Article

Performance Improvement for Small-Scale Wind Turbine System Based on Maximum Power Point Tracking Control

by
Ramadoni Syahputra
1,* and
Indah Soesanti
2,*
1
Department of Electrical Engineering, Faculty of Engineering, Universitas Muhammadiyah Yogyakarta, Yogyakarta 55183, Indonesia
2
Department of Electrical Engineering and Information Technology, Faculty of Engineering, Universitas Gadjah Mada, Yogyakarta 55281, Indonesia
*
Authors to whom correspondence should be addressed.
Energies 2019, 12(20), 3938; https://doi.org/10.3390/en12203938
Submission received: 31 July 2019 / Revised: 1 October 2019 / Accepted: 14 October 2019 / Published: 17 October 2019
(This article belongs to the Section F: Electrical Engineering)

Abstract

:
This paper proposes a strategy for performance improvement of small-scale wind turbine systems using maximum power point tracking control (MPPT). In this study, wind-turbine systems which use permanent magnet synchronous generators and converter devices are modeled in Simulink-Matlab software. In order to increase the power generated, MPPT is used based on the extended perturb and observe (PO) method. This algorithm has the ability to improve the speed of the turbine without oscillation. To analyze the ability of the PO-based MPPT in maximizing output power, performance examination of wind turbine systems in Simulink-Matlab software was conducted. The study is carried out with a 3000 W wind turbine device serving various electrical loads of 50 Ω, 100 Ω, 200 Ω, and 300 Ω, and each ohm varies with a wind speed of 4, 5, 6.5, 7, 8.5, 9, and 10 m/s. The overall turbine system performance found that the maximum increase in system output power occurs when it is loaded with 200 Ω with a wind speed of 6.5 m/s. During this combination of 200 Ω and 6.5 m/s, there are high increments of output power at 135.62% caused by the installation of MPPT controllers, with an average output power increase of 50.77%. The results of this study proved that PO-based MPPT has successfully improved the performance of wind-turbine systems.

1. Introduction

Due to energy issues related to potential, inventory, technology, and environmental impacts, the necessity for renewable energy has become increasingly urgent. This fact is attributed to the easy availability of fossil energy and its proven negative impact on the environment [1]. People are realizing the importance of renewable energy as a source of electricity to power our world. Indonesia, as a tropical country, has also paid serious attention to renewable energy [2], with the government creating a goal of deriving 23% of national electricity from renewable energy sources by 2025. This contribution will be increased to 31% by 2050.
Recently, the Indonesian government has encouraged the development of wind power technology in an effort to reduce carbon emissions. A wind turbine in Indonesia has become increasingly popular owing to the fact that the location has wind potential. Wind is one of the most readily available renewable energy sources in Indonesia, most prevalently on the southern coast of Java and Sumatra Island, and the eastern islands. Based on data from the National Energy Blueprint, Ministry of Energy and Mineral Resources of the Republic of Indonesia, the potential of wind energy is 9.29 GW, but the utilization is still around 0.5 GW, 5.38% of the existing potential [3,4].
Wind generates electrical energy through turbines, which are characterized by various types according to shapes and shafts. The wind turbine is connected with a generator that converts kinetic into electricity. Generators commonly used in conjunction with low- to medium-scale wind turbines are called permanent magnet synchronous generators (PMSG) [5,6]. The output of power generated by a PMSG varies depending on wind speed [7]. In order to maximize the output power of the generator, the maximum power point tracking (MPPT) controller is used to stabilize the maximum power [8,9].
Methods for MPPT that are commonly used include gradient approximation, artificial neural network method, fuzzy logic, particle swarm optimization, ant colony optimization, and the perturb and observe (PO) methods [10,11,12,13,14]. In the study of [15], stand-alone wind turbines and MPPT using the gradient approximation method is carried out. This works by measuring the voltage and current, then changing the duty cycle in the direct current (DC)–DC converter to obtain the maximum power. The alternating current (AC) output voltage used single phase full bridge inverter. Simulation results show that the maximum power ratio without MPPT is 79.41%, while with it, the maximum power is 94.51%. The results of this study indicate that wind turbines have a higher average power when using MPPT.
Furthermore, research [16] shows that MPPT technology is used to regulate the output voltage of the generator through a DC–DC converter circuit, where the switching technique uses pulse width modulation (PWM) by adjusting the duty cycle. The change of the duty cycle value depends on the wind speed. Therefore, a fuzzy logic controller (FLC) algorithm is used to set the cost as well as accelerate the PWM control-switching response. The results showed that with FLC-based MPPT technology, the efficiency of power output is increased from 45.5% to 87%.
The objective of this study is to improve the performance of generators in wind-power plants so that the power generated is always maximum. The technique used is the control strategy using the MPPT controller. In this MPPT, a control method is applied, namely the extended PO method. The PO-based MPPT algorithm has been widely used in searching for maximum power values [17] due to its simplicity. Furthermore, the use of the PO does not require wind speed information and turbine parameters, and it is faster and more efficient in searching the maximum point of power. However, it has the disadvantage of producing oscillations under steady-state conditions due to constant duty cycle changes. Therefore, modifications were made in the study, combining the PO and predictive method. Both methods work alternately according to current and voltage conditions on the input side of the converter. Predictive methods are used to determine the magnitude of step changes in the PO algorithm, the larger the voltage, the larger the step size used, and vice versa. The combination of the PO and predictive method applied to the MPPT technique for optimizing the generator output power of wind power systems is the novelty of this research. The technique used in the MPPT is the extended PO algorithm. The algorithm contains the foundations of standard PO, with changes to the step size value of each iteration according to the response of the system based on the predefined C constant. The modification of the method results in faster convergence of the computation.

2. Small-Scale Wind-Turbine System

The Indonesian government has encouraged the development of wind-power technology in an effort to reduce carbon emissions. The wind turbine in Indonesia has become increasingly popular owing to the fact that the location has wind potential. Indonesia is located in a tropical climate area, with moderate wind potential at speeds ranging from 3 m/s to 15 m/s [18]. Wind-turbine systems are commonly used for smaller scales [19]. The turbine works to convert the kinetic energy in the wind to mechanical energy via rotation by generating a torque. The magnitude of the kinetic energy depends on air density and wind speed [7]. Equation (1) expresses the electric power of the wind-turbine system as follows:
P = 0.5 Cp ρ A v3
As can be seen in Equation (1), the coefficient of Cp generates a fraction of the kinetic energy converted into mechanical energy caused by the wind turbine. Some factors contribute to determining the wind-turbine power, such as the ratio of tip speed λ. This wind speed ratio depends on the angle of the pitch blade for the turbine controlled by the pitch. The speed ratio can be defined as a correlation between the linear speed of the turbine blade and the wind velocity, which can be expressed by the following Equation (2):
λ = r ω/v
Substituting Equation (2) in (1), the electric power that a wind turbine system is as follows,
P = 0.5 Cp λ ρ A (r/λ)3(ω)3
Further torque can be calculated using the following Equation (4):
P = 0.5 Cp ρ A (v/λ)
Based on (4), it can be concluded that the value of the ratio of speed at which the coefficient of power reaches a maximum is possible. Wind turbines can generate maximum electrical energy by optimizing the tip speed ratio λ, achieved by adjusting the pace of the blade according to the wind speed. Figure 1 shows the power generated at different winds with a pitch angle of 0°, indicating divergent speeds leading to a difference in output power. The mechanical power is dependent on the rotation speed, as shown by the winds ranging from 4 m/s to 10 m/s. Based on this example, the nominal wind speed that produces nominal mechanical power (1 p.u. = 3 MW) is 9 m/s. A complete list of quantity symbols is presented in Table A1 and Table A2 in the Appendix A.

3. Maximum Power Point Tracking Control (MPPT) Control Using Extended Perturb and Observe (PO) Algorithm

3.1. MPPT Control for Small-Scale Wind-Turbine System

Figure 2 shows the typical diagram of a wind turbine system, composed of a turbine and PMSG generator that both serve to convert wind into mechanical energy, a generator-side converter that rectifies the 3 phase AC electrical voltage into DC, and a boost converter. There is also an MPPT Controller which maximizes the output power, and a grid-side converter that turns dc electrical voltage into ac [20]. Furthermore, the output from the inverter can be integrated into the grid of the distribution system.
A wind turbine is a piece of equipment for converting wind energy into mechanical energy. As expressed in Equation (4) that the power produced by the wind turbine (P) is the result of a process of half the mass density of the air type (ρ) with the area of cross-sectional coverage (A) and the power of the wind velocity (v3). Wind energy drives the turbine rotor connected to the generator to create electrical energy. The maximum output power of the wind turbine is limited to the power coefficient (Cp), a function of tip speed ratio λ, rated from 25% to 45%. Based on the experimental results, this value will not exceed 59.3%. A generator is a tool to convert mechanical energy into electricity, changing the torque (T) and rotational speed of the rotor (ω) it receives from the blade into voltage (V) and current (I) values. The output of this generator is 3-phase AC voltage.
The PMSG does not require an excitation system because its source is provided by a permanent magnet on the rotor [7], therefore eliminating the need for voltage control, simplifying the overall system. A PMSG is usually employed to generate electrical energy in wind turbines with low to medium power capacity. It is suitable for small scale power generators, hence useful in the Indonesian region where wind speeds are not too high. The advantage of using a PMSG is its low cost, durability, simplicity, and more straightforward clutch grid, however, a significant disadvantage is its need for smaller power factor and efficiency compensators [21].
The wind-energy system extracts wind energy and converts it to electrical energy. The output power of the wind energy system varies depending on the wind speed [22,23]. When wind speed is below the expected value, an MPPT is required to produce maximum power. The generator load is adjusted when the turbine ratings are smaller than the wind speeds. Figure 3 shows the ideal power curve in turbines with varying wind speeds. Region I illustrates areas where MPPT maximizes turbine power, while Region II portrays its regulation.
MPPT is the method of tracking the maximum power value of a power-plant system [24,25], in order to produce higher levels of efficiency. The working principle is to increase and decrease the voltage by adjusting the duty cycle on the power side converter. However, with MPPT, the maximum power output from the generator can be optimized. The methods used in MPPT vary according to the algorithm used; this study used an extended PO.

3.2. Extended Perturb and Observe Algorithm

The PO algorithm can be used to determine the optimal point of a system [17]. In this study, the optimal point is the maximum power value that a PMSG generator can achieve in a wind turbine system. The maximum power value is obtained by adjusting the dc voltage on the generator side converter, which in turn changes the output power. To monitor and manage these changes, a certain step-size (ΔD) and time need to be specified: that is the output power generated compared to previous electrical power, so that the power changes (ΔP) and the next variable ΔD can be determined. If the generated power increases, then the variable ΔD will be fixed, if it decreases, then the ΔD will change. The working principle of this extended PO algorithm can be seen in the flow chart in Figure 4 and Figure 5, with several parameters in the initial value to calculate the change of step size value in each iteration done. Furthermore, it is necessary to identify the limit of the duty cycle in running this algorithm to maintain the ability of the buck converter. Figure 4 shows the standard PO method, while Figure 5 shows the extended PO method used in this study.
Based on the analysis and literature study, the standard version of the PO algorithm (Figure 4) has disadvantages, including the time taken to reach a relatively slow convergence and high oscillation in maximum power search. However, this weakness can be overcome by changing the value of ΔD used to find the maximum point value of power generated, where the quantity of ΔD will be multiplied by a constant value of 0–1. When the system has reached the maximum power point then ΔD automatically decrease. The working principle of the extended PO algorithm can be seen in Figure 5.
The benefits of developing this PO algorithm include eliminating oscillation problems which occur due to fluctuations in power when it reaches maximum value. With the modification of the algorithm, this is expected to decrease due to the change of the value of ΔD, resulting in faster convergence of the computation.
This extended PO algorithm contains the foundations of the original, with changes to the value of the step size of each iteration according to the response of the system based on the predefined C constant. The duty cycle value limit is also specified in order to keep the system working in accordance with the capabilities of the buck converter. Time delay running the program in a one-time iteration is to respond due to changes in the given duty cycle.

4. Results and Discussion

4.1. Model of Wind-Turbine System

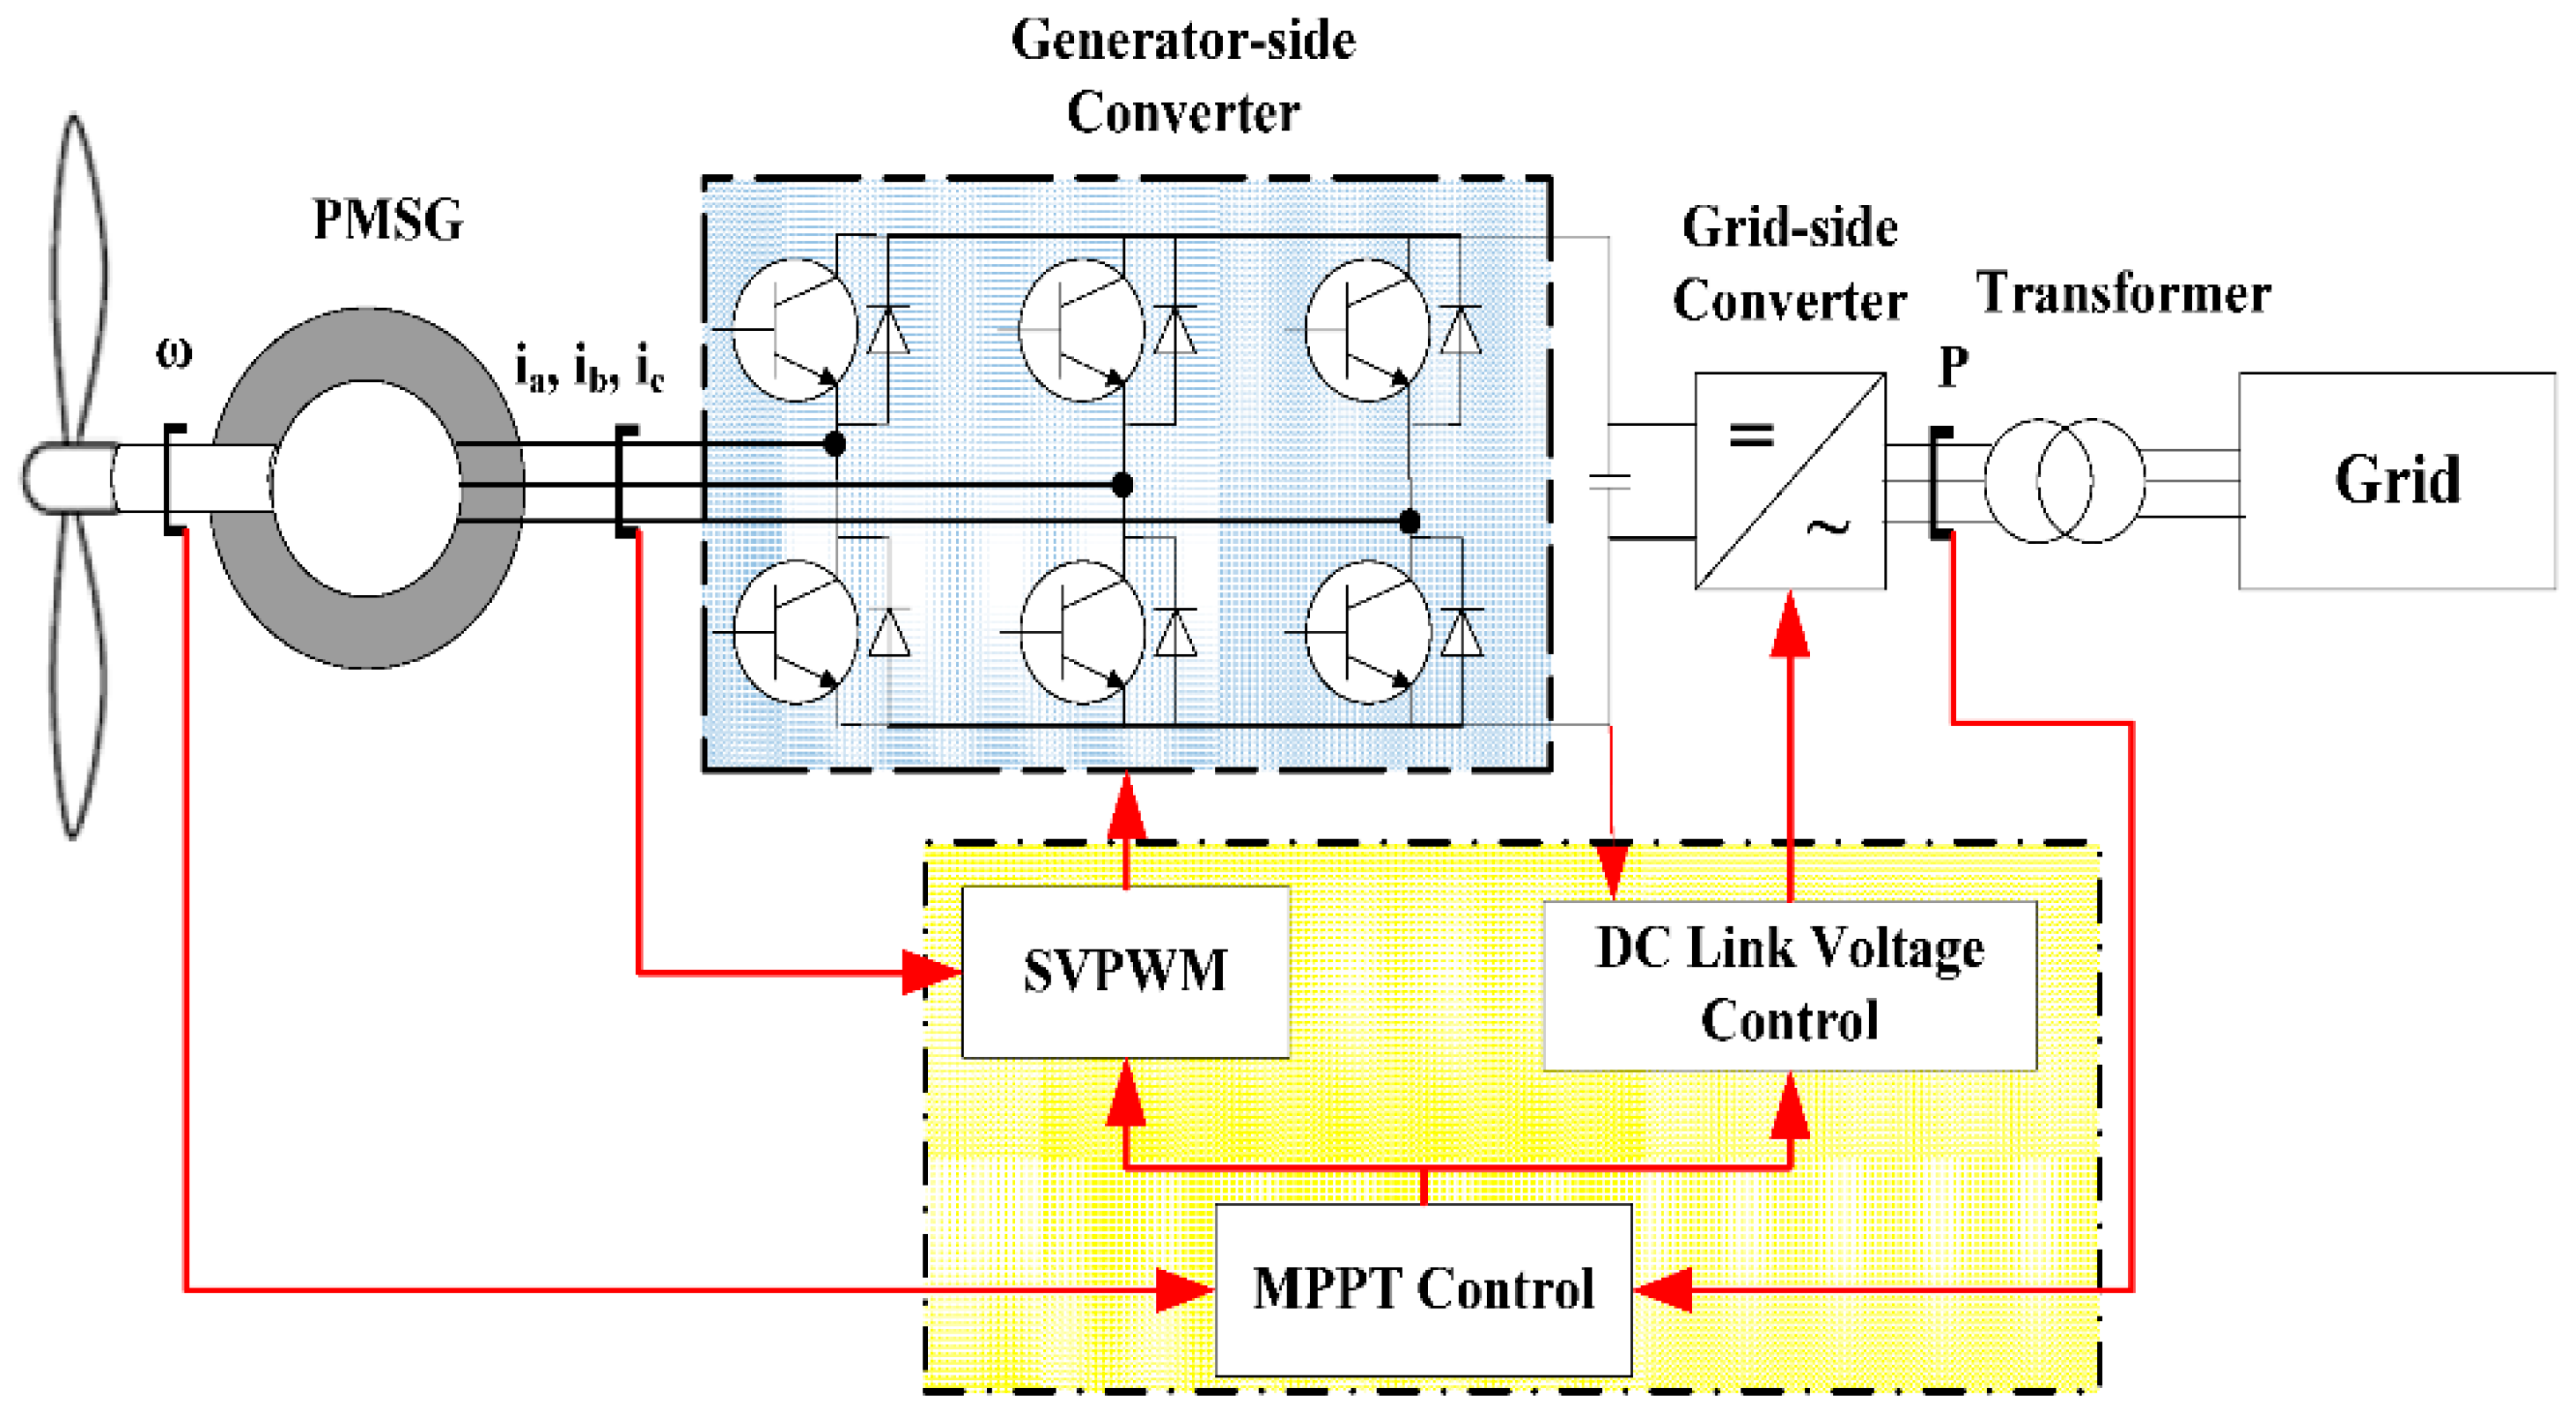
This study analyzes the wind-turbine system modelled by the Simulink-Matlab software. The system comprises a wind turbine, PMSG, a rectifier, MPPT, and an inverter. The turbine converts wind into mechanical energy, the PMSG transforms the mechanical energy into electricity, and the rectifier ensures that the AC electrical voltage is transformed into DC electrical current. Furthermore, the MPPT maximizes the output power of the wind turbine system, and the inverter converts the DC into AC voltage. The block diagram of the wind turbine system with MPPT and circuit diagram are shown in Figure 6 and Figure 7.
The parameters used in this study are shown in Table 1, where the mechanical output of power is 3000 W. It has a base electrical generator power of 1111.11 VA and a base wind speed of 12 m/s. The maximum power at base wind speed is 0.73 p.u, while the base rotational speed of the generator is 1.2 p.u. The pitch angle employed is 0°.
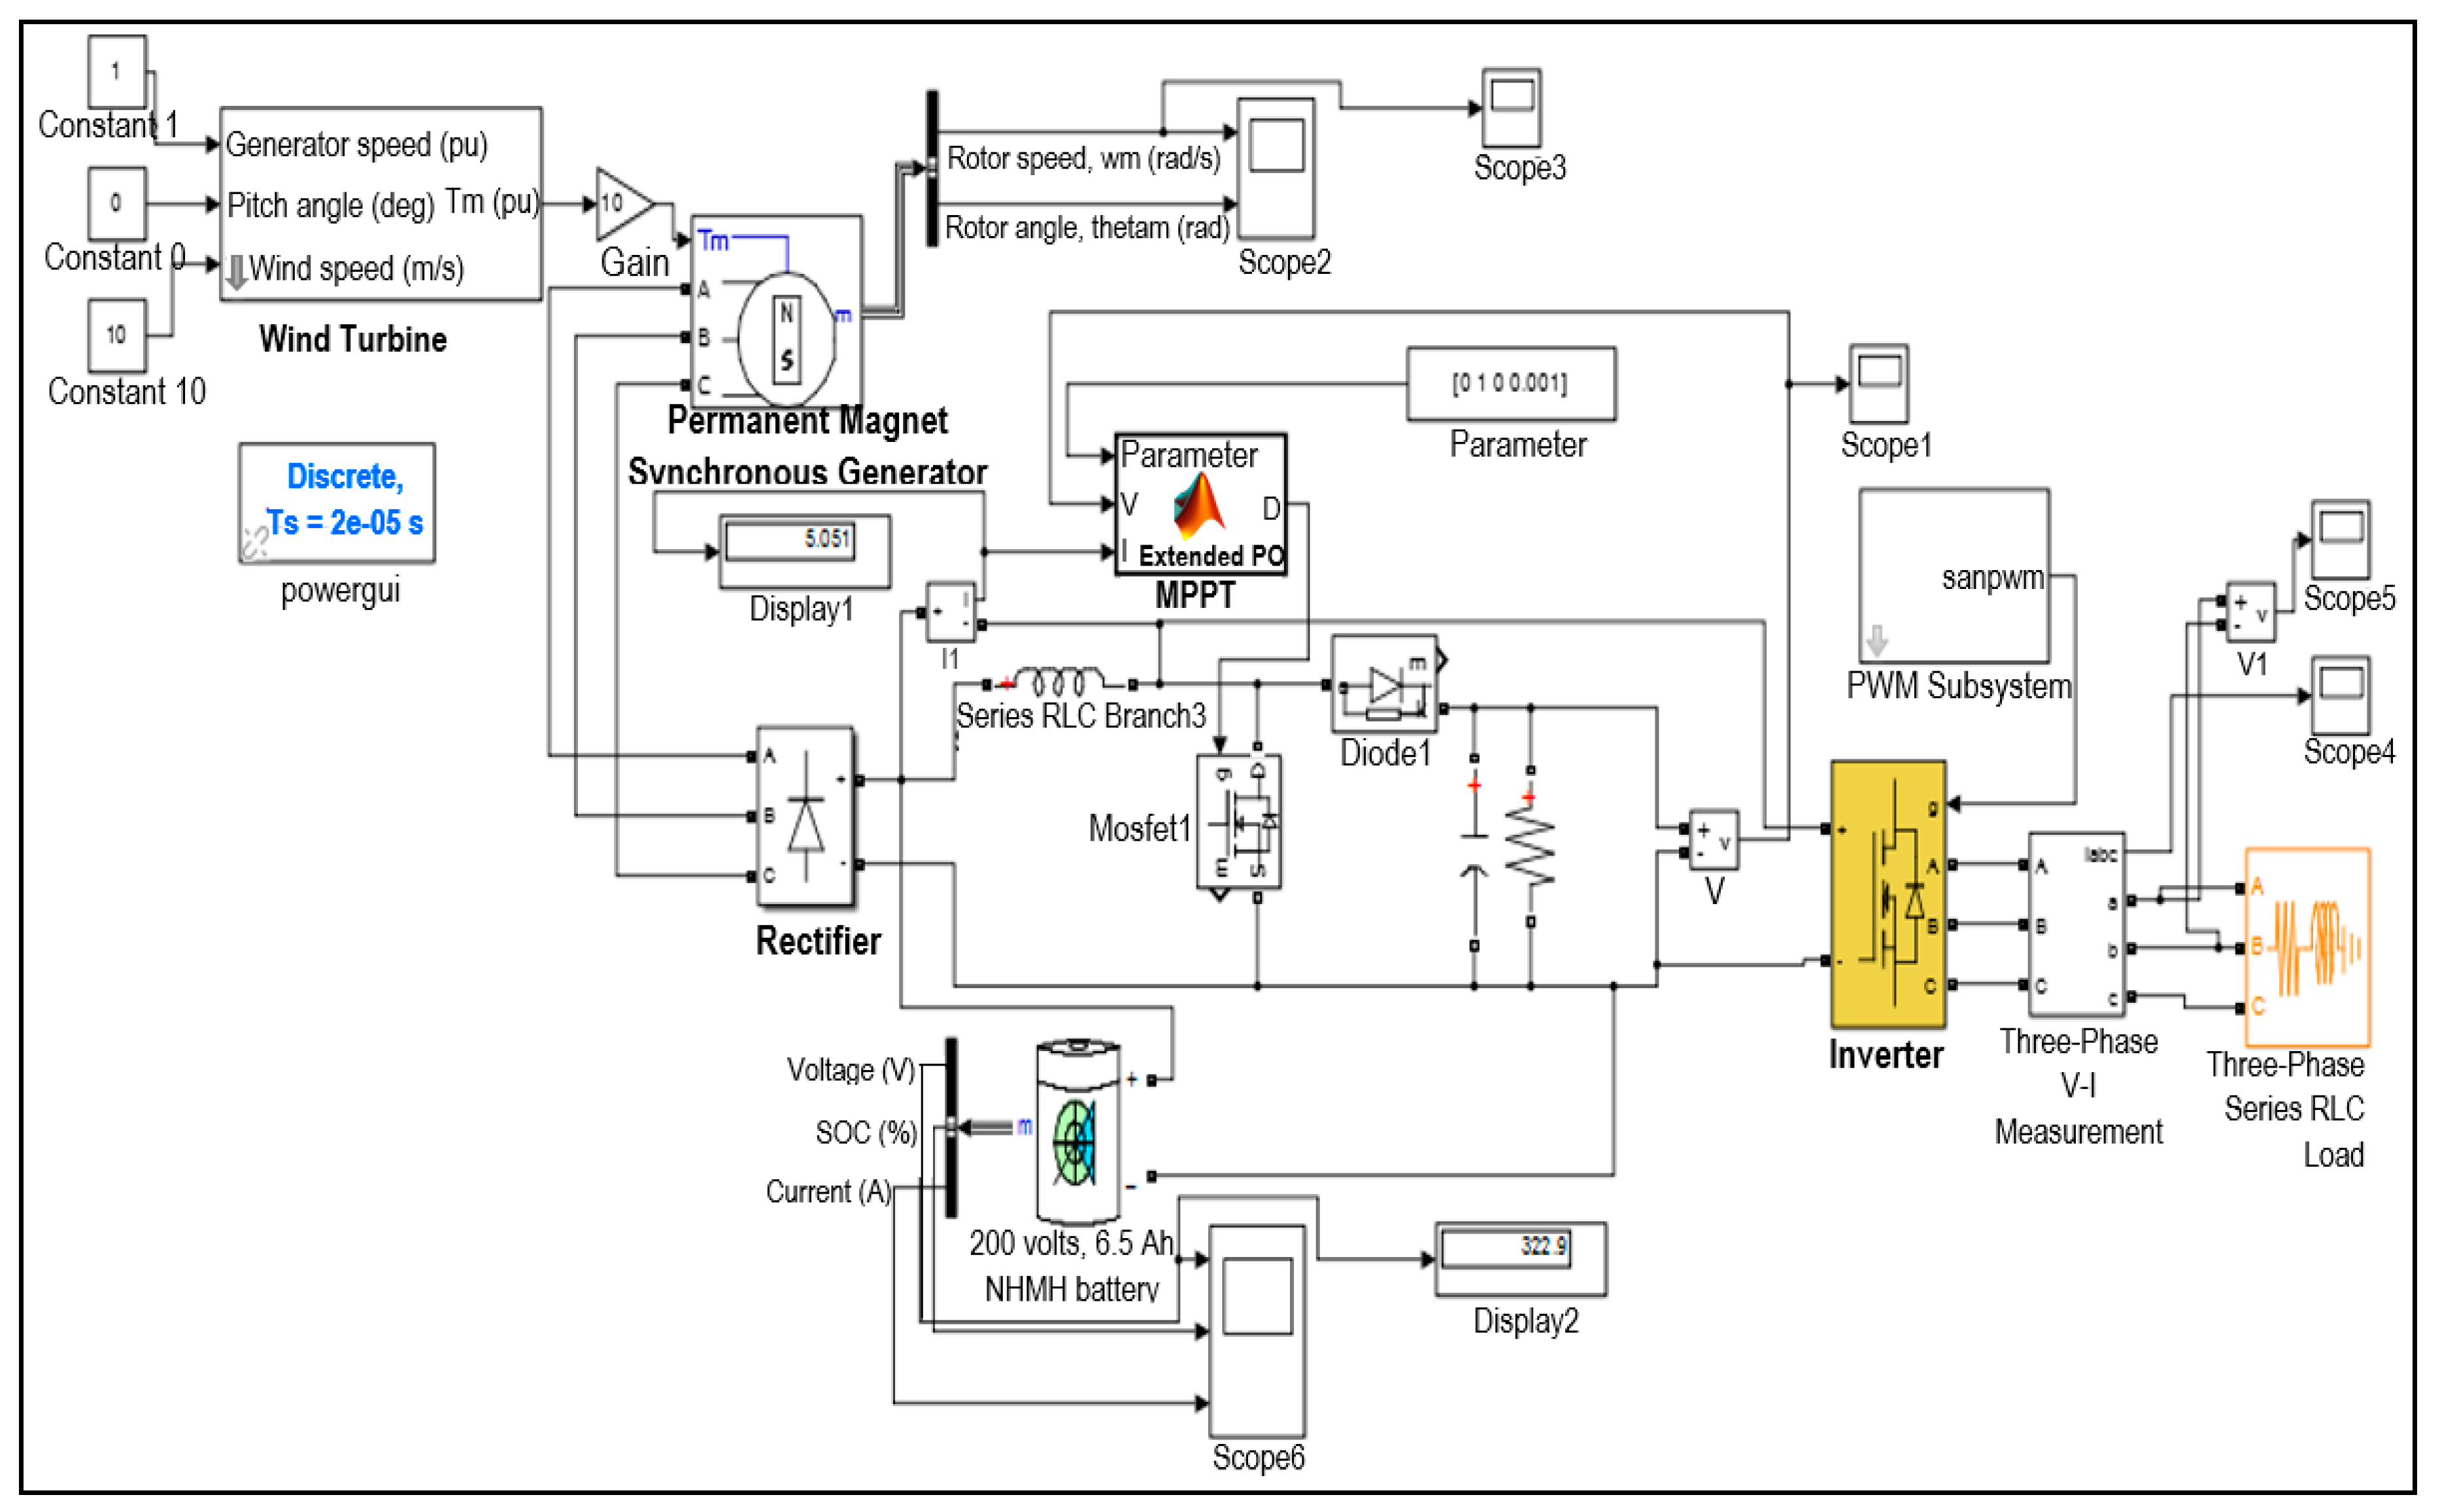
Wind turbine circuit diagram system with MPPT in the Simulink software, as shown in Figure 7, is an implementation of a block diagram of the wind turbine system with MPPT, as shown in 
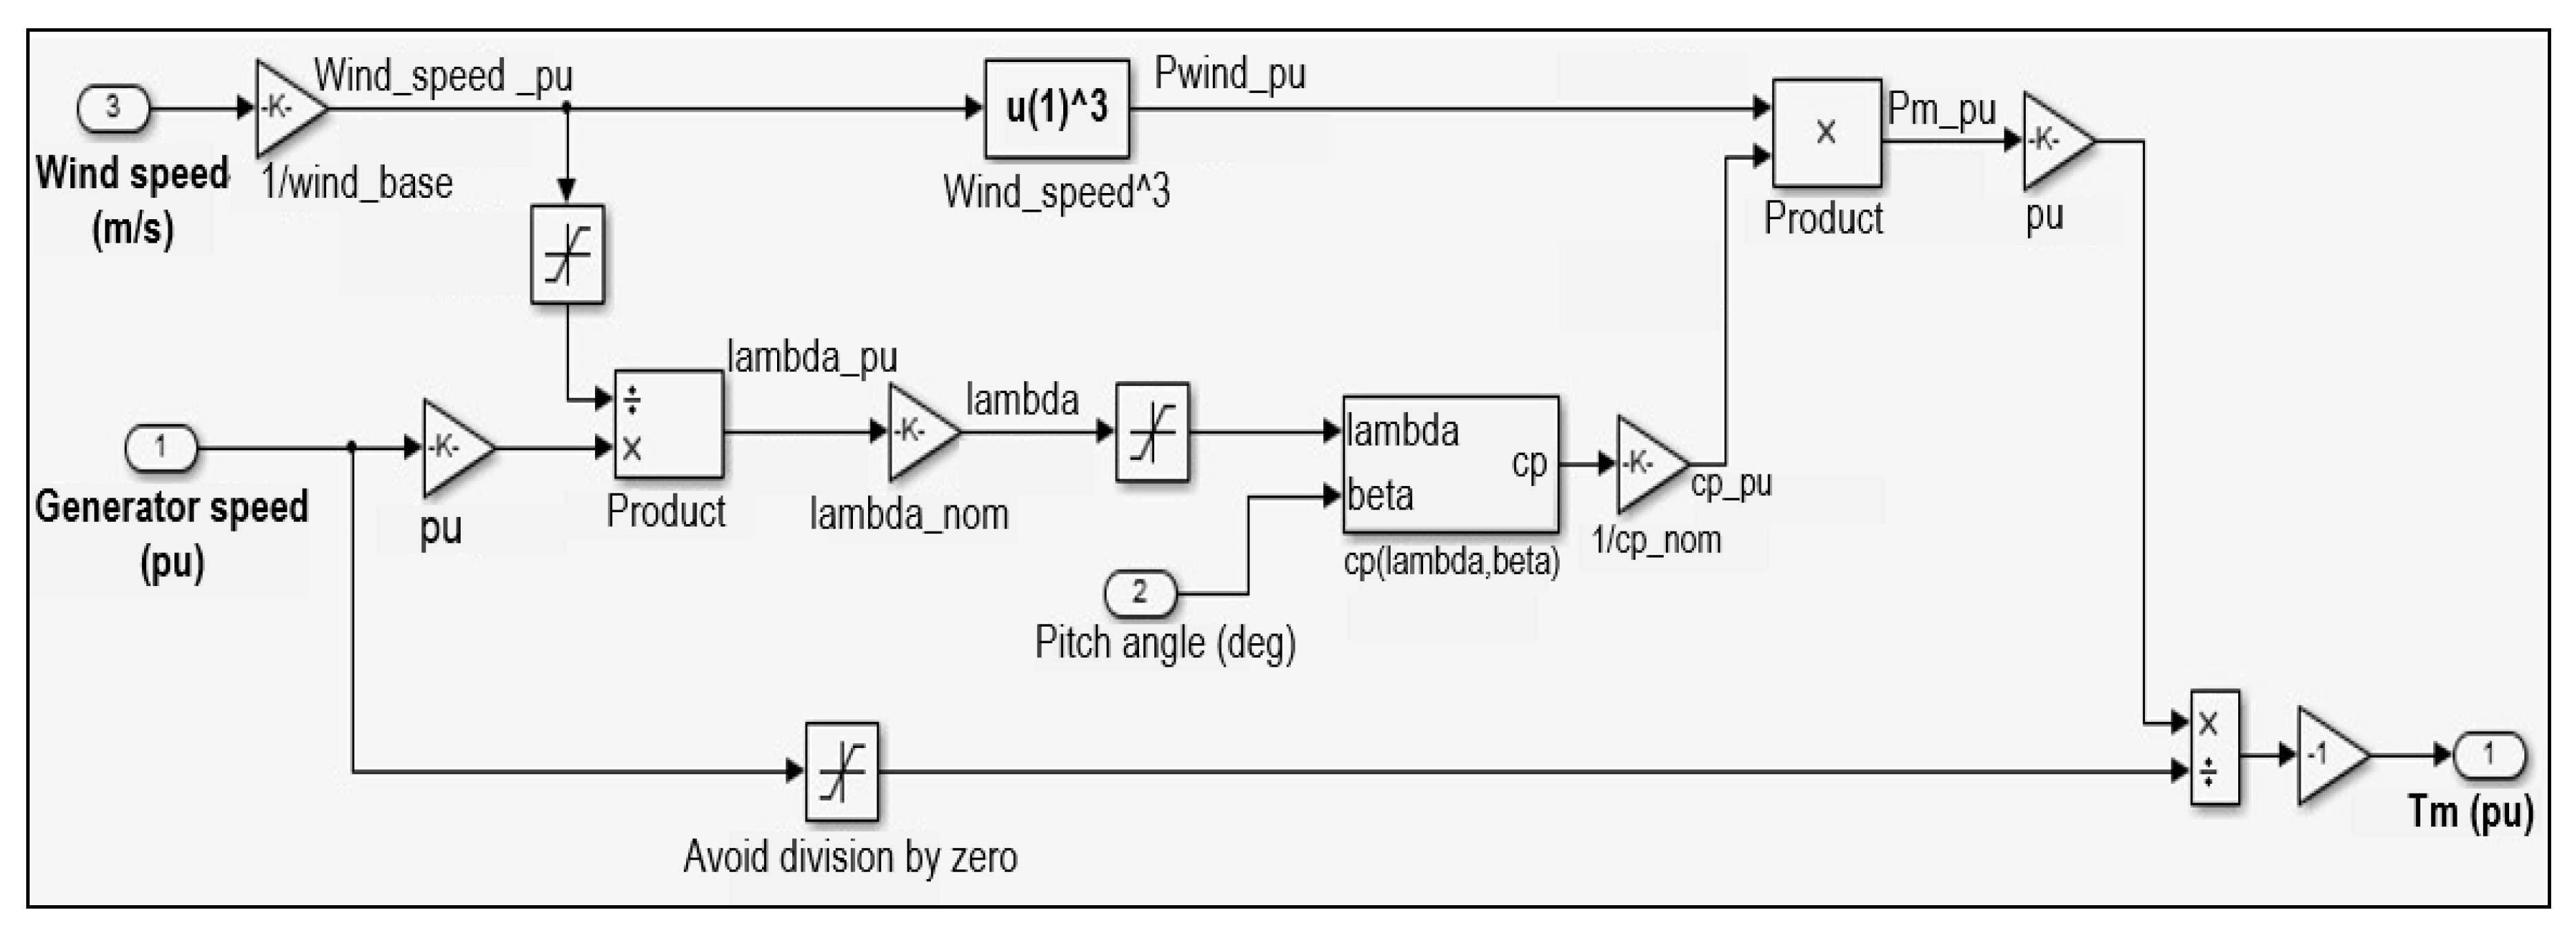
Figure 6. The wind turbine model in Simulink-Matlab software is presented in Figure 8.
There are three inputs and one output of the system, as shown in Figure 8. The first input is the speed of the generator from the rotor. There is a pitch angle measured in degrees, and in this study, we use 0°. The third input is the wind speed in m/s, adjusted for the simulated conditions, namely both are constant and changing. The output of the turbine is the mechanical torque of the rotation. The turbine is then connected to the PMSG generator.
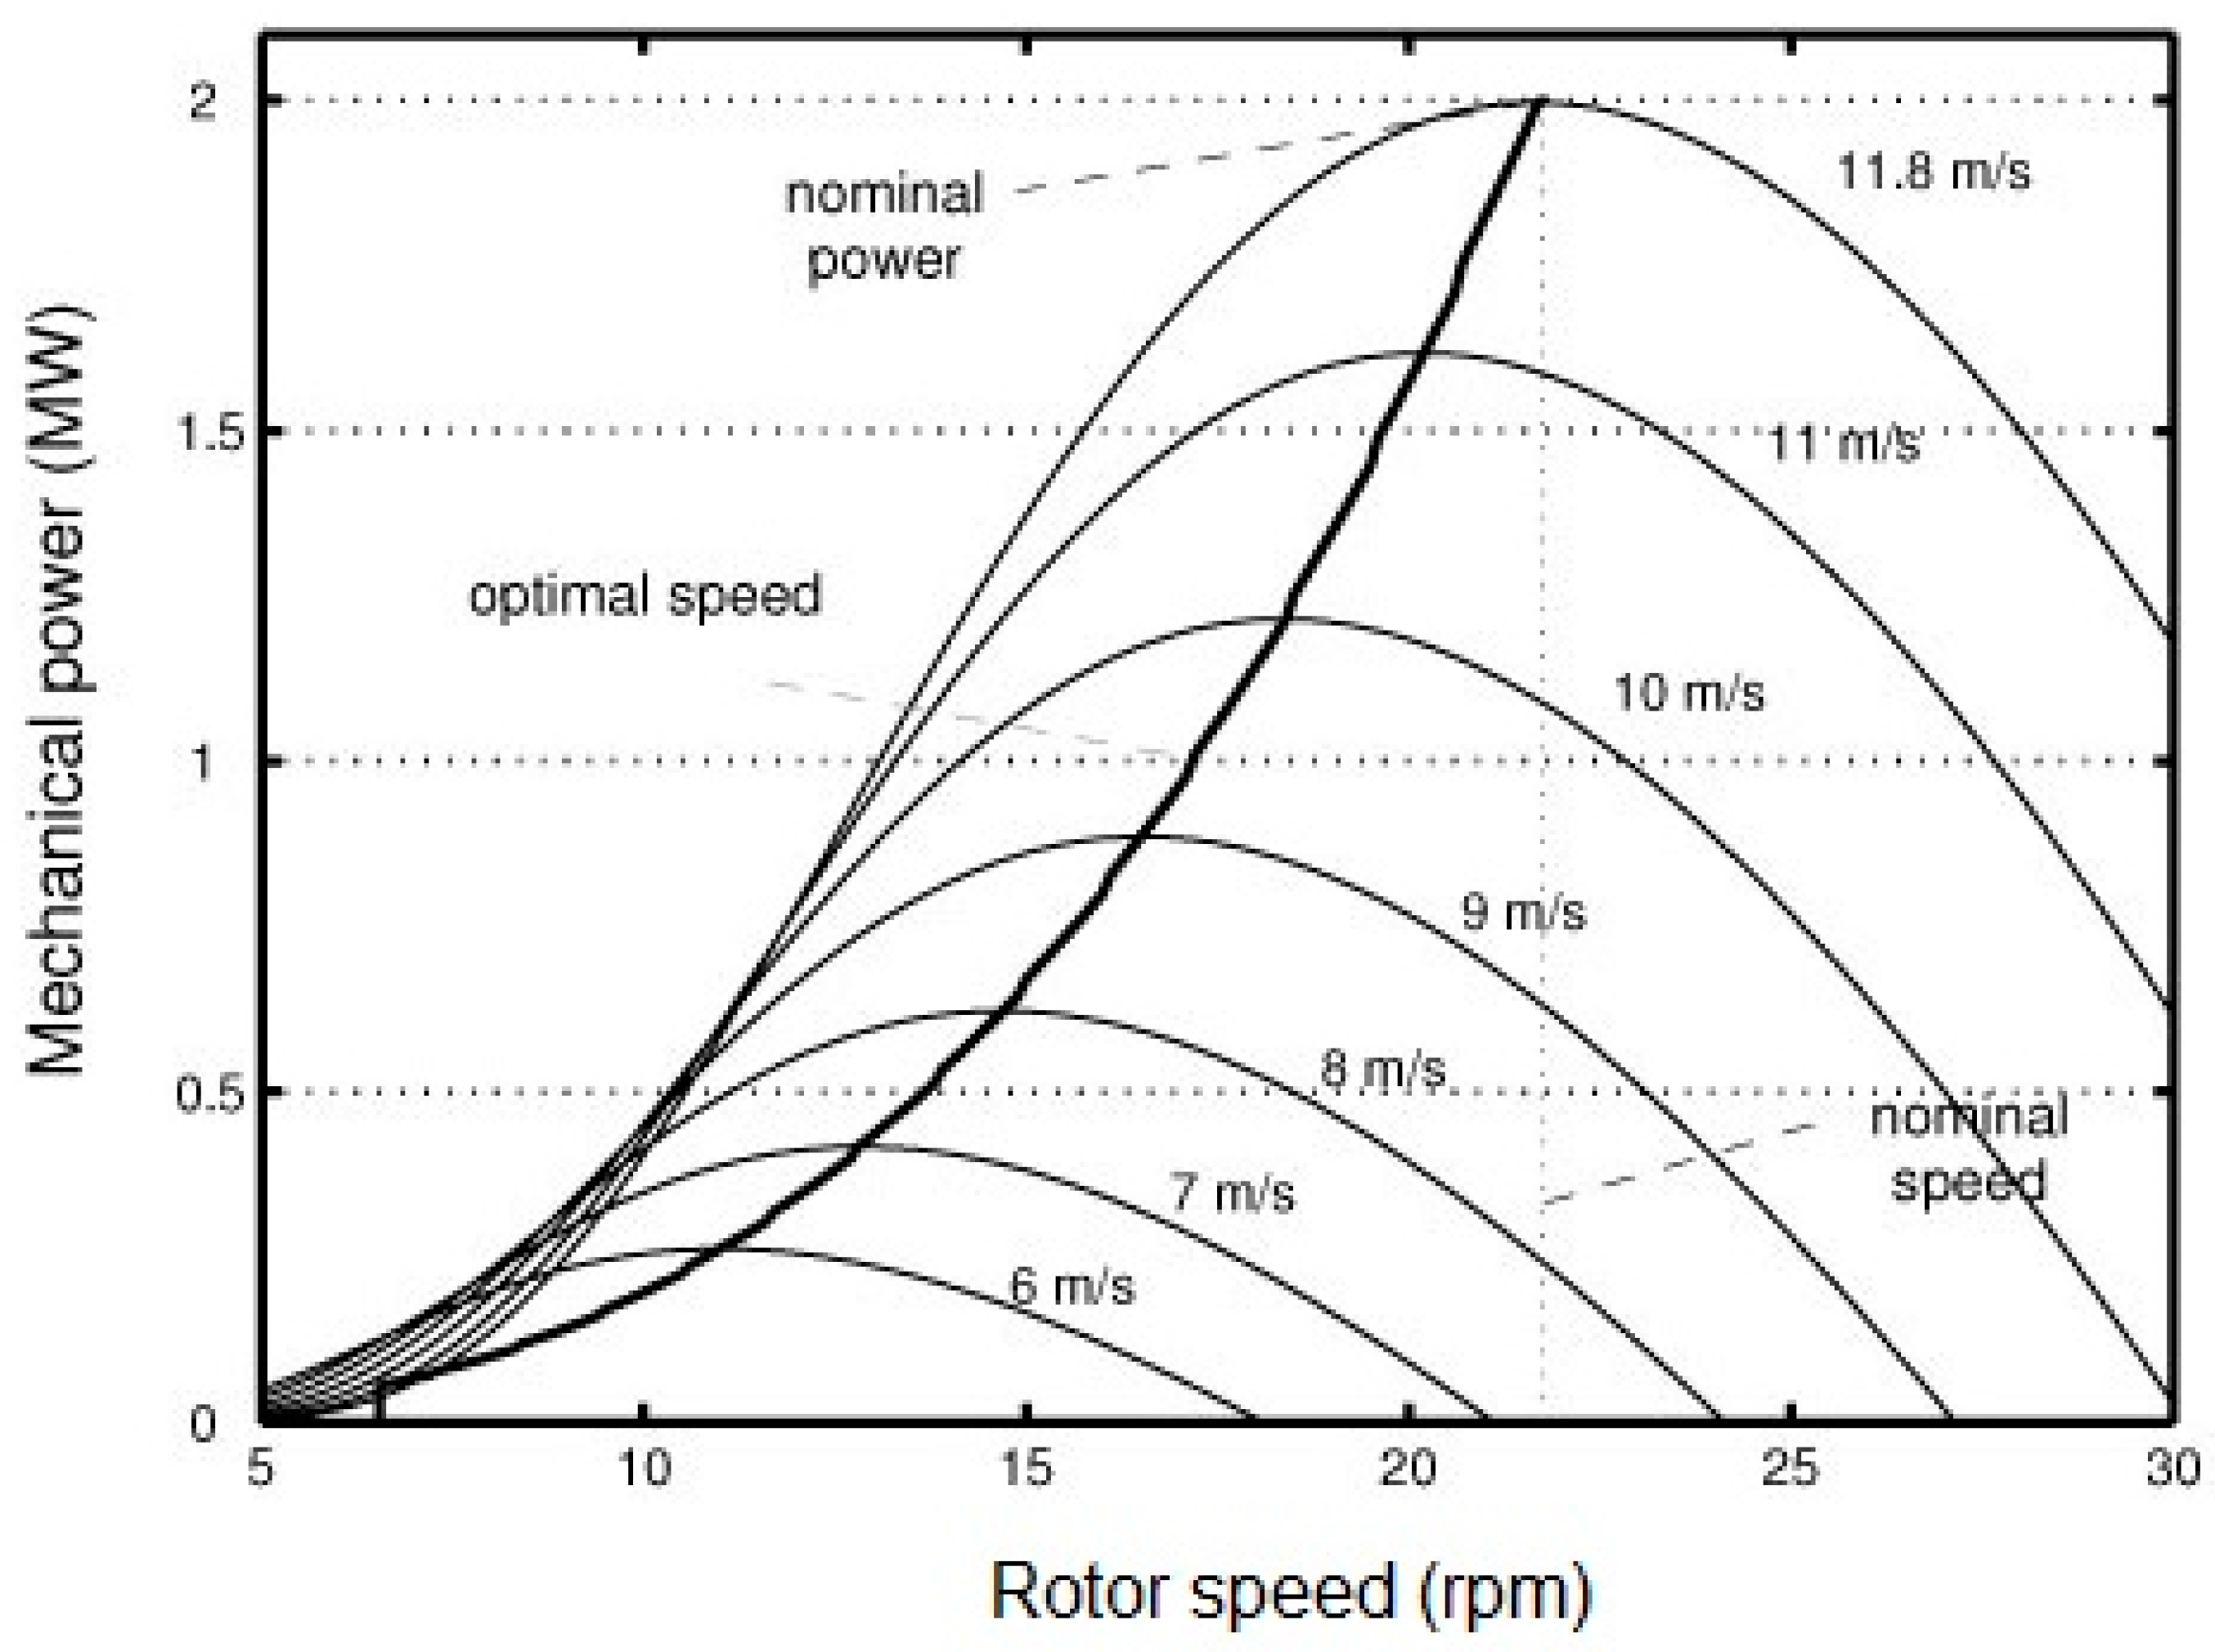
This wind turbine system is adapted to speeds ranging from 3 to 15 m/s, with optimal occurrence between 11:00 a.m. to 02:00 p.m. Along with this condition, the off-grid system is required to store the electrical energy produced. In this study, the generator used is a 3-phase PMSG type, as shown in Table 2. The 3-phase power voltage generated uses a rectifier to achieve a 48 V DC voltage, which can be connected to the battery, a converter, and an inverter to serve electric loads. As shown in Figure 1 and Figure 2, the MPPT is used to optimize generator voltage through rectifiers at boost converter locations. Furthermore, rectifier parameters are used in this study, as shown in Table 3. The power used is a bridge-type, where the resistance-capacitance (RC) snubber circuits are connected to each switch device in parallel form.
Figure 9 shows the model of the boost converter circuit in Simulink-Matlab. The parameters in the boost converter are shown in Table 4. In order to determine the boost converter circuit, an input voltage (Vin) of 100 V, is used to test the system, as shown in Figure 10. Results obtained prove that the model is able to produce the required voltage. Table 4 shows battery parameters, while the inverter, which is a bridge of selected power electronic devices consisting of RC snubber circuits connected in parallel with each switch device is shown in Table 5.

4.2. Evaluation of Perturb and Observe Algorithm

In the PO algorithm, the quantity of input is voltage, and the output is the current of PMSG generator. These voltages and currents are further utilized in order to obtain an optimal output, as shown in Figure 7. The following stages are involved in the PO algorithm process.
(1)
Initial voltage measurement is determined to study the exact value of the current PMSG generator output voltage.
(2)
The power PMSG generator is measured to determine its current value.
(3)
The power difference is calculated to actuate the difference between the present and the previously measured power.
(4)
The voltage and power are compared to figure out the process involved in the changes. From this comparison, the generator voltage will be larger or smaller, depending on the generator power and measured voltage differences.
(5)
If the above stages turn out to be successful, step 1 is repeated.
After the PO algorithm is applied to the wind-turbine system, its validity and sensitivity are evaluated. In this study, the algorithm is valid if the standard value of deviation is less than 1% in 6 experiments. This fact is also similar to its sensitivity, which is also conducted by changing the wind speed.
A validity test is carried out to examine the results using the PO algorithm, and by conducting repetitive experiments for fixed parameters with a particular input, followed by an observation of mean and standard deviation from the experimental data. In this test, a winding rate of 10 m/s is used as an input with fixed turbine-system parameters. The results of the algorithm validity test are shown in Table 6.
The test resulted to a standard deviation value of 0, which means that the optimization procedure produced the same value in each experiment; hence, the output power of the wind-turbine system can be categorized as valid.
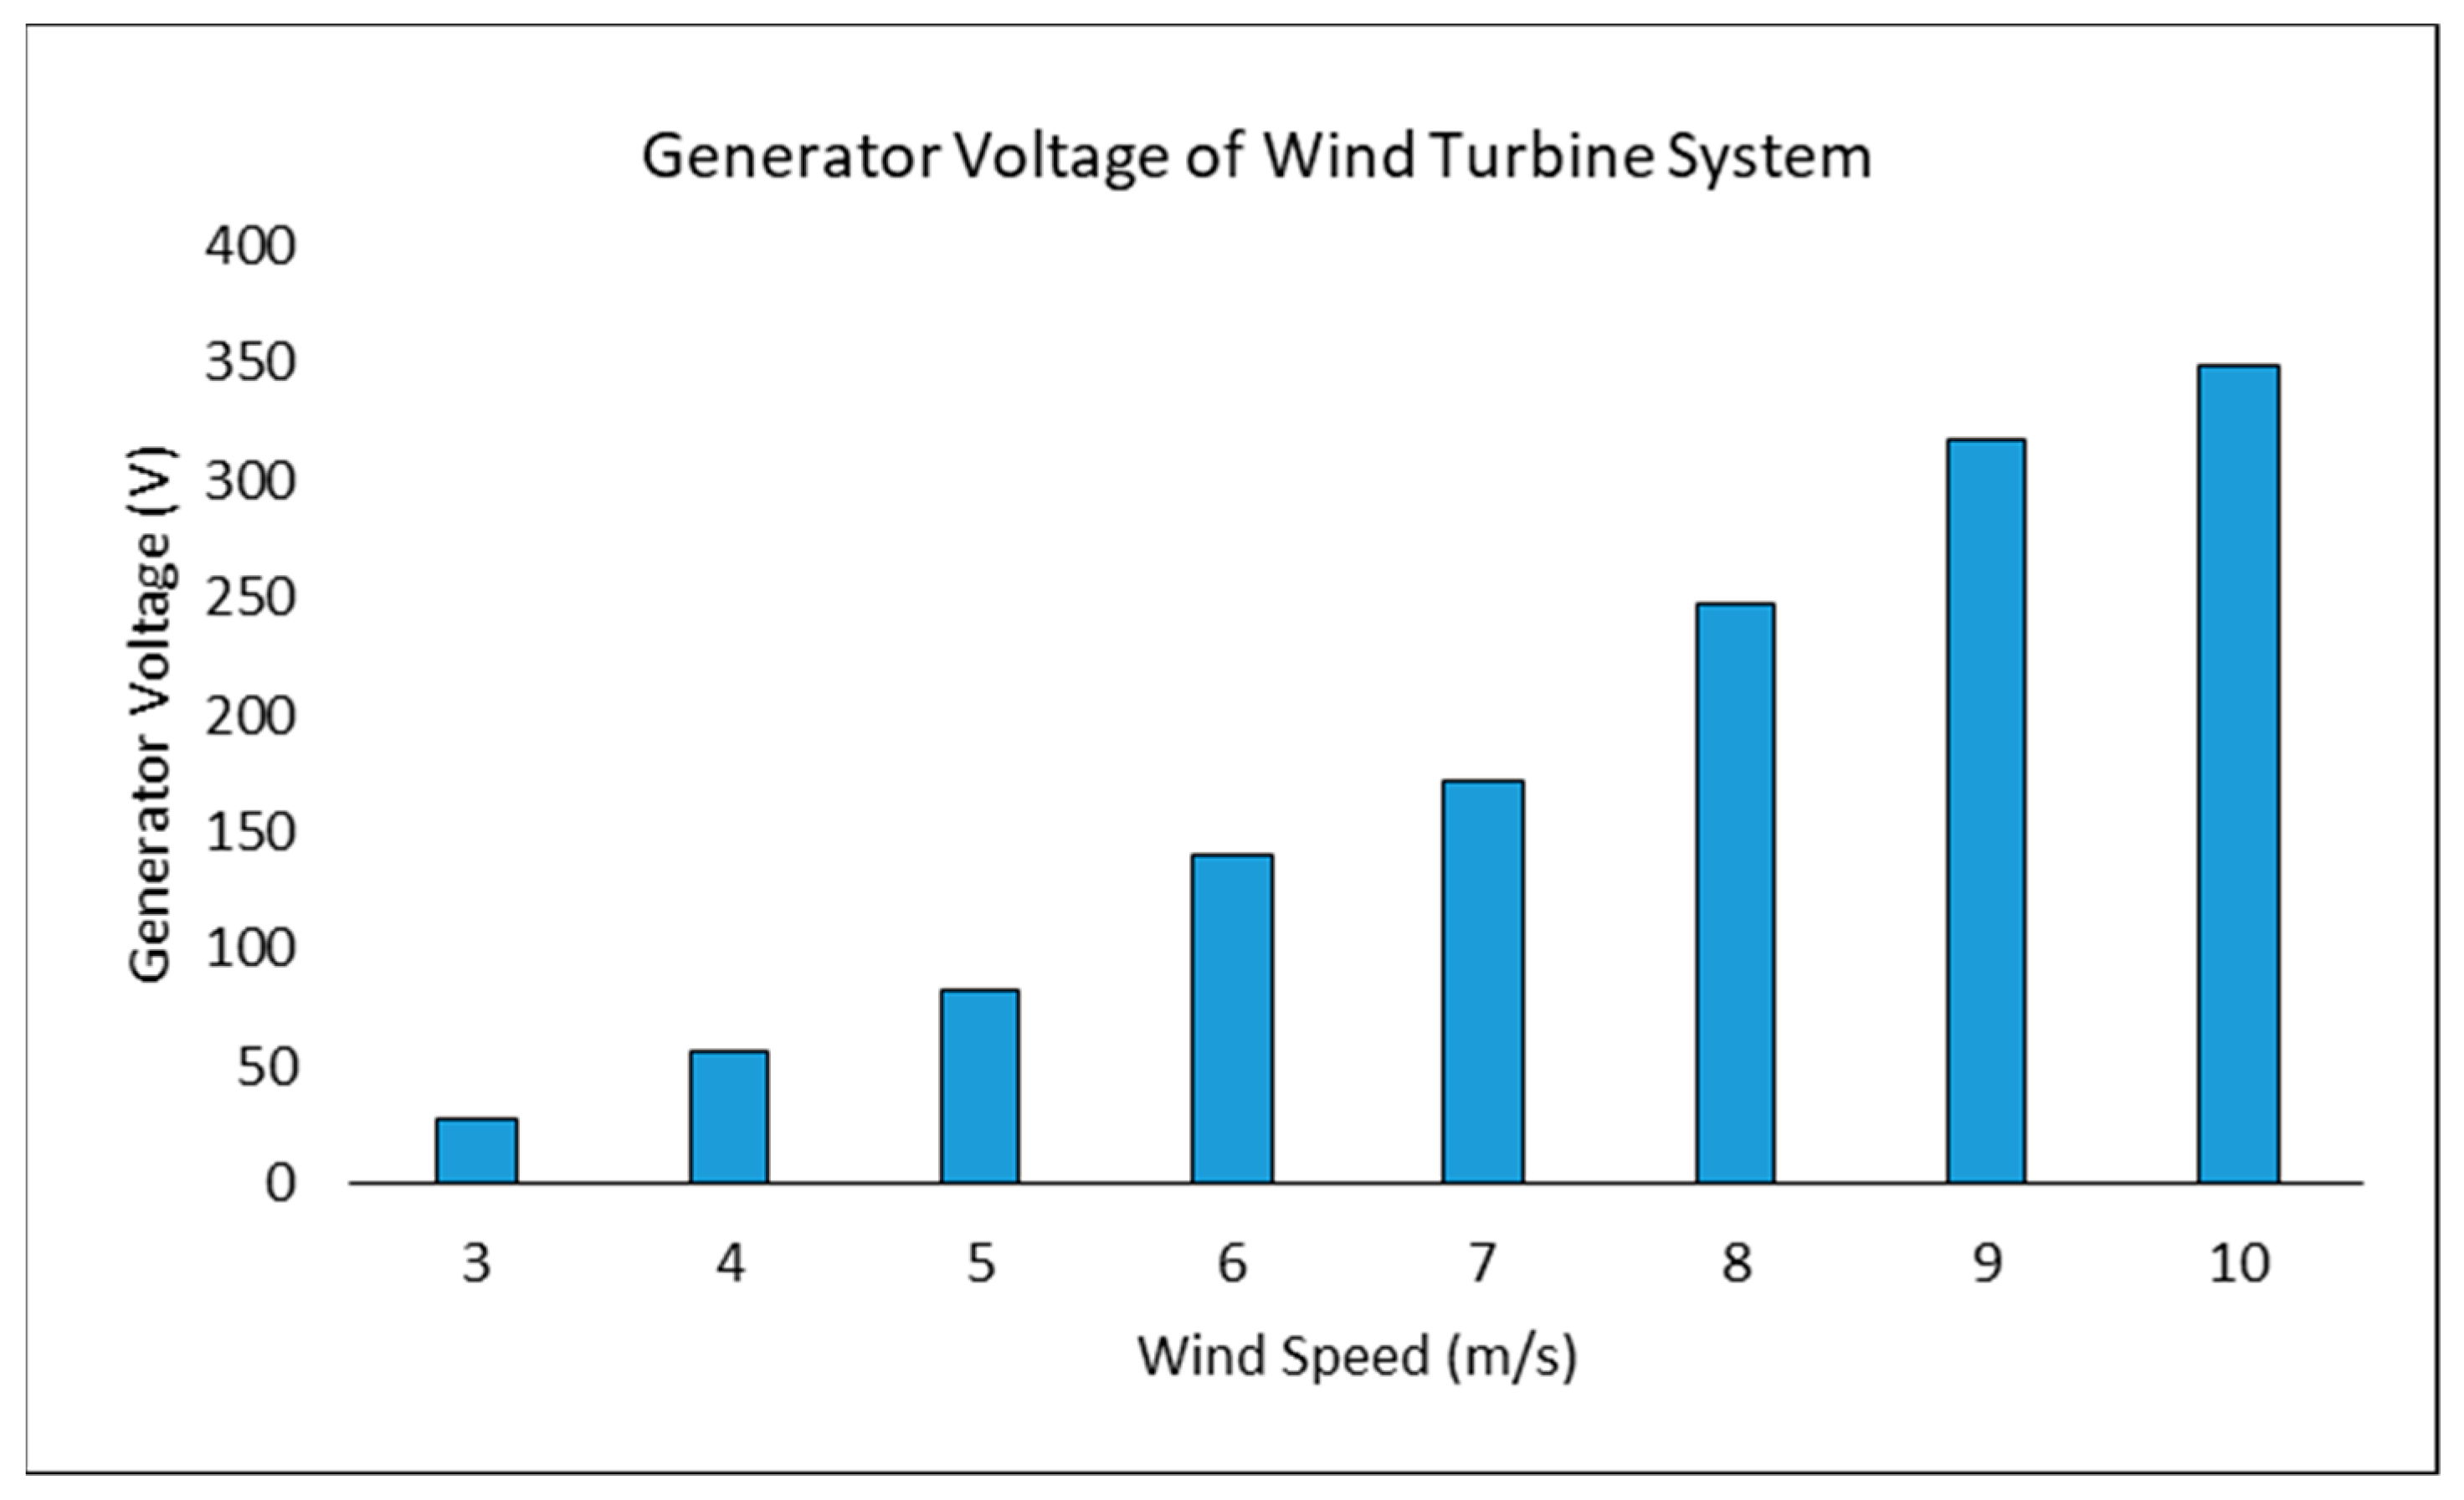
In order to determine the effect of the changes associated with the parameter values, a sensitivity analysis of the PO algorithm is tested by varying the value of the wind speed between 3 to 10 m/s with a fixed power generator value of 3000 W. In this experiment, 100 Ω resistance was used, and results obtained are shown in Table 7 and Figure 10. From the experimental results, it can be seen that the higher the wind speeds the more significant the voltage and power of the generator. This fact is because the rotor speed increases with a rise in wind speed, which also affects the power generated. The results of experiments in Table 7 and Figure 11 also prove that same.

4.3. Performance Test of Wind-Turbine System

In this section, a test is conducted on the wind turbine systems in order to improve the performance. Figure 12 and Figure 13 are used to test the Simulink Matlab performance with the installation of MPPT controllers. Test results of the system performance with and without the MPPT controller are shown in Table 8.
Table 8 shows the results of the wind turbine system performance test from simulations in Figure 12 and Figure 13. The performance test is carried out with a 3000 W wind turbine with electrical loads of 50 Ω, 100 Ω, 200 Ω, and 300 Ω, respectively in order to assess the performance of the turbine while serving the increased load with and without the MPPT controller.
As seen in Table 8, the greater the electrical load served, the higher the output power of the PMSG generator from the wind turbine. The most considerable output power is obtained when the system serves the highest electrical load of 300 Ω. Furthermore, the electrical load, and wind speed variation, on the prevailing wind conditions in Indonesia (i.e., 4, 5, 6.5, 7, 8.5, 9, and 10 m/s), is examined. Overall, the MPPT controller is able to increase the wind turbine system’s power output significantly. The average power increase after installing the MPPT controller using the PO algorithm is 50.77%. The results are presented in graphical form to clearly analyze the effect of the MPPT controller on various wind speed variations, as shown in Figure 14, Figure 15, Figure 16 and Figure 17.
Figure 14 shows the output power of the wind-turbine system with a load resistance of 50 Ω. At wind speeds of 4 m/s, the turbine system without MPPT produces 33.76 V, and at an electrical current of 0.67 A, and the output power of the turbine is 22.62 W. The application of an MPPT controller on the PMSG generator side converter generated both voltage and current of 33.83 V and 0.69 A, respectively, resulting in output power of 23.34 W. In this case, the system output power is increased by 3.20% before implementing the MPPT controller. Furthermore, the system performance test with wind speeds of 5, 6.5, 7, 8.5, 9, and 10 m/s, respectively, were examined. Based on the graph in Figure 14, it can be concluded that the higher the wind speed that hits the turbine, the greater the voltage, current, and output power with the best output recorded at 10 m/s. The condition without MPPT produced a voltage of 174.35 V with a load current of 3.49 A, thereby, generating power of 608.48 W.
Furthermore, with the application of the MPPT controller, there is an increase in voltage, load current, and system output power of 183.81 V, 3.95 A, and 726.05 W, respectively. When compared to the condition before the application, an increase in system output power by 19.32% is displayed. Based on the graph in Figure 14, the best performance of the MPPT controller in increasing the output power occurs precisely at wind speeds of 8.5 m/s, where the percentage increase in output power is 20.27%. Overall, it can be seen that the MPPT controller using the PO algorithm has successfully improved the performance of wind turbine systems.
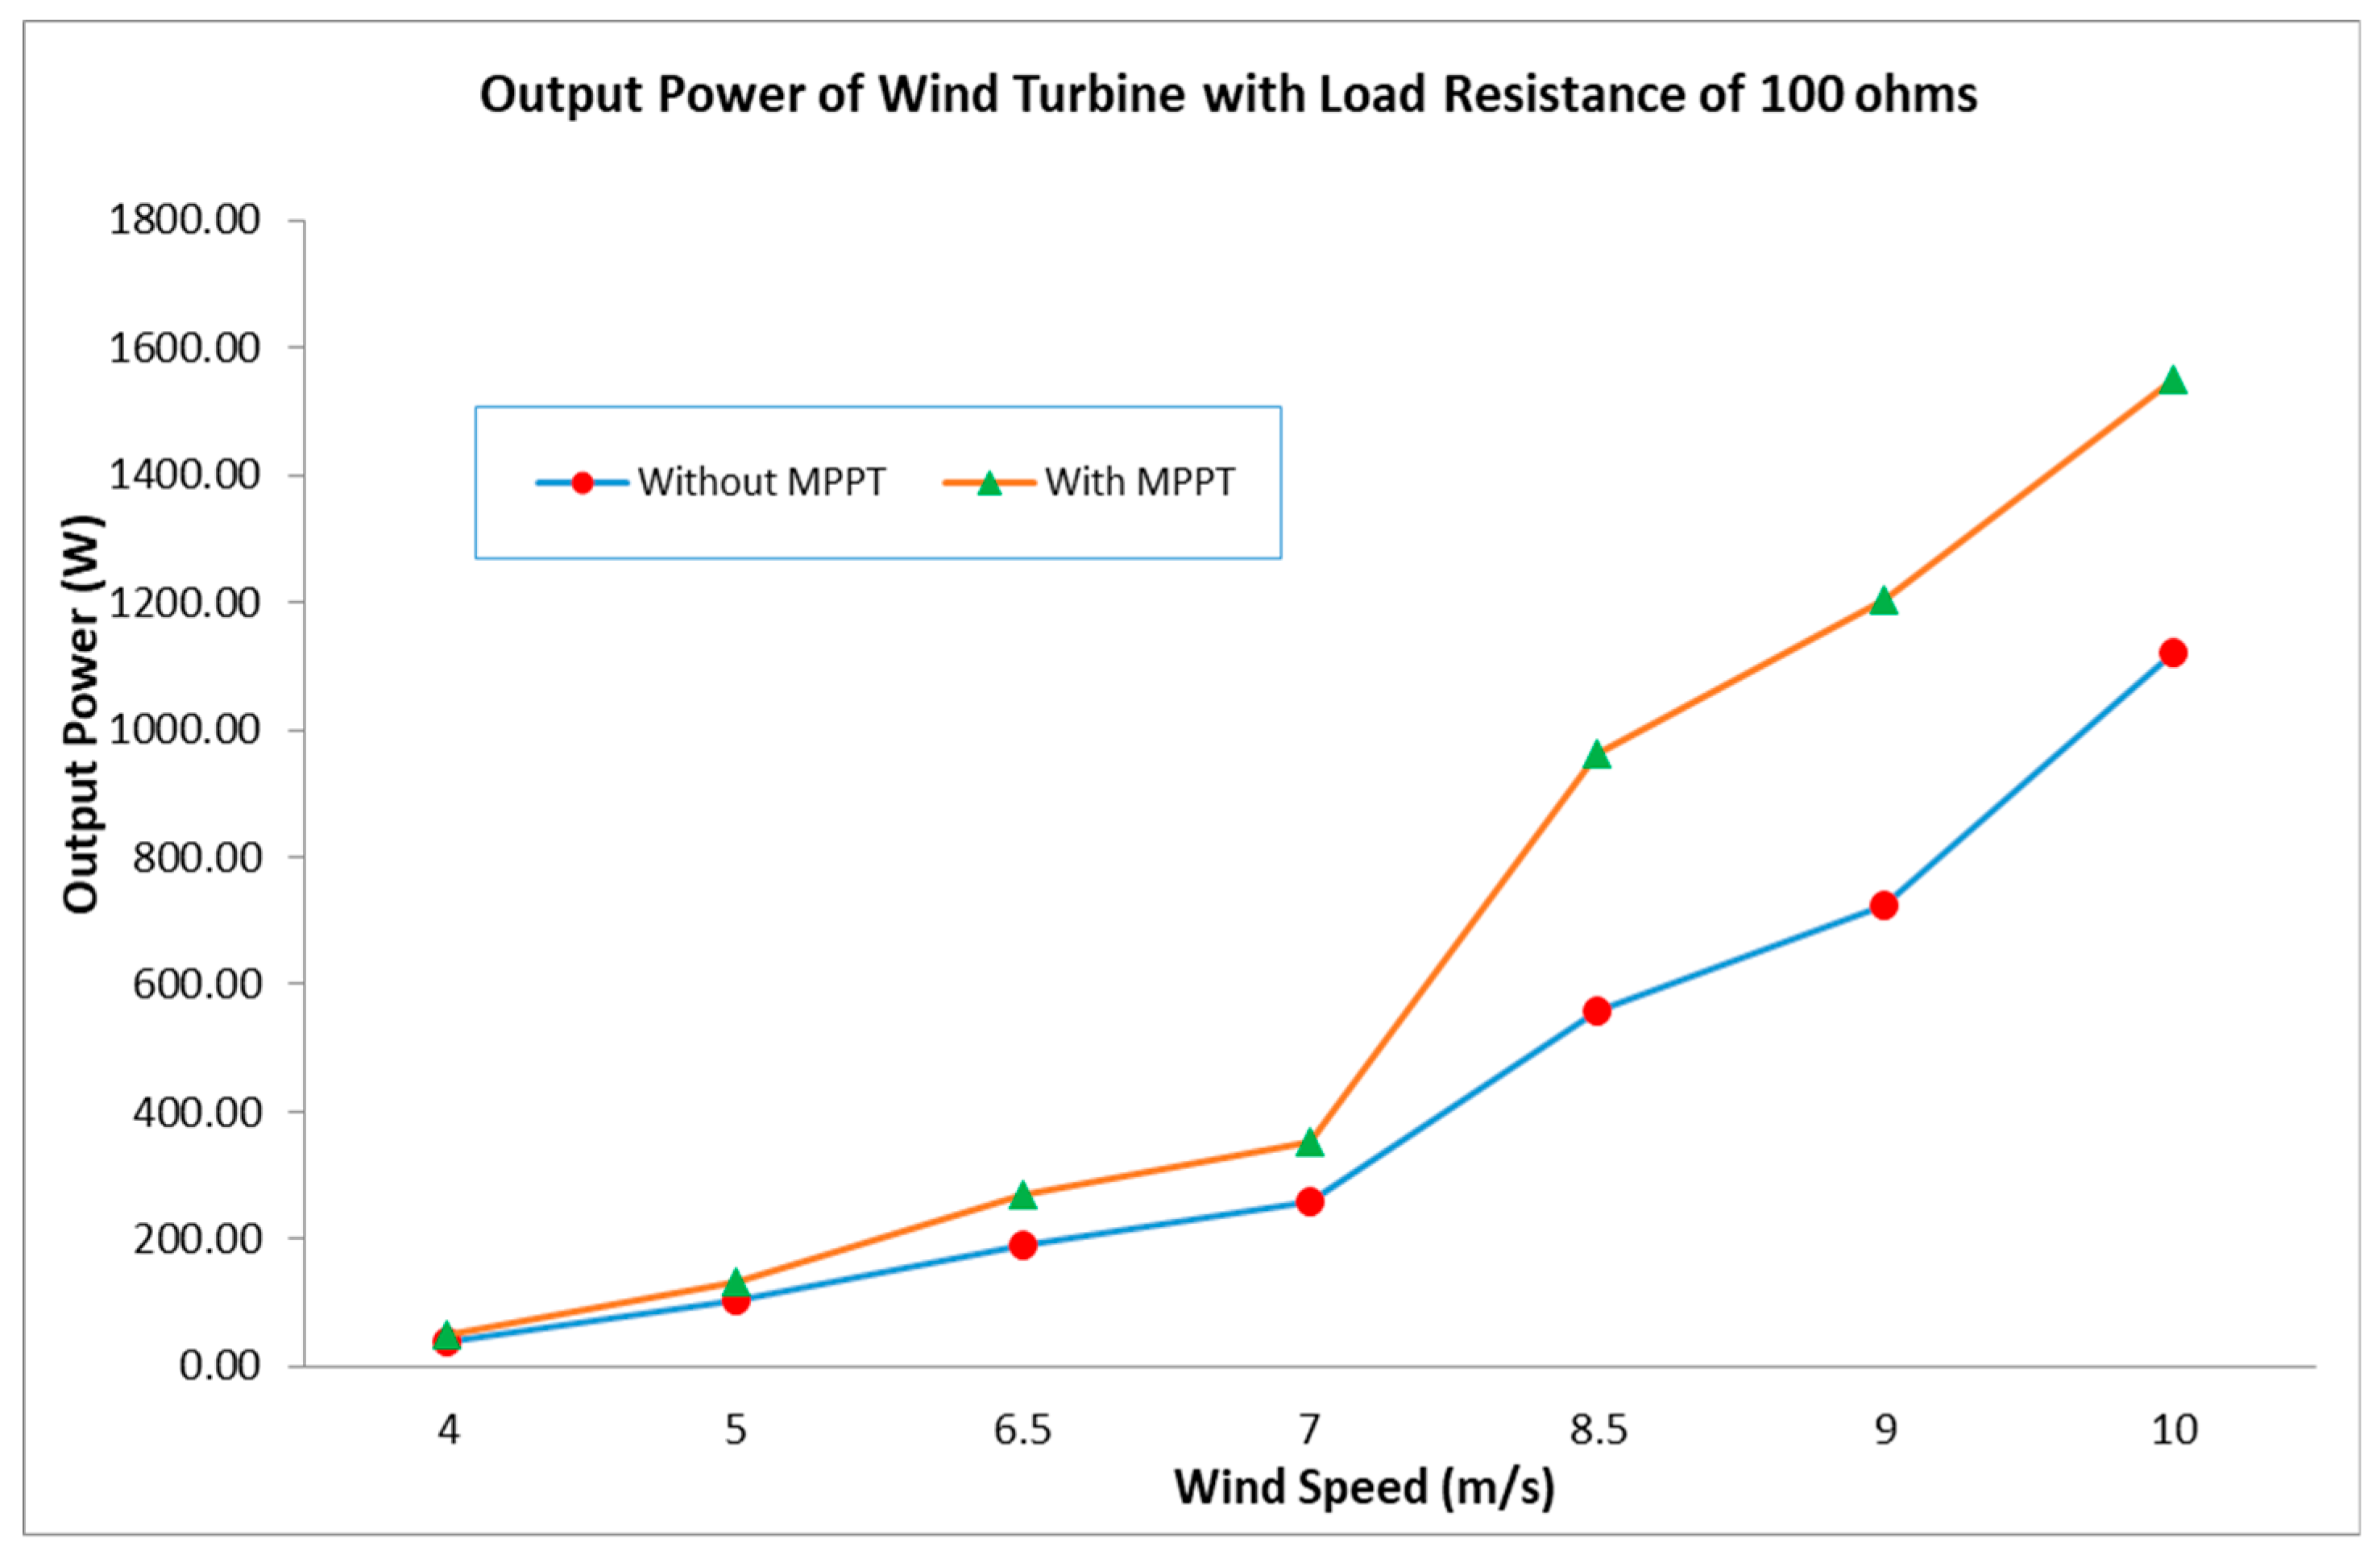
The output power of the wind turbine system with a load resistance of 100 Ω is shown in Figure 15. At a wind speed of 4 m/s, and without MPPT, the system produces a voltage of 62.63 V and an electric current of 0.62 A to serve the load resistance of 100 Ω, with an output turbine power of 38.83 W. Furthermore, the application of the MPPT controller on the PMSG generator side converter, as well as the voltage and current generated was 66.24 V and 0.75 A, respectively, resulting in output power of 49.68 W. This result means that the system output power is increased by 27.94% compared to when the MPPT controller was not implemented. Furthermore, the system performance test with a wind speed of 5, 6.5, 7, 8.5, 9, and 10 m/s, was examined. Based on the graph in Figure 15, it can be seen that the higher the wind speed, the greater the voltage, current, and output power of the system. The results show that the best output is produced with a wind speed of 10 m/s. Without applying the MPPT, the voltage produced was 335.09 V with a load current of 3.35 A, and power of 1122.55 W.
Furthermore, with the application of the MPPT, there is an increase in voltage, load current, and system output power of 348.61 V, 4.45 A, and 1151.3 W, respectively. When compared to the condition before the application of the MPPT, an increase in system output power by 38.20% is noticed. Based on the graph in Figure 15, it can also be seen that the best performance of the MPPT controller in increasing the output power of the system occurs precisely at the of 8.5 m/s wind speed, where the percentage increase in output power is 71.68%. Overall, it can be seen that the MPPT controller using the extended PO algorithm has successfully improved the performance of wind-turbine systems.
Figure 16 shows the output power of the turbine system with a load resistance of 200 Ω. At a wind speed of 4 m/s, and without implementing the MPPT, it produces a voltage of 116.51 V and electric current of 0.58 A to serve the load resistance of 200 Ω with an output power of 67.58 W. Along with the application of the MPPT controller on the PMSG generator, both voltage and current of 134.81 V and 1.14 A were generated, which resulted in output power of 153.68 W. Furthermore, the system performance test with wind speeds of 5, 6.5, 7, 8.5, 9, and 10 m/s, respectively, was examined. Based on the graph in Figure 16, it can be seen that the higher the wind speed, the greater the voltage, current, and output power of the wind turbine system. The results show that at a wind speed of 10 m/s, the system produces the optimal output.
Similarly, without implementing the MPPT, 547.11 V with a load current of 2.73 A were produced, which generated a total power of 1493.61 W. However, with the application of the MPPT controller, an increase in voltage, load current, and system output power of 586.44 V, 3.53 A, and 2070.13 W, respectively, was recorded. When compared to the condition before the application of the MPPT, the system output power is increased by 38.60%. Based on the graph in Figure 16, it can also be seen that the best performance of the MPPT controller in increasing the output power of the system occurs precisely when the wind speed is 6.5 m/s, with an output percentage power output of 135.62%. Overall, implementing the MPPT controller using the extended PO algorithm has successfully enhanced the performance of wind turbine systems.
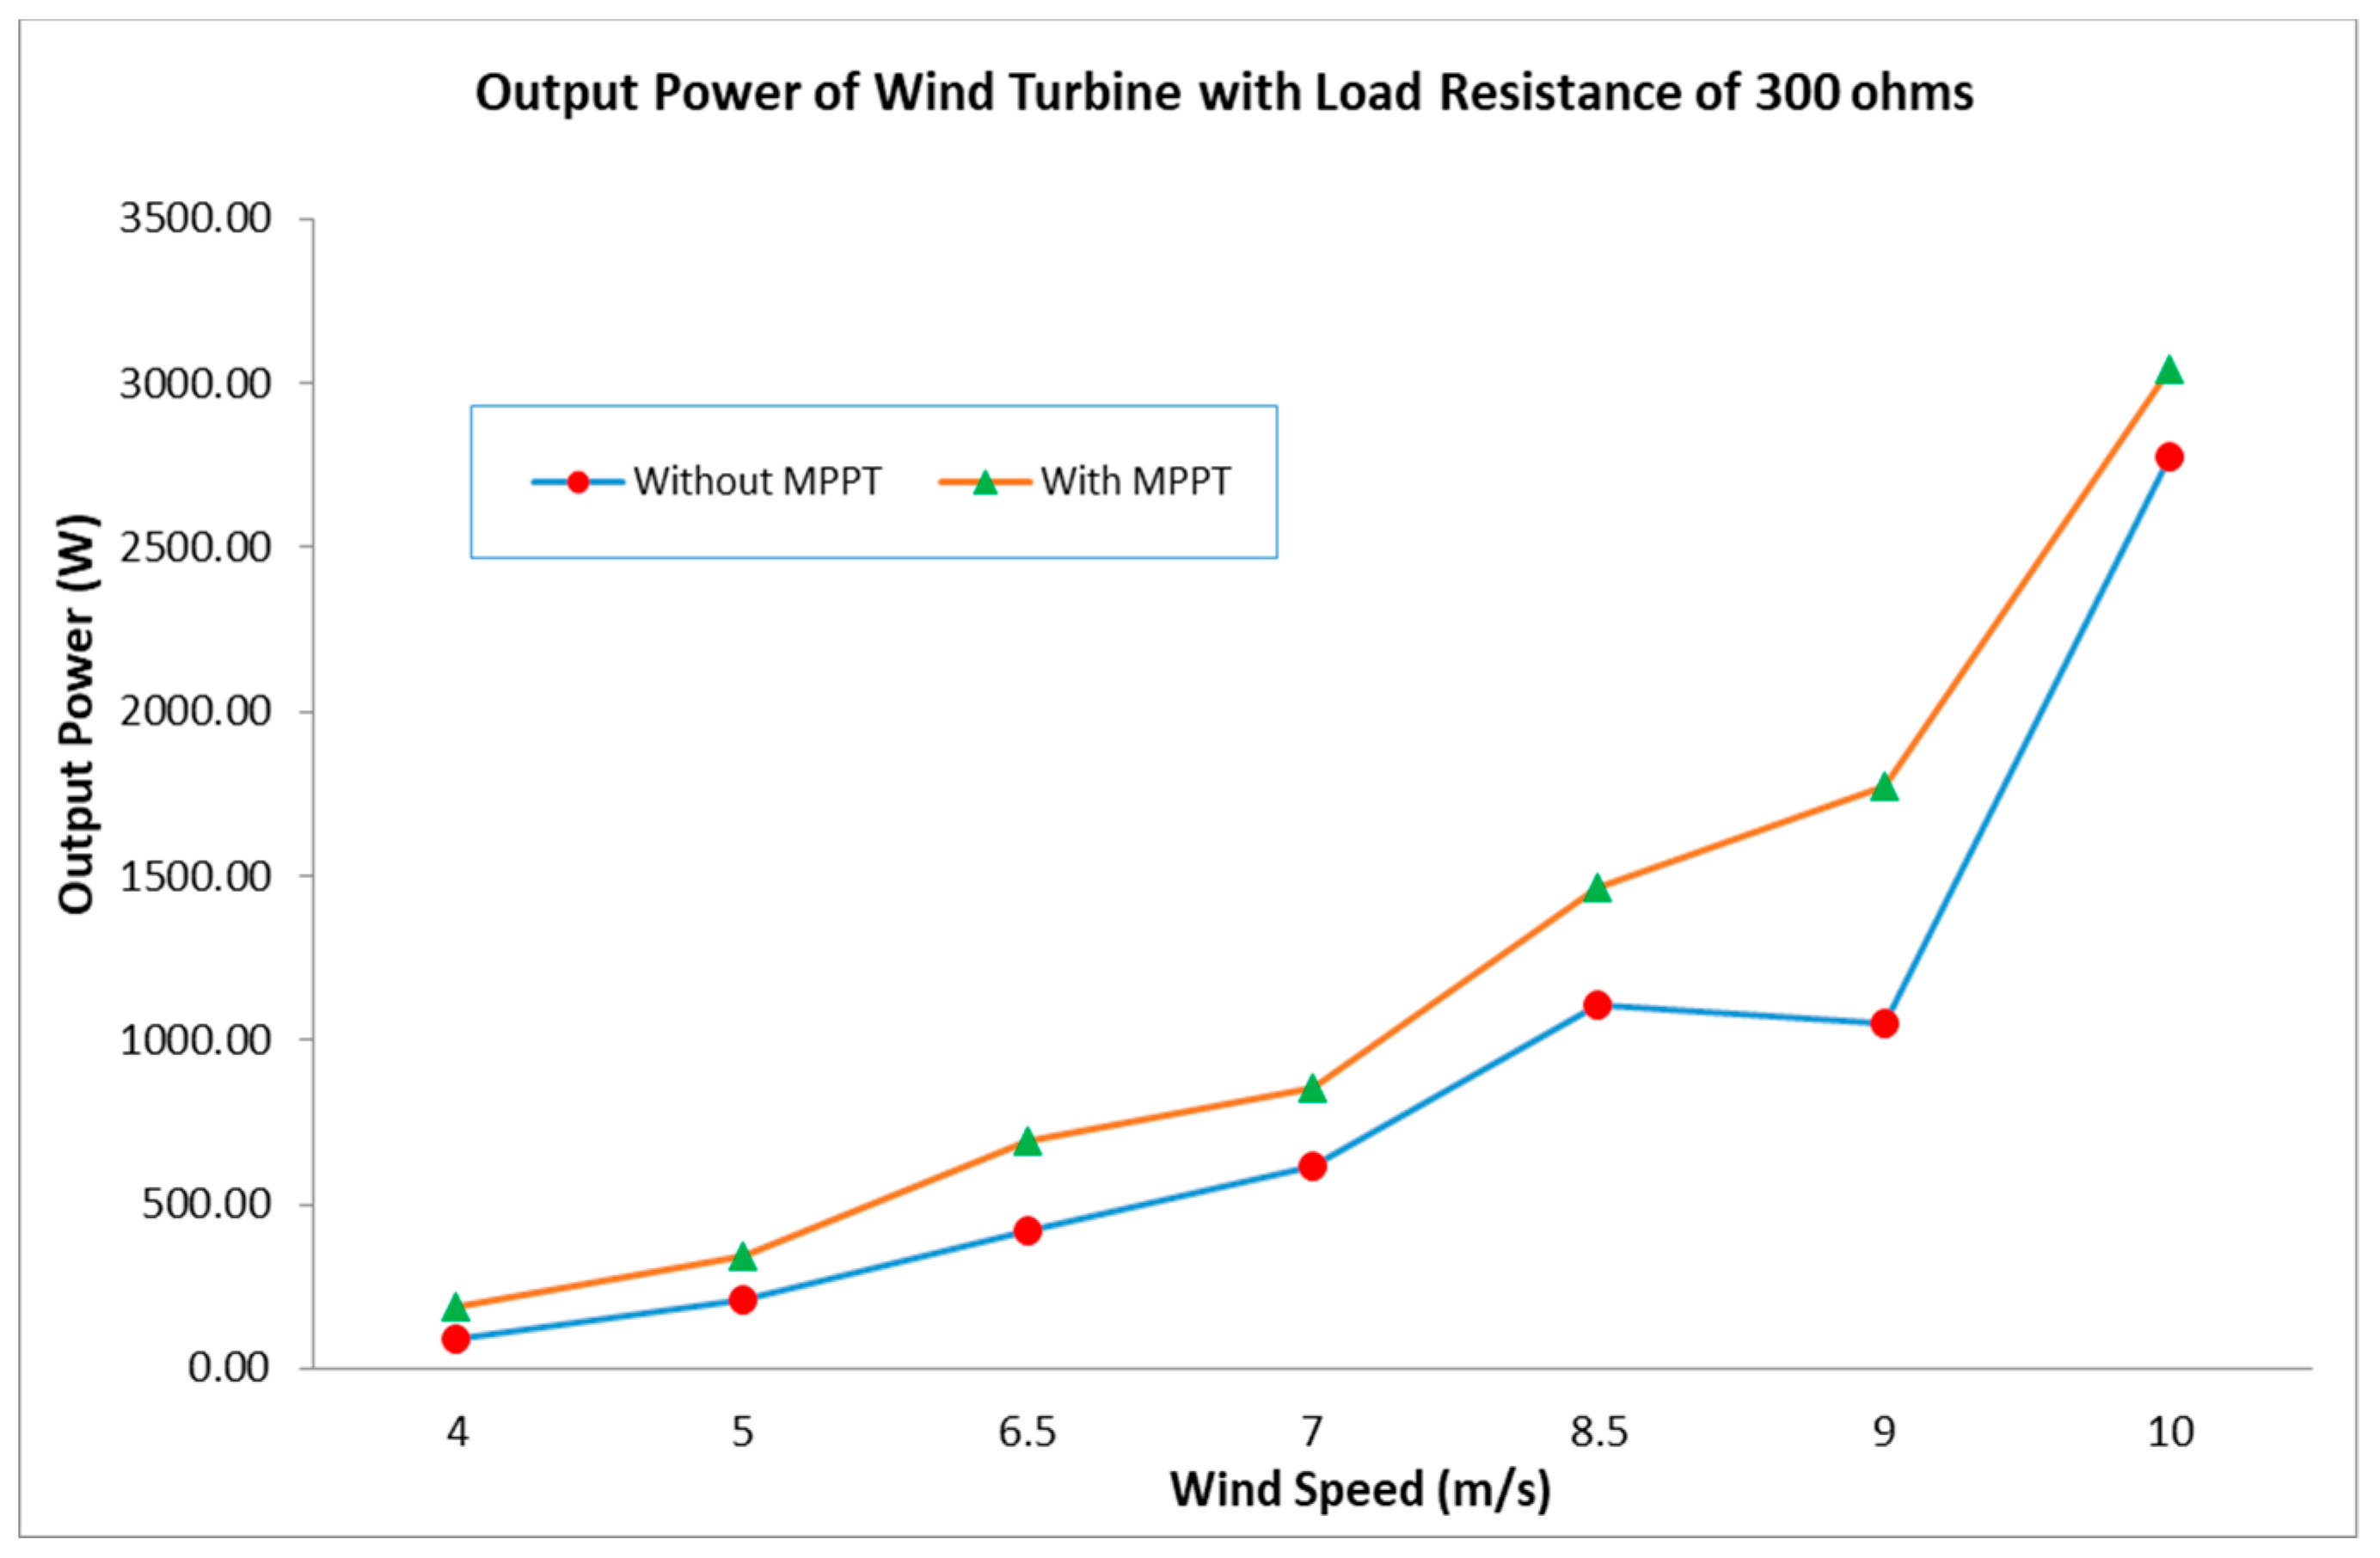
The output power of the wind turbine system with a load resistance of 300 Ω is shown in Figure 17. At wind speeds of 4 m/s, the system without MPPT produces a voltage of 166.03 V and electric current of 0.55 A which is used to serve the load resistance of 300 Ω with an overall output power of 91.32 W. The application of the MPPT controller on the PMSG generator produced a voltage and current of 184.25 V and 1.03 A, respectively, with an overall power output of 189.78 W. In this case, the system output power increased by 107.82% compared to when the MPPT controller was not implemented. Furthermore, the system performance test with wind speeds of 5, 6.5, 7, 8.5, 9, and 10 m/s, respectively, was examined.
Based on the graph in Figure 17, the higher the wind speed, the greater the voltage, current, and output power of the wind turbine system. The results show that the system produces an outstanding wind speed of 10 m/s. Without the implementation of the MPPT, the generated voltage is 902.72 V with a load current of 3.04 A, thus creating a power of 2734.67 W. Furthermore, with the application of the MPPT controller, there is an increase in voltage, load current, and system output power of 817.71 V, 3.72 A, and 2999.88 W, respectively. When compared to the initial condition, an increase in system output power by 9.63% can be detected. Based on the graph in Figure 17, the best performance of the MPPT controller in increasing the output power of the system occurs when the wind speed is 4 m/s, with a percentage increase in output power of 107.82%.
Based on the results of the overall wind-turbine system performance test, the most significant increase in system output power occurs when the system is loaded with 200 Ω, with a wind speed of 6.5 m/s. In this condition, there has been a high increase of output power by 135.62%, caused by the installation of the MPPT controller in the wind-turbine system, while the average growth of output power is only 50.77%. Thus, it can be concluded that MPPT using the extended PO method in this study has been proven to be able to increase the performance of wind-turbine systems.

5. Conclusions

In this study, the research of wind-turbine system performance using an MPPT controller based on an extended PO algorithm was performed. This algorithm can calibrate without oscillation to determine the maximum power output. To analyze the performance, the Simulink-Matlab software was employed. The performance examination is carried out with a 3000 W wind-turbine system which served varying electrical loads of 50 Ω, 100 Ω, 200 Ω, and 300 Ω, respectively. In each of the variations, various wind speeds based on the prevailing wind conditions in Indonesia, i.e., 4, 5, 6.5, 7, 8.5, 9, and 10 m/s, respectively, were performed. Based on the results of the overall wind-turbine system performance examination, the most significant increase in system output power occurs when the system is loaded with 200 Ω with a wind speed of 6.5 m/s. Similarly, the installation of the MPPT controller increased the output power by 135.62%, with an average power increase of 50.77%. The benefits of developing this PO algorithm include eliminating oscillation problems which occur due to fluctuations in power when it reaches maximum value. With the modification of the algorithm, this is expected to decrease due to the change of the value of ΔD, resulting in faster convergence of the computation. The results of this study have proved that an extended PO-based MPPT is capable of successfully enhancing the performance of wind-turbine systems.

Author Contributions

Conceptualization, R.S.; Data curation, I.S.; Formal analysis, R.S.; Funding acquisition, I.S.; Investigation, R.S.; Methodology, R.S.; Project administration, I.S.; Software, I.S.

Funding

This research was funded by the Directorate General of Development and Research Enhancement, Ministry of Research, Technology, and Higher Education of the Republic of Indonesia, under Research Grant scheme: DIPA-042.06.1.401516/2019, sub-contract number: 144.t/A.3-III/LP3M/IV/2019.

Acknowledgments

The authors gratefully acknowledge the contributions of the Directorate General of Development and Research Enhancement, Ministry of Research, Technology, and Higher Education of the Republic of Indonesia, and Universitas Muhammadiyah Yogyakarta.

Conflicts of Interest

The authors declare no conflict of interest.

Appendix A

Table A1. Abbreviations.
AbbreviationMeaning
ACalternating current
DCdirect current
EMFelectro-motive force
FLCfuzzy logic controller
GWgiga watts
MPPTmaximum power point tracking
PMSGpermanent magnet synchronous generator
POperturb and observe
PWMpulse width modulation
RCresistance-capacitance
Table A2. Symbols.
Table A2. Symbols.
SymbolsQuantityUnits
Athe area of cross-sectional coverage m2
Cpthe coefficient of electric power of the wind turbine system-
Cssnubber capacitanceF
Ielectric currentsA
Pthe electric power of the wind turbine systemW
RsSnubber resistanceΩ
Tthe torque of generator Nm
Velectric voltagesV
Vfforward voltageV
vwind velocity m/s
ωrotational speed of the rotor rad/s
λthe ratio of tip speed-
ρthe mass density of the air type kg/m3

References

  1. Syahputra, R.; Robandi, I.; Ashari, M. Reconfiguration of Distribution Network with DG Using Fuzzy Multi-objective Method. In Proceedings of the International Conference on Innovation, Management and Technology Research (ICIMTR), Melacca, Malaysia, 21–22 May 2012. [Google Scholar]
  2. Syahputra, R.; Robandi, I.; Ashari, M. Optimization of Distribution Network Configuration with Integration of Distributed Energy Resources Using Extended Fuzzy Multi-objective Method. Int. Rev. Electr. Eng. 2014, 9, 629–639. [Google Scholar] [CrossRef]
  3. Syahputra, R.; Soesanti, I.; Ashari, M. Performance Enhancement of Distribution Network with DG Integration Using Modified PSO Algorithm. J. Electr. Syst. 2016, 12, 1–19. [Google Scholar]
  4. Syahputra, R.; Robandi, I.; Ashari, M. Performance Improvement of Radial Distribution Network with Distributed Generation Integration Using Extended Particle Swarm Optimization Algorithm. Int. Rev. Electr. Eng. 2015, 10, 293–304. [Google Scholar] [CrossRef]
  5. Brusco, G.; Burgio, A.; Menniti, D.; Pinnarelli, A.; Sorrentino, N. Optimal Sizing of DGs for a CHP-Based Agro-Industrial Microgrid with a Priority Criteria Operational Strategy. Int. Rev. Electr. Eng. 2014, 9, 351–362. [Google Scholar]
  6. Syahputra, R.; Soesanti, I. DFIG Control Scheme of Wind Power Using ANFIS Method in Electrical Power Grid System. Int. J. Appl. Eng. Res. 2016, 11, 5256–5262. [Google Scholar]
  7. Syahputra, R.; Wiyagi, R.O.; Sudarisman. Performance Analysis of a Wind Turbine with Permanent Magnet Synchronous Generator. J. Theor. Appl. Inf. Technol. 2017, 95, 1950–1957. [Google Scholar]
  8. Ahmed, J.; Salam, Z. An Enhanced Adaptive P&O MPPT for Fast and Efficient Tracking under Varying Environmental Conditions. IEEE Trans. Sustain. Energy 2018, 9, 1487–1496. [Google Scholar]
  9. Sher, H.A.; Addoweesh, K.E.; Al-Haddad, K. An Efficient and Cost-Effective Hybrid MPPT Method for a Photovoltaic Flyback Microinverter. IEEE Trans. Sustain. Energy 2018, 9, 1137–1144. [Google Scholar] [CrossRef]
  10. Tang, L.; Xu, W.; Mu, C. Analysis for step-size optimisation on MPPT algorithm for photovoltaic systems. IET Power Electron. 2017, 10, 1647–1654. [Google Scholar] [CrossRef]
  11. Ghasemi, M.A.; Ramyar, A.; Eini, H.I. MPPT Method for PV Systems under Partially Shaded Conditions by Approximating I–V Curve. IEEE Trans. Ind. Electron. 2018, 65, 3966–3975. [Google Scholar] [CrossRef]
  12. Jiang, R.; Han, Y.; Zhang, S. Wide-range, high-precision and low-complexity MPPT circuit based on perturb and observe algorithm. Electron. Lett. 2017, 53, 1141–1142. [Google Scholar] [CrossRef]
  13. Peng, B.R.; Che, K.; Liu, Y.H. A Novel and Fast MPPT Method Suitable for Both Fast Changing and Partially Shaded Conditions. IEEE Trans. Ind. Electron. 2018, 65, 3240–3251. [Google Scholar] [CrossRef]
  14. Hossain, M.K.; Ali, M.H. Overview on Maximum Power Point Tracking (MPPT) Techniques for Photovoltaic Power Systems. Int. Rev. Electr. Eng. 2013, 8, 1363–1378. [Google Scholar]
  15. Hui, J.C.Y.; Bakhshai, A.; Jain, P.K. An Energy Management Scheme With Power Limit Capability and an Adaptive Maximum Power Point Tracking for Small Standalone PMSG Wind Energy Systems. IEEE Trans. Power Electron. 2016, 31, 4861–4875. [Google Scholar] [CrossRef]
  16. Hui, J.C.Y.; Bakhshai, A.; Jain, P.K. A Sensorless Adaptive Maximum Power Point Extraction Method with Voltage Feedback Control for Small Wind Turbines in Off-Grid Applications. IEEE J. Emerg. Sel. Top. Power Electron. 2015, 3, 817–828. [Google Scholar] [CrossRef]
  17. Farhat, S.; Alaoui, R.; Kahaji, A.; Bouhouch, L.; Ihlal, A. P&O and Incremental Conductance MPPT Implementation. Int. Rev. Electr. Eng. 2015, 10, 116–122. [Google Scholar]
  18. Al Hasibi, R.A.; Hadi, S.P.; Sarjiya, S. Integrated and Simultaneous Model of Power Expansion Planning with Distributed Generation. Int. Rev. Electr. Eng. 2018, 13, 116–127. [Google Scholar] [CrossRef]
  19. Metry, M.; Shadmand, M.B.; Balog, R.S.; Abu-Rub, H. MPPT of Photovoltaic Systems Using Sensorless Current-Based Model Predictive Control. IEEE Trans. Ind. Appl. 2017, 53, 1157–1167. [Google Scholar] [CrossRef]
  20. Kebede, M.H.; Beyene, G.B. Feasibility Study of PV-Wind-Fuel Cell Hybrid Power System for Electrification of a Rural Village in Ethiopia. J. Electr. Comput. Eng. 2018. [Google Scholar] [CrossRef]
  21. Syahputra, R.; Soesanti, I. Power System Stabilizer model based on Fuzzy-PSO for improving power system stability. In Proceedings of the 2015 International Conference on Advanced Mechatronics, Intelligent Manufacture, and Industrial Automation (ICAMIMIA), Surabaya, Indonesia, 15–17 October 2015; pp. 121–126. [Google Scholar]
  22. Soetedjo, A.; Lomi, A.; Mulayanto, W.P. Modeling of wind energy system with MPPT control. In Proceedings of the 2011 International Conference on Electrical Engineering and Informatics, Bandung, Indonesia, 17–19 July 2011; pp. 1–6. [Google Scholar]
  23. Zhang, Y.; Zhang, L.; Liu, Y. Implementation of Maximum Power Point Tracking Based on Variable Speed Forecasting for Wind Energy Systems. Processes 2019, 7, 158. [Google Scholar] [CrossRef]
  24. Costanzo, L.; Schiavo, A.L.; Vitelli, M. Design Guidelines for the Perturb and Observe Technique for Electromagnetic Vibration Energy Harvesters Feeding Bridge Rectifiers. IEEE Trans. Ind. Appl. 2019, 55, 5089–5098. [Google Scholar] [CrossRef]
  25. Raj, T.G.; Kumar, B.R. Comparative Analysis of Incremental Conductance and Perturb & Observe Mppt Methods For Single-Switch Dc/Dc Converter. In Proceedings of the 2018 National Power Engineering Conference (NPEC), Madurai, India, 9–10 March 2018. [Google Scholar]
Figure 1. Wind turbine characteristics with pitch angle of 0°.
Energies 12 03938 g001
Figure 2. Typical diagram of wind-turbine system.
Energies 12 03938 g002
Figure 3. Ideal power curve in wind turbines with varying wind speeds.
Energies 12 03938 g003
Figure 4. Flow chart of the standard perturb and observe (PO) algorithm.
Energies 12 03938 g004
Figure 5. Flow chart of the extended perturb and observe algorithm.
Energies 12 03938 g005
Figure 6. Block diagram of the wind turbine system with maximum power point tracking (MPPT).
Energies 12 03938 g006
Figure 7. Wind turbine circuit diagram system with MPPT in the Simulink-Matlab software.
Energies 12 03938 g007
Figure 8. Wind turbine model in Simulink-Matlab software.
Energies 12 03938 g008
Figure 9. Boost converter model in Simulink-Matlab software.
Energies 12 03938 g009
Figure 10. Generator voltage of wind-turbine system.
Energies 12 03938 g010
Figure 11. Generator output power of wind-turbine system.
Energies 12 03938 g011
Figure 12. Wind-turbine system without MPPT in Simulink-Matlab software.
Energies 12 03938 g012
Figure 13. Wind-turbine system with MPPT in Simulink-Matlab software.
Energies 12 03938 g013
Figure 14. Output power of wind-turbine system with load resistance of 50 Ω.
Energies 12 03938 g014
Figure 15. Output power of wind-turbine system with load resistance of 100 Ω.
Energies 12 03938 g015
Figure 16. Output power of wind turbine system with load resistance of 200 Ω.
Energies 12 03938 g016
Figure 17. Output power of wind-turbine system with load resistance of 300 Ω.
Energies 12 03938 g017
Table 1. Parameters of wind turbine in this study.
ParametersQuantities and Units
Nominal mechanical output power3000 W
Base power of the electrical generator3000/0.9 VA
Base wind speed12 m/s
Maximum power at base wind speed of nominal mechanical power0.73 p.u.
Base rotational speed of base generator speed1.2 p.u.
Pitch angle beta to display wind turbine power characteristics0
Table 2. Parameters of permanent magnet synchronous generator (PMSG).
ParametersQuantities and Units
Back electro-motive force (EMF) waveformSinusoidal
Rotor typeSalient pole
Mechanical inputTorque (Tm)
Stator phase resistance0.00867 Ω
Inductances (Ld)0.00286 H
Inductances (Lq)0.00344 H
Flux linkage 0.175 V.s.
Voltage constant126.966 Ω
Torque constant1.05 Nm
Table 3. Parameters of rectifier.
ParametersQuantities and Units
Number of bridge arms3
Snubber resistance (Rs)100 Ω
Snubber capacitance (Cs)0.1 µF
Power electronic devicediodes
Forward voltage (Vf)0.8 V
Table 4. Parameters of battery.
ParametersQuantities and Units
Nominal voltage300 V
Rated capacity6.5 Ah
Initial state of charge60%
Maximum capacity7 Ah
Fully charged voltage353.39 V
Nominal discharge current1.3 A
Internal resistance0.4615 Ω
Capacity at nominal voltage6.25 Ah
Exponential zone325.42 V, 1.3 Ah
Table 5. Parameters of inverter.
ParametersQuantities and Units
Snubber resistance100 k Ω
Snubber capacitanceInfinite
Power electronic deviceMosfet, diodes
Internal resistance0.001 Ω
Table 6. Results of the PO algorithm validity test.
Number of ExperimentsWind Speed (m/s)Turbine Rotation (rpm)Load Resistance (Ω)Output Power (W)
110508.062002032
210508.062002032
310508.062002032
410508.062002032
510508.062002032
610508.062002032
Mean10508.062002032
Standard deviation0000
Table 7. Results of the PO algorithm sensitivity test.
Wind Speed (m/s)Generator Voltage (V)Output Power (W)
327.928.22
457.0743.89
582.2178.02
6140.03242.13
7171.41334.23
8247.24809.31
9316.901201.18
10348.621472.34
Table 8. Results of performance test of wind-turbine system.
Load Resistance (Ω)Wind Speed (m/s)Performance Test Variables of Wind Turbine System
Without MPPTWith MPPTPower Increasing (%)
Output Voltage (V)Electric Current (A)Output Power (W)Output Voltage (V)Electric Current (A)Output Power (W)
50433.760.6722.6233.830.6923.343.20
554.091.0858.4260.051.1569.0618.21
6.571.511.43102.2673.211.53112.019.54
783.031.66137.8385.921.81155.5212.83
8.5124.242.42300.66130.542.77361.6020.27
9140.412.81394.55147.523.14463.2117.40
10174.353.49608.48183.813.95726.0519.32
100462.630.6238.8366.240.7549.6827.94
595.091.09103.65119.121.12133.4128.72
6.5137.641.38189.94149.021.81269.7342.00
7160.121.62259.39171.412.05351.3935.47
8.5238.232.35559.84265.53.62961.1171.68
9269.322.69724.47296.044.071204.8866.31
10335.093.351122.55348.614.451551.3138.20
2004116.510.5867.58134.811.14153.68127.42
5189.890.89169.00215.661.65355.84110.55
6.5240.641.23295.99280.082.49697.40135.62
7299.111.49445.67315.312.65835.5787.48
8.5376.071.88707.01431.622.921260.3378.26
9438.012.511099.41485.413.261582.4443.94
10547.112.731493.61586.443.532070.1338.60
3004166.030.5591.32184.251.03189.78107.82
5234.090.89208.34256.051.35345.6765.92
6.5354.811.18418.68360.261.93695.3066.07
7426.221.44613.76412.062.07852.9638.97
8.5574.051.931107.92589.922.481463.0032.05
9483.152.181053.27658.092.691770.2668.07
10902.723.042734.67817.713.722999.889.63
Average of power increasing (%)50.77

