Procedure to Evaluate the Impact in Distribution Single Phase Transformers Due to Insertion of New Nonlinear Load Which Changes Daily Demand Graphs

Abstract
:
1. Introduction and Background
2. Materials and Methods
- (a)
- Characterize the typical demand graph when different quantities of a type of polluting load are introduced.
- (b)
- Identify average values of the harmonic losses factors in conductors during the different hours of the day (FHL) and in other parts of the transformer (FHL-STR) and their confidence intervals.
- (c)
- Identify the typical hourly graph of harmonics’ effective current and its confidence interval when different quantities of a new type of polluting load are introduced.
- (d)
- Estimate, with the information in subsections a–c, previous heating state of the transformer when the electric peak begins.
- (e)
- Once the fundamental peak load and ambient temperature are known or estimated, calculate the actual heating state of the transformer so that the temperature of the hottest point does not exceed the limit temperature according to its insulation class, to contribute to timely decision making.
- (a)
- It is assumed with some foundation that all consumers of the identified population have a potential for installed equipment (not including new pollutant loads) that cause a similar behavior of current harmonics. That means that their behavior is a randomized variable with normal distribution in each hourly time interval.
- (b)
- The influence of iron losses on the additional heating suffered by the single-phase distribution transformer is negligible.
- (c)
- Distribution transformer heating is a slow physical phenomenon, given their high thermal inertia, which causes them to reach their highest temperature after the period of higher overload.
2.1. Proposed Procedure
- Characterize the population.
- Select a representative sample.
- Obtain the typical daily current demand graph in transformers, due to the inclusion of a new type of polluting load.
- Identify homogeneous groups of transformers (by capacity and number of users with polluting loads) considering the effective harmonics current as a normally distributed random variable.
- Characterize harmonic losses factors FHL and FHL-STR according to the groups determined in step 4.
- Identify an appropriate variable of loading state of each transformer (intensity of fundamental current in the peak), that can be measured or estimated to decode to natural values the typical graphs of fundamental and harmonics effective current corresponding to analyzed transformer and perform the calculation of its equivalent heating state. Estimate results’ confidence intervals.
2.2. Proposed Procedure Description
3. Results
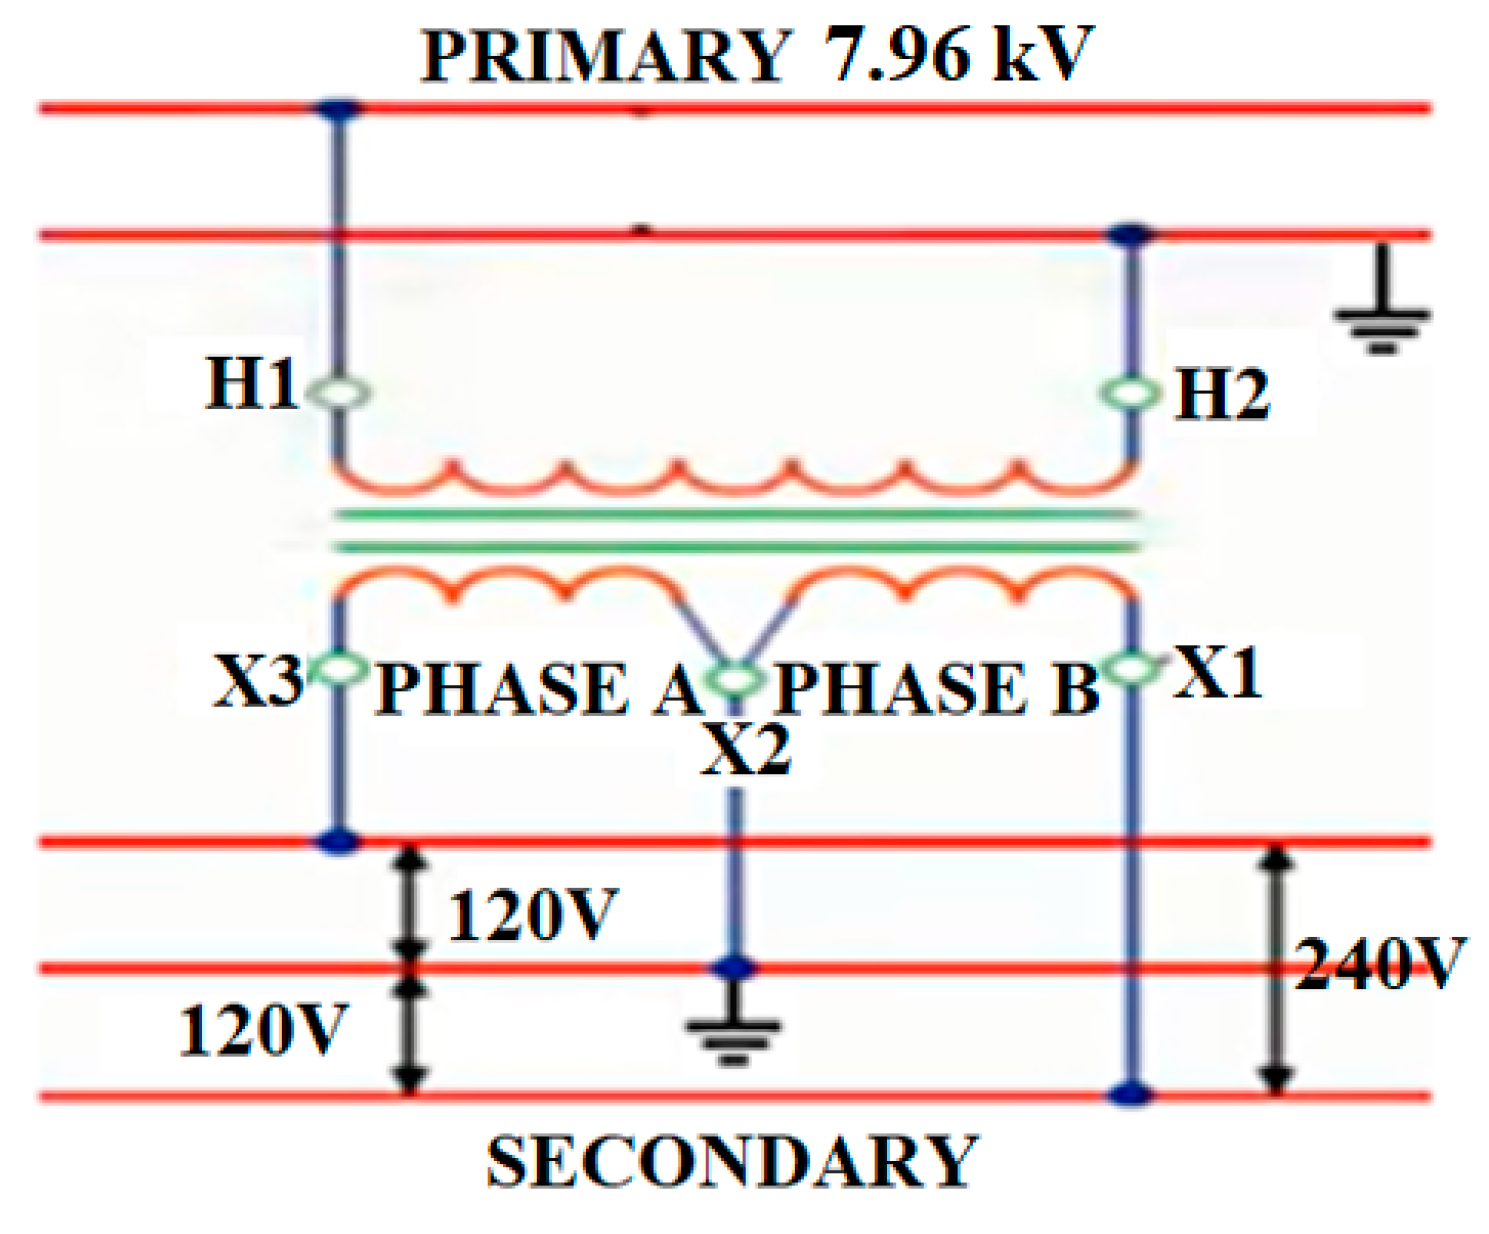
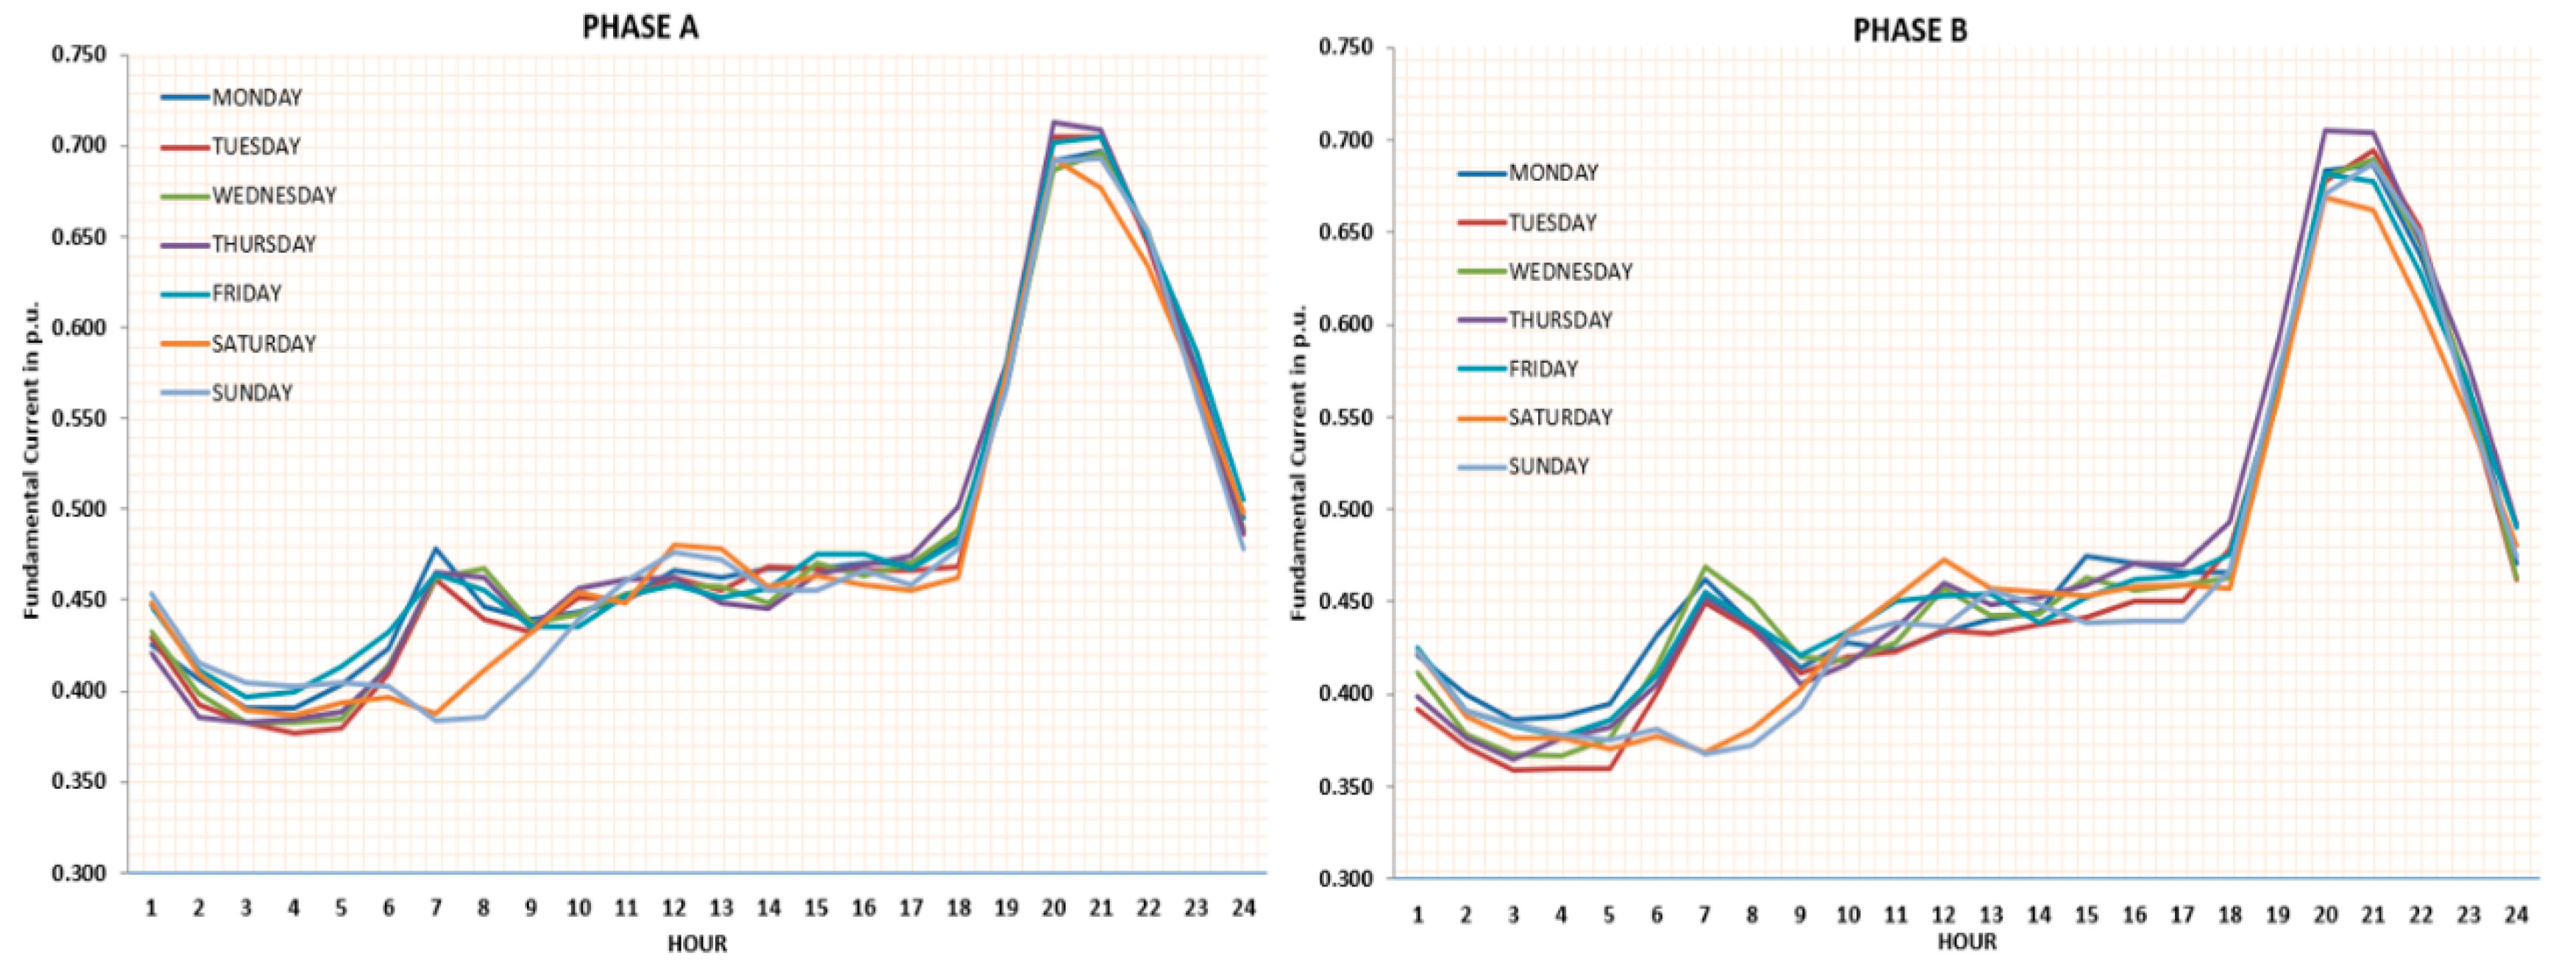
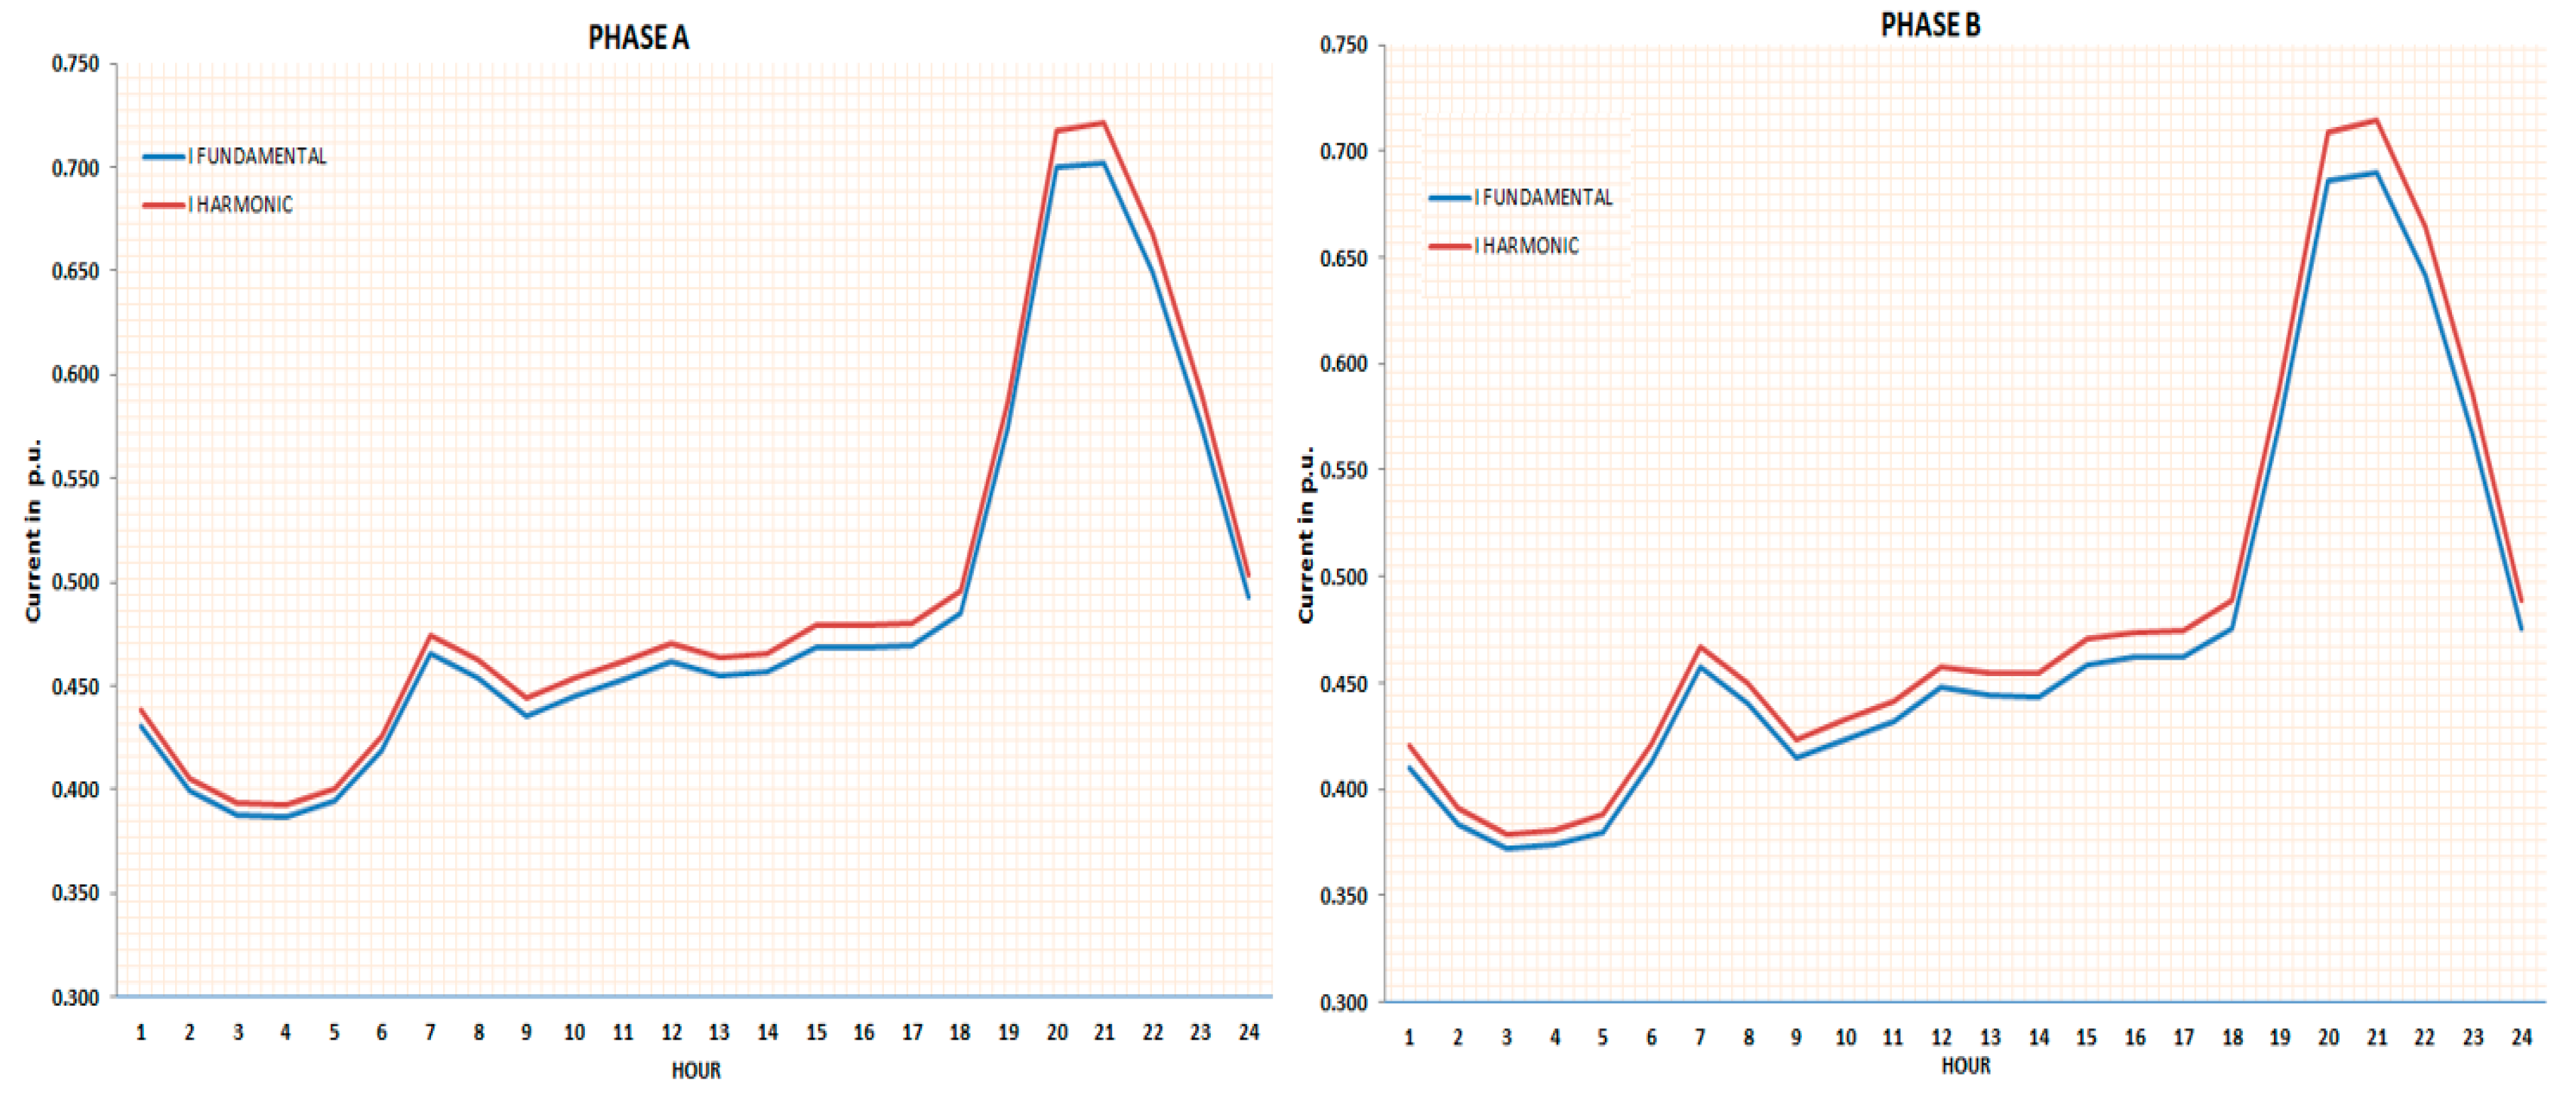
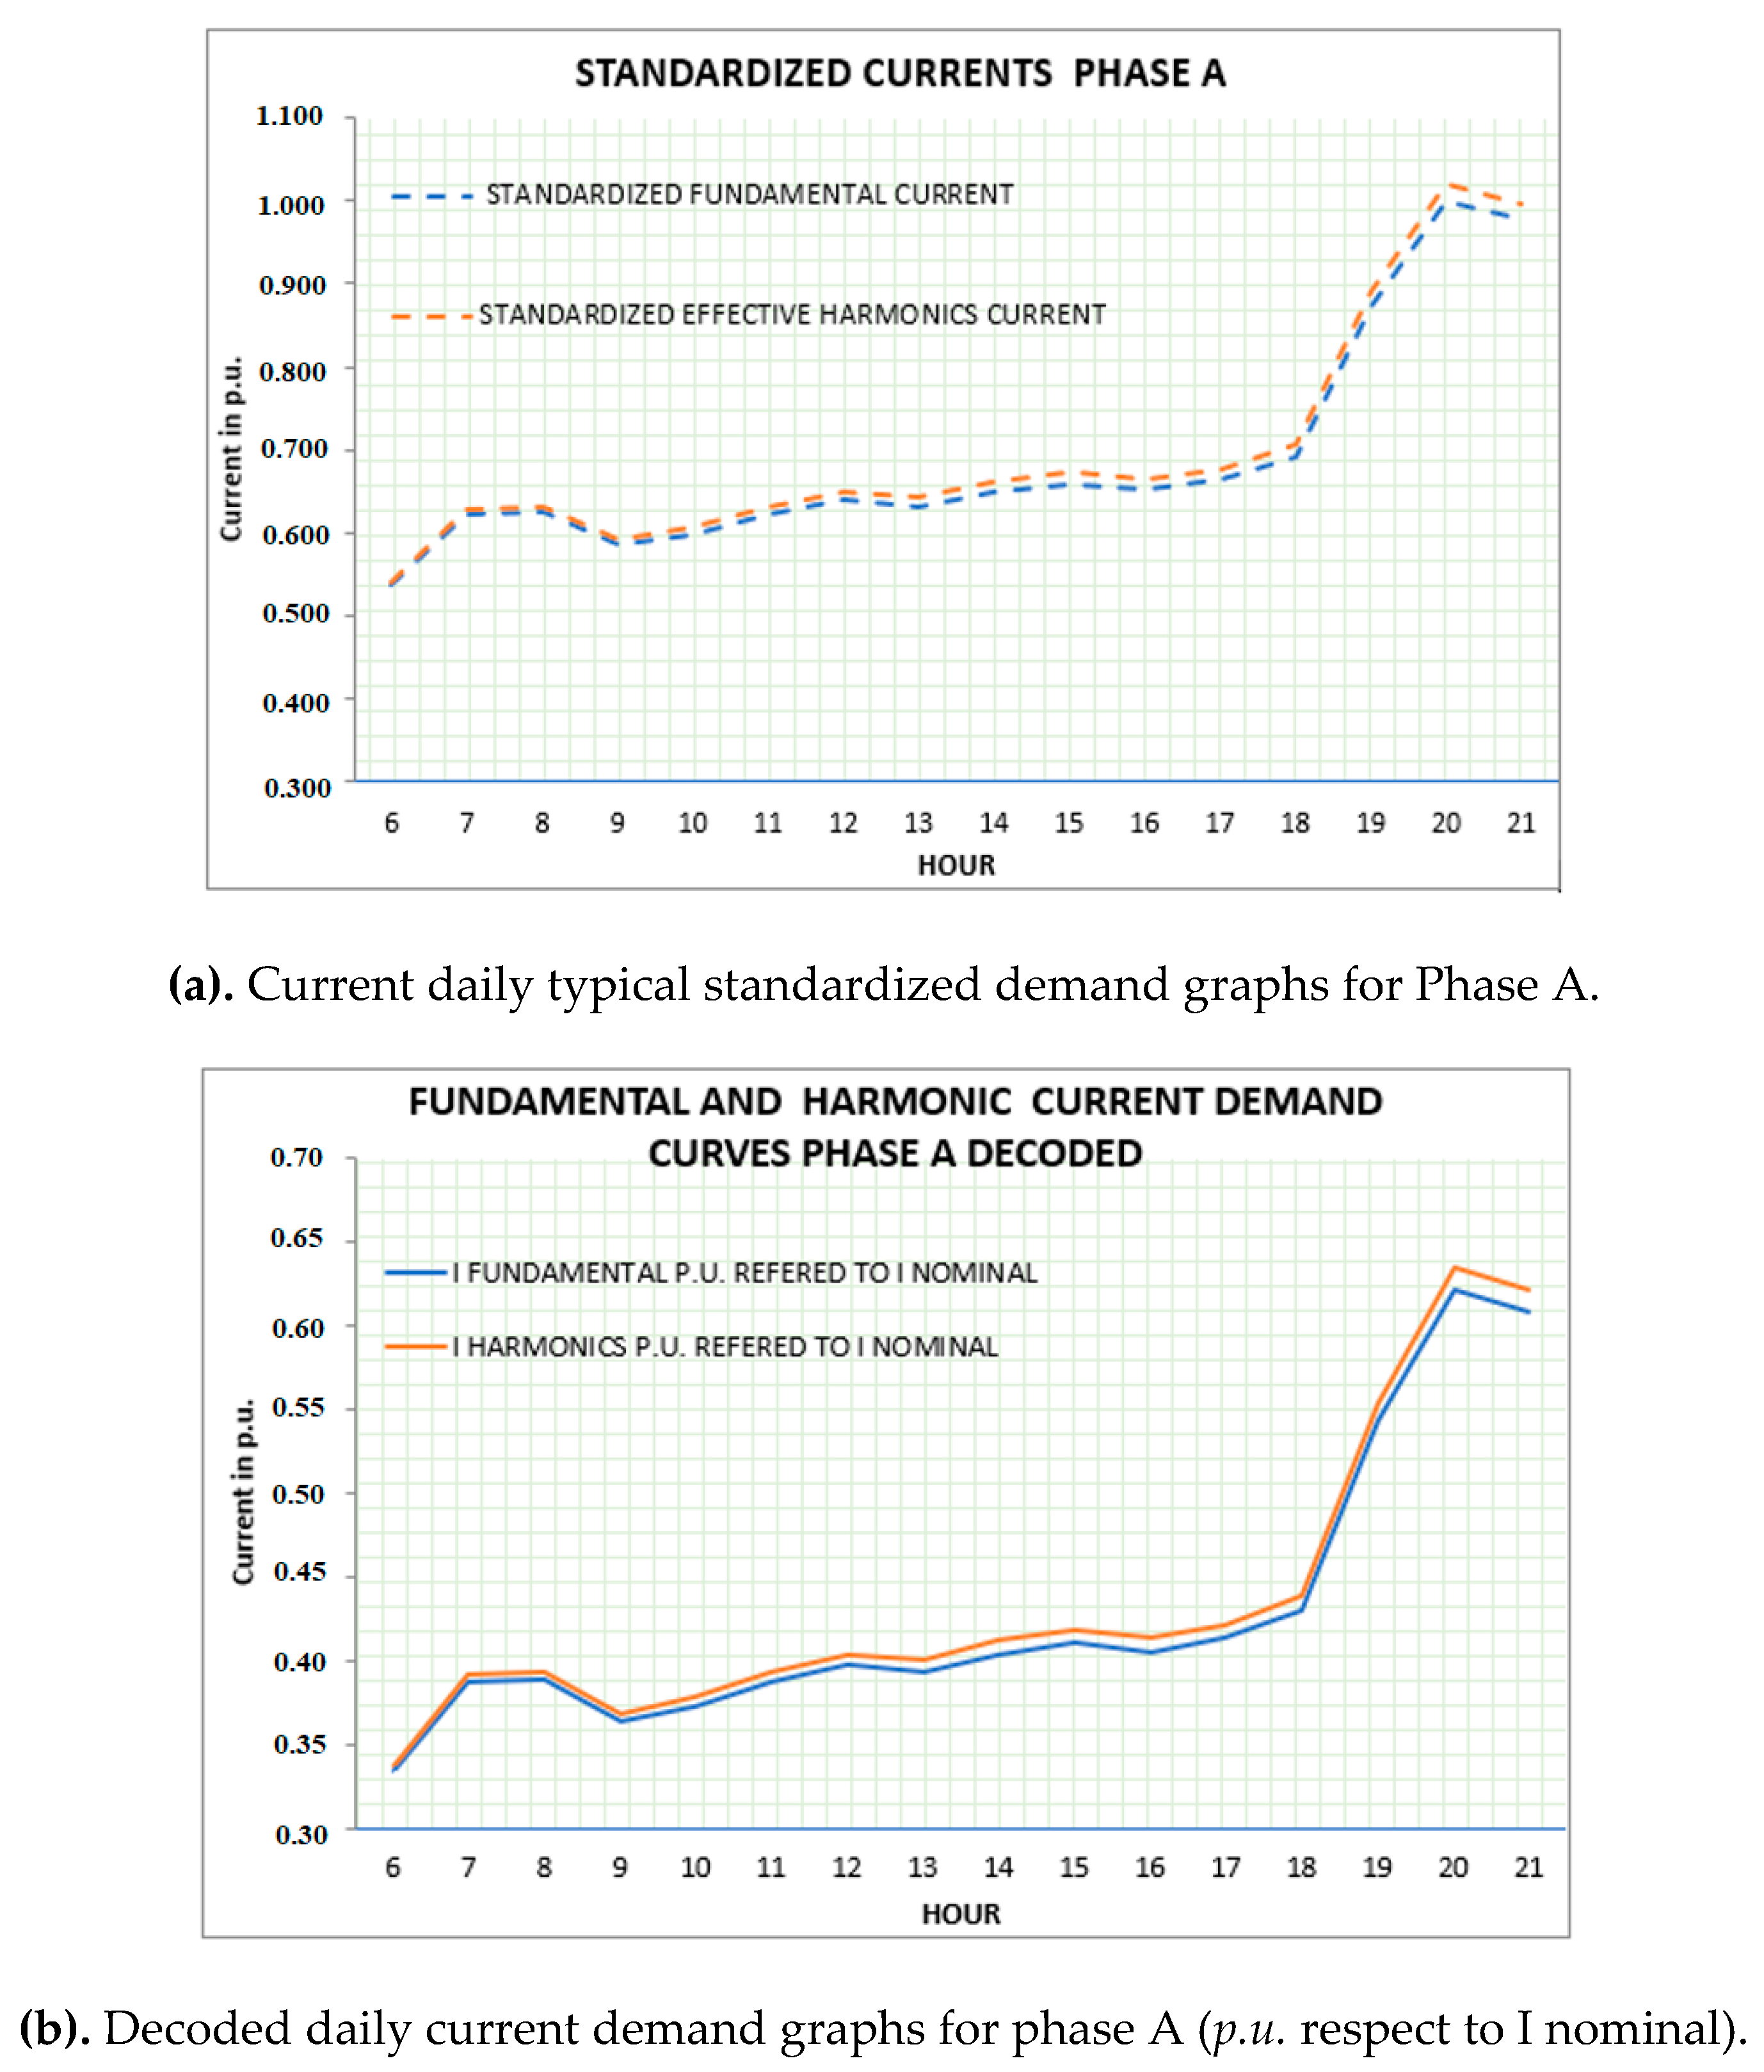
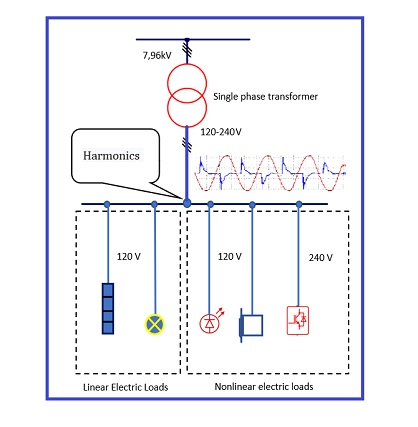
3.1. Application of the Procedure to the Case of Loja City, Ecuador
3.2. Calculations for a Specific Case of a 25 kVA Transformer
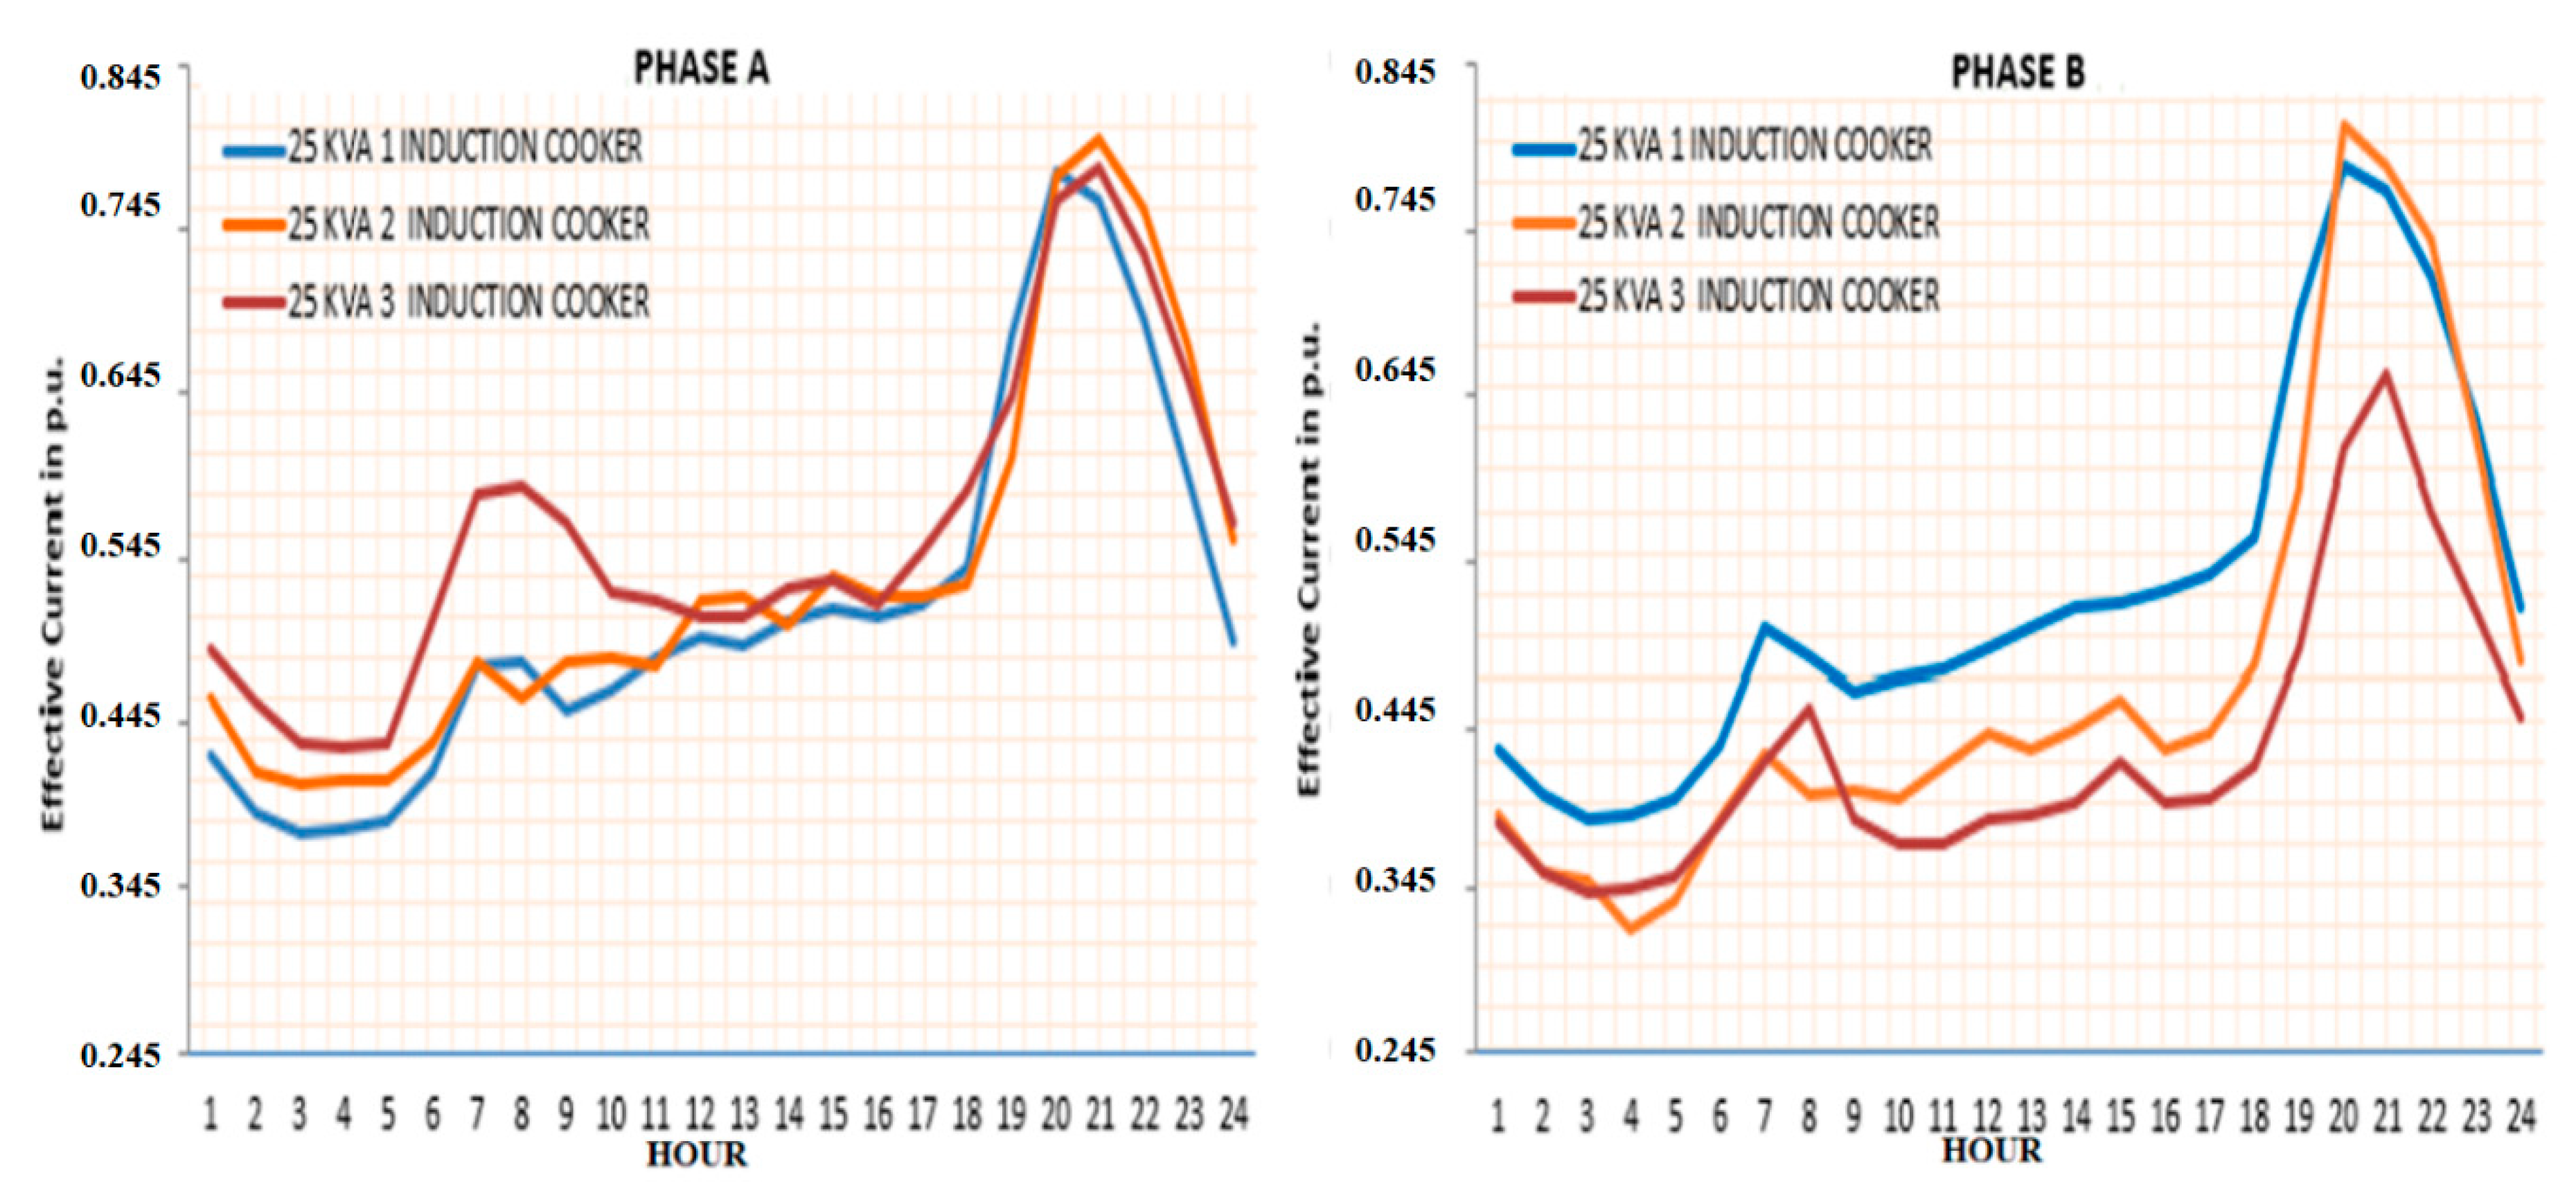
- From the typical current curves shown in Figure 4, the average values of the harmonic effective current intensities of both phases: IefhA and IefhB and their confidence intervals in p.u. referred to the transformer nominal current.
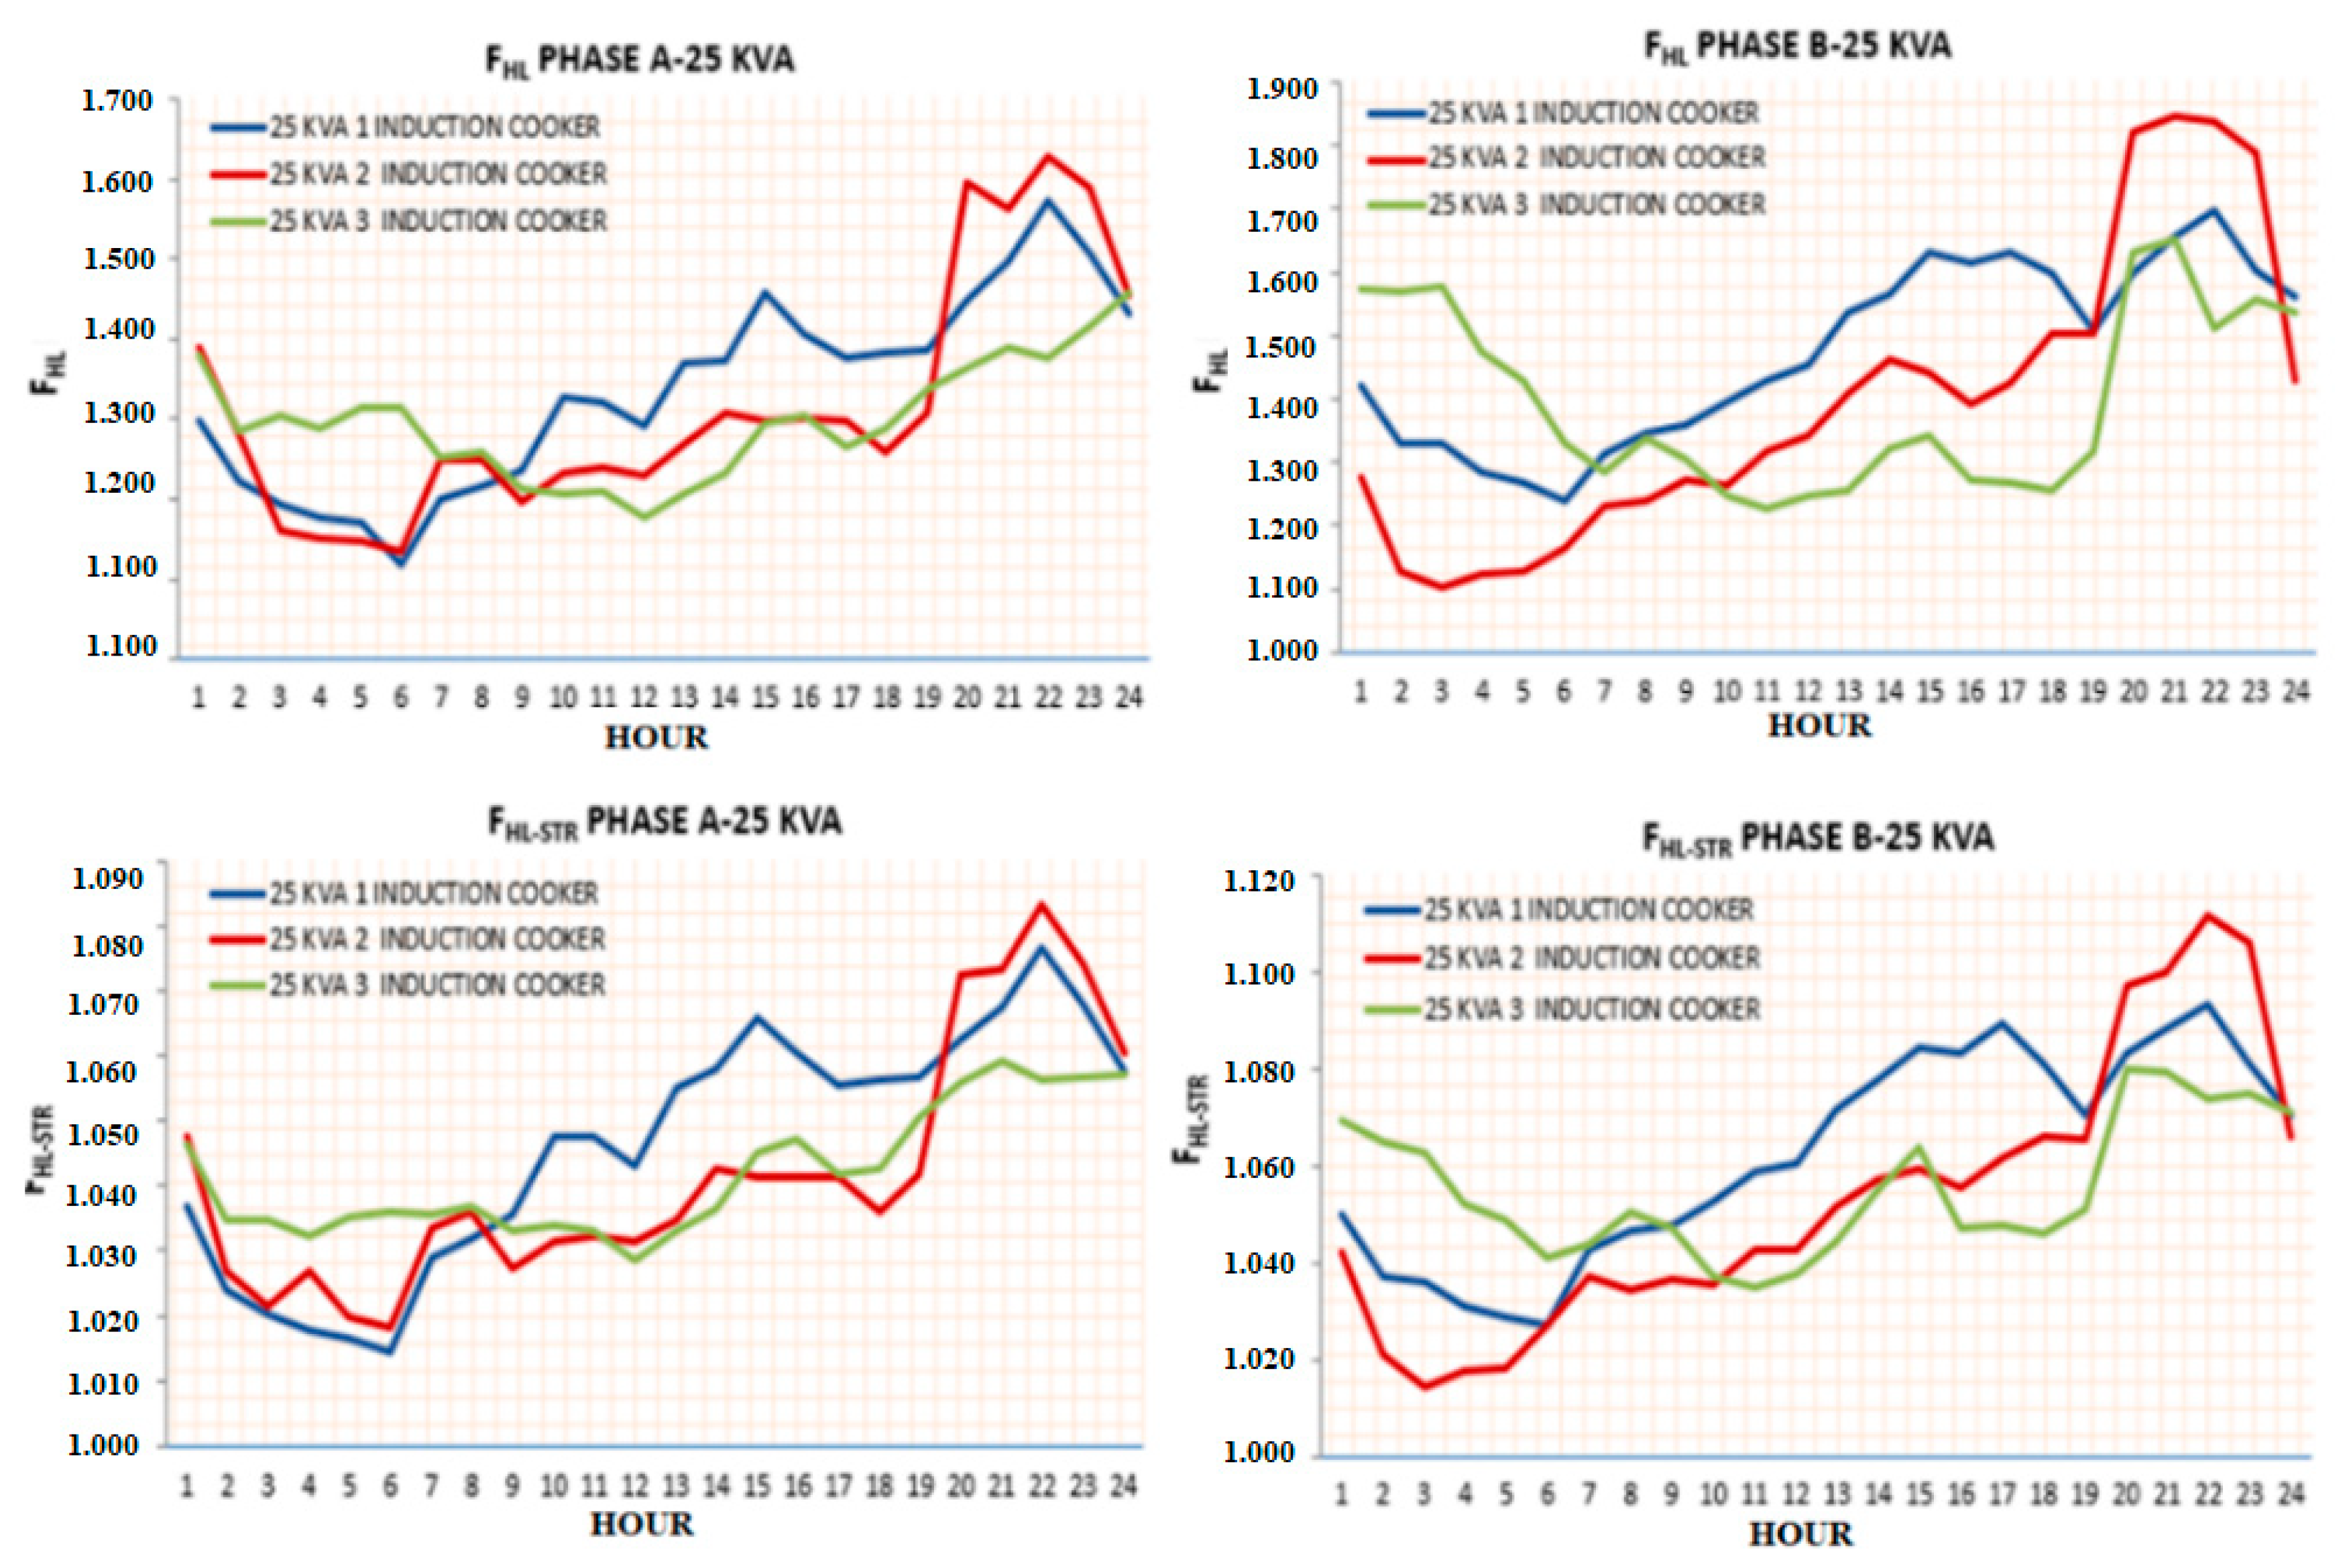
- The mean values of the stray loss factors FHLA, FHLB, FHL-STRA and FHL-STRB of phases A and B, and their confidence intervals calculated in step 5.
3.3. Transformer Heating Estimation in a Load Cycle
- Effective harmonics currents in phases A and B in the time interval i.
- Harmonic loss factors of phases A and B in the time interval i.
- N: is the number of previous time intervals considered.
3.4. Calculation of the 25 kVA Transformer Heating State with One Cooker in a Load Cycle
- Equivalent pre-peak load state = (0.276)0.5 p.u. = 0.525 p.u.
- Transformer peak load state = (0.3838)0.5 p.u. = 0.628 p.u.
- Confidence interval in the determination of the loading state of the transformer using Equation (2), at the peak equal to: 0.009 p.u.
4. Discussion of the Results
5. Conclusions
Author Contributions
Funding
Conflicts of Interest
References
- IEEE. C57.110-1998-IEEE Recommended Practice for Establishing Transformer Capability When Supplying Non-sinusoidal Load Currentsin; IEEE: Piscataway, NJ, USA, 1998. [Google Scholar] [CrossRef]
- Sadati, S.B.; Tahani, A.; Darvishi, B.; Dargahi, M.; Yousefi, H. Comparison of distribution transformer losses and capacity under linear and harmonic loads. In Proceedings of the 2008 IEEE 2nd International Power and Energy Conference, Johor Bahru, Malaysia, 1–3 December 2008; pp. 1265–1269. [Google Scholar] [CrossRef]
- IEEE. C57.110-1986-IEEE Recommended Practice for Establishing Transformer Capability When Supplying Nonsinusoidal Load Currents; IEEE: Piscataway, NJ, USA, 1998; pp. 1–16. [Google Scholar] [CrossRef]
- IEEE. C57.110-2008-IEEE Recommended Practice for Establishing Liquid-Immersed and Dry-Type Power and Distribution Transformer Capability When Supplying Nonsinusoidal Load Currents; IEEE: Piscataway, NJ, USA, 2008; pp. 1–68. [Google Scholar] [CrossRef]
- Delaiba, A.C.; de Oliveira, J.C.; Vilaca, A.L.A.; Cardoso, J.R. The effect of harmonics on power transformers loss of life. In Proceedings of the 38th Midwest Symposium on Circuits and Systems, Rio de Janeiro, Brazil, 13–16 August 1995; Volume 2, pp. 933–936. [Google Scholar] [CrossRef]
- Gómez-Sarduy, J.; Quispe, E.; Reyes-Calvo, R.; Sousa-Santos, V.; Viego-Felipe, P. Influencia de los armónicos de corriente sobre las pérdidas en los transformadores de distribución monofásicos con derivación central. El hombre y la Máquina 2014, 45, 33–43. [Google Scholar]
- Elmoudi, A.; Lehtonen, M.; Nordman, H. Effect of harmonics on transformers loss of life. In Proceedings of the 2006 IEEE International Symposium on Electrical Insulation, Toronto, ON, Canada, 11–14 June 2006; pp. 408–411. [Google Scholar] [CrossRef]
- Makarov, S.N.; Emanuel, A.E. Corrected harmonic loss factor for transformers supplying nonsinusoidal load currents. In Proceedings of the Ninth International Conference on Harmonics and Quality of Power. Proceedings (Cat. No.00EX441), Orlando, FL, USA, 1–4 October 2000; Volume 1, pp. 87–90. [Google Scholar] [CrossRef]
- Walpole, R.E. Probabilidad y Estadística Para Ingeniería y Ciencias, 9th ed.; TX: Naucalpan de Juárez, México, 2012; pp. 172–174. [Google Scholar]
- Said, D.M.; Nor, K.M. Effects of harmonics on distribution transformers. In Proceedings of the 2008 Australasian Universities Power Engineering Conference, Sydney, Australia, 14–17 December 2008; pp. 1–5. [Google Scholar]
- Abdelsamad, S.F.; Morsi, W.G.; Sidhu, T.S. Probabilistic Impact of Transportation Electrification on the Loss-of-Life of Distribution Transformers in the Presence of Rooftop Solar Photovoltaic. IEEE Trans. Sustain. Energy 2015, 6, 1565–1573. [Google Scholar] [CrossRef]
- Stahlhut, J.W.; Heydt, G.T.; Selover, N.J. A Preliminary Assessment of the Impact of Ambient Temperature Rise on Distribution Transformer Loss of Life. IEEE Trans. Power Deliv. 2008, 23, 2000–2007. [Google Scholar] [CrossRef]
- Henderson, R.D.; Rose, P.J. Harmonics: The effects on power quality and transformers. IEEE Trans. Ind. Appl. 1994, 30, 528–532. [Google Scholar] [CrossRef]
- Amoda, O.A.; Tylavsky, D.J.; McCulla, G.A.; Knuth, W.A. Acceptability of Three Transformer Hottest-Spot Temperature Models. IEEE Trans. Power Deliv. 2011, 27, 13–22. [Google Scholar] [CrossRef]
- Daghrah, M.; Wang, Z.D.; Liu, Q.; Walker, D.; Krause, C.; Wilson, G. Experimental investigation of hot spot factor for assessing hot spot temperature in transformers. In Proceedings of the 2016 International Conference on Condition Monitoring and Diagnosis (CMD), Xi’an, China, 25–28 September 2016; pp. 948–951. [Google Scholar] [CrossRef]
- Westinghouse. Electric Utility Engineering Reference Book Distribution Systems; Westinghouse: Pittsburgh, PA, USA, 1965; pp. 35–36. [Google Scholar]
- Gonen, T. Electric Power Distribution Engineering, 3rd ed.; CRC Press: Boca Raton, FL, USA, 2014; Volume 4, pp. 100–102. [Google Scholar]
- Murray, R.S.; Larry, J.S. Estadistica Shaum, 4th ed.; MC GRAW GRILL: Mexico City, Mexico, 2004; Volume 3, pp. 94–97. [Google Scholar]
- Massey, G.W. Estimation methods for power system harmonic effects on power distribution transformers. IEEE Trans. Ind. Appl. 1994, 30, 485–489. [Google Scholar] [CrossRef]
- Taheri, S.; Taheri, H.; Fofana, I.; Hemmatjou, H.; Gholami, A. Effect of power system harmonics on transformer loading capability and hot spot temperature. In Proceedings of the 2012 25th IEEE Canadian Conference on Electrical and Computer Engineering (CCECE), Montreal, QC, Canada, 29 April–2 May 2012; pp. 1–4. [Google Scholar] [CrossRef]
- El-Bataway, S.A.; Morsi, W.G. Distribution Transformer’s Loss of Life Considering Residential Prosumers Owning Solar Shingles, High-Power Fast Chargers and Second-Generation Battery Energy Storage. IEEE Trans. Ind. Inform. 2018, 15, 1287–1297. [Google Scholar] [CrossRef]
- Laborí, S.L. Sistemas Eléctricos de Distribución; Universidad Tecnológica de La Habana: Havana, Cuba, 2010; pp. 513–516. [Google Scholar]
- Najdenkoski, K.; Rafajlovski, G.; Dimcev, V. Thermal Aging of Distribution Transformers According to IEEE and IEC Standards. In Proceedings of the 2007 IEEE Power Engineering Society General Meeting, Tampa, FL, USA, 24–28 June 2007; pp. 1–5. [Google Scholar] [CrossRef]
- Dao, T.; Phung, B.T. Study of voltage harmonic effect on temperature rise in distribution transformer. In Proceedings of the 2016 IEEE International Conference on Power System Technology (POWERCON), Wollongong, Australia, 28 September–1 October 2016; pp. 1–5. [Google Scholar] [CrossRef]
- Dao, T.; Phung, B.T.; Blackburn, T. Effects of voltage harmonics on distribution transformer losses. In Proceedings of the 2015 IEEE PES Asia-Pacific Power and Energy Engineering Conference (APPEEC), Brisbane, Australia, 15–18 November 2015; pp. 1–5. [Google Scholar] [CrossRef]
- Awadallah, M.A.; Xu, T.; Venkatesh, B.; Singh, B.N. On the Effects of Solar Panels on Distribution Transformers. IEEE Trans. Power Deliv. 2015, 31, 1176–1185. [Google Scholar] [CrossRef]
- IEEE. C57.12.00-2010 IEEE Draft Standard for General Requirements for Liquid-Immersed Distribution, Power, and Regulating Transformers; IEEE: Piscataway, NJ, USA, 2015; pp. 1–71. [Google Scholar] [CrossRef]
- López, J.C.; Rider, M.J.; Wu, Q. Parsimonious Short-Term Load Forecasting for Optimal Operation Planning of Electrical Distribution Systems. IEEE Trans. Power Syst. 2019, 34, 1427–1437. [Google Scholar] [CrossRef]
- de Loja, M. Perspectivas del Medio Ambiente Urbano: GEO Loja; Programa de las Naciones Unidas para el Medio Programa de las Naciones Unidas para el Medio Ambientë, Loja, Ecuador: Loja, Ecuador, 2007. [Google Scholar]


| Transformers Capacity (kVA) | Transformers Quantity | Quantity of the New Type of Pollutant Load | ||||
|---|---|---|---|---|---|---|
| With 1 | With 2 | With 3 | With | With r | ||
| 1 | T1 | N11 | N12 | N13 | ... | N1r |
| k | TK | NK1 | NK2 | NK3 | … | NKr |
| Transformers Capacity (kVA) | Transformers Quantity | Amount of Pollutant Loads Associated with Each Transformer | ||||
|---|---|---|---|---|---|---|
| With 1 | With 2 | With 3 | With | More than 3 | ||
| 1 | TM1 | NM11 | NM12 | NM13 | … | NM14 |
| k | TMK | NMK1 | NMK2 | NMK3 | … | NMK4 |
| Transformers Capacity (kVA) | Transformers Quantity | Number of Cookers per Transformer | |||
|---|---|---|---|---|---|
| With 1 | With 2 | With 3 | More than 3 | ||
| 10 | 30 | 20 | 10 | 0 | 0 |
| 15 | 32 | 18 | 10 | 2 | 2 |
| 25 | 90 | 40 | 22 | 15 | 13 |
| 37.5 | 45 | 18 | 9 | 13 | 5 |
| Transformers Capacity (kVA) | Transformers Quantity | Number of Cookers per Transformer | |||
|---|---|---|---|---|---|
| With 1 | With 2 | With 3 | More than 3 | ||
| 10 | 20 | 15 | 5 | 0 | 0 |
| 15 | 20 | 11 | 5 | 2 | 2 |
| 25 | 78 | 34 | 16 | 15 | 13 |
| 37.5 | 34 | 14 | 5 | 10 | 5 |
| Nominal Loss Values For 25 kVA Transformers | ||||||
|---|---|---|---|---|---|---|
| Capacity (kVA) | PDC (W) | PEC-R (W) | POSL-R (W) | PLL-R (p.u.) | PEC-R (p.u.) | POSL-R (p.u.) |
| 25 | 272.153 | 5.559 | 11.287 | 1.062 | 0.0204 | 0.0415 |
| Allowable Peak Overloads to Select the Capacity of the Oil-Cooled Transformers, Equivalent Load in Percentage of the Nominal. | |||||||||
|---|---|---|---|---|---|---|---|---|---|
| Peak period | Previous load at: | ||||||||
| 50% | 70% | 90% | |||||||
| 20 °C | 30 °C | 40 °C | 20 °C | 30 °C | 40 °C | 20 °C | 30 °C | 40 °C | |
| 1 h | 1.73 | 1.58 | 1.41 | 1.65 | 1.49 | 1.32 | 1.55 | 1.39 | 1.20 |
| 2 h | 1.51 | 1.37 | 1.21 | 1.46 | 1.32 | 1.16 | 1.39 | 1.24 | 1.08 |
| 3 h | 1.39 | 1.31 | 1.13 | 1.35 | 1.22 | 1.10 | 1.29 | 1.17 | 1.03 |
© 2019 by the authors. Licensee MDPI, Basel, Switzerland. This article is an open access article distributed under the terms and conditions of the Creative Commons Attribution (CC BY) license (http://creativecommons.org/licenses/by/4.0/).
Share and Cite
Carrión González, J.E.; Martínez García, A.; del Castillo Serpa, A.; Carrión González, M.d.C.; Merino Vivanco, R.P.; Alulima Carrión, K.A. Procedure to Evaluate the Impact in Distribution Single Phase Transformers Due to Insertion of New Nonlinear Load Which Changes Daily Demand Graphs. Energies 2019, 12, 3923. https://doi.org/10.3390/en12203923
Carrión González JE, Martínez García A, del Castillo Serpa A, Carrión González MdC, Merino Vivanco RP, Alulima Carrión KA. Procedure to Evaluate the Impact in Distribution Single Phase Transformers Due to Insertion of New Nonlinear Load Which Changes Daily Demand Graphs. Energies. 2019; 12(20):3923. https://doi.org/10.3390/en12203923
Chicago/Turabian StyleCarrión González, Jorge Enrique, Antonio Martínez García, Alfredo del Castillo Serpa, Marianela del Cisne Carrión González, Rodolfo Pabel Merino Vivanco, and Kelvin Armando Alulima Carrión. 2019. "Procedure to Evaluate the Impact in Distribution Single Phase Transformers Due to Insertion of New Nonlinear Load Which Changes Daily Demand Graphs" Energies 12, no. 20: 3923. https://doi.org/10.3390/en12203923
APA StyleCarrión González, J. E., Martínez García, A., del Castillo Serpa, A., Carrión González, M. d. C., Merino Vivanco, R. P., & Alulima Carrión, K. A. (2019). Procedure to Evaluate the Impact in Distribution Single Phase Transformers Due to Insertion of New Nonlinear Load Which Changes Daily Demand Graphs. Energies, 12(20), 3923. https://doi.org/10.3390/en12203923