Abstract
The evolution of modern power distribution systems into smart grids requires the development of dedicated state estimation (SE) algorithms for real-time identification of the overall system state variables. This paper proposes a strategy to evaluate the minimum number and best position of power injection meters in radial distribution systems for SE purposes. Measurement points are identified with the aim of reducing uncertainty in branch power flow estimations. An incremental heuristic meter placement (IHMP) approach is proposed to select the locations and total number of power measurements. The meter placement procedure was implemented for a backward/forward load flow algorithm proposed by the authors, which allows the evaluation of medium-voltage power flows starting from low-voltage load measurements. This allows the reduction of the overall costs of measurement equipment and setup. The IHMP method was tested in the real 25-bus medium-voltage (MV) radial distribution network of the Island of Ustica (Mediterranean Sea). The proposed method is useful both for finding the best measurement configuration in a new distribution network and also for implementing an incremental enhancement of an existing measurement configuration, reaching a good tradeoff between instrumentation costs and measurement uncertainty.
1. Introduction
Modern power distribution grids are undergoing fundamental changes to their structure, thanks to the integration of distributed generators (DGs) and energy storages (DESs) from renewable energy sources, as well as the development of suitable communication systems and smart metering devices and infrastructures, all fostered by the political support of various countries and related standard requirements [1,2,3,4,5,6,7]. The transformation of traditional passive distribution networks into active grids (with bi-directional power flows and dynamic changes in grid operating conditions) requires the development of dedicated state estimation (SE) algorithms for real-time identification of the overall system state variables.
Traditionally, SE techniques make use of few actual measurements of medium-voltage (MV) branch voltages or current/power flows for collecting the input data of SE algorithms. The determination of the best possible combination of meters for distribution system monitoring is referred to as the optimal meter placement (MP) [8,9,10,11,12,13,14]. For the measurement of the SE input data, different kinds of measurement equipment can be used, i.e., phasor measurement units (PMUs), smart meters (SMs), power quality analyzers (PQAs) and so on, with different accuracy features and costs [15,16]. Missing data are integrated with pseudo-measurements, exploiting historical information or an a priori estimate of the relative power magnitude of each load [17,18,19,20]. Since pseudo-measurements are load estimates with high variance, the quality of the estimated state variables is dependent on the number of pseudo-measurements. If the SE errors are too high and do not ensure a reliable network control, additional real measurements are required. To this end, distribution system operators (DSOs) are required to choose the proper location, type and number of voltage or power measurements in the distribution network, in order to ensure suitable SE accuracy [21,22].
In theory, whenever an existing state estimator is upgraded or a new one is implemented, the best solution would be the redesign of the MP scheme for the whole network. However, in practical cases where an energy management system (EMS) and related measurement infrastructure are already implemented, this procedure is unfeasible (for economic reasons), and a reasonable solution is to implement an incremental enhancement of the existing measurement configuration. From this viewpoint, DSOs may be more interested in knowing how to improve their existing measurement infrastructure rather than in re-designing a new one. For this purpose, a meter placement method able to determine the proper locations of power measurements (PMs) can be very useful.
In this context, this paper proposes an IHMP method for placing PMs in radial distribution systems, for SE purposes. The proposed method focuses on branch power flows and uses a heuristic approach to select potential points for the location of bus PMs. The measurement points are identified with the aim of reducing uncertainty in branch power flow estimations, calculated using a Monte Carlo approach applied to a backward/forward (B/F) algorithm. Even though the technique does not explicitly optimize any objective function, the concept of an incremental approach is helpful in many practical situations. In particular, this technique is suitable in those cases where an EMS is already implemented and an enhancement of the measurement configuration is required.
The IHMP procedure was implemented and tested for a B/F load flow algorithm proposed by the authors, which allows the evaluation of MV power flows starting from low-voltage (LV) load measurements [23]. The integration of the proposed IHMP method with this load flow solution allows for an improvement in power flow estimation accuracy to be obtained, with limited costs for additional PMs. In fact, the proposed solution can be developed by using a low-cost measurement infrastructure that exploits PMs at LV level instead of those at MV level (as typically used in many literature MP and SE solutions). The IHMP method was tested in a real 25-bus MV radial distribution network. To validate the IHMP method’s effectiveness, it is compared to that used in [24]; differently from [24], where the MP strategy was developed to minimize the uncertainty in power flow estimations at MV slack bus, the IHMP method aims at reducing the mean value of uncertainty in all MV branches by properly adding new PMs to existing ones. The obtained results show that the IHMP approach allows a significant reduction of uncertainties in most of the MV branches. Thus, the new contribution of this paper is the combined use of a recursive technique for meter placement based on uncertainty analysis and a new measurement approach for medium-voltage power flows starting from low-voltage load measurements. In this way, a good tradeoff between low cost and accuracy is reached, both when choosing a measurement configuration for a new distribution network and when implementing an incremental enhancement of an already existing measurement configuration. In fact, the LV measurement approach for MV power flow evaluation allows a reduction in cost because PMs are installed at the low-voltage side of the power transformer, while the IHMP technique allows suitable PM placement in order to obtain the target estimation accuracy. The proposed technique has the further positive feature of being based on a recursive procedure, using the Monte Carlo approach applied to the B/F load flow algorithm, which is itself also a recursive algorithm. With respect to more complicated algorithms based on genetic algorithms (GA) or particle swarm optimization (PSO), in fact, recursive algorithms have the great advantage of also being implementable in software with limited available libraries, such as those of Scada control centers.
The paper is organized as follows: Section 2 provides a state-of-the art overview of measurement systems and MP techniques for distribution grids. The IHMP method is described in Section 3, where a flow chart of the proposed algorithm is also provided. Section 4 presents the test results, which were obtained under the real test conditions of the MV radial distribution network of the Island of Ustica (where the measurement infrastructure for LV load power collection was implemented). Finally, Section 5 reports the conclusions of the work.
2. Meter Placement Techniques and Measurement Systems for Distribution Grids
Optimal meter placement is a topic of current research interest due to the large extension of distribution grids over the territory and the potential economic impact of smart grid applications and related needs for measurement infrastructures. Thus, several works can be found in the literature approaching the problem of determining the best MP configuration for a given power network. The problem has been addressed in literature, proposing different specific targets including system observability, installation/maintenance cost minimization, poor data detection capability, and SE accuracy [8,9,10,11]. To solve the issue, different optimization algorithms have been proposed, such as genetic algorithms (GA), particle swarm optimization (PSO) or heuristic techniques. As an example, in [12], a heuristic technique is proposed that identifies nodes in which to place a given number of voltage measurements, by reducing the standard deviation of voltages at nodes where measurements are not available. The main focus of [13], instead, is on reducing the uncertainties in specific critical points of the network, thus applying an incremental method to obtain the desired accuracy. In [14] the authors propose a two-stage PMU placement method: the first one is required to make the power system topologically observable, and the second one is proposed to check if the resulted placement leads to a full ranked measurement Jacobian. In [15], the attention is focused on current and power flow measurements and their impacts on branch current estimation accuracy. Further MP approaches are surveyed in [21,22].
As a general consideration, most of these studies are focused on the use of two types of measurements, i.e., bus voltage magnitude measurements and branch power flow measurements. The suggested measurement instruments are PMUs installed in MV nodes or power meters installed in MV branches. As regards this, it is known that the use of a high number of PMUs is not economically reasonable, even if such meters can allow the obtainment of higher accuracies. Thus, a common issue of most proposed methods is to achieve the goal of minimizing the total cost of the metering infrastructure on one hand and maximizing the estimation accuracy on the other. Typically, these two features conflict with each other: to obtain the lowest uncertainties at a measurement point, the best solution would be to use high-accuracy measurement instruments (typically PMUs) installed at MV level, thus coping with the costs of measurement instruments, MV transducers, and related installation costs. Thus, many distributed measurement system solutions proposed for MV power grids usually involve few MV metering points, whose information is integrated with that obtained by estimation algorithms [17,18,19,20]. This allows the reduction of total costs, but entails some drawbacks especially in terms of accuracy in the estimated quantities and also algorithm complexity.
In literature, some alternative solutions have been developed with the aim of reducing the total measurement infrastructure costs. For example, in [16], in order to find a good tradeoff between measurement equipment costs and SE accuracy, a hybrid solution is proposed based on the use of different kinds of meters. In [25], the use of LV smart meter measurements is also considered, in order to save the costs of additional MV measurement system installation. This approach is based on the assumption that real-time measurements of voltage and power are available in smart meters. On the other hand, this could be possible in a future generation of smart meters and related communication infrastructures, while already installed smart meters, used for billing purposes in many countries, typically provide only average measurements (usually over 15 min), which are collected with low updating frequency (usually once a day).
The authors also faced the issue of reducing the measurement infrastructure costs proposed in [23], a new measurement approach to perform load flow analysis in an MV network. The proposed distributed measurement system infrastructure is schematically represented in Figure 1.
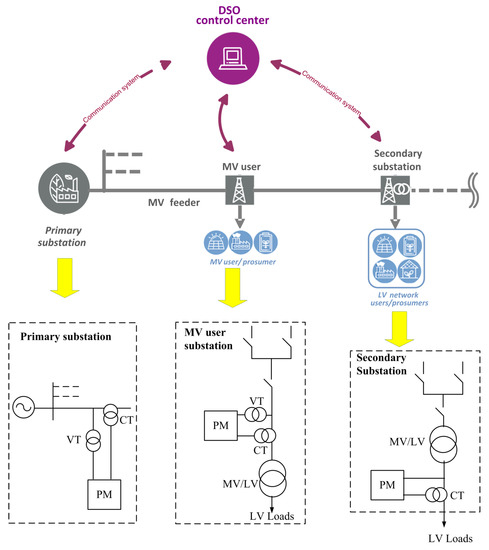
Figure 1.
Measurement system architecture for medium-voltage (MV) network monitoring based on both MV and low-voltage (LV) load power measurements.
The proposed solution entails the use of PMs in both primary and secondary substations. In a primary substation, the PM measures the voltage of the slack bus and the total power drained by the MV feeder. Meanwhile, in the case of DSO and MV users, PMs measure the total load drained by the substation. In the case of primary and MV user substations, PMs are installed at MV level, using MV voltage and current transducers, (VT and CT, respectively). Meanwhile, in the case of a DSO’s secondary substations, PMs are installed at LV level by using only LV current transducers. In this way, a reduction in installation costs is obtained because no MV transducers or related MV switchboard modifications are needed; moreover, current transducers for LV are less expensive than those for MV, and only a small number of customers would suffer an energy break, i.e., only those supplied by the secondary substation where the PM is installed, thus reducing the related DSO economic losses. Furthermore, PMs can also be already available in many secondary substations because they are usually installed by DSOs to discover eventual energy theft in LV networks. A backward/forward (B/F) algorithm is used to obtain the load flow in the MV network starting from these measurements. The algorithm takes into account the MV/LV power transformer losses, calculated starting from the measured load power and the power transformer rated data (i.e., short circuit and open circuit losses) [23]. Moreover, the algorithm also considers the line losses and voltage drops calculated starting from the rated data of MV lines. The load flow algorithm is implemented in the DSO control center. To collect the field measurement data, communication must be ensured between the DSO control center and the measurement points. In literature, different solutions are suggested to support smart grid applications, such as wireless, power line communications (PLC) or hybrid solutions, which can be also combined in an Internet of Things (IoT) platform [26,27,28,29,30,31,32,33]. On the other hand, currently, in MV networks DSOs deploy communication infrastructures only for automatic meter reading (AMR) and MV grid protection and supply restoration. The AMR server is usually installed in the DSO control center; it queries, via GSM (Global System for Mobile communications) or GPRS (General Packet Radio Service), the AMR concentrators of secondary substations. These AMR concentrators communicate via power line communications (PLC) to LV user smart meters. A supervisory system is also installed in the DSO control center for MV grid protection; it can control MV motorized switches, via GSM or GPRS, for fault isolation, protection or supply restoration purposes. In this framework, the idea of installing PMs at secondary substations perfectly fits with the described communication infrastructures, which can guarantee the real-time availability of measured data. In fact, PMs could be connected to the same communication system of AMR and MV networks and supply restoration systems, i.e., using installed GSM or GPRS systems. Moreover, this measurement infrastructure is also in line with the future implementation of faster communication links based on optic fibers, 5G or other wireless infrastructure. A similar solution is also adopted in the case study of the Ustica network, where a HiperLAN network was installed to connect the control center to the PMs of each secondary substation. More details on the infrastructure installed in the Ustica MV/LV network can be found in [4].
In light of the aforesaid considerations, the IHMP technique described in the next section, in conjunction with the abovementioned measurements and communication approach, can help to improve measurement uncertainty by suitably placing additional PMs in an existing measurement infrastructure, without entailing a high increase in the cost of measurement equipment. In fact, instead of using measurements at an MV level of voltage or current/power flow, the proposed measurement system suggests adding load power meters at the LV side of secondary substations, and the IHMP strategy allows the determination of where to locate these additional meters in order to guarantee the target uncertainty in estimated power flows all over the network.
3. Proposed Incremental Placement Technique
The purpose of the proposed IHMP technique is to determine the best location for PMs, exploiting a heuristic approach. Compared to the methods proposed in literature, the proposed approach is focused on branch power flows rather than nodal voltages. The measurement points are identified with the aim of reducing uncertainty in branch power flow estimations all over the network. The technique assumes that PMs are only located in certain nodes. In the remaining MV nodes, the load powers are estimated as pseudo-measurements. For sake of clarity, the method is firstly explained in a simple radial feeder, as shown in Figure 2. Meanwhile, its effectiveness in a real network application is shown in the next section.
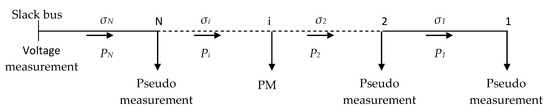
Figure 2.
Simple radial feeder.
The meter placement method starts by locating only one PM at the generic node i, whereas for the remaining MV nodes, pseudo-measurements are assumed. The uncertainties in all the branch power flows are obtained by applying a Monte Carlo procedure [34]: the load flow calculations are repeated 10,000 times, randomly changing the load powers at each node inside their Gaussian uncertainty distribution. In the nodes with PMs, the standard deviation of the distributions is that of the measurement instrument and the related transducers; meanwhile, in the nodes where pseudo-measurements are used, it is that of the estimation algorithm. At the end of the Monte Carlo procedure, the standard deviation of each branch power flow (σj) is estimated. By considering a cover factor of 3, which corresponds to a confidence level of 99.73%, the expanded uncertainty of the branch power flows can be obtained as:
where N is the total number of branches of the feeder.
In order to assess to what extent branch power flow uncertainties vary when different locations of PMs are considered, the following index, Fi (named the sensitivity index), is introduced:
where variable i indicates the node where the meter is positioned, while variable j indicates the branch of the network. Starting from a given PM configuration (in terms of number and location of PMs), the sensitivity index Fi gives an indication of the branch power flow uncertainties all over the network when an additional meter is located at the node i. Changing the node where the additional meter is placed, a different value of the index is obtained. Thus, the index allows the evaluation of the location of the meter that provides the lowest value of overall uncertainty.
A recursive procedure is then performed, by moving the meter in all the MV nodes, to identify the best position to locate the PM, i.e., the position that minimizes the sensitivity index, Fi. Once the first meter is placed, it is no longer moved. The algorithm continues looking for the position of a further meter. The sensitivity indexes are thus recalculated in the presence of the two meters: the first one is maintained fixed at the selected best location, and the second one is moved to the remaining nodes. At the end of the iteration procedure, the second meter is definitively located at the MV node that minimizes the sensitivity index. The procedure is thus repeated, locating other meters until an adequate accuracy level is achieved in all the branch power flows, i.e., when their uncertainties fall below a prefixed threshold. A flowchart of the proposed placement algorithm is shown in Figure 3. Firstly, a meter is added at node 1, whereas pseudo-measurements are assumed at the remaining MV nodes. The Monte Carlo procedure is applied to the load flow algorithm to evaluate the uncertainty of all branch power flows and thus to calculate the sensitivity index according to (2). This index is stored in memory. Then, the meter is removed from node 1 and relocated to node 2, and the Monte Carlo procedure is repeated to obtain the sensitivity index in this second case. This procedure is repeated iteratively, removing the meter from node i and moving it to the following node i+1, until the end of the line is reached. The memorized sensitivity indexes are then compared, and the meter is definitively located in the node correspondent to the minimum sensitivity index. This procedure is again repeated, adding further meters and finding the best position in terms of the minimum sensitivity index at each iteration. The procedure is stopped when the power flow uncertainties are found to be below a chosen threshold in all the branches.
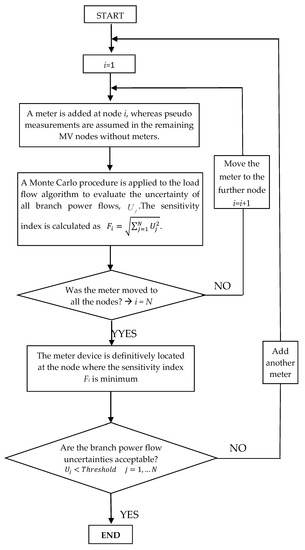
Figure 3.
Flowchart of the proposed incremental placement algorithm.
4. Real Case Study Network and Simulation Results
The proposed meter placement algorithm was implemented and tested in the 25-bus MV radial distribution network of the Island of Ustica. The circuit diagram of the Ustica MV network is shown in Figure 4. The MV distribution network is composed of two radial feeders departing from a diesel power plant. The upper feeder, named Vittorio Emanuele feeder, supplies 13 secondary substations; the lower feeder, named AUSL feeder, supplies 11 substations. In the figure, for each MV branch (indicated with capital letters), the type (cable or overhead), the conductor core section and the total length are reported.
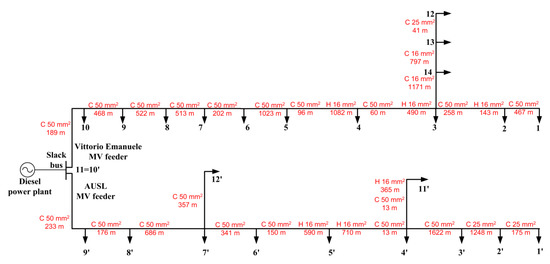
Figure 4.
Circuit diagram of the Ustica MV network: the type (C = cable, H = overhead), the core section and the length are reported for each MV line.
The B/F load flow algorithm was implemented for the Ustica MV network. The MV bus-bars of the diesel power plant were chosen as slack bus for the load flow algorithm. The algorithm receives the following data as input variables:
- -
- the load powers measured by the PMs;
- -
- the load power estimations, derived from pseudo-measurements;
- -
- the voltage at the slack bus;
- -
- the line characteristics and the MV/LV power transformer parameters.
The B/F load flow algorithm is based on a recursive procedure: starting from the measured load powers, the algorithm iteratively updates branch power flows and node voltages using backward and forward sweeps on the network, respectively. The iterations are repeated until the convergence condition is found at slack bus, i.e., the difference between the calculated and measured voltages at the slack bus is below a certain threshold. This threshold was fixed according to the accuracy of the installed measurement system. More details on the B/F load flow algorithm can be found in [23].
In the bus where PMs are located, the load power measurements are affected by the uncertainty of the measurement system.
In MV users’ secondary substations, the PM is usually installed at the MV side of power transformers, for billing purposes. In this case, the uncertainty of the PM is a composition of the PM and the related MV voltage and current transducer uncertainty, and thus it can be expressed as [18]:
where is the phase shift between voltage and current, is the PM uncertainty in active power measurement, and are the ratio errors, and and are the phase displacements of the current and voltage transducers, respectively.
On the other hand, as explained in Section 2, in the DSO’s secondary substation, the PM is installed at the LV side of power transformers. In this case, the PM uncertainty can be obtained from (3) without considering the terms related to VT errors.
To validate the proposed IHMP method, in the simulation study it was compared to that used in [24], showing how the new approach allows the reduction of uncertainties obtained in most of the branches. To perform the aforesaid comparison, the same reference load condition was used, which corresponds to the load power injection values shown in Table 1. This load condition is representative of the highest power flows measured in the summer period. In Table 1, the uncertainties are also reported for each node. They were calculated assuming 0.5 class instruments and transducers and also considering that CT errors are dependent on the current values and phase shift. In more detail, it is known that CT errors depend on the load currents. For example, for 0.5 class CTs, standard [35] fixes the maximum allowable ratio error and maximum phase displacement at rated current. For current equal to 20% of the rated current, such error limits increase to and . When currents are between 20% and 100% of the rated values, error limits are the linear interpolation between the two aforesaid limits. Thus, starting from the measured current and the rated value of the CT installed in each node, and are obtained and then PM uncertainties are calculated by using (3). More details on this procedure are reported in [36,37]. In the node without PM, a pseudo-measurement with an uncertainty of 100% is assumed in analogy of [24].

Table 1.
Summer reference load condition.
Table 2 and Table 3 show the values of the sensitivity indexes when the PM is moved between nodes, for the Vittorio Emanuele and the AUSL feeders, respectively. The sensitivity indexes refer to the total power of the feeder, which is 650.0 kW for the Vittorio Emanuele and 461.0 kW for the AUSL feeder. Table 2 shows that for the Vittorio Emanuele feeder, the sensitivity index has the lowest value when the first PM is located at node 7 (Fi% = 46.3%), the second PM at node 13 (Fi% = 40.5%), and so on (see values marked in bold). As regards the AUSL feeder, Table 3 shows that the first PM should be located at node 2’, where the sensitivity index is 54.4%, the second at node 8’, and so on (see values marked in bold).
Table 2.
Sensitivity index as a percentage of the total power of the Vittorio Emanuele feeder when the power measurements (PMs) are moved between nodes.
Table 3.
Sensitivity index as a percentage of the total power of the AUSL feeder when the PMs are moved between nodes.
The uncertainties in the branch power flow estimations are shown in Figure 5 and Figure 6 for the Vittorio Emanuele and AUSL feeders, respectively. The uncertainties are expressed as a percentage of the total power of the feeder. Each uncertainty curve corresponds to a given number and position of PMs. These PMs were located, one by one, in the MV nodes that ensure the minimum value of the sensitivity index. The graphs show that power flow uncertainties lower than 10% (desired accuracy level) can be obtained in all the branches by positioning PMs at only half of the nodes of each feeder.
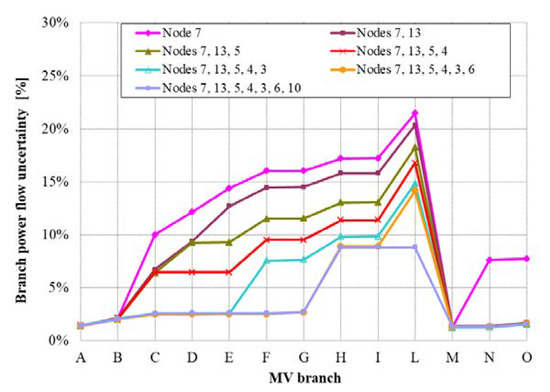
Figure 5.
Branch power flow uncertainties (referring to the total power of the Vittorio Emanuele feeder) obtained when the number and position of PMs are changed.
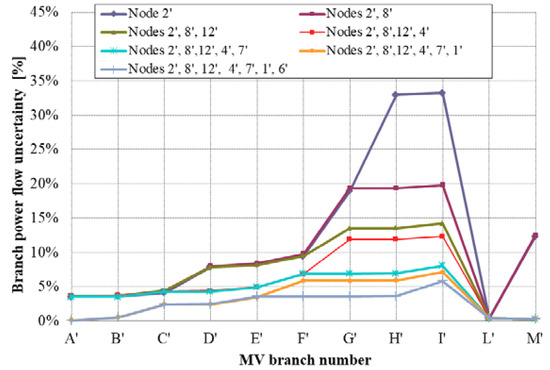
Figure 6.
Branch power flow uncertainties (referring to the total power of the AUSL feeder) obtained when the number and position of PMs are changed.
Further simulations were performed to compare the branch power flow uncertainties obtained with the proposed method with those obtained by using the approach of [24]. The uncertainties obtained with the two methods are compared in Figure 7 and Figure 8, in the case of seven PMs installed for each feeder. As can be seen, the power flux uncertainties obtained with the two methods are different. This is due to the different node selection for meter installations, which for the Vittorio Emanuele feeder is nodes 7, 13, 5, 4, 3, 6, and 10 for the proposed method and nodes 7, 10, 6, 8, 5, 4, and 3 for the second method, and for the AUSL feeder is nodes 2’, 8’, 12’, 4’, 7’, 1’, and 6’ for the proposed method and 8’, 2’, 12’, 7’, 6’, 9’, and 4’ for the second method. It should be noted that the two methods produce a different selection in both the chosen nodes and their order. With the proposed method, the medium value of uncertainty is lower than in the second method. On the other hand, the second method is optimized at the beginning of the feeder, thus a lower uncertainty is obtained in those branches. It should be noted that a very low difference is obtained at the beginning of the feeder with the second method, while a more significant reduction is obtained in the other branches with the proposed method.
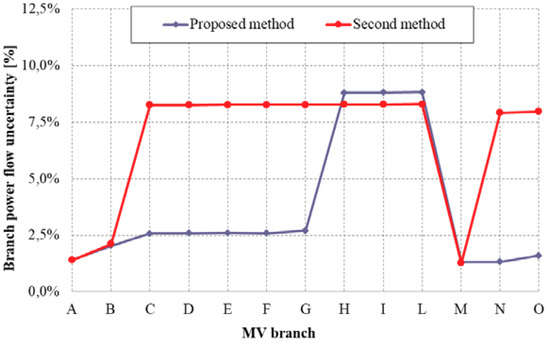
Figure 7.
Branch power flow uncertainty with seven PMs located in the Vittorio Emanuele feeder: comparison with a second placement method.
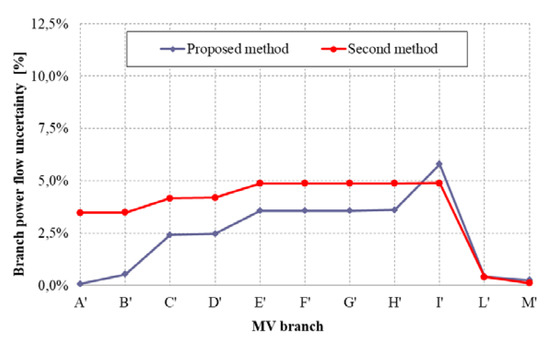
Figure 8.
Branch power flow uncertainty with seven PMs located in the AUSL feeder: comparison with a second placement method.
Using the same PM configuration, the branch power flow uncertainties were evaluated in a further load condition, registered on 1 November at 12:30 (see Table 4). This load condition was chosen since it is representative of the lowest power flows observed in the Ustica MV network (in the winter period). The obtained uncertainties are shown in Figure 9 and Figure 10. They are compared to those obtained in the summer load condition. As can be seen, the power flow uncertainty is lower than the desired accuracy level in all the branches, meaning that the proposed meter placement procedure ensures an adequate power flow uncertainty level for different load conditions.
Table 4.
Winter reference load condition.
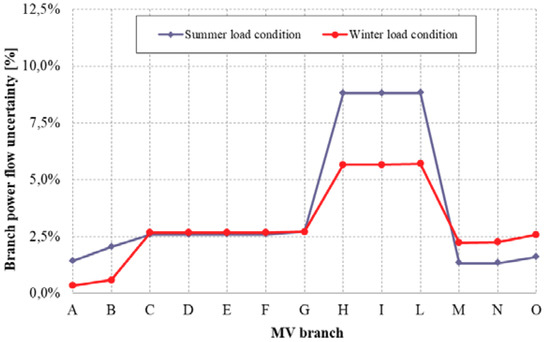
Figure 9.
Branch power flow uncertainty with seven PMs located in the Vittorio Emanuele feeder: comparison between summer and winter load conditions.
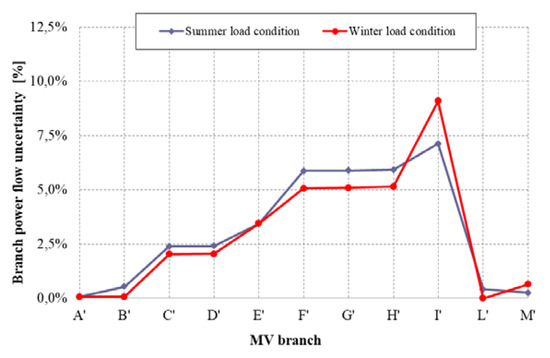
Figure 10.
Branch power flow uncertainty with six PMs located in the AUSL feeder: comparison between summer and winter load conditions.
5. Discussion
The proposed method, minimizing the sensitivity index, allows there to be a minimal mean value of uncertainty all over the network. To verify that the obtained solutions are optimal, some further tests were performed to investigate if, starting from a given configuration (which ensures an uncertainty value lower than the desired threshold), one of the placed meters could be removed and still have the condition satisfied. For example in the following, the results related to one of the test cases of the Vittorio Emanuele feeder are presented, i.e., the metering condition of the seventh iteration, which allowed the satisfaction of the 10% threshold in all the branches. Starting from this metering condition, a meter was removed from one of the seven nodes and the Monte Carlo procedure was performed again to calculate the power flow uncertainties and the sensitivity index. This was done for all seven nodes. The branch power flow uncertainties obtained in these tests are shown in Figure 11. As can be seen, none of the selected cases with six meters satisfy the 10% condition, thus confirming the need for a seventh meter as requested by the proposed method. Moreover, the indexes found for each removed node are reported in Table 5. As can be seen, none of the tested cases allows the obtainment of a sensitivity index lower than that found with the proposed solution at the sixth iteration, thus confirming the optimality of the solution.
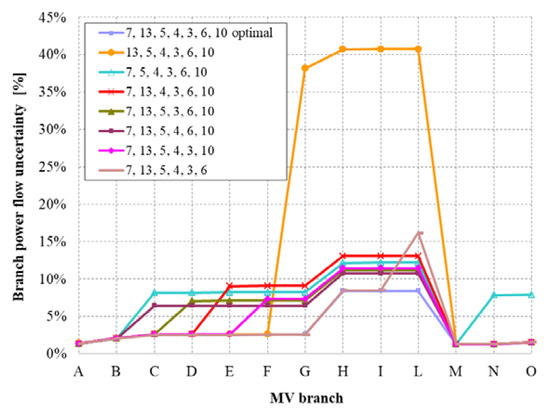
Figure 11.
Branch power flow uncertainties obtained when one PM is removed from the seven-meter optimal condition found for the Vittorio Emanuele feeder.
Table 5.
Sensitivity index when one PM is removed from the seven-meter optimal condition found for the Vittorio Emanuele feeder.
A further test was performed to verify the optimality of the proposed solution. Performing an extra iteration of the method (the eighth), a further meter would be added to node 8, as demonstrated by Table 2. Thus, the further tests consisted in adding the meter to the eighth node and removing one meter from the nodes by the seventh iteration. The branch power flow uncertainties obtained in these tests are shown in Figure 12. As can be seen, some of the selected cases with seven meters satisfy the 10% threshold but none of them has a lower mean value of uncertainty in the whole network than that found for the optimal seven-meter solution. This is demonstrated by the Fi index found for each case, reported in Table 6. As can be seen, none of the cases allows the obtainment of a lower value of the Fi index with respect to that found for the seventh iteration, thus confirming the optimality of the solution.
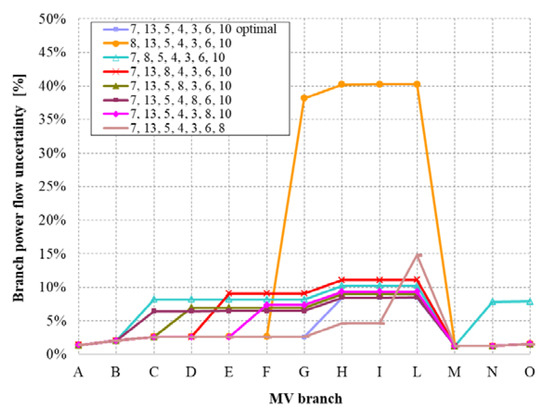
Figure 12.
Branch power flow uncertainties obtained when one PM is added to node 8 and one PM is removed from the seven-meter optimal condition found for the Vittorio Emanuele feeder.
Table 6.
Sensitivity index when one PM is added to node 8 and one PM is removed from the seven-meter optimal condition found for the Vittorio Emanuele feeder.
6. Conclusions
This paper proposes a new IHMP method to locate PMs for SE purposes in radial distribution systems. In more detail, the proposed approach is focused on branch power flow estimation, and it allows the determination of the minimum number and best position of load power meters in order to achieve a target accuracy in the branch power flow estimation. The proposed measurement technique assumes that power meters are located in a limited number of nodes, whereas in the remaining grid nodes the load powers are estimated as pseudo-measurements, with a given uncertainty. A sensitivity index is defined, which takes into account the branch power flow uncertainty all over the network; this ensures that, at any branch, the power flow is evaluated with an uncertainty value below a prefixed threshold.
The IHMP procedure was implemented for a backward/forward load flow algorithm proposed by the authors, which allows the evaluation of MV branch power flows starting from LV load power measurements. The integration of the proposed IHMP method with this load flow solution allows the obtainment of an improvement in power flow estimation accuracy, with limited costs for PMs. In fact, the proposed solution can be developed by using a low-cost measurement infrastructure that exploits PMs at LV level instead of those at MV level. The proposed method was implemented and tested in real case of the MV radial distribution network of the Island of Ustica, under different load conditions. The obtained results confirm that the method is useful to find the measurement configuration that guarantees a low uncertainty all over the network. In the case under study, the proposed meter placement procedure ensures an adequate power flow uncertainty level when PMs are installed in about half of the grid nodes.
The proposed IHMP technique is incremental, thus it allows not only for the best measurement configuration to be found in a new distribution network, but also allows the determination of how to obtain an enhancement of an existing measurement configuration. Both applications can be of practical interest for DSOs, as they may be interested in either installing a new measurement infrastructure or enhancing an already owned one. In both cases, the possibility of using measurements at LV level can increase the cost-effectiveness of the measurement infrastructure. In fact, thanks to the use of LV measurements instead of MV ones and the use of the proposed IHMP method, a good tradeoff can be reached between low cost and accuracy: the cost is reduced because of the choice to install PMs at the low-voltage side of the power transformer, while the IHMP technique allows suitable PM placement in order to obtain the target estimation accuracy.
Author Contributions
Conceptualization, A.C., V.C., D.D.C. and G.T.; Data curation, G.A., S.G., N.P. and E.T.; Investigation, A.C., V.C., D.D.C. and G.T.; Methodology, G.A., A.C., V.C., D.D.C., S.G., N.P., E.T. and G.T.; Software, G.A., S.G., N.P. and E.T.; Supervision, A.C., V.C., D.D.C. and G.T.; Validation, G.A., A.C., V.C., D.D.C., S.G., N.P., E.T. and G.T.; Writing—original draft, G.A., S.G., N.P. and E.T.; Writing—review & editing, A.C., V.C., D.D.C. and G.T.
Funding
This research received no external funding
Acknowledgments
The authors wish to thank the local DSO of Ustica (Impresa Elettrica D’Anna e Bonaccorsi S.R.L.) for their support and the collected network parameters and measurement data.
Conflicts of Interest
The authors declare no conflict of interest.
References
- De Villena, M.M.; Fonteneau, R.; Gautier, A.; Ernst, D. Evaluating the evolution of distribution networks under different regulatory frameworks with multi-agent modelling. Energies 2019, 12, 7. [Google Scholar] [CrossRef]
- TT Tran, Q.; Luisa Di Silvestre, M.; Riva Sanseverino, E.; Zizzo, G.; Pham, T.N. Driven Primary Regulation for Minimum Power Losses Operation in Islanded Microgrids. Energies 2018, 11, 2890. [Google Scholar] [CrossRef]
- Osório, G.J.; Shafie-khah, M.; Coimbra, P.D.L.; Lotfi, M.; Catalão, J.P.S. Distribution System Operation with Electric Vehicle Charging Schedules and Renewable Energy Resources. Energies 2018, 11, 3117. [Google Scholar] [CrossRef]
- Artale, G.; Cataliotti, A.; Cosentino, V.; Di Cara, D.; Guaiana, S.; Panzavecchia, N.; Tinè, G. Real Time Power Flow Monitoring and Control System for Microgrids Integration in Islanded Scenarios. IEEE Trans. Ind. Appl. 2019. [Google Scholar] [CrossRef]
- Christoforidis, C.G.; Panapakidis, P.I.; Papadopoulos, A.T.; Papagiannis, K.G.; Koumparou, I.; Hadjipanayi, M.; Georghiou, E.G. A Model for the Assessment of Different Net-Metering Policies. Energies 2016, 9, 262. [Google Scholar] [CrossRef]
- Crotti, G.; Delle Femine, A.; Gallo, D.; Giordano, D.; Landi, C.; Luiso, M. Measurement of the Absolute Phase Error of Digitizers. IEEE Trans. Instrum. Meas. 2019, 68, 1724–1731. [Google Scholar] [CrossRef]
- Dusonchet, L.; Favuzza, S.; Massaro, F.; Telaretti, E.; Zizzo, G. Technological and legislative status point of stationary energy storages in the EU. Renew. Sustain. Energy Rev. 2019, 101, 158–167. [Google Scholar] [CrossRef]
- Chen, X.; Lin, J.; Wan, C.; Song, Y.; You, S.; Zong, Y.; Guo, W.; Li, Y. Optimal Meter Placement for Distribution Network State Estimation: A Circuit Representation Based MILP Approach. IEEE Trans. Power Syst. 2016, 31, 4357–4370. [Google Scholar] [CrossRef]
- Xygkis, T.C.; Korres, G.N. Optimized measurement allocation for power distribution systems using mixed integer sdp. IEEE Trans. Instrum. Meas. 2017, 66, 2967–2976. [Google Scholar] [CrossRef]
- Damavandi, M.G.; Krishnamurthy, V.; Martí, J.R. Robust Meter Placement for State Estimation in Active Distribution Systems. IEEE Trans. Smart Grid 2015, 6, 1972–1982. [Google Scholar] [CrossRef]
- Yao, Y.; Liu, X.; Li, Z. Robust Measurement Placement for Distribution System State Estimation. IEEE Trans. Sustain. Energy 2019, 10, 364–374. [Google Scholar] [CrossRef]
- Shafiu, A.; Jenkins, N.; Strbac, G. Measurement location for state estimation of distribution networks with generation. IEE Proc. Gener. Transm. Distrib. 2005, 152, 240–246. [Google Scholar] [CrossRef]
- Xiang, Y.; Ribeiro, P.F.; Cobben, J.F.G. Optimization of state estimator-based operation framework including measurement placement for medium voltage distribution grid. IEEE Trans. Smart Grid 2014, 5, 2929–2937. [Google Scholar] [CrossRef]
- Sodhi, R.; Srivastava, S.C.; Singh, S.N. Optimal PMU placement method for complete topological and numerical observability of power system. Electr. Power Syst. Res. 2010, 80, 1154–1159. [Google Scholar] [CrossRef]
- Pau, M.; Pegoraro, P.A.; Monti, A.; Muscas, C.; Ponci, F.; Sulis, S. Impact of Current and Power Measurements on Distribution System State Estimation Uncertainty. IEEE Trans. Instrum. Meas. 2019. [Google Scholar] [CrossRef]
- Prasad, S.; Kumar, D.M.V. Trade-offs in PMU and IED deployment for active distribution state estimation using multi-objective evolutionary algorithm. IEEE Trans. Instrum. Meas. 2018, 67, 1298–1307. [Google Scholar] [CrossRef]
- Pokhrel, B.R.; Bak-Jensen, B.; R Pillai, J. Integrated Approach for Network Observability and State Estimation in Active Distribution Grid. Energies 2019, 12, 2230. [Google Scholar] [CrossRef]
- Cataliotti, A.; Cervellera, C.; Cosentino, V.; Di Cara, D.; Gaggero, M.; Maccio, D.; Marsala, G.; Ragusa, A.; Tine, G. An Improved Load Flow Method for MV Networks Based on LV Load Measurements and Estimations. IEEE Trans. Instrum. Meas. 2019, 68, 430–438. [Google Scholar] [CrossRef]
- Soares, T.M.; Bezerra, U.H.; Tostes, M.E.L. Full-Observable Three-Phase State Estimation Algorithm Applied to Electric Distribution Grids. Energies 2019, 12, 1327. [Google Scholar] [CrossRef]
- Brinkmann, B.; Member, S.; Negnevitsky, M.; Member, S. A Probabilistic Approach to Observability of Distribution Networks. IEEE Trans. Power Syst. 2017, 32, 1169–1178. [Google Scholar] [CrossRef]
- Dehghanpour, K.; Wang, Z.; Wang, J.; Yuan, Y.; Bu, F. A survey on state estimation techniques and challenges in smart distribution systems. IEEE Trans. Smart Grid 2019, 10, 2312–2322. [Google Scholar] [CrossRef]
- Lekshmana, R.; Padmanaban, S.; Mahajan, S.B.; Ramachandaramurthy, V.K.; Holm-Nielsen, J.B. Meter placement in power system network—A comprehensive review, analysis and methodology. Electronics 2018, 7, 329. [Google Scholar] [CrossRef]
- Cataliotti, A.; Cosentino, V.; Di Cara, D.; Russotto, P.; Telaretti, E.; Tinè, G. An Innovative Measurement Approach for Load Flow Analysis in MV Smart Grids. IEEE Trans. Smart Grid 2016, 7, 889–896. [Google Scholar] [CrossRef]
- Cataliotti, A.; Cosentino, V.; Di Cara, D.; Tinè, G. LV Measurement Device Placement for Load Flow Analysis in MV Smart Grids. IEEE Trans. Instrum. Meas. 2016, 65, 999–1006. [Google Scholar] [CrossRef]
- Pau, M.; Patti, E.; Barbierato, L.; Estebsari, A.; Pons, E.; Ponci, F.; Monti, A. Design and Accuracy Analysis of Multilevel State Estimation Based on Smart Metering Infrastructure. IEEE Trans. Instrum. Meas. 2019, 1–13. [Google Scholar] [CrossRef]
- Al-Turjman, F.; Abujubbeh, M. IoT-enabled smart grid via SM: An overview. Future Gener. Comput. Syst. 2019, 96, 579–590. [Google Scholar] [CrossRef]
- Sanduleac, M.; Lipari, G.; Monti, A.; Voulkidis, A.; Zanetto, G.; Corsi, A.; Toma, L.; Fiorentino, G.; Federenciuc, D. Next Generation Real-Time Smart Meters for ICT Based Assessment of Grid Data Inconsistencies. Energies 2017, 10, 857. [Google Scholar] [CrossRef]
- Marcon, P.; Szabo, Z.; Vesely, I.; Zezulka, F.; Sajdl, O.; Roubal, Z.; Dohnal, P. A Real Model of a Micro-Grid to Improve Network Stability. Appl. Sci. 2017, 7, 757. [Google Scholar] [CrossRef]
- Rinaldi, S.; Pasetti, M.; Sisinni, E.; Bonafini, F.; Ferrari, P.; Rizzi, M.; Flammini, A. On the Mobile Communication Requirements for the Demand-Side Management of Electric Vehicles. Energies 2018, 11, 1220. [Google Scholar] [CrossRef]
- Artale, G.; Cataliotti, A.; Cosentino, V.; Di Cara, D.; Fiorelli, R.; Guaiana, S.; Panzavecchia, N.; Tinè, G. A new low cost power line communication solution for smart grid monitoring and management. IEEE Instrum. Meas. Mag. 2018, 21, 29–33. [Google Scholar] [CrossRef]
- Ouissi, S.; Ben Rhouma, O.; Rebai, C. Statistical modeling of mains zero crossing variation in powerline communication. Meas. J. Int. Meas. Confed. 2016, 90, 158–167. [Google Scholar]
- Kabalci, Y.; Kabalci, E. Modeling and analysis of a smart grid monitoring system for renewable energy sources. Sol. Energy 2017, 153, 262–275. [Google Scholar] [CrossRef]
- Rinaldi, S.; Bonafini, F.; Ferrari, P.; Flammini, A.; Sisinni, E.; Di Cara, D.; Panzavecchia, N.; Tine, G.; Cataliotti, A.; Cosentino, V.; et al. Characterization of IP-Based communication for smart grid using software-defined networking. IEEE Trans. Instrum. Meas. 2018, 67, 2410–2419. [Google Scholar] [CrossRef]
- Joint Committee for Guides in Metrology (JCGM). Evaluation of Measurement Data—Supplement 1 to the ‘Guide to the Expression of Uncertainty in Measurement’—Propagation of Distributions Using a Monte Carlo Method, 101:2008, Ed.1; JCGM, BIPM: Sevres, France, 2008. [Google Scholar]
- IEC Standard. Instrument Transformers—Part 2: Additional Requirements for Current Transformers IEC Standard 61869-2; IEC Standard: Geneva, Switzerland, 2012. [Google Scholar]
- Cataliotti, A.; Cosentino, V.; Di Cara, D.; Guaiana, S.; Nuccio, S.; Panzavecchia, N.; Tinè, G. Measurement uncertainty impact on simplified load flow analysis in MV smart grids. In Proceedings of the 2018 IEEE International Instrumentation and Measurement Technology Conference (I2MTC), Houston, TX, USA, 14–17 May 2018; pp. 1354–1359. [Google Scholar]
- Cataliotti, A.; Cosentino, V.; Di Cara, D.; Telaretti, E.; Tinè, G. Uncertainty evaluation of a backward/forward load flow algorithm for a MV smart grid. In Proceedings of the IEEE International Instrumentation Measurement Technology Conference, Pisa, Italy, 11–14 May 2015; pp. 1279–1284. [Google Scholar]
© 2019 by the authors. Licensee MDPI, Basel, Switzerland. This article is an open access article distributed under the terms and conditions of the Creative Commons Attribution (CC BY) license (http://creativecommons.org/licenses/by/4.0/).