Abstract
In Africa, energy plays an important role in the processes of economic and sustainable development. However, inefficiency such as mismanagement of resources constrains productivity. Prior energy efficiency studies in Africa have failed to provide the paths through which energy efficiency improvement can be achieved. The current study aims to assess energy efficiency improvement among 25 selected countries in Africa. First, the dynamic slack-based measure (DSBM) data envelopment analysis (DEA) model is applied to gauge the efficiency measurement. Further, the Malmquist productivity index (MPI) is employed to investigate the energy efficiency improvement during 2006–2014. Empirically, the results from the dynamic slack-based measure (DSBM) model show that energy efficiency in Africa is generally low. Also, the findings from the MPI suggest there is no significant improvement in energy efficiency in Africa. Based on the estimated results, some energy efficiency improvement strategies are further proposed for sample countries in Africa.
1. Introduction
Globally, energy efficiency improvement is a key factor often advocated to enhance productivity as well as improve environmental quality. Accordingly, the world experienced an increase in energy demand (1.9%) in 2017, the highest since 2010, and this surge is largely due to the demands of emerging economies [1].
African economies have been witnessing incremental economic growth since 2000 and energy consumption has increased drastically by 45% [2]. The main priority of African countries is thus to improve the growing energy demand situation and to ensure universal coverage of modern energy services [2,3]. In pursuing this agenda, conscious steps are needed not to affect the quality of the environment. To this end, energy efficiency improvement measures that will predict the future energy use trends and the patterns are paramount. It allows sectorial managers and investors to make strategic energy policies to improve efficiency, reliability, and CO2 emissions reduction.
Data envelopment analysis (DEA), as proposed by Charnes et al. [4], has been widely applied in energy and environmental efficiency analysis [5,6,7,8]. The said approach can accommodate the several inputs-several outputs phenomena [9,10]. However, the basic DEA models are normally formulated to estimate the technical efficiency of the understudy decision-making units (DMUs) in a static manner. Therefore, many biased inefficiency scores may occur if only static optimization is considered [11]. This is because CO2 emission is not always included as an undesirable output factor but only gross domestic product (GDP) is incorporated as the good output in the DEA model. Specifically, GDP is often deployed as the original output (“the more the better”), whereas CO2 is usually described as the undesirable output (“the less the better”). Recently, there has been a plethora of research methods proposed for the evaluation of DMUs with the consideration of undesirable factors in the DEA model. Tyteca [12] argued that undesirable factors should be employed as input in DEA modeling, while Ramanathan [13] adopted CO2 as the reciprocal value in the investigation of the relationship between growth and energy use among the Middle East and North African countries.
To adequately measure energy performance with DEA modeling techniques considering desirable and undesirable outputs simultaneously, some scholars have developed many DEA models based on the axiom of environmental DEA techniques. A comprehensive review of these novel DEA models and their practical applications are presented by [10,14]. The slack-based measure (SBM) introduced by Tone [15], stands tall among the other different methods proposed. This study follows the ideas of Tone [15] as well as Zhou et al. [6] The slack-based measure (SBM)-DEA modeling approach, where the more desirable outputs, the less undesirable outputs and fewer inputs, is regarded as the efficient frontier. Thus, the SBM model has greater superior power in the estimation of environmental decision-making units (DMUs) [6]. In the empirical literature, Zhou et al. [6] measured the efficiency of CO2 emission among Organization for Economic Cooperation and Development (OECD) nations from 1998–2002, using the SBM model. Hu and Kao [16] investigated the energy-saving potential for the Asia-Pacific Economic Cooperation (APEC) during the study period of 1991 to 2000 by adopting the SBM model methodological framework. Choi et al. [17] studied the efficiency of Chinese provinces by considering CO2 emissions with the SBM model. Li et al. [18] proposed a novel extension of the SBM model to adequately study Chinese regional environmental efficiency from 1991 to 2010. Aside from the aforementioned studies, the SBM model was also utilized in the analysis of other sectoral efficiencies, such as the banking industry [19,20], industrial sectors [21], and educational sectors [22,23].
Furthermore, in the literature, some studies adopted the dynamic DEA modeling framework for estimating the implications of variables over consecutive periods [24]. The dynamic DEA modeling technique was initially proposed by [25] and [26]. In a study by Sengupta [25], the model was based on the adjustment cost method, where he integrated the concept of quasi-fixed inputs and their optimum paths in their study. On the other hand, Färe and Grosskopf [26] modeled multi-out production cases by incorporating a multi-time period framework in their study. From their breakthrough, other meaningful dynamic DEA models were formulated [27,28,29,30,31,32,33]. Tone and Tsutsui [34] integrated the carry-over concepts as linking variables between two consecutive periods to develop a new slack-based DEA model to systematically study the overall and period efficiencies simultaneously. Jafarian-Moghaddam and Ghoseiri [35] extended the dynamic framework to include the fuzzy multi-objective DEA model to study the efficiency of the railways. Sueyoshi et al. [36] applied the dynamic DEA window model technique to measure environmental efficiency of coal-fired power generating plants in the United States (US). They suggested that the US should incorporate CO2 emission reduction measures into the Clean Air Act (CAA) to control emissions.
With the continued rise of global warming issues, concerns on energy use and the environment have attracted the attention of researchers globally to find the synergy between sustainable economic growth and environmental protection. In these regards, Färe et al. [37] formulated a DEA Malmquist index model perspective to compute the relative efficiency change and technical progress of production technology. In DEA energy efficiency studies, there are two established ways of handling undesirable output factors in the DEA model: 1) the weakly disposable (WD) where undesirable factors are used in their original form [38,39,40,41]; and 2) strongly disposable (SD) where undesirable factors are treated in their various translation methods, such as reciprocal or additive inverse forms before applications [42,43,44].
Elsewhere, there is a growing body of theoretical and empirical literature on energy efficiency that applies the DEA for several countries or regions; these include the US [45]; China [46,47,48,49]; India [50,51]; Japan [52]; and OECD countries [53,54]. In the African context, there exists a lacuna of energy efficiency studies using the data envelopment analysis approach, although there are some important energy efficiency studies in Africa [2,3,55,56,57,58]. One limitation of those studies is that they do not consider the different implications among the results with the inclusion and without the inclusion of CO2 emissions. Moreover, the literature on energy efficiency improvement in Africa is relatively scant.
Again, based on CO2 emission concerns, Liu and Liu [59] employed the three-stage DEA methodological framework to assess the efficiency of the top 20 CO2 emitting economies from 2000 to 2012 with the incorporation of CO2 as a bad output. Wang et al. [60] developed an integrated super SBM-DEA and Malmquist productivity index (MPI) method to study the energy efficiency estimates of 17 nations. Lenz et al. [61] investigated the energy efficiency dynamics among the European Union (EU) economies by adopting the SBM-DEA approach. Wang et al. [48] used both the SBM model and MPI DEA framework to measure the energy efficiency of 25 countries by including CO2 emission as a bad output. All the above studies are concentrated on developed and Asian countries, but none has been done from the perspective of African countries.
Therefore, the objective of this study is to provide a comprehensive evaluation of energy and environmental efficiency (EE) from the perspective of 25 sample countries in Africa in terms of CO2 emissions. In order to accomplish this, first, energy efficiency measures in Africa are gauged by applying the dynamic slacks-based measure (DSBM) DEA. Second, the pathways through which energy efficiency improvement can be achieved in Africa form 2006–2014 are investigated by adopting the MPI framework. This helps in generating more accurate efficiency scores than the static model. Essentially, in the presence of data availability, undertaking a dynamic analysis is important, in that, the data can further be decomposed into efficiency change subcomponents, thus solving the issue of change over time.
The current study makes the following contributions to the present energy efficiency literature: (1) It provides the first Africa energy efficiency measurement considering two different dynamic DEA models (DSBM model and MPI). (2) The study adopts two case analysis scenarios: (a) the effect of CO2 emission on energy efficiency and (b) without CO2 emission. (3) Empirically, the study contributes by conducting energy efficiency improvement analysis in Africa by utilizing country-level data. (4) Finally, industry-specific efficiency improvements measures are discussed based on the results.
2. Materials and Methods
In this section, the study presents the dynamic slacks-based model, first to gauge the energy efficiency of 25 sample countries in Africa. Second, the Malmquist productivity index (MPI) model is adopted to investigate energy efficiency improvement in Africa. The MPI is further decomposed into technical and technology efficiency sub-components over time.
2.1. Dynamic SBM Model
Measuring energy efficiency with the dynamic DEA methodological framework is important. This is because it allows researchers to understand efficiency-changing dynamics over time. In the real world, strategic energy efficiency improvement planning and investment are of enormous distress for economic growth. In addition, ignoring the dynamic nature (carry-over activities) and undesirable output generally leads to an overestimation of efficiency scores [62,63]. This makes it important to perform a dynamic analysis when there is data availability. Tone and Tsutsui [34] developed a new dynamic SBM-DEA model incorporating carry-over factors. The non-oriented model by Tone and Tsutsui was selected in this study since it can independently handle the inputs, outputs, and carry-over factors individually. This implies that the model can easily assign the weights to each input and output regardless of their degree of position. Interestingly, Tone and Tsutsui [34] adequately proposed that dynamic DEA models have four types of correlation variables (i.e., fixed, free, good, and bad) in a consecutive period’s framework system. Therefore, real GDP is employed as the only linking variable depicting the profit factor that connects the two consecutive production years. The central aim of this study is that African economies must take pragmatic steps towards improving energy efficiency as well as CO2 emission reduction.
This study assumes that there are n nations in Africa to be systematically analyzed. For the j-th nation, j = 1, …, n across two consecutive periods (t = 1, …, T). Where m inputs (i = 1, k, m) are consumed by each investigated DMU. F denotes nondiscretionary (fixed) inputs (i = 1, k, m); S is the output (i = 1, k, s); P represents nondiscretionary (fixed) outputs (i = 1, k, r); Z is the carry-over factor which can be fixed, free, good, or bad; and W depicts the weights. See the diagram below for further details which is denoted by Figure 1.
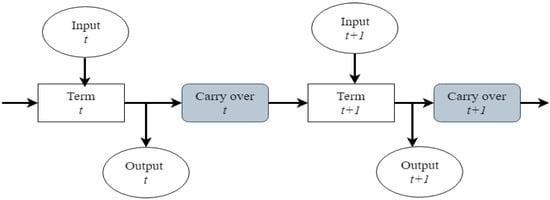
Figure 1.
The dynamic structure of the production technology in consecutive period t.
The non-oriented Tone and Tsutsui [34] model is formulated as
Equation (2) shows the linking or connecting the equation of the two consecutive periods (t and T − 1).
Here is the most efficient, feasible solution:
2.2. Malmquist Productivity Index (MPI) Model
To adequately measure the energy efficiency of selected African countries over time, the study employed the MPI and the Malmquist CO2 emission index (MCEI) proposed by Färe et al. [64] and Zhou et al. [65], respectively. This greatly helps in understanding the influence of such changes on efficiency and can be a significant tool in predicting the fluctuation trends of future efficiency [66].
Assuming t and t + 1 are two different periods, and denote the distance functions of the understudy input and output variables at time t and t + 1 under environmental DEA technology, respectively. The MPI energy efficiency can be computed as:
where measures the efficiency changes between the two different periods in consecutive fashion (t and t + 1). Should it means increased efficiency while reports decreased efficiency.
As Zhou et al. [65] indicated, the MPI can be disintegrated into technical change and efficiency changes. The mathematical model can be written as:
Efficiency change systematically estimates the “catch-up effect” and either improves the understudy firm or worsen its efficiency. For interpretation purposes, if the efficiency change is <1, =1, or >1 this indicates the estimated firm has efficiency retrogression, no change, or progression in efficiency, respectively. On the other hand, technical change measures the “frontier-shift effect” reporting the systematic change in the efficiency frontier relative to the two different periods. If the computed value of technical efficiency is >1 and <1, it indicates progress and retrogression in technical efficiency, respectively. Finally, if MPI is =1, <1, or >1 it means productivity has not changed, decreased in productivity, or increased in productivity, respectively. This study attempts to measure efficiency improvement in Africa over time, which can be ascertained by comparing estimates of the efficiency changes (EC) and the technological change (TC) indexes.
3. Results
3.1. Data Used
The study covers 25 sampled countries in Africa during 2006–2014. The data was obtained from the World Bank indicators database in 2019. One challenge in data collection is that most of the African countries have a lot of missing data, and because of this situation, the sample covers only 25 countries out of a total of 54 countries in Africa. African economies with missing data in one or more of the selected inputs and outputs were excluded from the sample.
The selection of variables is important for any DEA model. This is because, in practice, a nation utilizes multiple inputs to adequately help in generating GDP. A lot of empirical research has been carried out worldwide to estimate energy efficiency [46]. Following these prior studies and data availability, capital stock, labor, and energy use are described as the three inputs; the output variable is GDP (gross domestic product) and CO2 emission is used as the only undesirable output. Note that GDP is employed as the carry-over factor for the DSBM model. The definition of these variables is presented in Table 1.

Table 1.
Variable definitions
The study data were collected from the World Development Indicators (WDI) as stated above. This study covers a very long period for a thorough and profound better understanding of the analyses and discussions. The mean statistics of the understudy variables are presented in Figure 2.
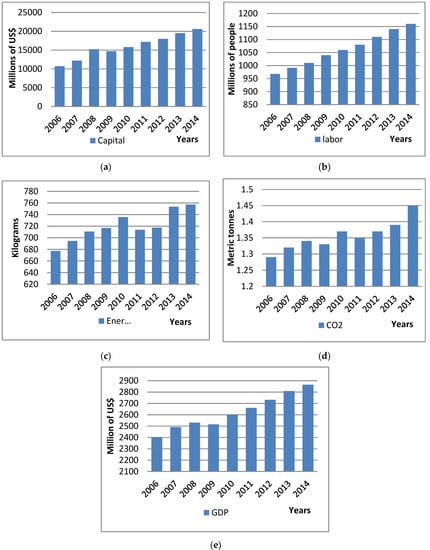
Figure 2.
Mean statistical indexes of the understudy variables from 2006–2014: (a) capital; (b) labor; (c) energy; (d) CO2; and (e) GDP.
From Figure 2, the mean values of energy consumption have risen till 2011 when they drop slightly and continue to increase for the remaining years. Noticeable again is the average CO2 emission values, that continue to increase for the entire sample period except a slight decrease in 2010. The average labor continued to increase during the whole sample period. However, other variables experienced variation with time.
3.2. Energy Efficiency Estimates in Africa
First, the energy efficiency in Africa was computed by employing Equation (4). To have a profound understanding of efficiency changes over time, the dynamic SBM-DEA model was utilized. As Hu and Wang [68] indicated, the fundamental energy efficiency index (EEI) is simply defined as energy use as the only factor in the production of GDP. However, in the real world phenomenon, only energy input cannot be utilized in generating GDP. Therefore, in measuring energy efficiency, one should adopt the multiple inputs framework, in the production of the desired output. Moreover, energy consumption has adverse effects on environmental quality. Thus, bad output, in this case CO2 emission, should be included in the evaluation framework.
Figure 3 reports efficiency estimates obtained by adopting the multiple inputs framework to generate both GDP and emit carbon. The findings reveal that only seven countries were efficient during the entire sample period. This implies that these seven countries have superior mechanisms in the utilization of input resources to propel balance development between GDP production and CO2 reductions.
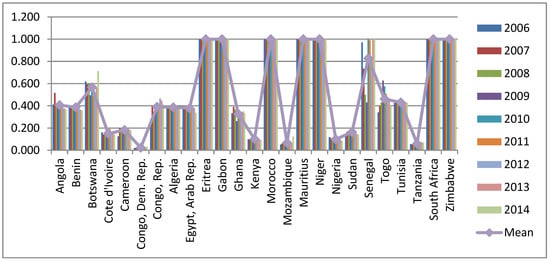
Figure 3.
Energy efficiency estimates from dynamic slack-based models (DSBM) with carbon.
The mean efficiency estimate of all 25 sampled countries experienced a fluctuating pattern. It can be observed that the average efficiency slightly increased from 0.492 in 2006 to 0.499 in 2007. There was a slight decline in efficiency from 2007 to 2009 but recovery was recorded in 2010 (0.510). From 2010, a fairly stable efficiency score was witnessed for the subsequent years. The results in Figure 3 further indicate that adopting GDP as a carry-over factor linking or dynamically connecting the two consecutive years had serious implications on the overall efficiency (0.496).
3.3. Energy Efficiency Improvement Estimates in Africa
The study evaluates the energy efficiency of 25 sampled countries in Africa over time. Essentially, it is a very useful exercise for researchers to undertake a dynamic analysis in the presence of data availability. This is because we can understand efficiency changes over time and adequately help in predicting future efficiency fluctuations [66]. To deeply understand the patterns of change in energy efficiency and productivity growth in Africa, the study divides the analysis into two distinct forms of energy productivity efficiency: (1) with the inclusion of CO2 emission as bad output; and (2) without the inclusion of CO2 emission.
3.3.1. Case Scenario 1: Malmquist Productivity Index (MPI) with CO2 Emission
The results of CO2 emission incorporation into the energy productivity efficiency analysis are shown in Figure 4. The mean energy efficiency (0.992) with the inclusion of CO2 emissions of the selected 25 countries in Africa is higher than those from 2007, 2008, and 2012. The mean efficiency estimate for 2007, 2008, and 2012 are 0.983, 0.989, and 0.967, respectively.
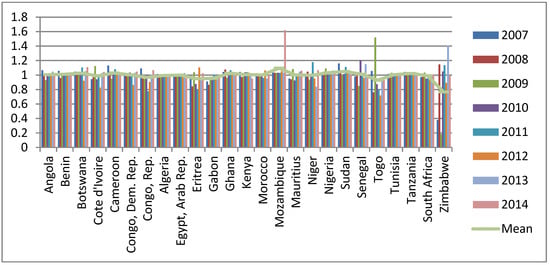
Figure 4.
The energy productivity estimates with CO2 emission in Africa during 2006–2014.
During the entire sample period, the selected 25 countries as a whole witnessed a negative change (0.992). However, energy efficiency increased by 5.1% in 2014 relative to 2007. Therefore, during the following years (i.e., 2011, 2013, and 2014) the sampled African economies experienced a positive change. Clearly, from 2006 to 2014, Mozambique, Sudan, and Tanzania seem to have made a slight improvement in their energy productivity scores. This is because the average estimates of these countries are higher than one across the entire sampled period. The results further suggest that Zimbabwe performed poorly with an overall average efficiency of 0.766. The energy scores of the other countries varied with time.
In detail, Figure 5 shows the patterns of the mean energy efficiency productivity of the different countries over time in Africa. It can be observed that Zimbabwe had a lower overall mean efficiency score. The average efficiency estimates of Mozambique (1.095) appear as the highest. This is followed by Sudan, Cameroon, Botswana, Ghana, and Tanzania with 1.050, 1.028, 1.026, 1.024, and 1.022 efficiency scores, respectively.
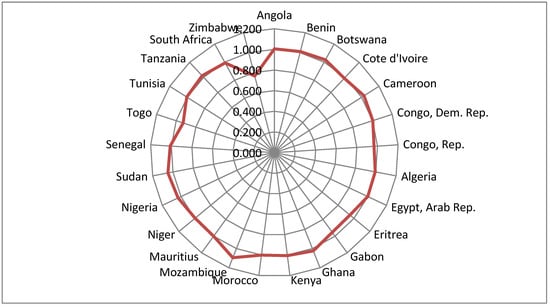
Figure 5.
Mean Malmquist productivity index (MPI) scores with CO2 emission for the 25 sample countries in 2006–2014.
3.3.2. Case Scenario 2: Malmquist Productivity Index (MPI) without CO2 Emission
Next, the results of energy productivity efficiency without the inclusion of CO2 emission as a bad output are reported in Table 2. Interestingly, the result reveals that the sampled countries achieved higher average energy productivity (1.012) in 2013 and maintained it in 2014.
Table 2.
The energy productivity estimates without CO2 emissions in Africa during 2006–2014.
The above table demonstrates that the whole period sample mean is 0.988, representing a 1.2% decline in productivity. However, in 2011, 2013, and 2014, there was positive growth in productivity. In the years 2007, 2008, 2009, 2010, and 2012 there were productivity losses of 3%, 0.6%, 6.5%, 1%, and 1.3%, respectively. These losses may be as a result of global economic phenomena such as the global financial crisis since African economies are vulnerable to external pressures.
The mean overall energy productivity for all the different sample countries in Africa is shown in Figure 6. The findings indicate that the mean estimate of Sudan is 1.050, considered to be the most efficient energy productivity, with a growth rate of 5%. This is followed by Nigeria (3.4%), Mozambique (3.1%), and Cameroon (2.7%) with positive growth rates while Zimbabwe again recorded the worst performance with 25.2% loss in productivity. Zhao et al. [69] report that political unrest can greatly affect efficiency. Aside from the above, the effects of other external environmental factors such as energy resource structure, degree of industrialization, trade, and CO2 emission can have an instrumental impact on energy efficiency.
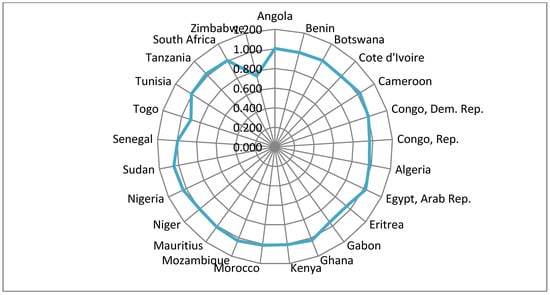
Figure 6.
Mean MPI scores without CO2 emissions for the 25 sample countries in 2006–2014.
The Figure 7 above shows the comparison of the mean MPI energy efficiency analysis with and without CO2 emissions. From Figure 5 and Figure 6, the overall energy efficiency with and without CO2 emissions incorporation is 0.992 and 0.988, respectively. This result reveals that there is no significant difference in the mean efficiencies of the two case scenarios.
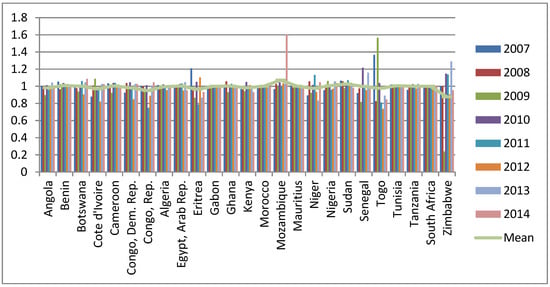
Figure 7.
Comparison between average MPI energy efficiency with and without CO2 emissions.
The results of this study to a large extent confirm the findings of Liu and Liu [59], who estimated the energy performance of the top 20 CO2 emitting nations. Wang et al. [48] also obtained similar findings, assessing the energy efficiency of 25 nations. These findings are supported by Wang et al. [60] and Zhou et al. [70] who studied 17 nations and the APEC nations, respectively.
3.3.3. Energy Efficiency Change Improvement in Africa (Catchup)
For further analysis, scenario 1 was adopted to gain insight into whether energy productivity growth is mainly due to efficiency or technology changes (i.e., energy efficiency with the inclusion of CO2 emissions). Figure 8 shows the findings of the “catch-up effect” (efficiency change) energy efficiency estimates in Africa.
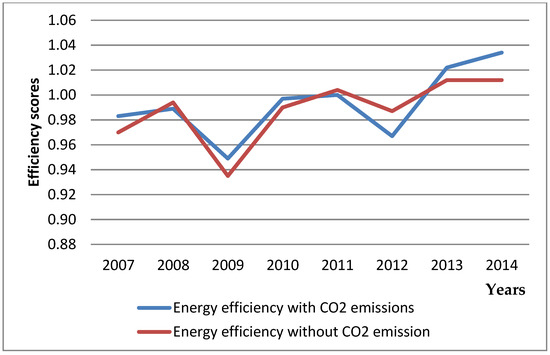
Figure 8.
The energy efficiency change estimates in Africa from 2006–2014.
For the entire sample period, the overall mean efficiency change score is 0.99, implying a 1% loss in productivity. It can be found that the 25 sample countries experienced a slightly positive growth rate in 2007, 2009, 2013, and 2014 with 0.5%, 3.1%, 1.3%, and 1.1% rates, respectively. However, three countries, Gabon, Mauritius and South Africa, did not witness a change in technical efficiency (=1) over time. In addition, Benin, Cameroon, Egypt, Ghana, Mozambique, Nigeria, Sudan, and Tunisia are technically efficient. Zimbabwe and the other countries with a mean technical efficiency less than 1 are regarded as technically inefficient since they are far from the contemporaneous frontier.
3.3.4. Technology Energy Efficiency Change Improvement in Africa (Frontier)
Figure 9 displays the results of the efficiency improvement driven by technology changes among 25 sampled African countries. The findings demonstrate that the selected countries in Africa have shown a slight improvement in technology efficiency scores. Only six countries have a mean technology efficiency less than 1, which means they were the only inefficient countries from the entire sample. Finally, the results suggest energy efficiency change in Africa is mainly due to technological efficiency change. The possible reason for this development is a result of several governments/policymakers making concerted efforts to improve energy efficiency on the continent. Investment and implementation of energy efficiency measures come with technological improvement and exchange of expertise.
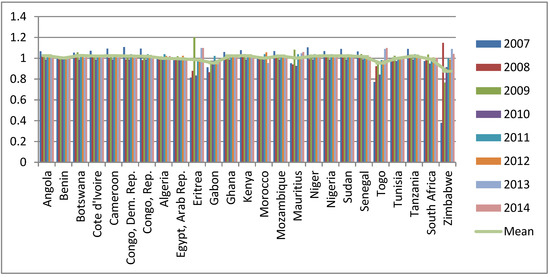
Figure 9.
The technology change estimates in Africa from 2006–2014.
4. Conclusions and Policy Implications
This study aims to go beyond static optimizations of energy and environmental (EE) efficiency to assess the pathways through which energy efficiency improvement can be achieved in Africa. To achieve this objective, two different dynamic models (DSBM-DEA and the MPI) were applied to gauge the energy efficiency of 25 sampled countries in Africa. To adequately estimate EE efficiency in Africa, the study employed capital stock, labor, and energy consumptions as inputs while GDP and CO2 emissions were used as the good and bad outputs, respectively. This study was different from prior energy efficiency studies in Africa. First, EE efficiency estimates were measured by utilizing the DSBM-DEA model. Second, the MPI model was deployed to investigate efficiency improvement change over time in two case scenarios: (1) energy efficiency with the inclusion of CO2 emission and (2) energy efficiency without CO2 emission during the study period of 2006–2014.
The results obtained by applying the DSBM model for measuring energy efficiency in Africa suggest that the sampled countries are generally low. This implies that the sampled countries have fewer mechanisms in promoting GDP growth and are ineffective in CO2 emission reduction. Additionally, the results further suggest that carry-over factor activities have an adverse implication on energy efficiency in Africa. This means pursuing economic prosperity of these countries must include environmental protection as well as CO2 emission reduction measures.
The results of the MPI suggest that there is a slight improvement in energy efficiency among the selected countries in African, mainly due to changes in technology. Evidentially, the overall mean efficiency of the efficiency change (catchup) and that of the technology change (frontier) is 0.99 and 1.002, respectively. However, this change is too insignificant (0.2%) to have a meaningful impact on improving energy efficiency for the entire African continent. The results from the MPI concerning the inclusion and without CO2 emission factors demonstrated no significant difference.
To improve efficiency, both industrial players and policymakers must endeavor to adopt innovative policies to ensure energy efficiency in Africa. Increased efficiency on the continent can be obtained via renewable and clean energy sources such as solar and wind, which are abundantly available and free in Africa. Renewable energy resource utilization must be adequately planned to ensure its optimal usage. Investment in technology and implementation of photovoltaic poverty alleviation activities or projects should be encouraged. Emission reduction measures such as the implementation of a carbon tax should be adopted as well as proper and effective utilization of resources (such as economic and energy input) to enhance GDP growth.
The results of this study are helpful for managers to select effective management and investment strategies. Policymakers and potential investors can generate appropriate action plans to systematically improve energy efficiency in Africa. The results of this study are an effective tool for governments in Africa to realize the collective fight against global climate change.
In a future study, one can analyze the impact of external determinants on energy efficiency improvement in Africa. The construction of relatively new DEA models to measure energy efficiency in Africa is thus, a grey area for future research.
Author Contributions
Conceptualization, N.A.; methodology, N.A., Z.M. and Z.Z.; software, N.A., Z.Z. and M.L.; validation, N.A., Z.M., M.L. and Z.Z.; formal analysis, N.A., M.L. and Z.Z.; investigation, N.A., Z.M., M.L., Z.Z., J.A. and B.A.A.; data collection, J.A. and B.A.A.; writing—original draft preparation, N.A., J.A. and B.A.A.; writing—review and editing, N.A., J.A. and B.A.A.; supervision, Z.M. and M.L.; funding acquisition, Z.M.
Funding
This research was funded by National Natural Science Foundation of China grant number (7167031130) and (71774071), as well as Social Science Funding Project of Jiangsu Province grant number (18GLB024).
Acknowledgments
We, the authors are very thankful to the Editor and reviewers for their support for our manuscript. The authors highly appreciate the useful comments and suggestions given by the Editor and reviewers on the initial version of this manuscript.
Conflicts of Interest
The authors declare no conflict of interest.
References
- International Energy Agency, E.E. Analysis and Outlook to 2040. Available online: https://webstore.iea.org/download/direct/2369?fileName=Market_Report_Series_Energy_Efficiency_2018.pdf (accessed on 18 December 2018).
- Ouedraogo, N.S. Africa energy future: Alternative scenarios and their implications for sustainable development strategies. Energy Policy 2017, 106, 457–471. [Google Scholar] [CrossRef]
- Adom, P.K. An evaluation of energy efficiency performances in Africa under heterogeneous technologies. J. Clean. Prod. 2019, 209, 1170–1181. [Google Scholar] [CrossRef]
- Charnes, A.; Cooper, W.W.; Rhodes, E. Measuring the efficiency of decision making units. Eur. J. Oper. Res. 1978, 2, 429–444. [Google Scholar] [CrossRef]
- Zaim, O. Measuring environmental performance of state manufacturing through changes in pollution intensities: A DEA framework. Ecol. Econ. 2004, 48, 37–47. [Google Scholar] [CrossRef]
- Zhou, P.B.; Angand, K. Slacks-based efficiency measures for modeling environmental performance. Ecol. Econ. 2006, 60, 111–118. [Google Scholar] [CrossRef]
- Zhou, P.K.L.; Pohand, B.W. A non-radial DEA approach to measuring environmental performance. Eur. J. Oper. Res. 2007, 178, 1–9. [Google Scholar] [CrossRef]
- Wang, K.; Lu, B.; Wei, Y.-M. China’s regional energy and environmental efficiency: A range-adjusted measure based analysis. Appl. Energy 2013, 112, 1403–1415. [Google Scholar] [CrossRef]
- Song, M.; Peng, J.; Wang, J.; Zhao, J. Environmental efficiency and economic growth of China: A Ray slack-based model analysis. Eur. J. Oper. Res. 2018, 269, 51–63. [Google Scholar] [CrossRef]
- Mardani, A.; Zavadskas, E.K.; Streimikiene, D.; Jusoh, A.; Khoshnoudi, M. A comprehensive review of data envelopment analysis (DEA) approach in energy efficiency. Renew. Sustain. Energy Rev. 2017, 70, 1298–1322. [Google Scholar] [CrossRef]
- Nemoto, J.; Goto, M. Dynamic data envelopment analysis: Modeling intertemporal behavior of a firm in the presence of productive inefficiencies. Econ. Lett. 1999, 64, 51–56. [Google Scholar] [CrossRef]
- Tyteca, D. Linear programming models for the measurement of environmental performance of firms—Concepts and empirical results. J. Product. Anal. 1997, 8, 183–197. [Google Scholar] [CrossRef]
- Ramanathan, R. Evaluating the comparative performance of countries of the Middle East and North Africa: A DEA application. Socio-Econ. Plan. Sci. 2006, 40, 156–167. [Google Scholar] [CrossRef]
- Mariz, F.B.; Almeida, M.R.; Aloise, D. A review of Dynamic Data Envelopment Analysis: State of the art and applications. Int. Trans. Oper. Res. 2018, 25, 469–505. [Google Scholar] [CrossRef]
- Tone, K. A slacks-based measure of efficiency in data envelopment analysis. Eur. J. Oper. Res. 2001, 130, 498–509. [Google Scholar] [CrossRef]
- Hu, J.-L.; Kao, C.-H. Efficient energy-saving targets for APEC economies. Energy Policy 2007, 35, 373–382. [Google Scholar] [CrossRef]
- Choi, Y.; Zhang, N.; Zhou, P. Efficiency and abatement costs of energy-related CO2 emissions in China: A slacks-based efficiency measure. Appl. Energy 2012, 98, 198–208. [Google Scholar] [CrossRef]
- Li, H.; Fang, K.; Yang, W.; Wang, D.; Hong, X. Regional environmental efficiency evaluation in China: Analysis based on the Super-SBM model with undesirable outputs. Math. Comput. Model. 2013, 58, 1018–1031. [Google Scholar] [CrossRef]
- Aggelopoulos, E.; Georgopoulos, A. Bank branch efficiency under environmental change: A bootstrap DEA on monthly profit and loss accounting statements of Greek retail branches. Eur. J. Oper. Res. 2017, 261, 1170–1188. [Google Scholar] [CrossRef]
- Zhou, Z.; Amowine, N.; Huang, D. Quantitative efficiency assessment based on the dynamic slack-based network data envelopment analysis for commercial banks in Ghana. South Afr. J. Econ. Manag. Sci. 2018, 21, 1–11. [Google Scholar]
- De Castro Camioto, F.; Mariano, E.B.; Rebelatto, D.A.d.N. Efficiency in Brazil’s industrial sectors in terms of energy and sustainable development. Environ. Sci. Policy 2014, 37, 50–60. [Google Scholar] [CrossRef]
- Sagarra, M.; Mar-Molinero, C.; Agasisti, T. Exploring the efficiency of Mexican universities: Integrating data envelopment analysis and multidimensional scaling. Omega 2017, 67, 123–133. [Google Scholar] [CrossRef]
- Thanassoulis, E.; Dey, P.K.; Petridis, K.; Goniadis, I.; Georgiou, A.C. Evaluating higher education teaching performance using combined analytic hierarchy process and data envelopment analysis. J. Oper. Res. Soc. 2017, 68, 431–445. [Google Scholar] [CrossRef]
- Kao, C. Dynamic data envelopment analysis: A relational analysis. Eur. J. Oper. Res. 2013, 227, 325–330. [Google Scholar] [CrossRef]
- Sengupta, J.K. A dynamic efficiency model using data envelopment analysis. Int. J. Prod. Econ. 1999, 62, 209–218. [Google Scholar] [CrossRef]
- Färe, R.; Grosskopf, S. Intertemporal production frontiers: With dynamic DEA. J. Oper. Res. Soc. 1997, 48, 656. [Google Scholar] [CrossRef]
- Sueyoshi, T.; Sekitani, K. Returns to scale in dynamic DEA. Eur. J. Oper. Res. 2005, 161, 536–544. [Google Scholar] [CrossRef]
- Jaenicke, E.C. Testing for intermediate outputs in dynamic DEA models: Accounting for soil capital in rotational crop production and productivity measures. J. Product. Anal. 2000, 14, 247–266. [Google Scholar] [CrossRef]
- Emrouznejad, A.; Thanassoulis, E. A mathematical model for dynamic efficiency using data envelopment analysis. Appl. Math. Comput. 2005, 160, 363–378. [Google Scholar] [CrossRef]
- Silva, E.; Stefanou, S.E. Dynamic efficiency measurement: Theory and application. Am. J. Agric. Econ. 2007, 89, 398–419. [Google Scholar] [CrossRef]
- Ouellette, P.; Yan, L. Investment and dynamic DEA. J. Product. Anal. 2008, 29, 235–247. [Google Scholar] [CrossRef]
- Chen, C.-M.; van Dalen, J. Measuring dynamic efficiency: Theories and an integrated methodology. Eur. J. Oper. Res. 2010, 203, 749–760. [Google Scholar] [CrossRef]
- Tone, K.; Tsutsui, M. Dynamic DEA with network structure: A slacks-based measure approach. Omega 2014, 42, 124–131. [Google Scholar] [CrossRef]
- Tone, K.; Tsutsui, M. Dynamic DEA: A slacks-based measure approach. Omega 2010, 38, 145–156. [Google Scholar] [CrossRef]
- Jafarian-Moghaddam, A.R.; Ghoseiri, K. Fuzzy dynamic multi-objective Data Envelopment Analysis model. Expert Syst. Appl. 2011, 38, 850–855. [Google Scholar] [CrossRef]
- Sueyoshi, T.; Goto, M.; Sugiyama, M. DEA window analysis for environmental assessment in a dynamic time shift: Performance assessment of US coal-fired power plants. Energy Econ. 2013, 40, 845–857. [Google Scholar] [CrossRef]
- Färe, R.; Grosskopf, S.; Norris, M.; Zhang, Z. Productivity growth, technical progress, and efficiency change in industrialized countries. Am. Econ. Rev. 1994, 66–83. [Google Scholar]
- Färe, R.; Grosskopf, S.; Pasurka, C.A., Jr. Pollution abatement activities and traditional productivity. Ecol. Econ. 2007, 62, 673–682. [Google Scholar] [CrossRef]
- Färe, R.; Grosskopf, S. Nonparametric productivity analysis with undesirable outputs: Comment. Am. J. Agric. Econ. 2003, 85, 1070–1074. [Google Scholar] [CrossRef]
- Kuosmanen, T. Weak disposability in nonparametric production analysis with undesirable outputs. Am. J. Agric. Econ. 2005, 87, 1077–1082. [Google Scholar] [CrossRef]
- Färe, R.; Grosskopf, S. Modeling undesirable factors in efficiency evaluation: Comment. Eur. J. Oper. Res. 2004, 157, 242–245. [Google Scholar] [CrossRef]
- Lovell, C.K. Measuring the macroeconomic performance of the Taiwanese economy. Int. J. Prod. Econ. 1995, 39, 165–178. [Google Scholar] [CrossRef]
- Athanassopoulos, A.D.; Thanassoulis, E. Separating market efficiency from profitability and its implications for planning. J. Oper. Res. Soc. 1995, 46, 20–34. [Google Scholar] [CrossRef]
- Seiford, L.M.; Zhu, J. Modeling undesirable factors in efficiency evaluation. Eur. J. Oper. Res. 2002, 142, 16–20. [Google Scholar] [CrossRef]
- Tsutsui, M.; Goto, M. A multi-division efficiency evaluation of US electric power companies using a weighted slacks-based measure. Socio-Econ. Plan. Sci. 2009, 43, 201–208. [Google Scholar] [CrossRef]
- Guo, X.; Zhu, Q.; Lv, L.; Chu, J.; Wu, J. Efficiency evaluation of regional energy saving and emission reduction in China: A modified slacks-based measure approach. J. Clean. Prod. 2017, 140, 1313–1321. [Google Scholar] [CrossRef]
- Lu, B.; Wang, K.; Xu, Z. China’s regional energy efficiency: Results based on three-stage DEA model. Int. J. Glob. Energy 2013, 36, 262–276. [Google Scholar] [CrossRef]
- Wang, L.-W.; Le, K.-D.; Nguyen, T.-D. Assessment of the Energy Efficiency Improvement of Twenty-Five Countries: A DEA Approach. Energies 2019, 12, 1535. [Google Scholar] [CrossRef]
- Ouyang, X.; Mao, X.; Sun, C.; Du, K. Industrial energy efficiency and driving forces behind efficiency improvement: Evidence from the Pearl River Delta urban agglomeration in China. J. Clean. Prod. 2019, 220, 899–909. [Google Scholar] [CrossRef]
- Mukherjee, K. Energy use efficiency in the Indian manufacturing sector: An interstate analysis. Energy Policy 2008, 36, 662–672. [Google Scholar] [CrossRef]
- Haider, S.; Danish, M.S.; Sharma, R. Assessing energy efficiency of Indian paper industry and influencing factors: A slack-based firm-level analysis. Energy Econ. 2019, 81, 454–464. [Google Scholar] [CrossRef]
- Honma, S.; Hu, J.-L. Industry-level total-factor energy efficiency in developed countries: A Japan-centered analysis. Appl. Energy 2014, 119, 67–78. [Google Scholar] [CrossRef]
- Sahoo, B.K.; Luptacik, M.; Mahlberg, B. Alternative measures of environmental technology structure in DEA: An application. Eur. J. Oper. Res. 2011, 215, 750–762. [Google Scholar] [CrossRef]
- Apergis, N.; Aye, G.C.; Barros, C.P.; Gupta, R.; Wanke, P. Energy efficiency of selected OECD countries: A slacks based model with undesirable outputs. Energy Econ. 2015, 51, 45–53. [Google Scholar] [CrossRef]
- Amuakwa-Mensah, F.; Klege, R.A.; Adom, P.K.; Amoah, A.; Hagan, E. Unveiling the energy saving role of banking performance in Sub-Sahara Africa. Energy Econ. 2018, 74, 828–842. [Google Scholar] [CrossRef]
- Adom, P.K.; Amakye, K.; Abrokwa, K.K.; Quaidoo, C. Estimate of transient and persistent energy efficiency in Africa: A stochastic frontier approach. Energy Convers. Manag. 2018, 166, 556–568. [Google Scholar] [CrossRef]
- Adom, P.K.; Minlah, M.K.; Adams, S. Impact of renewable energy (hydro) on electricity prices in Ghana: A tale of the short-and long-run. Energy Strategy Rev. 2018, 20, 163–178. [Google Scholar] [CrossRef]
- Kolawole, A.; Adesola, S.; de Vita, G. Factors that drive energy use in Africa: Panel data evidence from selected Sub-Sahara African countries. OPEC Energy Rev. 2017, 41, 364–380. [Google Scholar] [CrossRef]
- Liu, X.; Liu, J. Measurement of low carbon economy efficiency with a three-stage data envelopment analysis: A comparison of the largest twenty CO2 emitting countries. Int. J. Environ. Res. Public Health 2016, 13, 1116. [Google Scholar] [CrossRef]
- Wang, C.-N.; Ho, H.-X.; Hsueh, M.-H. An integrated approach for estimating the energy efficiency of seventeen countries. Energies 2017, 10, 1597. [Google Scholar] [CrossRef]
- Lenz, N.V.; Šegota, A.; Maradin, D. Total-factor Energy Efficiency in EU: Do Environmental Impacts Matter? Int. J. Energy Econ. Policy 2018, 8, 92–96. [Google Scholar]
- Guo, X.; Lu, C.C.; Lee, J.H.; Chiu, Y.H. Applying the dynamic DEA model to evaluate the energy efficiency of OECD countries and China. Energy 2017, 134, 392–399. [Google Scholar] [CrossRef]
- Lu, C.C.; Chen, X.; Hsieh, C.L.; Chou, K.W. Dynamic energy efficiency of slack-based measure in high-income economies. Energy Sci. Eng. 2019. [Google Scholar] [CrossRef]
- Färe, R.; Grosskopf, S.; Tyteca, D. An activity analysis model of the environmental performance of firms—application to fossil-fuel-fired electric utilities. Ecol. Econ. 1996, 18, 161–175. [Google Scholar] [CrossRef]
- Zhou, P.; Ang, B.; Han, J. Total factor carbon emission performance: A Malmquist index analysis. Energy Econ. 2010, 32, 194–201. [Google Scholar] [CrossRef]
- Chen, L.; Jia, G. Environmental efficiency analysis of China’s regional industry: A data envelopment analysis (DEA) based approach. J. Clean. Prod. 2017, 142, 846–853. [Google Scholar] [CrossRef]
- World, B. World Development Indicators. Available online: http://www.wdi.org/ (accessed on 2 May 2019).
- Hu, J.-L.; Wang, S.-C. Total-factor energy efficiency of regions in China. Energy Policy 2006, 34, 3206–3217. [Google Scholar] [CrossRef]
- Zhao, C.; Zhang, H.; Zeng, Y.; Li, F.; Liu, Y.; Qin, C.; Yuan, J. Total-factor energy efficiency in BRI countries: An estimation based on three-stage DEA model. Sustainability 2018, 10, 278. [Google Scholar] [CrossRef]
- Zhou, D.Q.; Meng, F.Y.; Bai, Y.; Cai, S.Q. Energy efficiency and congestion assessment with energy mix effect: The case of APEC countries. J. Clean. Prod. 2017, 142, 819–828. [Google Scholar] [CrossRef]
© 2019 by the authors. Licensee MDPI, Basel, Switzerland. This article is an open access article distributed under the terms and conditions of the Creative Commons Attribution (CC BY) license (http://creativecommons.org/licenses/by/4.0/).