Article

Numerical Analysis of End-Gas Autoignition and Pressure Oscillation in a Downsized SI Engine Using Large Eddy Simulation

State Key Laboratory of Engines, Tianjin University, Tianjin 300072, China
*
Author to whom correspondence should be addressed.
Energies 2019, 12(20), 3909; https://doi.org/10.3390/en12203909
Submission received: 30 August 2019 / Revised: 26 September 2019 / Accepted: 29 September 2019 / Published: 15 October 2019

Abstract

:
Knock and super-knock are abnormal combustion phenomena in engines, however, they are hard to study comprehensively through optical experimental methods due to their inherent destructive nature. In present work, the methodology of large eddy simulation (LES) coupled with G equations and a detailed mechanism of primary reference fuel (PRF) combustion is utilized to address the mechanisms of knock and super-knock phenomena in a downsized spark ignition gasoline engine. The knock and super-knock with pressure oscillation are qualitatively duplicated through present numerical models. As a result, the combustion and onset of autoignition is more likely to occur at top dead center (TDC), which causes end gas at a higher temperature and pressure. It is reasonable to conclude that the intensity of knock is not only proportional to the mass fraction of mixtures burned by the autoignition flame but the thermodynamics of the unburned end-gas mixture, and the effect of thermodynamics is more important. It also turns out that two auto-ignitions occur in conventional knock conditions, while only one auto-ignition takes place in super-knock conditions. However, the single autoignition couples with the pressure wave and they reinforce each other, which eventually evolves into detonation combustion. This work gives the valuable insights into knock phenomena in spark ignition gasoline engines.

1. Introduction

Due to their advantages of high thermal efficiency and low emissions, turbocharging and downsizing engines represent the recent technical trend in downsized spark-ignited (SI) engines, as energy crisis and environmental pollution have become increasingly serious [1,2]. However, the inherent abnormal combustion phenomenon in SI engines, knock, represents the major obstacle for present SI engines to achieve ideal thermal efficiency [3]. Specifically, heavy knocking damages engines and produces noise that distracts drivers’ attention. It is widely agreed that knock is caused by end gas auto-ignition before it is reached by the main flame initiated by the spark plug [4]. Furthermore, a new knocking mode called super-knock which produces huge destructive effects on engines has become a greater challenge for improving engine performance [5,6,7,8,9,10].
Many studies have been conducted to investigate the mechanisms of knock and super-knock [11,12,13,14,15,16,17,18,19,20,21,22,23]. Konig et al. [11] observed the flame propagation and auto-ignition events by using high-speed natural light and Schlieren photography. Their results showed a multiple centering and stochastic nature of auto-ignition, and the severity of knock increased as the onset of auto-ignition occurred closer behind the top dead center (TDC). Merola et al. [24] carried out a series of experiments in a four-stroke SI engine with optical techniques based on natural flame emission imaging and ultraviolet spectroscopy to investigate the relationship between intermediate products and the start time, duration of knock and auto-ignition (AI) kernel. Their research revealed that HCO· radicals arei strongly correlated with the occurrence of auto-ignition while the burned region with high temperature can be modeled by OH radicals. Based on this work, Kawahara et al. [25] took a step forward and pointed out that OH radicals can be adopted to identify the transition from low-temperature reactions to high-temperature reactions. Besides, researchers have explored a majority of the characteristics that may influence knock, including the initial temperature and properties of fuel [26], octane tic sensitivity [27], and advanced techniques such as homogeneous charge compression ignition (HCCI) [28]. Wang et al. [29,30] captured the super-knock in a closed system by using a rapid compression machine and high-speed direct photography, and their results demonstrated that the mechanism of super-knock consists of a heat-induced deflagration to detonation. Furthermore, they pointed out that the detonation was firstly initiated near the wall. Those experiments play an important role in understanding the knock phenomenon, however, with experimental methods is hard to comprehensively recognize knock or super-knock combustion due to their extremely destructive features and the complicated nature of knock which combines turbulent flow, flame propagation, end-gas auto-ignition, pressure oscillation, turbulent-combustion interactions and pressure wave-chemical reactions interactions.
Thanks to the blooming development of high-performance computing clusters, the CFD method has been proved able to help us understand abnormal combustion mechanisms [31,32,33,34,35]. In the 1-D numerical field, Livengood and Wu [36] proposed an equation to predict the occurrence of auto-ignition in unburned mixtures. Based on this work, Heywood et al. [37] introduced the influence of burned mixtures on end-gas unburned mixtures, and they divided the combustion chamber into burned region and unburned region, proposing that the compression and heating effect from burned mixtures is prone to promote the end-gas auto-ignition. The two studies focused on the end-gas AI, but they could not predict the pressure oscillation and flame propagation after the occurrence of AI, let alone consider the influence of turbulence and the structure of the combustion chamber. In 3-D simulations, the Reynolds averaged Navier–Stokes (RANS) approach provides today precise predictions of mean quantities such as temperature or pressure in internal combustion engines. Notably, RANS simulations were conducted to predict and understand the occurrence of knock [38,39] and super-knock [40]. However, as the definition suggests, the RANS method is limited because it focuses on describing the mean cycle, which is not suitable for knock or super-knock due to their transient characteristics. On the other hand, direct numerical simulations (DNS) for 3-D investigations still remain costly.
The recent development of LES tools has opened new perspectives in the combustion field without losing computational efficiency. Some works of Robert et al. [41] showed that LES could capture knock characteristics such as intensity and frequency over a wide range of ST. Pinaki et al. [42] proposed a LES model coupled with G equation and skeletal mechanism of a primary reference fuel (PRF) to predict knocking combustion in a cooperative fuel research engine. The model was able to predict the no knock to knock transition precisely as the compression ratio was increased. Especially, it made great agreements in the critical compression ratio at knock onset with experimental data for two different PRF blends. However, only slight knock phenomena could be observed. Lecocq et al. [43] proposed a new LES model coupled with the flame surface density and Tabulated Kinetics for Ignition (TKI) approaches to investigate knock and pre-ignition in downsized gasoline engines, whereas Robert et al. [32] pointed out that both the Extended Coherent Flame Model for LES (ECFM-LES) and TKI methods were not able to fully decouple the premixed flame and auto-ignition phenomena. Therefore they improved the ECFM-LES method and applied it successfully to simulating a multi-cycle SI engine under general knock and super-knock conditions. Their results show that knock intensity is positively proportional to the fresh gases mass burned by auto-ignition at low knock intensities, while for super-knock, the knock intensity is also proportional to the fresh gases consumed by auto-ignition but with a much higher factor. Moreover, the deflagration to detonation transition (DDT) is observed in super-knock, where a coupling between pressure wave and the AI reaction rate appears, leading to maximum pressures and propagation speeds close to those of detonation. However, the in-depth mechanism of the combustion mode transition from normal combustion to super-knock combustion is not clear yet, the relevant work is still limited and the further work needs to be done.
Therefore, the main objective of the present work is to numerically investigate the in-depth mechanism of different combustion modes in a practical spark ignition engine. The knock and super-knock phenomena are achieved by changing the spark timing, and the in-depth mechanisms responsible for the combustion mode transition from normal combustion to super-knock combustion are carefully addressed in terms of the evolutions of the pressure wave, HCO, flame surface and unburned temperature distributions. A spark timing variation in the experimental database is well simulated in LES, in which the methodology of LES coupled with G-equations and detailed chemistry mechanism of primary reference fuel are carried out. Importantly, the present model performance is validated and evaluated even when super-knock occurs. Thus, the turbulent flame propagation is determined by the G-equations turbulent combustion model, meanwhile the detailed chemistry mechanism based on SAGE solver is employed to capture the end-gas autoignition process. This work will give the valuable insights for the spark ignition gasoline engine to further improve the performance.
The remaining of the paper has the following structure: the experimental apparatus and procedure are presented in Section 2. In Section 3, the numerical settings including LES equations, combustion model, and other numerical models are comprehensively demonstrated. The validation of the present model and the general combustion phenomena are also provided here. Subsequently, the knock and super-knock combustion mechanism obtained through simulation are discussed in Section 4. Finally, a conclusion that summarizes our main findings is presented.

2. Experimental Setting

2.1. Experimental Apparatus

Experiments are conducted in a single-cylinder, four-stroke Ricardo E6 engine equipped with a direct-current dynamometer. The engine combustion chamber contains of an approximately plane piston and a pent-roof cylinder head. A Siemens VDO piezoelectric injector for a BMW vehicle is used for injection. Variable valve timing and lift is achieved by a hydraulically powered Variable Valve Actuation system. A wideband lambda sensor is used to measure equivalence ratio which has a resolution of 0.001 and uncertainty of ±0.8%. A Kistler 6118B pressure transducer and a Kistler 5018 charge amplifier are used to capture and amplify the in-cylinder pressure signals. The natural frequency is approximately 90 kHz. Pressure signals are measured by a combustion analyzer with resolution of 0.1 C A . A fuel consumption meter ranging from 0 kg/h to 5 kg/h with accuracy of ±0.2% is placed to measure fuel mass. The temperatures of lubricating oil and coolant are controlled by a SIEMENS PID controller with uncertainty of ±3 C A . A Toceil LFE060 flow meter is chosen for measuring the inlet mass flow rate with uncertainty of ±1%.

2.2. Experimental Procedure

A full load with engine speed of 1600 rpm is chosen to investigate knock in direct injection spark ignition (DISI) engines. The detailed operating conditions are shown in Table 1. The engine is firstly operated under general combustion conditions, and then its spark timing is advanced gradually until obvious pressure oscillation and a knocking sound can be observed. Results show that knock does not take place when the spark timing is 8, 10, 12 CAD bTDC while a slight knock can be observed when the spark timing is 14 CAD bTDC. With the further advance in spark timing, the knock grows stronger. At the condition of 18 CAD bTDC, the knock becomes strongly destructive as the knocking sound becomes grating. Figure 1 demonstrates the evolution of cylinder pressure and pressure oscillation filtered by a high-pass FFT filter. The high-pass filter with a cutoff 4 kHz is used to distinguishing the pressure oscillations from the original in-cylinder pressure signals. Here, the pressure value in general combustion condition is the average cylinder pressure of 200 consecutive cycles. For knock condition, the cylinder pressure is obtained at the max maximum amplitude of pressure oscillations (MAPO) cycle [44]. Along with the advance in spark timing, the maximum pressure increases gradually, until knock occurs. Further advance in spark timing will strengthen knock and increase the amplitude of pressure oscillation. When sparking advance timing is 18 CAD bTDC, the amplitude of pressure oscillation exceeds 0.5 MPa, which indicates a strong knock. And further advancing the spark timing will destroy the engine, thus the very strong knock or super-knock can’t be observed in this experiment.

3. Numerical Settings

3.1. Turbulent Combustion Model

In a spray-guided GDI engine, partially pre-mixed combustion may occur [45]. The G-equation-based turbulent combustion model [46] is usually applied for partially pre-mixed combustion with chemical kinetics. Based on the above considerations, a skeletal chemical kinetics mechanism of a primary reference fuel (PRF) with 48 species and 152 elementary reactions for isooctane and n-heptane [47] is used in this work. The G-equation-based turbulent combustion model is used supposing to calculate the average flame surface. Detailed transient chemistry solver (SAGE) [48] is applied to mimic fuel consumption after flame front and auto-ignition prior to flame front. The flame front is defined as the boundary where G is −0.001. The average flame surface where G is 0 divides the combustion chamber into unburnt region (G < 0) and burnt region after the average flame surface (G > 0). The G-equation is [49]:
G   ̃ / t + v f ˜ v   _ v e r t e x · G ˜ = ρ u ¯ ρ ¯ s t   G   ̃   D t k ˜ M G ˜
Here G ˜ is Favre-averaged G. v f ˜ is the Favre mean bulk fluid velocity in the flame front.   v v e r t e x is the mesh vertex velocity.   ρ u ¯ is unburned mixture density. ρ ¯ is the mean gas density of turbulent flame.   D t is turbulent diffusivity. k ˜ M is mean flame curvature. s t   represents turbulent flame speed.
s t   is the function of laminar flame speed ( s l   ) and Damköhler number. It is expressed as follows [49]:
s t   = s l   + v a 4 b 3 2 2 b 1 D a + a 4 b 3 2 2 b 1 D a 2 + a 4 b 3 2 D a 1 2
where v is turbulence intensity. Other parameters such as a4, b1 and b3 are constants derived from turbulence model. D a is the Damköhler number, which establishes the relationship between chemical kinetic and flame development.
To mimic the laminar flame speed, Metghalchi and Kech correlation [50] is adopted in this study:
s l = s l r e f T u T u , r e f α P P r e f β 1 2.1 Y d i l
T u is the unburnt mixture temperature, T u , r e f equals to 298.0 K. P is the unburnt mixture pressure, P r e f is 1.01 bar. Y d i l is the mass fraction of the dilution species. α and β are the exponent for temperature and pressure:
α = 2.18 0.8 ϕ 1
β = 0.16 0.22 ϕ 1
s l r e f is obtained by the Gülder correlations [51]:
s l _ r e f = ω ϕ η e x p ξ ϕ σ 2
Here, ω , η , ξ and σ are modeling constant coefficients for isooctane/air mixture.

3.2. Numerical Models

The 3D methodology of LES coupled with G-equation and a chemical kinetic model for primary reference fuel (PRF) oxidation in CONVERGE CFD code is applied for the simulation performed in this study. Here, the large eddy simulation coupled with one equation viscosity model [52,53] is adapted to simulate the turbulence. The KH-RT breakup length model [54] that includes Kelvin-Helmholtz instability and Rayleigh-Taylor instability mechanisms is utilized to predict the breakup of fuel droplets. The wall heat transfer process is modeled by the O’Rourke and Amsden model [55]. The geometry model which consists of a combustion chamber, an inlet port and an outlet port together with its grid splitting can be found from Figure 2. The simulation starts at −440 CAD aTDC, with a duration of the whole working cycle. The base grid size is 1 mm, with a fix embedding around spark plug and spray to meet mesh resolution requirement. Furthermore, adaptive mesh refinement (AMR) is adopted in spray and reaction region. During combustion, the average cell size in flame front is of the order of 0.5 mm. The number in spray and spark plug region during injection process and ignition process is 0.25 mm and 0.125 mm, respectively. A maximum cell number of 4 million is achieved. Note that the present grid resolution is able to predict the super-knock occurrence according previous work [32]. The time step adjusts itself according to the CFL number and convection speed, varying from 1 × 10 8 s to 1 × 10 6 s. The simulations are performed at Tianhe Super-computer Platform and the computational cost of the knock case is on the order of 5 days. Twelve monitor points are allocated evenly around the combustion chamber to capture pressure oscillation. Owing to the stochastic nature of knock, the cycle-to-cycle variation in knock condition exists, so the mean cylinder pressure and mean heat release rate of 200 cycles in general combustion condition are chosen to validate the model. In this work, we only focus on the knock mechanism, thus, the effect of cycle-to-cycle variations is neglected.

3.3. Model Validations

Figure 3 describes the numerical and experimental results of cylinder pressure and Heat Release Rate (HRR) at −10 CAD as a reference. It should be seen that combustion progress at spark timings vary from −8 to −12 show similar results. As can be seen, the predicted pressure profile agrees with the experimental results well. In this spark timing, knocking combustion is neither identified by experiment nor by LES. Advancing the spark timing to −18 CAD TDC is used to further validate the model in knock conditions as shown in Figure 4. The numerical result denoted by red lines is seen to be correctly distributed from the bottom to the top of the experiment envelop, and the amplitude of pressure oscillation is similar to experimental results, too. LES very well captures the knocking combustion phenomenon. Those results provide favorable evidence that the present model is able to simulate knock in engines.
Limited by the structure strength of engine, the maximum spark advance angle is −18 CAD in experiment, the MAPO, however, is below 1 MPa, which corresponds to conventional knock as a reference. While in simulations, the spark advance angle can be further increased to investigate strong knock or even super-knock by LES method. In present work, the knock progress at the spark timing of −20, −22, −24, −26, −28 CAD is investigated. These conditions are defined as ST-20, ST-22, ST-24, ST-26 and ST-28, while the elementary case is ST-18.

3.4. General Combustion Phenomena Using LES

The evolution of pressure and filtered pressure oscillation is demonstrated in Figure 5. Figure 6 shows the MAPO and onset of auto-ignition which is obtained from the 3-D simulation results under different spark timings. From ST-18 to ST-24, the knock grows stronger with earlier onset and higher amplitude as spark timing advances, the MAPO, however, is still lower than 5 MPa, which indicates the low intensity of knock. At ST-26 and ST-28, the peak pressure and amplitude of pressure oscillation increase steeply, reaching a value of 30 MPa and 25 MPa, respectively. Obviously, super-knock occurs in these cases.
Figure 7 demonstrates the evolution of HRR and burned mass fraction (BMF) under different spark timings. The curves of HRR exhibit a bimodal shape between ST-18 and ST-24. Besides, the advance in spark timing will advance the appearance of peak pressure and increase its value while shorten the duration of heat release. The bimodal shape of HRR indicates that the end gas is not completely consumed by the first auto-ignition. The first auto-ignition decays into a deflagration, after which a new auto-ignition occurs between the main flame and deflagration, causing the second rising in heat release rate. At −26 CAD and −28 CAD, an obviously unimodal shape of HRR is observed, with a much higher peak value. The BFM increases steeply, and 25% of mixture is consumed during 1 CAD. These results reveal that the auto-ignition occurs sequentially in an extremely short time. Similar results can be concluded in 3D results. Though distinct differences can be found in cylinder pressure and HRR between conventional knock and super-knock, the BMF denoted by pentagrams in Figure 7 is similar under different spark timings when auto-ignition occurs. Thus, it can be drawn that the knock intensity does not depend on the mass fraction of unburned mixture when AI takes place, but its thermodynamic conditions. The onset of AI gets closer to TDC as spark timing advances, which will bring out higher cylinder pressure and temperature. As a result, the heat release of end-gas is more violent at the auto-ignition process, producing higher local pressure increase, which externalizes a stronger knock. As pointed out in [41], the knock intensity is related to the fuel mass percentage consumed by AI and pressure wave intensity is proportional to the fuel mas burned by AI, however, in this process the thermodynamics conditions as well as pressure wave also play important roles observed in this work. To further investigate the combustion mechanisms of conventional knock and super-knock in cylinder, ST-18, ST-22, ST-26 and ST-28 are analyzed.

4. Results and Discussion

4.1. Knock Combustion Mechanism

In ST-18, ST-20, ST-22 and ST-24, the knock intensity increases as spark timing advances, however, all of them belong to knock due to their relatively low cylinder pressure and HRR. Thus, ST-18 and ST-22 are chosen as the example case to analyze the in-cylinder combustion process of conventional knocks with different intensity.

4.1.1. Combustion Progress in ST-18

Figure 8 shows the 3D evolution of in-cylinder combustion process of ST-18. Here, the isosurface for G = 0 denoted by the red surface represents the flame front induced by spark ignition [49]. The onset of auto-ignition is localized by an isosurface of HCO with a mass fraction of 3.0 ppm [24] and the isosurface where the unburned temperature is 1600 K represents the flame front induced by auto-ignition. Reference [24] experimentally revealed that the HCO radical is strongly correlated to the occurrence of auto-ignition while the high temperature burned region can be modeled by OH. The distribution pattern of pressure fluctuation (ΔP) in the horizontal cross-section which is the value of the differential between the local pressure and the average pressure in cylinder is demonstrated. Three distinct different combustion stages, including main flame propagation, first auto-ignition propagation and second auto-ignition can be found. The deflagration ignited by spark spreads outwardly from the spark plug, with a relatively low heat release as a result of the low flame propagation velocity. The local pressure increase caused by the combustion at the flame front is balanced immediately, thus, no local pressure differential is caused in the first stage. The temperature and pressure of end gas rise continuously under the compression and preheating of burned gas induced by the main flame propagation. Owing to the inhomogeneity in temperature and species distribution, an auto-ignition occurs at hot spot. In ST-18, the auto-ignition occurs near the cylinder wall at 12.1 CAD, with lots of HCO radicals produced by low temperature reactions being accumulated. As the temperature increases, HCO radicals are consumed quickly, forming a stable flame front spread outwardly. The AI induces much higher HRR compared to main flame, causing a steeply increase in local pressure, which ultimately result in the generation of pressure wave. Note that in the present discussion, the AI 1 and AI 2 do not represent the only two autoignition points, but similar auto-ignition points in temporal and spatial evolution approximately are regarded as one auto-ignition point. For example, in the first auto-ignition, a new auto-ignition kernel appears at 12.4 CAD. However, the new AI kernel is so close to the initial auto-ignition flame front that they couple with each other immediately, forming a new flame front (see 12.7 CAD and 13 CAD). Sequential auto-ignitions do not appear around the first auto-ignition owing to the insufficient thermodynamic state, instead, it turns into a deflagration flame. The newly generated flame as well as the main flame compresses the unburned mixture, leading to a huge increase in local temperature and pressure, which triggers the second auto-ignition. The second auto-ignition has a higher intensity compared to the first one owing to the fact that the second auto-ignition occurs in a mixture with higher temperature and pressure. Mixtures around it are consumed in a short time (from 14.1 CAD to 14.5 CAD), causing a sharp heat release, which generates strong pressure waves. Those pressure waves propagate back and forth, leading to the pressure oscillation.
Figure 9 demonstrates the distribution of pressure fluctuation, mass friction of HCO and unburned temperature in the horizontal cross-section under different time. The purple line represents the contour of G = 0, which is utilized to locate the main flame. Similar to it, the auto-ignition flame front is localized by an isoline (black line) of HCO with a mass fraction of 3.0 ppm. High HCO concentration region indicates the strong intensity of low temperature reaction of autoignition. It can be seen that, after the initial autoignition kernel formation, HCO is mainly generated in a very thin area near the auto-ignition flame front, which can be used to identify the location of auto-ignition flame front. As can be clearly seen from the diagram, two auto-ignitions take place one by one at 12.1 CAD and 14.1 CAD, respectively. The first auto-ignition occurs near the cylinder wall, while the second auto-ignition occurs ahead of the flame front. This result confirms the stochastic nature of auto-ignition, which is consistent with the optical results in experimental work. It is noted that in this condition, sequential auto-ignitions do not occur after the initial flame kernel is formed, so the pressure wave propagates away from the auto-ignition point. As a result, no coupling between flame front and pressure wave is formed.

4.1.2. Combustion Progress at ST-22

Figure 10 demonstrates the combustion progress at ST = −22 CAD. The result shows that at 8.5 CAD, the first auto-ignition takes place, slightly earlier than at ST = −18 CAD, the location where the auto-ignition occurs, however, remains the same. The flame induced by auto-ignition at ST-22 propagates faster than at ST-18 due to the higher thermodynamics of unburned mixture when auto-ignition occurs. Moreover, ST-22 has shorter interval between two auto-ignitions. The second auto-ignition takes place at 10 CAD in the same position as ST-18 with faster propagating velocity, inducing stronger pressure oscillations. It can be seen from Figure 11 that the distribution area of HCO in unburned mixture for ST-22 is larger than that for ST-18, which means more unburned mixture are involved into auto-ignition, bringing a much more intense heat release. Two pressure waves generated by the first and the second auto-ignition respectively can be clearly observed from the distribution pattern of ΔP. These two pressure waves propagate perpendicularly without superposition or coupling, which can’t cause the strong knock intensity.
To further investigate the coupling between flame and pressure wave, the pressure, temperature and mass fraction of HCO are extracted from a circular path which passes through the AI point. Details of the tracing method can be found in Figure 12. The two black curves shown in the figure are two concentric circles of 3 mm (curve 1) and 8 mm (curve 2) away from the cylinder wall, which pass through the two auto-ignition points as shown in Figure 12, respectively. Basically, the main flame propagates outwardly from the spark plug, and the unburned mixture is distributed between cylinder wall and main flame. Hence, it is reasonable to conclude that the direction of auto-ignition flame propagation is basically consistent with the direction of circular path.
Figure 13 shows the evolution of 2D configuration of ΔP in the horizontal cross-section (left), pressure, unburned temperature and mass fraction of HCO on the 1D profile (middle) and 2D configuration of unburned temperature in the horizontal cross-section (right) under the condition of ST-22. HCO as the cause of autoignition in the end gas is employed at the onset of knocking. The temperature and pressure of AI point increase immediately after the auto-ignition that occurs at 8.5 CAD, while at the same time, HCO production occurs by low temperature reactions near the auto-ignition flame front. The first auto-ignition core quickly evolves into a propagating flame, with a velocity lower than the velocity of pressure wave. The pressure wave is ahead of the flame. At 10 CAD, the second auto-ignition occurs between the main flame and the first AI flame. No flame propagation from the latter auto-ignition is observed because of multi-point autoignition and thermal explosion. As the most of unburned mixture is consumed by the flame induced by first auto-ignition, consequently the unburned mixture consumed by the occurrence of the second AI is small, which leads to a small pressure rise of about 1 MPa. Besides, it can be seen from the one-dimensional diagram that no coupling between flame front and pressure wave appears at any instant, thus the flame propagation is only normal auto-ignition and deflagration propagation. As a result, it is evident that the deflagration to detonation transition does not occur here.

4.2. Super-Knock Combustion Mechanism

Super-knock appears at ST-26 and ST-28, as their MAPOs exceed 25 MPa, which are far away from other spark timings. Therefore, ST-26 is taken as an example to analyze the combustion mechanism of super-knock. Figure 14 demonstrates the 3D evolution of in-cylinder combustion process at ST-26. Different from ST-18 and ST-22, only one auto-ignition point takes place at 3.2 CAD. The flame induced by auto-ignition propagates at a fast speed due to the high thermodynamics near the TDC, consequently, it sweeps the position where the second auto-ignition is supposed to occur even before the second auto-ignition occurs, leading to the absence of second auto-ignition. On the contrary, the flame in the left side of auto-ignition propagates at a slow speed. As a result, there are still mixtures remains unconsumed at 3.9 CAD. Meanwhile, a small auto-ignition occurs near the exhaust valve. Limited by the insufficient unburned mixture, the pressure rise induced by this auto-ignition is negligible, thus which is not discussed in detail in present work.
An obvious pressure wave in flame front can be seen from the distribution of pressure fluctuation during 3.6 to 3.8 CAD bTDC in Figure 15. In addition, the position of pressure wave is well consistent with the flame front induced by auto-ignition that is marked by YHCO = 3 ppm, indicating the pressure wave and auto-ignition flame front are coupled and propagate with same velocity forwards to unburned mixture region. As a result, the coupling increases the local pressure dramatically and lowers the ignition delay time of local unburnt mixture, which attributes to the quick auto-ignition occurrence and release a lot of heat, and in turn maintains the propagation of pressure wave. A positive feedback is thus formed. The propagation velocity of auto-ignition flame from 3.6 CAD to 3.8 CAD is 1.7 Km/s, which is much larger than the value of local acoustic speed 650 m/s. The max pressure in the flame front is 30 MPa. The C-J detonation velocity is [32]:
D C J = 2 γ 2 1 Q
and the C-J pressure of burned mixture is:
P C J ρ 0 D C J 2 γ + 1
where Q , γ, ρ 0 are the heat release amount of unit mass of mixture, the adiabatic exponent, the density of local unburned mixture. Specifically, γ = 1.4 , ρ 0 = 20 kg/m3, and the low heating value of gasoline is 44 MJ/kg. Results calculated by Equation (7) and Equation (8) show that the detonation velocity is 2.3 km/s and the detonation pressure is 44 MPa. It is noted that the Chapman-Jouguet theory is based on one-dimensional idealized mode, while the investigation in this work is conducted in 3D models. Though the propagation velocity of flame and the maximum pressure are lower than the CJ velocity and the CJ pressure, considering the difference between 1D and 3D, especially that they have same order of magnitude, it is reasonable to draw the conclusion that DDT occurs in present condition.
To further validate the coupling between flame and pressure wave, a similar method is adopted to extract the pressure, temperature and mass fraction of HCO as shown in Figure 12. The detailed method can be found in Section 4.1. Figure 16 shows the evolution of 2D configuration of ΔP in the horizontal cross-section (left), pressure, unburned temperature and mass fraction of HCO on the 1D profile (middle) and 2D configuration of unburned temperature in the horizontal cross-section (right) under the condition of ST-26. It can be seen from the 1D profile that pressure wave induced by the increase of local pressure appears at 3.2 CAD when the first auto-ignition occurs. However, the maximum pressure here is only 6.8 MPa, with a maximum pressure differential of 0.8 MPa. The dashed red line in the 2D configuration of ΔP represents the initial pressure wave positions at different timings. During 3.2 CAD to 3.4 CAD, the right side of flame propagates outwardly with about 490 m/s, which is lower than that local sound speed. Thus, the autoignition induces a deflagration flame. As the pressure wave effects on the local thermodynamics, the ignition delay time of unburned mixture ahead of auto-ignition flame shortens.
Consequently, auto-ignition flame propagation velocity increases, which will generate new pressure wave. At 3.4 CAD bTDC, the maximum pressure value at right side of flame front achieves 8.5 MPa. The new pressure wave has a faster velocity than previous one due to local high thermodynamics. As the new pressure wave catches up the previous one, a strong pressure wave called shock wave forms. Thus, following the increase of flame propagation velocity, the transition of the autoignition modes is completed from the subsonic combustion to supersonic combustion. During 3.4 to 3.6 CAD bTDC, the flame front velocity achieves 1.16 km/s. The distance between flame front and pressure wave gradually decreases and finally the coupling between flame front and pressure wave with a maximum pressure of 30 MPa is observed. At this time, a detonation wave right in the flame front can be observed. As a consequence HCO decreased quickly and high temperature reaction became the predominant species in the combustion chamber, which is consistent with the optical experiment [24]. From 3.6 CAD to 3.8 CAD, the detonation propagates towards right at a speed of about 1.7 km/s, until the unburned mixture is exhausted. Thus, from 3.2 CAD to 3.8 CAD, the flame propagation completes the combustion mode transition from sequential auto-ignition to detonation combustion.
In fact, the maximum spark advancing angle in practical engines is −18 CAD, while in simulation, the value can be advanced to −26 CAD and −28 CAD in order to investigate super-knock, which, basically, is equivalent to the pre-ignition phenomenon in engines [17]. Therefore, the combustion process in this condition is equivalent to the super-knock caused by the end-gas detonation.

5. Conclusions

In present work, multidimensional LES simulations are employed to capture the different combustion modes in a downsized spark ignition gasoline engine. A G-equation turbulent combustion model is employed to track the turbulent flame front and SAGE coupled with detailed chemistry mechanism is used to capture end-gas autoignition near the wall. Here, the knock intensity and combustion mechanism under six spark timings are carefully investigated by experiment and LES. The results are concluded as follows:
(1)
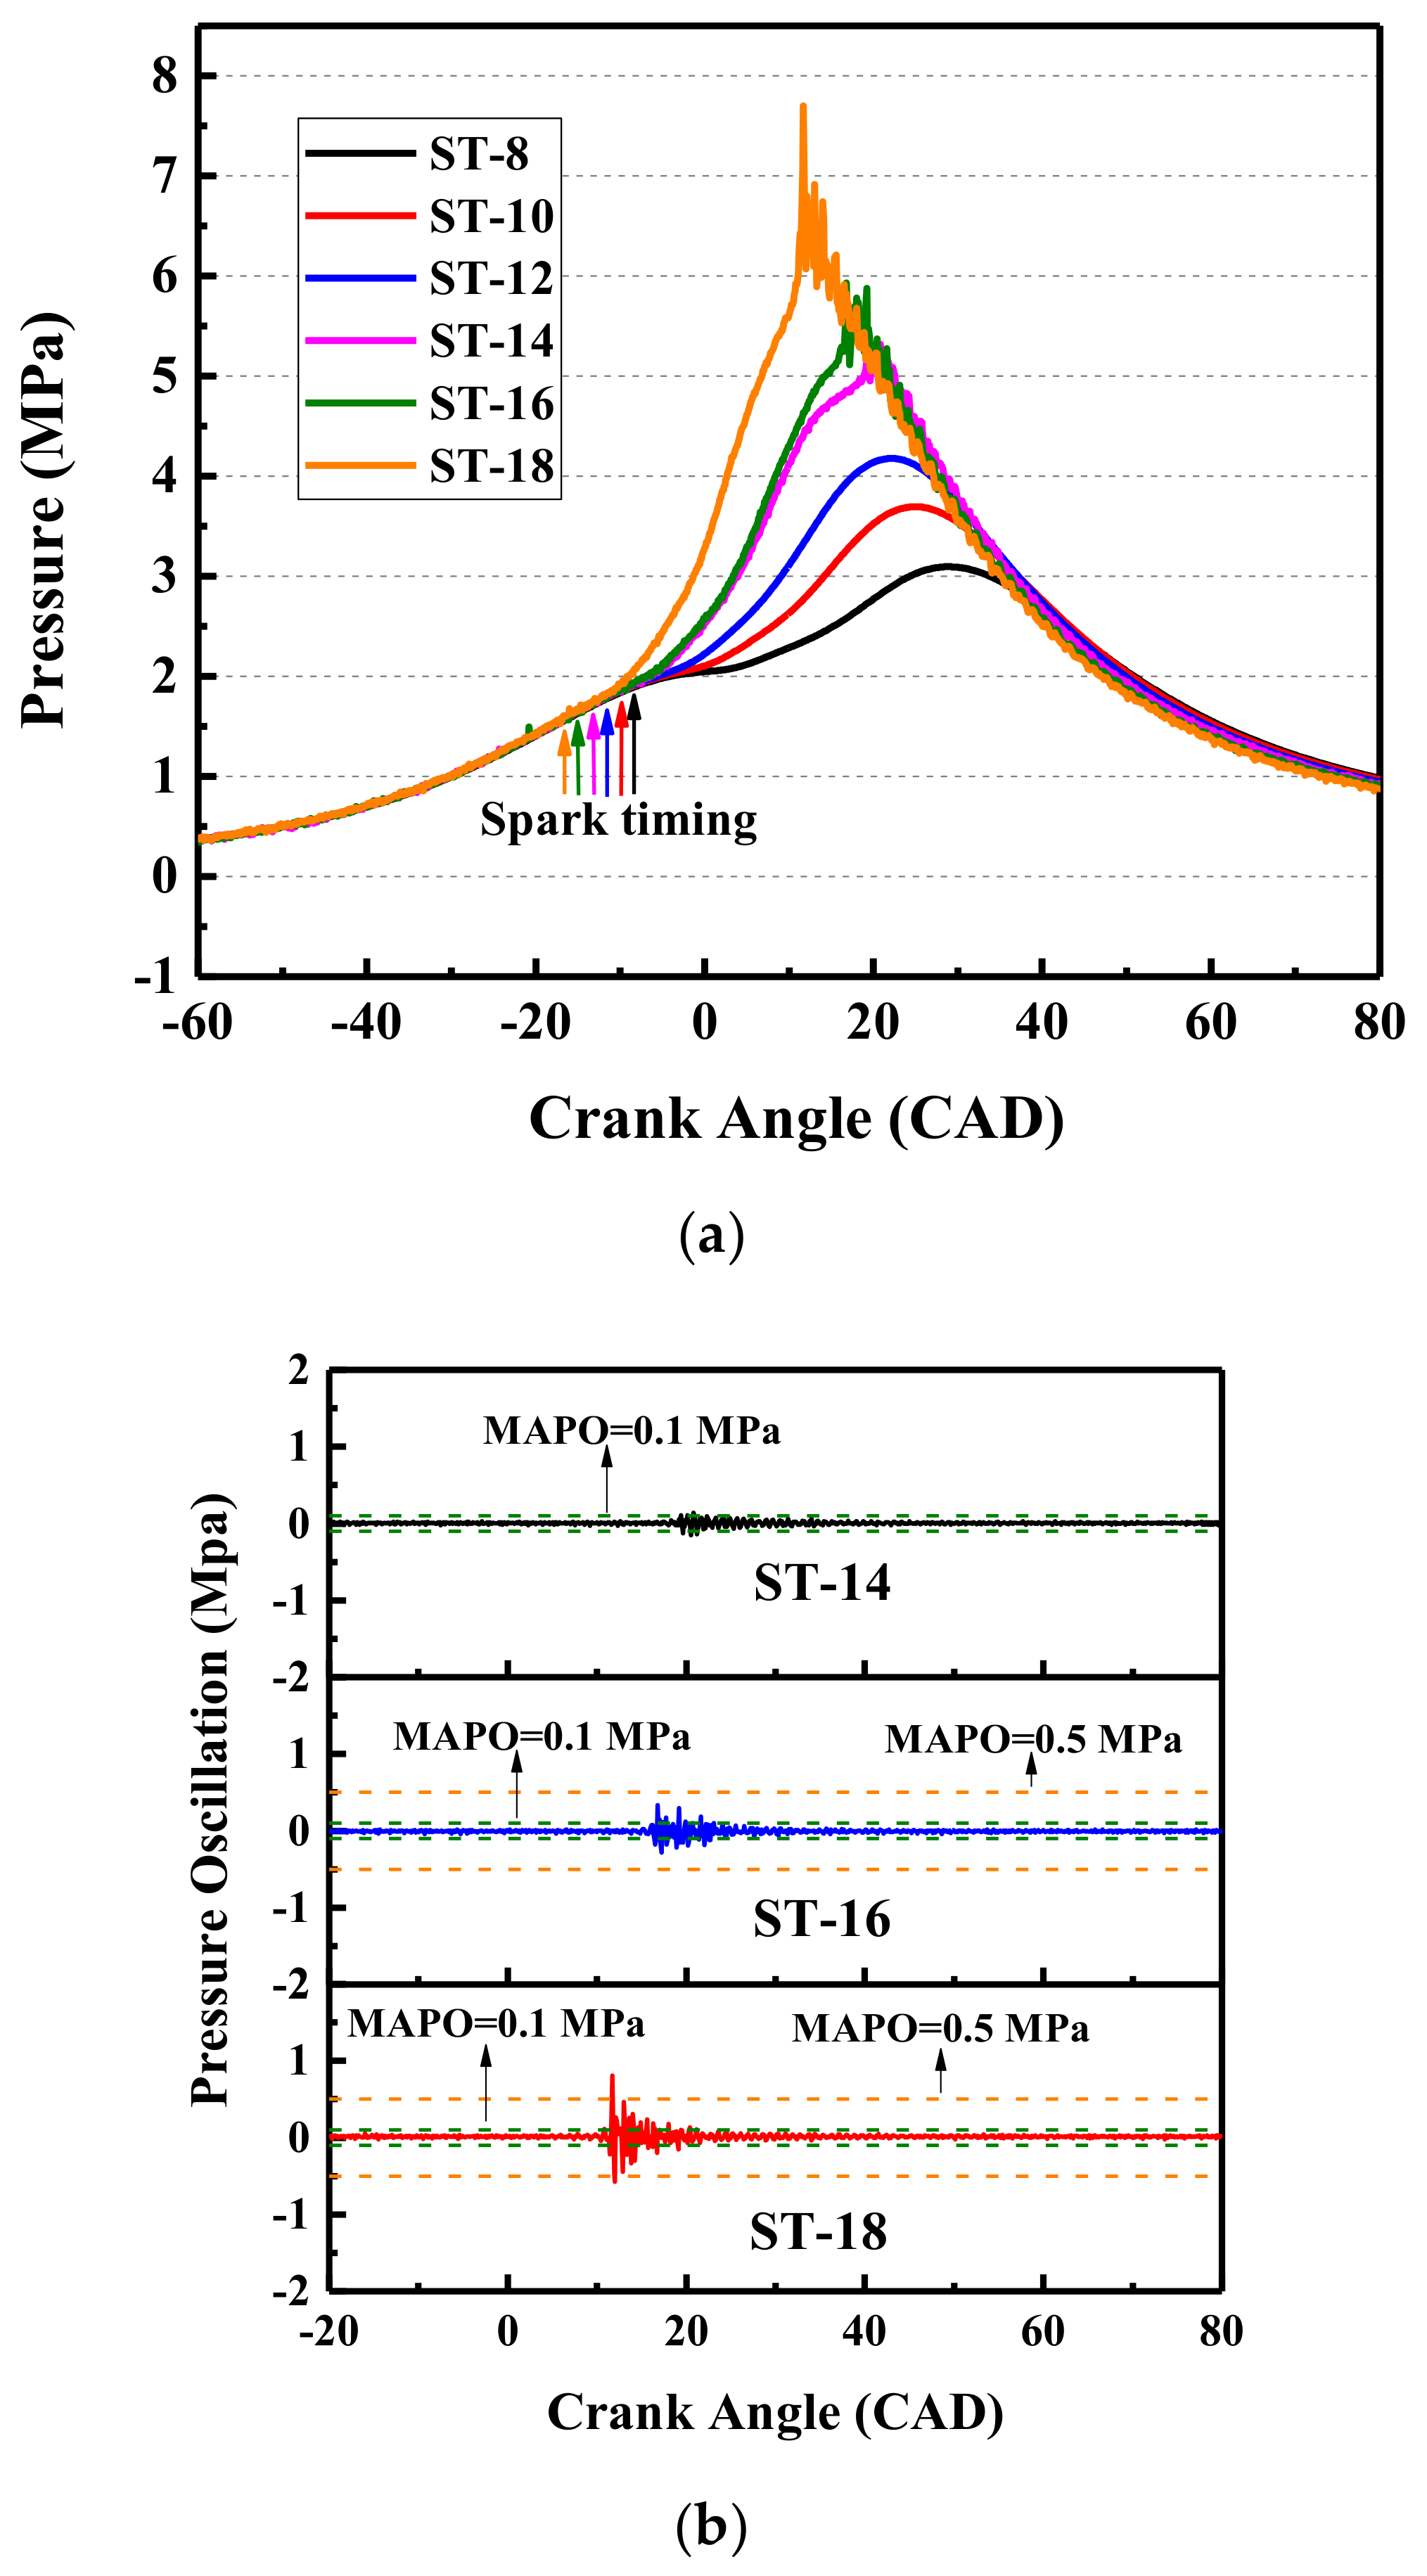
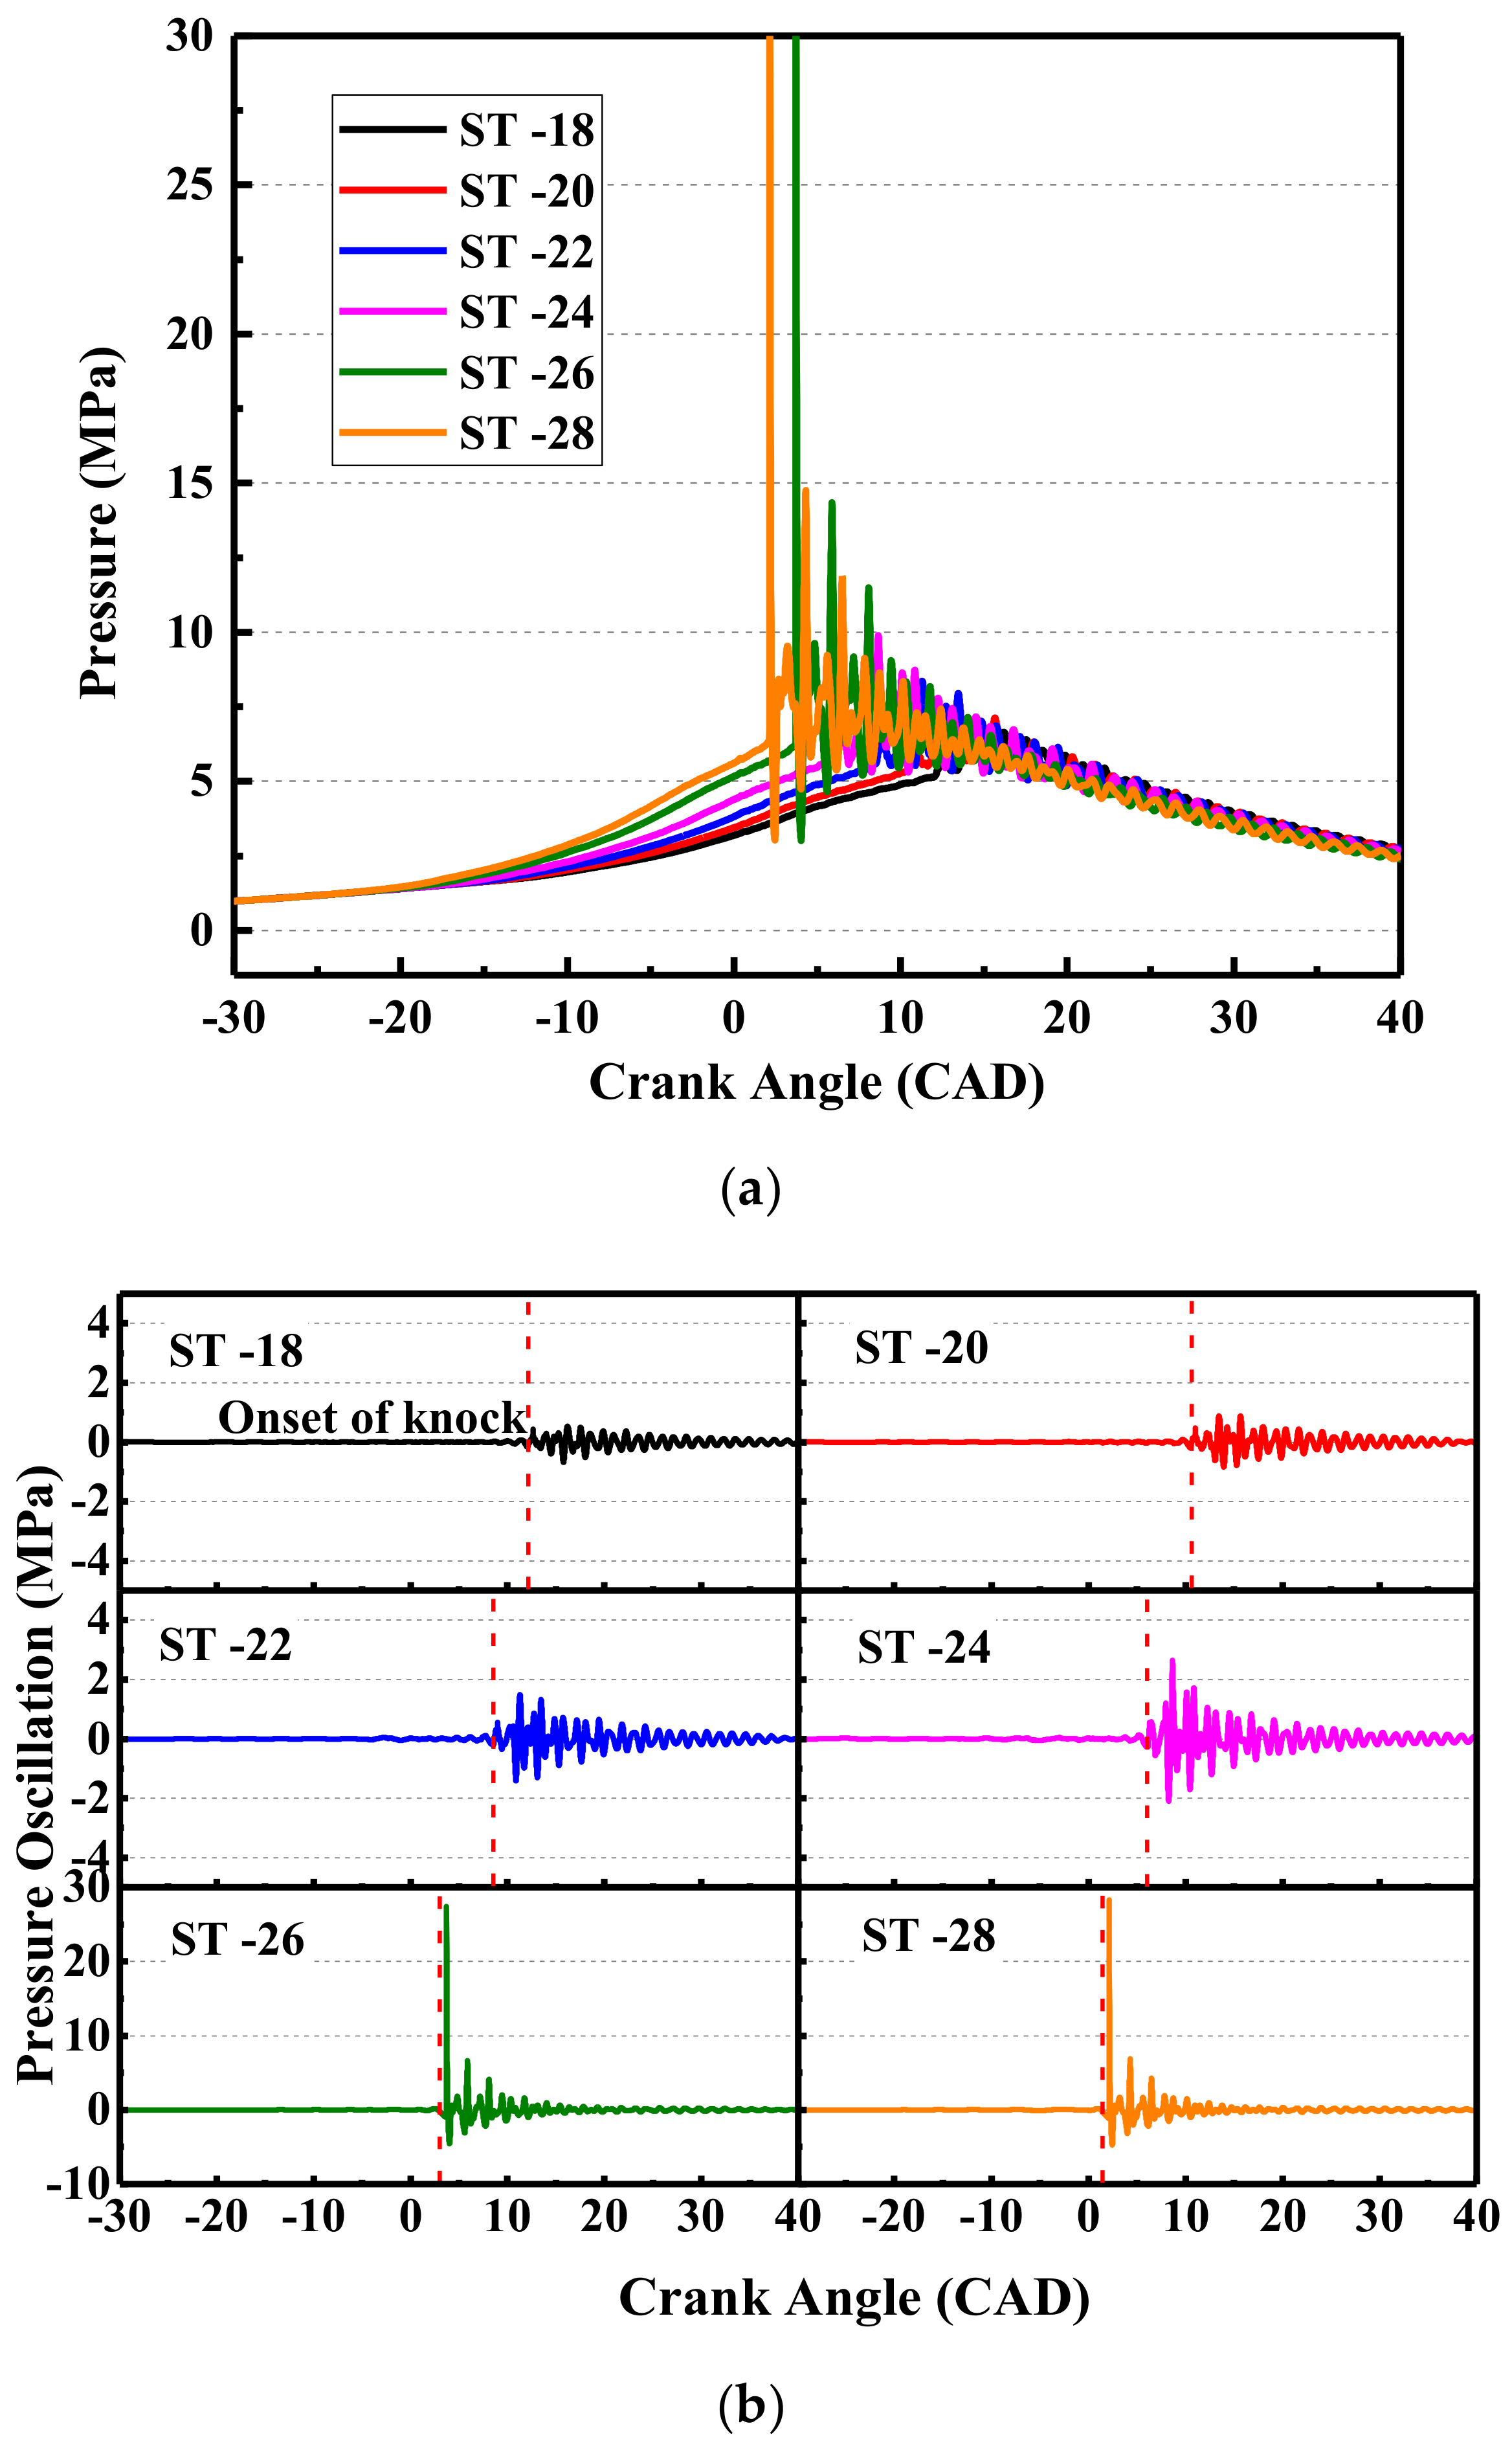
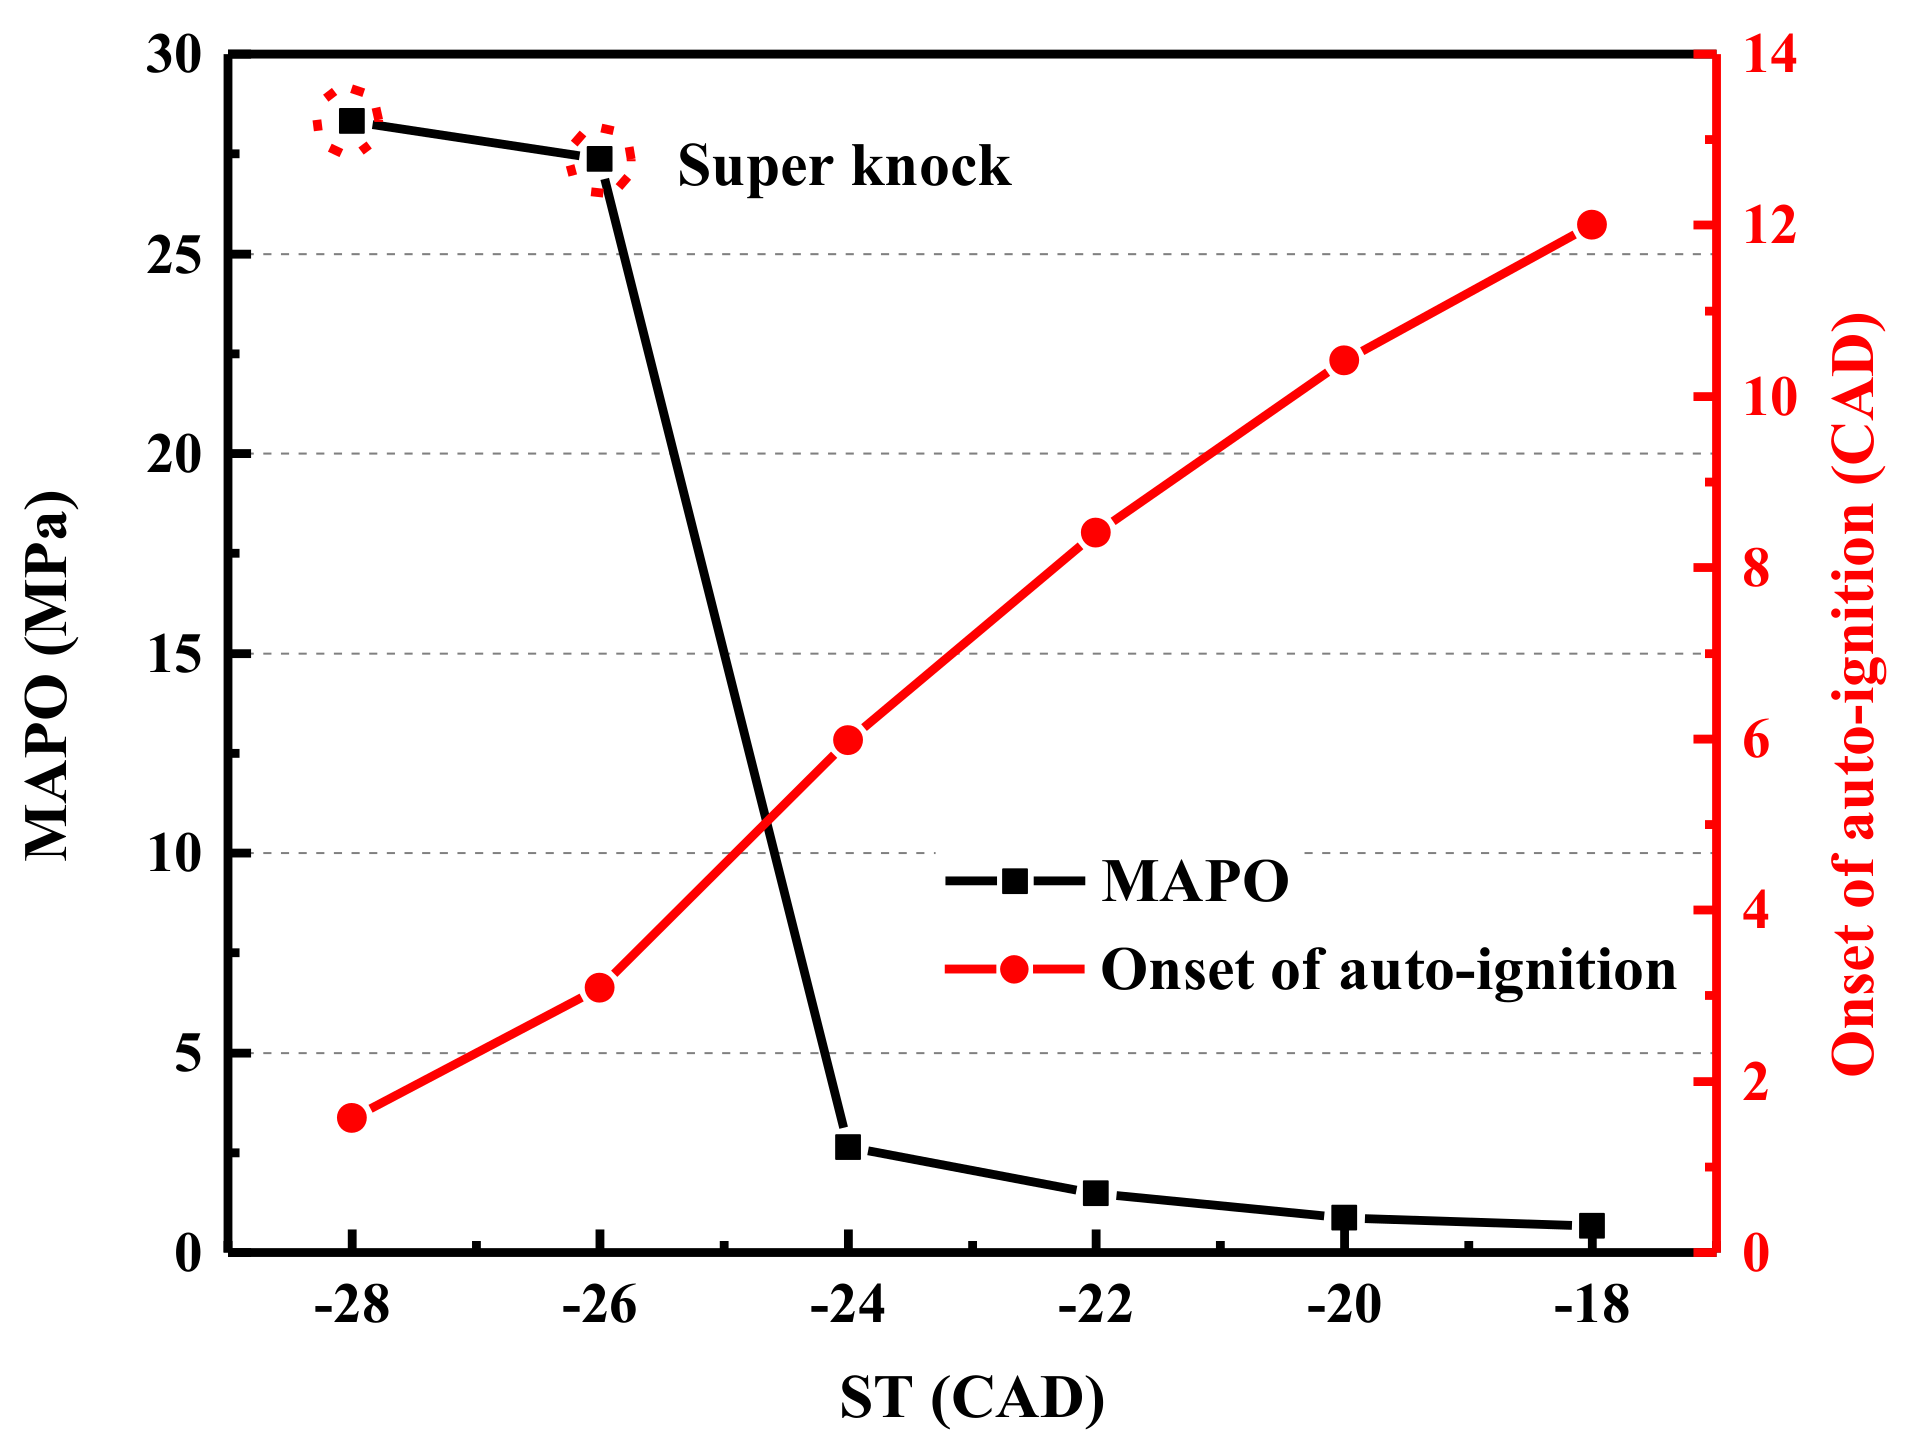
Along with the advance of spark timing, the pressure oscillation starts earlier with higher amplitude, and a transition from knock to super-knock appears. The super-knock is observed in ST-26 and ST-28, in which the peak pressure exceeds 30 MPa. Though the intensity of knock increases, the mass fraction of unburned mixture when AI occurs under different spark timings is similar. However, as the spark timing advances, the flame propagates faster. As a result, the combustion and onset of autoignition is more likely to occur at TDC, which brings end gas a higher temperature and pressure. It is reasonable to conclude that knock intensity is not only proportional to the mass fraction of mixtures burned by AI but the thermodynamics of it instead.
(2)
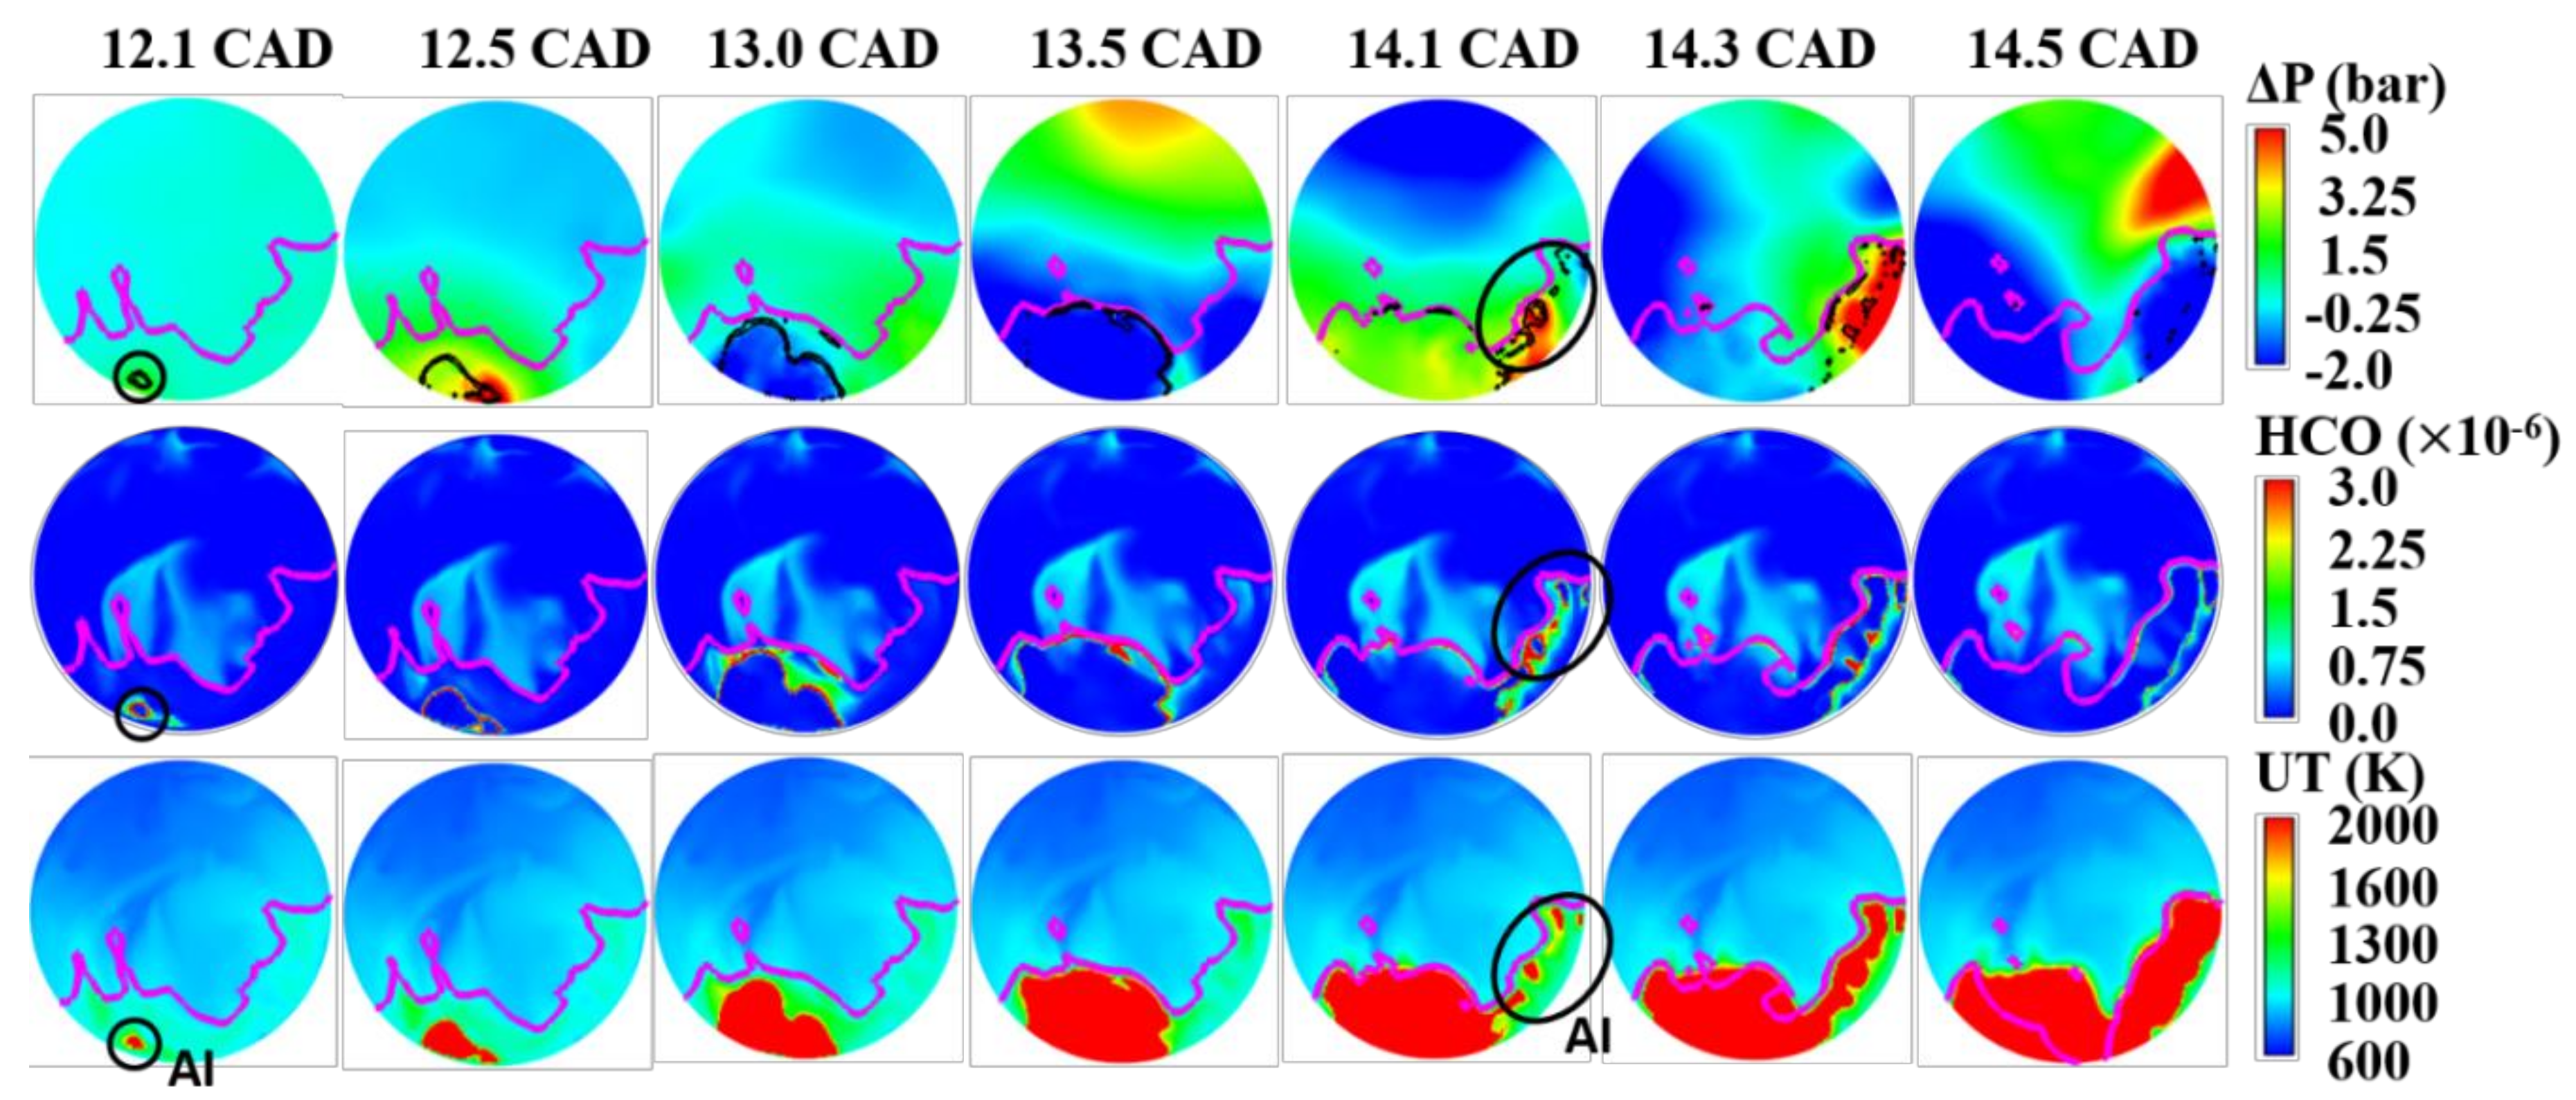
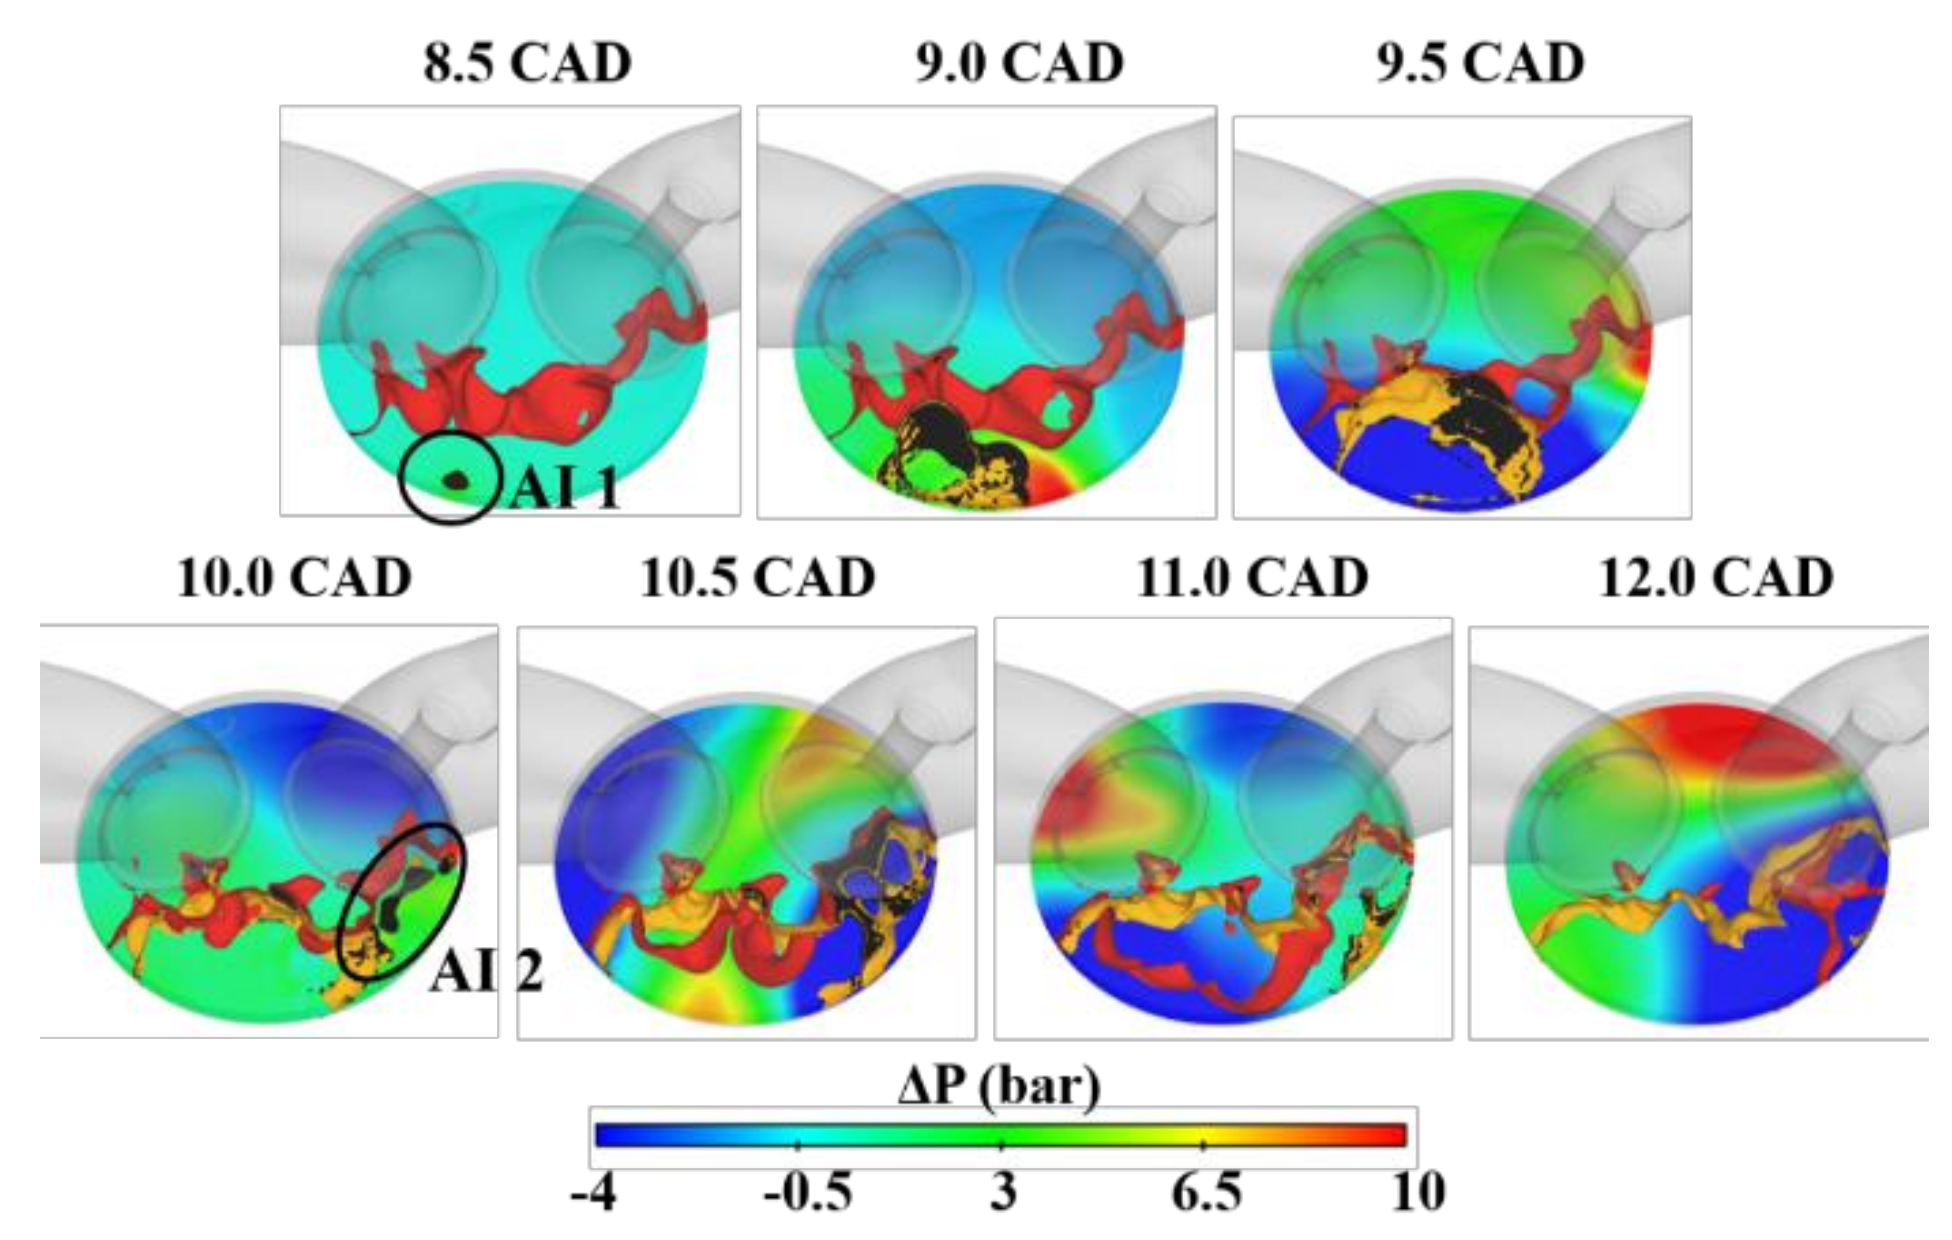
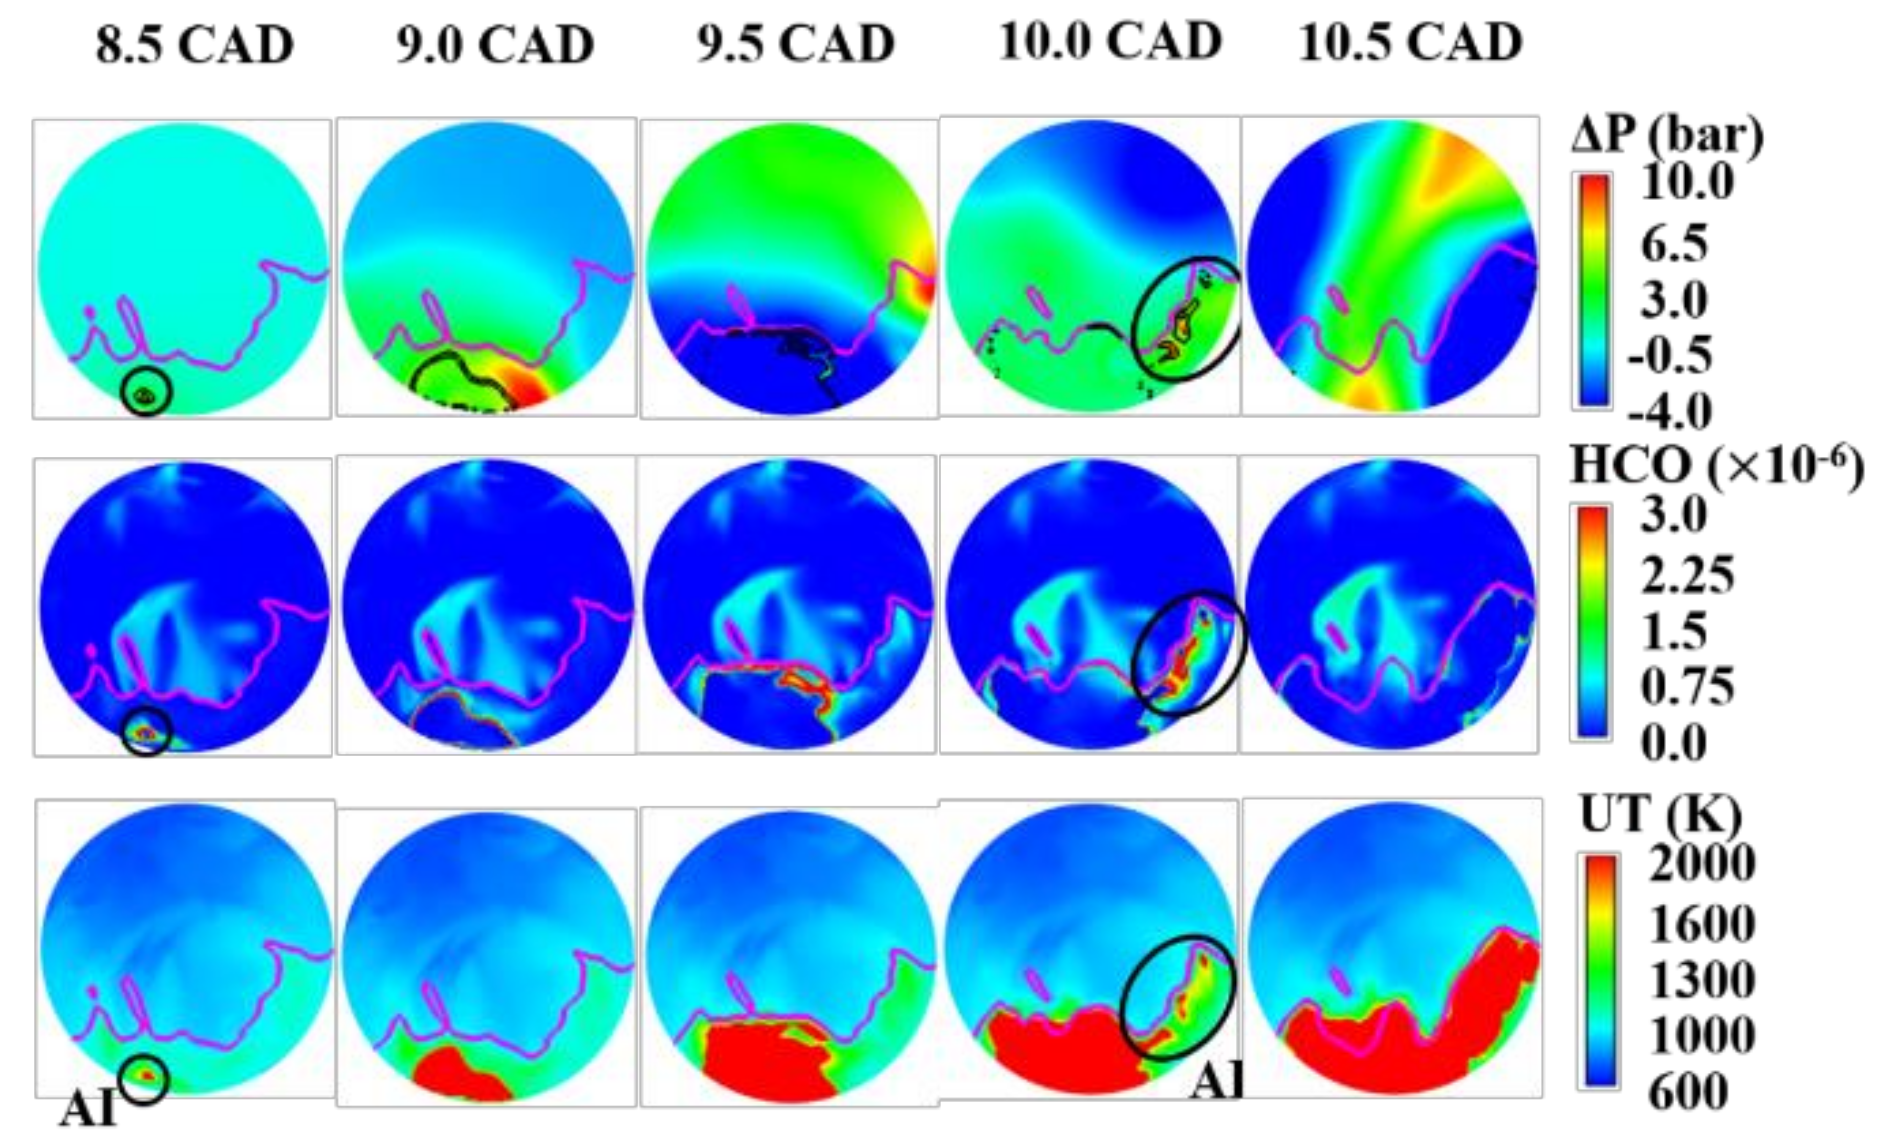
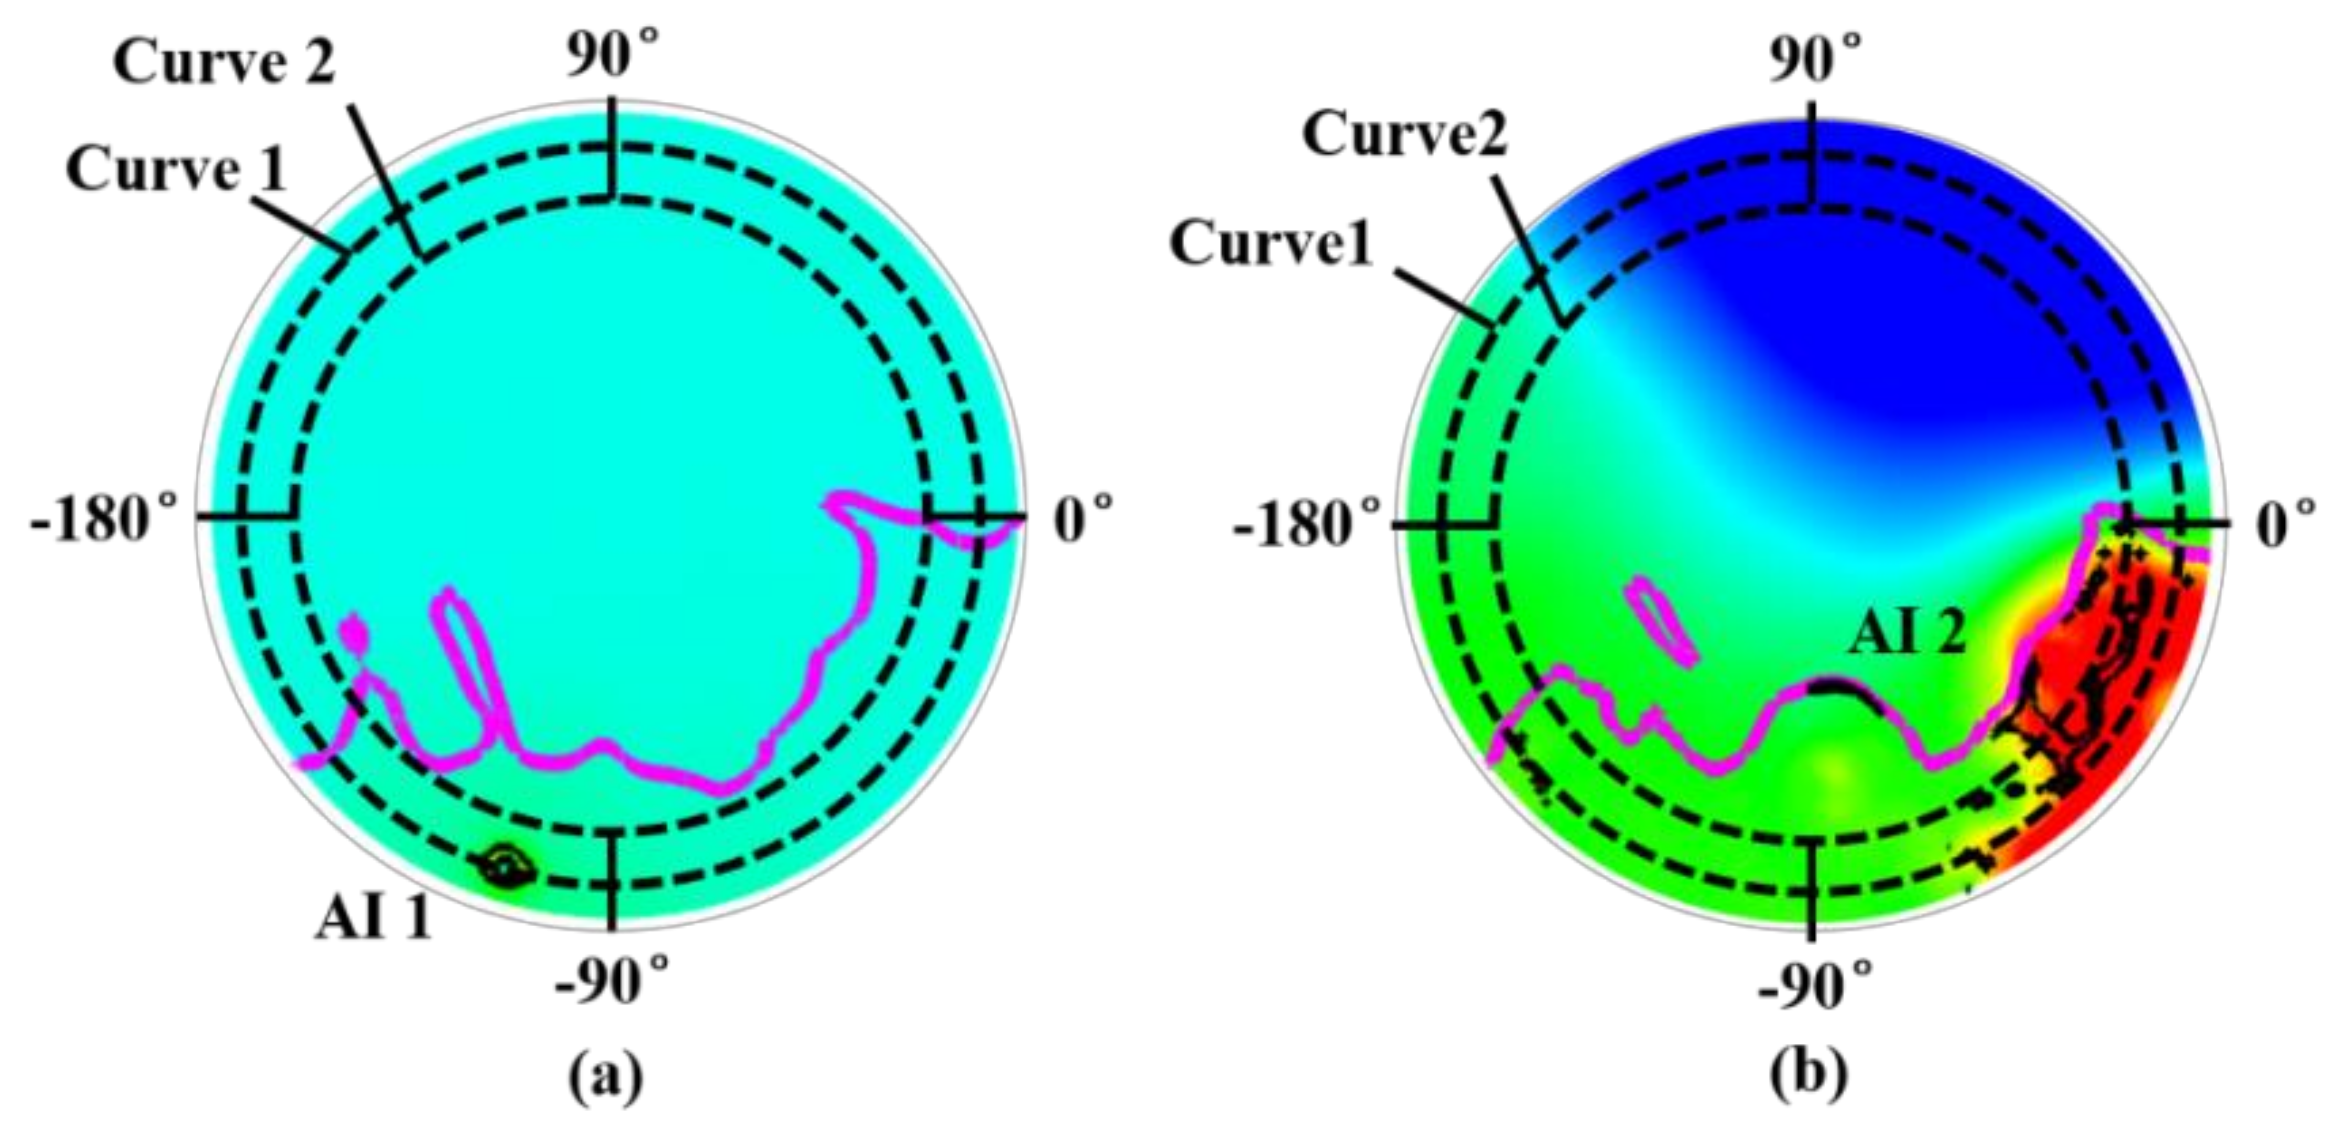
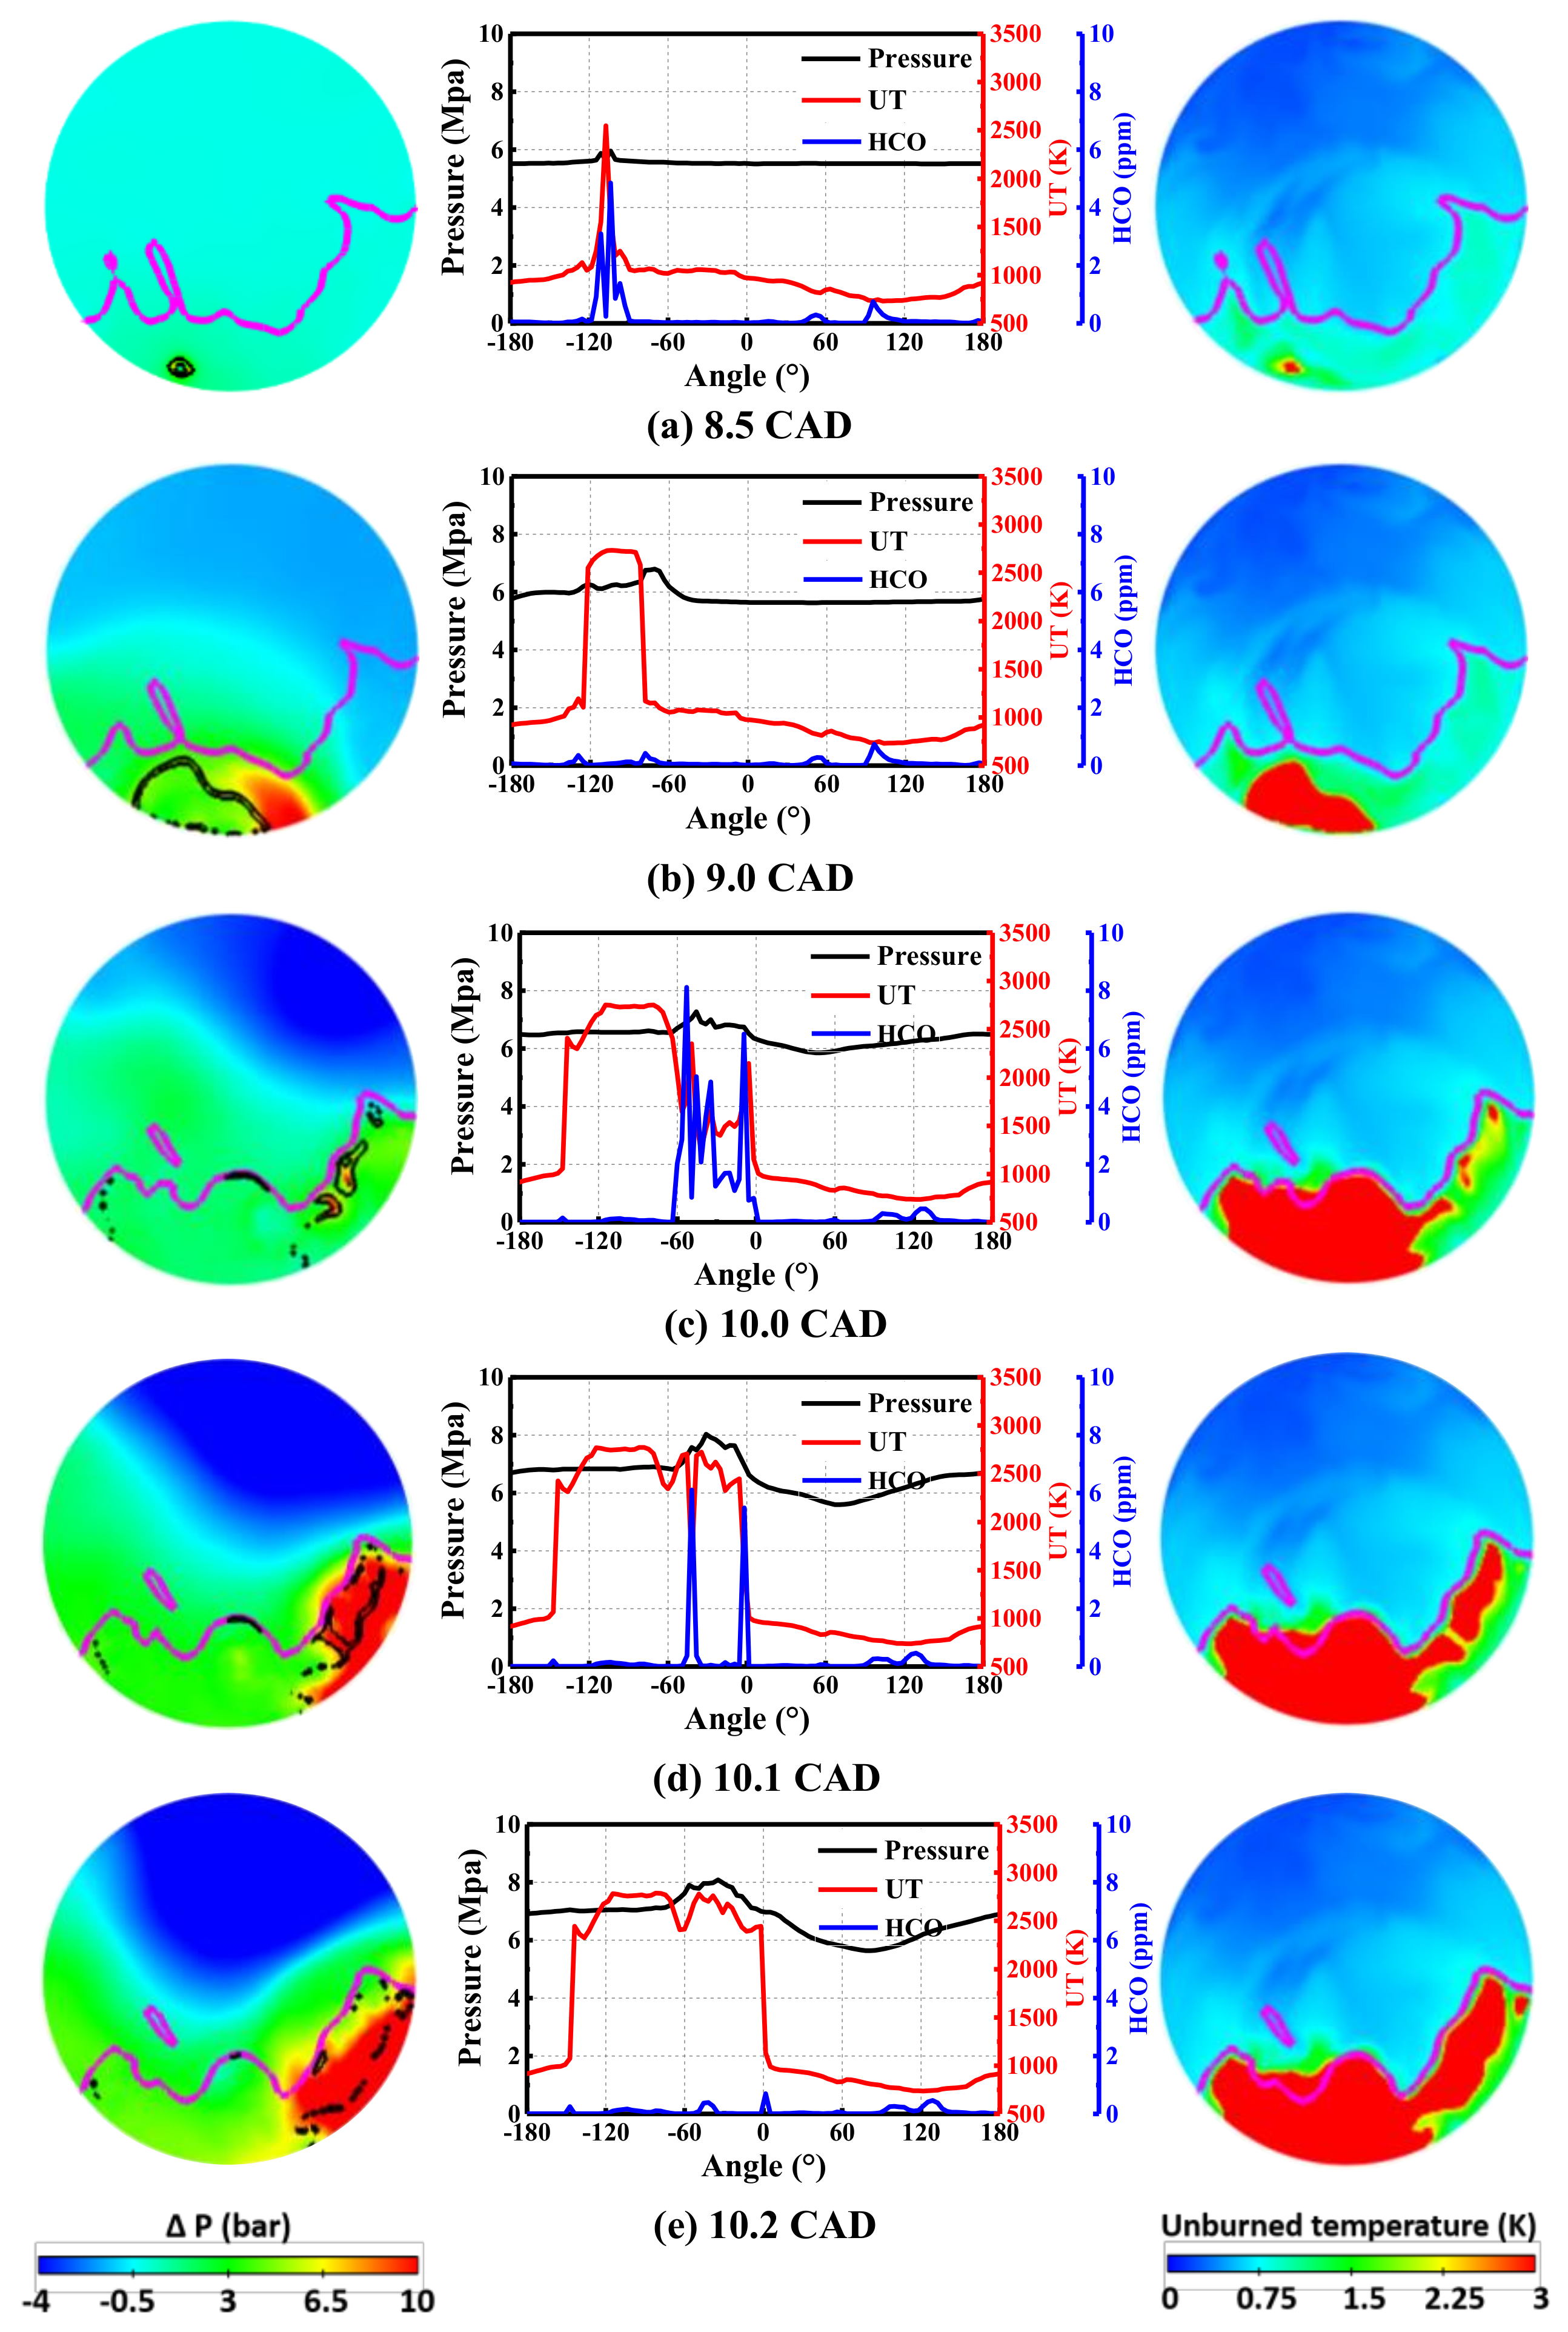
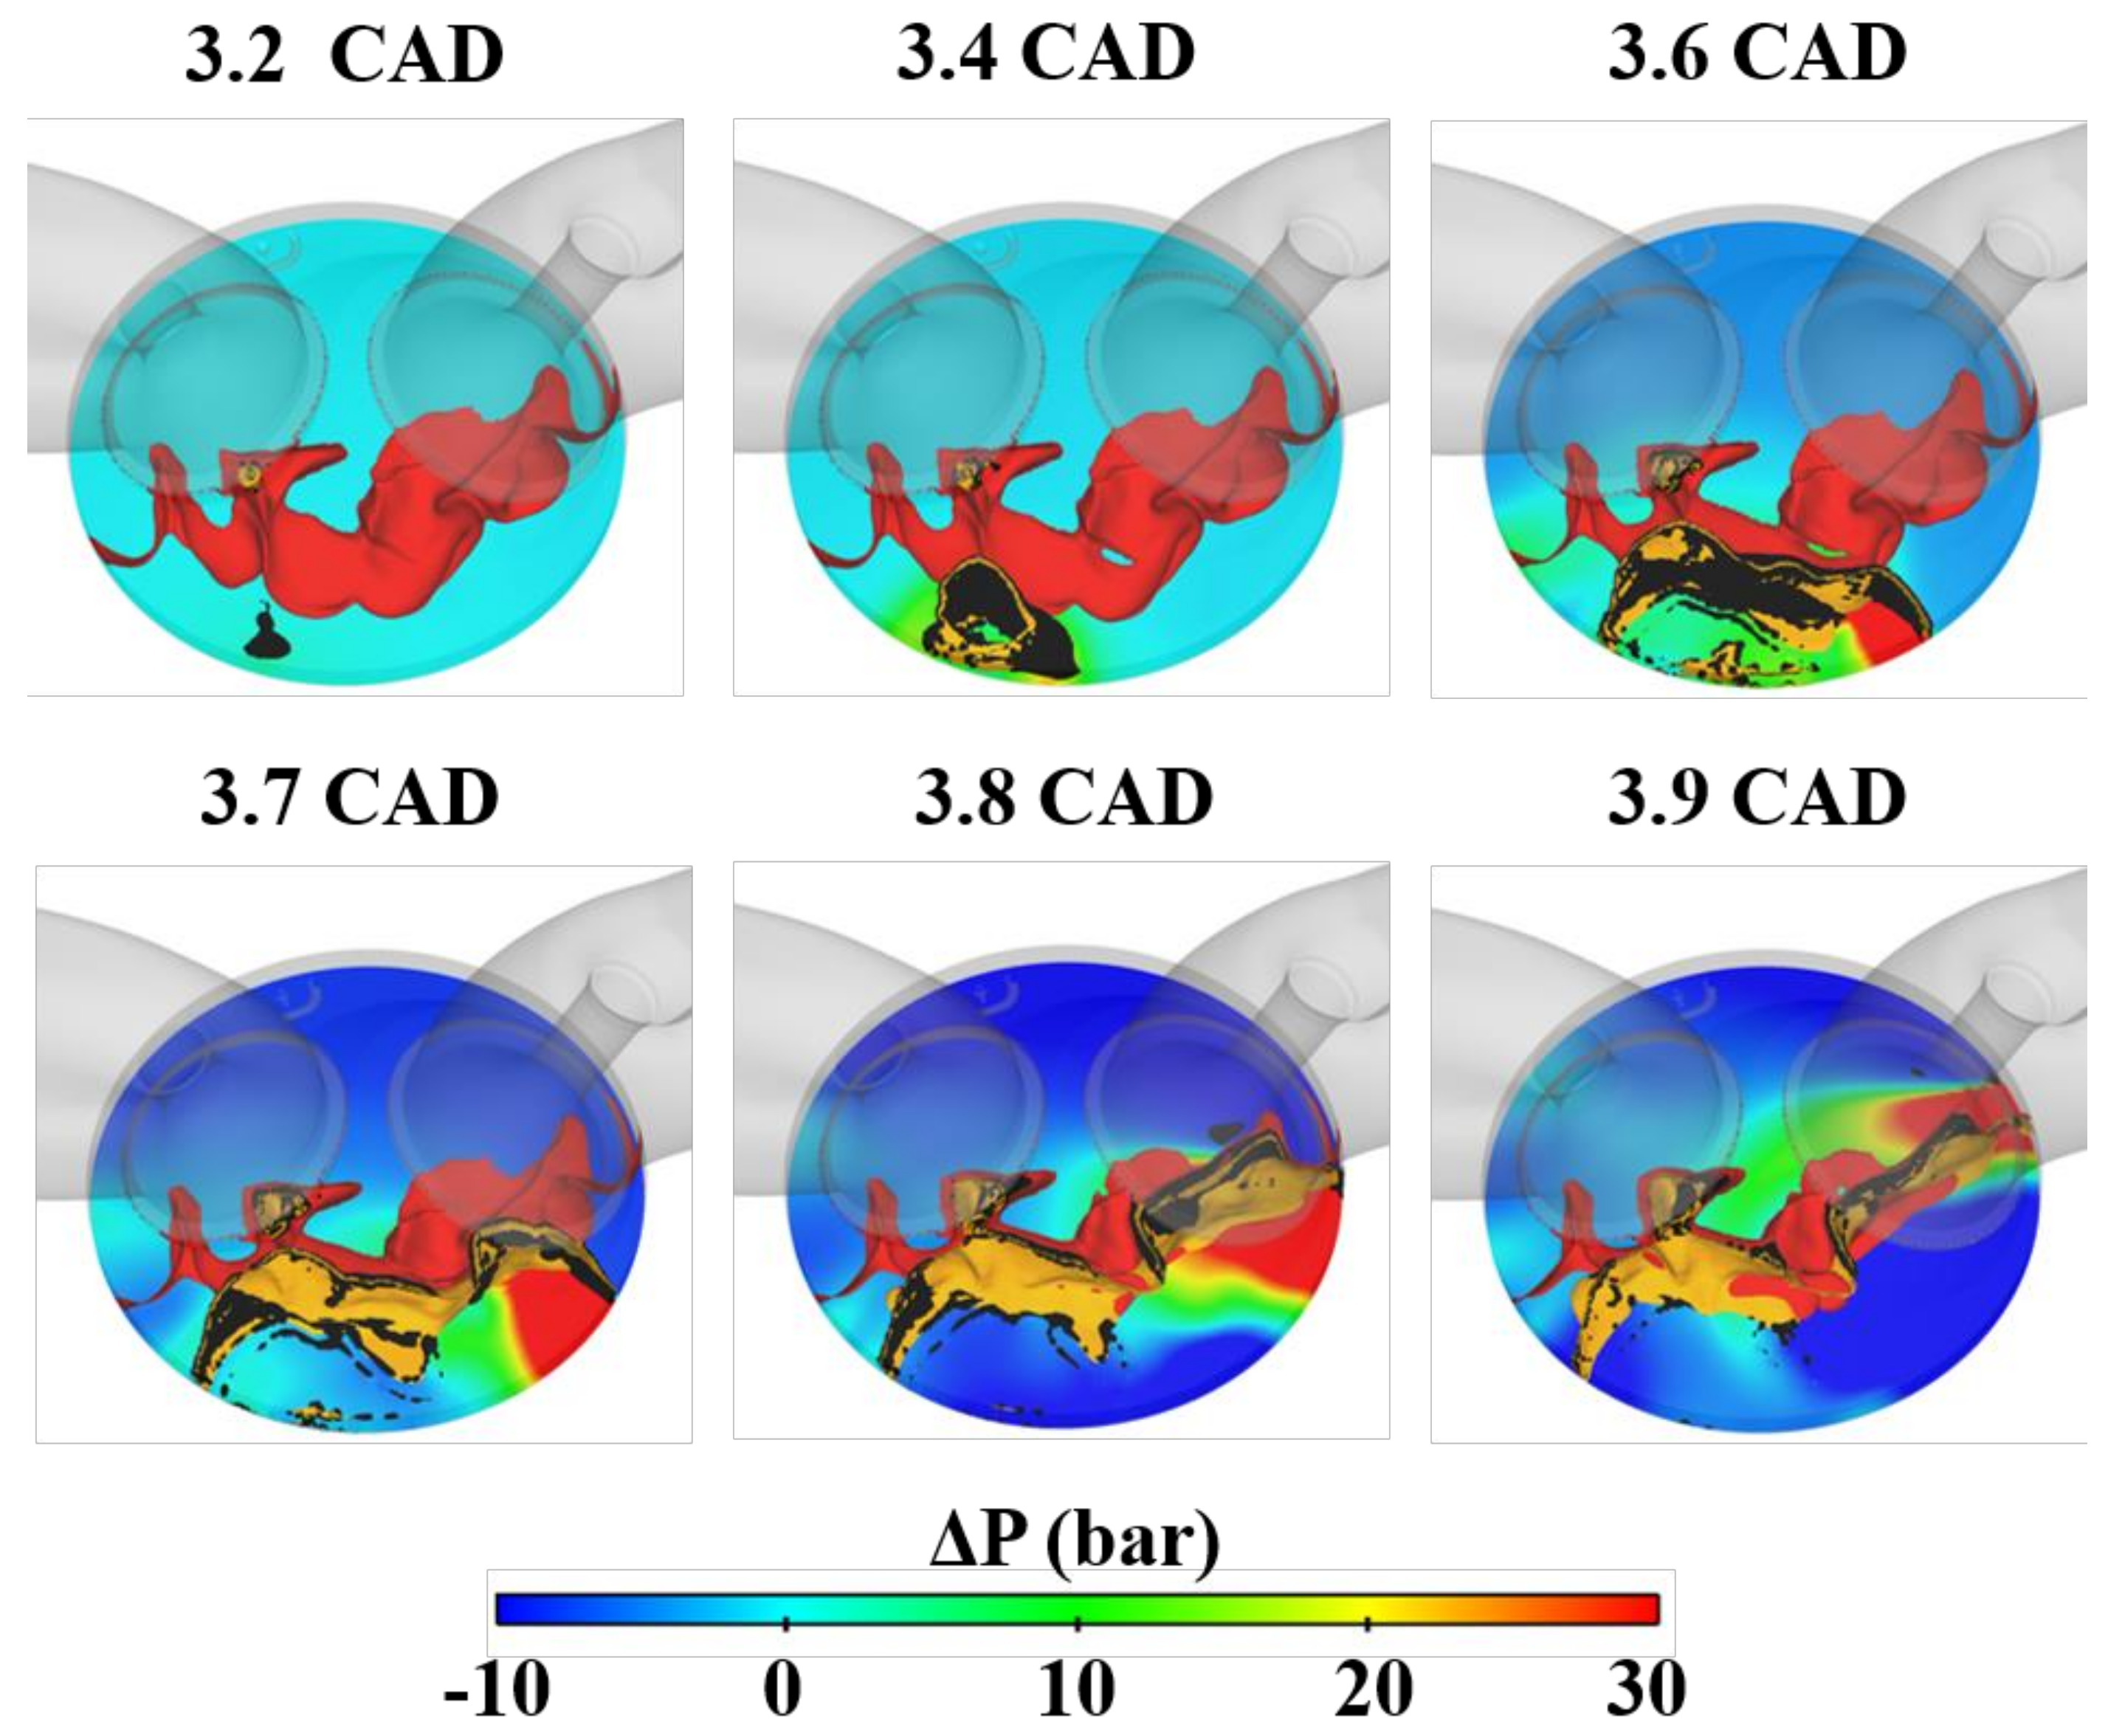
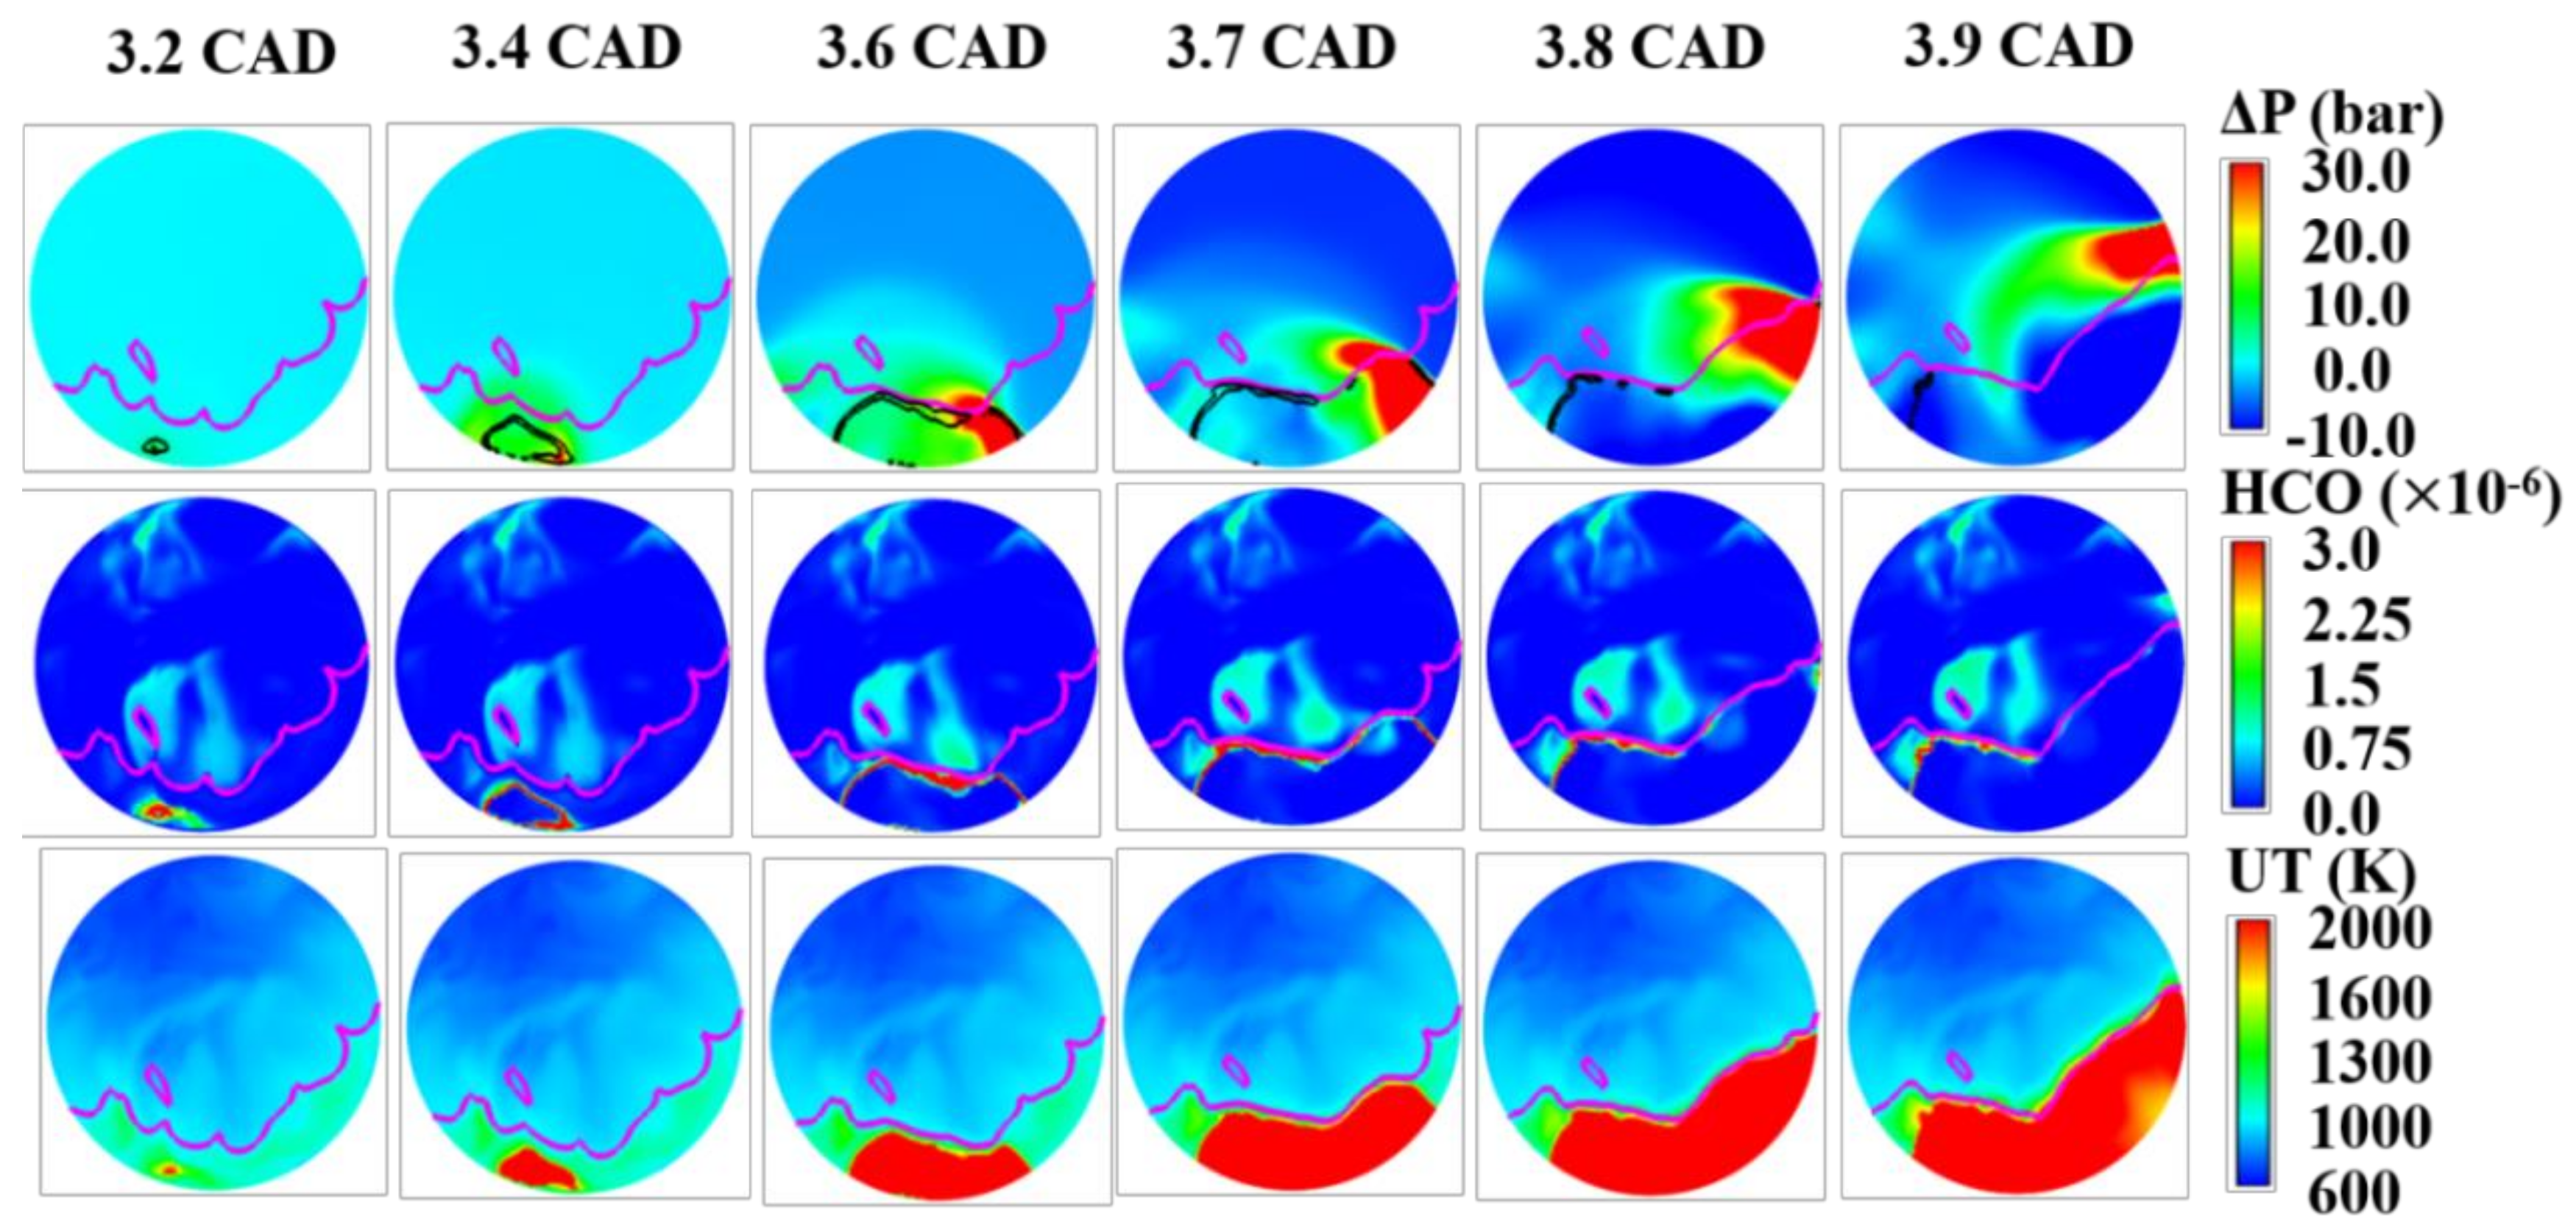
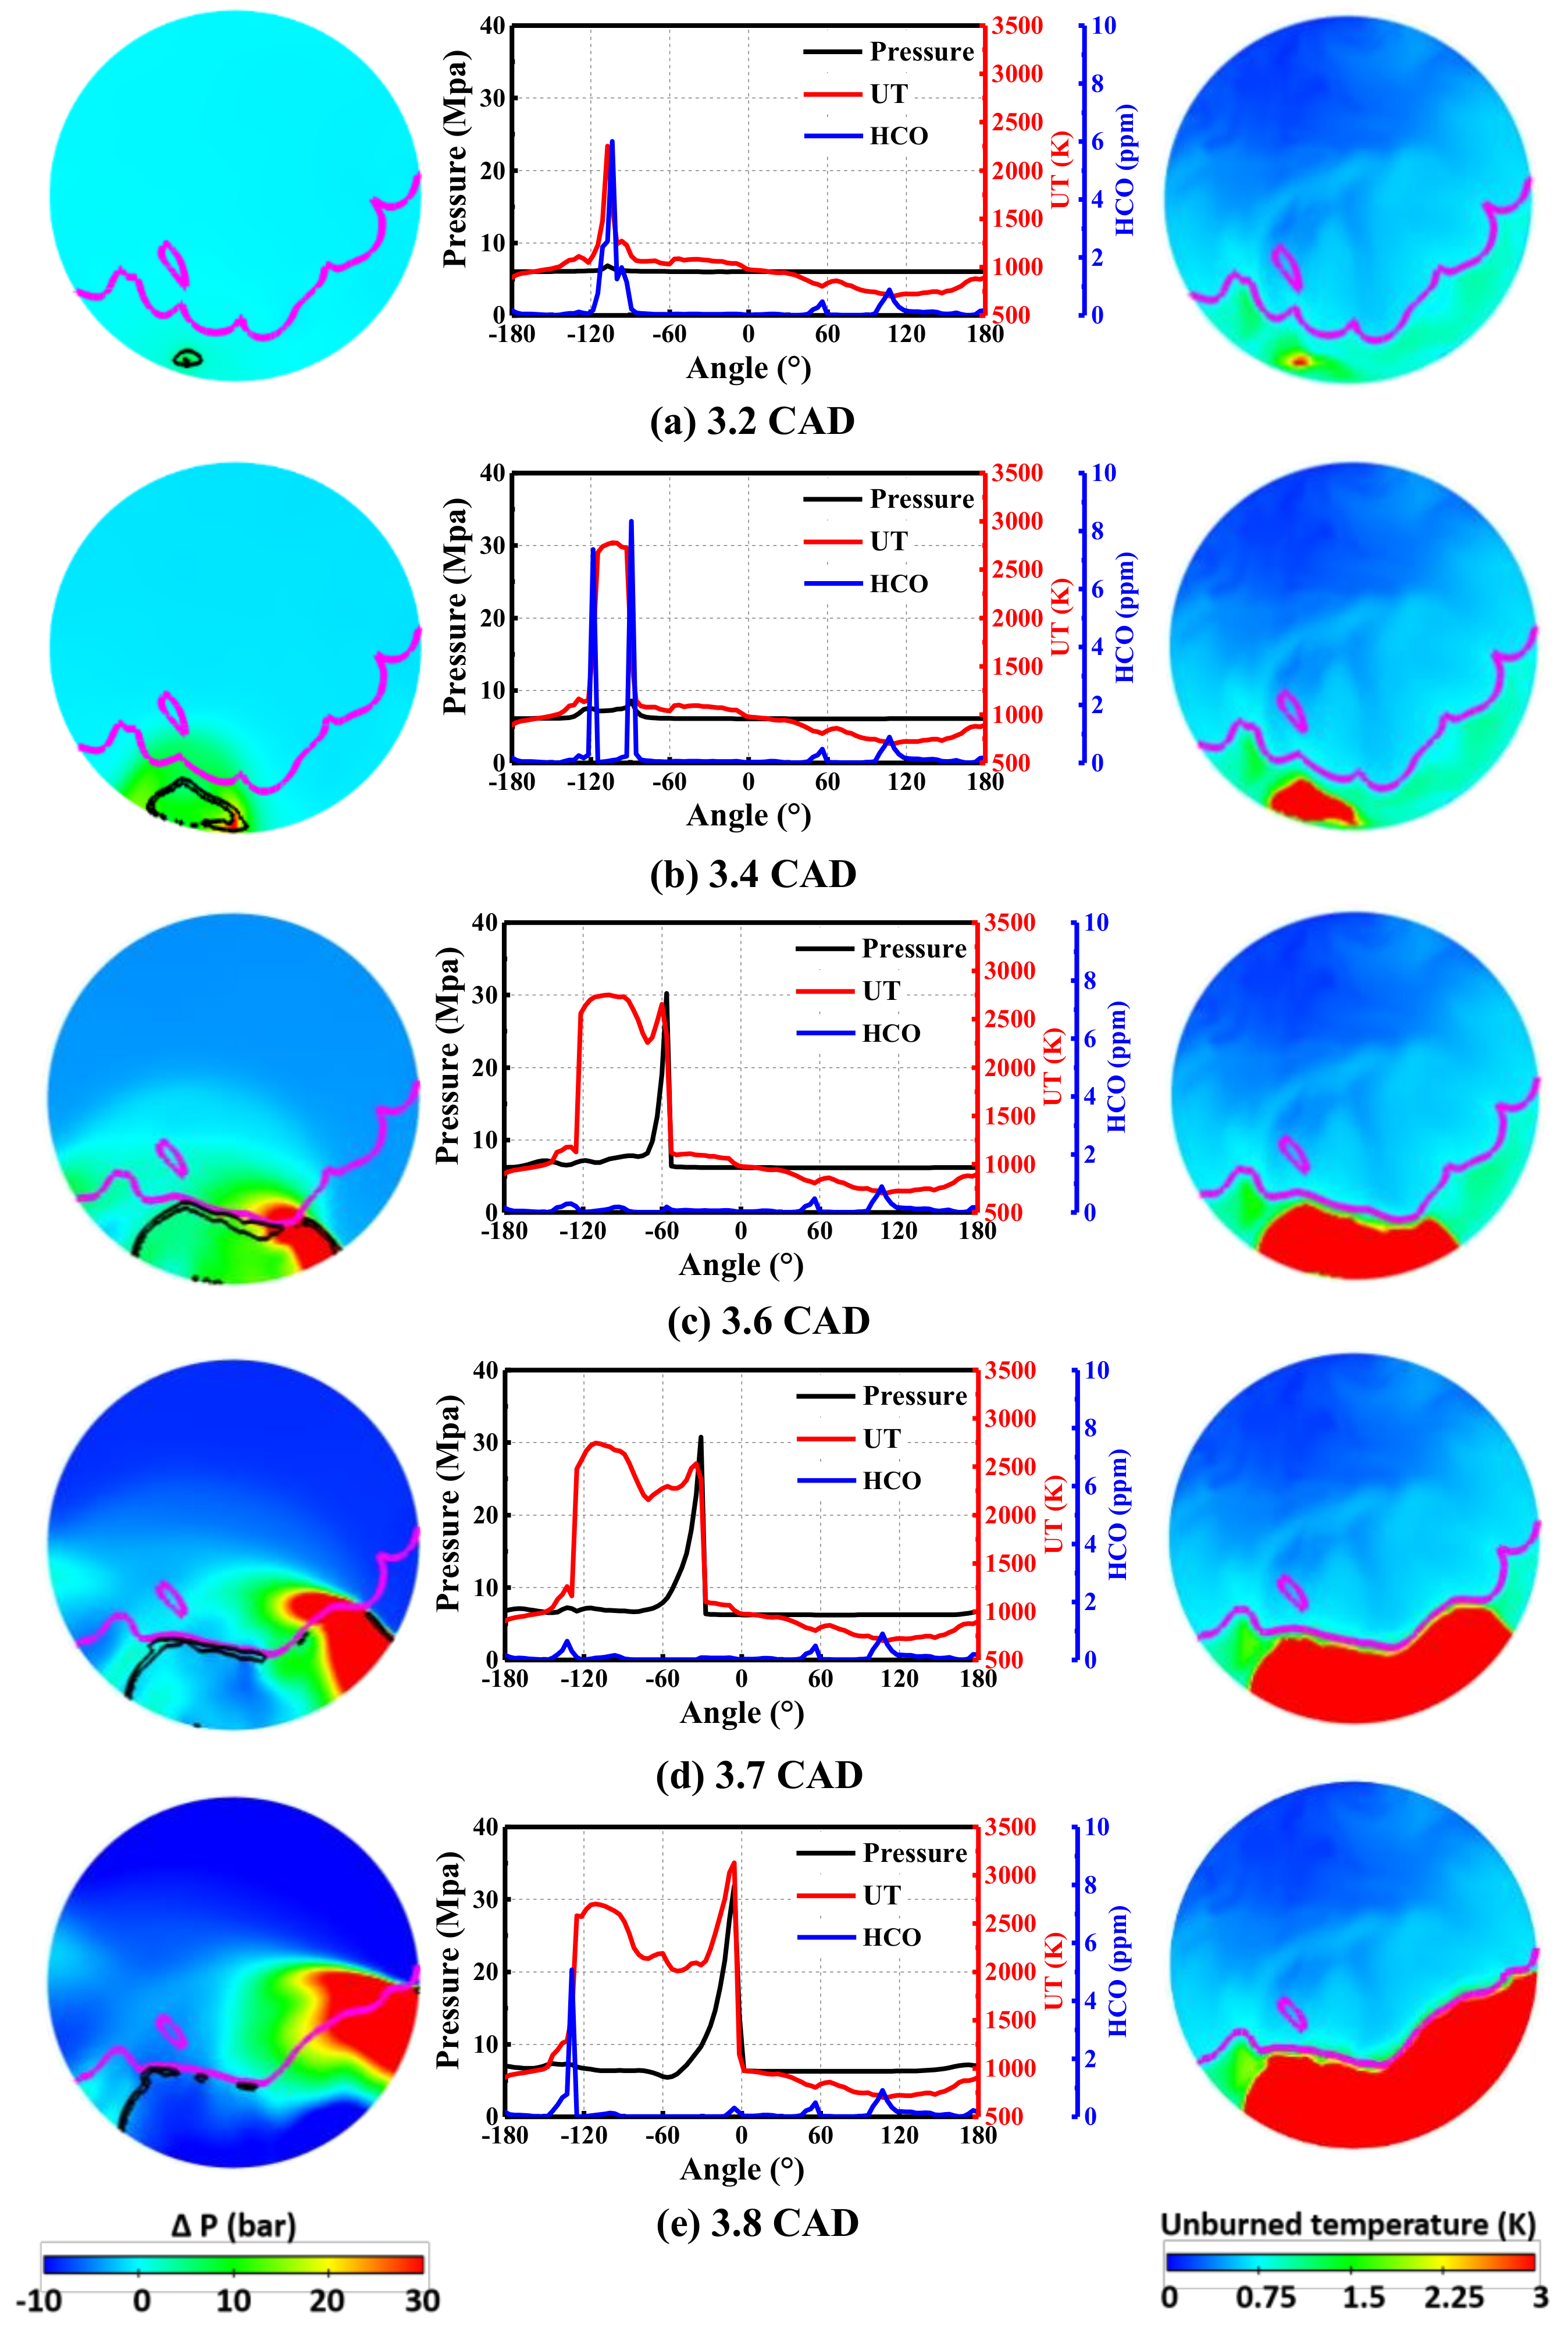
In the conventional knock, the unburned mixture is preheated and compressed by the burned region as main flame propagates. Auto-ignition occurs at hot-spots near the cylinder wall, generating pressure waves. The thermodynamics state of remained unburned mixture is further increased under the coupling effects of the deflagration and the main flame until it is high enough to emerge new hot-spot that triggers second auto-ignition, generating stronger pressure waves as a result of higher HRR.
(3)
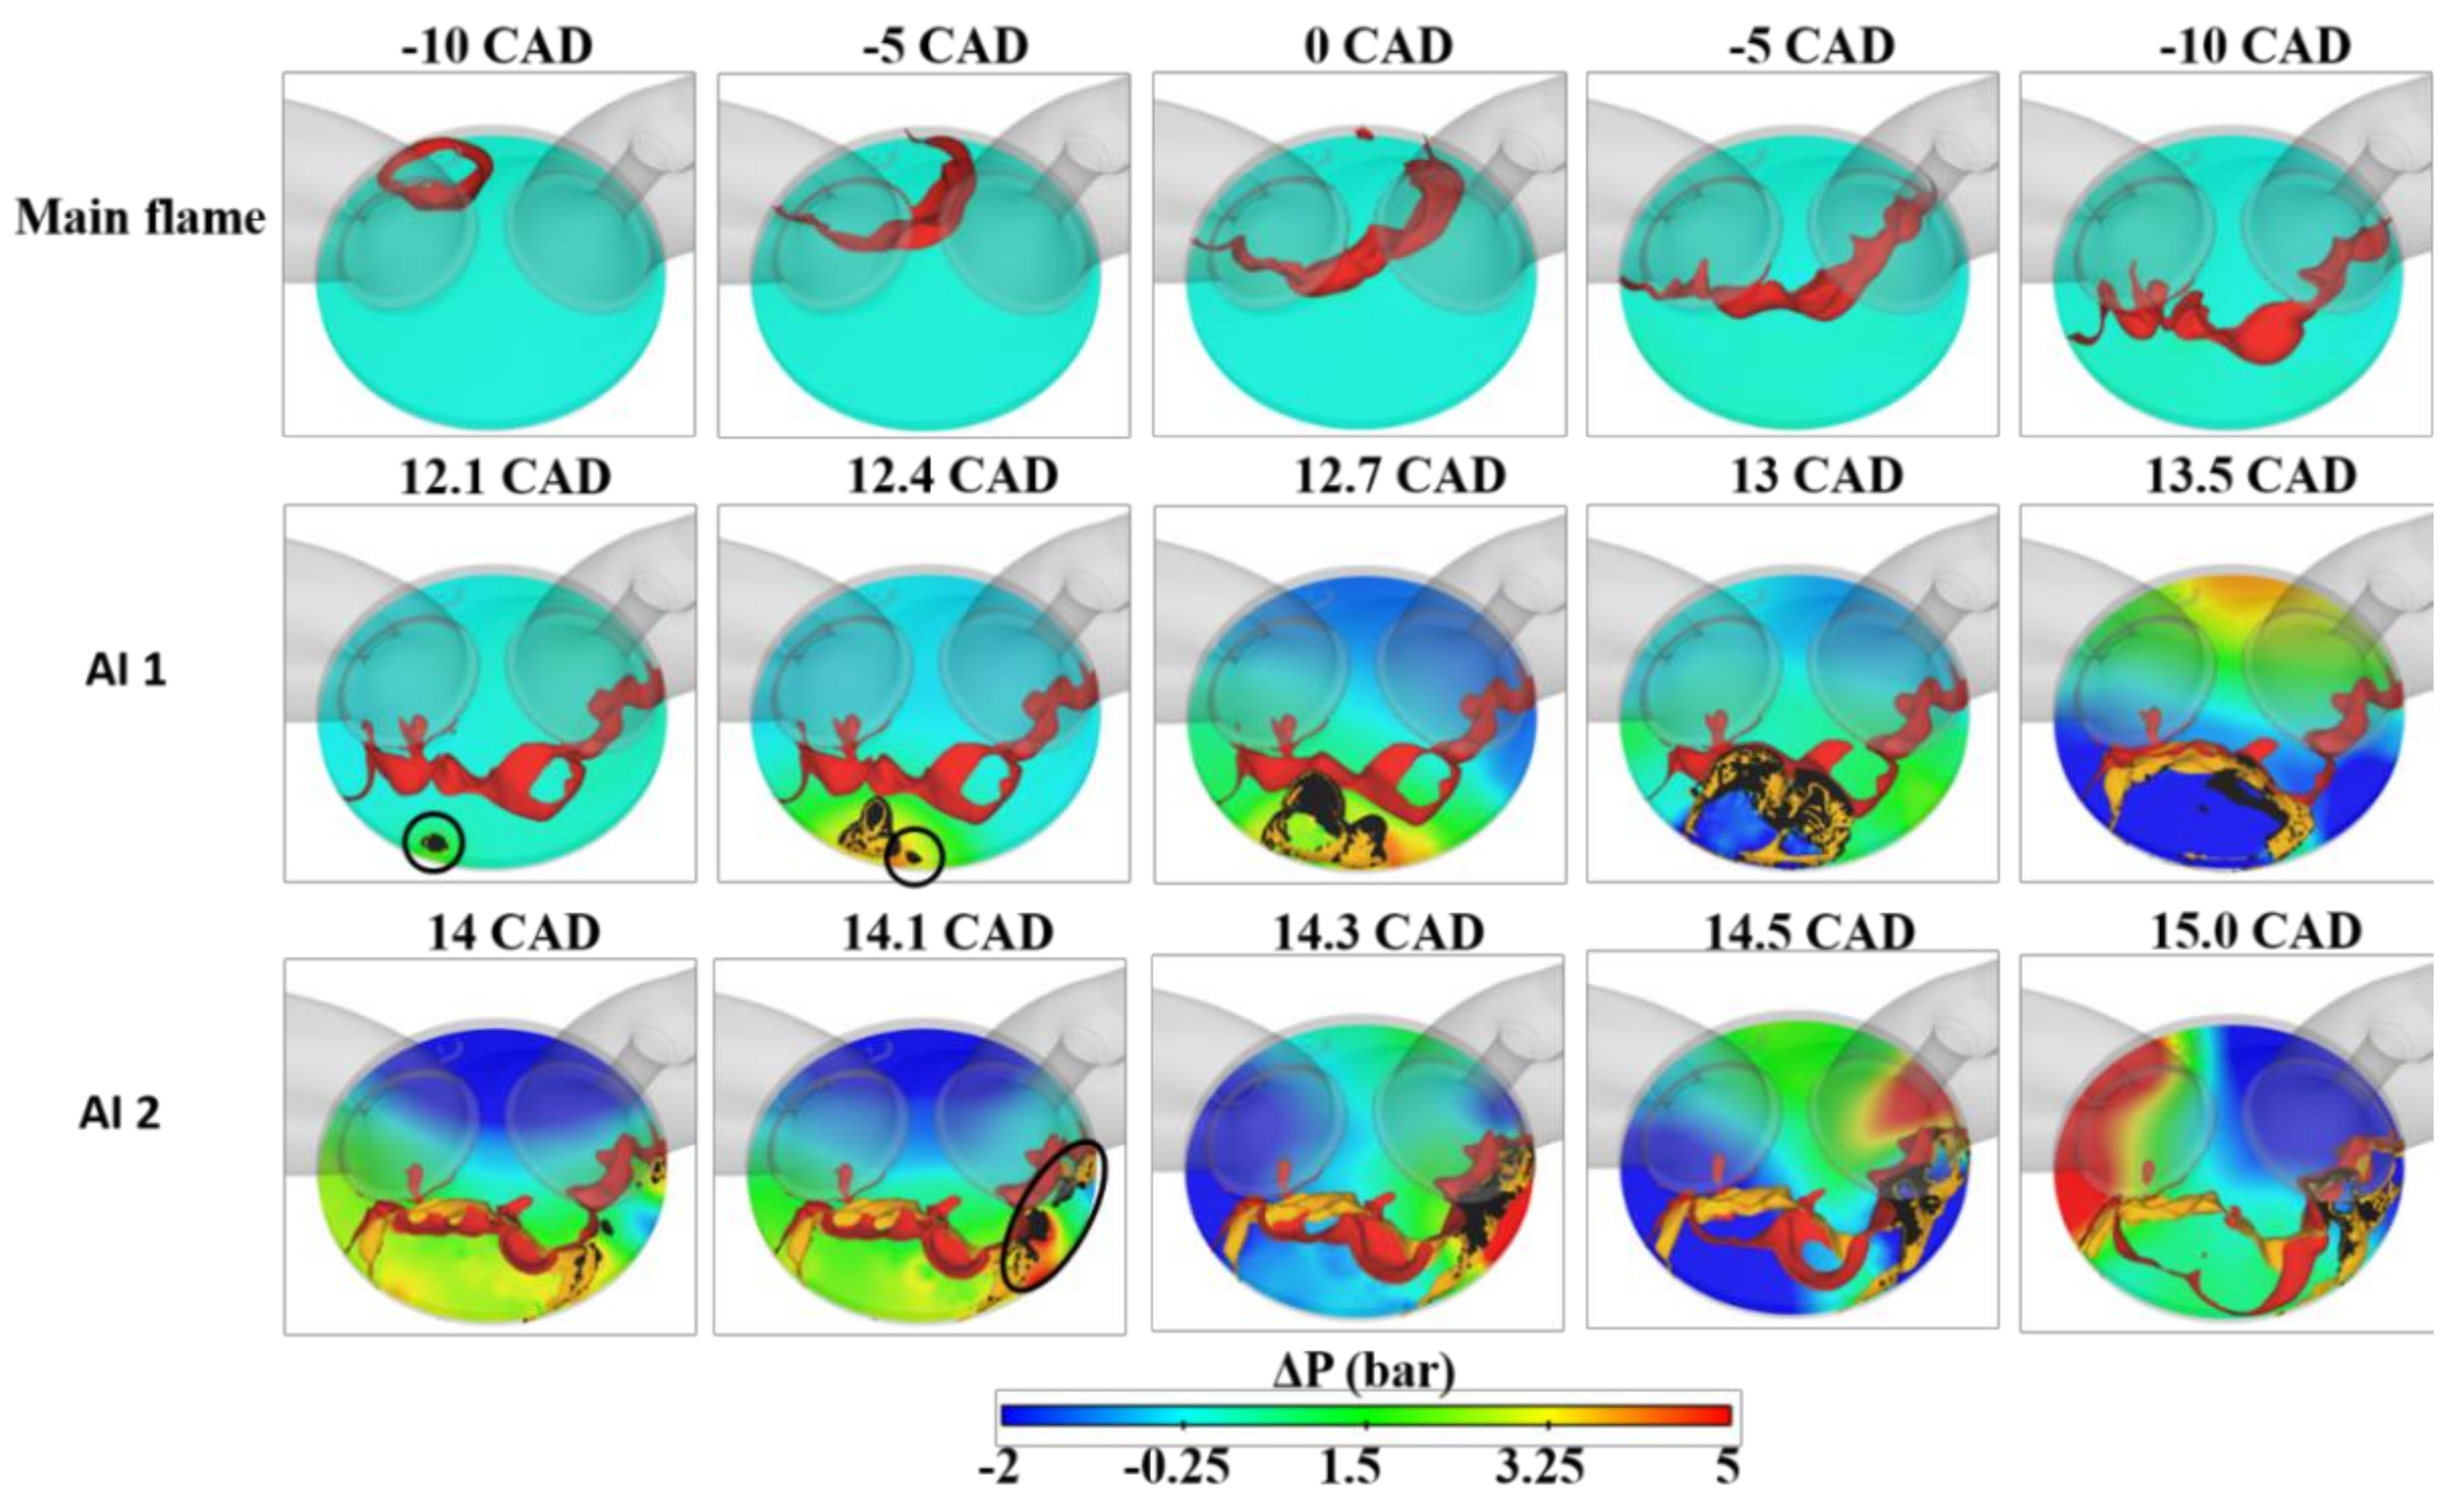
For further advancing ST that corresponding to the pre-ignition in engines such as ST-26, ST-28, an intense knock called super-knock occurs. As the pressure wave effects induced by the autoignition in the end gas on the local thermodynamics, the ignition delay time of unburned mixture ahead of auto-ignition flame shortens. Consequently, auto-ignition flame propagation velocity increases, which will generate new strong pressure wave. Overall, following the increase of flame propagation velocity, the transition of the autoignition modes is achieved from the subsonic combustion to supersonic combustion. This allows the coupling between pressure wave and AI flame that reinforces each other, leading to the DDT and super-knock occurrences.
It should be noted that knock combustion also depends on the current combustion velocity and composition and temperature fluctuations in cylinder [41], which are responsible for the knock occurrence in different cycles. Thus, the knock mechanism in terms of cycle-to-cycle variations will be studied in our further work. This work only focuses on the mechanism of knock occurrence by advancing spark timing, thus the control of knock should be investigated in future work.

Author Contributions

Supervision, C.L.; Writing—original draft, L.Z.; Writing—review & editing, C.L.

Funding

This research was funded by the National Natural Science Foundation of China (Grant No. 91641203, 51606133).

Conflicts of Interest

The authors declare no conflict of interest.

Abbreviations

AMRAdaptive Mesh RefinementAIAuto-ignition
aTDCafter Top Dead CenterBMFBurned Mass Fraction
bTDCbefore Top Dead CenterCFDComputational Fluid Dynamics
CJChapman-JouguetDDTDeflagration to Detonation Transition
DNSDirect Numerical SimulationECFM-LESExtended Coherent Flame Model for LES
GDIGasoline Direct InjectionHCCIHomogeneous charge compression ignition
HRRHeat Release RateLESLarge Eddy Simulation
MAPOmaximum amplitude of pressure oscillationsRANSReynolds averaged Navier–Stokes
PRFPrimary Reference FuelPIDProportional-Integral-Derivative
STSpark TimingSISpark Ignition
TKITabulated Kinetics for IgnitionTDCTop Dead Center

References

  1. Rudloff, J.; Zaccardi, J.M.; Richard, S.; Anderlohr, J.M. Analysis of pre-ignition in highly charged SI engines: Emphasis on the auto-ignition mode. Proc. Combust. Inst. 2013, 34, 2959–2967. [Google Scholar] [CrossRef]
  2. Sharma, N.; Patel, C.; Tiwari, N.; Agarwal, A.K. Experimental investigations of noise and vibration characteristics of gasoline-methanol blend fuelled gasoline direct injection engine and their relationship with combustion characteristics. Appl. Ther. Eng. 2019, 158, 113754. [Google Scholar] [CrossRef]
  3. Wei, H.; Yu, J.; Zhou, L. Improvement of engine performance with high compression ratio based on knock suppression using Miller cycle with boost pressure and split injection. Front. Energy 2019. [Google Scholar] [CrossRef]
  4. Wei, H.; Gao, D.; Zhou, L.; Feng, D.; Chen, R. Different combustion modes caused by flame-shock interactions in a confined chamber with a perforated plate. Combust. Flame 2017, 178, 277–285. [Google Scholar] [CrossRef] [Green Version]
  5. Wang, Z.; Liu, H.; Song, T.; Qi, Y.; He, X.; Shuai, S.; Wang, J. Relationship between super-knock and pre-ignition. Int. J. Engine Res. 2015, 16, 166–180. [Google Scholar] [CrossRef]
  6. Wang, Z.; Liu, H.; Reitz, R.D. Knocking combustion in spark-ignition engines. Prog. Energy Combust. Sci. 2017, 61, 78–112. [Google Scholar] [CrossRef]
  7. Xu, H.; Gao, J.; Yao, A.; Yao, C. The effect of the energy convergence and energy dissipation on the formation of severe knock. Appl. Energy 2018, 228, 1243–1254. [Google Scholar] [CrossRef]
  8. Vafamehr, H.; Cairns, A.; Sampson, O.; Koupaie, M.M. The competing chemical and physical effects of transient fuel enrichment on heavy knock in an optical spark ignition engine. Appl. Energy 2016, 179, 687–697. [Google Scholar] [CrossRef] [Green Version]
  9. Zaccardi, J.-M.; Escudié, D. Overview of the main mechanisms triggering low-speed pre-ignition in spark-ignition engines. Int. J. Engine Res. 2015, 16, 152–165. [Google Scholar] [CrossRef]
  10. Wei, H.; Zhao, J.; Zhou, L.; Xu, Z.; Gao, D. Pressure oscillation with destructive effect of flame propagation of a stoichiometric hydrogen-air mixture in a confined space. J. Hazard. Mater. 2018, 344, 1025–1033. [Google Scholar] [CrossRef]
  11. Konig, G.; Sheppard, C.G.W. End Gas Autoignition and Knock in a Spark Ignition Engine; SAE Transactions; SAE International: Tulsa, OK, USA, 1990; pp. 820–839. [Google Scholar]
  12. Bates, L.; Bradley, D. Deflagrative, auto-ignitive, and detonative propagation regimes in engines. Combust. Flame 2017, 175, 118–122. [Google Scholar] [CrossRef]
  13. Amann, M.; Mehta, D.; Alger, T. Engine Operating Condition and Gasoline Fuel Composition Effects on Low-Speed Pre-Ignition in High-Performance Spark Ignited Gasoline Engines. SAE Int. J. Engines 2011, 4, 274–285. [Google Scholar] [CrossRef]
  14. Steurs, K.; Blomberg, C.; Boulouchos, K. Formulation of a Knock Model for Ethanol and Iso-Octane under Specific Consideration of the Thermal Boundary Layer within the End-Gas. SAE Int. J. Engines 2014, 7, 1752–1772. [Google Scholar] [CrossRef]
  15. Wei, H.; Feng, D.; Pan, J.; Shao, A.; Pan, M. Knock characteristics of SI engine fueled with n-butanol in combination with different EGR rate. Energy 2017, 118, 190–196. [Google Scholar] [CrossRef]
  16. Wei, H.; Feng, D.; Pan, M.; Pan, J.; Rao, X.; Gao, D. Experimental investigation on the knocking combustion characteristics of n-butanol gasoline blends in a DISI engine. Appl. Energy 2016, 175, 346–355. [Google Scholar] [CrossRef]
  17. Zhou, L.; Kang, R.; Wei, H.; Feng, D.; Hua, J.; Pan, J.; Chen, R. Experimental analysis of super-knock occurrence based on a spark ignition engine with high compression ratio. Energy 2018, 165, 68–75. [Google Scholar] [CrossRef] [Green Version]
  18. Bares, P.; Selmanaj, D.; Guardiola, C.; Onder, C. A new knock event definition for knock detection and control optimization. Appl. Ther. Eng. 2018, 131, 80–88. [Google Scholar] [CrossRef]
  19. Shen, X.; Zhang, Y.; Shen, T. Cylinder pressure resonant frequency cyclic estimation-based knock intensity metric in combustion engines. Appl. Ther. Eng. 2019, 158, 113756. [Google Scholar] [CrossRef]
  20. Zhou, L.; Shao, A.; Hua, J.; Wei, H.; Feng, D. Effect of Retarded Injection Timing on Knock Resistance and Cycle to Cycle Variation in Gasoline Direct Injection Engine. J. Energy Resour. Technol. 2018, 140, 072202. [Google Scholar] [CrossRef]
  21. Zhou, L.; Gao, D.; Zhao, J.; Wei, H.; Zhang, X.; Xu, Z.; Chen, R. Turbulent flame propagation with pressure oscillation in the end gas region of confined combustion chamber equipped with different perforated plates. Combust. Flame 2018, 191, 453–467. [Google Scholar] [CrossRef] [Green Version]
  22. Wei, H.; Zhang, X.; Zeng, H.; Deiterding, R.; Pan, J.; Zhou, L. Mechanism of end-gas autoignition induced by flame-pressure interactions in confined space. Phys Fluids 2019, 31, 076106. [Google Scholar]
  23. Wei, H.; Zhao, J.; Zhang, X.; Pan, J.; Hua, J.; Zhou, L. Turbulent flame–shock interaction inducing end-gas autoignition in a confined space. Combust. Flame 2019, 204, 137–141. [Google Scholar] [CrossRef]
  24. Merola, S.S.; Vaglieco, B.M. Knock investigation by flame and radical species detection in spark ignition engine for different fuels. Energy Convers. Manag. 2007, 48, 2897–2910. [Google Scholar] [CrossRef]
  25. Kawahara, N.; Tomita, E.; Sakata, Y. Auto-ignited kernels during knocking combustion in a spark-ignition engine. Proc. Combust. Inst. 2007, 31, 2999–3006. [Google Scholar] [CrossRef]
  26. Tanoue, K.; Jimoto, T.; Kimura, T.; Yamamoto, M.; Hashimoto, J. Effect of initial temperature and fuel properties on knock characteristics in a rapid compression and expansion machine. Proc. Combust. Inst. 2017, 36, 3523–3531. [Google Scholar] [CrossRef]
  27. Westbrook, C.K.; Mehl, M.; Pitz, W.J.; Sjöberg, M. Chemical kinetics of octane sensitivity in a spark-ignition engine. Combust. Flame 2017, 175, 2–15. [Google Scholar] [CrossRef] [Green Version]
  28. Yang, Y.; Dec, J.E.; Sjöberg, M.; Ji, C. Understanding fuel anti-knock performances in modern SI engines using fundamental HCCI experiments. Combust. Flame 2015, 162, 4008–4015. [Google Scholar] [CrossRef] [Green Version]
  29. Wang, Z.; Qi, Y.; He, X.; Wang, J.; Shuai, S.; Law, C.K. Analysis of pre-ignition to super-knock: Hotspot-induced deflagration to detonation. Fuel 2015, 144, 222–227. [Google Scholar] [CrossRef]
  30. Wang, Z.; Qi, Y.; Liu, H.; Zhang, P.; He, X.; Wang, J. Shock wave reflection induced detonation (SWRID) under high pressure and temperature condition in closed cylinder. Shock Waves 2016, 26, 687–691. [Google Scholar] [CrossRef]
  31. D’Adamo, A.; Breda, S.; Fontanesi, S.; Irimescu, A.; Merola, S.S.; Tornatore, C. A RANS knock model to predict the statistical occurrence of engine knock. Appl. Energy 2017, 191, 251–263. [Google Scholar] [CrossRef]
  32. Robert, A.; Richard, S.; Colin, O.; Poinsot, T. LES study of deflagration to detonation mechanisms in a downsized spark ignition engine. Combust. Flame 2015, 162, 2788–2807. [Google Scholar] [CrossRef] [Green Version]
  33. Yu, H.; Chen, Z. End-gas autoignition and detonation development in a closed chamber. Combust. Flame 2015, 162, 4102–4111. [Google Scholar] [CrossRef]
  34. Wang, Z.; Wang, Y.; Reitz, R.D. Pressure Oscillation and Chemical Kinetics Coupling during Knock Processes in Gasoline Engine Combustion. Energy Fuel 2012, 26, 7107–7119. [Google Scholar] [CrossRef]
  35. Zhou, L.; Dong, K.; Hua, J.; Wei, H.; Chen, R.; Han, Y. Effects of applying EGR with split injection strategy on combustion performance and knock resistance in a spark assisted compression ignition (SACI) engine. Appl. Ther. Eng. 2018, 145, 98–109. [Google Scholar] [CrossRef] [Green Version]
  36. Livengood, J.C.; Wu, P.C. Correlation of autoignition phenomena in internal combustion engines and rapid compression machines. Symp. Int. Combust. 1955, 5, 347–356. [Google Scholar] [CrossRef] [Green Version]
  37. Heywood, J.B. Internal Combustion Engine Fundamentals; McGraw-Hill Education: New York, NY, USA, 1988. [Google Scholar]
  38. Lafossas, F.-A.; Castagne, M.; Dumas, J.-P.; Henriot, S. Development and Validation of a Knock Model in Spark Ignition Engines Using a CFD Code; Report No. 0148-7191; SAE Technical Paper; SAE International: San Diego, CA, USA, 2002. [Google Scholar]
  39. Shao, J.; Rutland, C. Modeling Investigation of Auto-Ignition and Engine Knock by HO2; Report No. 0148-7191; SAE Technical Paper; SAE International: Detroit, MI, USA, 2014. [Google Scholar]
  40. Réveillé, B.; Duparchy, A. 3D CFD analysis of an abnormally rapid Combustion phenomenon in downsized gasoline engines. Oil Gas Sci. Technol. Rev. de l’IFP 2009, 64, 431–444. [Google Scholar]
  41. Robert, A.; Richard, S.; Colin, O.; Martinez, L.; de Francqueville, L. LES prediction and analysis of knocking combustion in a spark ignition engine. Proc. Combust. Inst. 2015, 35, 2941–2948. [Google Scholar] [CrossRef]
  42. Pal, P.; Wu, Y.; Lu, T.; Som, S.; See, Y.C.; le Moine, A. Multidimensional Numerical Simulations of Knocking Combustion in a Cooperative Fuel Research Engine. J. Energy Resour. Technol. 2018, 140, 102205. [Google Scholar] [CrossRef]
  43. Lecocq, G.; Richard, S.; Michel, J.-B.; Vervisch, L. A new LES model coupling flame surface density and tabulated kinetics approaches to investigate knock and pre-ignition in piston engines. Proc. Combust. Inst. 2011, 33, 3105–3114. [Google Scholar] [CrossRef]
  44. Zhou, L.; Hua, J.; Wei, H.; Dong, K.; Feng, D.; Shu, G. Knock characteristics and combustion regime diagrams of multiple combustion modes based on experimental investigations. Appl. Energy 2018, 229, 31–41. [Google Scholar] [CrossRef]
  45. Tan, Z.; Reitz, R.D. Development of a Universal Turbulent Combustion Model for Premixed and Direct Injection Spark/Compression Ignition Engines; SAE International: Detroit, MI, USA, 2004. [Google Scholar]
  46. Liang, L.; Reitz, R.D.; Iyer, C.O.; Yi, J. Modeling Knock in Spark-Ignition Engines Using a G-equation Combustion Model Incorporating Detailed Chemical Kinetics; SAE International: Detroit, MI, USA, 2007. [Google Scholar]
  47. Liu, Y.-D.; Jia, M.; Xie, M.-Z.; Pang, B. Enhancement on a Skeletal Kinetic Model for Primary Reference Fuel Oxidation by Using a Semidecoupling Methodology. Energy Fuels 2012, 26, 7069–7083. [Google Scholar] [CrossRef]
  48. Senecal, P.K.; Pomraning, E.; Richards, K.J.; Briggs, T.E.; Choi, C.Y.; McDavid, R.M.; Patterson, M.A. Multi-Dimensional Modeling of Direct-Injection Diesel Spray Liquid Length and Flame Lift-off Length Using CFD and Parallel Detailed Chemistry; SAE International: Detroit, MI, USA, 2003. [Google Scholar]
  49. Ewald, J.; Peters, N. A Level Set Based Flamelet Model for the Prediction of Combustion in Spark igNition Engines. In Proceedings of the 15th International Multidimensional Engineering Models User Group, Detroit, MI, USA, 11 April 2005; pp. 1–6. [Google Scholar]
  50. Metghalchi, M.; Keck, J.C. Burning velocities of mixtures of air with methanol, isooctane, and indolene at high pressure and temperature. Combust. Flame 1982, 48, 191–210. [Google Scholar] [CrossRef]
  51. Gülder, Ö.L. Correlations of Laminar Combustion Data for Alternative SI Engine Fuels; Report No. 0148-7191; SAE Technical Paper; SAE Internaional: San Diego, CA, USA, 1984. [Google Scholar]
  52. Yoshizawa, A.; Horiuti, K. A statistically-derived subgrid-scale kinetic energy model for the large-eddy simulation of turbulent flows. J. Phys. Soc. Jpn. 1985, 54, 2834–2839. [Google Scholar] [CrossRef]
  53. Menon, S.; Calhoon, W.H. Subgrid mixing and molecular transport modeling in a reacting shear layer. Symp. Int. Combust. 1996, 26, 59–66. [Google Scholar] [CrossRef]
  54. Reitz, R. Modeling atomization processes in high-pressure vaporizing sprays. At. Spray Technol. 1987, 3, 309–337. [Google Scholar]
  55. Amsden, A.A.; Findley, M. KIVA-3V: A Block-Structured KIVA Program for Engines with Vertical or Canted Valves; Lawrence Livermore National Lab(LLNL): Livermore, CA, USA, 1997. [Google Scholar]
Figure 1. Pressure traces (a) and filtered pressure oscillations (b) with different spark timings.
Energies 12 03909 g001
Figure 2. Schematic of the model structure and grid splitting.
Energies 12 03909 g002
Figure 3. The numerical and experimental results of cylinder pressure and HRR at different spark timings.
Energies 12 03909 g003
Figure 4. Comparison of numerical and experimental results on pressure trace and filtered pressure oscillations under knock condition.
Energies 12 03909 g004
Figure 5. Pressure trace (a) and filtered pressure oscillations (b) at different spark timings.
Energies 12 03909 g005
Figure 6. MAPO and onset of auto-ignition at different spark timings.
Energies 12 03909 g006
Figure 7. HRR and BMF curves at different spark timings.
Energies 12 03909 g007
Figure 8. Evolutions of 3D in-cylinder combustion process including the propagation of spark-induced flame, auto-ignition in the end-gas and pressure oscillation triggered by auto-ignition.
Energies 12 03909 g008
Figure 9. Evolutions of ΔP, mass fraction of HCO and unburned temperature after the initial auto-ignition at ST = −18 CAD.
Energies 12 03909 g009
Figure 10. Evolutions of 3D isosurfaces of G = 0 and T = 1600 K in-cylinder combustion process at ST = −22 CAD.
Energies 12 03909 g010
Figure 11. Evolutions of ΔP, mass fraction of HCO and unburned temperature after the initial auto-ignition at ST = −22 CAD.
Energies 12 03909 g011
Figure 12. Schematic of the trace from which the 1D profile is extracted.
Energies 12 03909 g012
Figure 13. Evolutions of 2D configuration of ΔP in the horizontal cross-section (left), pressure, unburned temperature and mass fraction of HCO on the 1D profile (middle) and 2D configuration of unburned temperature in the horizontal cross-section (right) under the condition of ST = −22 CAD. (ae) corresponding to five different angles.
Energies 12 03909 g013
Figure 14. Evolution of 3D isosurface of G = 0 and T = 1600 K in-cylinder combustion process at ST = −26 CAD.
Energies 12 03909 g014
Figure 15. Evolutions of ΔP, mass fraction of HCO and unburned temperature after the initial auto-ignition at ST = −22 CAD.
Energies 12 03909 g015
Figure 16. Evolutions of 2D configuration of ΔP in the horizontal cross-section (left), pressure, unburned temperature and mass fraction of HCO on the 1D profile (middle) and 2D configuration of unburned temperature in the horizontal cross-section (right) under the condition of ST = −26 CAD. (ae) corresponding to five different angles.
Energies 12 03909 g016
Table 1. Operating conditions.
ParameterValue
Compression ratio10:1
Rotational speed1600 rpm
Throttle angleFully open
Equivalence ratio1.0
Intake pressure1 atm
Intake temperature25 °C
Injection pressure125 bar
Injection timing240 CAD bTDC
FuelRON92 (PRF92)
Fuel consumption1.64 kg/h
Spark timing−8, −10, −12, −14, −16, −18 CAD
IVO/IVC350/590 CAD
EVO/EVC160/380 CAD

