Article

Environmental and Efficiency Analysis of Simulated Application of the Solid Oxide Fuel Cell Co-Generation System in a Dormitory Building

Department of Architecture, Pusan National University, Busan 46241, Korea
*
Authors to whom correspondence should be addressed.
Energies 2019, 12(20), 3893; https://doi.org/10.3390/en12203893
Submission received: 23 August 2019 / Revised: 8 October 2019 / Accepted: 11 October 2019 / Published: 15 October 2019

Abstract

:
The problem of air pollution in Korea has become progressively more serious in recent years. Since electricity is advertised as clean energy, some newly developed buildings in Korea are using only electricity for all energy needs. In this research, the annual amount of air pollution attributable to energy under the traditional method in a dormitory building, which is supplying both natural gas and electricity to the building, was compared with the annual amount of air pollution attributable to supplying only electricity. The results showed that the building using only electricity emits much more air pollution than the building using electricity and natural gas together. Under the traditional method of energy supply, a residential solid oxide fuel cell cogeneration system (SOFC–CGS) for minimizing environmental pollution of the building was simulated. Furthermore, as a high load factor could lead to high efficiency of the SOFC–CGS, sharing of the SOFC–CGS by multi-households could increase its efficiency. Finally, the environmental pollution from using one system in one household was compared with that from sharing one system by multi-households. The results showed that the environmental pollution from sharing the system was relatively higher but still similar to that when using one system in one household.

Graphical Abstract

1. Introduction

1.1. Research Background

Electricity as non-combusted energy is advertised to the public as clean energy. Since the price of natural gas and the price of electricity for residential use are similar [1], in the areas of architecture and construction, some real estate developers have been developing new buildings using only electricity for power. However, as a secondary energy resource, electricity is either clean or not clean depending on the electricity generation procedure. In Korea, 39% of electricity is generated from burning coal and only 4% is generated from renewable resources as seen in Figure 1 [2].
The traditional method of supplying energy to a building in Korea is mainly using natural gas for heating and hot water and using electricity for lighting, cooling, and equipment. A recent method of supplying energy to a building is using only electricity for all energy needs in the building. This research compared the annual amount of air pollution attributable to energy under the traditional method in a dormitory building, which is supplying both natural gas and electricity to the building and the annual amount of air pollution attributable to supplying only electricity.
A solid oxide fuel cell (SOFC) is a clean energy device for generating electricity by consuming hydrogen or natural gas. By utilizing chemical interaction in the cell stack during the process of electricity generation in SOFC, there is no environmental pollution. However, there is a large amount of heat dissipation during SOFC operation. In order to improve the efficiency of SOFC, the SOFC cogeneration system (SOFC–CGS) was developed to collect and use the heat loss. The heat dissipation generated from SOFC is collected by residential SOFC–CGS and supplied to a hot water tank for hot water demand of a household. A fuel cell as a clean energy system is widely studied for residential use. In recent years, various researches were done about optimizing the operation efficiency of a fuel cell. Some scholars proposed efficiency optimization methods of a fuel cell through improving working principles of electronic components. Wang et al. proposed a novel stack and converter interpreted design scheme to improve the converter efficiency [3]. A micro tri-generation system could increase the system efficiency to over 90% [4]. An energy management system could also achieve cost reduction, CO2 mitigation, and energy consumption [5]. Some scholars aim to find a way to improve the efficiency of a fuel cell from analysis of energy demand, energy distribution, and energy supplication of a fuel cell. Adam et al. presents a multi-objective modeling approach that allows an optimized design of micro-combined heat and power (CHP) systems considering the source, distribution and emission requirements in unison to achieve more efficient whole systems [6]. Coordination between utilization factor of SOFC and features of a DC/AC (Direct current/Alternating current) inverter is also an efficient control strategy for SOFC operation [7]. Some researchers have combined a photovoltaic, battery, or heat pump with a fuel cell to satisfy the energy needs by a household while reducing cost and CO2 emission [8,9,10]. From a wider energy supply perspective, SOFC was considered to supply energy for both households and EV (Electric vehicle) to improve the efficiency and energy supply capacity of SOFC. Using a hydrogen supply system for a residential fuel cell to provide energy for fuel cell vehicles is also a method to solve the problem of lacking hydrogen stations for fuel cell vehicles [11,12]. Field experimental studies demonstrated that a residential fuel cell could significantly reduce the CO2 emissions and primary energy consumption [13]. Accurate mathematical models were developed to analyze the performance of SOFC. A 1D dynamic model was built for studying system integration and developing adequate energy management and control strategies of SOFC systems [14]. Gallo et al. developed a model of a non-conventional SOFC system by applying a lumped energy balance to each component. This model could efficiently increase the heat exchanges inside the system. This model is verified by experiments and applicable to numerous layouts [15]. According to reference [16], a fuel cell is mainly used in America, Europe, South Korea and Japan worldwide. From environmental aspect, analysis of CO2 reduction by a fuel cell was also shown in recent researches from Europe, Japan and South Korea. Fuel cell for EV is mainly applied and investigated in Korea. Environmental impact of CO2 reduction and emission by fuel cell EV is conducted [17,18]. In order to encourage the utilization residential fuel cell in households in Korea, Lim et al. did a study in the view of CO2 emissions reduction by applying residential fuel cell [19]. European researchers did several analyses of applying SOFC in the industrial area to reduce CO2 emission [20,21]. On the other hand, a residential fuel cell is mainly studied in Japan in recent years. The CO2 emission density of a public power plant was used to calculate the amount of CO2 emission and CO2 reduction can be calculated by a simulating application of a fuel cell in a household [22,23,24]. The same calculation method was used for environmental analysis in this research. From the energy demand oriented research, Ozawa et al. indicates that SOFC–CHP systems can drastically reduce greenhouse gas (GHG) emissions from a particularly small-sized household [24]. Another aspect studied in this research is the efficient operation of SOFC–CGS in small-sized households in a dormitory building by using a exist model of SOFC–CGS from Japan [25,26,27]. This study analyzed efficiency improvement and environmental impact of operating SOFC–CGS in a dormitory building in Korea by simulating SOFC–CGS operation in multi-households. Under the traditional energy supply method, solid oxide fuel cell cogeneration system (SOFC–CGS) was attempted to simulate applying in the target building of this research. The target building was a dormitory building near a university in Korea. In Korea, the dormitories inside the university campus usually cannot accommodate all of the students registered in the university. Thus, most of the students have to rent a small room for living off campus. Therefore, there are a lot of dormitory buildings near universities in Korea. The dormitory building usually contains several households in each floor and area of one household is around 20 to 30 m2, which can only accommodate one or two students. The target building is near a university campus in Busan. Specifications of the target building can be checked in Table 1 in Section 2.1. SOFC–CGS is a clean energy system that does not release any air pollutants when it generates electricity [6,14,24,28]. The device efficiency and environmental impact were analyzed under the conditions of applying one system to one household and applying one system to multi-households to identify the most appropriate way to operate SOFC–CGS in the building. The model of SOFC–CGS is introduced in Section 4. Four different types of energy supply were considered in this research. The first type was supplying only electricity to the building, and the second type was supplying natural gas and electricity together. According to the analysis result, the second energy supply type emits a relative smaller amount of air pollutants than the first type and the efficiency of using natural gas directly by combustion is much higher than using natural gas by SOFC for heating. Therefore, the third type was applying one SOFC–CGS to one household under the second energy supply type, and the fourth type was applying one SOFC–CGS system to multi-households under the second energy supply type.

1.2. Research Methodology

This study mainly used the commercial software Design Builder (Version 4.5, DesignBuilder Software Ltd, London, UK) to predict energy consumption of the building. In the second part of this research, to simulate operating the SOFC–CGS in the building, a calibrated SOFC–CGS mathematical model was programmed using Visual Basic.NET. The research target building was modeled using Design Builder, and the one-year hourly energy consumption of the building was also predicted using this software. Design Builder as a calibrated software is made in England. This software was mainly used for energy analysis of the building. The calculation model of this software is EnergyPlus (Version 8.2.0, Department of Energy, Washington, USA), which is a calculation engine invented in America for analyzing the heating, cooling, lighting, ventilation, etc., of a building. There are several calculation engines for energy consumption prediction from which DOE-2 (Version 2.1E, Department of Energy, Washington, USA), DeST (Version 2.0, Tsinghua University, Beijing, China), and EnergyPlus are mainly used for the analysis of the energy consumption of buildings. Xin et al. compared the simulation performance among these three different calculation engines. Compared with EnergyPlus and DeST, DOE-2 is limited in the basic assumption of the heating, ventilation and air conditioning (HVAC) system calculations [29]. Therefore, the commercial software Design Builder with the calculation engine EnergyPlus was chosen for doing this research. The air pollutants of the research target building were calculated and compared under the conditions of using the traditional method of supplying energy to the building and new method of supplying energy to the building by referring to the air pollutant emission densities of electricity and natural gas in Korea. Finally, the environmental impact and efficiency analyses of operating the SOFC–CGS in the building were conducted.

2. Energy and Environmental Analysis of the Dormitory Building

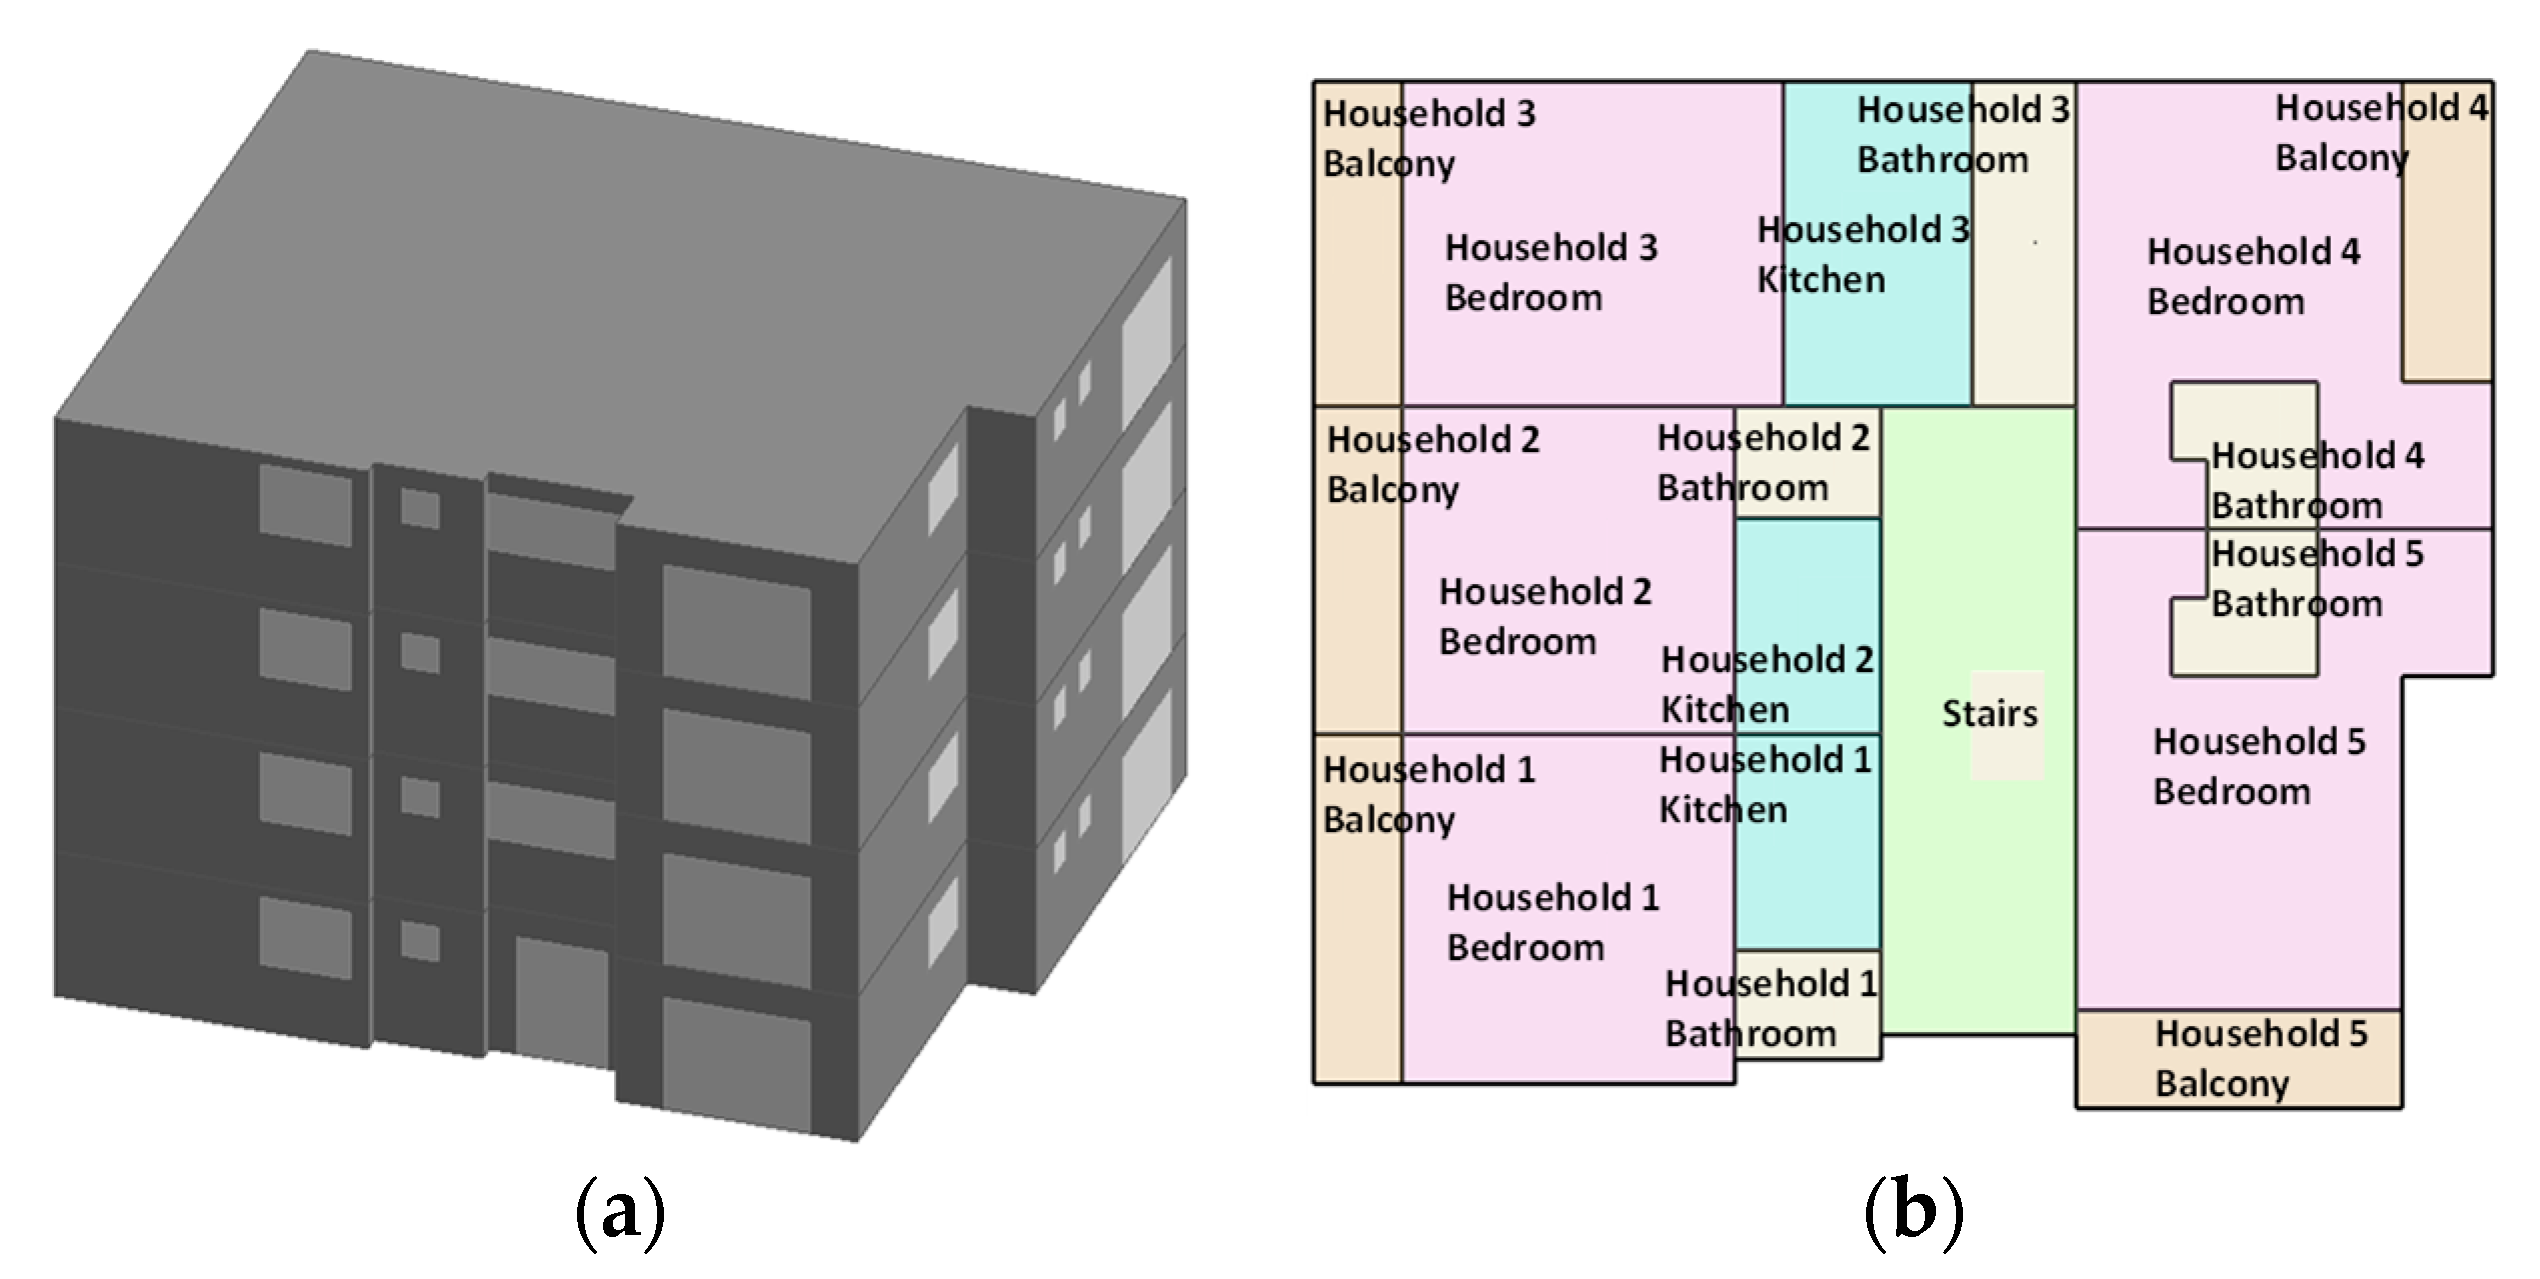
2.1. Modeling of the Dormitory Building

There are a lot of dormitories for accommodating students near the campus of universities in Korea. Each room in the buildings typically can accommodate one or two students. Most of the dormitory buildings are constructed so that there is a supply of natural gas and electricity to the building. However, recently, some newly developed dormitory buildings have been constructed to use only electricity for all of the energy needs. One of these newly developed buildings was selected for this research. To predict the energy consumption of the building, a model of the building was made using Design Builder, and the 3D model and configuration are shown in Figure 2.
According to the energy and environmental analysis of the dormitory building in a previous study [30], to predict the energy consumption of the building precisely, weather data of Busan, Korea, were acquired, and the occupancy schedule of different partitions of the building were referred from ASHRAE standard 90.2, 2010 [31]. Basic weather data were listed in Table 2. Moreover, the energy consumption standard of a building in Korea was referred from the Korean Energy Agency to build the model. According to this standard, heating, cooling, resident density, lighting density, and equipment density were set as in Table 3 [32]. According to Korean Construction Law, the construction thermal specifications of external wall, internal wall, roof, and floor were set, as listed Table 3 [32,33,34]. Since this building uses only electricity, cooling and heating were both set from electricity. Table 3 briefly summarizes the building specifications of the dormitory building.

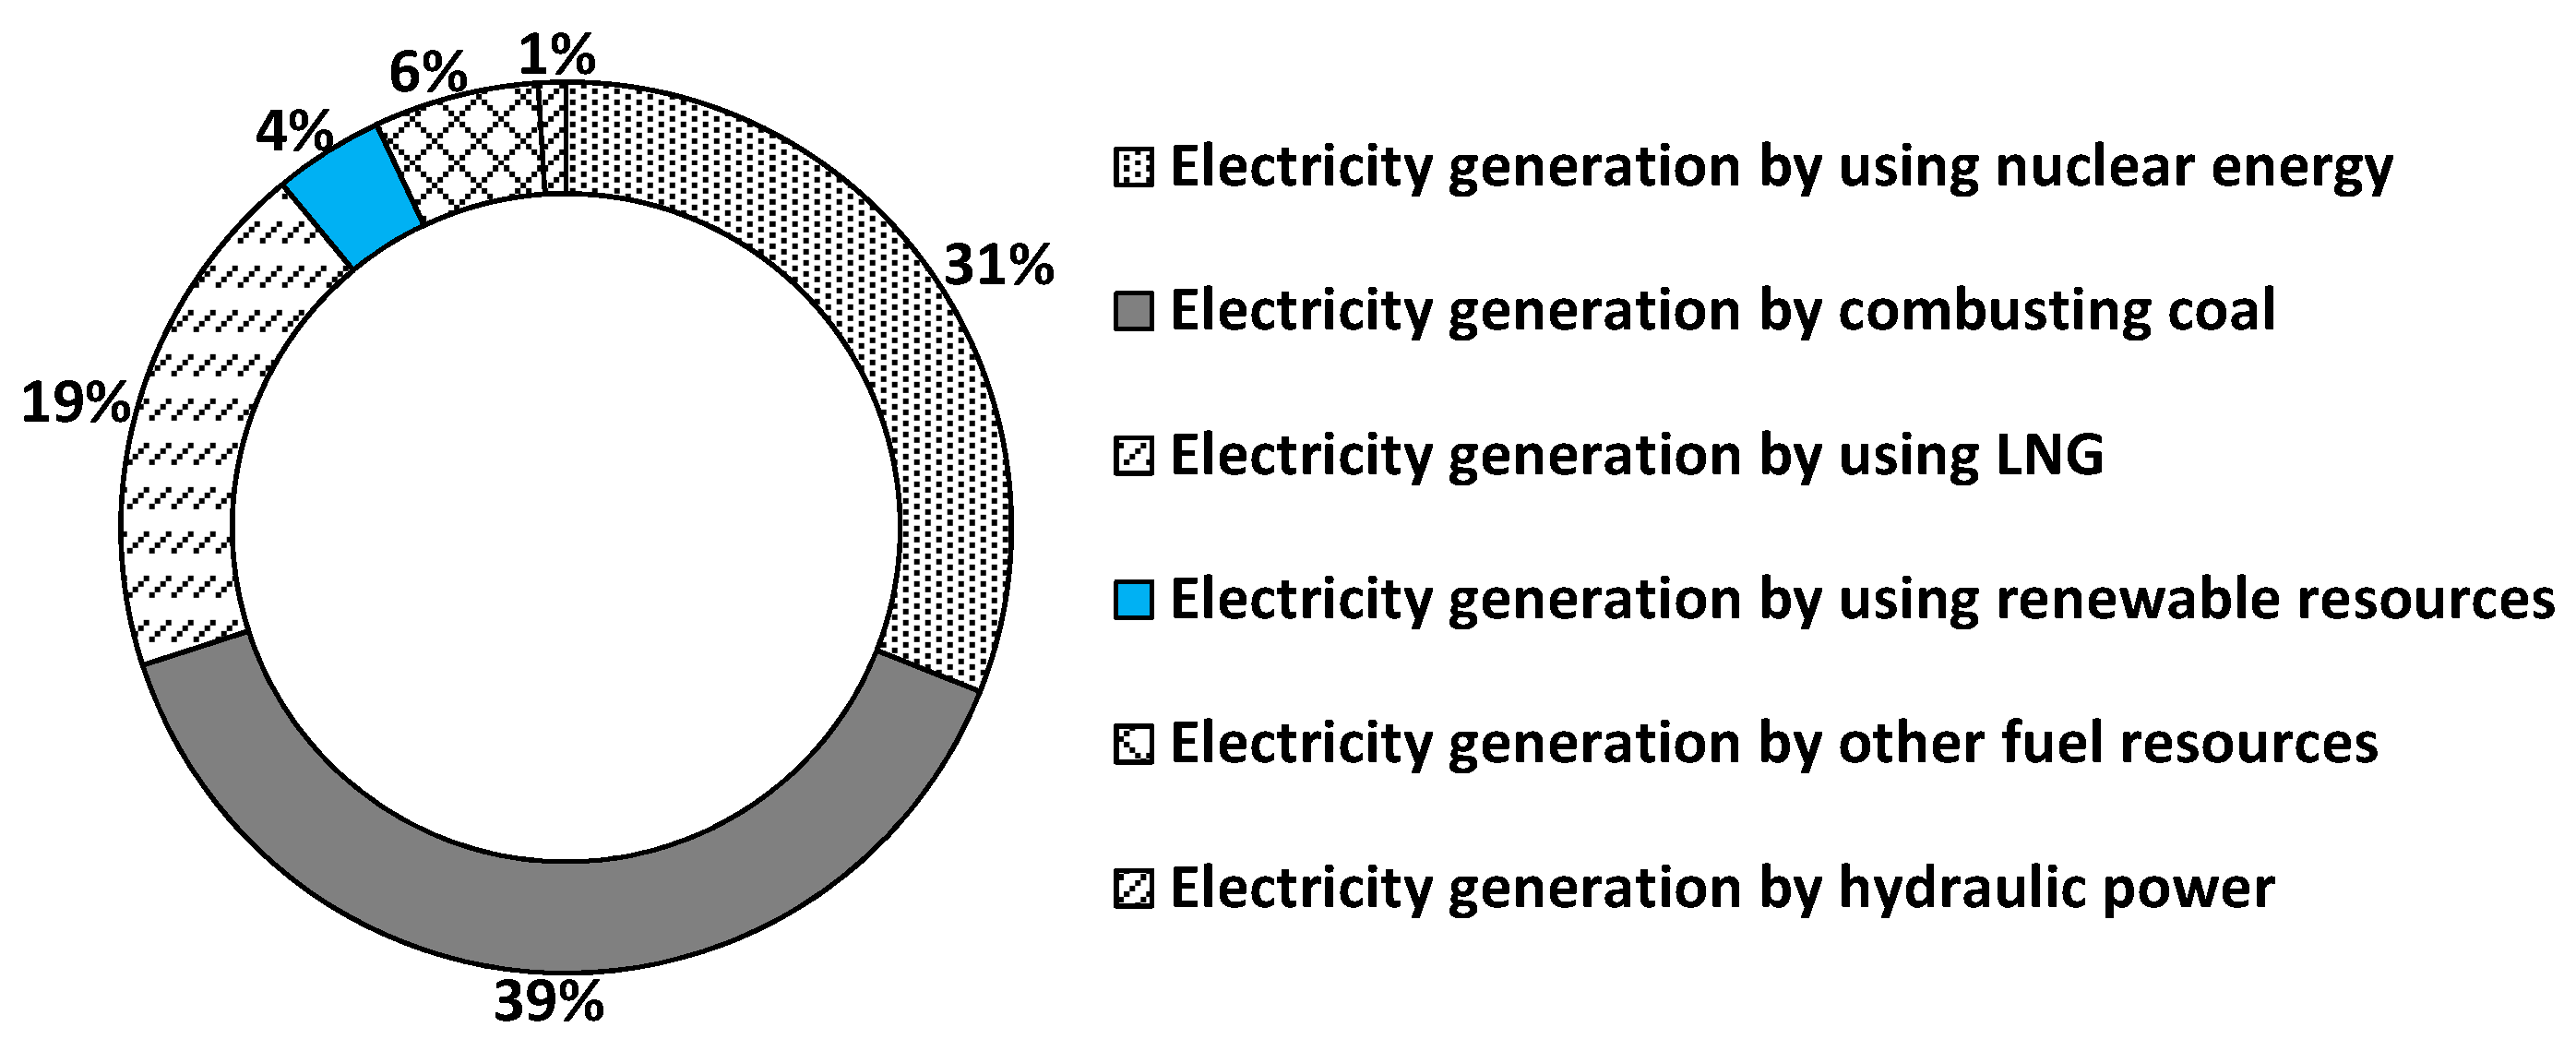
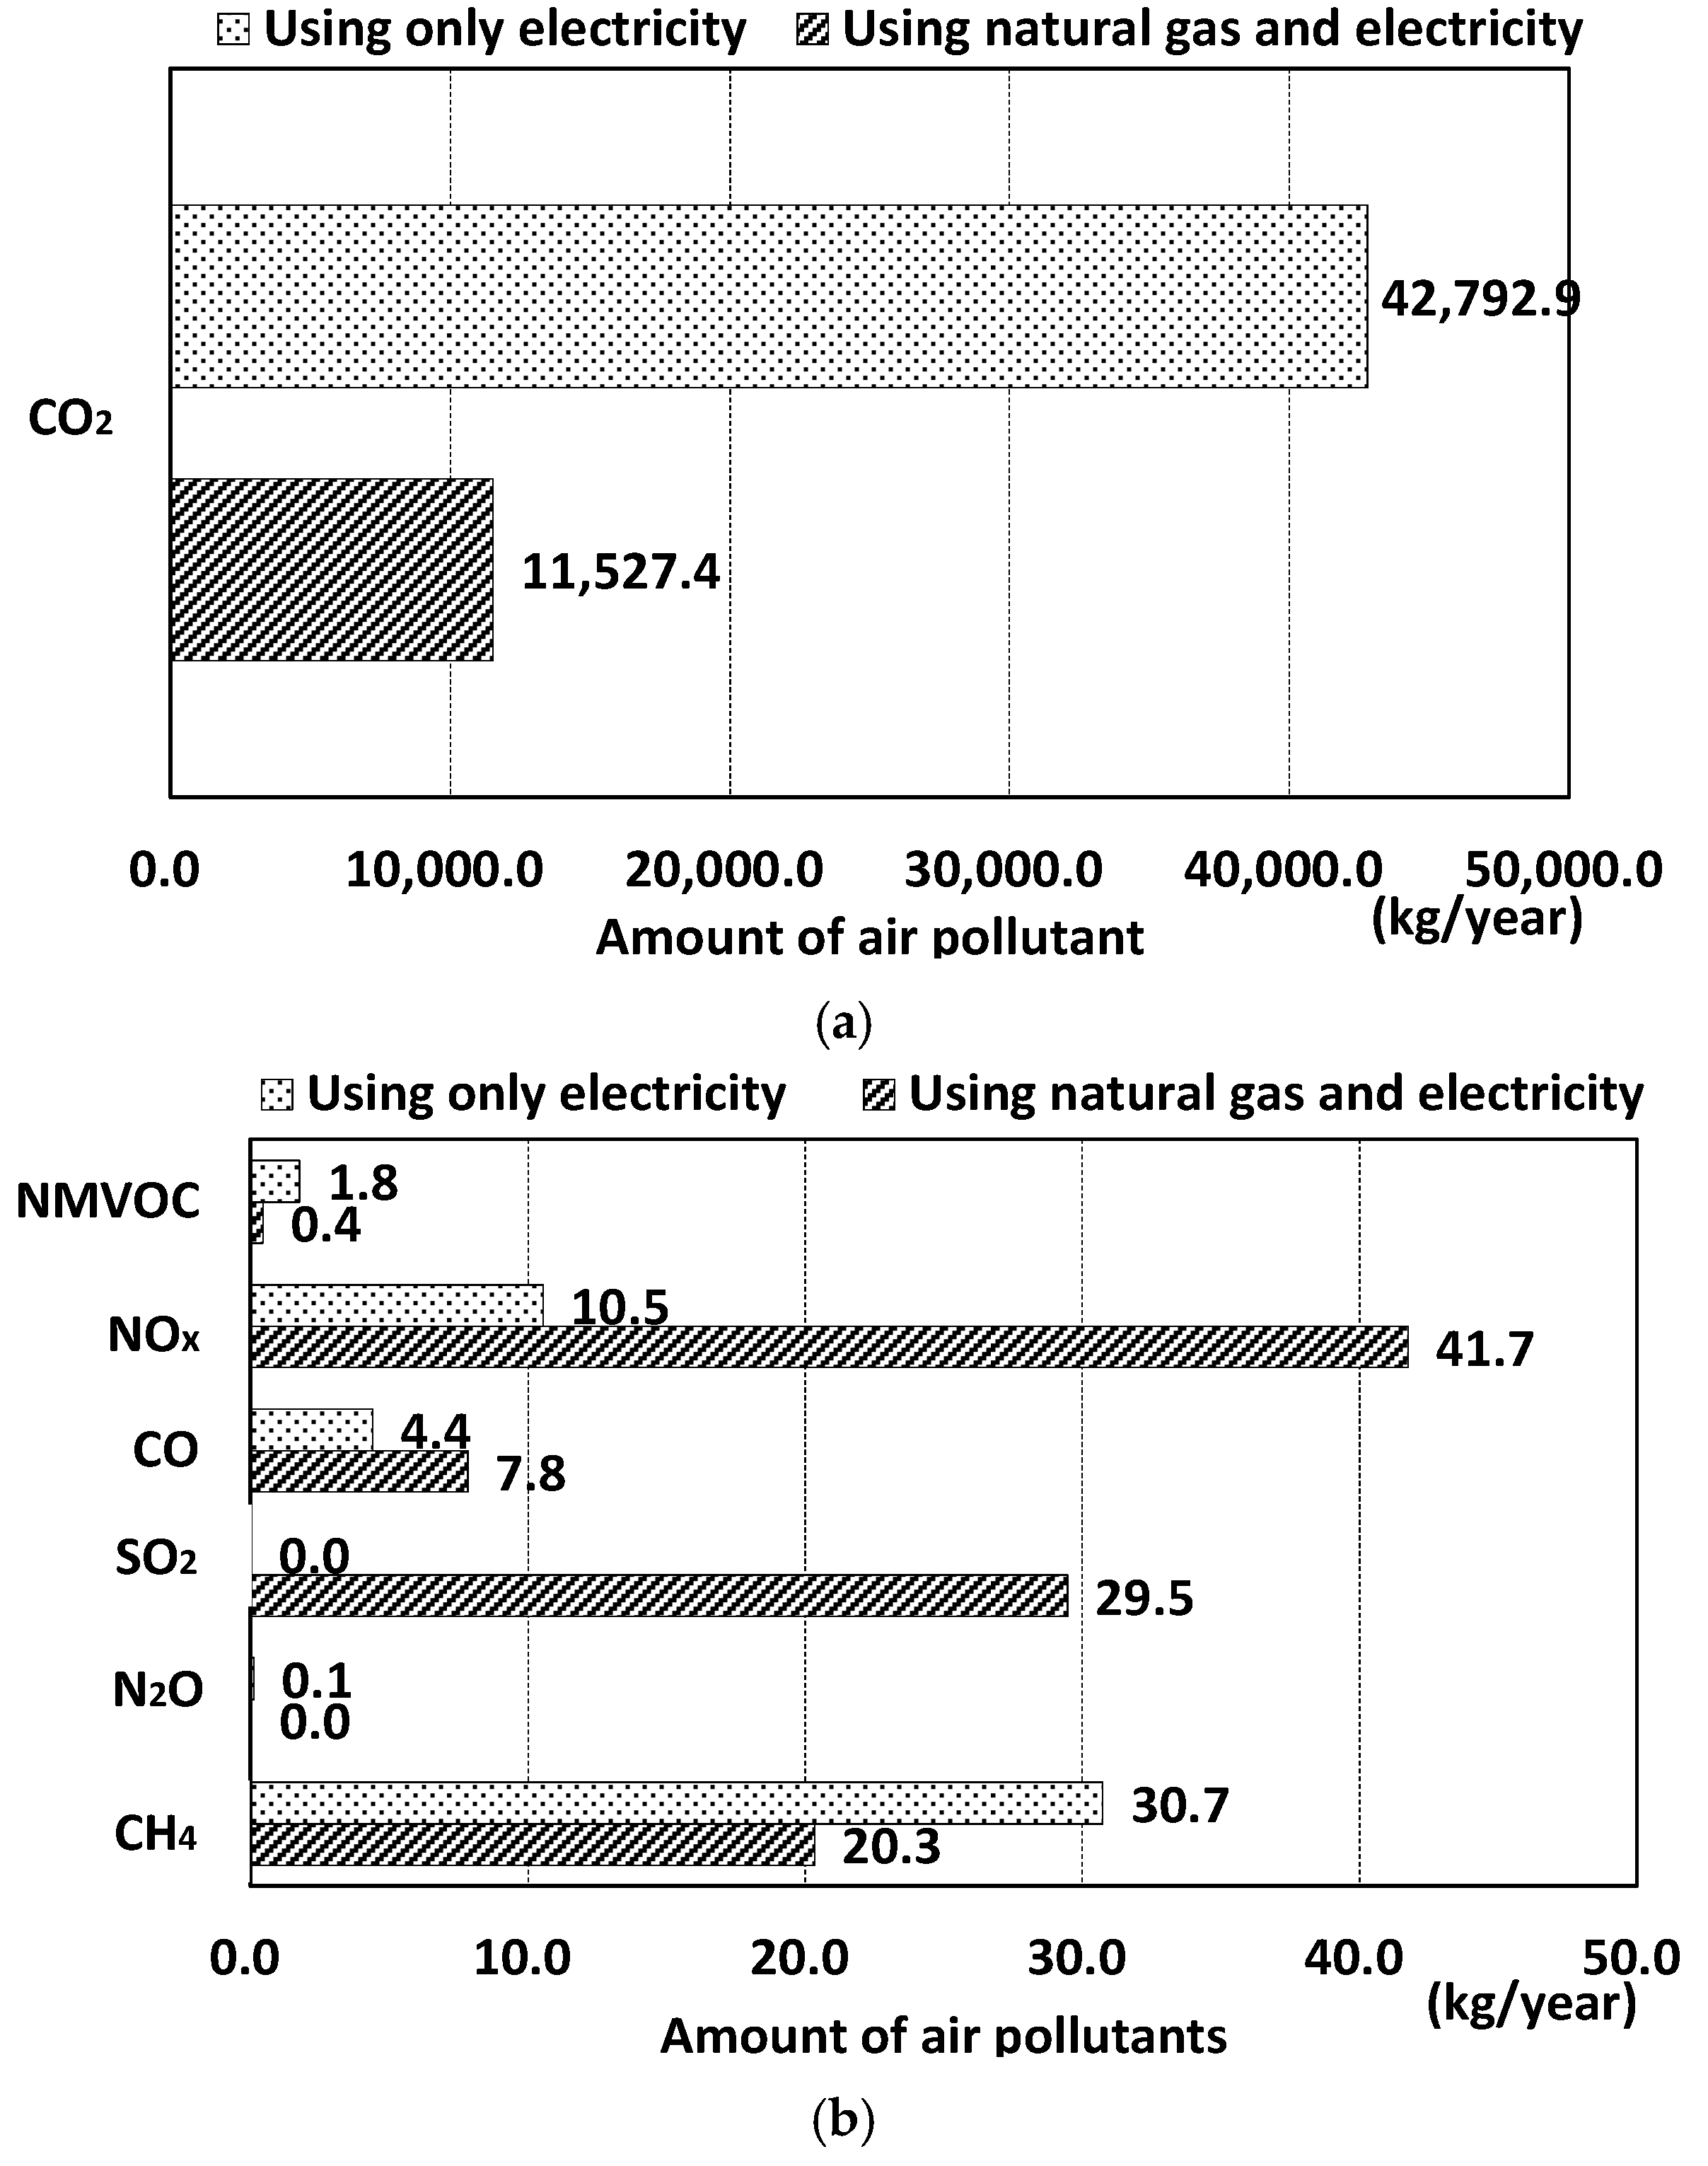
2.2. Energy and Environmental Analyses

According to the building model made using Design Builder in Section 2.1, the one-year energy consumption of the building was predicted. The energy analysis result showed that the one-year energy consumption of the building was 87,830.78 kWh when only electricity was used in the building. On the other hand, when natural gas and electricity were used together, the one-year electricity consumption was 18,013.7 kWh and the one-year natural gas consumption was 69,817.1 kWh.
To calculate the annual air pollutants emission of the building, the air pollutant emission densities of electricity and natural gas were referred from the Korea Environmental Industry and Technology Institute, as listed in Table 4 [32,35]. The one-year air pollutants of the building when only electricity was supplied and when natural gas and electricity were supplied together were calculated and compared. The environmental analysis result showed that the amount of CO2 emission was much larger when the building used only electricity than when the building used electricity and natural gas together, as shown in Figure 3. On the other hand, emissions of other air pollutants, such as CH4, N2O, SO2, CO, NOX, and NMVOC, were much lower than CO2 emission. This means that the building using natural gas and electricity together was much cleaner than the building using only electricity for all energy needs.

3. Modeling of SOFC–CGS

The residential fuel cell as a clean energy device is used widely in Japan. Since environmental problems including air pollution have been getting worse recently in Korea, implementation of the residential fuel cell as a clean energy device in buildings in Korea is necessary. Therefore, this research analyzed the efficiency and environmental impact of operating SOFC–CGS in a dormitory building in Korea, as mentioned in previous sections.
Typical approaches of fuel cell modeling in recent research were summarized in Table 5. In order to evaluate and optimize the performance of fuel cell, electrochemical models were developed to simulate the specific chemical and energy interaction inside the cell stack [36,37,38]. On the other hand, in order to evaluate and improve the device operation efficiency and CO2 reduction by using fuel cell for transportation or residential, fuel cell modeling by mainly using device efficiency was developed to simulate operating fuel cell in household or for EV [11,22,24]. In this research, the modeling of SOFC–CGS by mainly using the efficiency of the device was developed to simulate the application of SOFC–CGS in a dormitory building in Korea.

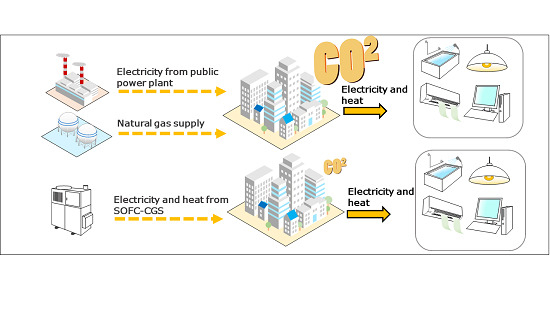
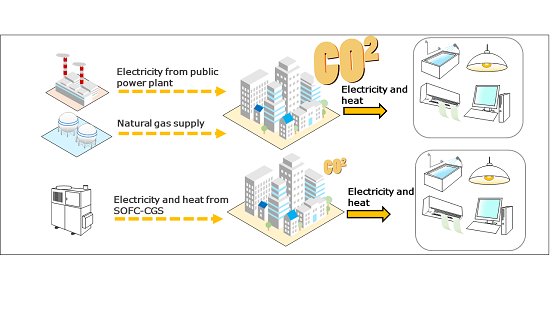
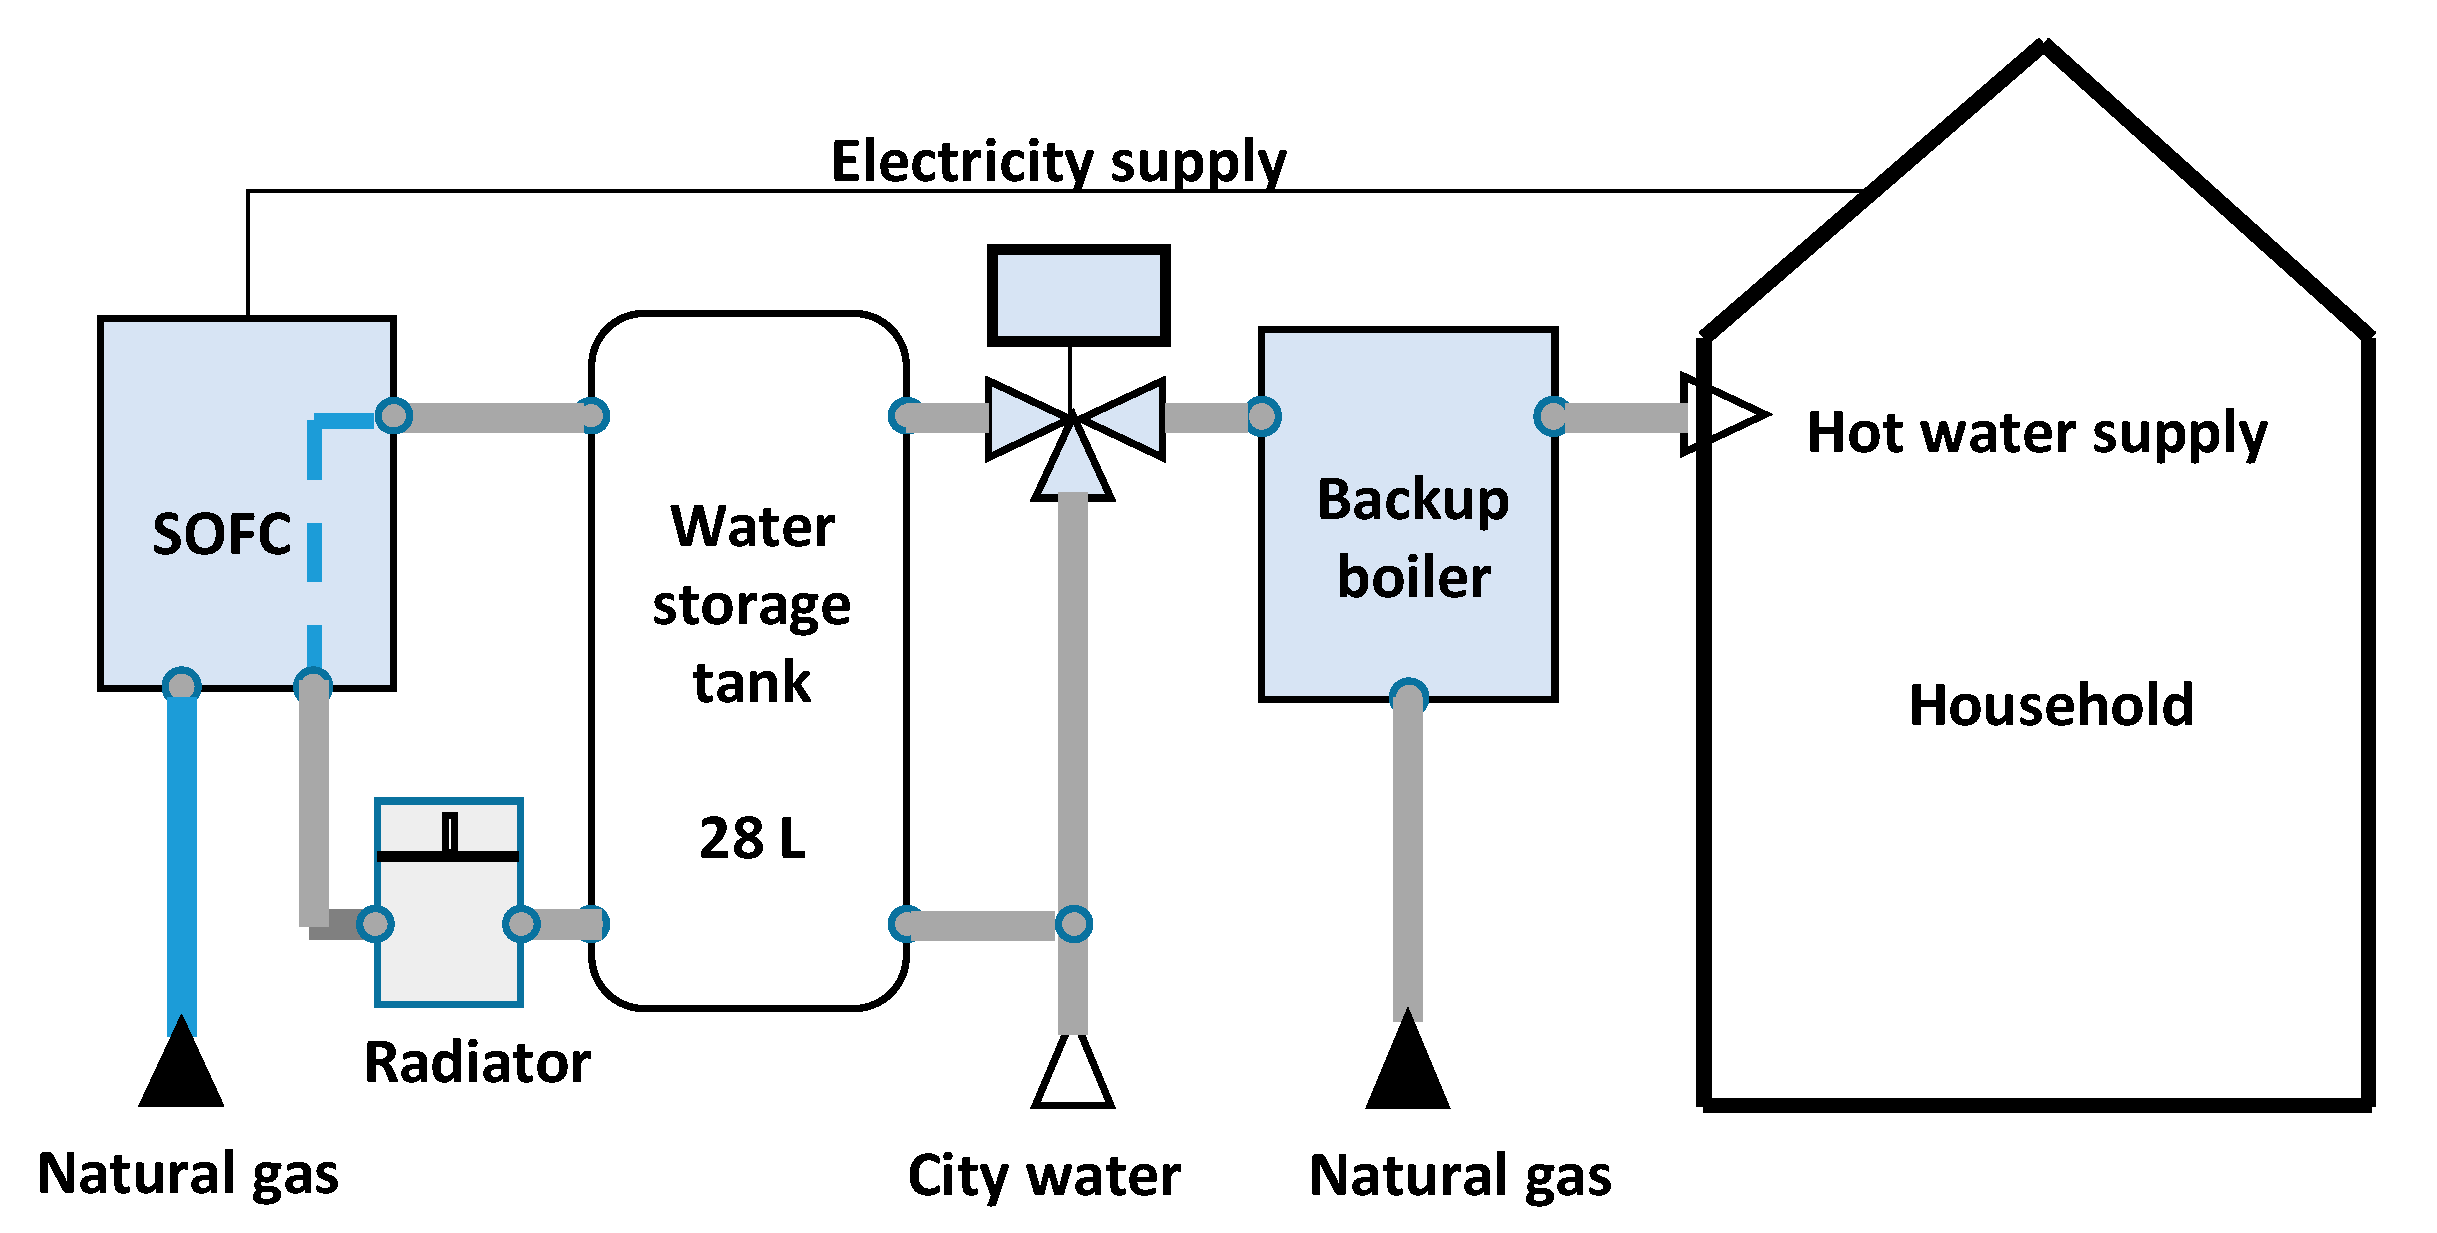
3.1. Explanation of SOFC–CGS

Residential SOFC, as a clean energy supply device, has relatively low efficiency. Due to heat losses, the highest electricity generation efficiency of SOFC is about 46.4% [24,27]. To improve the efficiency of SOFC, SOFC–CGS was developed [24,25,27]. Heat losses from SOFC are collected to heat water, and a backup boiler is used for reheating the water to meet the demand temperature. A 28 L water storage tank was used in this system, as illustrated in Figure 4. SOFC uses natural gas to generate electricity to supply the electricity demand of a household. The heat losses of SOFC are collected and transferred to the water storage tank by a water tube. The limit temperature control of the storage tank is 65 °C, and the temperature of the storage tank is adjusted by controlling the water flow rate in the tube that collects heat from the SOFC. If the input water temperature through the radiator is higher than 34 °C, the radiator reduces the water temperature to 34 °C, then the water can enter the SOFC to collect heat. Hot water outputs from the storage tank to the household when hot water is needed. In this system, the city water temperature was set as 15 °C, and the hot water temperature demand was set as 40 °C. The output water temperature from the water mix device was set to be equal to or less than 33 °C. If the water output from the storage tank was equal to or less than 33 °C, hot water directly entered the backup boiler for reheating of the water to 40 °C and then the hot water at 40 °C was provided to the household. If the output water temperature from the storage tank was higher than 33 °C, the water mix device mixed city water and water from the storage tank to attain the temperature of 33 °C, and then, through the backup boiler, water was heated to 40 °C to supply the household. This system is illustrated as Figure 4. The specifications of the SOFC–CGS in this study are shown in Table 6, and the efficiency of electricity generation and heat collection of the SOFC–CGS are shown in Figure 5. The mathematical equation of the electricity generation efficiency is written as Equation (1). The efficiency of heat collection of the SOFC–CGS was constantly 31%.
EFFElSup = 0.6868LF3 − 1.6829LF2 + 1.4601LF.
In the equation, EFFElSup is the efficiency of electricity generation of the SOFC and LF is the load factor of electricity generation.

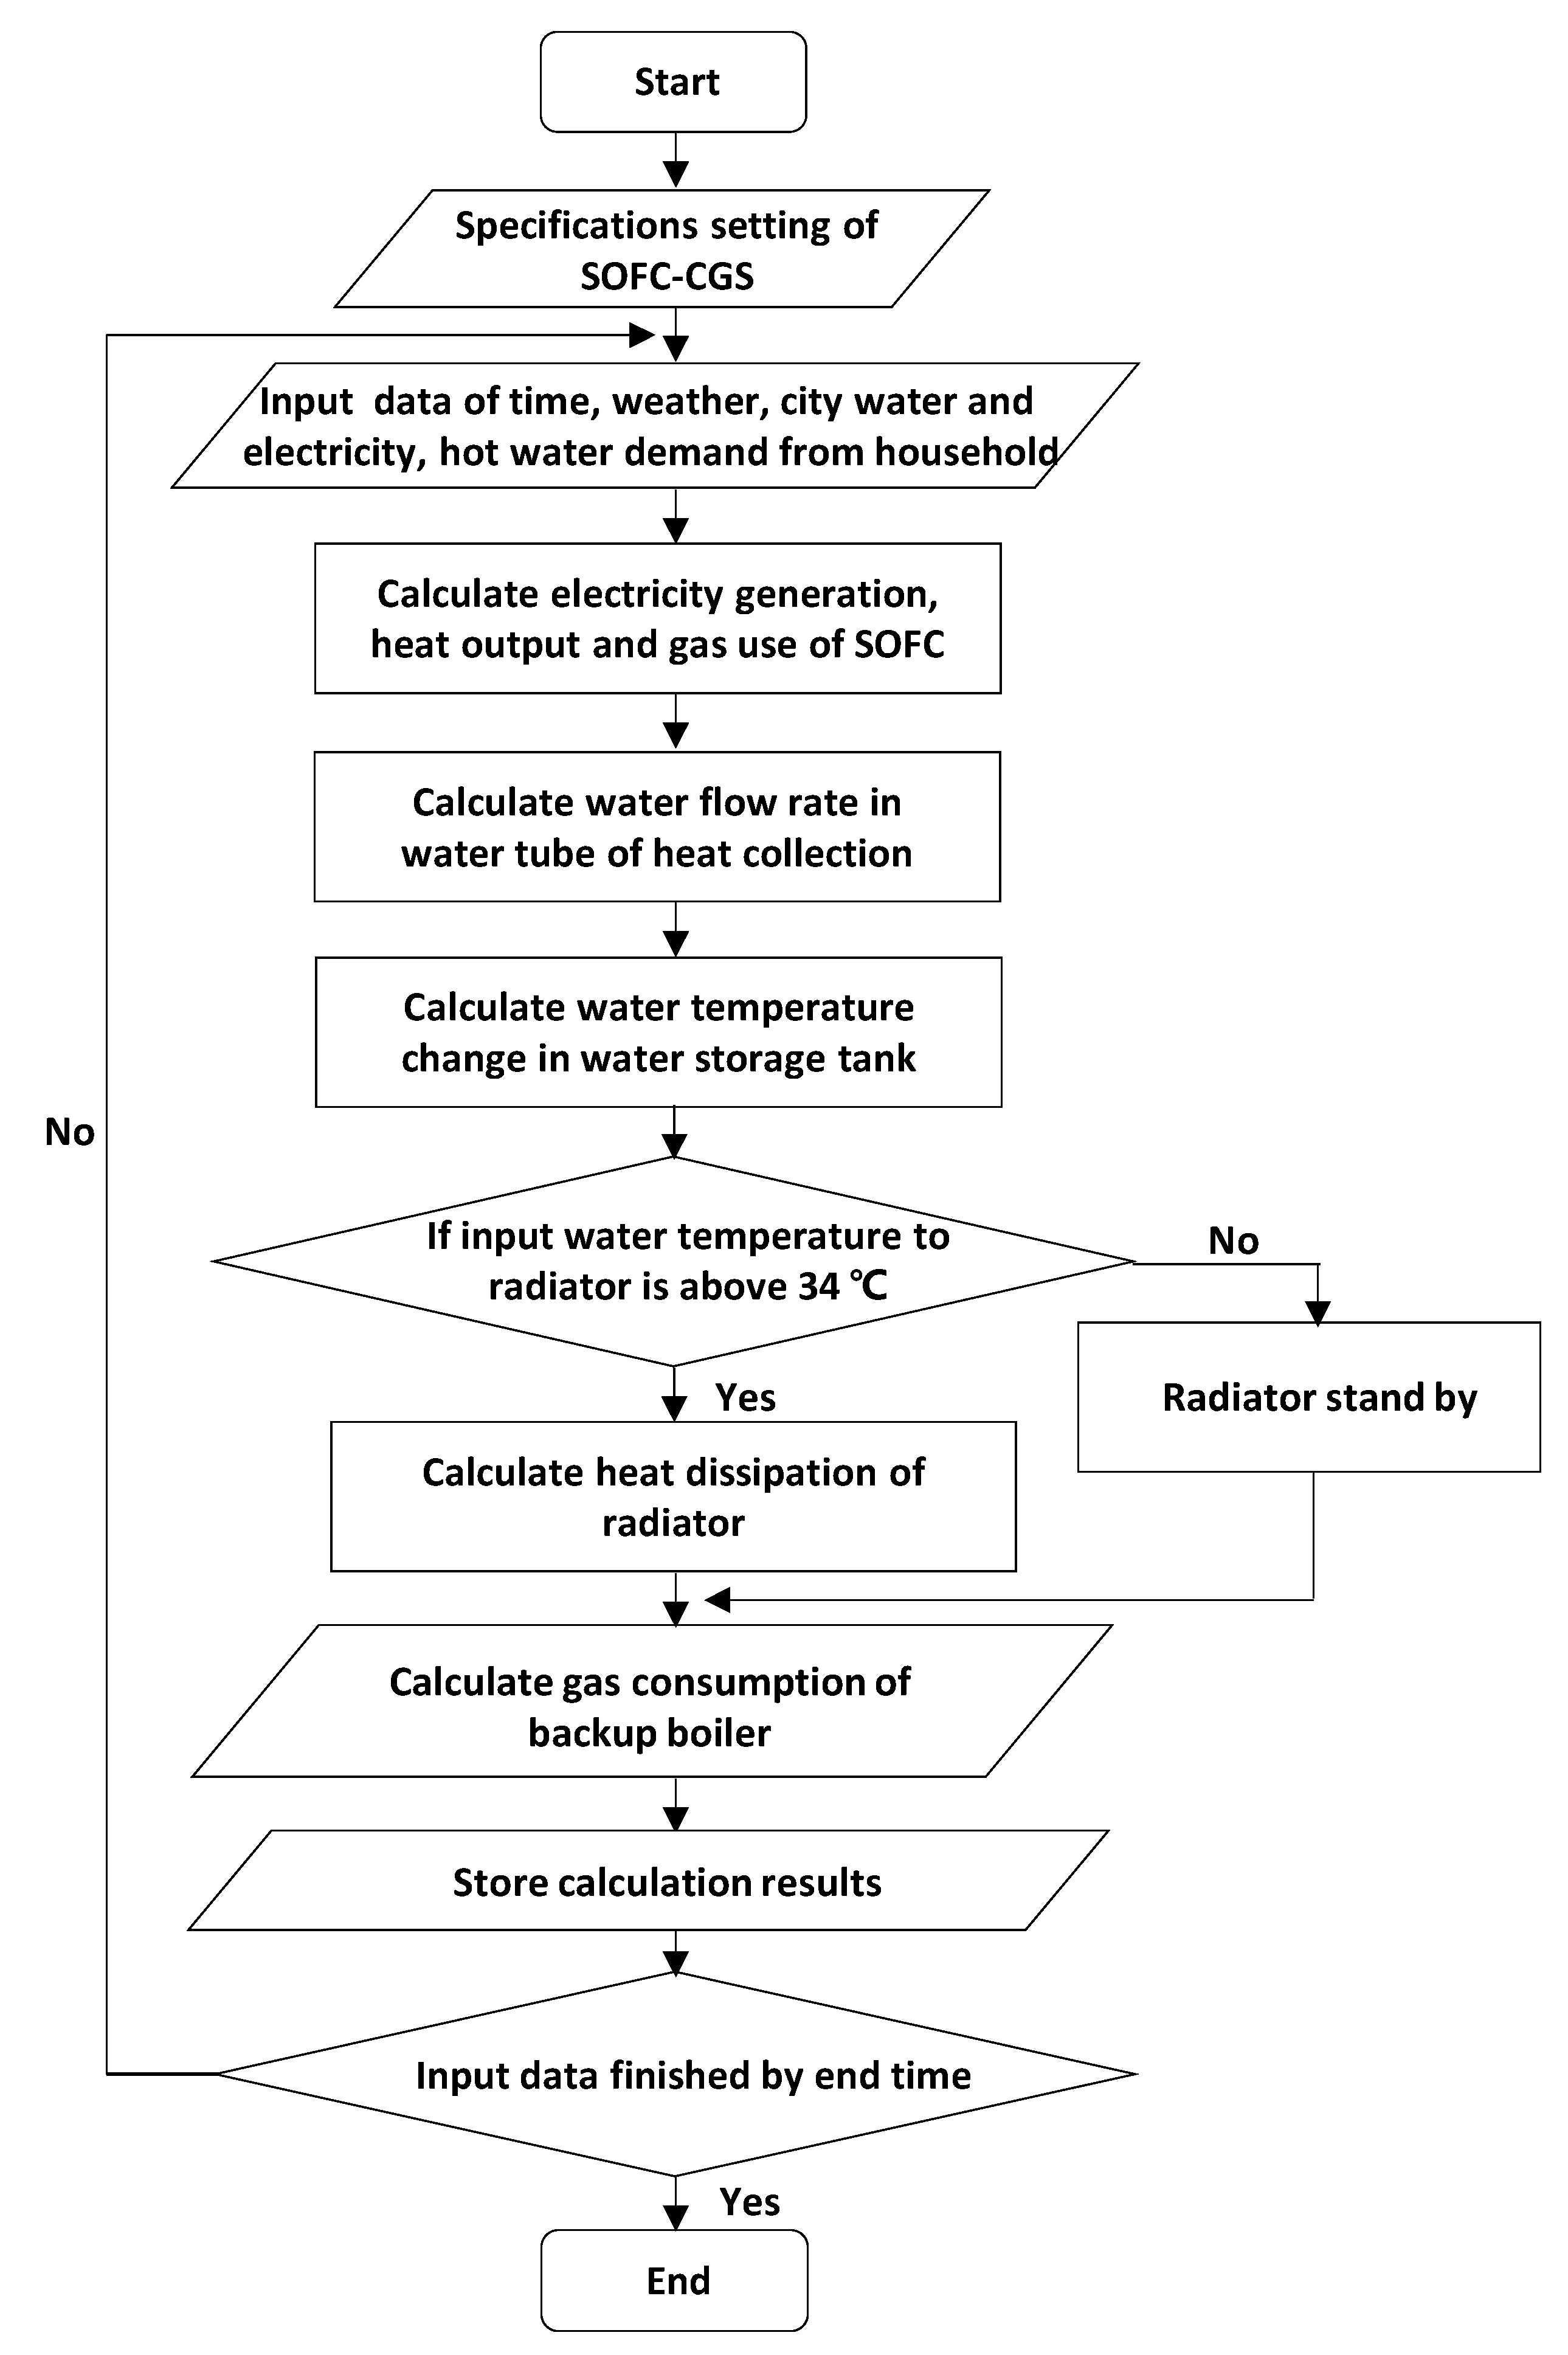
3.2. Mathemetical Model of SOFC–CGS

In this study, the mathematical model of SOFC–CGS was referred from recent research from Kyushu University [25,26,27]. The electricity generation calculation follows the steps below. Firstly, depending on the electricity generation tracking speed, the maximum electricity supply capability can be determined by Equation (2):
PSupmax = −PElSup + VElSupSpItint,
where PSupmax is the maximum electricity supply capability, PElSup is the amount of electricity generation, VElSupSp is the electricity generation tracking speed, and Itint is the calculation time interval. Then, according to the household electricity demand, the electricity supply from SOFC can be determined. Following Equations (3) and (4), the amount of natural gas consumption by SOFC can be calculated:
LF   =   P ElSup P ElMax
P EhCell   =   P ElSup EFF ElSup ,
where LF is the load factor of electricity generation, PElMax is maximum electricity generation capacity of SOFC, PEhCell is the amount of natural gas consumption of SOFC, and EFFElSup is the efficiency of electricity generation. The amount of heat output from SOFC can be calculated by Equation (5):
PHtSup = PEhCellEFFHtSup,
where PHtSup is the amount of heat output from SOFC and EFFHtSup is the heat output efficiency of SOFC, which is 31%.
The water flow rate in the water tube that collects heat can be calculated using either Equation (6) or Equation (7). If the input water temperature through the radiator unit is higher than or equal to 34 °C, Equation (6) is used to calculate the water flow rate in water tube; otherwise, Equation (7) is used to calculate it.
V wCell   =   P HtSup C w ( T out 34 )
V wCell   =   P HtSup C w ( T out T in ) .
In the equations, VwCell is the water flow rate in the water tube; PHtSup is the amount of heat supply from SOFC; Tout is the target output water temperature from the SOFC, which was set as 65 °C in this study; Tin is the input water temperature to the radiator unit; and Cw is the specific heat of water.
If the water temperature is higher than 34 °C, the heat dissipation of the radiator unit is determined by Equation (8); otherwise, the heat dissipation of the radiator unit is zero:
PRad = VwCellCw(Tout − Tin),
where PRad is the heat dissipation from the radiator unit. The amount of heat output from the backup boiler is determined by Equation (9), and the amount of gas used in the backup boiler is calculated from Equation (10):
PBBSup = VolHwDmdCw(TDmd−TBBin),
P BBUse   =   P BBSup EFF BB ,
where PBBSup is the amount of heat output from the backup boiler, PBBUse is the amount of gas used in the backup boiler, TDmd is the water temperature demand from the household, TBBin is the input water temperature to the backup boiler, VolHwDmd is the amount of hot water demand from the household, PBBUse is the amount of gas used in the backup boiler; and EFFBB is the working efficiency of the backup boiler, which was set as 95% in this study.
The calculation flow of the program and the input data are shown as Figure 6 and Table 7.

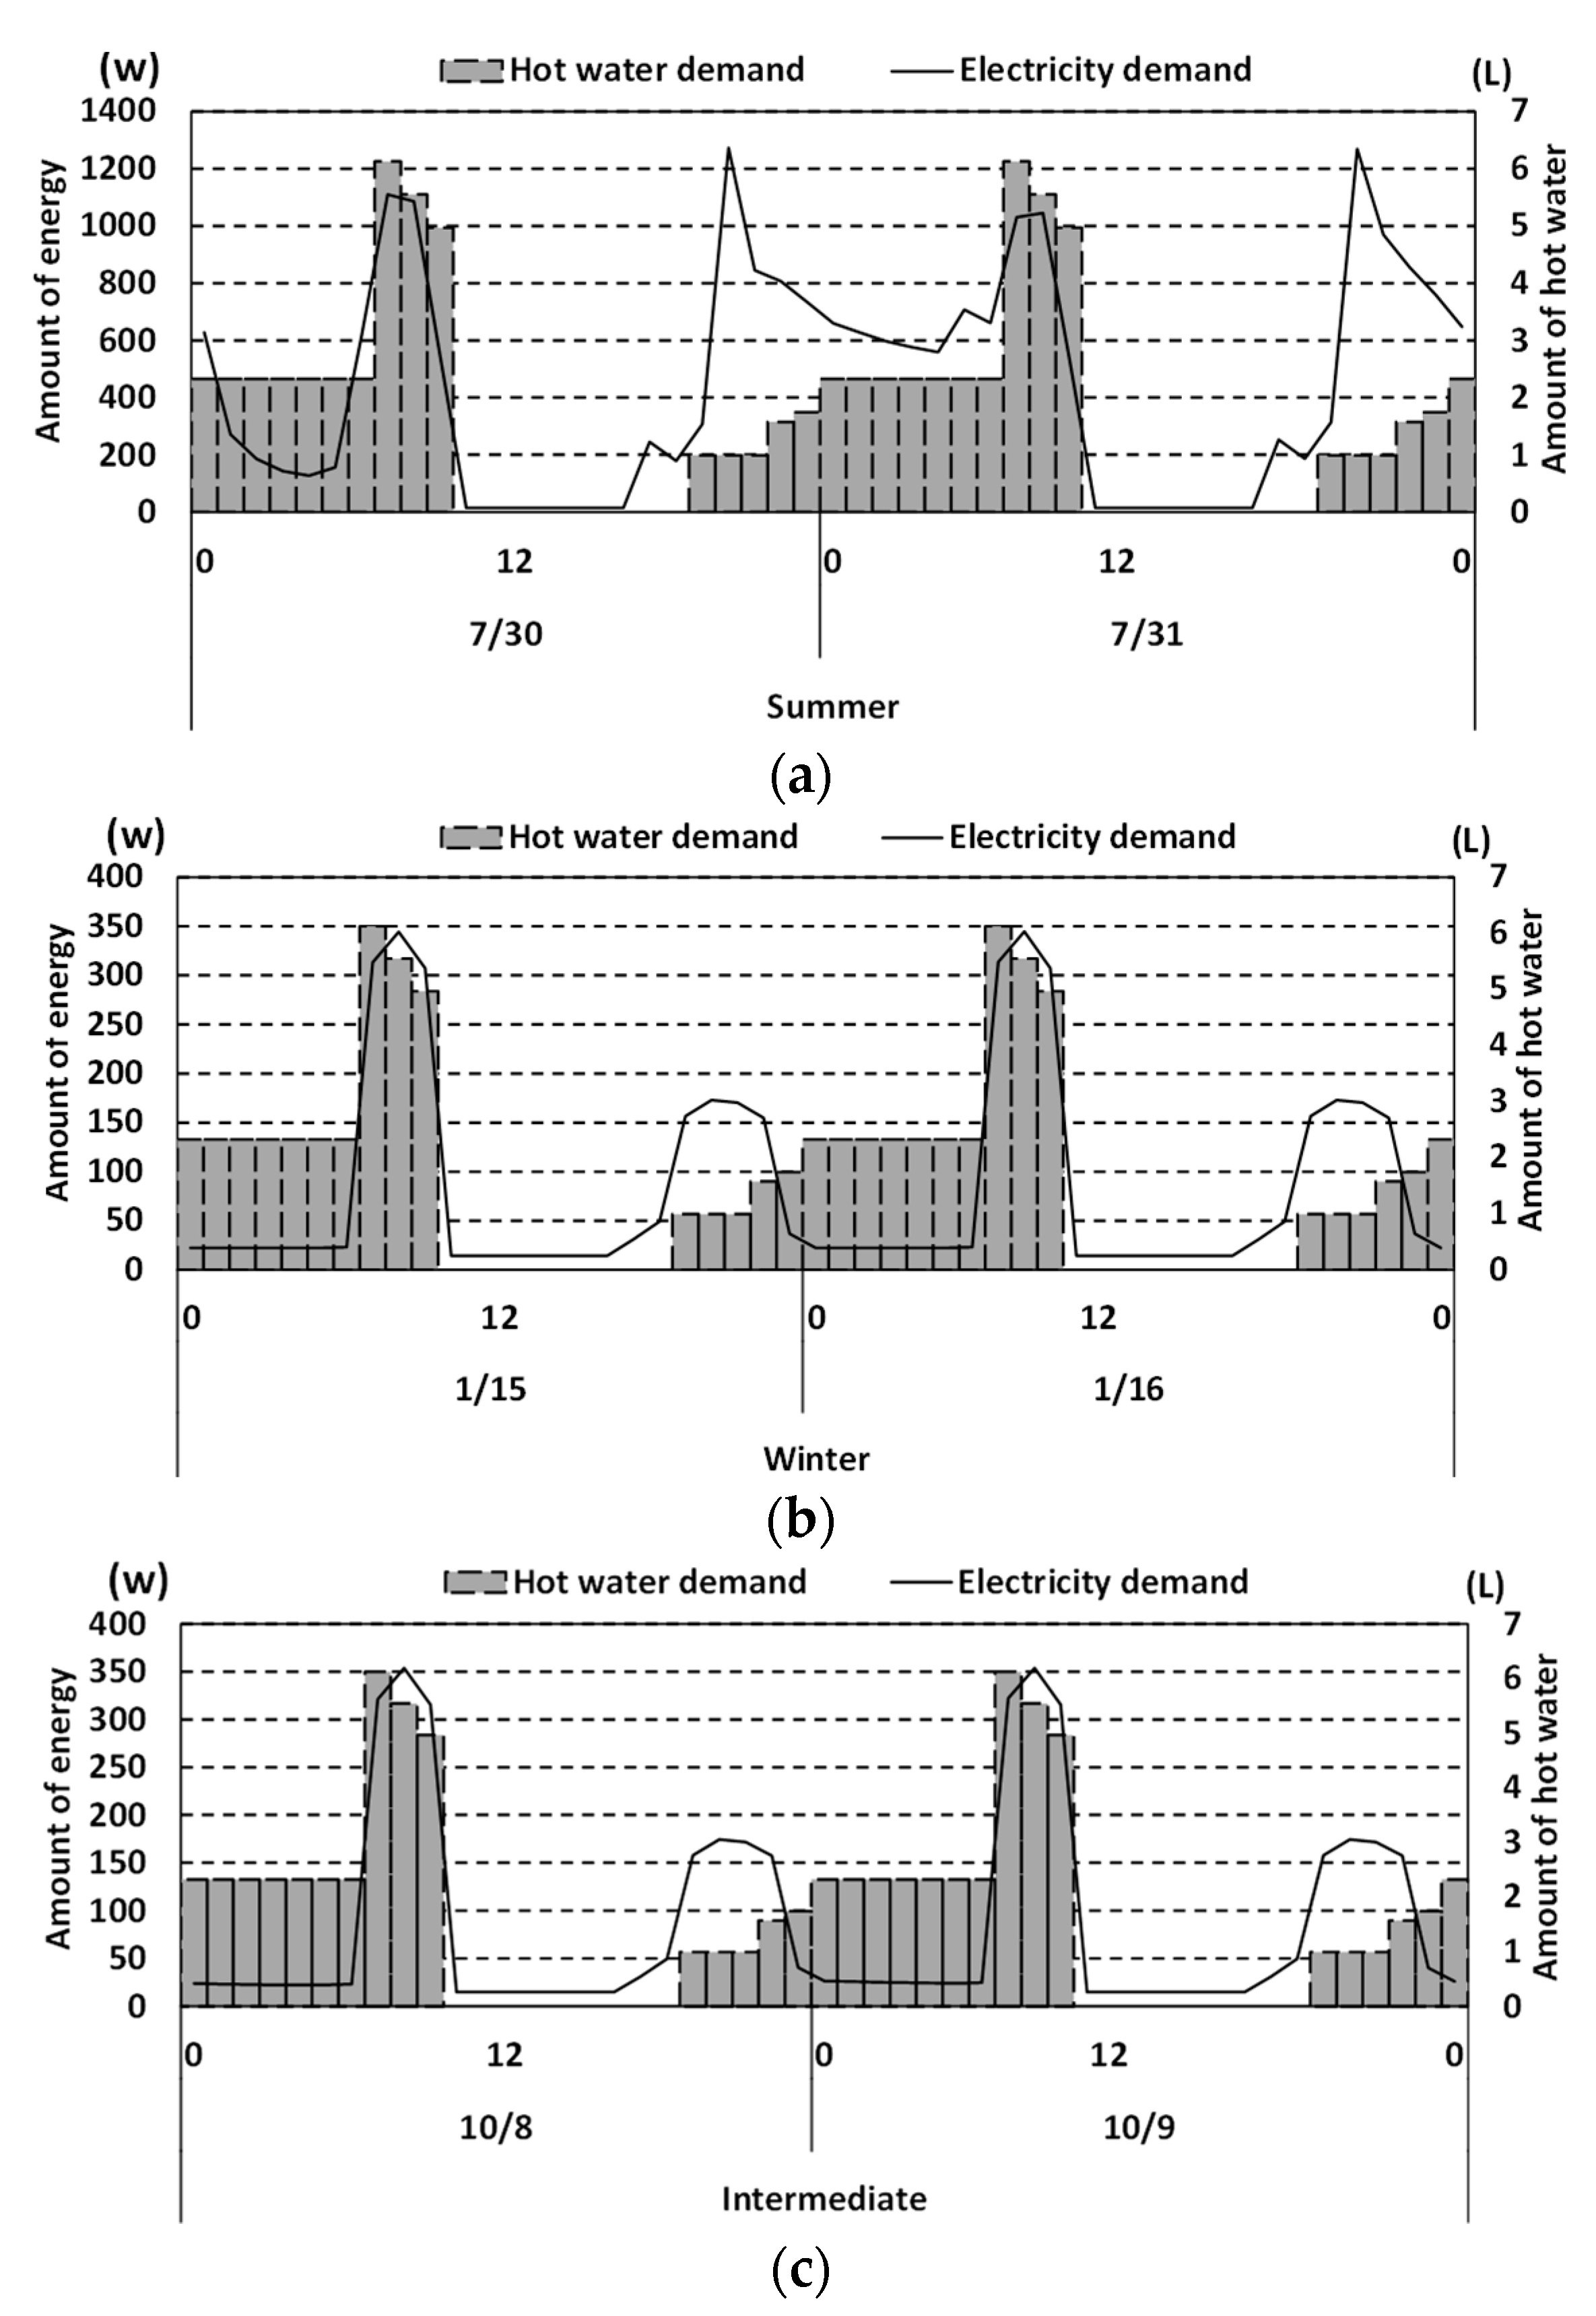
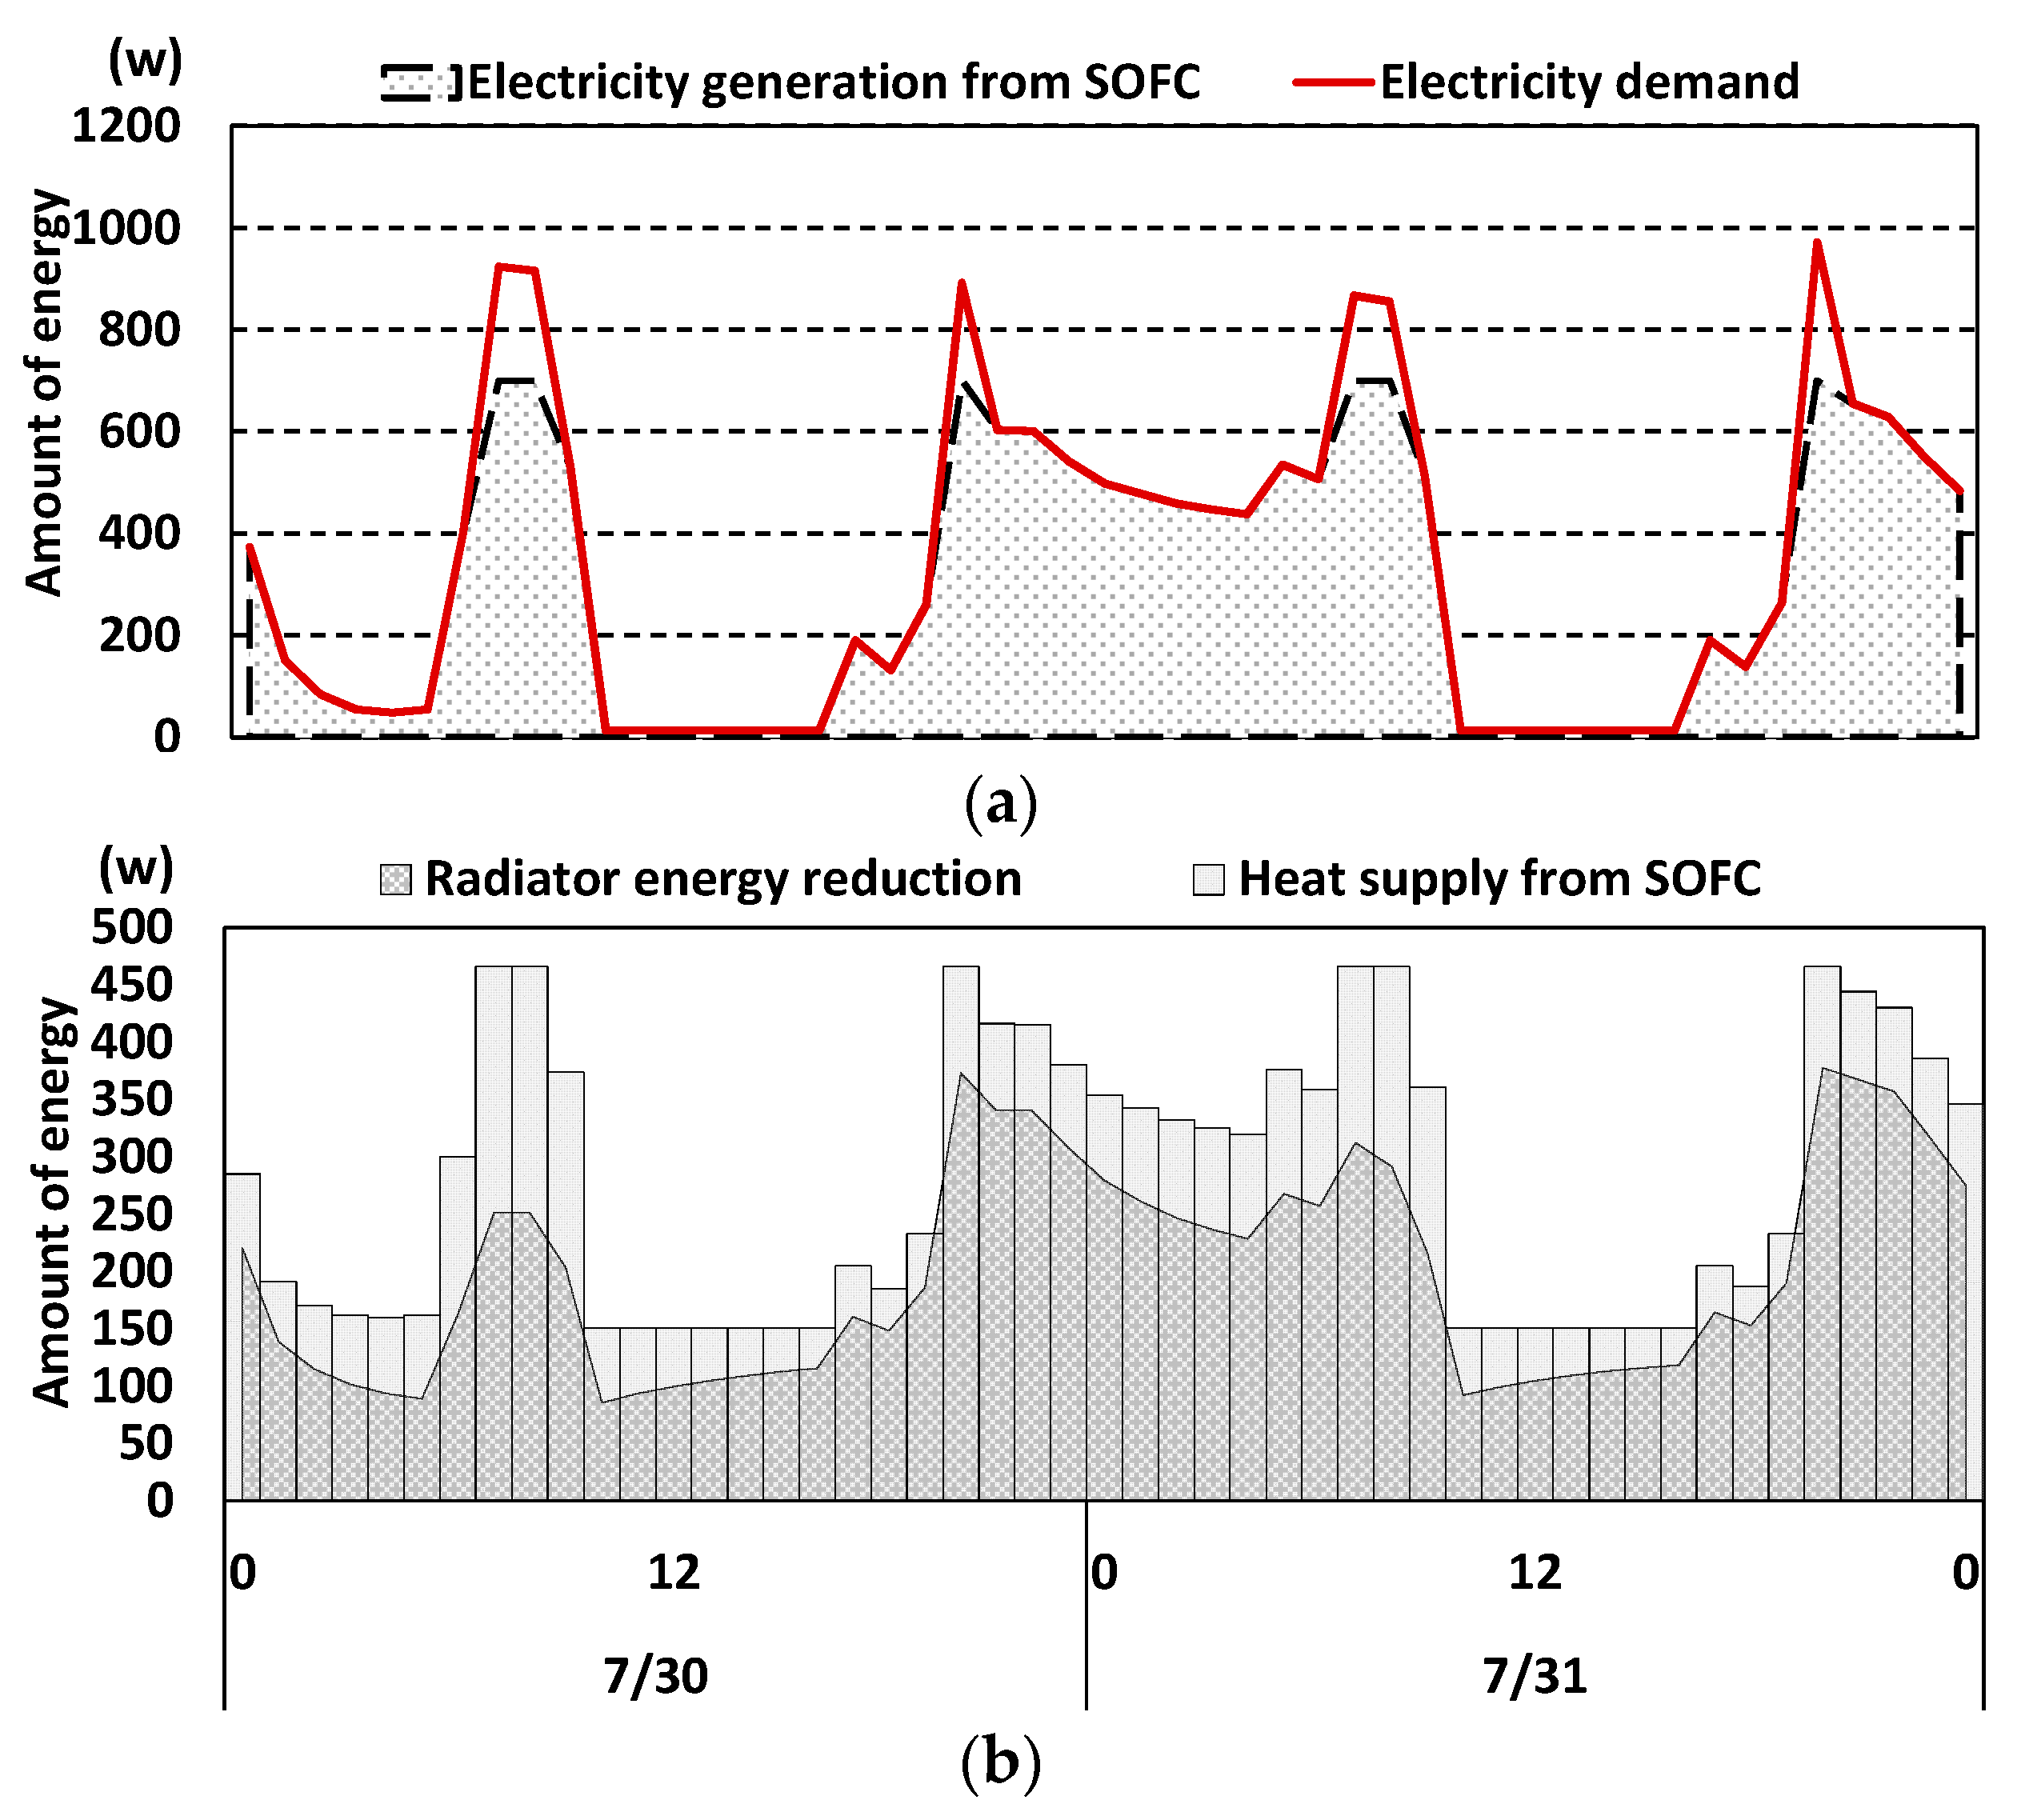
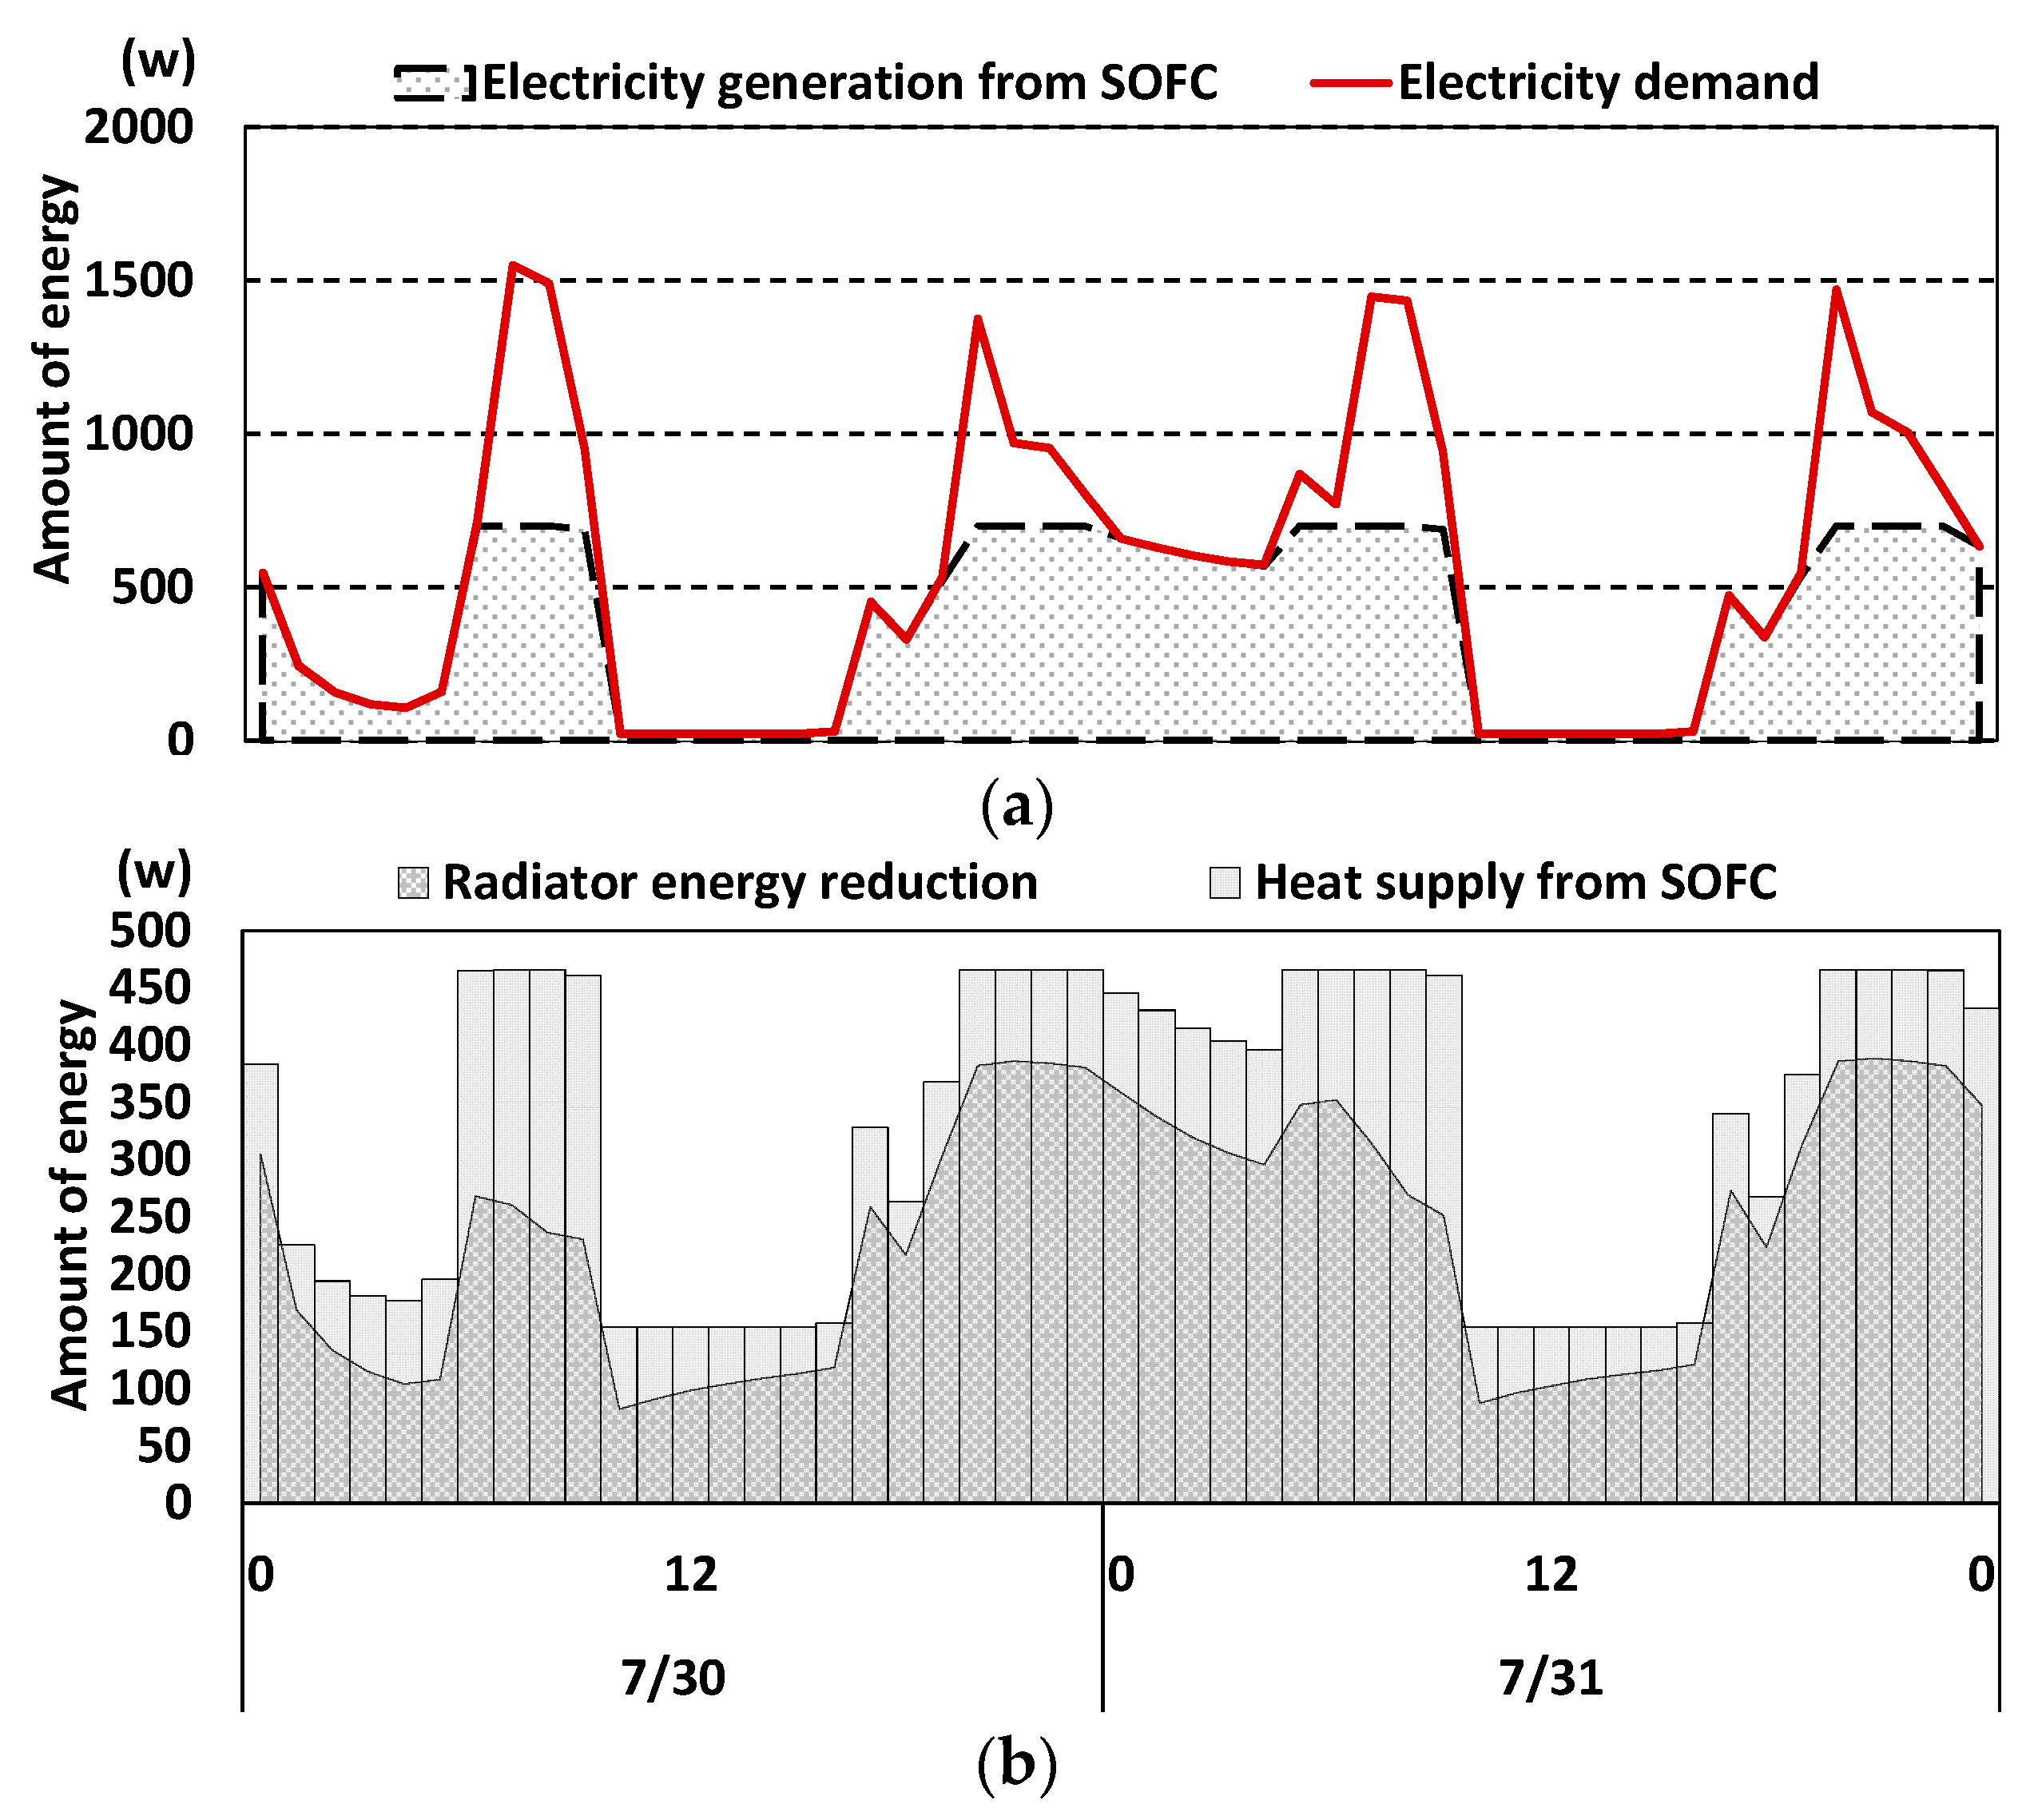
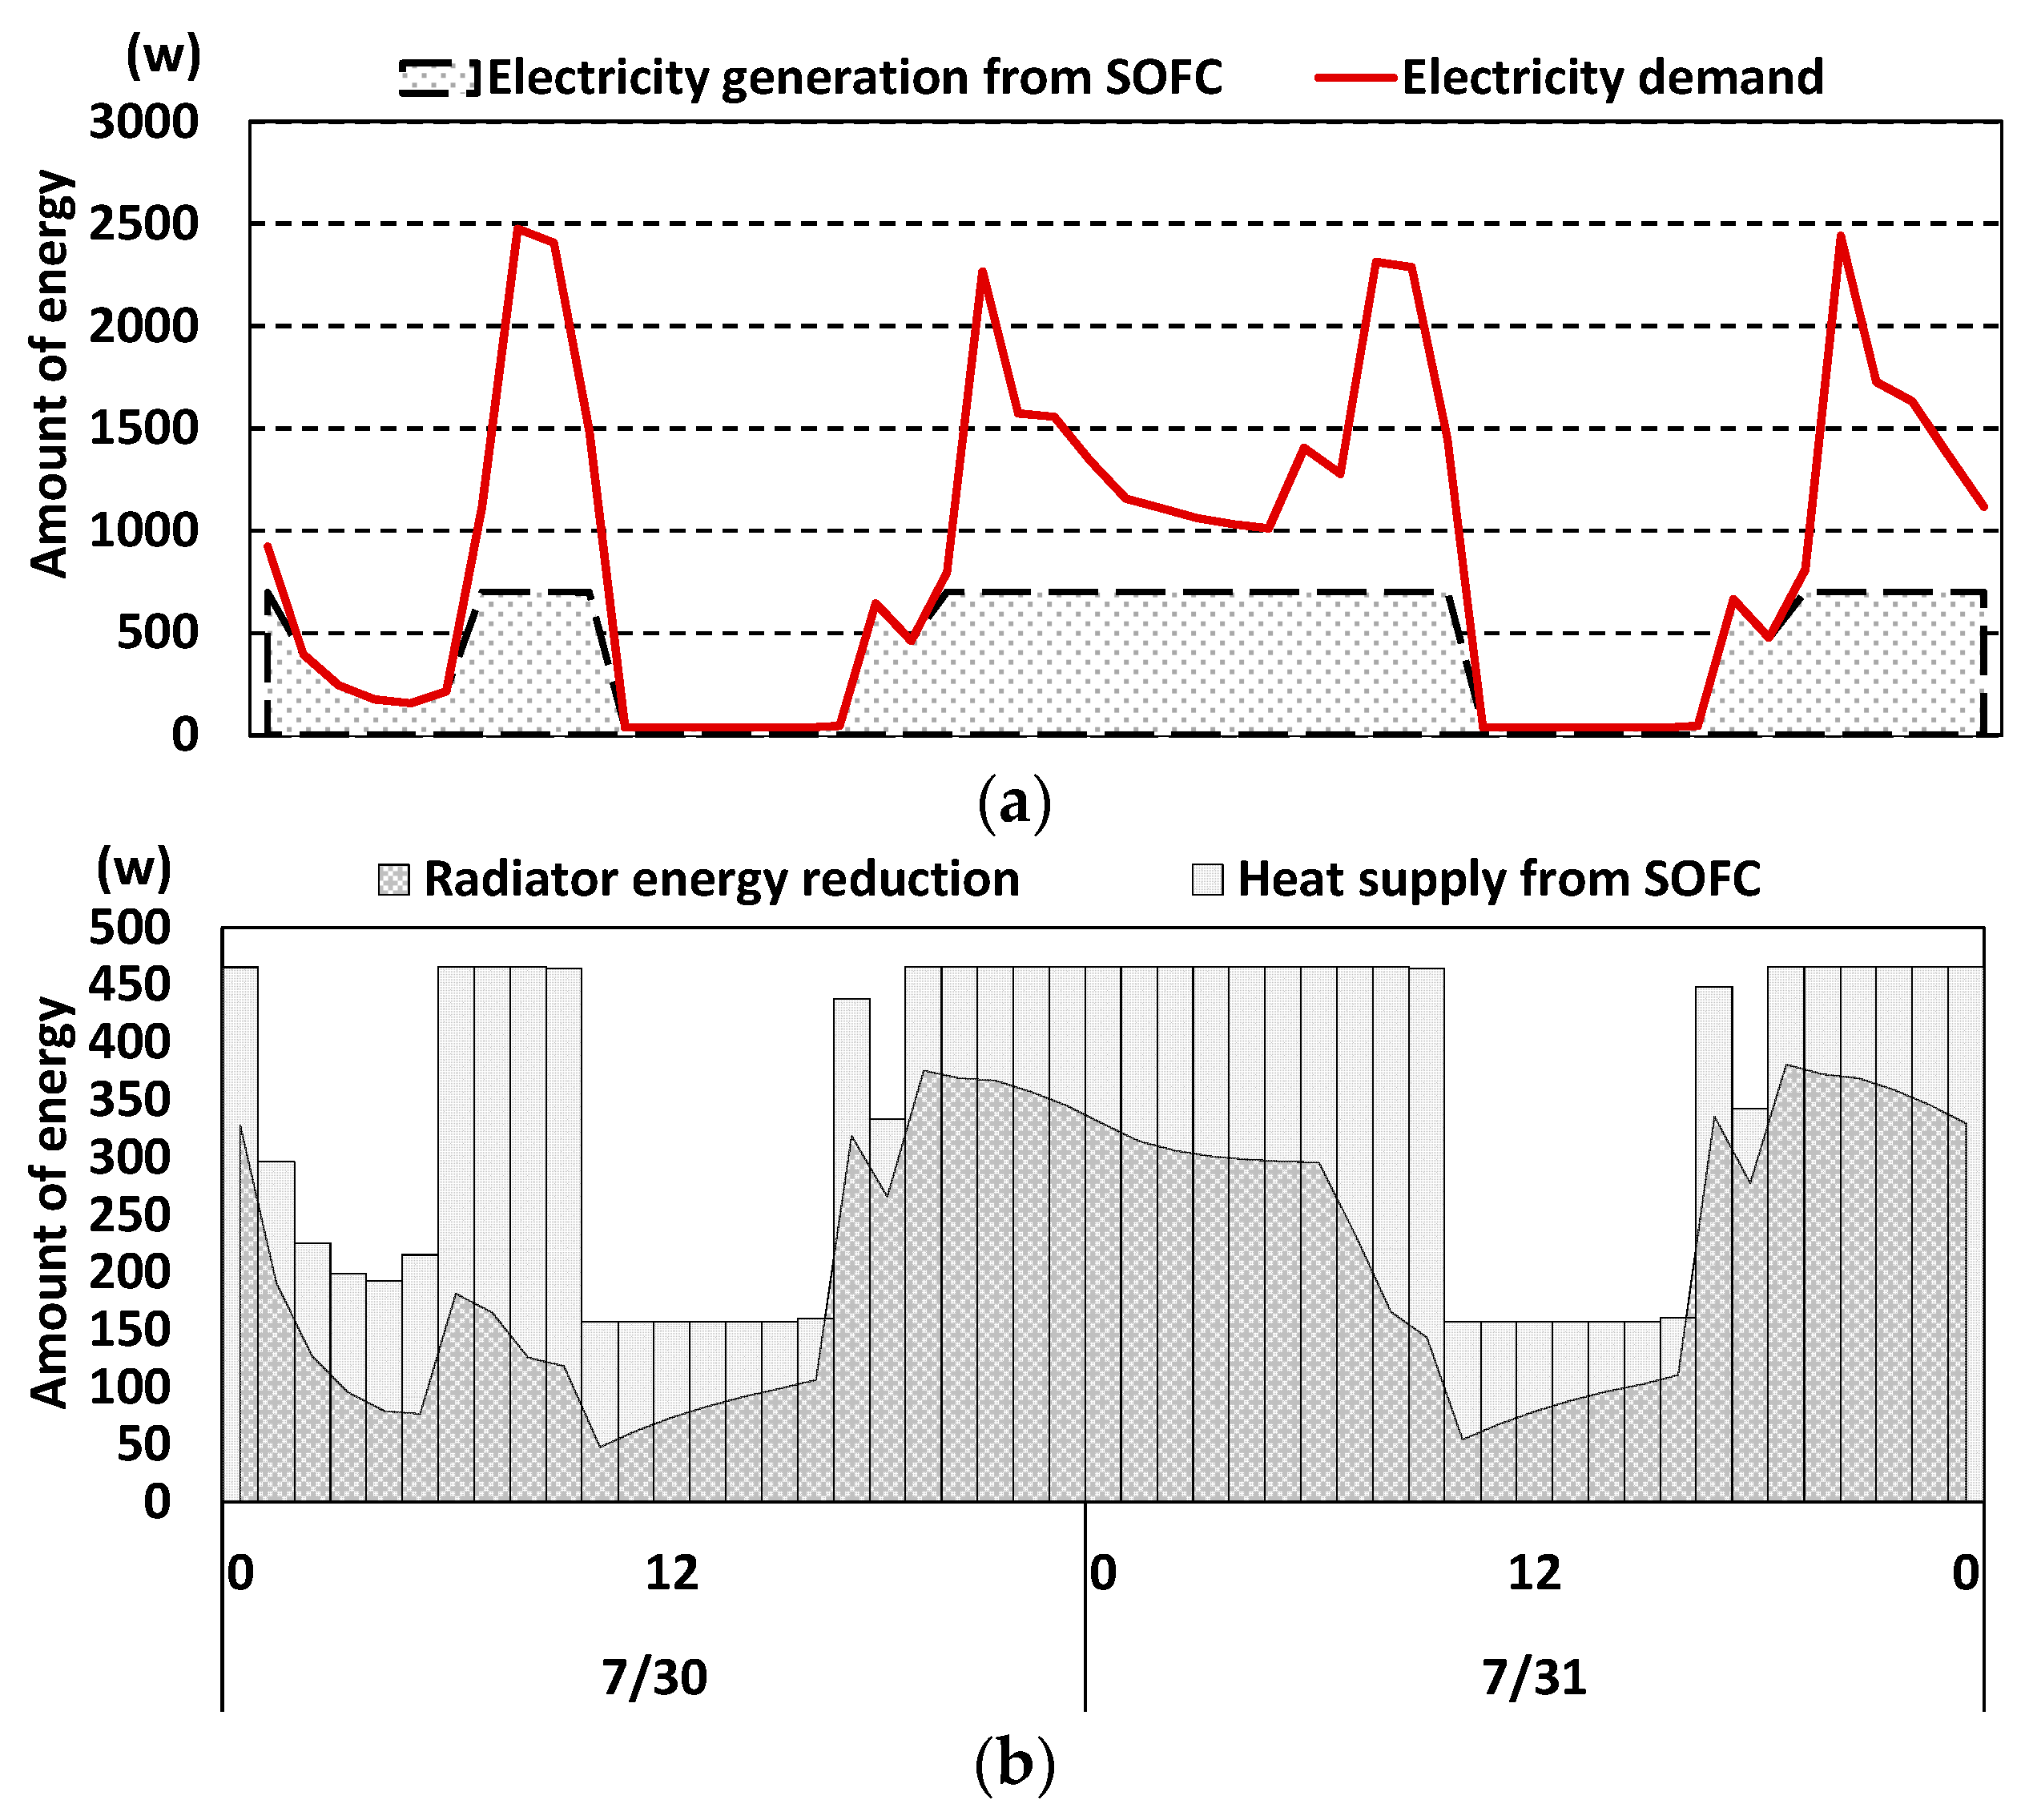
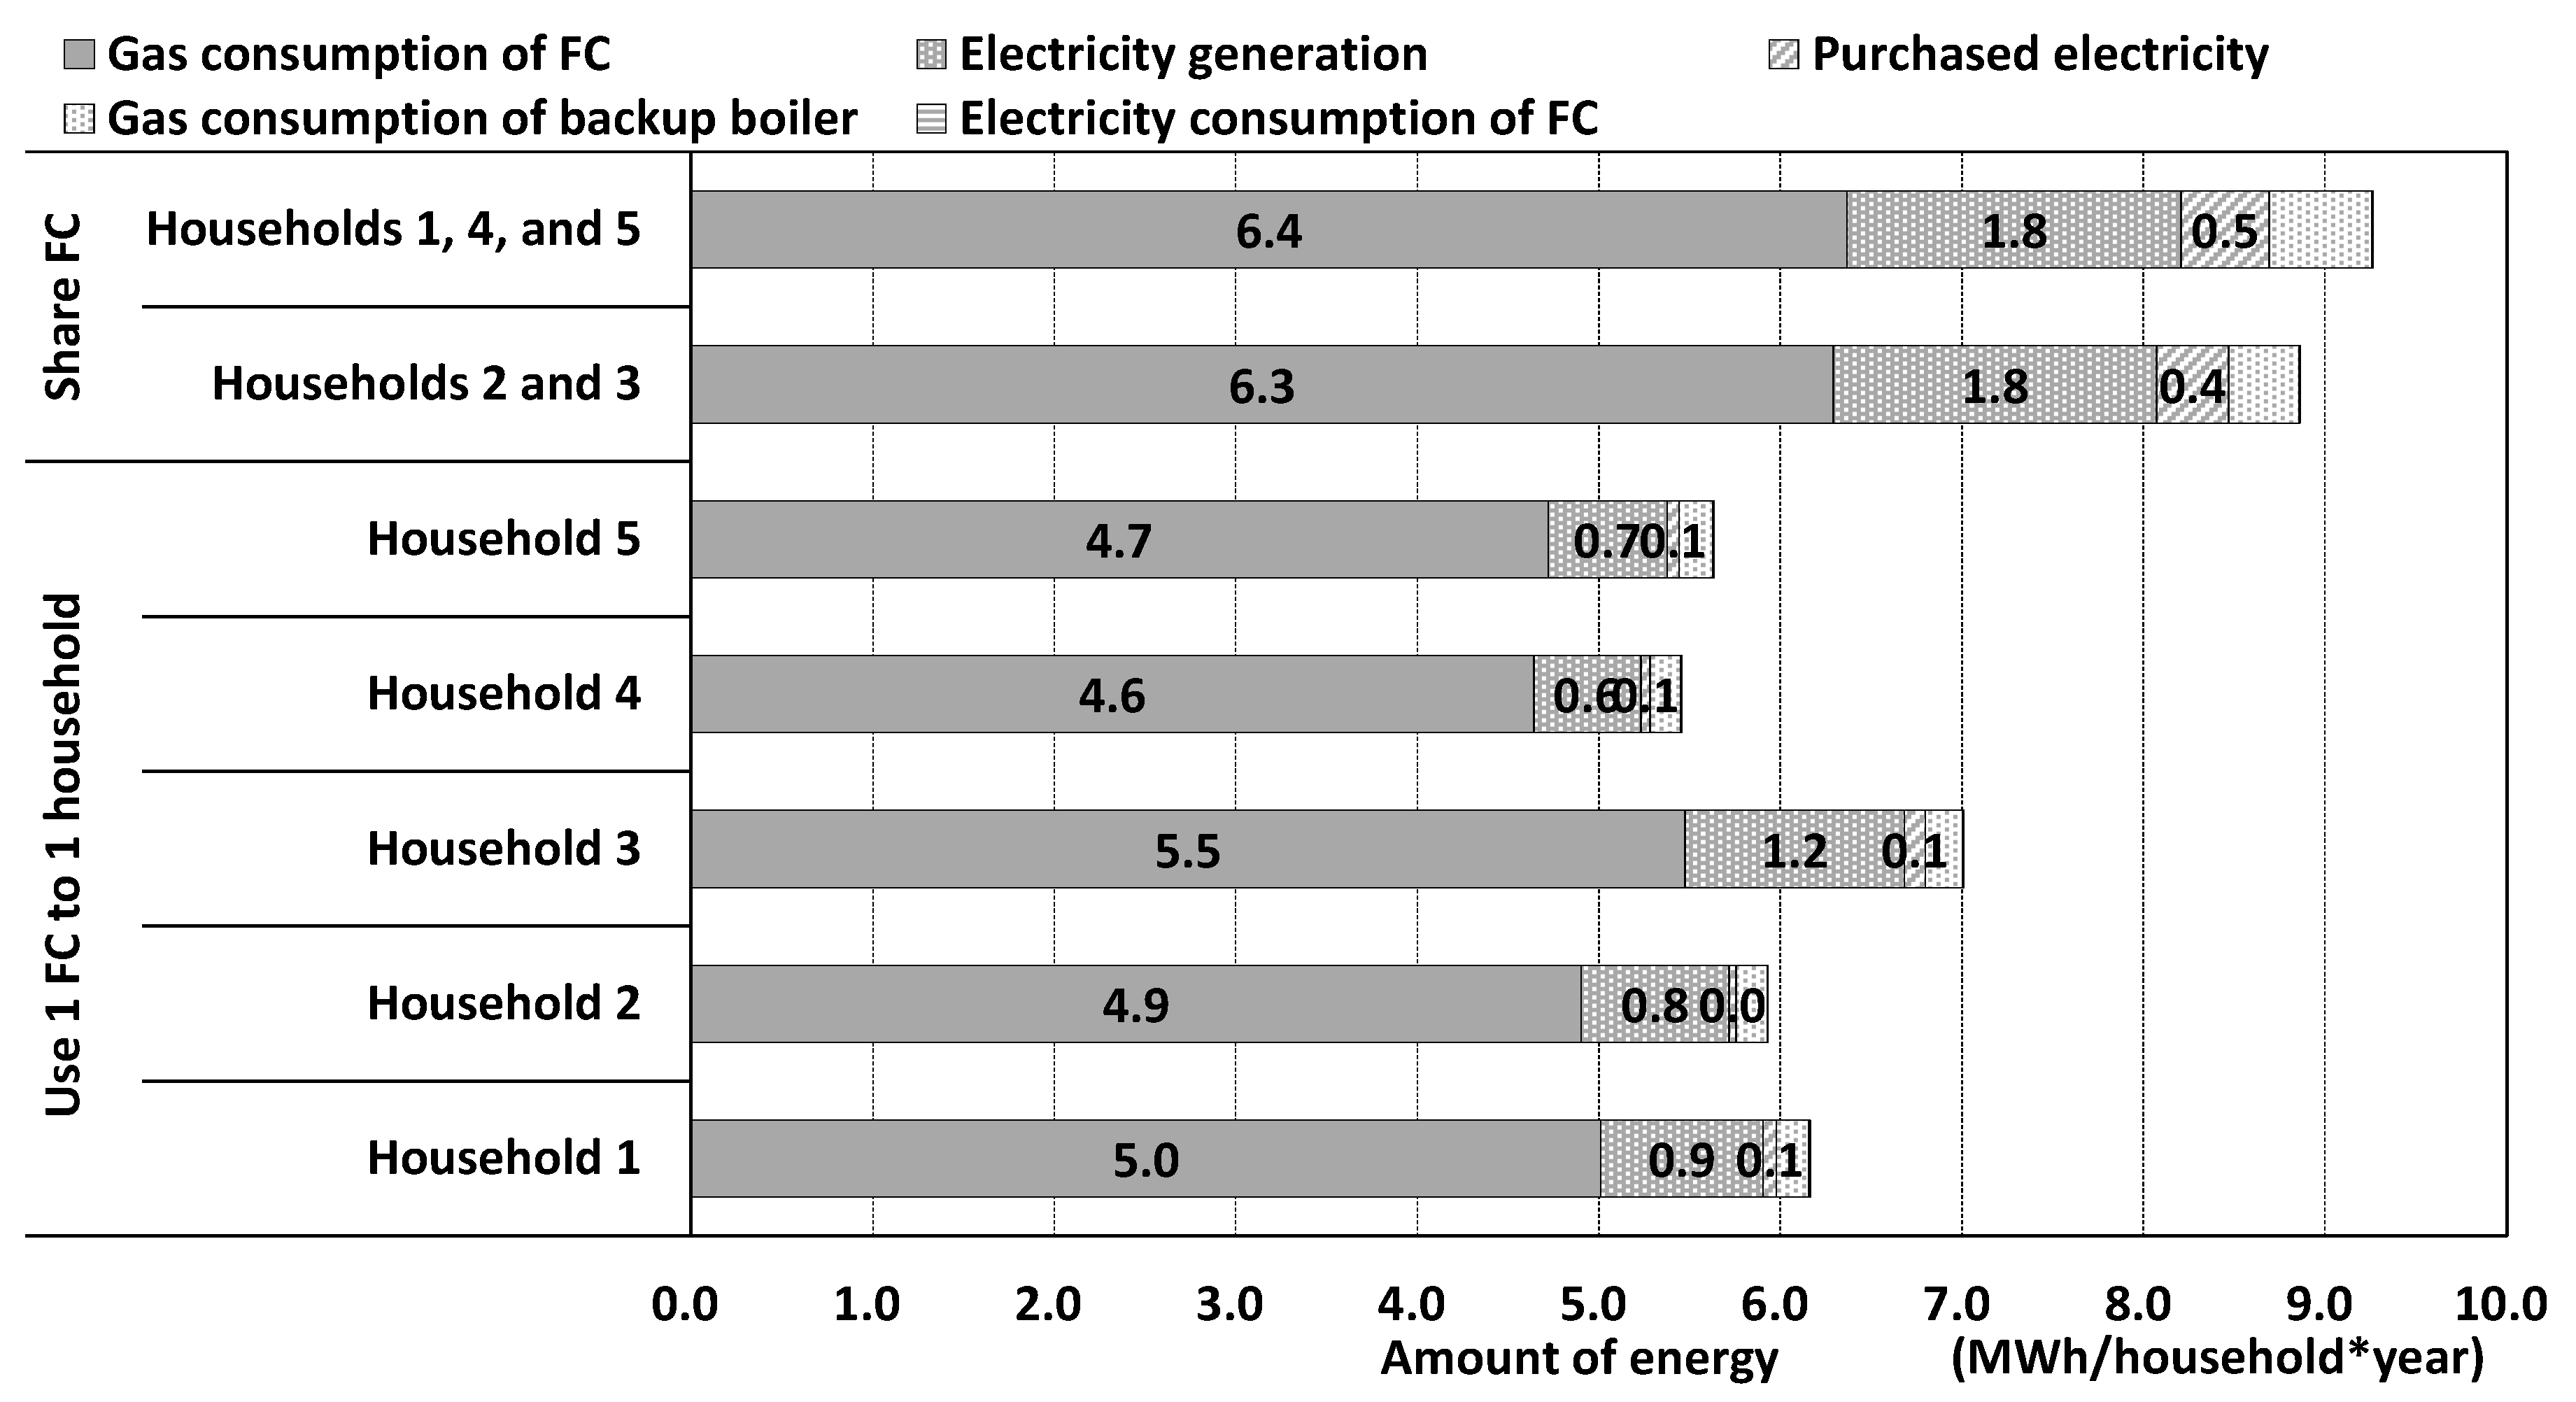
4. Simulation of Operating SOFC–CGS in the Dormitory Building

As mentioned in Section 2, the energy consumption for heating the research target building in winter was significant. Since using electricity from the public power plant results in much more air pollution than using natural gas for heating and because the efficiency of directly using natural gas for heating was much higher than that of using natural gas to generate electricity for heating by the SOFC, in this research, energy for heating was not considered as being supplied from the SOFC. Aside from heating, the SOFC–CGS provides electricity and hot water to the households.
The research target building had four floors, and each floor had the same structure with five households. As the energy consumption of each household was predicted by the calibrated commercial software Design Builder, the energy consumption pattern and amount were the same for each floor. Thus, the first floor was chosen for this research. As mentioned previously, there were five households in first floor, and the energy consumption pattern was similar among the five households in the first floor. According to schedule of ASHRAE standard for residential house [31], the electricity and hot water consumption patterns of representative dates of each season of household 1 in the first floor are shown as Figure 7. As heating energy was provided directly by natural gas, it was not considered in simulating the operating SOFC–CGS. The yearly energy consumption of each household in the first floor is shown as Figure 8.
To improve and analyze the efficiency of SOFC–CGS, one SOFC–CGS was simulated to operate in either only one household or in multi-households (two or three households). According to the yearly energy consumption of each household, as shown in Figure 8, household 2 ranked the lowest and household 3 ranked the highest. Therefore, in order to form a balance, households 2 and 3 were simulated as sharing one SOFC–CGS, and households 1, 4, and 5 were simulated as sharing one SOFC–CGS. Hourly data of electricity demand, electricity generation, and heat output from the SOFC and the heat reduction amount from the radiator at representative days in the year in summer are shown as Figure 9, Figure 10 and Figure 11 below.
As the data of the simulation results were large, the simulation results of households 2 and 3 were selected for presentation in this research. Figure 9 and Figure 10 show the simulation results when operating one SOFC–CGS for one household. Figure 11 shows the simulation results when sharing one SOFC–CGS by multi-households. The load factor of SOFC–CGS was increased when multi-households share one SOFC–CGS, as in Figure 11. This means that the electricity generation efficiency of SOFC–CGS was improved. Additionally, the ratio of heat reduction amount by the radiator was reduced when SOFC–CGS was shared by multi-households, as shown in Figure 11, which means that the efficiency of heat usage for hot water was increased.

5. Analysis of Efficiency and Environmental Impact of SOFC–CGS

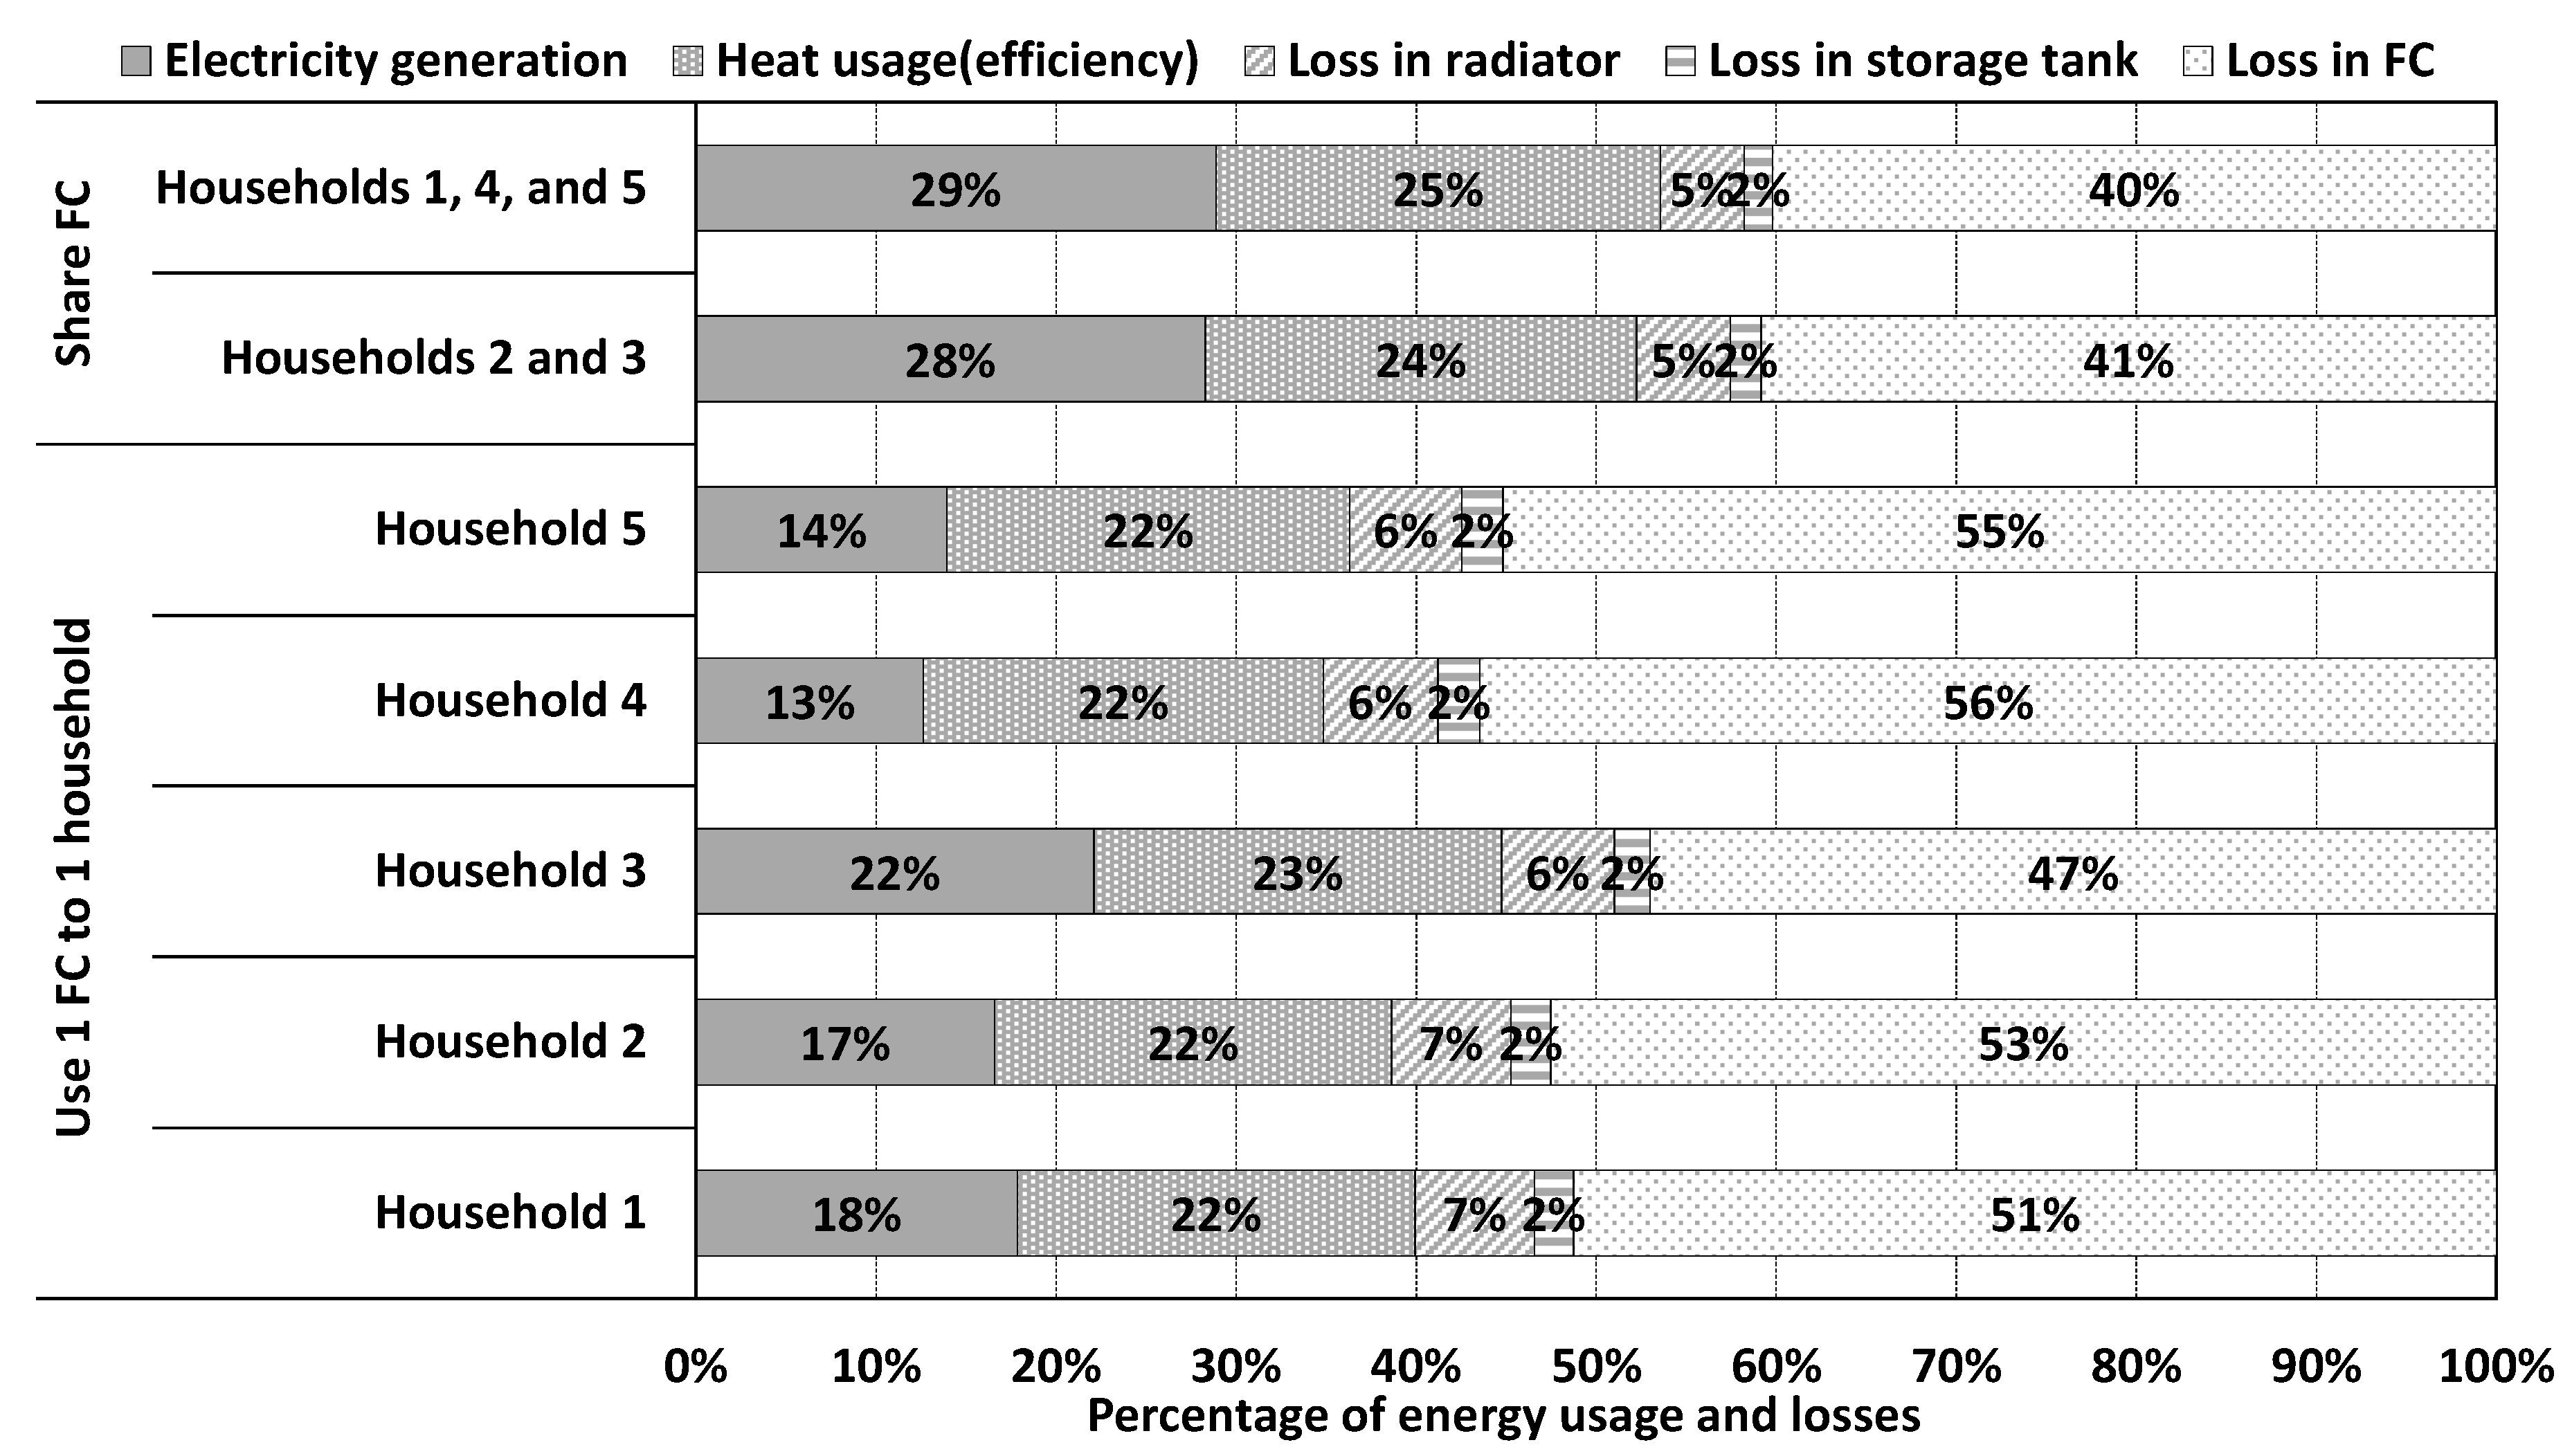
5.1. Analysis of SOFC–CGS Efficiency

The yearly energy consumptions of simulating the operation of one SOFC–CGS to one household and multi-households are shown as Figure 12. The natural gas consumption by SOFC, electricity generation by SOFC, purchased electricity, and natural gas consumption by the backup boiler were higher when simulating the operation of one SOFC–CGS for multi-households than when simulating for one household. The electricity consumption by SOFC was constant because electricity was only used when the SOFC started or restarted. Increasing electricity generation led to increasing efficiency of electricity generation by SOFC. The reason for this was that sharing one SOFC–CGS to multi-households led to increasing electricity and hot water demand for the one SOFC–CGS.
According to Figure 13, the electricity generation efficiency of SOFC ranged from 13% to 22% and the heat usage efficiency ranged from 22% to 23% when simulating the operation of one SOFC–CGS for one household. The efficiency of electricity generation of SOFC was increased to range from 28% to 29% and the heat usage efficiency was increased to range from 24% to 25% when multi-households share one SOFC–CGS. The percentages of losses from different components of SOFC–CGS of simulating operation of one SOFC–CGS to one household and sharing one SOFC–CGS by multi-households are compared in Figure 14. The losses in fuel cell and radiator were decreased when multi-households share one SOFC–CGS. In another aspect, sharing one SOFC–CGS by multi-households increased the electricity demand from the public power plant, which leads to more air pollution. The specific environmental analysis is shown in Section 5.2.

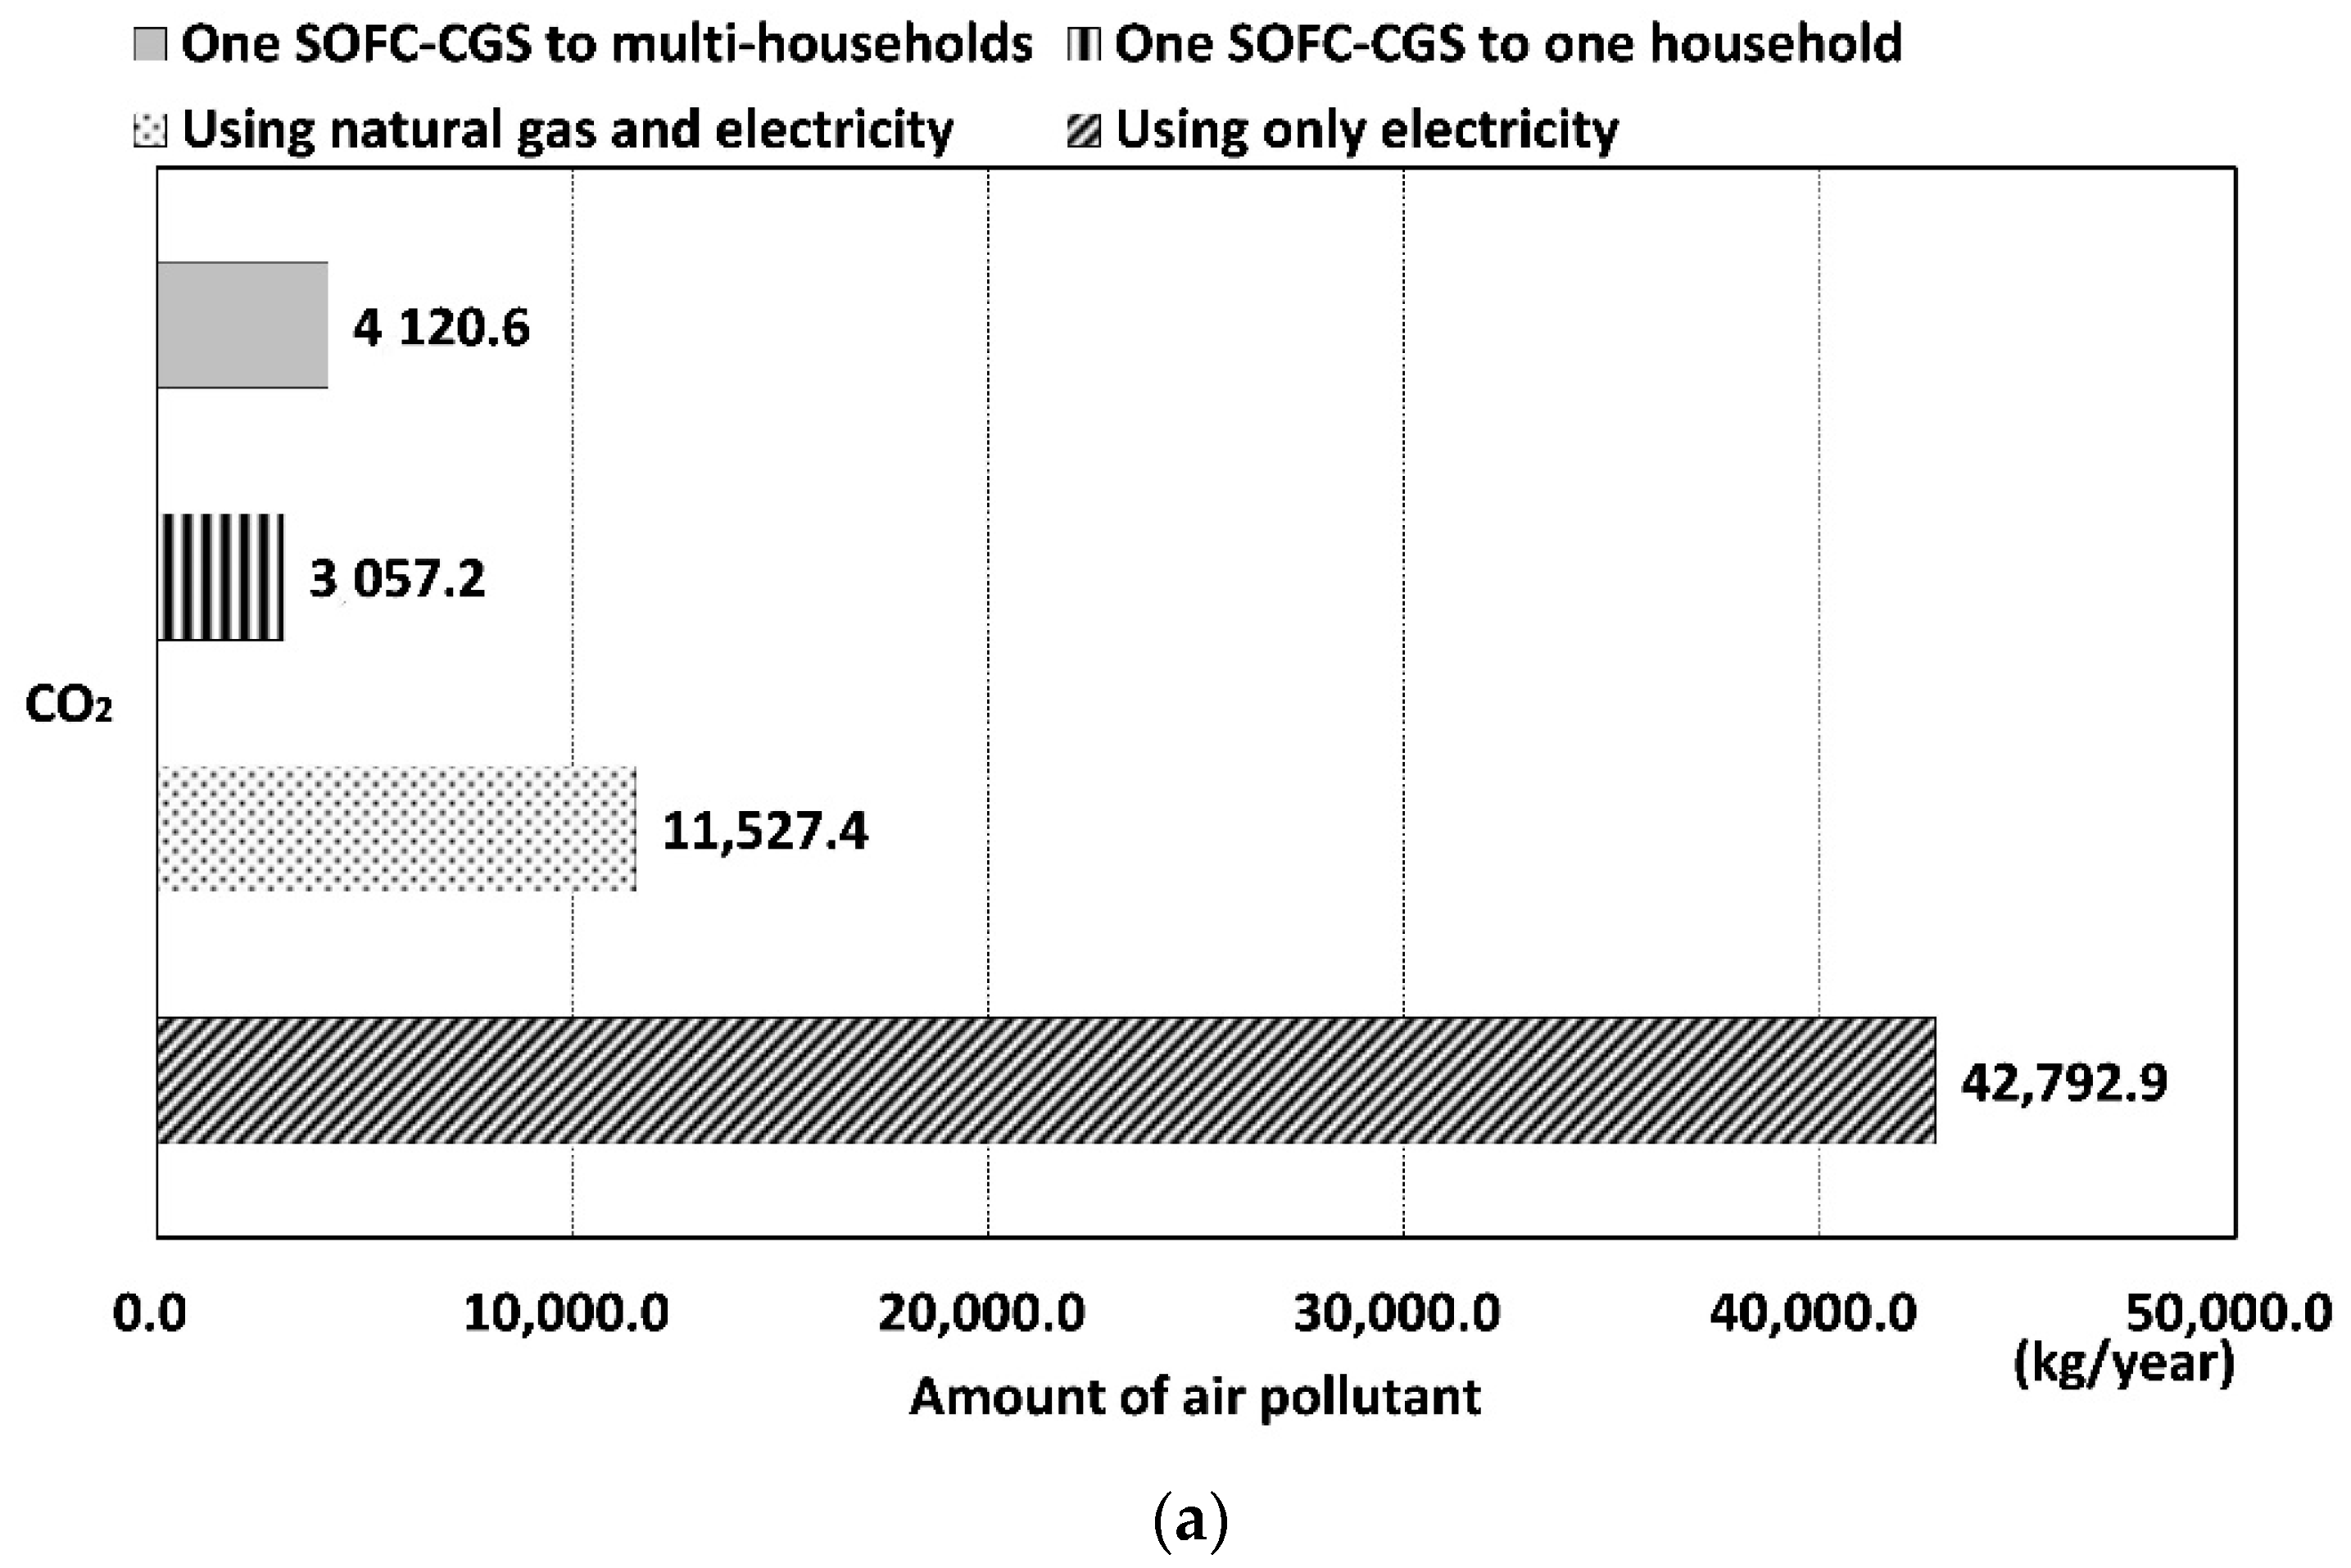
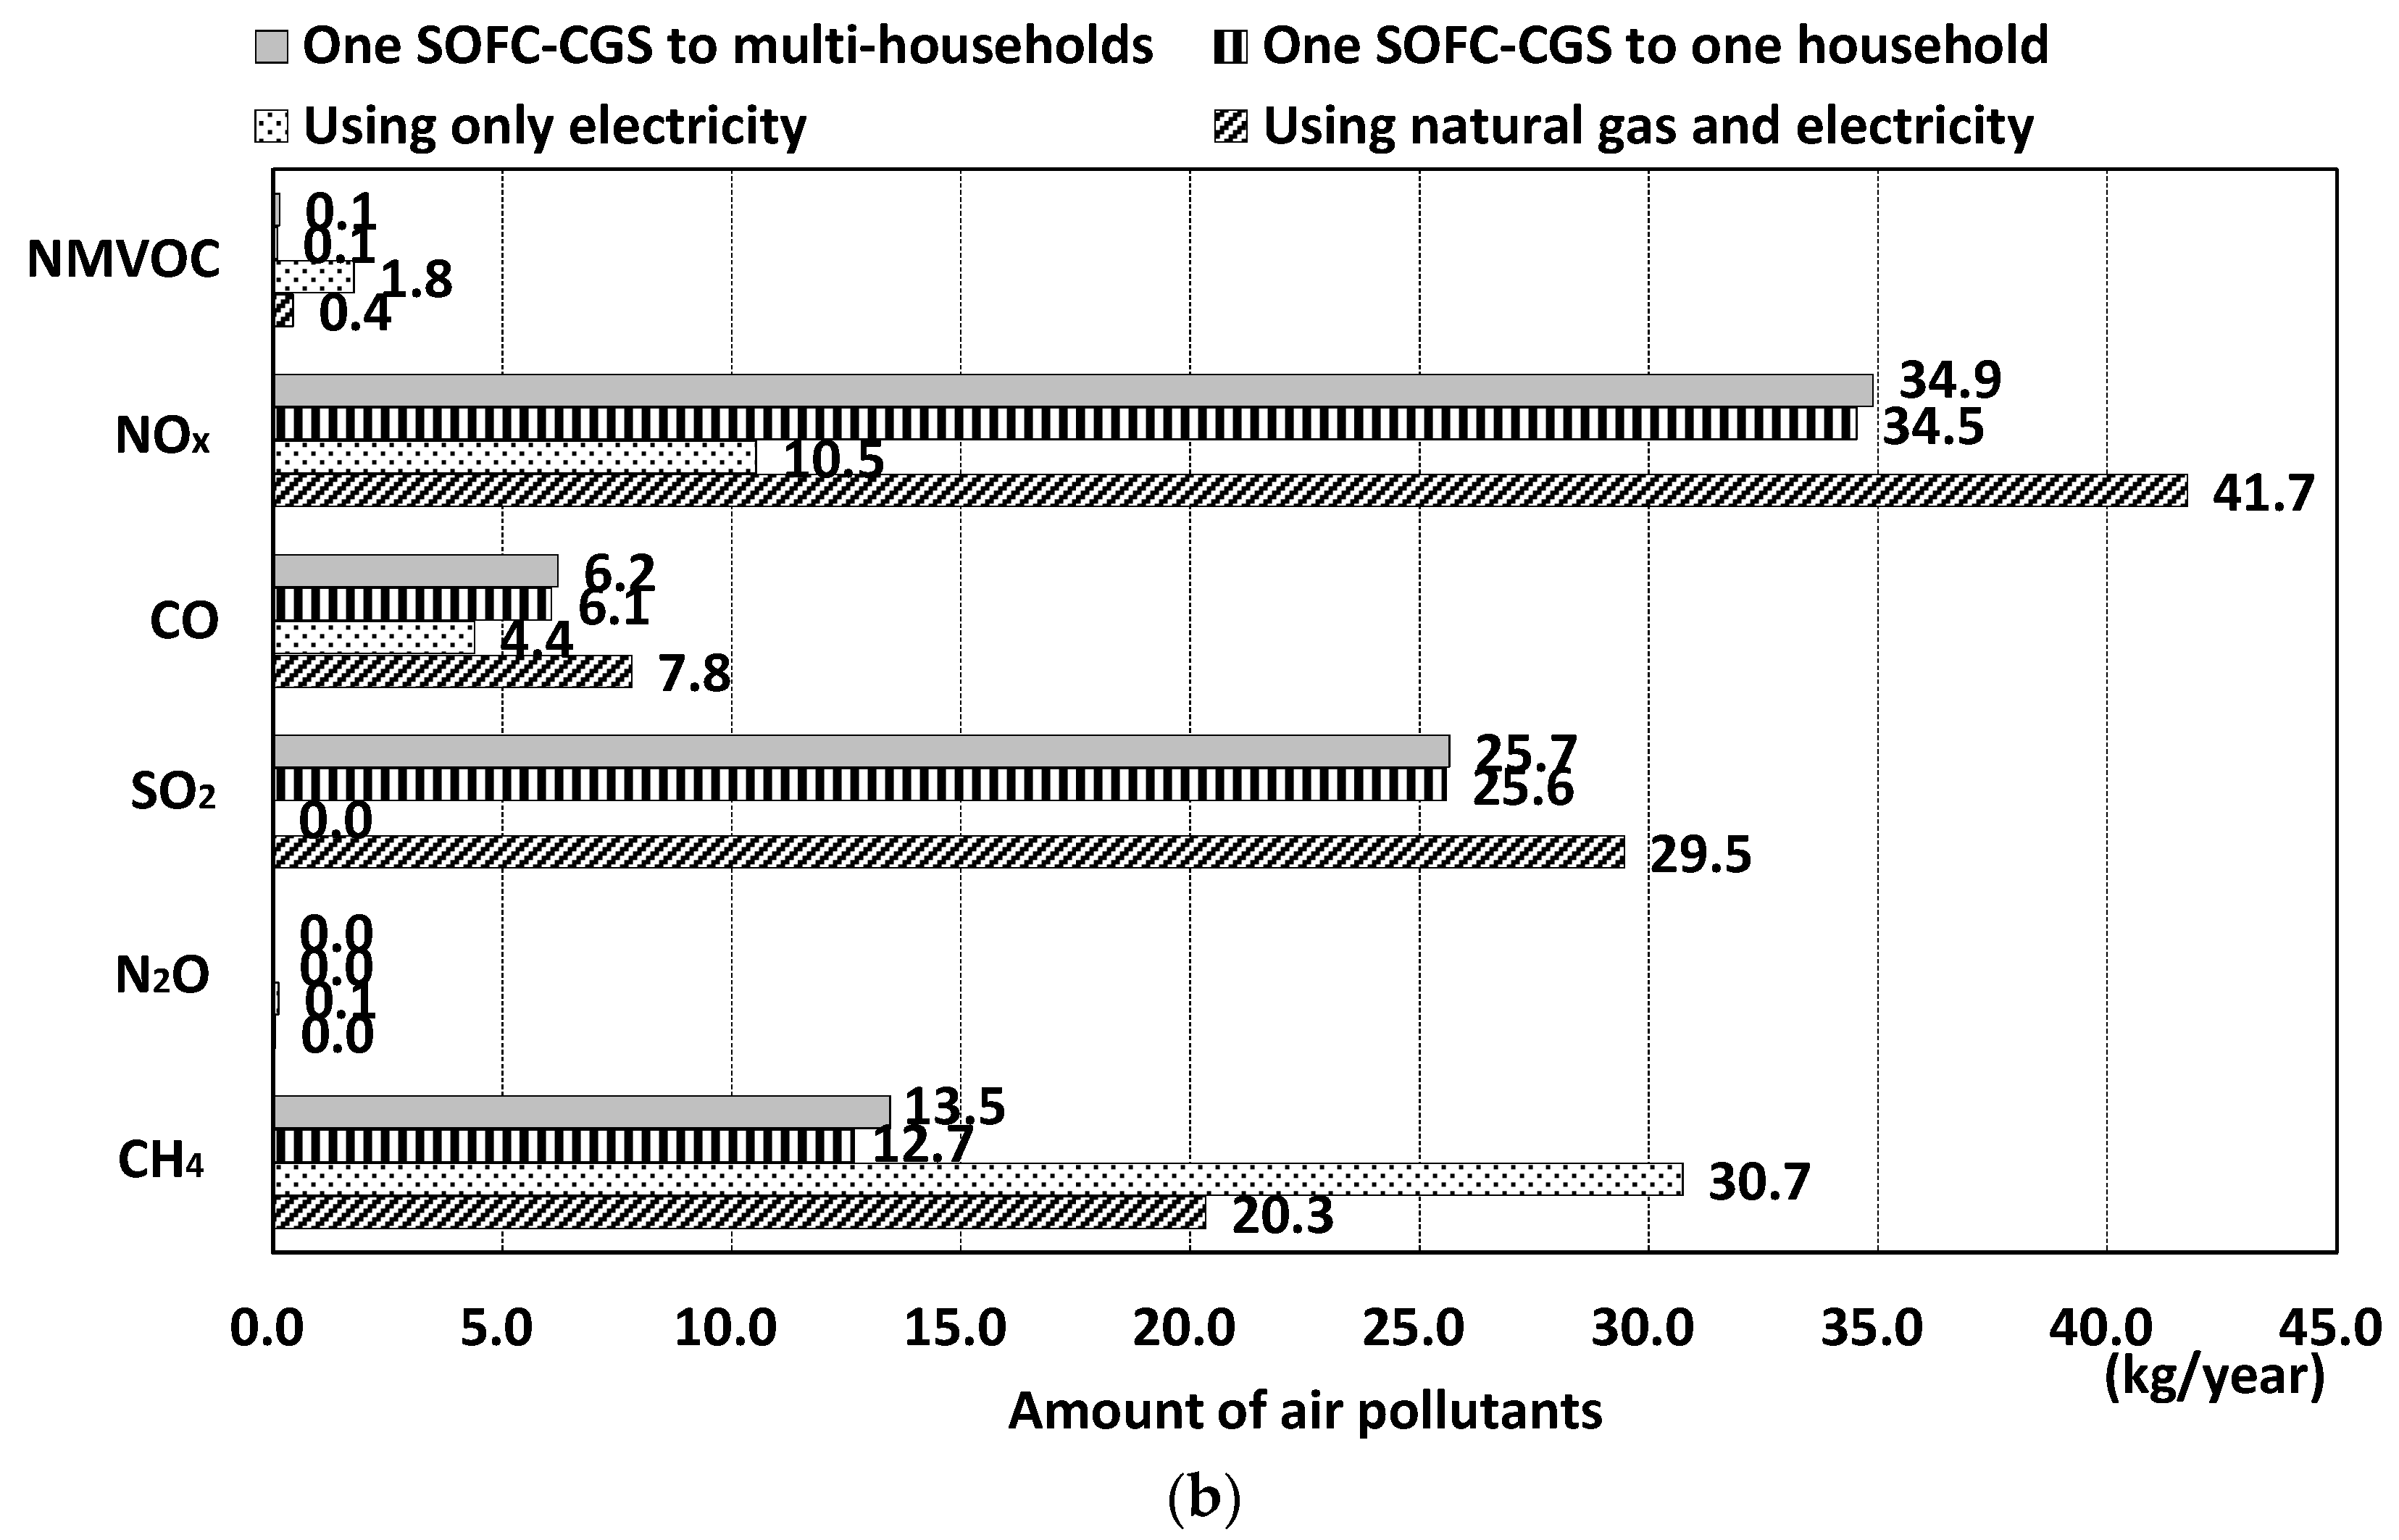
5.2. Analysis of Environmental Impact of SOFC–CGS

Including the two previous cases of energy supply types in the building in Section 2, four different cases of energy supply types are explained and summarized in Table 8. In the first case, only electricity was supplied to the building, while in the second case, natural gas and electricity together were supplied. According to the analysis result, the second energy supply type emitted a relatively smaller amount of air pollutants than the first type and the efficiency of using natural gas directly by combustion was much higher than using natural gas by SOFC for heating. Therefore, in the third case, one SOFC–CGS was applied to one household under the second energy supply type, and in the fourth case, one SOFC–CGS was applied to multi-households under the second energy supply type. The environmental analysis for the entire building (four stories) under the four different cases of energy application types is shown as Figure 15. According to the result of the environmental analysis, the amount of CO2 emission was most significant in the case of using only electricity in the building. The CO2 emission of the second case, using natural gas and electricity together in the building, was much lower than in the case of using only electricity in the building. Under the energy supply type of the second case, when SOFC–CGS was simulated as operating in the building, the CO2 emission was significantly reduce to range from 3057.2 to 4120.6 kg/year. The case of operating one SOFC–CGS for one household gave the lowest CO2 emission. Due to the purchased electricity from the public power plant was increased from the third case to the fourth case as shown in the energy analysis in Figure 12, the fourth case resulted in a higher air pollutants emission than the third case. However, the case of sharing one SOFC–CGS among multi-households had a higher system efficiency than the case of operating one SOFC–CGS for one household, as indicated by the analysis result in Section 5.1. In another aspect, the difference of CO2 emission between cases three and four was not significant, as in Figure 15; therefore, the case of sharing one SOFC–CGS among multi-households was recommended. According to Figure 15, the emission amounts of the pollutants other than CO2 of the four different cases were much lower than the CO2 emissions of the four different cases.

6. Conclusions

Residential SOFC, as a clean energy device, continues to be researched by researchers in the field of architecture. However, as the efficiency of SOFC is relatively low, SOFC–CGS has been studied recently by many researchers. In this research, the environmental and efficiency impacts of operating SOFC–CGS in a dormitory building in Korea were analyzed. As a newly developed building, the research target building was constructed with electricity as the only energy resource. Analysis of this strategy was required. Firstly, in this study, the environmental impact was compared between the cases of using only electricity (new way) and using electricity and natural gas (traditional way) in the building. The analysis result showed that the traditional way of energy supply type in the building emits less air pollution than the new way. Secondly, based on the traditional energy supply type, operating SOFC–CGS in the building was simulated. The efficiency and environmental impact were analyzed, and these were compared between the cases of simulating one SOFC–CGS in one household and sharing one SOFC–CGS among multi-households. The specific conclusions are listed below.
(1) The comparison analysis between supplying only electricity to the building and supplying electricity and natural gas together showed that supplying electricity and natural gas together results in much less air pollution than supplying only electricity.
(2) Under the energy supply type of supplying electricity and natural gas together to the building, SOFC–CGS was simulated in the building under the conditions of operating one SOFC–CGS in one household and sharing one SOFC–CGS among multi-households. The electricity generation efficiency of SOFC ranged from 13% to 22% and the heat usage efficiency ranged from 22% to 23% when simulating operation of one SOFC–CGS in one household. The electricity generation efficiency of SOFC increased to range from 28% to 29% and the heat usage efficiency increased to range from 24% to 25% when multi-households shared one SOFC–CGS.
(3) The four different cases of energy supply type for environmental analysis were summarized in Table 8. According to the results of the environmental analysis, the CO2 emission was significantly reduced from 11,527.4 kg/year to 3057.2 kg/year when simulating the operation of one SOFC–CGS in one household under the energy supply type of case two. On the other hand, the CO2 emission was significantly reduced from 11,527.4 kg/year to 4120.6 kg/year when simulating the sharing of one SOFC–CGS among multi-households. The emission amounts of pollutants other than CO2 of the four different cases were much lower than the CO2 emissions of the four different cases.
(4) The difference of CO2 emission between a simulating operation of one SOFC–CGS in one household and the sharing of one SOFC–CGS among multi-households was not significant. Meanwhile, simulating the sharing one SOFC–CGS among multi-households led to higher efficiency than simulating the operation of one SOFC–CGS in one household. Therefore, sharing one SOFC–CGS among multi-households in a dormitory building is recommended.

Author Contributions

H.C. conceived and completed this paper. I.-H.L. supervised and reviewed this paper.

Funding

This work was supported by a National Research Foundation of Korea grant funded by the Korean Government (NRF-2018R1D1A1B07051106).

Conflicts of Interest

The authors declare no conflict of interest.

Abbreviations

SOFC Solid oxide fuel cell
SOFC–CGS Solid oxide fuel cell cogeneration system
LNGLiquefied Natural Gas
CHPCombined heat and power
DCDirect current
ACAlternating current
EVElectric vehicle
SOFC–CHPSolid oxide fuel cell combined heat and power
GHGGreenhouse gas
HVACHeating, Ventilation and Air Conditioning
ASHRAEAmerican Society of Heating, Refrigerating and Air-Conditioning Engineers
PEMFC–CHPProton exchange membrane fuel cell combined heat and power
Nomenclatures
EFFElSupEfficiency of electricity generation
LF Load factor of electricity generation
PSupmaxMaximum electricity supply capability
PElSupAmount of electricity supplication
VElSupSpElectricity generation tracking speed
ItintTime interval
PElMaxMaximum electricity generation capacity of SOFC
PEhCellAmount of natural gas consumption of SOFC
PHtSupAmount of heat output from SOFC
EFFHtSupHeat output efficiency of SOFC
VwCellWater flow rate in the water tube
ToutTarget output water temperature from the SOFC
TinInput water temperature to the radiator unit
CwSpecific heat of water
PRadHeat dissipation from the radiator unit
PBBSupAmount of heat output from the backup boiler
PBBUseAmount of gas used in the backup boiler
TDmdWater temperature demand from the household
TBBinInput water temperature to the backup boiler
VolHwDmdAmount of hot water demand
EFFBBWorking efficiency of the backup boiler

References

  1. Doosoon, L. An Analysis of the Effect of Relative Prices between Electricity and Gas on the Sectoral Demand of City Gas. Master’s Thesis, Public Administration of Seoul National University, Seoul, Korea, 2014. [Google Scholar]
  2. Korea Electric Power Corporation. Sustainable Report. 2016. Available online: www.kepco.co.kr (accessed on 6 August 2018).
  3. Wang, Y.; Zhao, Q.; Borup, U.; Choi, S. Stack and converter-integrated design for efficient residential fuel cell system. Int. J. Hydrogen Energy 2009, 34, 7316–7322. [Google Scholar] [CrossRef]
  4. Yuqing, W.; Yixiang, S.; Meng, N.; Ningsheng, C. A micro tri-generation system based on direct flame fuel cells for residential applications. Int. J. Hydrogen Energy 2014, 39, 5996–6005. [Google Scholar]
  5. Hirohisa, A.; Tetsuya, W.; Ryohei, Y. Development of an energy management system for optimal operation of fuel cell based residential energy systems. Int. J. Hydrogen Energy 2016, 41, 20314–20325. [Google Scholar] [Green Version]
  6. Alexandros, A.; Eric, S.F.; Dan, J.L.B. Options for residential building services design using fuel cell based micro-CHP and the potential for heat integration. Appl. Energy 2015, 138, 685–694. [Google Scholar]
  7. Mohammad, H.-M. Transient performance improvement of a stand-alone fuel cell for residential applications. Sustain. Cities Soc. 2019, 50, 101650. [Google Scholar]
  8. Hong, B.; Qiong, W.; Weijun, G.; Weisheng, Z. Optimal operation of a grid-connected hybrid PV/fuel cell/battery energy system for residential applications. Energy 2016, 113, 702–712. [Google Scholar]
  9. Yasuhiro, H.; Kiyotaka, T.; Ryuichirao, G.; Hideki, K. Hybrid utilization of renewable energy and fuel cells for residential energy systems. Energy Build. 2011, 43, 3680–3684. [Google Scholar]
  10. Marco, S.; Marta, G.; Massimo, S. Modeling and techno-economic analysis of the integration of a FC based micro-CHP system for residential application with a heat pump. Energy 2017, 120, 262–275. [Google Scholar]
  11. Ramadhani, F.; Hussain, M.A.; Mokhlis, H.; Fazly, M.; Ali, J.M. Evaluation of solid oxide fuel cell based polygeneration system in residential areas integrating with electric charging and hydrogen fueling stations for vehicles. Appl. Energy 2019, 238, 1373–1388. [Google Scholar] [CrossRef]
  12. Takahide, H.; Yusuke, O.; Takashi, I.; Atsushi, A. Technological assessment of residential fuel cells using hydrogen supply systems for fuel cell vehicles. Int. J. Hydrogen Energy 2017, 42, 26377–26388. [Google Scholar]
  13. Kazunori, N.; Joshua, D.; Michael, E.W. Assessment of primary energy consumption, carbon dioxide emissions, and peak electric load for a residential fuel cell using empirical natural gas and electricity use profiles. Energy Build. 2018, 178, 242–253. [Google Scholar]
  14. Van Biert, L.; Godjevac, M.; Visser, K.; Aravind, P.V. Dynamic modelling of a direct internal reforming solid oxide fuel cell stack based on single cell experiments. Appl. Energy 2019, 250, 976–990. [Google Scholar] [CrossRef]
  15. Marco, G.; Dario, M.; Marco, S.; Cesare, P.; Siu, F.A. A versatile computational tool for model-based design, control and diagnosis of a generic Solid Oxide Fuel Cell Integrated Stack Module. Energy Convers. Manag. 2018, 171, 1514–1528. [Google Scholar]
  16. Weidner, E.; Ortiz, C.R.; Davies, J. Global Development of Large Capacity Stationary Fuel Cells; JCR Technical Reports; Publications Office of the European Union: Brussels, Belgium, 2019. [Google Scholar]
  17. Kim, J.H.; Kim, H.J.; Yoo, S.H. Willingness to pay fuel-cell electric vehicles in South Korea. Energy 2019, 174, 497–502. [Google Scholar] [CrossRef]
  18. Eunji, Y.; Myoung, K.; Han, H.S. Well-to-wheel analysis of hydrogen fuel-cell electric vehicle in Korea. Int. J. Hydrogen Energy 2018, 43, 9267–9278. [Google Scholar]
  19. Lim, S.Y.; Kim, H.J.; Yoo, S.H. Household willingness to pay for expanding fuel cell power generation in Korea: A view from CO2 emissions reduction. Renew. Sustain. Energy Rev. 2018, 81, 242–249. [Google Scholar] [CrossRef]
  20. Giuseppe, D.; Piero, B.; Erasmo, M.; Francesco, P.; Fabio, M.; Dawid, P.H.; Vasilije, M. Feasibility of CaO/CuO/NiO sorption-enhanced steam methane reforming integrated with solid-oxide fuel cell for near-zero-CO2 emissions cogeneration system. Appl. Energy 2018, 230, 241–256. [Google Scholar] [Green Version]
  21. Rao, M.; Fernandes, A.; Pronk, P.; Aravind, P.V. Design, modelling and techno-economic analysis of a solid oxide fuel cell-gas turbine system with CO2 capture fueled by gases from steel industry. Appl. Therm. Eng. 2019, 148, 1258–1270. [Google Scholar] [CrossRef]
  22. Koki, Y.; Akihito, O. Study on Performance Evaluation of Residential SOFC Co-Generation Systems Part 2 Equipment characteristics and installation effect. Soc. Heat. Air-Cond. Sanit. Eng. Jpn. 2013, 70, 281–284. [Google Scholar]
  23. Koki, Y.; Akihito, O.; Myonghyang, L. Study on Performance Evaluation of Residential SOFC Co-Generation Systems. Soc. Heat. Air-Cond. Sanit. Eng. Jpn. 2014, 203, 25–33. [Google Scholar]
  24. Akito, O.; Yuki, K. Performance of residential fuel-cell-combined heat and power systems for various household types in Japan. Int. J. Hydrogen Energy 2018, 43, 15412–15422. [Google Scholar]
  25. Sumiyoshi, D. The examination for suitable spec of solid oxide fuel cell co-generation system and the proposal of tank minimization by using Bas-Tab in collective housing. J. Environ. Eng. 2015, 80, 441–450. [Google Scholar] [CrossRef]
  26. Takahiro, Y.; Koshiro, A.; Daisuke, S. Estimation energy saving effects of sharing fuel cell with two households by simulation program: Study on effective usage of the home fuel cell in the apartment housing. J. Environ. Eng. 2018, 83, 365–374. [Google Scholar]
  27. Takahiro, Y. Analysis of Impact to Applying Residential Fuel Cell by Different Lifestyle. Ph.D. Thesis, Department of Architecture of Kyushu University, Fukuoka, Japan, 2018. [Google Scholar]
  28. Taehee, L.; JinHyeok, C.; TaeSung, P. Development and Performance Test of SOFC Co-generation System for RPG. In Proceedings of the Korean Society for New and Renewable Energy, Seoul, Korea, 25 June 2009; pp. 361–364. [Google Scholar]
  29. Zhou, X.; Hong, T.; Yan, D. Comparison of Building Energy Modeling Programs: HVAC Systems; Lawrence Berkeley National Lab. (LBNL): Berkeley, CA, USA, 2013.
  30. Han, C.; Inhee, L. A case study of decreasing environment pollution caused by energy consumption of a dormitory building which only using electricity by efficiently simulating applying residential SOFC (solid oxide fuel cell). J. Archit. Res. Archit. Inst. Korea 2019, 21, 21–29. [Google Scholar]
  31. American Society of Heating, Refrigeration, and Air-Conditioning Engineers. Energy Efficient Design for Low-Rise Residential Buildings; ASHRAE: Atlanta, GA, USA, 2010. [Google Scholar]
  32. Jehean, S. The Analysis of Environmental Impact Index Using Life Cycle Assessment for Korean Traditional Building. Ph.D. Thesis, Department of Architecture of the Pusan National University, Busan, Korea, 2017. [Google Scholar]
  33. Cheolyong, J.; Byunglip, A.; Chihoon, K.; Wonhwa, H. A Study on the insulation performance of the super window considering the evaluation of building energy rating. J. Korean Sol. Energy Soc. 2009, 29, 1598–6411. [Google Scholar]
  34. Kim, C.; Ahn, B.; Kim, J.; Jang, C. A Study on the Evaluation of Building Energy Rating Considering the Insulation Performance of the Window and Wall in Apartment Houses. In Proceedings of the Conference of The Society of Air-conditioning and Refrigerating Engineers of Korea, Seoul, Korea, 25 June 2009. [Google Scholar]
  35. Korea Environmental Industry & Technology Institute. Available online: www.epd.or.kr (accessed on 6 August 2018).
  36. Arata, N.; Zacharie, W.; Patrick, M.; Stefan, D.; Gunter, S.; Jan, V.; Daniel, F. Electrochemical model of solid oxide fuel cell for simulation at the stack scale. Part I: Calibration procedure on experimental data. J. Electrochem. Soc. 2011, 158, B1102–B1118. [Google Scholar]
  37. Marcin, M.; Katarzyna, B.; Shinji, K.; Janusz, S.S.; Grzegorz, B. A Multiscale Approach to the Numerical Simulation of the Solid Oxide Fuel Cell. Catalysts 2019, 253, 1–28. [Google Scholar]
  38. Kwang, H.L.; Richard, K.S.; Shinji, K. SOFC cogeneration system for building applications, part 1: Development of SOFC system-level model and the parametric study. Renew. Energy 2009, 34, 2831–2838. [Google Scholar]
Figure 1. Electricity generation system in Korea.
Energies 12 03893 g001
Figure 2. 3D model and configuration of the dormitory building. (a) 3D model; (b) Configuration.
Energies 12 03893 g002
Figure 3. Comparison of air pollutant amounts between the building using only electricity and the building using electricity and natural gas together. (a) Comparison of amount of CO2 emission (b) Comparison of amount of other air pollutants emission.
Energies 12 03893 g003
Figure 4. Working principle of the solid oxide fuel cell cogeneration system (SOFC–CGS).
Energies 12 03893 g004
Figure 5. Efficiency of the SOFC–CGS.
Energies 12 03893 g005
Figure 6. Calculation diagram of the program.
Energies 12 03893 g006
Figure 7. Representative daily data of electricity demand and hot water demand of household 1 in each season. (a) Data in summer; (b) Data in winter; (c) Data in intermediate seasons.
Energies 12 03893 g007
Figure 8. Yearly energy consumption of each household in the first floor.
Energies 12 03893 g008
Figure 9. Hourly simulation data of household 2. (a) Data of electricity generation and electricity demand; (b) Data of heat reduction and heat supply.
Energies 12 03893 g009
Figure 10. Hourly simulation data of household 3. (a) Data of electricity generation and electricity demand; (b) Data of heat reduction and heat supply.
Energies 12 03893 g010
Figure 11. Hourly simulation data of households 2 and 3. (a) Data of electricity generation and electricity demand; (b) Data of heat reduction and heat supply.
Energies 12 03893 g011
Figure 12. Yearly energy consumptions of simulating one SOFC–CGS for one household and multi-households.
Energies 12 03893 g012
Figure 13. Yearly electricity generation and heat output efficiencies of simulating using one SOFC cogeneration system for one household and multi-households.
Energies 12 03893 g013
Figure 14. Yearly energy losses of simulating using one SOFC–CGS to one household and multi-households.
Energies 12 03893 g014
Figure 15. Comparison of air pollutant amounts of the building under the four different energy supply types. (a) Comparison of amount of CO2 emission (b) Comparison of amount of other air pollutants emission.
Energies 12 03893 g015aEnergies 12 03893 g015b
Table 1. Building specifications.
ParameterSpecific Characteristic
Area172.3 m2
StructureSteel–concrete
EnvelopConcrete
Aboveground Stories4
Underground Stories0
Story height2.6 m
Height10.4 m
Width12.6 m
Length14.5 m
Service life50 years
Table 2. Climate specifications of Busan.
Climate SpecificationValue
Latitude35°32′ N
Longitude129°19′ E
Average annual temperature14.05 °C
Average max annual temperature35.4 °C
Average min annual temperature–8.8 °C
Average annual relative humidity63.40%
Average solar radiation106.15 Wh/m2
Average annual wind speed1.93 m/s
Elevation above sea level33 m
Table 3. Construction specifications.
ParameterSpecific Characteristic
OrientationWest to East
External wall0.58 W/m2K
Internal wall2.92 W/m2K
Roof0.27 W/m2K
Glazing3.12 W/m2K
Infiltration rate0.3 ac/h
Ventilation rate3 ac/h
Equipment5.38 W/m2
Lighting3.88 W/m2
Occupancy0.054 people/m2
HVAC/HeatingDedicated hot water boiler (electricity)
HVAC/CoolingElectricity from grid
Set point temperatureSummer 26 °C, Winter 22 °C
Table 4. Air pollutant emission densities of electricity and natural gas.
Air PollutantElectricity (kg/kWh)Natural Gas (kg/kWh)
CO24.87 × 10−13.94 × 10⁻²
CH43.50 × 10−42.01 × 10⁻⁴
N2O1.35 × 10−61.72 × 10⁻⁷
SO20.00 × 1004.22 × 10−4
CO5.00 × 10−59.91 × 10−5
NOX1.20 × 10−45.67 × 10⁻⁴
NMVOC2.00 × 10−51.04 × 10⁻⁶
Table 5. Typical approaches of fuel cell modeling.
SystemSystem ApplicationModel ApplicationMain Design Variables
SOFC [36]Cell stackElectrochemical modelVolumetric rate generated thermal energy, rate of production of species, area specific resistance
SOFC–CGS [37]StationaryElectrochemical modelPartial pressure of methane, reaction rate of steam reforming, cell temperature
SOFC [38]Cell StackElectrochemical modelPartial pressure of species, anodic and cathodic charge-transfer coefficients, exchange current density
SOFC–CGS [22]StationaryDevice efficiencyEfficiency of electricity generation, efficiency of heat collection, water temperature
SOFC–CGS [11]Stationary/TransportationDevice efficiencyElectric demand of cafeteria, required electricity for EV charging, electric power generated by SOFC–CGS
SOFC–CHP/PEMFC–CHP [24]StationaryDevice efficiencyPower generation efficiency of the fuel cell, heat recovery efficiency of the fuel cell, heat loss rate of the tank
Table 6. Specifications of the SOFC–CGS.
Type of Cell StackSOFC (Solid Oxide Fuel Cell)
Rated electrical output700 W
Max running time26 days
Standby time for start1 day
Water tank volume28 L
Reaction to overheatingHeat dissipation by radiator
Efficiency of heat collection31%
Water temperature from tank to backup boiler40 °C
Efficiency of electricity generation46.4%
Table 7. Input data of the program.
Input DataUnit/Value
Electricity demandW
Hot water demandL/Time unit
Setting temperature of backup boiler40 °C
Outside temperature Data from ASHRAE
Temperature of city water15 °C
Temperature of hot water demand40 °C
Table 8. Explanation of cases for environmental analysis.
Case NumberCase NameEnergy for Heating/Hot WaterEnergy for Other Needs in Household
1Using only electricityPurchased electricity from power plantPurchased electricity from power plant
2Using natural gas and electricityDirect natural gas (heating and hot water) Purchased electricity from power plant
3One SOFC–CGS for one householdDirect natural gas (heating) Individual SOFC–CGS for one household and purchased electricity from power plant
4One SOFC–CGS to multi-householdsDirect natural gas (heating) Shared SOFC–CGS for multi-households and purchased electricity from power plant

