Article

Solid Particles in Natural Gas from a Transportation Network: A Chemical Composition Study

1
CNRS/Univ Pau & Pays Adour/E2S UPPA, Institut des Sciences Analytiques et de Physico-Chimie pour L’Environnement et les Matériaux, UMR5254, Helioparc-2 Avenue du Président Angot, 64000 Pau, France
2
CNRS/Total/Univ Pau & Pays Adour/E2S UPPA, LFCR-IPRA UMR 5150, 64000 Pau, France
3
Teréga, 40 Avenue de l’Europe CS 20 522, 64010 Pau CEDEX, France
*
Authors to whom correspondence should be addressed.
Energies 2019, 12(20), 3866; https://doi.org/10.3390/en12203866
Submission received: 13 September 2019 / Revised: 5 October 2019 / Accepted: 9 October 2019 / Published: 12 October 2019

Abstract

:
This paper aims to provide the elemental composition of particles found in natural gas. Particle sampling is performed on cellulose filters obtained from an industrial gas storage facility, and the qualitative particle composition is determined by scanning electron microscopy and energy dispersive X-ray spectroscopy. Our results establish that natural gas may contain solid particles, with sizes ranging from less than 1 μm to more than 50 μm. The observed particles are composed of numerous elements, such as aluminum (Al), silica (Si), sulphur (S), chloride (Cl), chromium (Cr), zinc (Zn), sodium (Na), manganese (Mg), calcium (Ca), iron (Fe), titanium (Ti), nickel (Ni), vanadium (V), potassium (K), copper (Cu), manganese (Mn), silver (Ag), cobalt (Co), iodine (I), and barium (Ba), with relative occurrences ranging from 1 to 85%. Moreover, metallic elements enable the formation of larger particles as a result of the agglomeration of smaller particles.

Graphical Abstract

1. Introduction

To ensure a good energy supply, natural gas must satisfy quality specifications to be transported and commercialized and must meet standards in terms of calorific power and chemical composition, with methane, dioxygen, water and sulfur compounds, etc. as the main components [1,2,3,4,5]. These specifications ensure high quality gas for combustion but are also essential to prevent damage to facilities and protect consumer health. However, studies have revealed the presence of arsenic compounds, mercury and other metals/metalloids in natural gas from different origins at very low concentrations ranging from 10−1 to 103 µg/m3 [6,7,8,9,10,11]. These elements have well-known risks and potentially can cause industrial damage, such as through corrosion or catalytic poisoning.
Although most of the components are in the gaseous phase (methane and undesirable compounds such as carbon dioxide, dioxygen, water and sulfur compounds), some solid particles can be detected in natural gas. To analyze the particulate phase, the most common sampling technique is filtration. Filters can be made of different materials, such as glass fiber, stainless steel, and cellulose, and they are chosen according to the targeted elements and the subsequent analysis techniques to be performed. This particulate phase is commonly called “black powder” and refers to small particles transported in gas pipelines [12,13]. The origin of these particles can vary from transmission processes to corrosion phenomena in pipes [12]. The particulate phase in gases often results in damage to industrial installations, such as deposit formation on devices or engines, collapse of filtering elements, and erosion of valves and pipes [12,14]. Thus, determination of the concentration and chemical composition of these particles in gas is significant and necessary. Xiong et al., [14] developed a new sampling method to determine the particle concentration and size distributions in high-pressure gas flows; they reported these data but did not report information about the chemical composition of the particles. Azadi et al., [12] focused on the evolution of particle sizes and concentrations in the network according to the seasons, showing that smaller particles were observed more frequently in winter than in summer. Pack et al., [13] studied the identification of favorable conditions for elemental sulfur-based deposits in natural gas pipelines. Unfortunately, such studies are scarce and, to our knowledge, no works have focused on quantification and chemical characterization.
The objective of this study is to better understand the physical and chemical interactions between gas and storage facilities, including the aquifer reservoir itself and the distribution network, with a focus on particle fate.
Herein, we report a qualitative and semi-quantitative study of the entire particulate phase collected from natural gas and the elemental determination of the chemical composition of the particles.

2. Materials and Methods

2.1. Collection of Samples for Analyses

The filters collected were from a unique underground aquifer storage site. This storage aquifer receives gas from different geographic origins, and the gases are mixed in storage and transportation/distribution pipes, leading to a single gas mixture.
Two types of filters were applied in series in the sampling tubing connected to the natural gas transportation pipelines. This study focused on cellulose membranes (Genie, 0.45 µm porosity and 34 mm diameter), as presented in the Supplementary Materials Figure S1. Five cellulose membranes were sampled and analyzed. A new cellulose membrane also was analyzed under the same conditions and used as a blank to determine the origin of the particles (natural gas or filter-related/contamination).

2.2. Analytical Device and Parameters

Cellulose membranes were analyzed by scanning electron microscopy with energy dispersive X-ray spectroscopy (SEM/X-EDS) (FEI Quanta 200). The SEM/X-EDS instrument was equipped with a secondary electron detector (SED) to perform surface analysis of the shape and size of the particles; a backscattered electron detector (BSED) allowed atomic differentiation in terms of atomic weight (Z), while X-EDS provided the elementary composition of the particles. Combining the data obtained by the use of these three detectors yielded information about the texture, size distribution, shape and chemical composition of the particles trapped in the filters.

2.3. Analysis Procedure

The membranes were cut into quarters to fit the “chamber” size, and several areas were selected and observed from the center to the periphery. No additional specific treatment or preparation was necessary.
The filter quarters were analyzed using an SED and a BSED at different magnitudes ranging from ×40 to ×20,000. The first magnitude permits the selection of a zone, and the subsequent magnitudes permit the detection of particles according to their size and elemental composition. When particles of interest were targeted by a specific magnitude, X-EDS analysis was performed to determine their elemental composition. An example of the micrography procedure is presented in Figure 1. Targeted areas or particles are annotated on the images to facilitate understanding. BSE micrography differentiates between low Z and high Z values. Thus, low-Z particles appear dark, while high-Z particles are brilliant or white.
The membranes were contaminated rapidly by carbon deposition from the electron beam (due to the molecules present in the microscope column) when the beam was focused on the region of interest (ROI) and by the effect of the electron beam on particles sensitive to electron and temperature gradients (oxides, negatively charged particles, hydrated and halogenated particles, etc.). Following a period of analysis (minutes), the exposed ROI was no longer available for any kind of analysis, and a compromise had to be made in the determination of SEM parameters between better detection of particles or their chemical composition analysis and contamination. Regarding SED analysis, the spot was fixed at approximately 3.7 µm, and the intensity was approximately 8 keV on a scale of up to 40 keV. Concerning BSED analysis, the spot and intensity were fixed at approximately 5 µm and 15 keV, respectively.
Excited electrons are converted to a number of counts, which is proportional to the concentration of the element. Without a standard to determine the precise k-factor of each element in a solid matrix, and due to the variable thickness of the particles analyzed, only semiquantitative X-EDS analysis was available. To take this limit into consideration, intercomparative analysis was performed. Subsequent to data treatment, all detected chemical elements could be identified and, according to the signal intensity, the relative proportion of the elements in the particle/studied area could be determined.

3. Results and Discussion

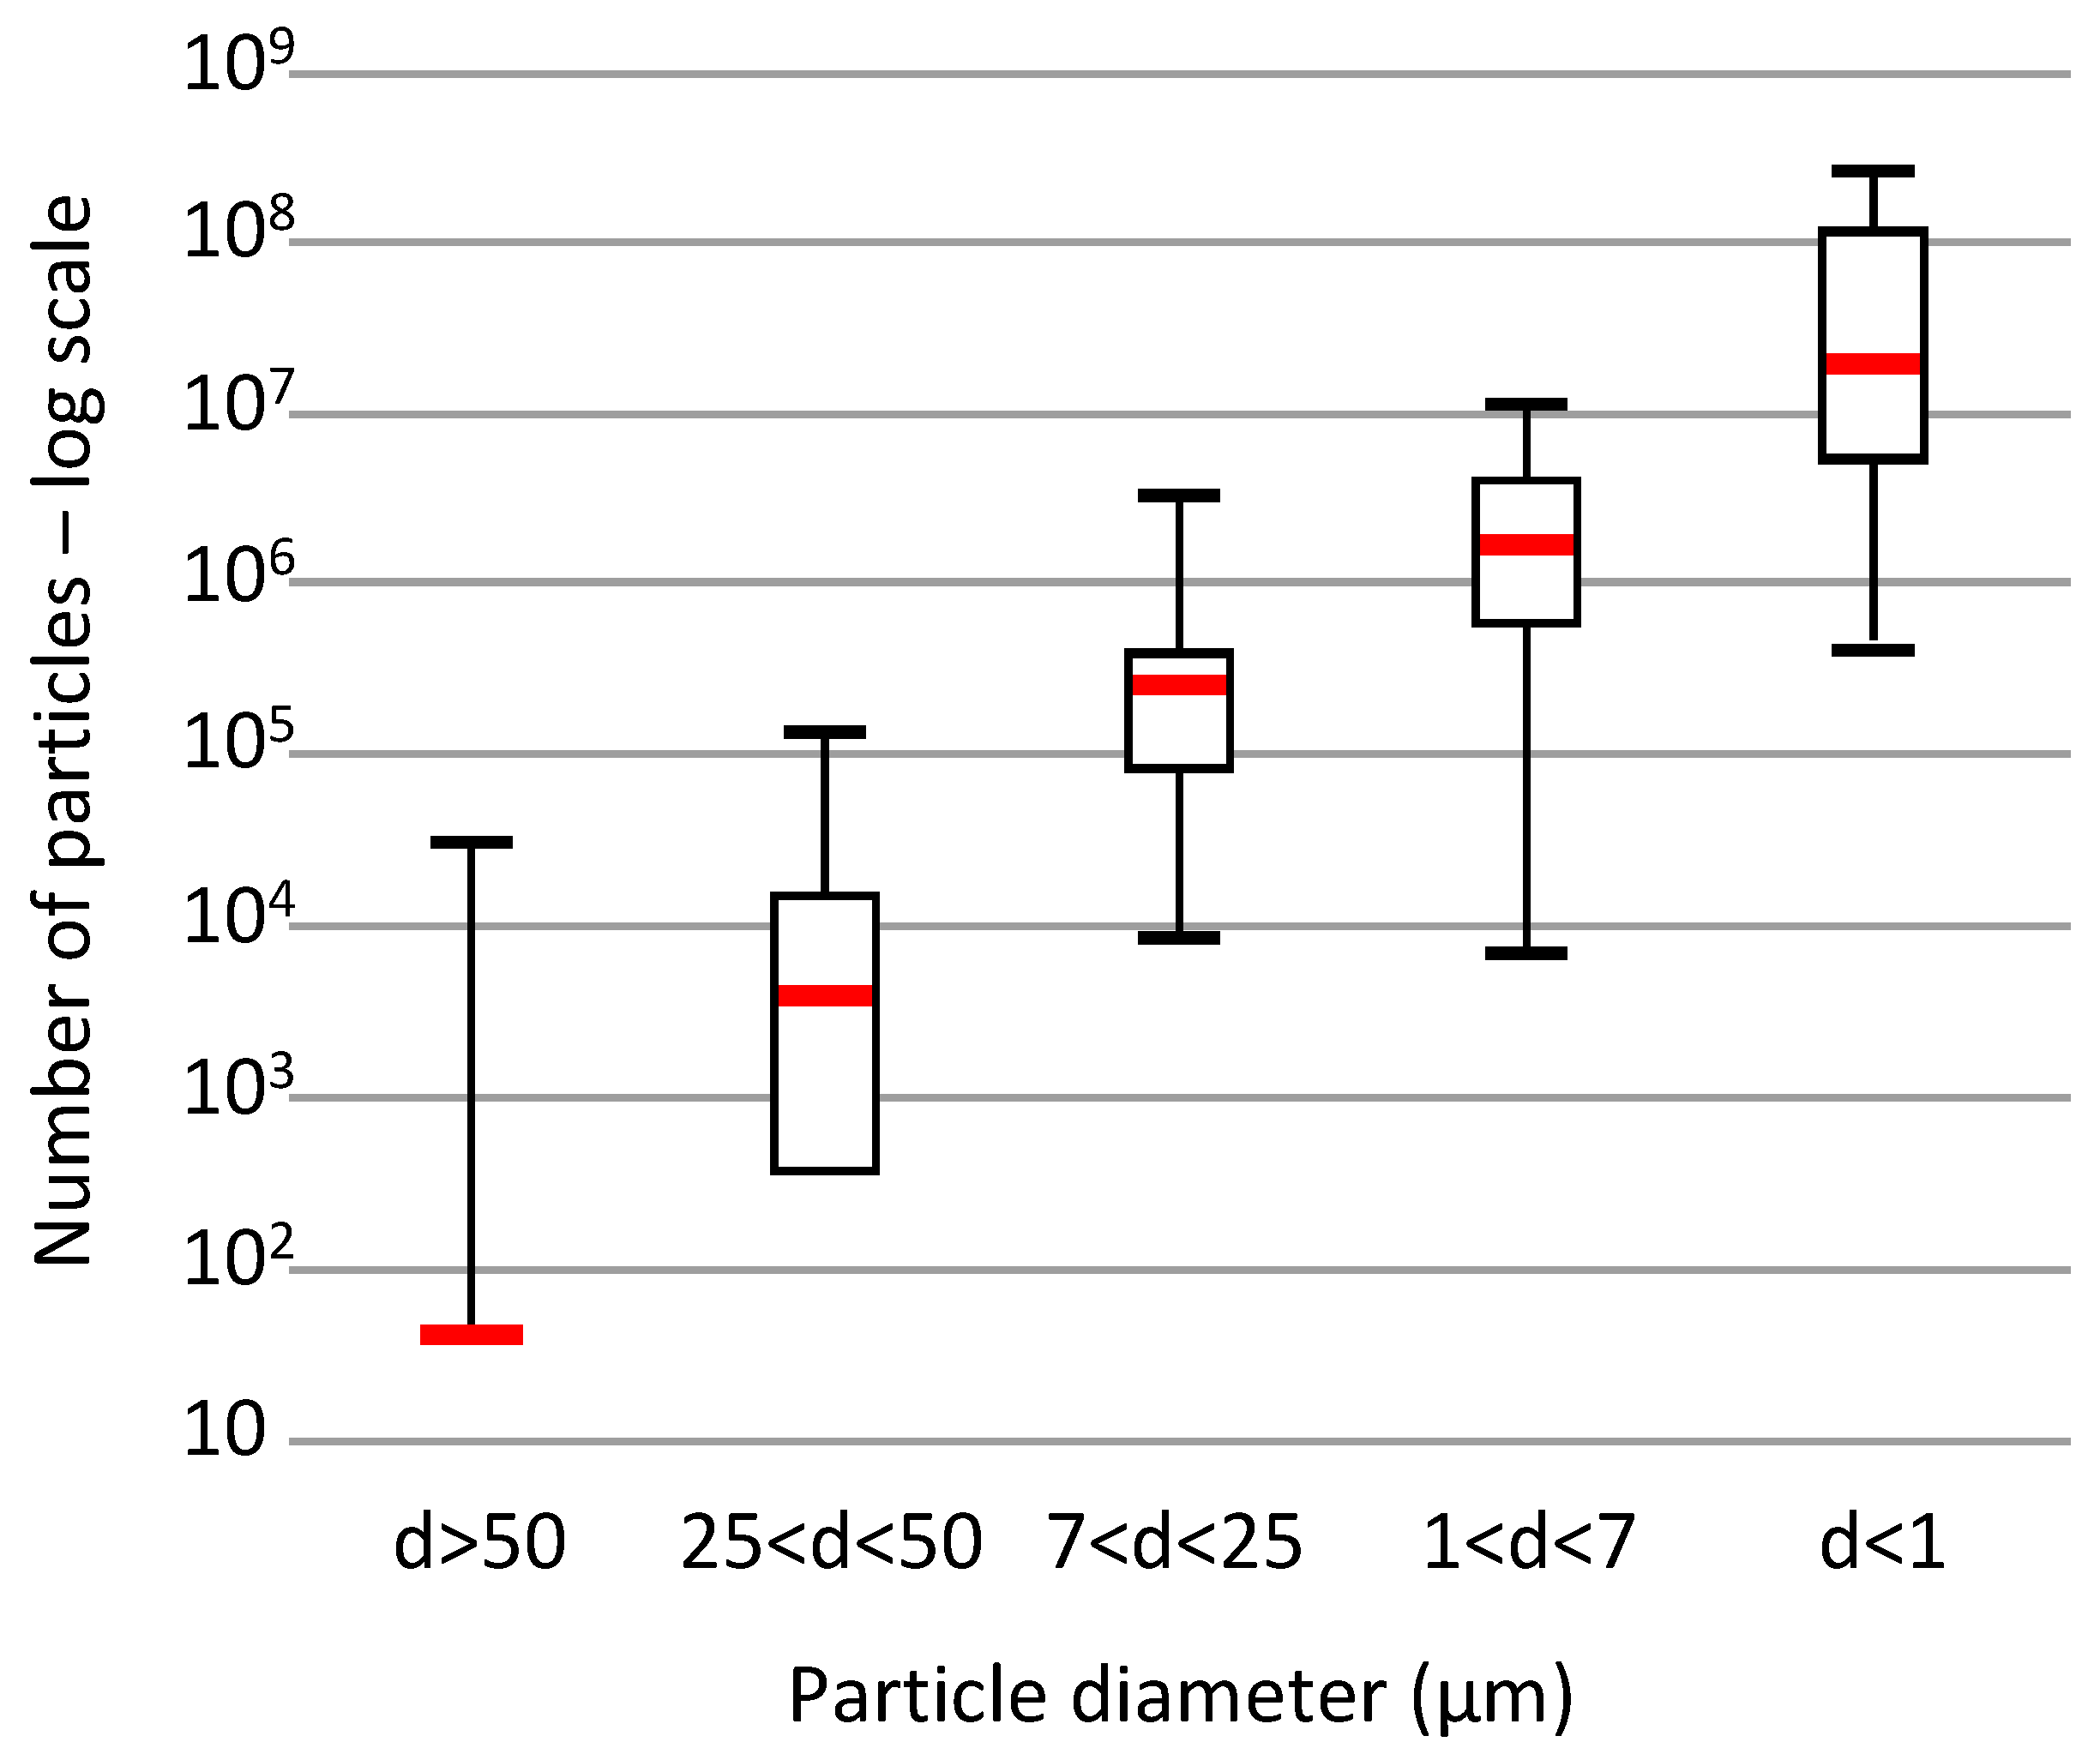
3.1. Particle Size on Cellulose Filters

Particle size distributions were obtained through image analysis at different microscope magnifications. The results for the cellulose membrane are summarized in Figure 2, with particles classified according to their size. Box plots were generated from the average number of particles obtained from five different filters, calculated according the quantities observed in each zone investigated. The analysis of the blank cellulose membrane revealed no particles. Thus, it can be concluded that all solid particles observed and quantified on the membranes were from natural gas filtration.
The smallest particles (≤1 µm) are the most abundant on the membranes, with an amount ranging between 105 and 109 per filter, which corresponds to 108 to 1012 particles/m2. To contrast, larger particles (≥25 µm), which have very low abundance on the filters, are not always detected within an area, and their amounts never exceed 104 per filter (107 particles/m2). The presence of these particles could be attributed to (i) the creation and appearance of “large particles” in the pipeline due to corrosion or abrasion and (ii) the formation of larger particles from smaller particles resulting from reorganization or aggregate formation.

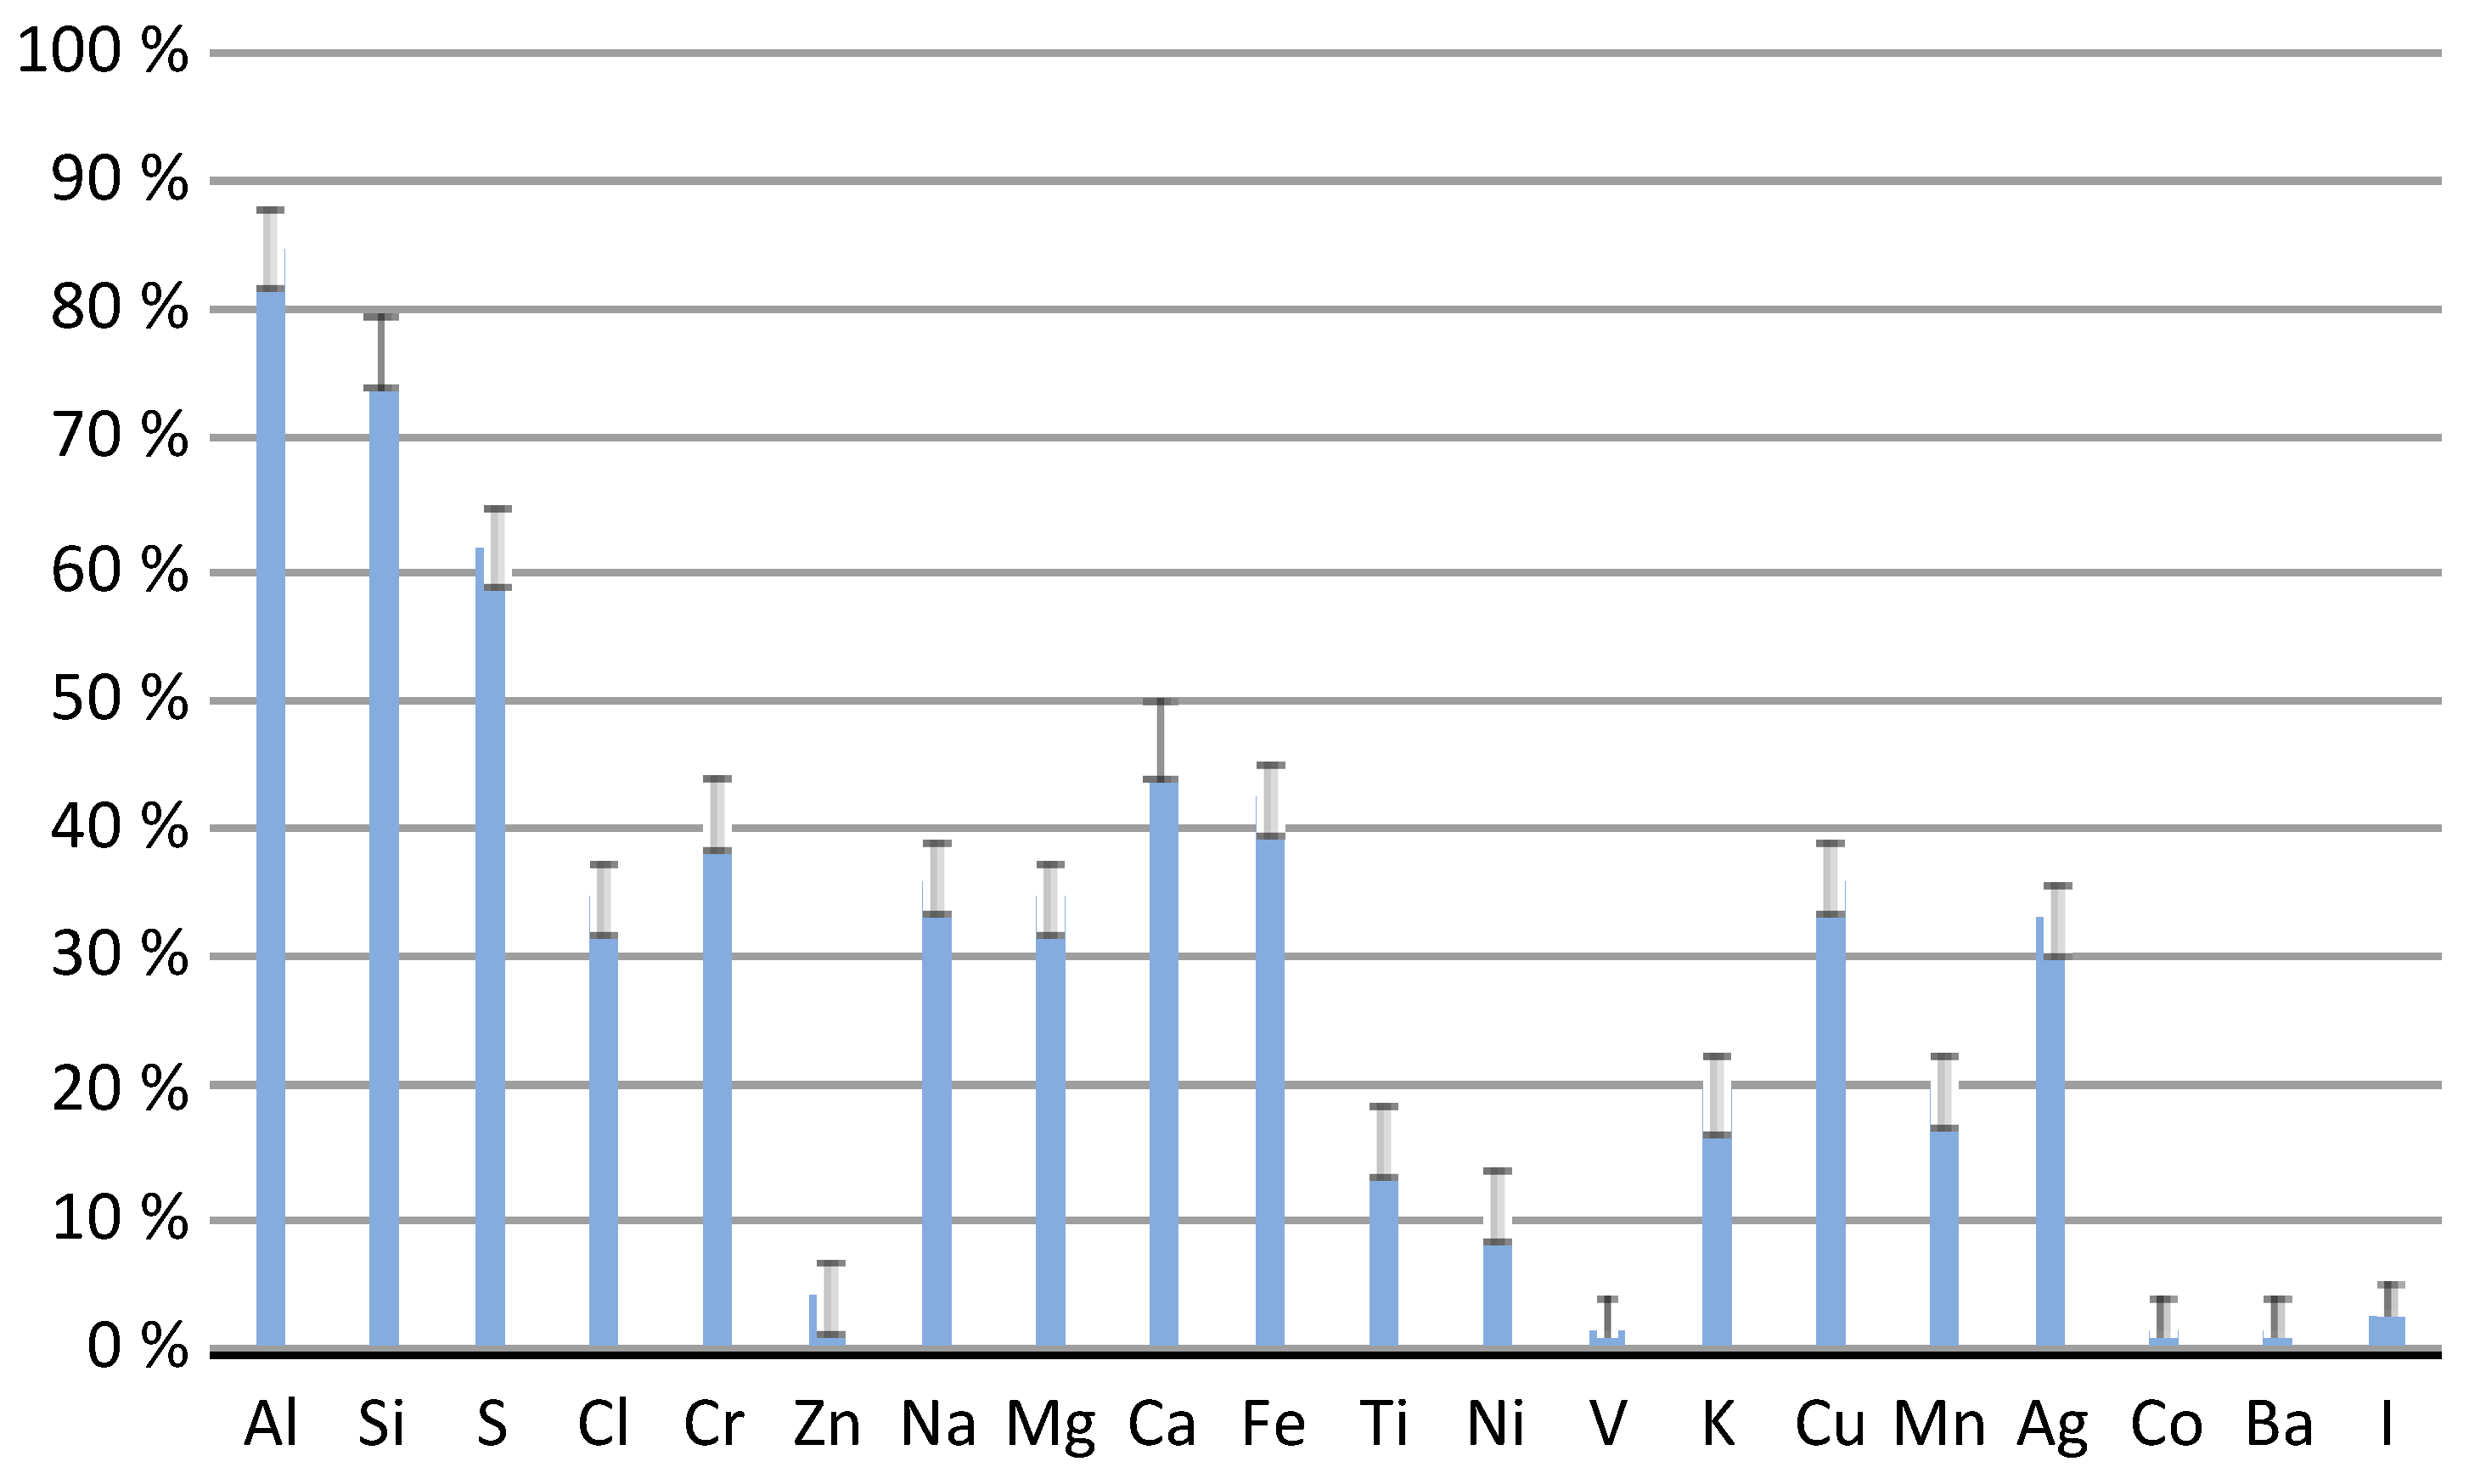
3.2. Chemical Composition of Particles

The presence of solid particles on the cellulose membranes confirms the occurrence of these particles in natural gas. The element detection frequency is presented in Figure 3. Each percentage represents the number of elements detected for all particles analyzed in this work.
Aluminum was found in 85% of particles, in contrast to vanadium, cobalt and barium, which were found in only approximately 1% of the particles. Silicon and sulfur also were detected frequently, which could be a result of sand or solid sulfur compounds encountered in natural gas, as reported by Pack et al., [13] Although it is not possible to correlate these results to the gas origin, some metals, such as aluminum, chromium, iron and titanium, are present in the alloys used in transport pipelines. Therefore, the pipes as the origin of the particles cannot be excluded, especially since the observed metals are part of the chemical composition of the pipes and, therefore, can reflect the occurrence of corrosion or abrasion, which is favorable for the presence of solid residues.
The element distribution for one particle also was determined by an X-EDS detector. Figure 3 shows the occurrence of each chemical element in a set of particles, but not its distribution inside the particle. Two examples of particle composition are presented in Table 1.
Some particles in natural gas are predominantly metallic, whereas some particles mainly are composed of major elements, such as sodium or chlorine (values in red in Table 1). Results for Particle 1 in Table 1 reveals the possibility of finding NaCl in natural gas or sand, based on the detection of silicon. These compounds have been identified in previous studies and are referred to as “black powder” [12].

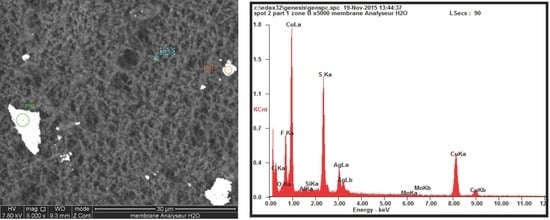
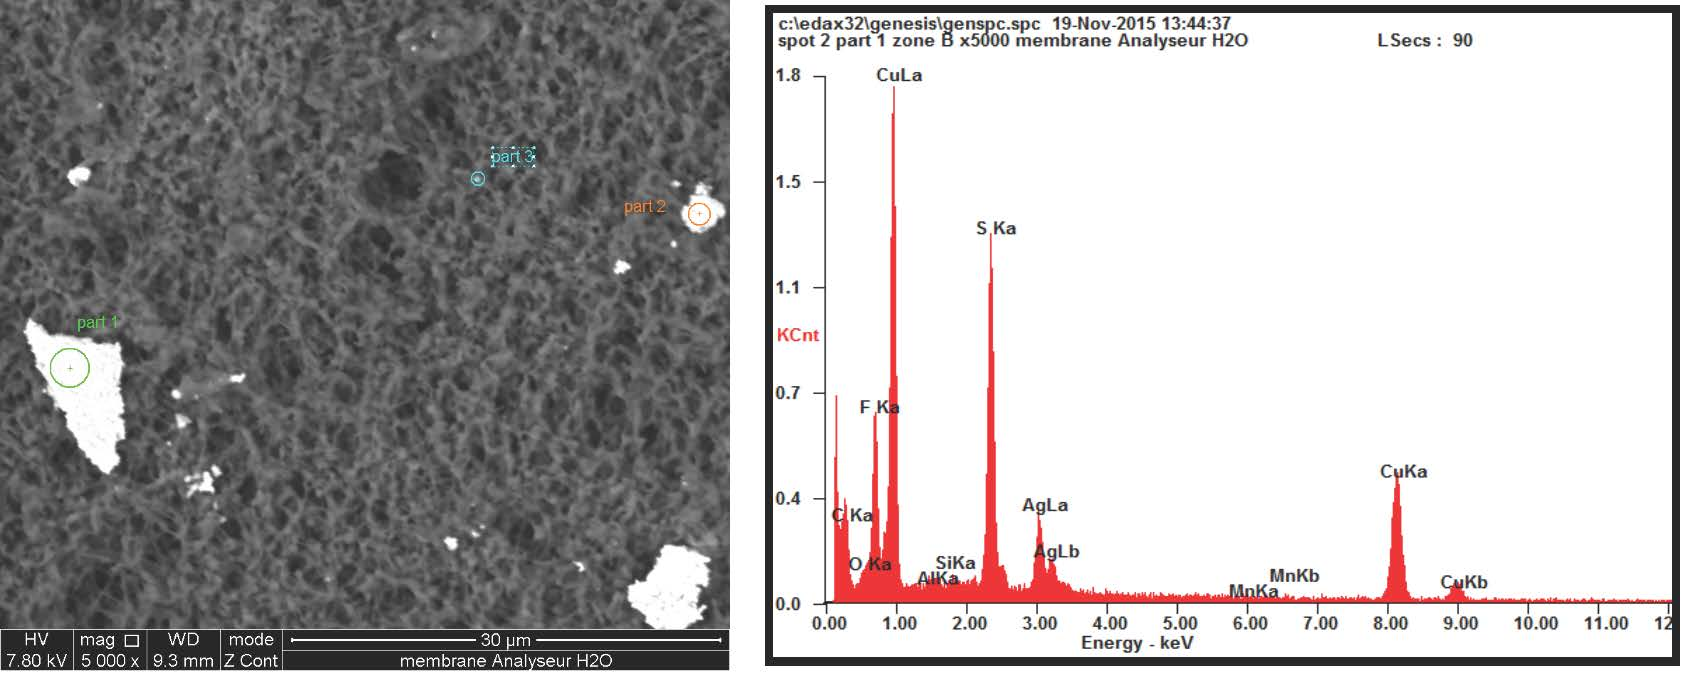
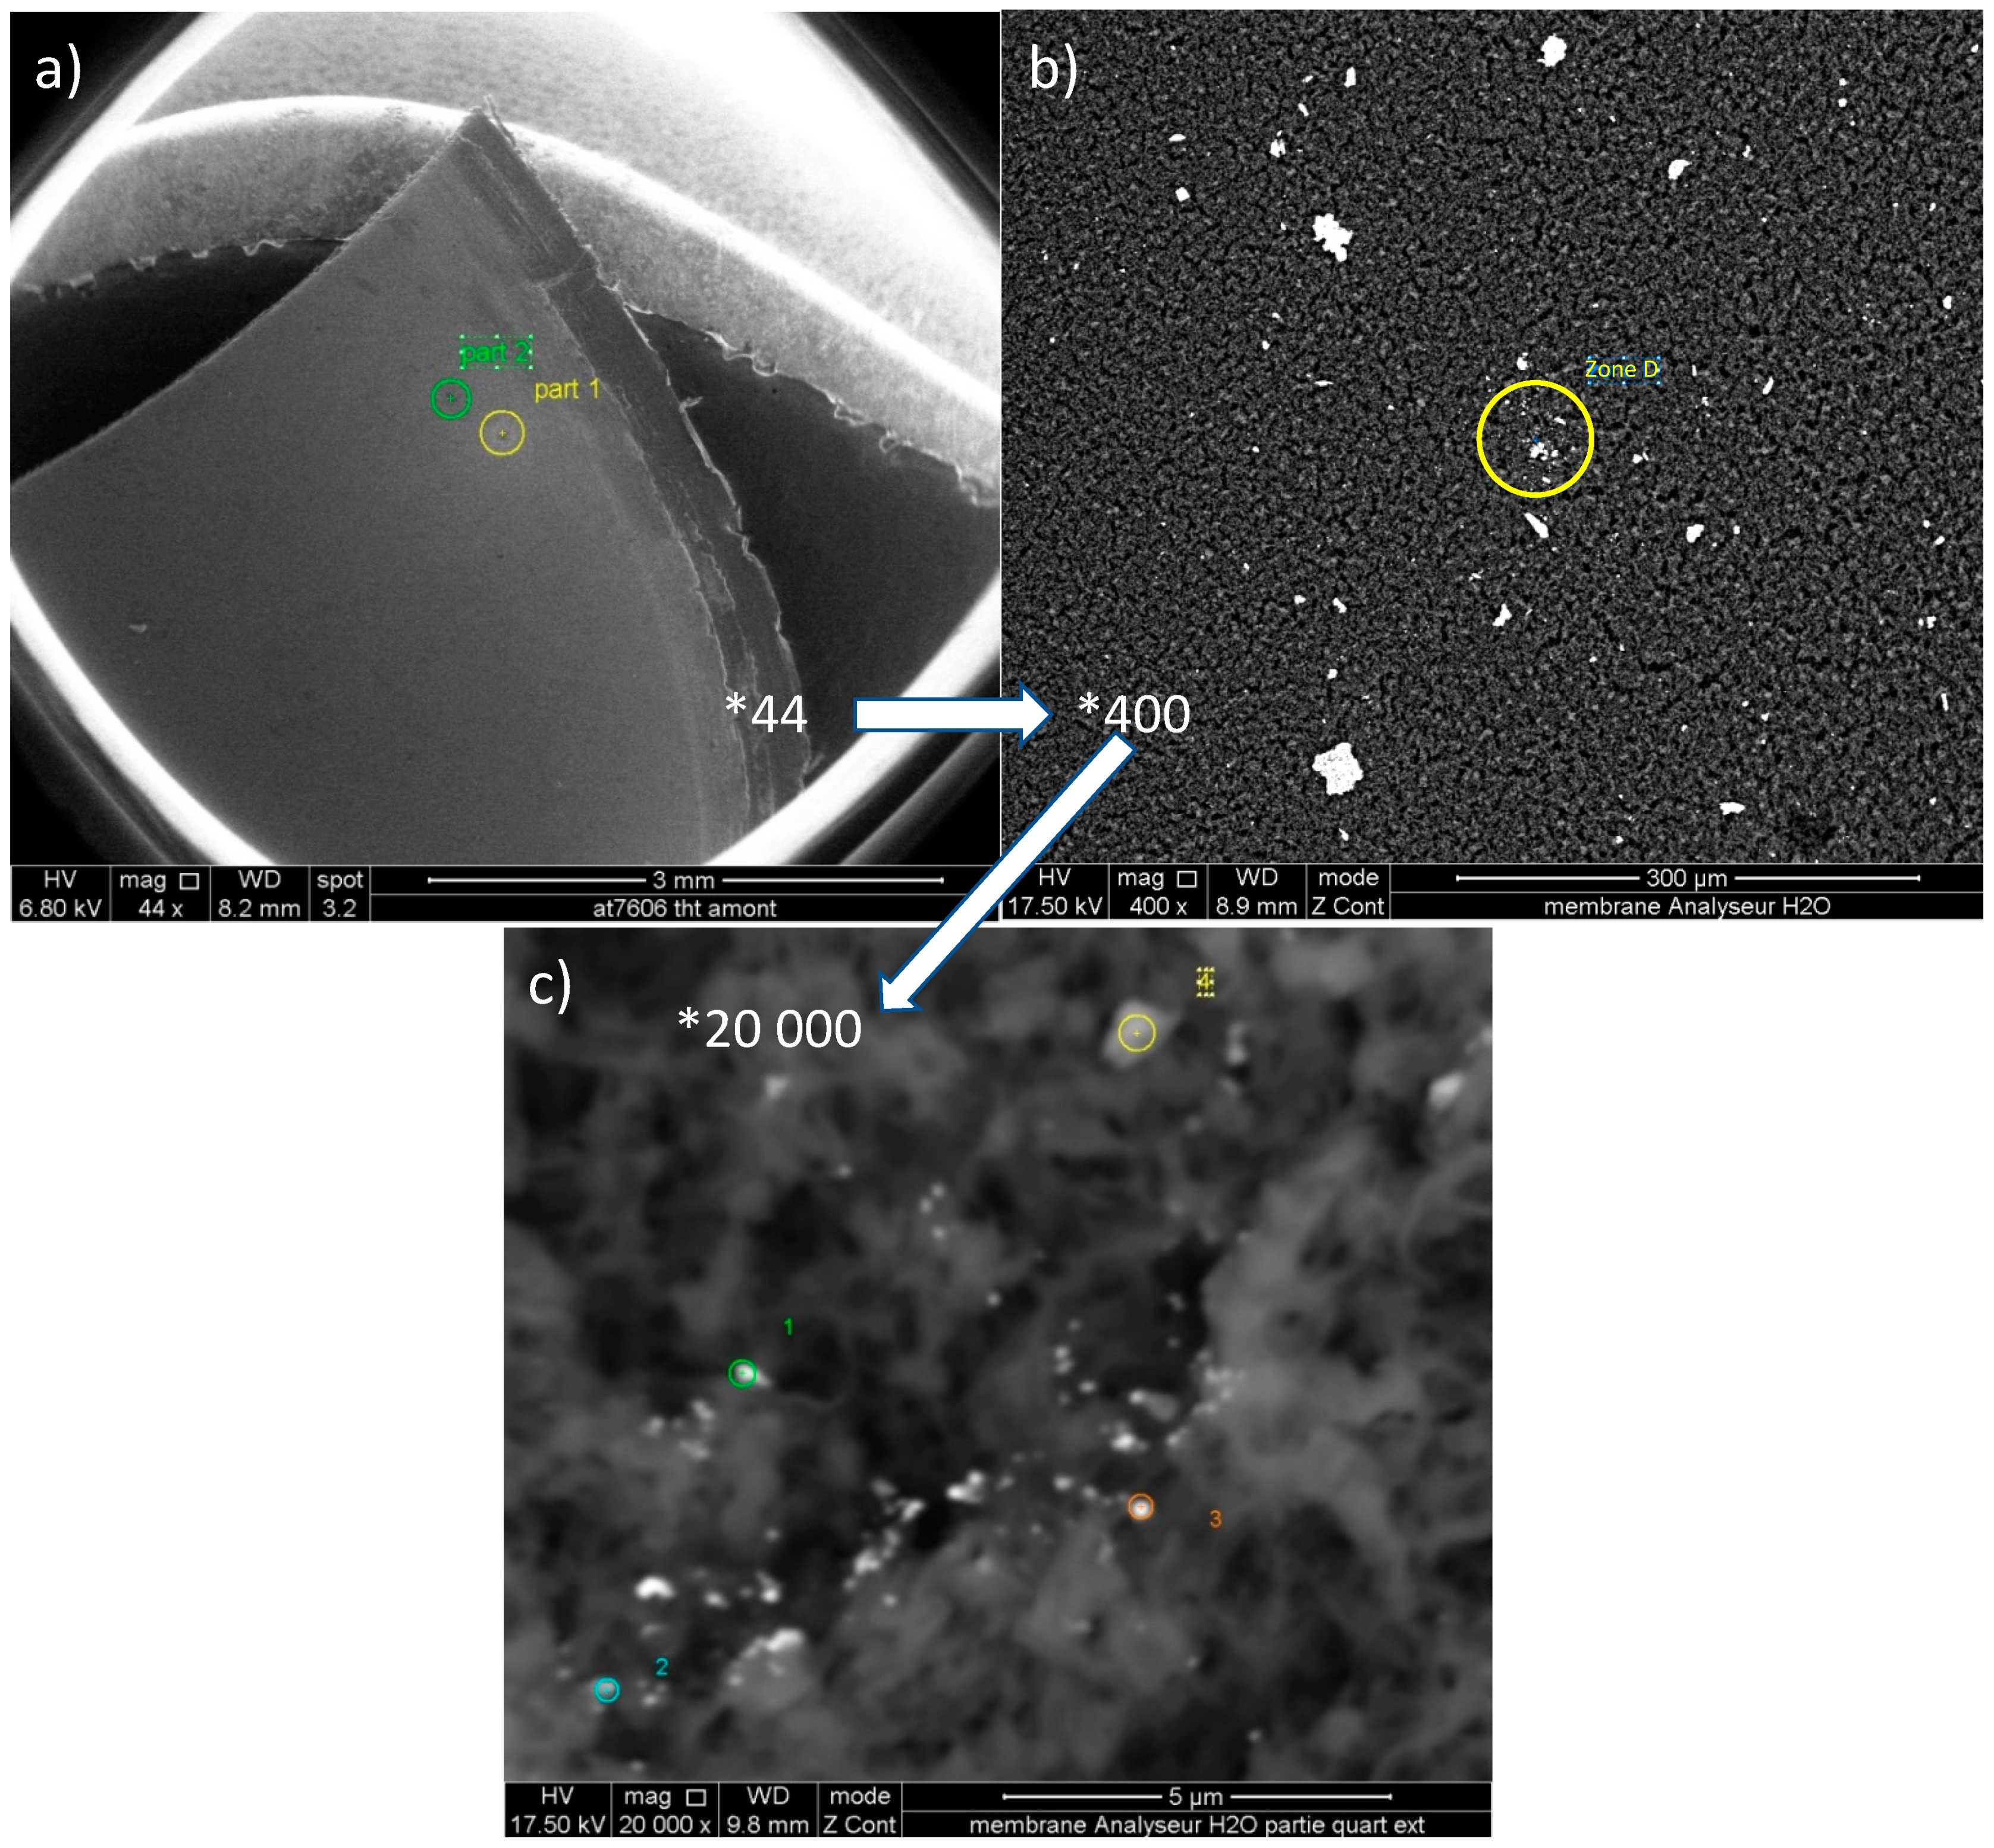
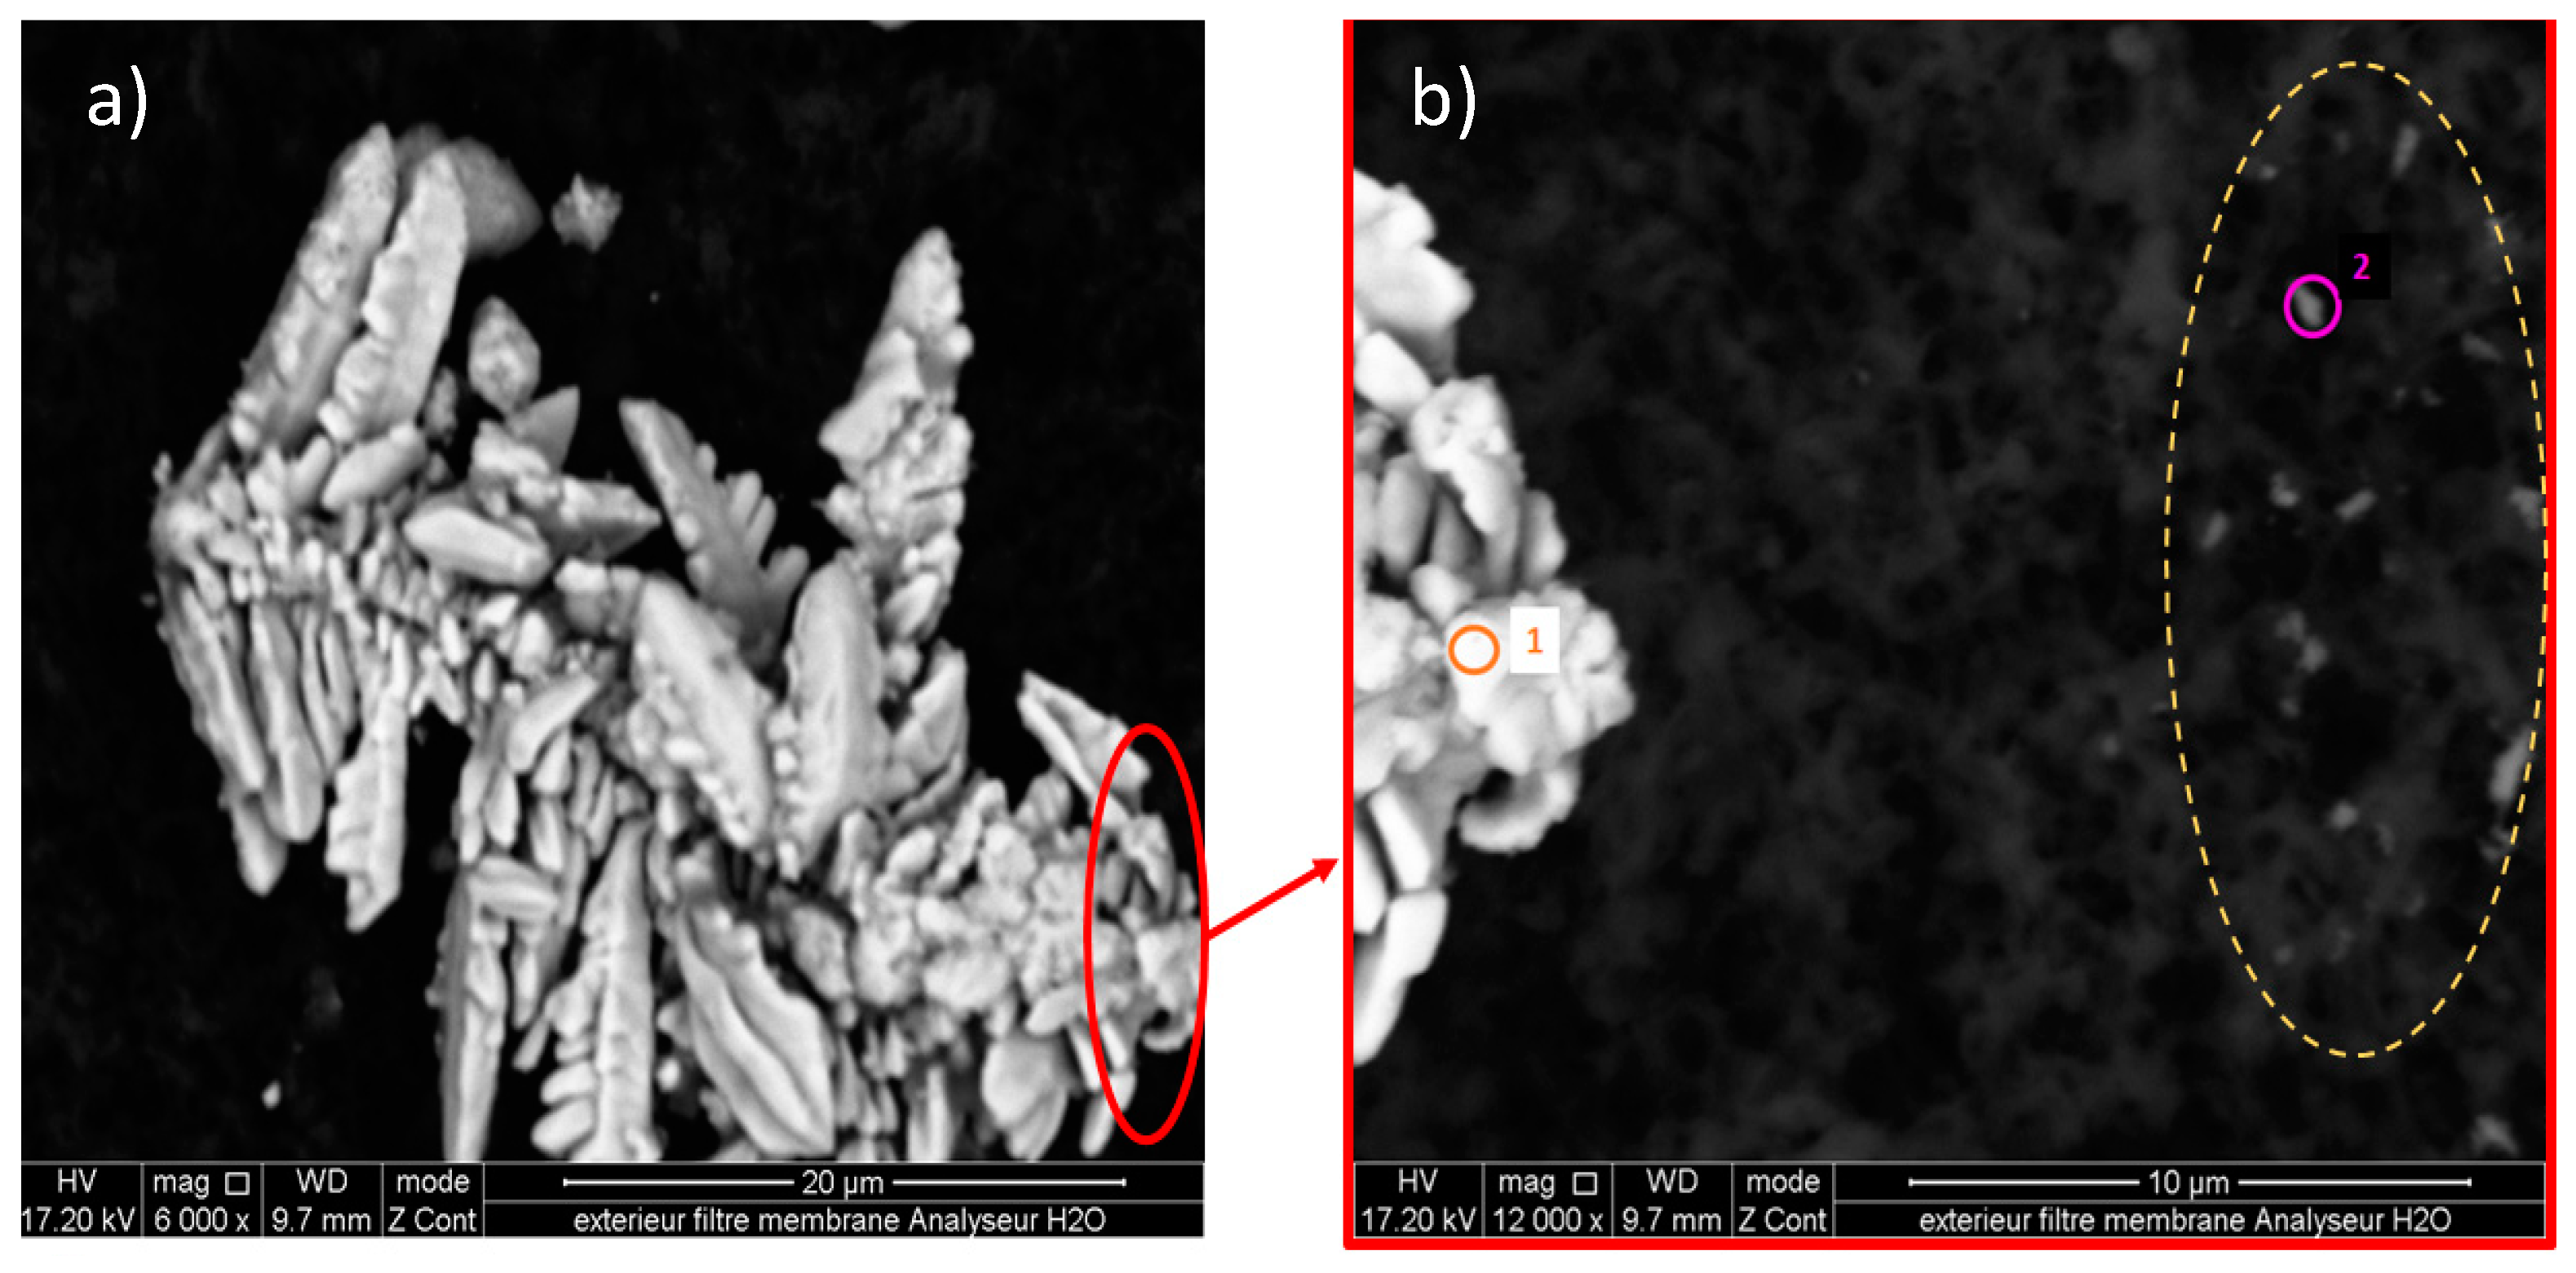
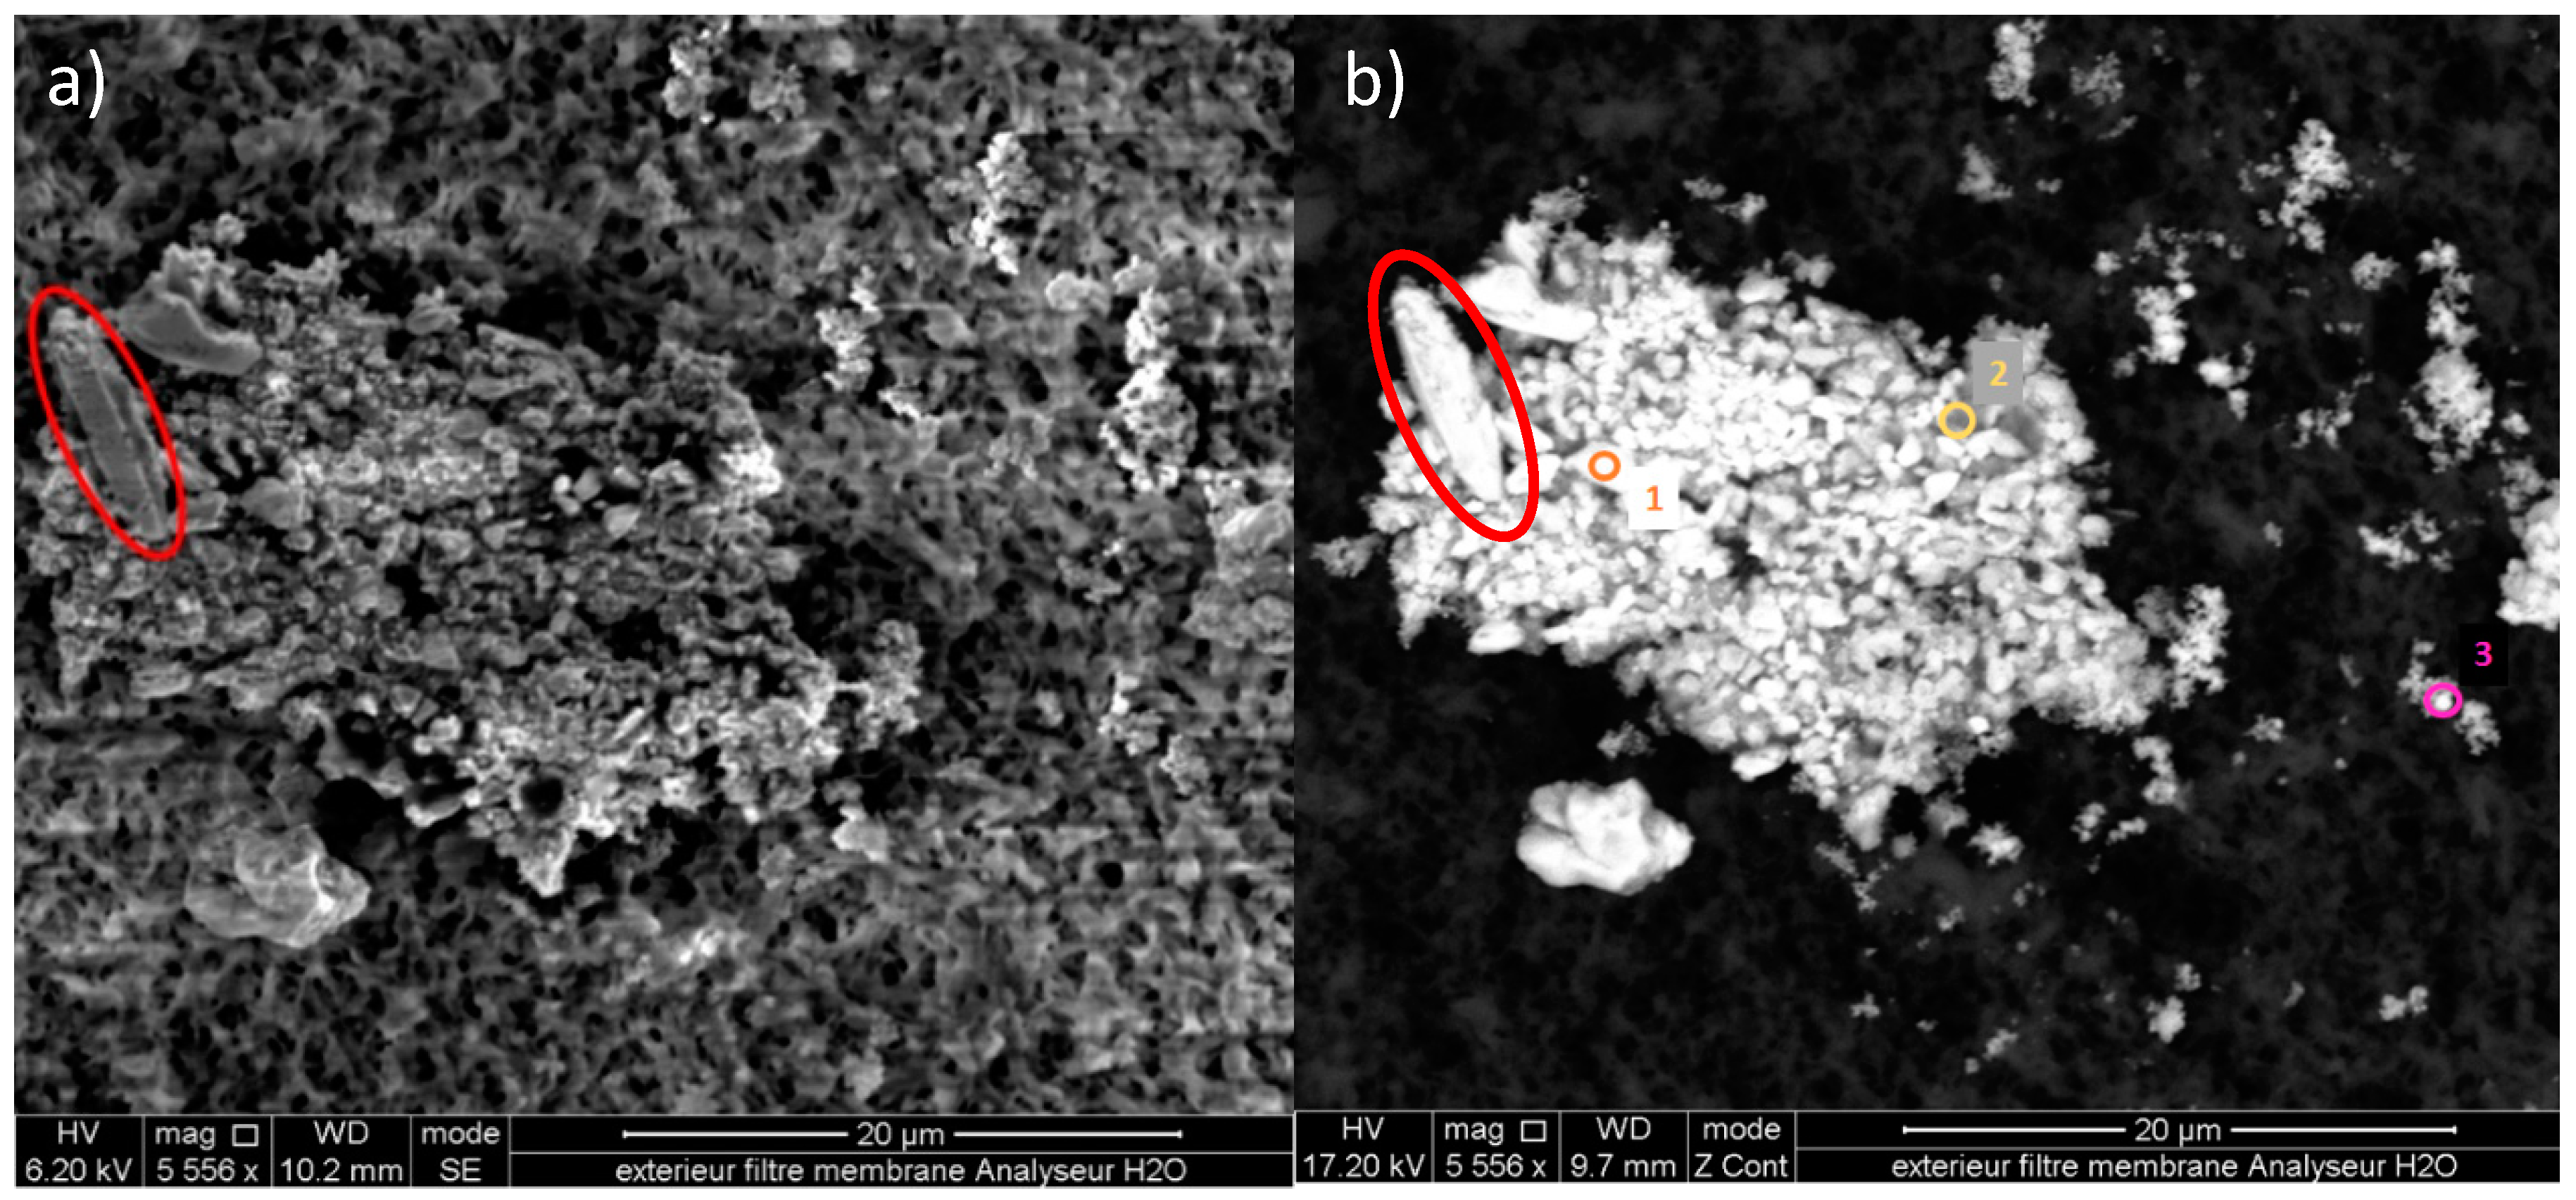
3.3. Study of Particles with Diameters >7 µm on the Cellulose Membranes

The cellulose membranes revealed a large range of particle sizes, from less than 1 µm to more than 25 µm, although a 7 µm porosity filter was placed upstream of the cellulose membranes in the pipe. Chemical analyses help to explain the presence of particles larger than 7 µm. Most of the larger particles were surrounded by smaller particles, as shown in Figure 4. Moreover, these smaller particles had the same chemical composition as presented in Table 2.
Figure 4b (yellow oval) shows small particles with a diameter less than 1 µm surrounding a larger particle (Figure 4a).
According to Table 2, the chemical composition of the main particle is similar to that of the small particles, where silver, copper and sulfur are predominant. It can be concluded that small particles could agglomerate to create a larger solid compound. This hypothesis could be verified by observing the particle in Figure 5 that clearly shows the aggregation of different small particles to form a larger main particle. Moreover, the heterogeneity indicates an overlapping of several particles to create a large compound. It is also interesting to note the similarity between the components in Figure 5 (circled in red) and those constituting the main particle in Figure 4.
Chemical composition analysis of the particle shown in Figure 5 was performed to complete this observation. Different areas of the particle were analyzed, distinguishable by their chemical contrasts (Spot 1 and Spot 2 in Figure 5b) and their shape. Small neighboring particles (Spot 3 in Figure 5b) also were analyzed by X-EDS to identify a common elemental composition with the larger particles. The results are presented in Table 3.
A difference in elemental composition was observed between Spots 1 and 2 of the main particle in Figure 5b and Table 3. Spot 2 reveals the presence of magnesium, aluminum, silicon, calcium, copper and silver. Connecting these results to the chemical composition, shape and relief of the main particle, it can be concluded that the identified elements have different origins. According to the analysis, the small neighboring particle (Spot 3 in Figure 5 and Table 3) is mainly composed of sulfur, silver and copper. This result corroborates the hypothesis that large particles result from the aggregation of many smaller particles.

4. Conclusions

Cellulose filter analysis shows that natural gas contains particles of different sizes and forms. Sizes less than 1 μm to more than 50 μm are observed.
EDX analyses reveal different chemical compositions, including metals. The observed particles are composed of numerous elements, determined in the following sequences from the least frequently to the most frequently detected: Co, Ba, V < I, Zn < Ni < Ti < K < Cl, Ag, Mg, Na < Cr, Fe < Ca < S < Si < Al, with relative occurrences ranging from 1 to 85%. This chemical heterogeneity highlights different particle origins and establishes that the largest particles are the result of small particle aggregation. This observation demonstrates the importance of monitoring the particulate phase in natural gas to anticipate potential damage. Combined knowledge about the amount and composition of particles in gases could explain some currently observed phenomena and provide solutions to improve infrastructure integrity.

Supplementary Materials

The following are available online at https://www.mdpi.com/1996-1073/12/20/3866/s1. Figure S1: Image of the cellulose membrane filters unused (left) and used (right).

Author Contributions

Please note that the manuscript was written through contributions of all authors. All authors have given approval to the final version of the manuscript.

Funding

The authors acknowledge the financial support of Teréga, the Conseil Régional d’Aquitaine (20071303002PFM) and Fonds Européen de Développement Économique et Régional (FEDER) (31486/08011464).

Acknowledgments

The authors acknowledge Teréga for providing samples and allowing the publication of this study.

Conflicts of Interest

The authors declare no conflicts of interest.

References

  1. Wei, L.; Geng, P. A review on natural gas/diesel dual fuel combustion, emissions and performance. Fuel Process. Technol. 2016, 142, 264–278. [Google Scholar] [CrossRef]
  2. Dilaver, Ö.; Dilaver, Z.; Hunt, L.C. What drives natural gas consumption in Europe? Analysis and projections. J. Nat. Gas. Sci. Eng. 2014, 19, 125–136. [Google Scholar] [CrossRef]
  3. S EN 16726:2015+A1:2018. Gas Infrastructures. Quality of Gas; Group H. BSI: London, UK, 2017; p. 56. [Google Scholar]
  4. Rojey, A.; Durand, B.; Jaffret, C.; Jullian, S.; Valais, M. Le Gaz Naturel: Production, Traitement, Transport; Editions Technip: Paris, France, 1994; pp. 1–430. [Google Scholar]
  5. Farzaneh-Gord, M.; Niazmand, A.; Deymi-Dashtebayaz, M.; Rahbari, H.R. Effects of natural gas compositions on CNG (compressed natural gas) reciprocating compressors performance. Energy 2015, 90, 1152–1162. [Google Scholar] [CrossRef]
  6. Jianwen, Z.; Da, L.; Wenxing, F. An approach for estimating toxic releases of H2S-containing natural gas. J. Hazard. Mater. 2014, 264, 350–362. [Google Scholar] [CrossRef] [PubMed]
  7. Snowdon, L.R. Natural gas composition in a geological environment and the implications for the processes of generation and preservation. Org. Geochem. 2001, 32, 913–931. [Google Scholar] [CrossRef]
  8. Krupp, E.M.; Johnson, C.; Rechsteiner, C.; Moir, M.; Leong, D.; Feldmann, J. Investigation into the determination of trimethylarsine in natural gas and its partitioning into gas and condensate phases using (cryotrapping)/gas chromatography coupled to inductively coupled plasma mass spectrometry and liquid/solid sorption techniques. Spectrochim. Acta Part B At. Spectrosc. 2007, 62, 970–977. [Google Scholar] [CrossRef]
  9. Duoyi, W.; Meizhou, D.; Yinghan, L.; Yawei, L.; Xingyun, L.; Renqi, L. Discovery of the metal trace elements in natural gas and its ecological environment significance. Earth Sci. Front. 2008, 15, 124–132. [Google Scholar] [CrossRef]
  10. Ezzeldin, M.F.; Gajdosechova, Z.; Masod, M.B.; Zaki, T.; Feldmann, J.; Krupp, E.M. Mercury speciation and distribution in an egyptian natural gas processing plant. Energy Fuels 2016, 30, 10236–10243. [Google Scholar] [CrossRef]
  11. Cachia, M.; Bouyssière, B.; Carrier, H.; Garraud, H.; Caumette, G.; Le Hécho, I. Development of a high-pressure bubbling sampler for trace element quantification in natural gas. Energy Fuels 2017, 31, 4294–4300. [Google Scholar] [CrossRef]
  12. Azadi, M.; Mohebbi, A.; Soltaninejad, S.; Scala, F. A case study on suspended particles in a natural gas urban transmission and distribution network. Fuel Process. Technol. 2012, 93, 65–72. [Google Scholar] [CrossRef]
  13. Pack, D.J.; Parks, D.W.; Chesnoy, A.B. Gas pipeline preferential site selection occurrence for elemental sulphur & other particle matter formation & deposition. J. Petrol. Sci. Eng. 2012, 94–95, 12–18. [Google Scholar] [CrossRef]
  14. Xiong, Z.; Ji, Z.; Wu, X.; Chen, Y.; Chen, H. Experimental and numerical simulation investigations on particle sampling for high-pressure natural gas. Fuel 2008, 87, 3096–3104. [Google Scholar] [CrossRef]
Figure 1. Analytical procedure used to obtain images of particles at different magnitudes: (a) ×44 for the location of the studied areas labeled “part 1” and “part 2”; (b) ×400 for the count of particles according to their size (BSE mode) and; (c) ×20,000 for the location of particles (zone D on figure b) analyzed by the EDX detector (BSE micrography).
Energies 12 03866 g001
Figure 2. Number of particles observed on cellulose membranes according to their diameter.
Energies 12 03866 g002
Figure 3. Relative occurrence of element detection for all particles observed.
Energies 12 03866 g003
Figure 4. (a) Large particles showing a dendritic crystal growth pattern (>7 µm) at ×6000 and; (b) ×12,000 encircled by smaller particles. O 1 = main particle, O 2 = small particle.
Energies 12 03866 g004
Figure 5. Observation of a large particle (>7 µm) formed by the agglomeration of smaller particles of different sizes and shapes at ×5556 magnitude with detectors secondary electrons SE (a) and backscattered electrons BSE (b).
Energies 12 03866 g005
Table 1. Chemical compositions of two kinds of particles in natural gas.
Element% Total Weight% Total Atomic
Particle 1NaK22.31 ± 3.3529.03 ± 4.35
MgK3.38 ± 2.374.16 ± 2.91
AlK8.11 ± 0.419.00 ± 0.45
SiK9.60 ± 0.4810.22 ± 0.51
PK3.71 ± 2.233.58 ± 2.15
SK9.42 ± 0.948,79 ± 0.88
ClK26.97 ± 4.0522.76 ± 3.41
KK7.64 ± 1.915.85 ± 1.46
CaK8.85 ± 1.336.61 ± 0.99
Particle 2AlK6.25 ± 3.4411.12 ± 6.12
SiK4.02 ± 3.626.87 ± 6.18
CrK76.98 ± 26.9471.05 ± 24.87
FeK12.75 ± 3.1910.95 ± 2.74
Table 2. Chemical compositions of the Main particle (1) and Smaller particles (2) (Figure 4).
Element% Total Weight% Total Atomic
Main particleMgK0.54 ± 0.291.42 ± 0.78
AlK0.43 ± 0.241.03 ± 0.57
SiK0.33 ± 0.180.78 ± 0.43
SK19.09 ± 10.4938.02 ± 20.91
AgL51.47 ± 28.3030.48 ± 16.76
CuK28.13 ± 15.4728.28 ± 15.55
Smaller particlesMgK0.75 ± 0.232.38 ± 0.71
AlK0.54 ± 0.161.50 ± 0.15
SiK0.65 ± 0.061.77 ± 0.35
SK11.79 ± 4.7228.40 ± 12.78
AgL77.90 ± 15.5855.78 ± 16.73
CuK8.37 ± 3.7710.15 ± 4.57
Table 3. Chemical compositions of Spots 1 and 2 from the main particle and Spot 3 of a small particle (Figure 5).
Element% Total Weight% Total Atomic
Spot 1SK20.60 ± 8.2421.99 ± 9.89
AgL44.17 ± 8.8314.02 ± 4.21
CuK35.22 ± 15.8518.96 ±8.53
Spot 2MgK0.27 ± 0.080.32 ± 0.09
AlK0.34 ± 0.100.35 ± 0.04
SiK0.29 ± 0.030.29 ± 0.06
SK21.14 ± 8.4618.75 ± 8.44
AgL41.10 ± 8.2210.84 ± 3.25
CaK1.89 ± 0.571.34 ± 0.40
CuK34.98 ± 15.7415.65 ± 7.04
Spot 3SK12.89 ± 5.156.04 ± 2.71
AgL57.05 ± 11.418.05 ± 2.42
CuK30.07 ± 13.537.11 ± 3.20

