Article

Intelligent Estimation of Vitrinite Reflectance of Coal from Photomicrographs Based on Machine Learning

1
School of Information and Control Engineering, China University of Mining and Technology, Xuzhou 221116, China
2
Department of Electrical and Computer Engineering, University of British Columbia, Vancouver, BC V6T 1Z4, Canada
3
School of Resources and Geosciences, China University of Mining and Technology, Xuzhou 221116, China
*
Authors to whom correspondence should be addressed.
Energies 2019, 12(20), 3855; https://doi.org/10.3390/en12203855
Submission received: 3 September 2019 / Revised: 28 September 2019 / Accepted: 8 October 2019 / Published: 12 October 2019
(This article belongs to the Section H: Geo-Energy)

Abstract

:
The accurate measurement of vitrinite reflectance (especially for mean maximum vitrinite reflectance, MMVR) is an important issue in the fields of coal mining and processing. However, the application of MMVR has been somewhat hampered by the subjective and the time-consuming characteristic of manual measurements. Semi-automated methods that are oversimplified might affect the accuracy in measuring MMVR values. To address these concerns, we propose a novel MMVR measurement strategy based on machine learning (MMVRML). Considering the complex nature of coal, adaptive K-means clustering is firstly employed to automatically detect the number of clusters (i.e., maceral groups) in photomicrographs. Furthermore, comprehensive features along with a support vector machine are utilized to intelligently identify the regions with vitrinite. The largest region with vitrinite in each photomicrograph is gridded for further regression analysis. Evaluations on 78 photomicrographs show that the model based on random forest and 15 simplified grayscale features achieves the state-of-the-art root mean square error of 0.0424. In addition, to facilitate the usage of petrologists without strong expertise in the machine learning domain, we released the first non-commercial standalone software for estimating MMVR.

1. Introduction

1.1. Background and Motivation

Vitrinite reflectance (VR), the percentage of incident light reflected from a polished vitrinite surface, is the most definitive maturation parameter to characterize the maturation process of coal [1,2]. The mean maximum vitrinite reflectance (MMVR), one of the most important types of VR, is widely accepted as an important and desirable means for evaluating the potential usefulness of coals in a series of applications [3], such as determining coal blending procedures, evaluating coal’s suitability for hydrogenation, identification of potential sites for exploration, and so on [4,5]. Although there are a few other maturation parameters, including volatile matter, calorific value, and moisture content, MMVR is the most commonly used one for calculating the relative amount of coalification and defining coal rank [6,7,8].
Despite the advantages and obvious usefulness of MMVR, its application has been hampered by the subjective factors and time-consuming characteristic of manual methods [6]. To measure vitrinite reflectance, steps including grinding, pelleting, and polishing are required to prepare the samples [9]. Prior to the measuring, the coal sample should be placed in the desiccator for at least 15 h and the apparatus should be calibrated following strict guidelines. Then, a series of reflectance measurements (usually more than 100) are collected from particles of vitrinite in the sample. It is necessary to measure vitrinite reflectance at different locations by rotating the microscope stage in the measurement process. The method for measuring MMVR of coal samples is standardized in both Method of Determining Microscopically the Reflectance of Vitrinite (ISO 7404-5) [10] and Standard Test Method for Microscopical Determination of the Vitrinite Reflectance of Coal (ASTM D2798) [11], as well as a few other national standards. In addition, significant petrographic experience is also vital to precisely measure the MMVR. In order to avoid subjectivity and the variability arisen from different interpretations, a few independent measurements are always repeated and the mean value is reported as the MMVR of the sample.
The problems encountered in measuring MMVR can be categorized into three causes: human mistakes; technical issues; and problems associated with the complicated nature of coal, especially for inhomogeneity [12]. The frequency of human mistakes and technical problems largely depends on the experience of the operator, whereas the third case is difficult to deal with owing to its generally inestimable character. Determination of the MMVR of a coal requires sophisticated microscopic instrumentation and expertise. The traditional way based on optical experiment also requires expensive and time-consuming analytical methods. To address these concerns, an objective and accurate analytical technique that is able to automatically estimate MMVR is highly desired for the growing industrial demand. In this work, we propose a novel strategy based on machine learning to intelligently estimate the vitrinite reflectance from photomicrographs. It involves image segmentation based on adaptive K-means, vitrinite identification based on the combination of a support vector machine and comprehensive features, as well as MMVR regression based on random forest regression.

1.2. Related Work

An MMVR estimation system should include two major components, including vitrinite detection/identification and MMVR estimation. Both vitrinite detection and MMVR estimation are open problems owing to the complex and heterogeneous nature of coal. Many attempts have been made in this field, whereas, to the best of the authors’ knowledge, each of the previous works only covers one component (i.e., vitrinite identification or MMVR estimation) in their research. There is no systematic study that is able to automatically detect vitrinite and estimate the MMVR value from photomicrographs.
Maceral composition analysis and vitrinite reflectance analysis are two main petrographic ways to evaluate coals. Maceral composition analysis is an important technique in evaluating the economical use of a coal or the performance of coal conversion processes [13]. Over the past decades, attempts of maceral components’ identification have shown promising results. Młynarczuk and Skiba evaluated the ability of three machine learning methods for identifying three maceral groups of coal (i.e., vitrinite, inertinite, and liptinite) and non-organic minerals. They selected a sequence of regions of interest and achieved an average accuracy of 97.23% with the nearest neighbor method based on the morphological gradients and the gray level features [14]. Wang et al. proposed a novel maceral identification method based on image analysis. The developed maceral identification tool, Maceral Identification strategy based on Image Segmentation and Classification (MISC), is able to provide complete analysis of maceral components with accuracy of 90.44% [15]. In addition, there are two automated microscopic techniques that have been successfully commercialized, including Pearson petrography [16] and Commonwealth Scientific and Industrial Research Organisation (CSIRO) coal grain analysis [17]. However, they do not mention the corresponding performance.
Although there are many attempts on the identification of maceral components, the studies focusing on MMVR estimation are relatively limited. England et al. employed an image analyzer to measure the distribution of VR [18]. Paulo et al. developed a vitrinite reflectance measurement tool based on image analysis, and the obtained values are highly correlated with the results from traditional measurements [19]. Considering the principle that maceral reflectance is proportional to the grayscale value of an image, Chen et al. established the working curve of maceral reflectance determination [20]. However, these measurements of vitrinite reflectance based on automatic imaging techniques were oversimplified, which may create major problems in interpreting various geological situations. There are three commercialized softwares for measuring vitrinite reflectance, including Pearson Petrography [16], CRAIC technologies [21], and Lim Laboratory Imaging [22]. CRAIC provided solutions for measuring vitrinite reflectance with either a photometer, a spectrophotometer, or a digital camera fitted to the microscope. They released a tool, namely GeoImageTM, for measuring reflectance of coals, kerogens, and other sedimentary rock accurately and efficiently. Lim Laboratory Imaging released a software for maceral analysis and coal reflectance measurement. However, they do not mention the detailed technologies employed in these two tools on the corresponding websites.
Although the above-mentioned works have achieved promising performances, there are still some issues that need to be tackled.
First and foremost, the separation of the vitrinite component from microscopic images is the basis of vitrinite reflectance measurement. Without this step, it is unrealistic to achieve fully automatic estimation of vitrinite reflectance. Considering the overlap of gray levels between different macerals as well as the complexity of coal, it is difficult to distinguish vitrinite from other macerals only based on gray levels [15,23]. In addition, according to the prior knowledge of vitrinite reflectance measurement, the measurement based on a large area of vitrinite can promote robust estimation results. Therefore, it is imperative to identify the vitrinite regions accurately.
Second, in previous studies, the researchers assumed that there is a linear relationship between vitrinite reflectance and the grayscale value of a pixel or the maximum grayscale value of a region. Vitrinite reflectance is determined by counting the distribution of its histogram from sufficient measurements. Therefore, more grayscale features describing the characteristics of grayscale distribution are needed for measuring vitrinite reflectance. In addition, the assumption about the linear relationship may not hold. A powerful machine learning method can be employed to learn this relationship from data.
Last, but not least, there is no publicly available software for the automatic measurement of vitrinite reflectance. The traditional measurement methods require significant petrographic experience, whereas some researchers who also attempt to understand vitrinite reflectance may not have strong expertise in maceral analysis.
To address the above-mentioned concerns, we propose a novel framework for estimating coal mean maximum vitrinite reflectance automatically based on machine learning (MMVRML). An adaptive image segmentation method was adopted to separate different components in photomicrographs, and a support vector machine (SVM) with radial basis function (RBF) kernel was employed to identify the vitrinite regions. Finally, we adopted random forest to estimate vitrinite reflectance. The main contributions of our proposed MMVRML lie in three folds.
(1)
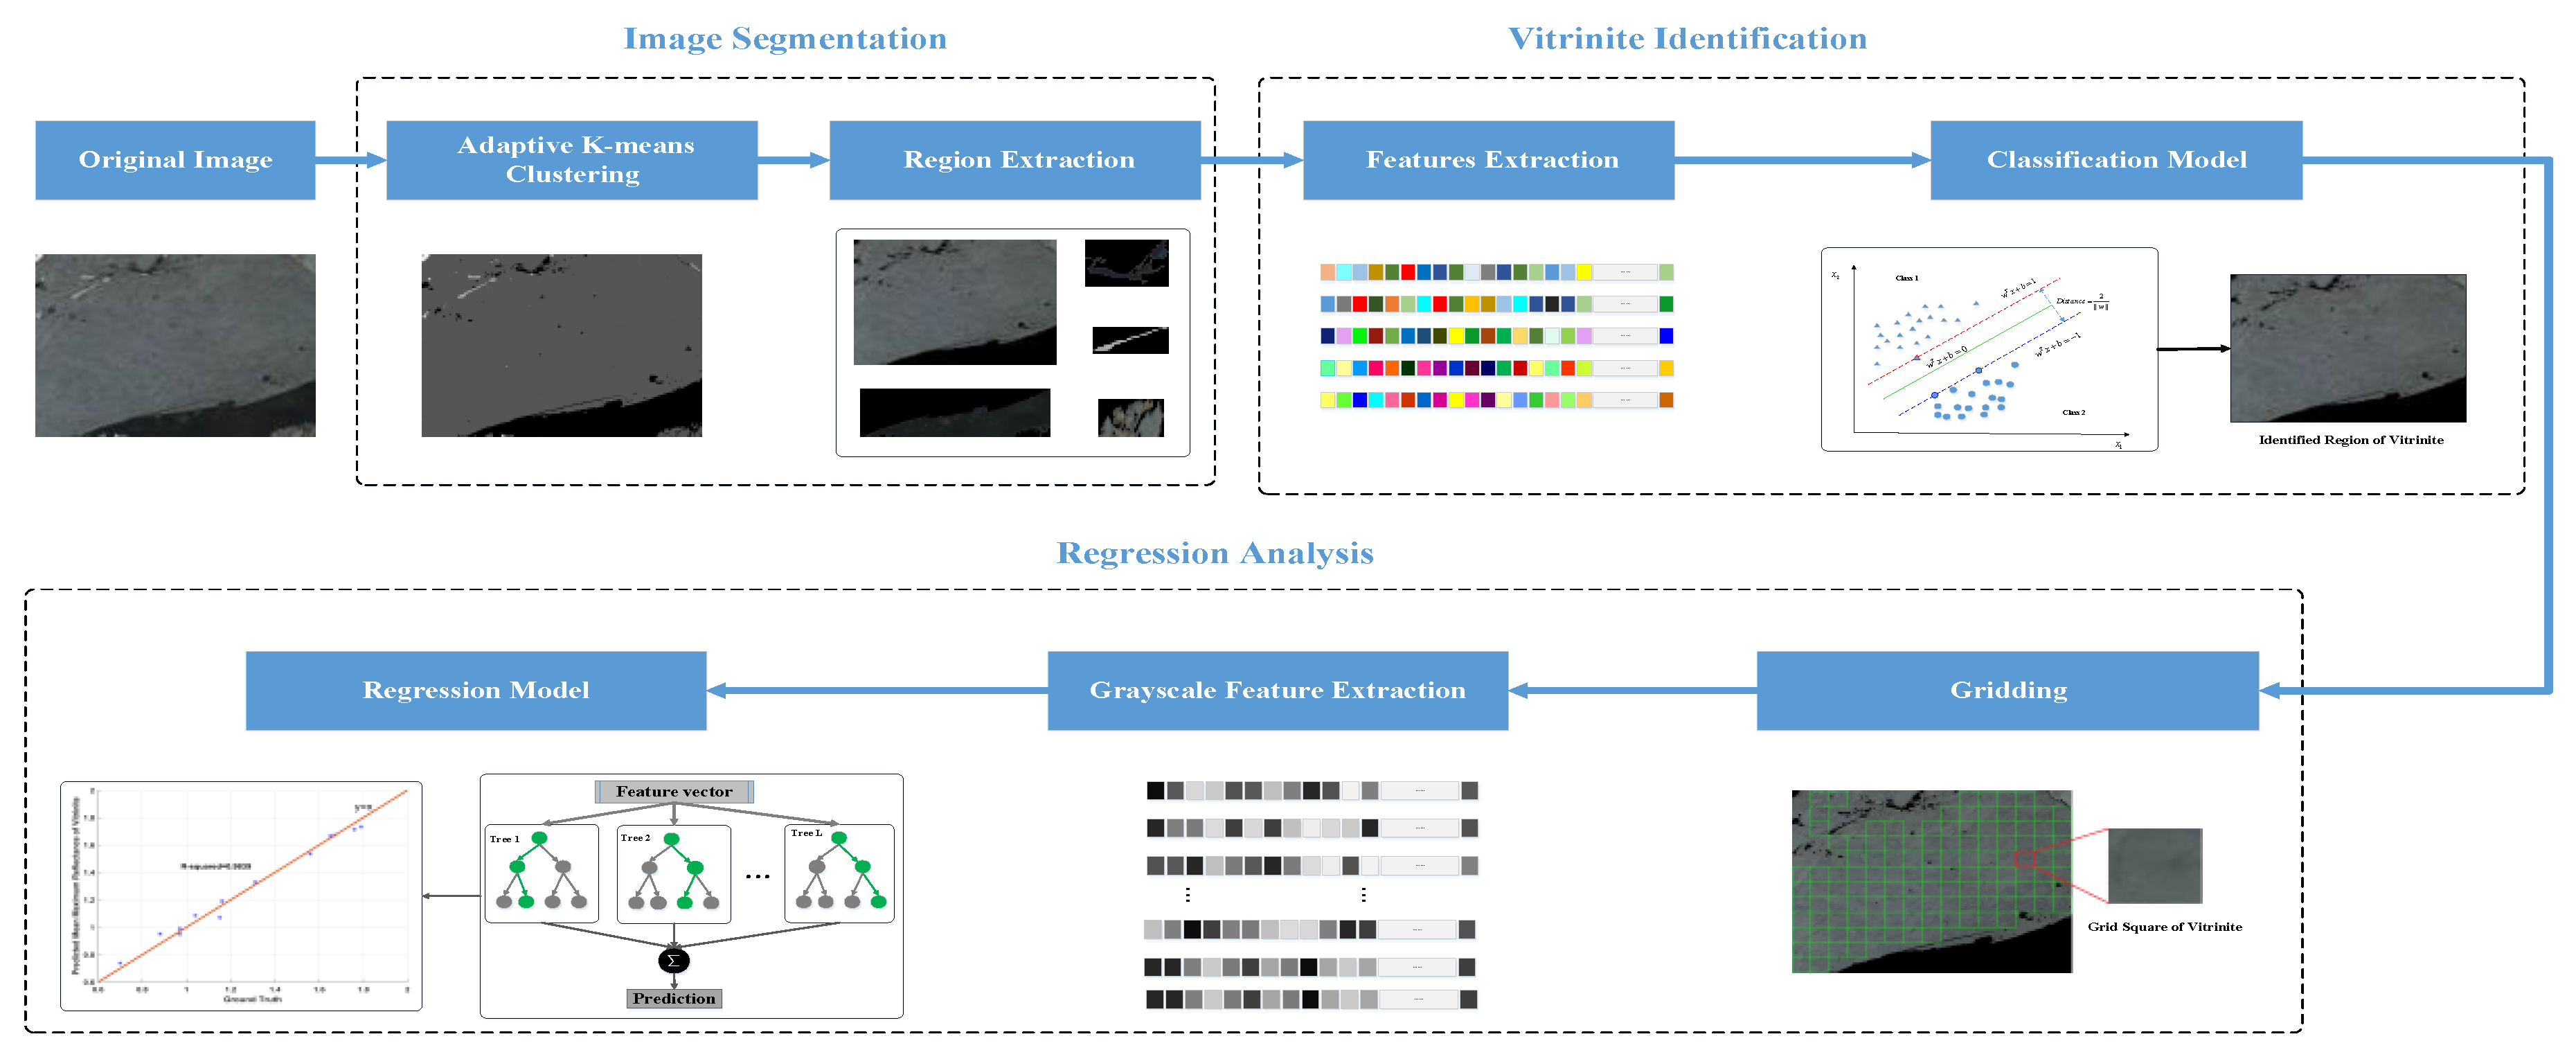
Considering the complicated characteristics of coal photomicrographs, the number of maceral categories in one photomicrograph is uncertain. We adopted an adaptive image segmentation method to intelligently segment an entire photomicrograph into several discrete regions, where each region corresponds to one maceral group. The proposed method can be generalized in different degrees of coalification.
(2)
Comprehensive and discriminative features from coal photomicrographs, including texture, grayscale, and geometric features, were employed to distinguish vitrinite from other maceral components. We evaluated four popular machine learning classifiers along with the comprehensive feature combination. The SVM with RBF kernel provides state-of-the-art performance with an average accuracy of 97.10%. In the vitrinite reflectance estimation stage, we employed 15 grayscale features to reflect the gray distribution characteristics. Finally, we evaluated seven regression methods to estimate the MMVR value, and the best regression performance was obtained by random forest (RF), with R-squared of 0.9839.
(3)
We released a fully automatic mean maximum vitrinite reflectance estimation software, namely MMVRML, which is able to automatically estimate MMVR from photomicrographs. This tool integrates algorithms of adaptive image segmentation, vitrinite identification, and MMVR estimation. The developed software is freely available for users at the following website: https://github.com/GuyooGu/MMVRML.

2. Materials

Thirteen bituminous coal samples used in the study were randomly selected from samples submitted to the laboratory of United States Geological Survey (USGS) from Colorado and West Virginia [24]. The samples were well prepared after a sequence of operations, including grinding, pelleting, and polishing according to American Society for Testing Materials (ASTM) D2797 standard [25]. The mean maximum reflectance of the vitrinite components, the ground truth of this dataset, was strictly measured through the traditional manual measuring method, and all measurements met the requirements of ASTM D2798 standard [11]. The MMVR was determined microscopically by measuring the amount of light reflected from a polished surface immersed in oil through a microscopic system, which includes an incident light microscope, a photomultiplier, a microprocessor, and a computer. We refer the readers to the works of [10,11] for further details about manual methods for measuring the vitrinite reflectance of coal.
A total of 78 photomicrographs containing vitrinite were captured by a Leica DFC 480 digital camera from these 13 bituminous coal samples. The size of these photomicrographs varies from each other, in the range of (281 – 547) × (369 – 648) px. Each pixel roughly corresponds to 2–4 μm. All these photomicrographs were captured under incident white light in oil immersion with the same camera exposure. The range of mean maximum vitrinite reflectance of these 78 photomicrographs is from 0.7% to 1.79% [24]. In order to reduce the effect of subjective evaluation in the determination of vitrinite reflectance, each bituminous coal sample was measured by 10–15 independent laboratories, and the indicated values on the photomicrographs are the group mean result. The dataset used in this study can be found at https://energy.usgs.gov/PhotoAtlas/?aid=14.

3. Methods

We present the flowchart of the proposed MMVRML in Figure 1, including image segmentation based on adaptive K-mean clustering, vitrinite identification based on image classification, and MMVR estimation based on regression. Considering that the category number of each photomicrograph is unknown, we employed adaptive K-means clustering to segment photomicrographs into separate regions, where each region corresponds to one maceral group. Then, 112-dimensional discriminative features were extracted for vitrinite identification, including texture features, grayscale features, and geometric features. Given the fact that vitrinite is relatively large, in this study, we only classified the maceral components that were larger than 200 px. We further employed four image classification techniques, such as RF and SVM, to classify the segmented regions. In the MMVR estimation stage, we employed 15 simplified grayscale features to build the regression model based on 7 machine learning methods.

3.1. Image Segmentation Based on Adaptive K-Means Clustering

Image segmentation is a fundamental step of image analysis and interpretation, which is vital for automatic maceral composition identification and reflectance measurement. K-means clustering is undoubtedly the most extensively used technique for complex image segmentation, whereas it also comes with several limitations. First and foremost, it requires users to specify the number of clusters [26]. However, owing to the complexity of coal, it is sometimes unrealistic to know the number of maceral types in a photomicrograph without strong expertise in maceral analysis. Second, it is susceptible to the initial centroids and always converges at a local optimum. In addition, the clustering results may be different in various trials [27,28]. In order to overcome above-mentioned limitations, an adaptive strategy whose initial cluster centers were specified according to the grayscale distribution of photomicrographs was employed to separate the regions with different maceral components. The proposed method is able to achieve consistent segmentation results for the same image. The major steps of the adopted adaptive K-means clustering algorithm for image segmentation are summarized in Algorithm 1.
The segmented regions with more than 200 px were further analyzed by image classification to detect the regions with vitrinite.

3.2. RBF SVM for Classification

SVM is one of the most popular classification methods for its attractive properties, including high generalization capability, robustness to noise, and excellent classification performance. It is able to find an optimal hyperplane that separates classes with minimum classification errors in higher dimensional space [29,30]. As shown in Figure 2, the round and triangular tags represent data points belonging to two different classes— x = ( x 1 , x 2 ) represents the feature vector, w T x + b = 0 is the optimal hyperplane, and the data points on the two other hyperplanes (e.g., red line and blue line) are called support vectors. The optimization of SVM is to select a suitable w and b to maximize the margin between the hyperplanes.
Radial basis function (RBF) kernel is the most widely applied kernel in SVM, which is well known for its excellent performance in pattern classification and function approximation [31]. In this study, we obtained the optimum values of the penalty parameter c and the kernel parameter g via grid search. Furthermore, we compared the performance of RBF SVM with that of state-of-the-art classifiers, including K-nearest neighbor (KNN), RF, and deep forest (DF) [32], on vitrinite identification. Furthermore, the detected regions were gridded into squares with 41 × 41 px. In order to enhance the robustness of the proposed model, we removed the squares with more than 20 non-vitrinite pixels. In total, there are 4133 square patches from 78 photomicrographs.
Algorithm 1. Pseudo code of the adaptive K-means clustering for image segmentation.
Algorithm: Image segmentation based on adaptive K-means clustering
Input: The photomicrograph to be clustered.
Output: Separated regions with different maceral components.
Step 1. Convert RGB (i.e., Red, Green and Blue) values of each photomicrograph into a 2-dimensional matrix, denoted as ( A ) n × 3 , where n represents the number of pixels and each row of A contains the RGB values for each pixel, A = [ a 1 , a 2 , , a n ] T .
Step 2. Initialize the cluster centroid as the column-wise mean value of A , denote as c .
Step 3. Repeat the following sub-steps until A is empty or the iteration number arrives at 50:
{
Repeat until the centroid do not change any more or the iteration number arrives at 50:
{
Compute the distance between each pixel and the centroid, and save the distances in vector d :
d i = | a i c | , i = 1 , 2 , , n
Compute the bandwidth of the cluster:
b = 0.25 × max ( d )
Determine which pixels belong to this cluster, save the flag in vector p :
p i = { 1         i f   d i < b 0         o t h e r w i s e
Update the centroid as:
c = i = 1 n 1 { p i = 1 } a i i = 1 n 1 { p i = 1 }
}
Remove the pixels belonging to this cluster from A and save the obtained centroid in matrix U .
}
Step 4. Obtain k cluster centroids, denoted as ( U ) k × 3 . Transform cluster centroids according to the following formula, and get ( ξ ) k × 1 :
ξ k = j = 1 3 U k j 2
Step 5. Sort the matrix ξ and calculate the distance between two adjacent transformed centroids, discard the centroids less than a given threshold.
Step 6. Unmap the remaining transformed centroids in ξ , and get the final cluster centroids. Assign each pixel to the nearest centroids.
Step 7. Create a binary mask corresponding to each cluster and obtain independent regions.

3.3. Random Forest for Regression

Random forest is a commonly used ensemble machine learning method that gained popularity for its advantages of robustness, easy parameterization and high accuracy. RF has been shown to be effective and powerful in classification and regression problems [33]. As shown in Figure 3, it consists of multiple uncorrelated regression trees, which are constructed from different bootstrap samples from the training dataset. Each tree generates a regression result and the final output is the mean value of regression prediction results from individual trees [34].
In the study, 15-dimensional grayscale features were combined as the input variables of random forest. Seven commonly used regression learners were tested, including regression tree, Gaussian process regression, linear regression, SVM regression, artificial neural network (ANN) regression, restricted Boltzmann machine (RBM) regression, and RF regression.

3.4. Feature Extraction

Considering the complexity of coal’s optical characteristics, it is difficult to distinguish vitrinite from other macerals using a single type of feature. Therefore, in this study, given a photomicrograph of coal macerals, 112 discriminative features, including texture, grayscale, and geometric features, were extracted for vitrinite identification [15,35].
The mean grayscale value and the statistical features describing the distribution of the gray level were extracted to represent the grayscale features, including mean grayscale value, maximum grayscale value, median grayscale value, mode of grayscale values, the standard deviation of grayscale value, average contrast, smoothing degree, consistency degree, third-order moment, entropy, and grayscale probability [35]. In order to enhance the efficiency, we merged every four adjacent gray levels in computing the grayscale probability and, in total, 74 grayscale features were extracted.
Considering that the resolutions of photomicrographs may be different, and the maceral component may have different sizes, we adopted gray-level invariant haralick texture features to descript the texture information. The 21 gray-level invariant haralick texture features consist of autocorrelation, cluster prominence, cluster shade, and 18 other features. Detailed information about these features can be found in the work of [36].
The geometric features were used to describe the size, shape, and morphology of macerals. We selected 17 geometric features, including the area, perimeter, arc degree, rectangle degree, length of long axis, length of short axis, aspect ratio, eccentricity, solidity, extent, and Hu’s seven invariant moments [37].
Figure 4 shows the grayscale distribution of vitrinite regions with different vitrinite reflectance. With the increase of MMVR, the grayscale values of the corresponding vitrinite region increase. In order to describe the grayscale distribution and estimate MMVR accurately, we extracted 15 grayscale features from candidate vitrinite squares, rather than grayscale values of specific pixels, for the close relationship between MMVR and grayscale distributions. We list all 15 grayscale features in Table 1.

3.5. Evalutation Criteria

We evaluated the performance of vitrinite identification via four performance indices, including accuracy, precision, recall, and F1-score. Accuracy is the most intuitive and commonly used evaluation metric for classification problems, whereas it is not sufficient for handling imbalanced data [38]. To tackle this problem, we introduced another three evaluation metrics that are more suitable for imbalanced problems. All of these evaluation criteria can easily be calculated from the confusion matrix, which provides the detailed information of the number of instances between the actual and predicted label (shown in Table 2). The equations of these performance indices are described as Equations (1)–(4).
A c c u r a c y = ( T P + T N ) / ( T P + T N + F N + F P )
R e c a l l = T P / ( T P + F N )
P r e c i s i o n = T P / ( T P + F P )
F 1 - s c o r e = 2 × P r e c i s i o n × R e c a l l / ( P r e c i s i o n + R e c a l l )
To fairly compare the regression performance, four evaluation metrics were employed, including Mean Squared Error (MSE), Root Mean Square Error (RMSE), Mean Absolute Error (MAE), and R-squared [39]. MSE is defined as follows:
M S E = 1 n i = 1 n ( y i y i ) 2 ,
where y i represents the true value, y i is the predicted value, and n is the number of samples.
RMSE is the square root of MSE, which indicates the concentration level of data around the best-fitting line. It is defined as follows:
R M S E = 1 n i = 1 n ( y i y i ) 2 .
MAE is calculated as the average of absolute differences between the predicted values and true values. It is defined as follows:
M A E = 1 n i = 1 n | y i y i | .
R-squared (i.e., the coefficient of determination) is a statistical measure indicating how close the regression predictions are to the real values. The higher R-squared value represents the better regression performance. R-squared is defined as follows:
R s q u a r e d = 1 i = 1 n ( y i y i ) 2 i = 1 n ( y ¯ y i ) 2 ,
where y ¯ represents the average value of total true values.

4. Experimental Results and Discussion

4.1. Image Segmenation Results

Adaptive K-means clustering segmented images based on the grayscale distribution characteristics of each image. As can be seen from Figure 5, the leftmost photomicrograph in the first row only contains the vitrinite component, and the algorithm clustered all the pixels into one cluster. Similarly, the pixels of the rightmost photomicrograph were clustered into four clusters when the photomicrograph contained four components (binder, vitrinite, liptinite, and inertinite). We employed a label matrix as a mask to create a binary image from the cluster results, and the image was multiplied with the label matrix corresponding to each cluster. Finally, the pixels belonging to a given cluster can be separated from these pixels belonging to other clusters for further analysis.

4.2. Vitrinite Identification Results

Each photomicrograph was segmented into a sequence of discrete regions (i.e., macerals groups). Then, we extracted texture, grayscale, and geometric features from each region, and created a 112-dimensional feature vector for each region. We compared the identification performance of RBF-SVM with the other three popular classification methods via a 10-fold cross validation. Table 3 summarizes the classification results on the 898 regions (175 vitrinite regions, 723 non-vitrinite regions) obtained by image segmentation. The RBF-SVM yields the highest accuracy of 97.10%, precision of 94.08%, recall of 90.86%, and F1-score of 92.44%, outperforming the other classifiers. To the best of our knowledge, it should be regarded as the state-of-the-art performance in classifying vitrinite from complete photomicrographs. The identification results are solely based on the features from the sample images, rather than the prior knowledge. It also suggests the high potential of the maceral analysis based on machine learning along with selected petrographic features of coal.

4.3. Vitrinite Reflectance Regression Results

Inspired by the traditional way to measure MMVR, we selected the largest vitrinite region of each photomicrograph for further analysis, and split that region into squares with a fixed size (e.g., 41 × 41 px). Seven regression models were constructed to predict the MMVR of each coal sample, including regression tree, Gaussian process regression, linear regression, SVM regression, ANN regression, RBM regression, and random forest regression. The prediction performance was evaluated through five-fold cross-validation in square-wise and coal sample-wise, respectively. As shown in Table 4, random forest regression achieved the best performance in both square-wise and coal sample-wise regression with an R-squared of 0.9125 and 0.9839, respectively. The difference between the performance of square-wise and coal sample-wise regression also suggests that it is more robust to estimate MMVR from various parts of the vitrinite.
Unlike the other machine learning methods, RF has an inherent procedure of providing measures of feature importance. The relative importance of features, which reflects the corresponding contribution to regression, is estimated based on the change of the regression performance if a given feature was permuted randomly. In order to better understand which features are more correlated with vitrinite reflectance, we plotted histograms of features’ importance. As can be seen from Figure 6, in accordance with the traditional manual way to measure the MMVR, the maximum grayscale value of a region is the most important impact factor. In addition, the minimum grayscale value is another important feature that has a strong influence on the MMVR estimation.
It was demonstrated that the generalization error of random forest always converges with the increase of the number of trees in the forest. However, with the increase of forest size, the computational time for constructing the forest will be improved. In this study, we evaluated the out of bag (OOB) mean square error with the increase of the number of trees from 1 to 300. As shown in Figure 7, in general, the estimation performance improves with the increase of forest size, especially when the number of trees is smaller than 100. However, the improvement decreases as the number of trees in the forest increases from 100. Considering the tradeoff between the regression performance of the developed model and the computational efficiency, in this study, we set the number of regression trees to be 200.
To graphically observe the difference between the estimated value and the reference values, we showed the correlation chart corresponding to 13 coal samples in Figure 8. The true MMVR ranges from 0.7% to 1.79%. As we have multiple photomicrographs for each coal sample, we report the mean of these estimations as the estimated MMVR. As can be seen from Figure 8, the predicted MMVR is highly correlated with the MMVR measured by the traditional method. This suggests that the proposed machine learning-based MMVR estimation method is an effective alternative to the traditional MMVR measurement method.

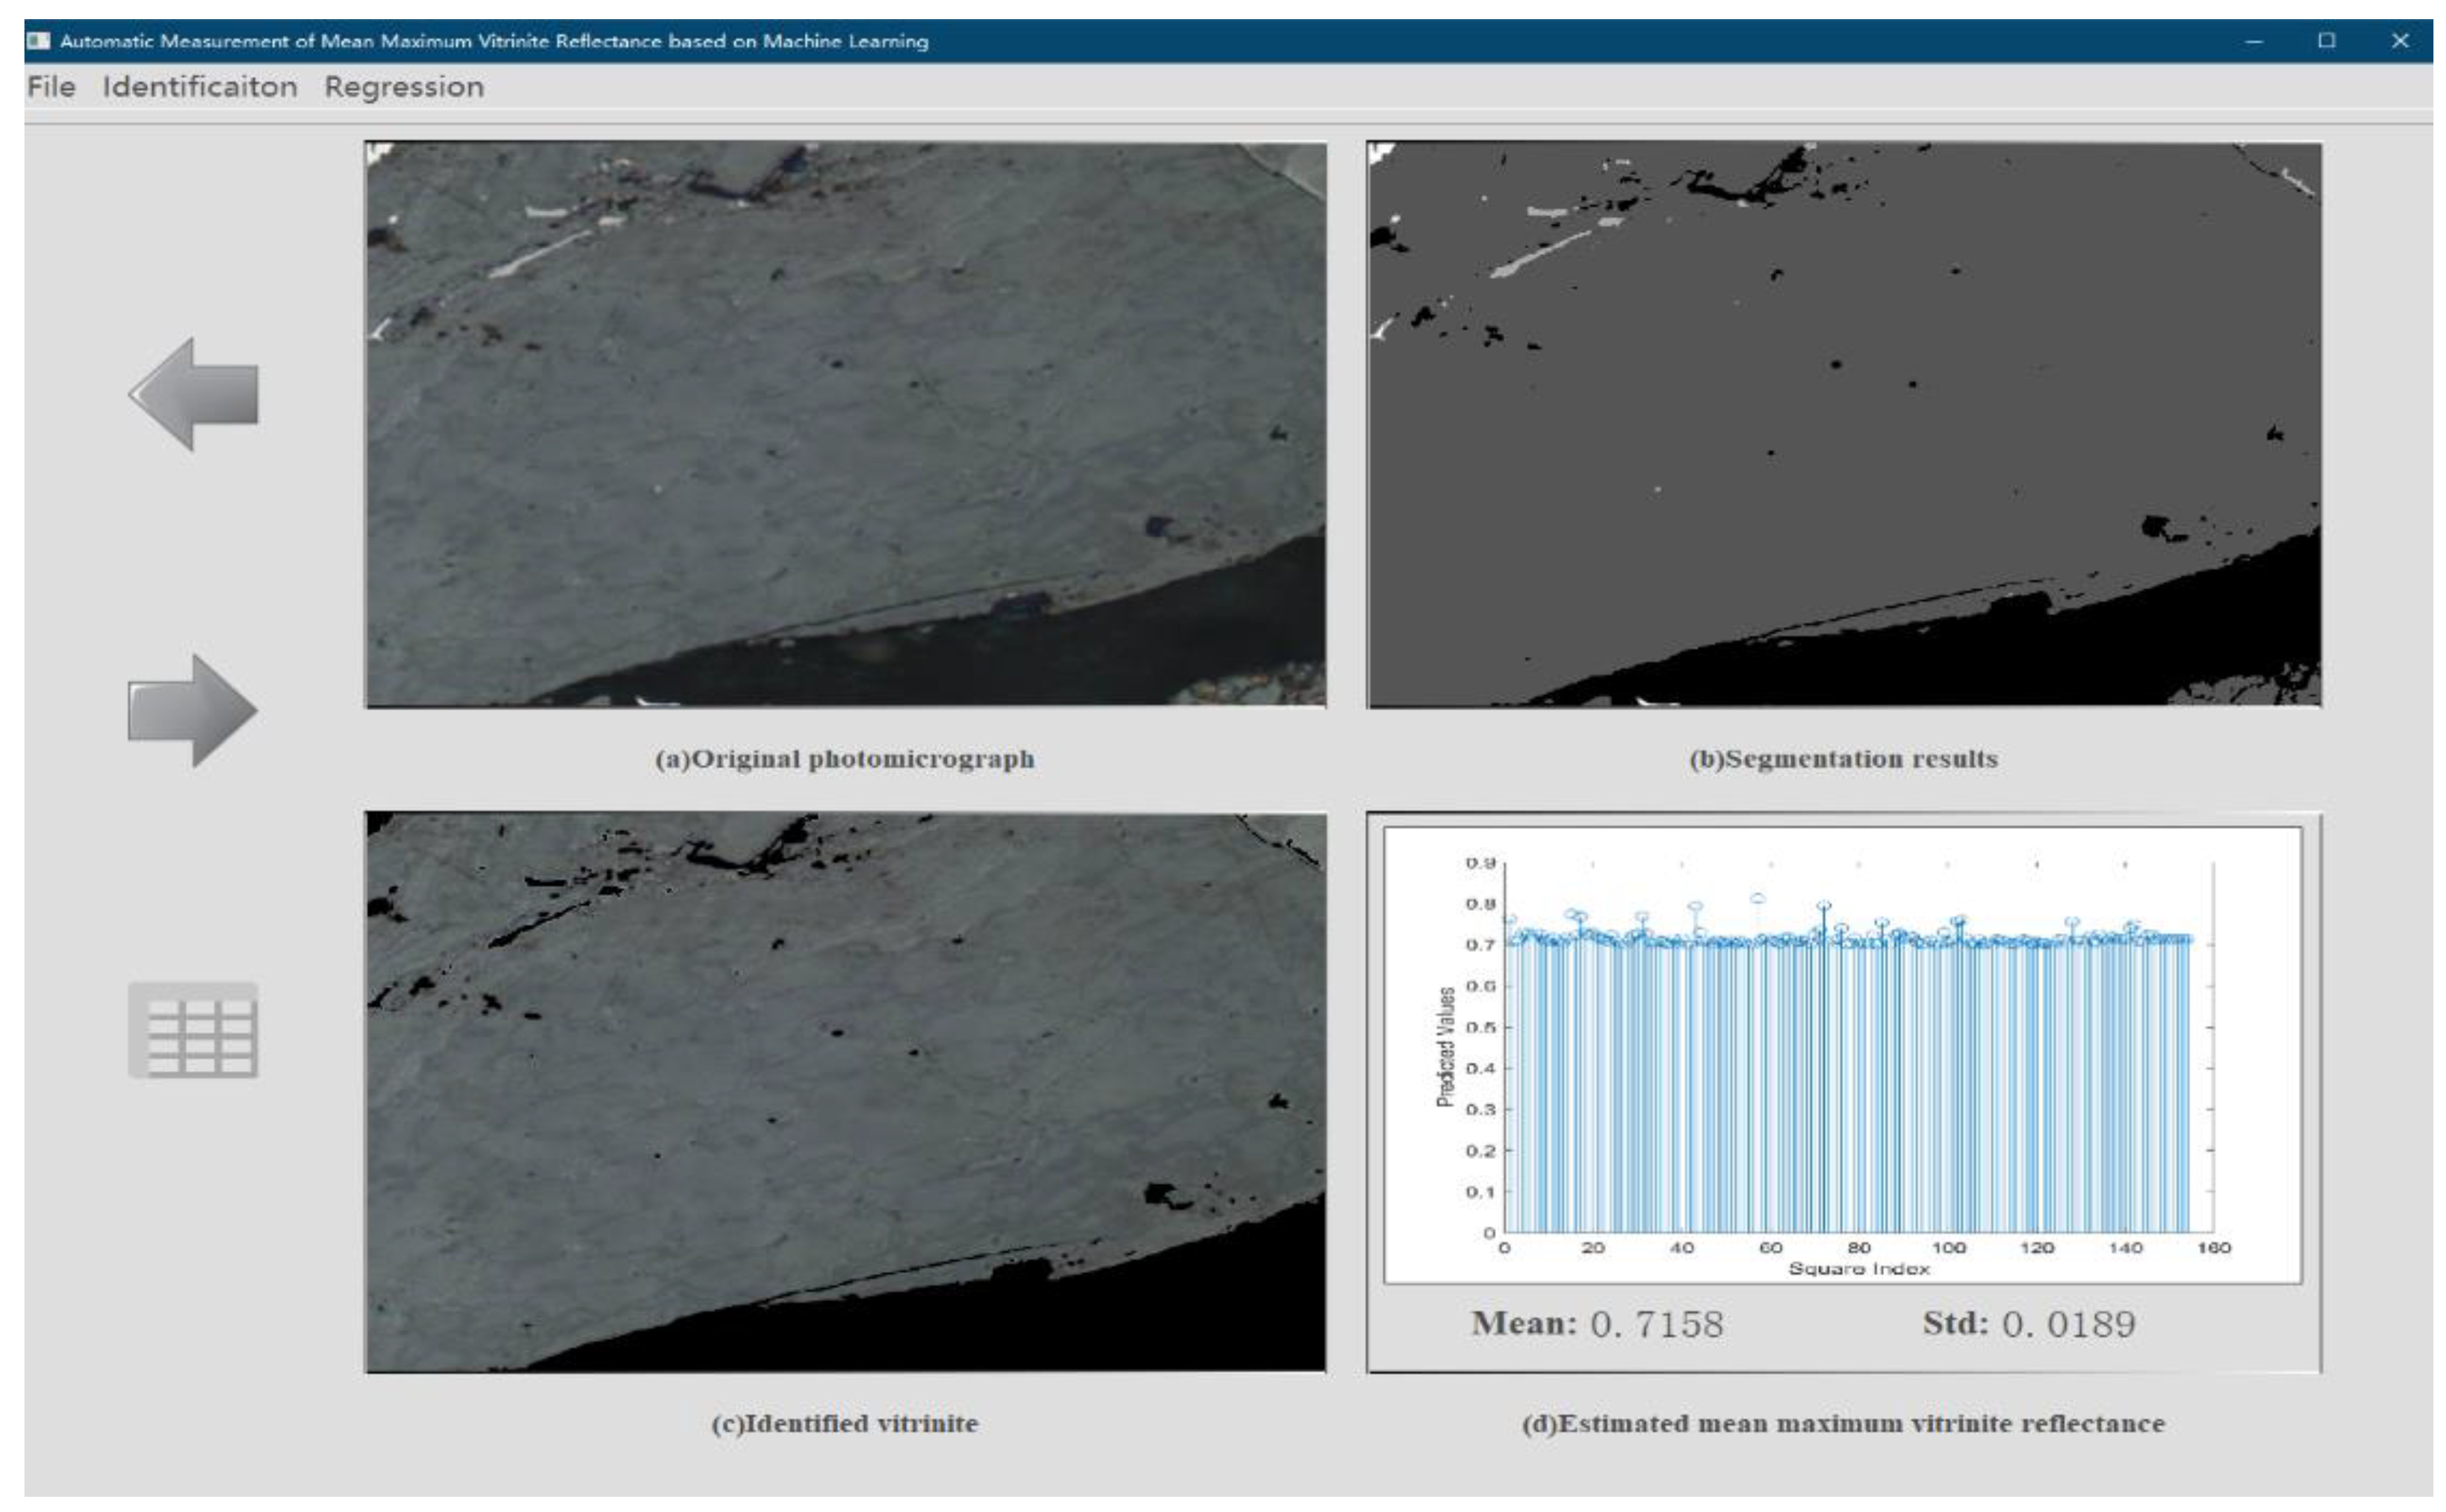
4.4. The Platform of Automatic Vitrinite Reflectance Measurement

The proposed MMVR estimation method, MMVRML, based on adaptive clustering, image classification, and regression, makes it possible to estimate the MMVR automatically and intelligently. In order to facilitate the usage of petrologists without strong expertise in the machine learning domain, we released a standalone software that is freely available at the following website: https://github.com/GuyooGu/MMVRML. This software integrates the adaptive image segmentation, vitrinite identification, and MMVR estimation algorithms mentioned in this paper. Users can submit their own photomicrograph of coal and the software will automatically detect regions with vitrinite in that image and estimate MMVR. The software outputs the segmentation results in subfigure (b), the detected largest vitrinite region as well as the non-vitrinite regions marked in black color in subfigure (c), and the estimated vitrinite reflectance values of the squares in the detected vitrinite as well as the estimated MMVR of this coal sample (d). It should be noted that the acquisition of microscopic images of coal should follow the Standard Test Method for Microscopical Determination of the Vitrinite Reflectance of Coal (ASTM D2798). Figure 9 is the screen snapshot of the MMVRML software. Compared with the traditional measuring method, whose results may be affected by subjective factors, the proposed machine learning based method provides an objective alternative to estimate MMVR. This software can be used to assist coal petrologists to determine the value of the mean maximum vitrinite reflectance. Along with other maturation parameters, such as carbon content and calorific value, the estimated MMVR can be used for determining the degree of coal maturity. In addition, the segmentation results provide the detailed shape information of individual maceral, which can facilitate the training of junior petrologists in recognizing maceral components. To the best of our knowledge, it is the first non-commercial software for estimating MMVR, which is demonstrated to be an efficient and effective tool.

4.5. Discussion

Despite the satisfying performance, there is still substantial room to further improve the robustness and the accuracy of the estimations, especially in many special cases. First, the developed software was based on 78 photomicrographs with MMVR ranging from 0.7% to 1.79%. More training data with a wider range of MMVR are required to ensure the robustness of the developed model in the case that the MMVR to estimate is not in this range. Secondly, the proposed method assumed that the vitrinite region was larger than 200 px. Although this assumption always holds, the proposed method does not work if the vitrinite to analyze is smaller than 200 px. Fortunately, this is rarely the case because vitrinite is the largest component of coal macerals. We plan to improve the current work from three aspects: (1) construct and evaluate the machine learning models based on more samples with a wider range of MMVR; (2) enhance the robustness of the proposed method on samples with small vitrinites; and (3) investigate the reflectance of other macerals, such as the liptinite reflectance and the inertinite reflectance.
The proposed strategy provides a systematic and intelligent way to automatically detect the vitrinite and estimate the mean maximum reflectance of vitrinite in the coal sample. Although there are some limitations, to the best of our knowledge, the proposed method is the first study aiming to estimate MMVR from original photomicrographs, rather than simply mapping the grayscale values of vitrinite to MMVR. In addition, the developed software is the first non-commercial software for estimating MMVR, which is demonstrated to be an efficient and effective tool.

5. Conclusions

Mean maximum reflectance of vitrinite has been widely applied in coal mining and coal-related fields. It is always employed as one indicator of coal rank and reflects coal’s characteristics as feedstock for the processes of coal combustion, carbonization, liquefaction, and gasification [5,6]. Inspired by the way that petrologists measure vitrinite reflectance, an automatic framework to estimate MMVR is presented in this study. The MMVR estimation system includes three major procedures, including image segmentation, vitrinite identification, and MMVR regression. We employed adaptive K-means clustering to automatically search the optimal number of clusters (i.e., maceral groups) in each photomicrograph; therefore, the users do not need to specify the number of maceral groups in each photomicrograph. Furthermore, inspired by the way that petrologists examine photomicrographs and considering the complicated nature of coal, we investigated four popular classification methods to identify the regions with vitrinite. On the basis of RBF-SVM along with 112 discriminative features, the proposed strategy is able to classify vitrinite properly in over 97.10% cases. For the purpose of enhancing the robustness and reliability of the proposed method, the largest vitrinite within each photomicrograph was selected for estimating MMVR. We split the selected vitrinite region into grid squares with the size of 41 × 41 px. A total of 15 simplified grayscale features were employed to estimate MMVR values based on seven intelligent regression models. The random forest provides the most optimal results, with an R-squared of 0.9839. Our results suggest that machine learning-based maceral analysis will be a promising direction in geology.

Author Contributions

Conceptualization, H.W., Y.C., and L.Z.; Funding acquisition, M.L. (Ming Li) and L.Z.; Investigation, M.L. (Meng Lei); Methodology, H.W. and M.L. (Meng Lei); Software, J.J.; Supervision, M.L. (Ming Li) and L.Z.; Visualization, J.J.; Writing—original draft, H.W. and L.Z.; Writing—review & editing, Y.C.

Funding

This research was funded by the National Natural Science Foundation of China (61901003 and 51904297) and the Natural Science Foundation of Jiangsu Province (BK20190623).

Conflicts of Interest

The authors declare no conflict of interest.

References

  1. Chen, Y.; Qin, Y.; Li, Z.; Shi, Q.; Wei, C.; Wu, C.; Cao, C.; Qu, Z. Differences in desorption rate and composition of desorbed gases between undeformed and mylonitic coals in the Zhina Coalfield, Southwest China. FUEL 2019, 239, 905–916. [Google Scholar] [CrossRef]
  2. Mählmann, R.F.; Le Bayon, R. Vitrinite and vitrinite like solid bitumen reflectance in thermal maturity studies: Correlations from diagenesis to incipient metamorphism in different geodynamic settings. Int. J. Coal Geol. 2016, 157, 52–73. [Google Scholar] [CrossRef]
  3. Unsworth, J.F.; Gough, H. Characterization of coals by automated optical image analysis 2. Inertinite reflectance. J. Microsc. 1989, 156, 327–342. [Google Scholar] [CrossRef]
  4. Dembicki, J.H. Chapter 3—Source Rock Evaluation. In Practical Petroleum Geochemistry for Exploration and Production; Dembicki, J.H., Ed.; Elsevier: Amsterdam, The Netherlands, 2017; pp. 61–133. [Google Scholar]
  5. Flores, R.M. Chapter 4—Coalification, Gasification, and Gas Storage. In Coal and Coalbed Gas; Flores, R.M., Ed.; Elsevier: Boston, MA, USA, 2014; pp. 167–233. [Google Scholar]
  6. Ward, C.R.; Suárez-Ruiz, I. Chapter 1—Introduction to Applied Coal Petrology. In Applied Coal Petrology; Suárez-Ruiz, I., Crelling, J.C., Eds.; Elsevier: Burlington, MA, USA, 2008; pp. 1–18. [Google Scholar]
  7. Chen, Y.; Qin, Y.; Wei, C.; Huang, L.; Shi, Q.; Wu, C.; Zhang, X. Porosity changes in progressively pulverized anthracite subsamples: Implications for the study of closed pore distribution in coals. FUEL 2018, 225, 612–622. [Google Scholar] [CrossRef]
  8. Zou, J.; Han, F.; Li, T.; Tian, H.; Li, Y. Mineralogical and Geochemical Compositions of the Lopingian Coals in the Zhongliangshan Coalfield, Southwestern China. Minerals 2018, 8, 104. [Google Scholar] [CrossRef]
  9. Karmakar, B.; Ghosh, T.; Ojha, K.; Pathak, A.K.; Devraju, J. Effects of chemical composition and petrography of coal for coalbed methane evaluation with special reference to in-situ gas content. In Proceedings of the 10th Biennial International Conference & Exposition, Kochi, India, 23–25 November 2013. [Google Scholar]
  10. International Organization for Standardization. Methods for the Petrographic Analysis of coals—Part 5: Method of Determining Microscopically the Reflectance of Vitrinite. In ISO 7404-5; ISO: Geneva, Switzerland, 2009. [Google Scholar]
  11. ASTM International. Standard Test Method for Microscopical Determination of the Vitrinite Reflectance of Coal. In ASTM D2798-11a; ASTM International: West Conshohocken, PA, USA, 2011. [Google Scholar]
  12. Fedor, F.; Hamor-Vido, M. Statistical analysis of vitrinite reflectance data—A new approach. Int. J. Coal Geol. 2003, 56, 277–294. [Google Scholar] [CrossRef]
  13. Van Niekerk, D.; Mitchell, G.D.; Mathews, J.P. Petrographic and reflectance analysis of solvent-swelled and solvent-extracted South African vitrinite-rich and inertinite-rich coals. Int. J. Coal Geol. 2010, 81, 45–52. [Google Scholar] [CrossRef]
  14. Młynarczuk, M.; Górszczyk, A.; Ślipek, B. The application of pattern recognition in the automatic classification of microscopic rock images. Comput. Geosci. 2013, 60, 126–133. [Google Scholar] [CrossRef]
  15. Wang, H.; Lei, M.; Chen, Y.; Li, M.; Zou, L. Intelligent Identification of Maceral Components of Coal Based on Image Segmentation and Classification. Appl. Sci. 2019, 9, 3245. [Google Scholar] [CrossRef]
  16. Pearson Petrography. Available online: http://www.coalpetrography.com/blog1/ (accessed on 1 August 2019).
  17. Coal Grain Analysis. Available online: https://www.csiro.au/en/Do-business/Commercialisation/-Marketplace/Coal-Grain-Analysis (accessed on 1 August 2019).
  18. England, B.M.; Mikka, R.A.; Bagnall, E.J. Petrographic characterization of coal using automatic image analysis. J. Microsc. 1979, 116, 329–336. [Google Scholar] [CrossRef]
  19. Fernandes, P.; Luis, J.; Rodrigues, S.; Marques, M.; Valentim, B.; Flores, D. The Measurement of Vitrinite Reflectance with MatLab; CIMP-Commission Internationale de Microflore du Paléozoique: Warsaw, Poland, 2010; pp. 11–13. [Google Scholar]
  20. Chen, H.; Bai, X.; Li, Z.; Zhang, Y. Working curve establishing and application of determining maceral reflectance by image analysis method. J. China Coal Soc. 2014, 39, 562–567. [Google Scholar]
  21. CRAIC: How to Measure Vitrinite Reflectance. Available online: http://www.microspectra.com/-support/learn/how-to-analyze-coal?tdsourcetag=s_pcqq_aiomsg (accessed on 1 August 2019).
  22. Lim Laboratory Imaging. Available online: http://www.limaging.cz/en/front-page/vitrinite (accessed on 1 August 2019).
  23. Mlynarczuk, M.; Skiba, M. The application of artificial intelligence for the identification of the maceral groups and mineral components of coal. Comput. Geosci. 2017, 103, 133–141. [Google Scholar] [CrossRef]
  24. Gesserman, R.M. Petrographic web atlas for metallurgical bituminous coal macerals. In Proceedings of the 2009 Portland GSA Annual Meeting, Portland, OR, USA, 18–21 October 2009. [Google Scholar]
  25. ASTM International. Standard practice for preparing coal samples for microscopical analysis by reflected light. In D2797/D2797M-11a; ASTM International: West Conshohocken, PA, USA, 2011. [Google Scholar]
  26. Zhao, L.; Chen, Z.; Yang, Y.; Zou, L.; Wang, Z.J. ICFS clustering with multiple representatives for large data. IEEE T NEUR NET LEAR 2018, 30, 728–738. [Google Scholar] [CrossRef] [PubMed]
  27. Zhang, S.; Wang, H.; Huang, W.; You, Z. Plant diseased leaf segmentation and recognition by fusion of superpixel, K-means and PHOG. Optik 2018, 157, 866–872. [Google Scholar] [CrossRef]
  28. Bhuiyan, M.; Esmaieli, K.; Ordóñez-Calderón, J.C. Application of Data Analytics Techniques to Establish Geometallurgical Relationships to Bond Work Index at the Paracutu Mine, Minas Gerais, Brazil. Minerals 2019, 9, 302. [Google Scholar] [CrossRef]
  29. Zheng, B.; Myint, S.W.; Thenkabail, P.S.; Aggarwal, R.M. A support vector machine to identify irrigated crop types using time-series Landsat NDVI data. Int. J. Appl. Earth OBS 2015, 34, 103–112. [Google Scholar] [CrossRef]
  30. Zou, L.; Wang, M.; Shen, Y.; Liao, J.; Li, A.; Wang, M. PKIS: Computational identification of protein kinases for experimentally discovered protein phosphorylation sites. BMC Bioinform. 2013, 14, 247. [Google Scholar] [CrossRef]
  31. Ring, M.; Eskofier, B.M. An approximation of the Gaussian RBF kernel for efficient classification with SVMs. Pattern Recognit. Lett. 2016, 84, 107–113. [Google Scholar] [CrossRef]
  32. Zhou, Z.H.; Feng, J. Deep Forest: Towards An alternative to deep neural networks. In Proceedings of the Twenty-Sixth International Joint Conference on Artificial Intelligence (IJCAI-17), Melbourne, Australia, 19–25 August 2017. [Google Scholar]
  33. Zou, L.; Huang, Q.; Li, A.; Wang, M. A genome-wide association study of Alzheimer’s disease using random forests and enrichment analysis. Sci. China Life Sci. 2012, 55, 618–625. [Google Scholar] [CrossRef]
  34. Adusumilli, S.; Bhatt, D.; Wang, H.; Bhattacharya, P.; Devabhaktuni, V. A low-cost INS/GPS integration methodology based on random forest regression. Expert Syst. Appl. 2013, 40, 4653–4659. [Google Scholar] [CrossRef]
  35. Li, N.; Hao, H.; Gu, Q.; Wang, D.; Hu, X. A transfer learning method for automatic identification of sandstone microscopic images. Comput. Geosci. 2017, 103, 111–121. [Google Scholar] [CrossRef]
  36. Löfstedt, T.; Brynolfsson, P.; Asklund, T.; Nyholm, T.; Garpebring, A. Gray-level invariant Haralick texture features. PLoS ONE 2019, 14, e212110. [Google Scholar] [CrossRef] [PubMed]
  37. Zhang, Y.; Yang, J.; Wang, S.; Dong, Z.; Phillips, P. Pathological brain detection in MRI scanning via Hu moment invariants and machine learning. J. Exp. Theor. Artif. Intell. 2017, 29, 299–312. [Google Scholar] [CrossRef]
  38. Tran, D.; Mac, H.; Tong, V.; Tran, H.A.; Nguyen, L.G. A LSTM based framework for handling multiclass imbalance in DGA botnet detection. Neurocomputing 2018, 275, 2401–2413. [Google Scholar] [CrossRef]
  39. Parmar, K.S.; Bhardwaj, R. Water quality management using statistical analysis and time-series prediction model. Appl. Water Sci. 2014, 4, 425–434. [Google Scholar] [CrossRef] [Green Version]
Figure 1. The flowchart of the proposed mean maximum vitrinite reflectance measurement based on machine learning (MMVRML).
Energies 12 03855 g001
Figure 2. A demonstration of the support vector machine (SVM) for classification.
Energies 12 03855 g002
Figure 3. The flowchart of random forest for regression. OOB, out of bag.
Energies 12 03855 g003
Figure 4. Vitrinite images with different MMVR and the corresponding grayscale probability density distribution (from left to right, the MMVR is 0.7%, 0.88%, 1.16%, and 1.79%, respectively. The second row shows the grayscale probability density distribution of the corresponding images). (a) Vitrinite images; (b) Grayscale probability density distribution.
Energies 12 03855 g004
Figure 5. The results of adaptive K-means clustering (the first row consists of four original photomicrographs and the second row consists of the segmentation results of the corresponding photomicrographs in the first row. From left to right, the number of clusters is 1, 2, 3, and 4, respectively). (a) Original photomicrographs; (b) Segmentation results of each corresponding photomicrograph in the first row.
Energies 12 03855 g005
Figure 6. Random forest feature importance chart.
Energies 12 03855 g006
Figure 7. The out of bag mean square error with different numbers of trees in random forest.
Energies 12 03855 g007
Figure 8. Correlation chart of mean maximum vitrinite reflectance values measured by MMVRML and the traditional method.
Energies 12 03855 g008
Figure 9. The user interface of MMVRML for automatic MMVR measurement.
Energies 12 03855 g009
Table 1. Grayscale feature space utilized in regression procedure.
Grayscale Features and Corresponding Index
x1–x10: the top 10 grayscale value sorting in quantity
x11: mean grayscale value
x12: maximum grayscale value
x13: minimum grayscale value
x14: median grayscale value
x15: mode grayscale value
Table 2. The confusion matrix.
Confusion MatrixPredicted Label
TrueFalse
True LabelTrueTrue Positive (TP)False Negative (FN)
FalseFalse Positive (FP)True Negative (TN)
Table 3. Quantitative assessment of vitrinite identification methods *.
AccuracyPrecisionRecallF1-Score
KNN95.88%93.14%85.14%88.96%
Deep Forest96.10%91.67%88.00%89.79%
Random Forest95.59%92.17%87.43%89.73%
RBF SVM97.10%94.08%90.86%92.44%
* The optimal parameters of each method are set as follows: the number of nearest neighbors K = 1 in K-nearest neighbor (KNN); n_estimators = 10, max_depth = 5 in deep forest; the number of trees = 500, m_try = the square root of the number of features in random forest; cost c = 1 and gamma = 0.0078 in radial basis function support vector machine (RBF-SVM).
Table 4. Quantitative assessment of different MMVR regression models *. MSE, mean squared error; RMSE, root mean square error; MAE, mean absolute error; ANN, artificial neural network; RBM, restricted Boltzmann machine; SVM, support vector machine.
MethodsMSERMSEMAER-Squared
Square-wiseRegression Tree0.01710.13080.09320.8661
Gaussian Process Regression0.01210.11000.08280.9030
Linear Regression0.01400.11820.09260.8898
SVM Regression0.01390.11790.09440.8857
ANN Regression0.0183 0.13540.10510.8462
RBM Regression0.02550.15960.12130.8398
Random Forest Regression0.01100.10470.07600.9125
Coal Sample-wiseRegression Tree0.00220.04720.03980.9792
Gaussian Process Regression0.00190.04300.03670.9832
Linear Regression0.00210.04630.04120.9797
SVM Regression0.00250.04980.04410.9765
ANN Regression0.00440.06620.05410.9567
RBM Regression0.00370.06110.05260.9709
Random Forest Regression0.00180.04240.03620.9839
* The optimal configuration of each method is set as follows: minimum leaf size = 4 in regression tree; nonparametric Gaussian process regression; multiple linear regression; linear kernel SVM regression; the network structure is 64-32-1 in the ANN regression; the network structure is 10-10-1 in the restricted Boltzmann machines for regression; the number of trees = 200 in random forest regression.

