Article

Experimental Study of Crack Propagation in Cracked Concrete

1
School of Water Resources and Hydropower Engineering, Wuhan University, Wuhan 430072, China
2
Materials & structural Engineering Department, Nanjing Hydraulic Research Institute, Nanjing 210029, China
*
Author to whom correspondence should be addressed.
Energies 2019, 12(20), 3854; https://doi.org/10.3390/en12203854
Submission received: 18 September 2019 / Revised: 10 October 2019 / Accepted: 10 October 2019 / Published: 12 October 2019

Abstract

:
The intersection of cracks has an important role in the key technology of hydraulic fracturing for enhancing the recovery of tight hydrocarbon reservoirs. On the basis of digital image correlation technology, three-point bending tests of concrete beams with an edge crack and a central preset crack were conducted to investigate the propagation of cracks after intersection in concretes. Concrete beams with cracks of different positions, lengths, and approach angles were tested, and results were analyzed. In conclusion, the crack positions, crack lengths, and approach angles significantly influence the crack propagation in naturally cracked concrete. A large distance between the crack tip and central point at the preset transverse crack and crack length indicate a high possibility of the edge crack vertically crossing the preset crack. In particular, the crack restarts from the preset crack tip after intersection when the distance between two cracks is smaller than 30 mm and when the preset crack length is smaller than 40 mm. A large approach angle corresponds to a large carrying capacity of the beam and a high possibility of the crack propagating perpendicularly. An improved criterion of restart cracking after interaction is proposed, and the restart points of all tested beams are predicted and compared with the experimental results. A good agreement is observed, which proves that this criterion is reliable.

Graphical Abstract

1. Introduction

Hydraulic fracturing is a key technology for enhancing the recovery of tight hydrocarbon reservoirs in petroleum industries [1,2,3]. Numerous natural fractures exist in shale formations, and these pre-existing natural fractures have an important role in the hydraulic fracturing process because they can influence the process and path of hydraulic fracture propagation. Natural fractures affect the propagation of hydraulic fractures, and the passage of internal driving forces of hydraulic fractures can be greatly influenced by multiple natural fractures. Thus, the interaction of cracks in rock-like materials, such as concrete, should be investigated. The propagation criterion of crack interaction can also guide the study of complex fracture propagation.
A series of criterions were proposed to predict single crack propagation in rock-like materials. Hubbert and Willis [4] proposed the classical model to predict the pore and corresponding fracture pressures using well log and drilling data; their results are the basis for fracture propagation research. Xu and Reinhardt [5,6] proposed the classical double-K fracture criterion to predict crack initiation and propagation in concretes. On the basis of the double-K fracture criterion, crack initiation has been predicted by the initiation fracture toughness, and the stability of the crack propagation has been predicted by the unstable fracture toughness. The maximum tensile stress criterion has been widely used to predict the appearance of cracks in rock and concrete structures [7,8,9,10,11,12]. This criterion indicates that cracks will appear when the maximum circumferential stress in the concrete structure exceeds the tensile strength of the material. The fracture toughness criterion has also been widely used to predict the stability of crack propagation in concrete structures [13,14,15]. The fracture toughness criterion indicates that, if the stress intensity factor (SIF) of the crack tip exceeds the fracture toughness, then the crack will develop and expand. The crack propagation will also enter the unstable propagation stage. However, these criteria can only be used to predict single crack propagation, but multiple crack propagation has been proven to be different from single crack propagation by many studies.
Simple and reasonable multiple crack tests should be conducted to obtain and improve the criterion of multiple crack propagation. In the last century, some efforts have been undertaken for this purpose. Gu [16] conducted an experiment of hydraulic fractures crossing natural fractures at non-orthogonal angles. The test results were analyzed to evaluate the criterion of a crack crossing a natural crack at non-orthogonal angles. Fu [17] presented several laboratory experiments to explore the interaction between hydraulic and pre-existing fractures that are strongly cemented relative to the host material strength but over only a portion of the natural fracture. The results showed that no crossing results are obtained when the strongly cemented region is around 30% of the height of the natural crack. Hassan [18] experimentally investigated the interaction of natural and propagated hydraulic fractures. The results showed that weakly bonded natural fracture surfaces increase the chance of shear slippage occurring and arresting the propagation of hydraulic fractures even at an angle of interaction as high as 90°. Wang [19] experimentally explored the interaction between cemented natural and hydraulic fractures. The experimental results showed that the interface cracks apart and attracts a propagating fracture depending on the frictional strength and the approach angle. The above-mentioned investigations are concentrated on the propagation and criteria of the hydraulic fracture crossing the natural fracture and the interaction of fractures. The general crack propagation after interaction is rarely researched through experiments, and the prediction criterion of crack restart propagation has seldom been studied.
Digital image correlation (DIC) technology has a great advantage in directly observing crack initiation and propagation in solid materials. DIC is an optical measurement to detect the surface displacement and deformation fields of test specimens by analyzing the probabilistic statistical correlation of the light intensity of particles randomly distributed on the specimen surface before and after deformation [20]. The DIC technique has been broadly used to experimentally investigate the crack propagation behavior in the fracture process of quasi-brittle materials at the laboratory scale because of its advantages of full-field measurement, non-contact, and 3D mode [21,22,23]. The rapid development in image processing techniques and high-resolution digital cameras over the last decade facilitated the utilization of DIC technology in analyzing specimens with multiple growing cracks. Helm [24] presented a series of modifications to the DIC process that allowed the method to automatically analyze specimens with multiple growing cracks. Li [25] researched multiple fatigue crack propagation of reinforced concrete beams strengthened with CFRP under cyclic bending loads. The results of the aforementioned studies indicated that the DIC technique has great advantage in observing crack propagation in concretes with multiple cracks, measuring fracture processes, and providing insight into concrete cracking.
In this study, the DIC technique was used to investigate the crack propagation path in the cracked concrete three-point bending (TPB) beam by measuring the displacement and strain fields of test beam surface. The geometrical parameters of the preset crack including crack position, crack length, and approach angle were analyzed. Furthermore, the influence of the crack position, crack length, and approach angle of the preset crack on the load force (P) and crack mouth opening displacement (CMOD) relations and the strain contour of test beams was illustrated. Finally, a criterion of the restart point on the crack upper surface was proposed to predict the propagation path after interaction.

2. Materials and Methods
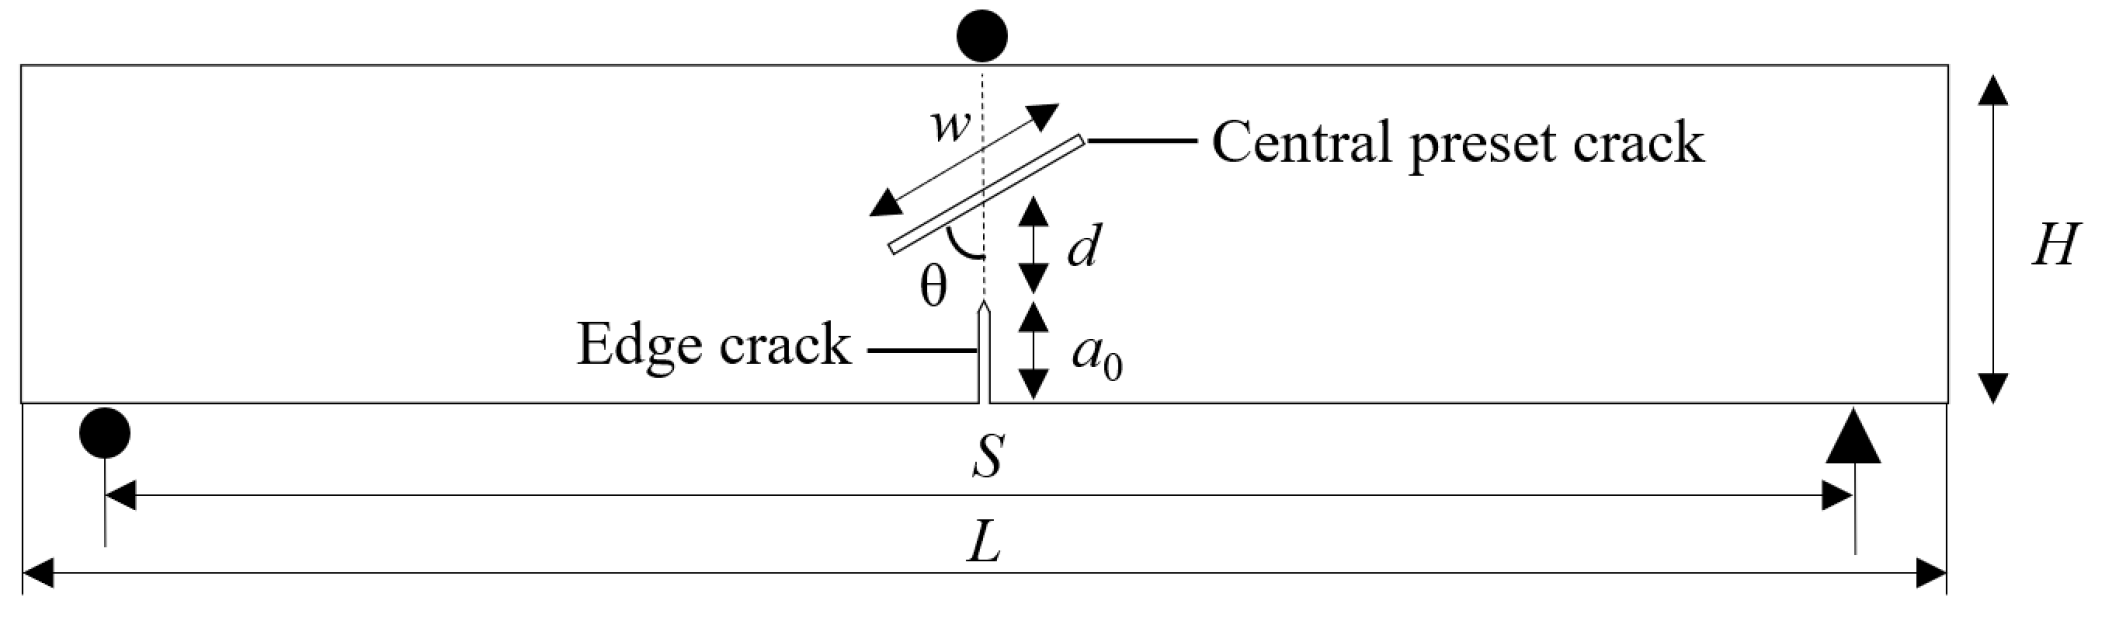
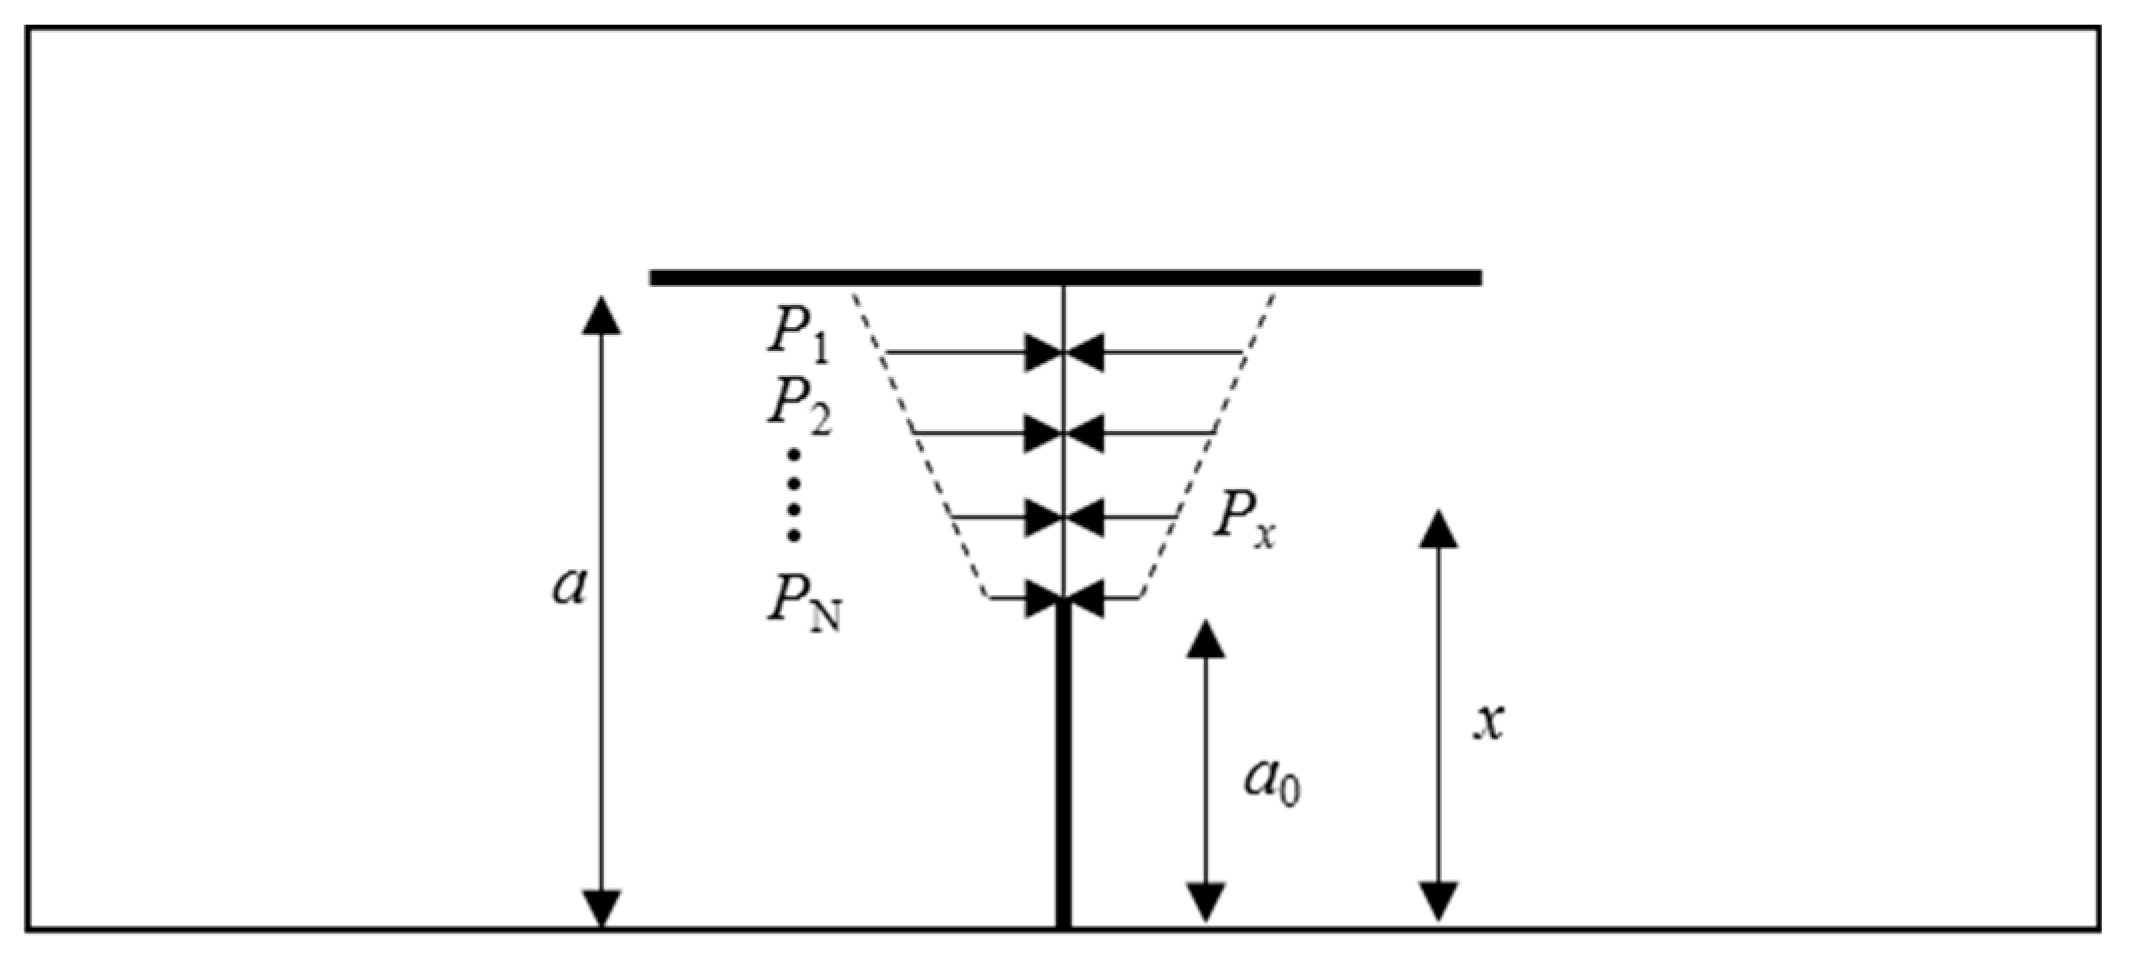
2.1. Test Beams

The naturally cracked concrete beam tested in the experiment is shown in Figure 1. In this figure, d is the distance from the tip of the initial edge crack to the center of the preset crack on the extension line of initial vertical notch, w is the length of the preset crack, θ is the acute angle measured from the initial fracture propagation direction to the preset crack and a0 is the notch depth. For all test specimens, the height H is 150 mm, the length L is 800 mm, the span to height ratio S/H is 4, and the thickness B is 100 mm. All test beams were divided into 12 groups and distinguished by the preset crack position, length, and approach angle. Table 1 lists all test beams and the corresponding parameters of the preset crack. All test beams were named as TPB-“X”, for the beam without preset crack, X is 1, 2, 3, and 4; for the beam with different distances between the edge crack and the preset crack, X is D10, D30, D50, and D70, respectively; for the beam with different lengths of the preset crack, X is W20, W40, W60, and W80, respectively; for the beam with different approach angles, X was A30, A45, A60, and A90, respectively.

2.2. Materials

All tested concrete beams consist of a standard P.O 42.5 Portland cement of a 28-day standard compressive strength higher than 42.5 MPa, crushed limestones with a maximum diameter of 20 mm, and river sand. The composition proportion of the concrete is given in Table 2. Concrete mixtures were casted into a wooden mold under vibration and demolded after 28 days. All interior surfaces of wooden molds were lubricated with a thin layer of oil before casting. The initial cracks were formed by inserting two steel sheets of 2 mm in thickness during pouring. The steel sheets with two V-shaped tips and the steel sheets with one V-shaped tip were utilized to form the preset and edge cracks, respectively. The measured cube compressive strength, tense strength, Young’s modulus, and Poisson’s ratio of concrete are fc = 46.7 MPa, ft =3.5 MPa, E = 33.0 GPa, and μ = 0.2, respectively.
Standard TPB fracture tests of concrete beams were conducted to obtain the fracture toughness KIc and the fracture energy Gf of the concrete. Figure 2 shows the load force—crack mouth opening displacement (P-CMOD) curve measured using a clip gauge. The critical loading force can be obtained at the turning point of the P-CMOD curve. Moreover, the fracture toughness KIc and the fracture energy Gf can be obtained on the basis of the test results. The average fracture toughness KIc and the average fracture energy Gf of the concrete are 0.57 and 110 N/mm, respectively.

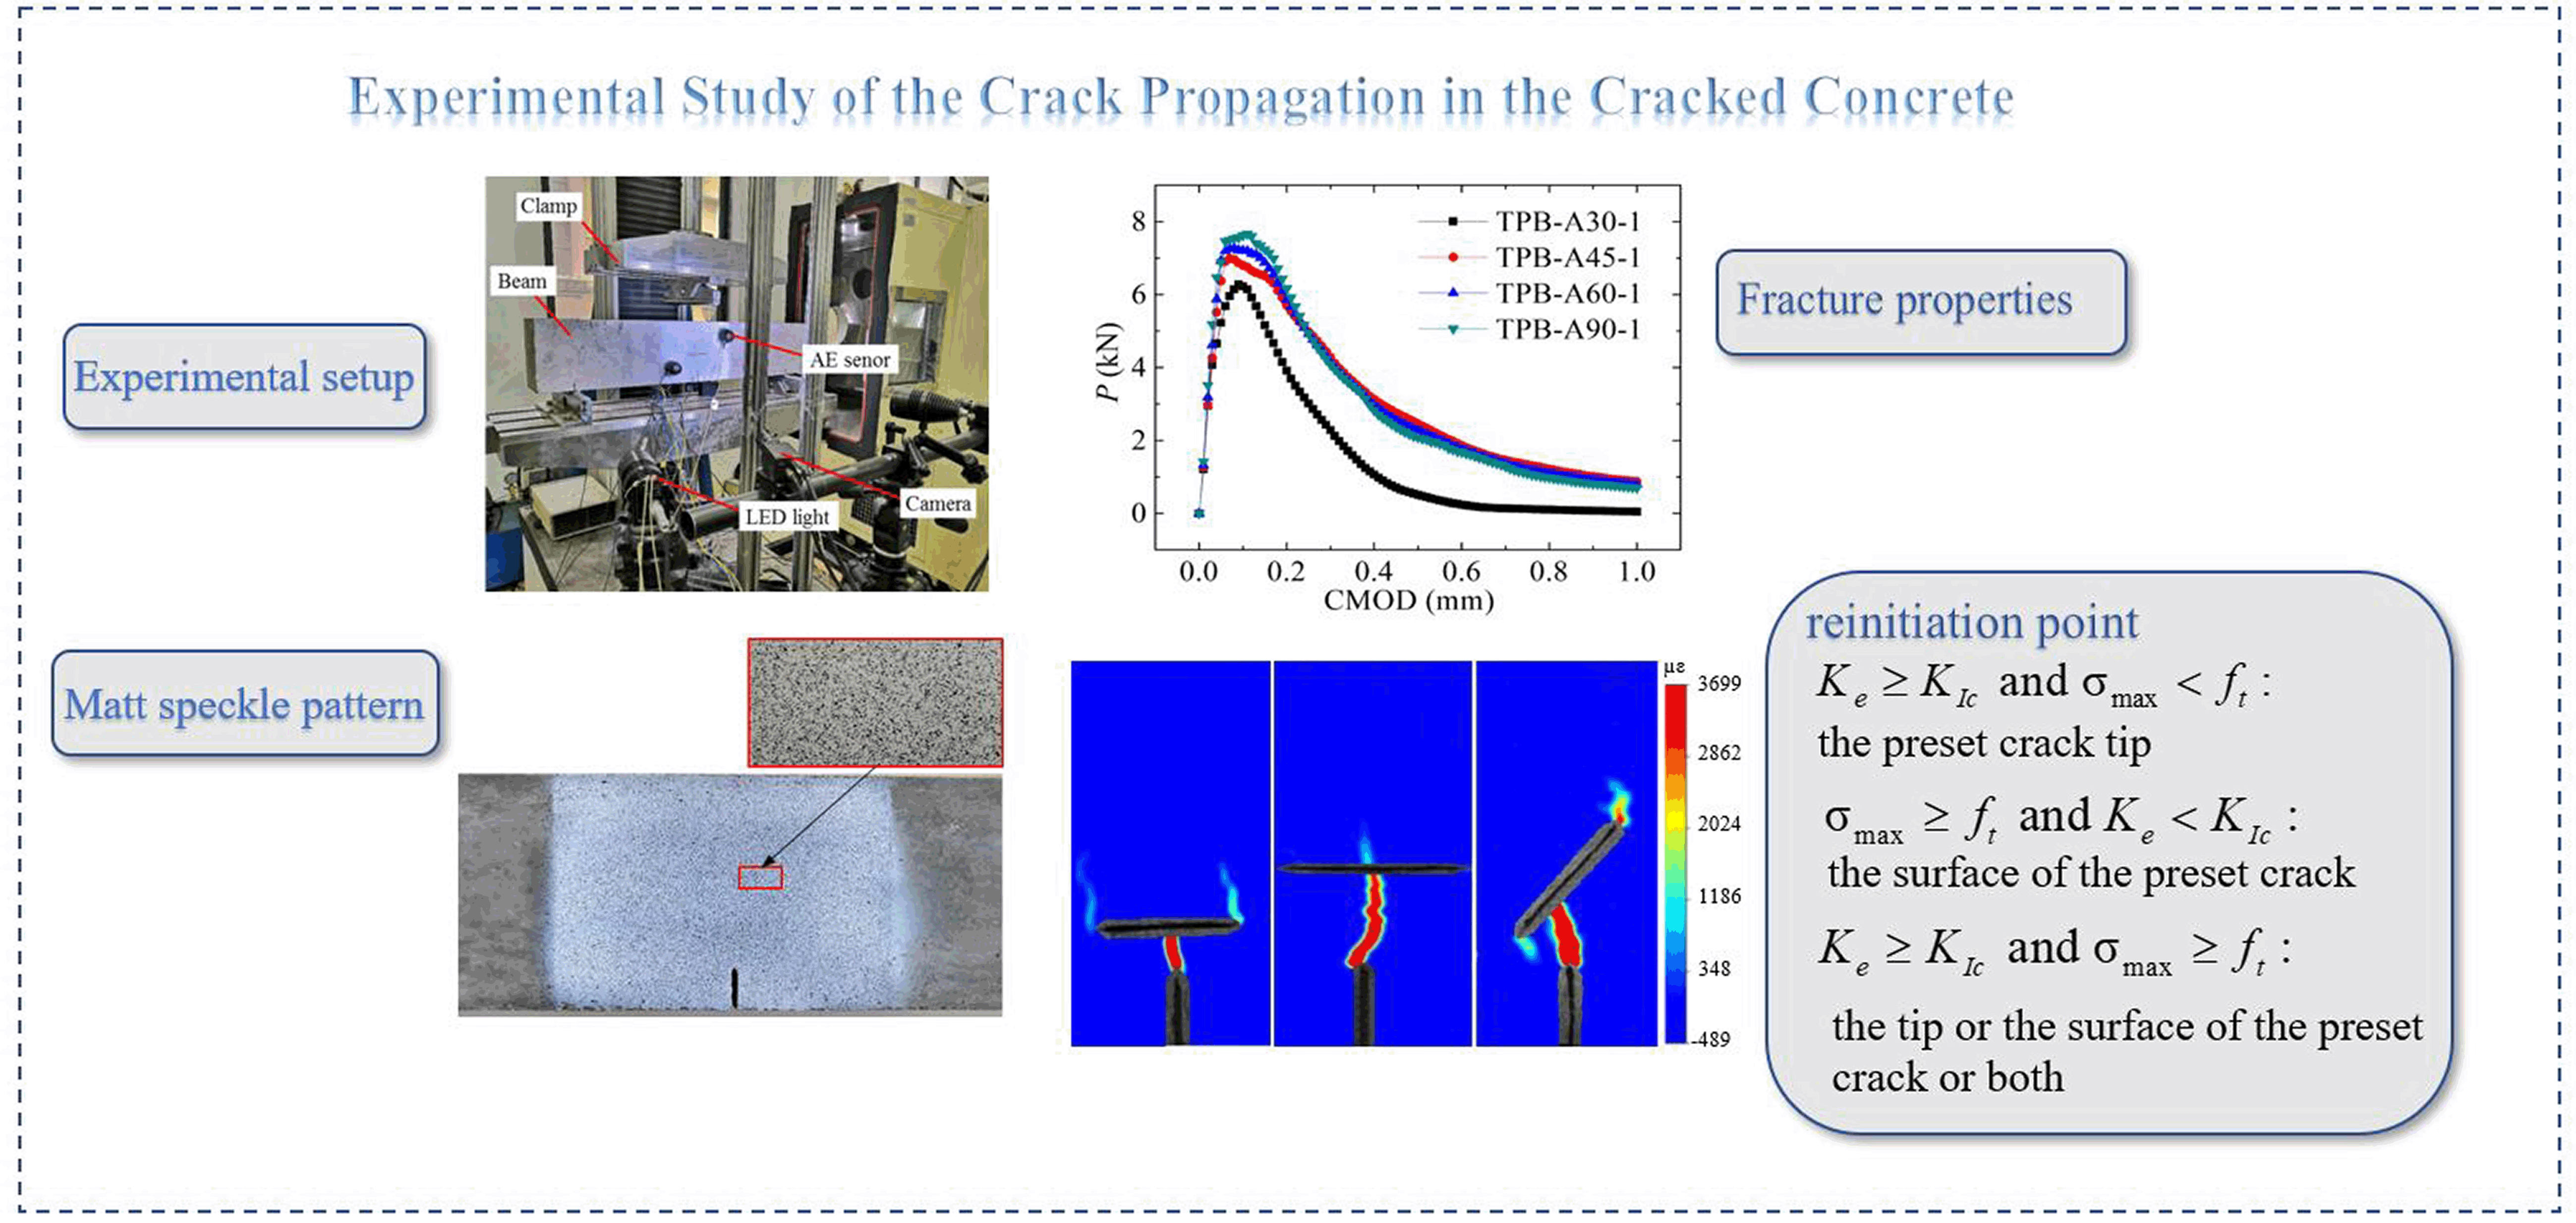
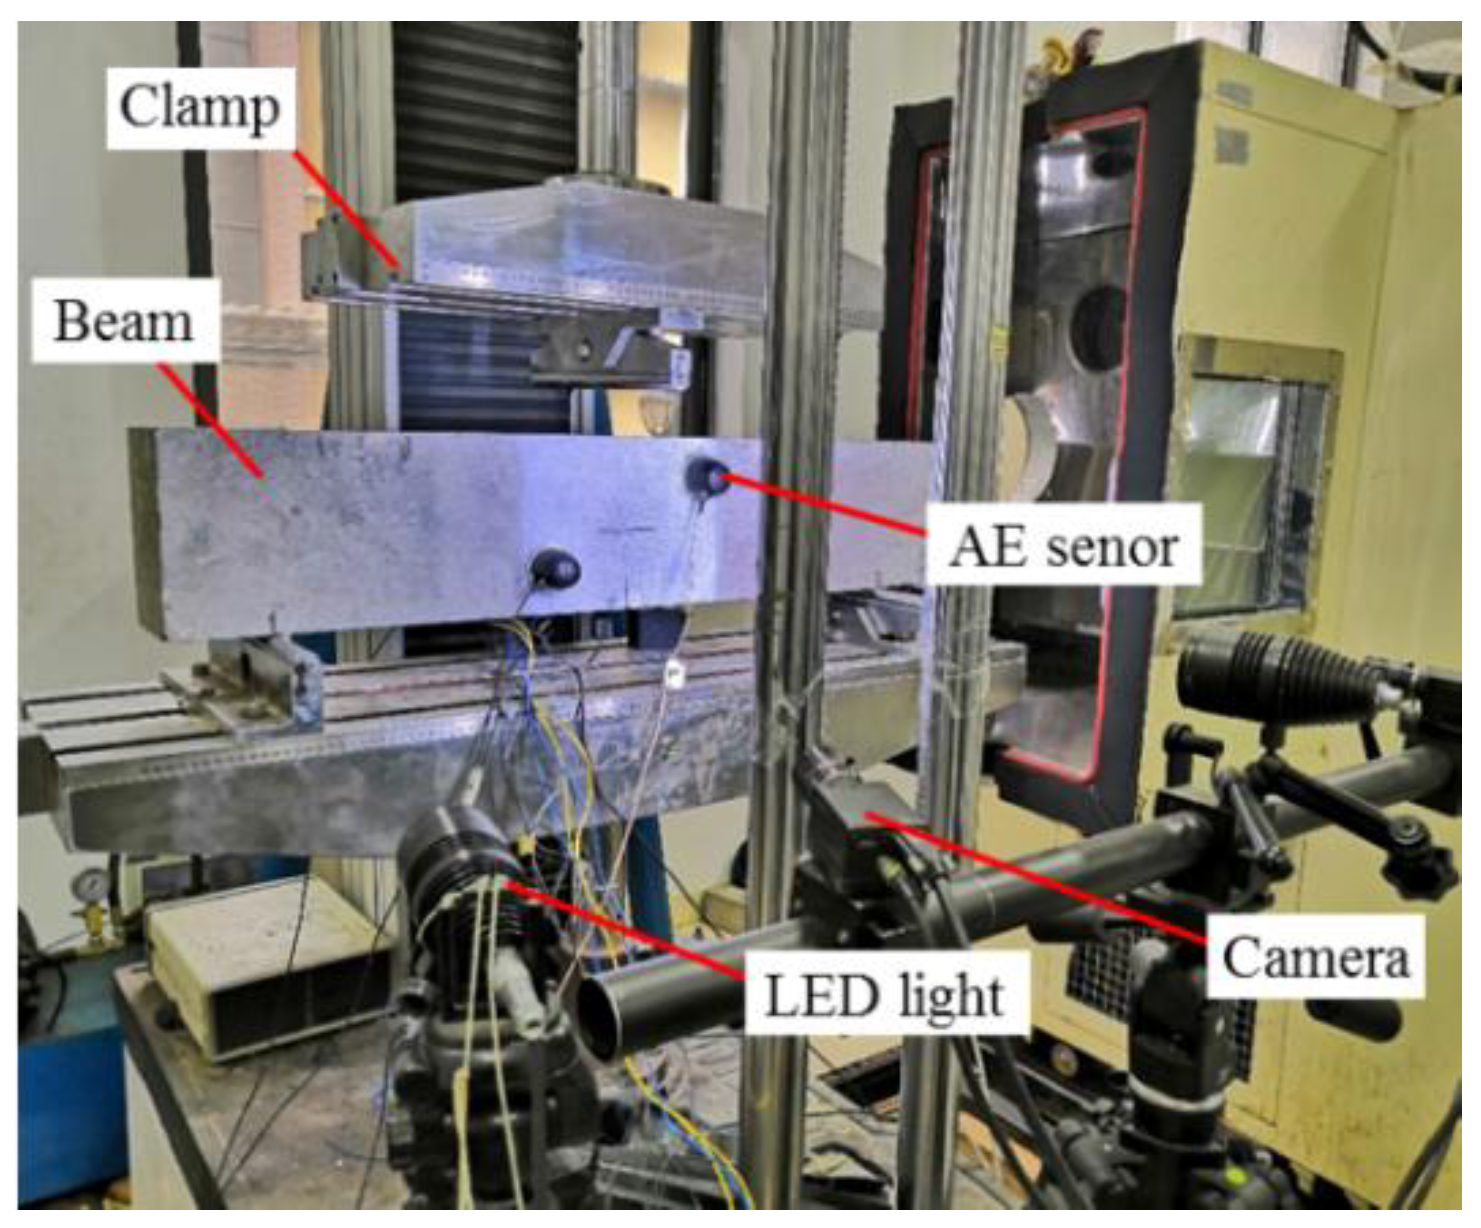
2.3. Experimental Setup
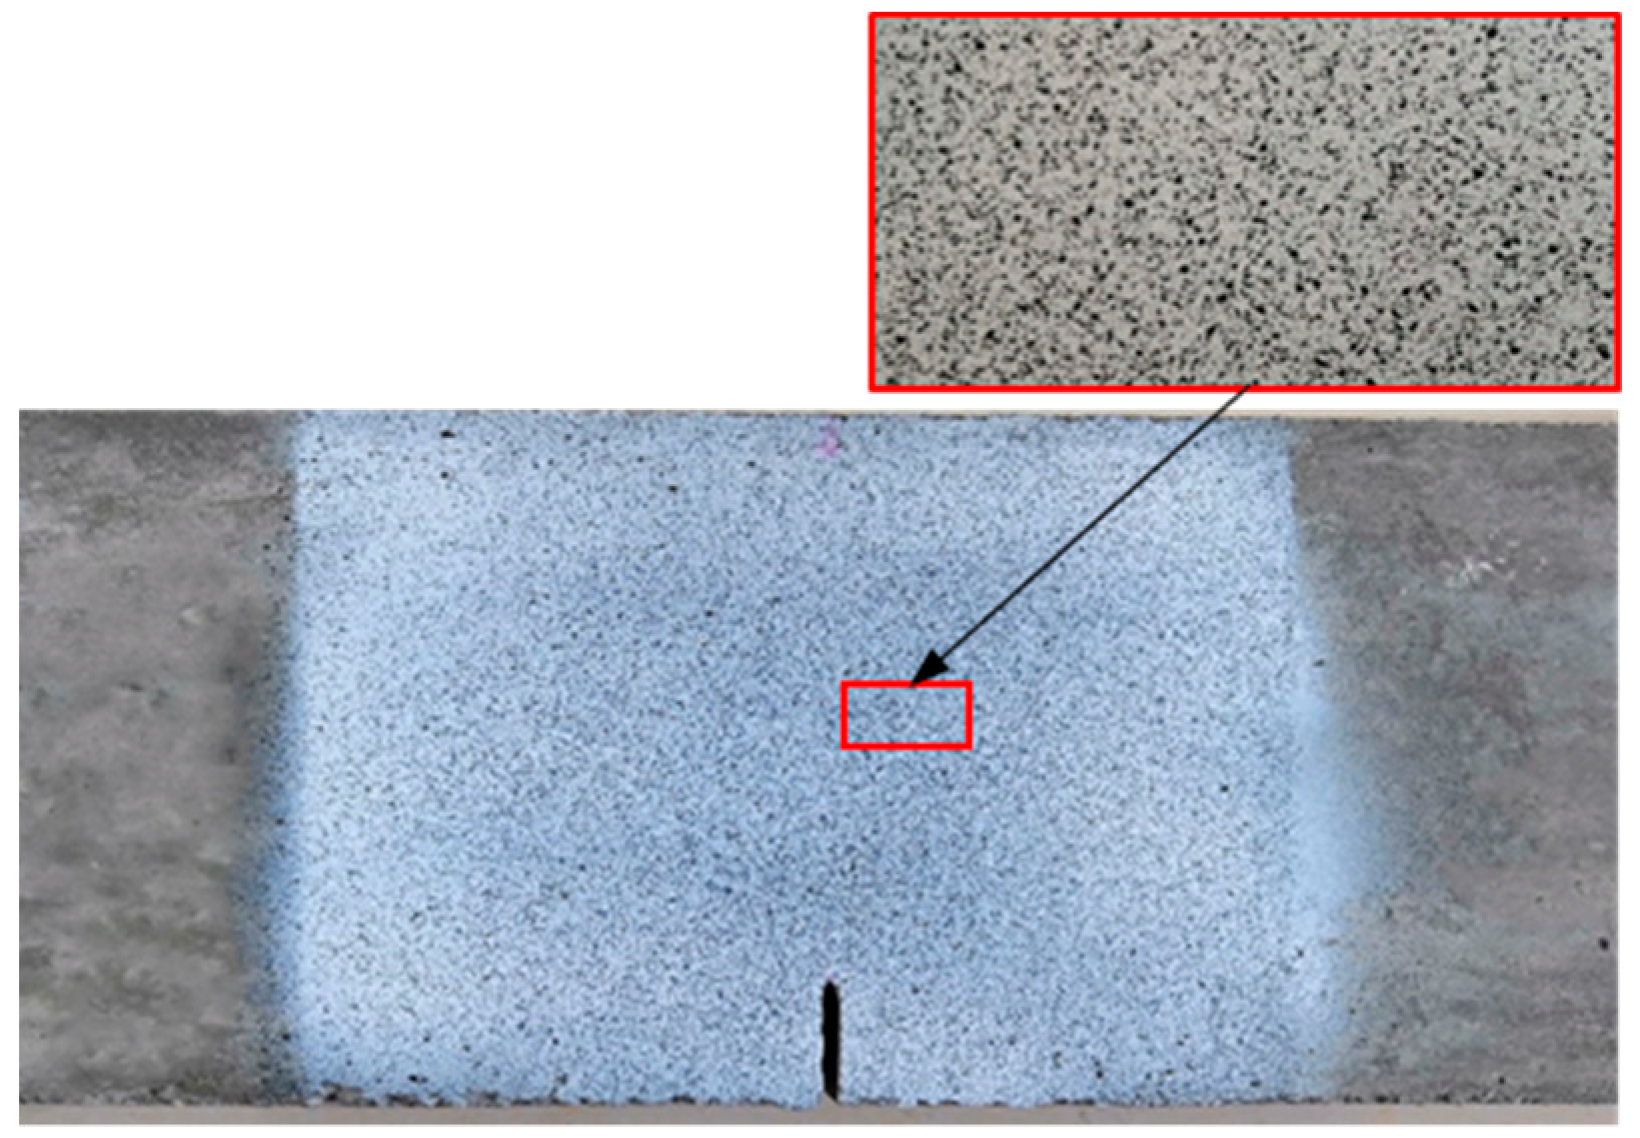
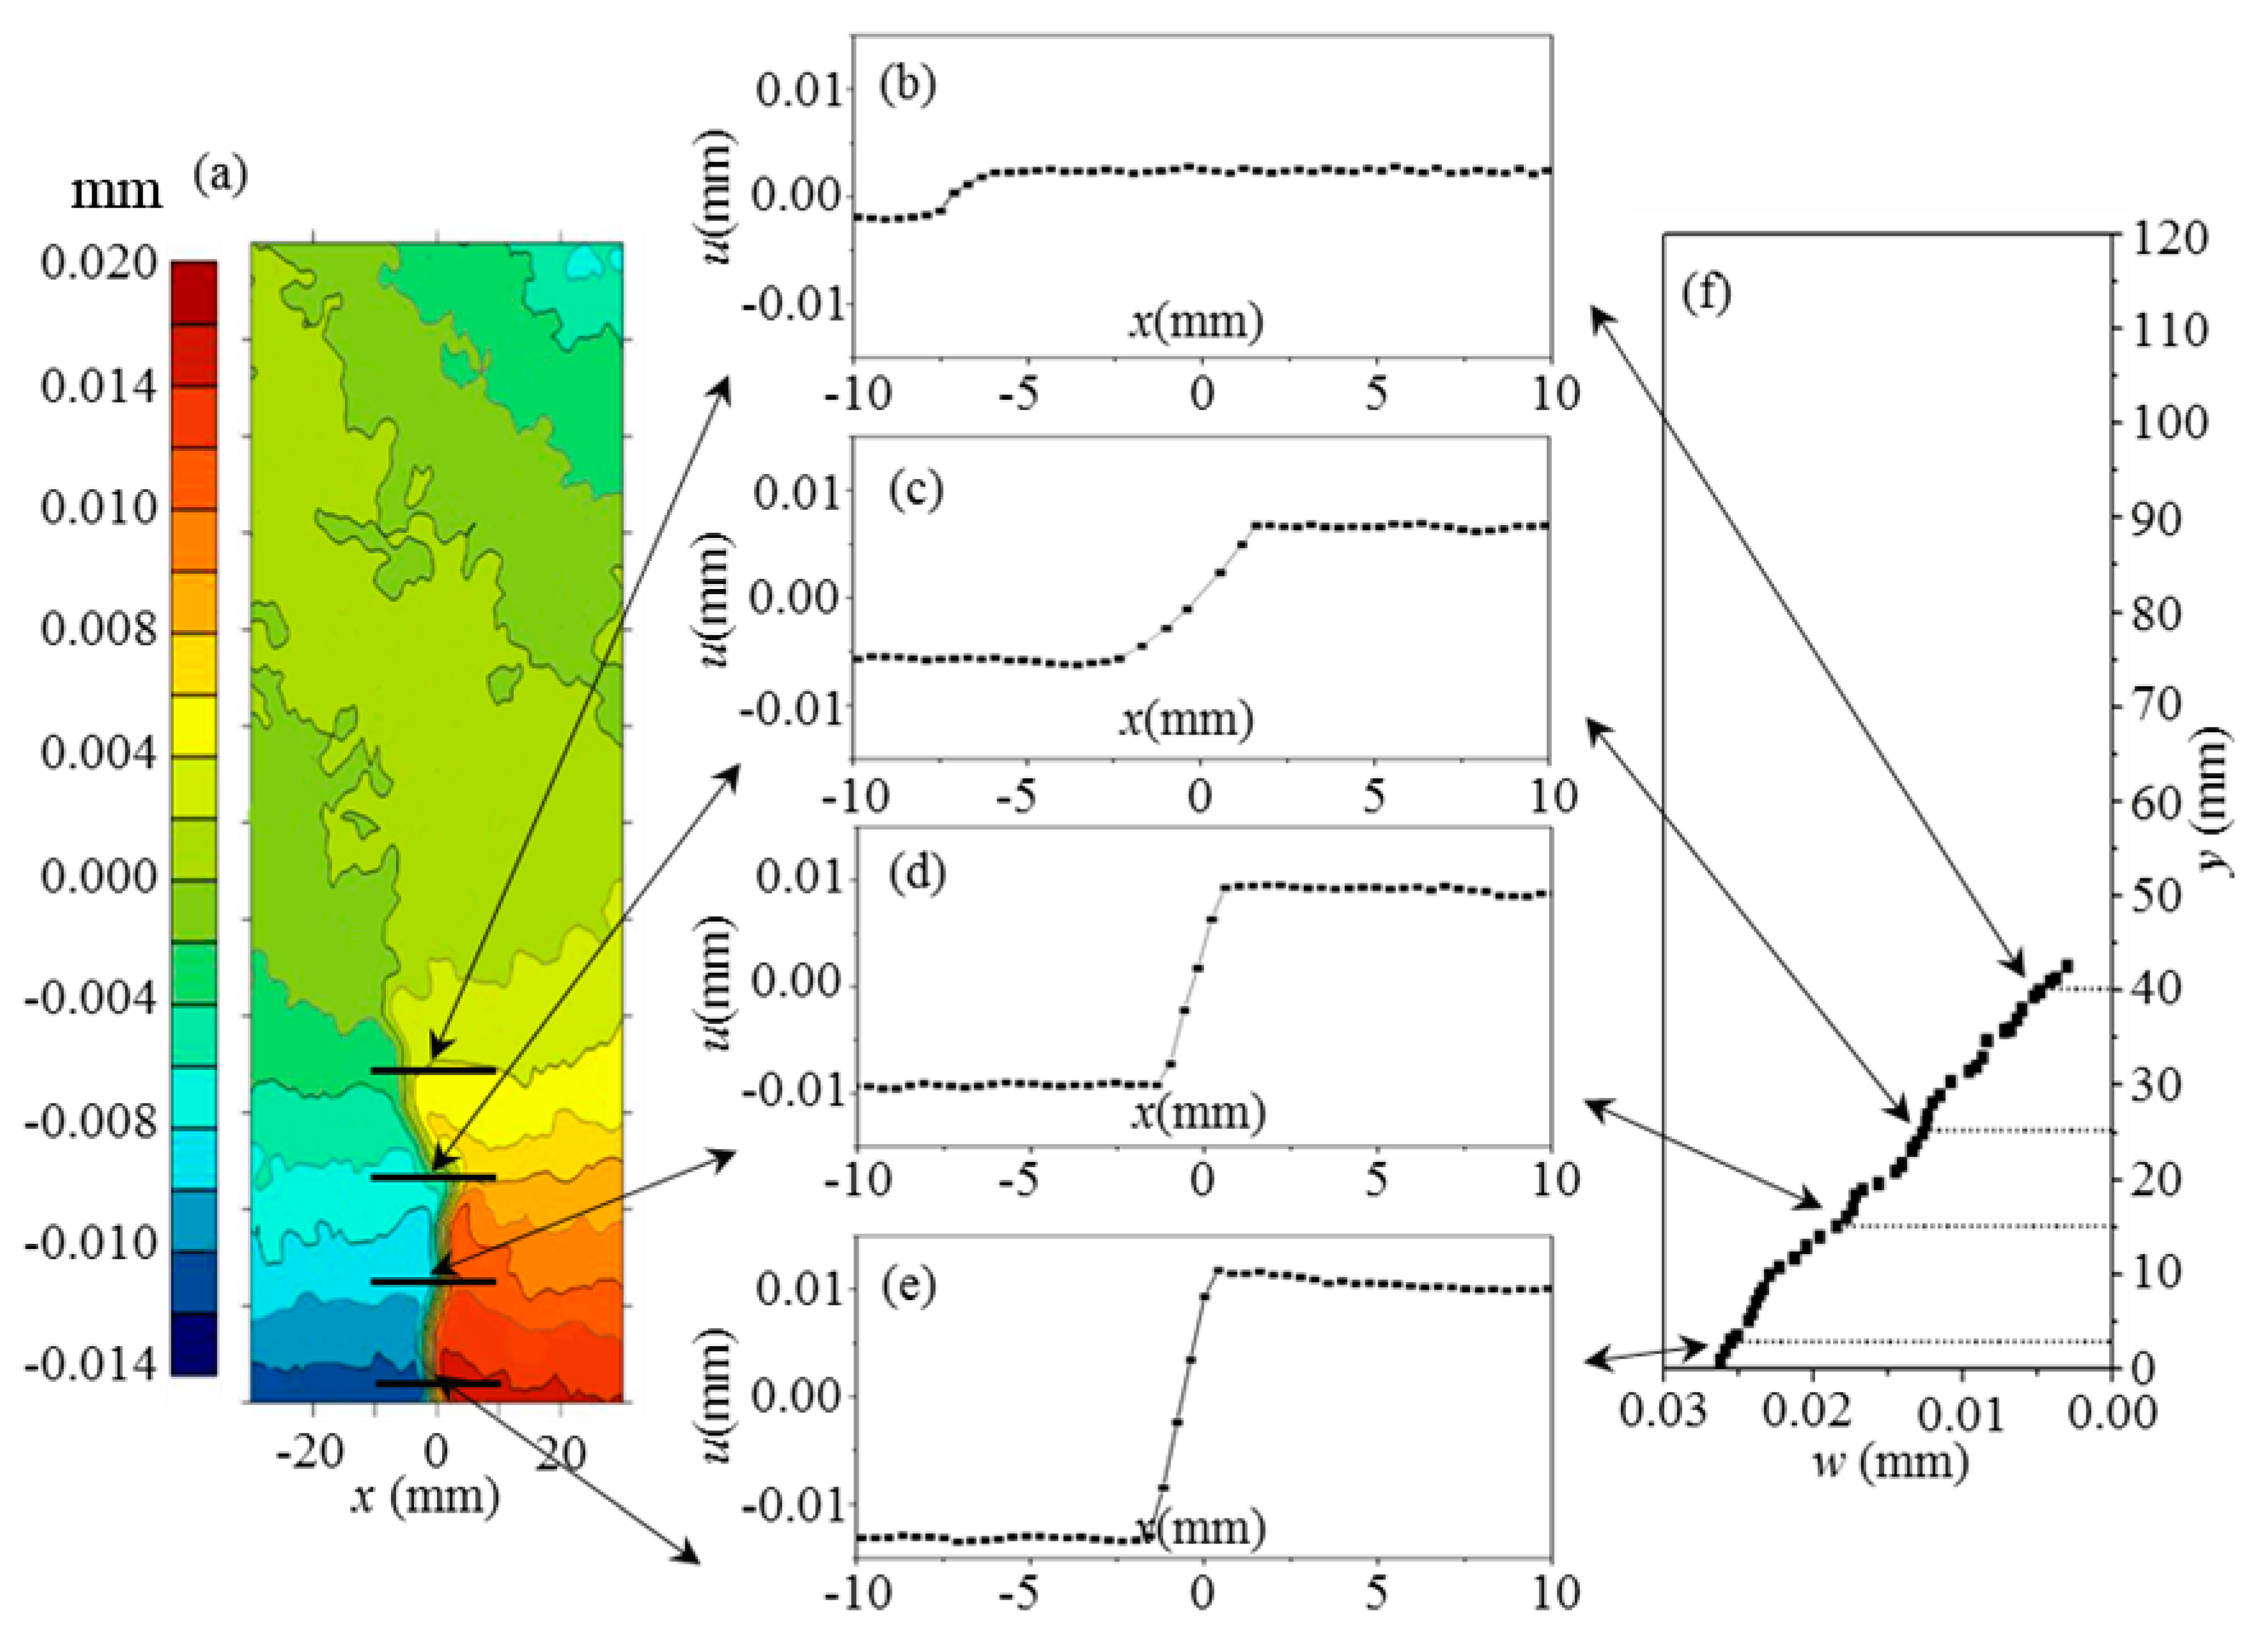
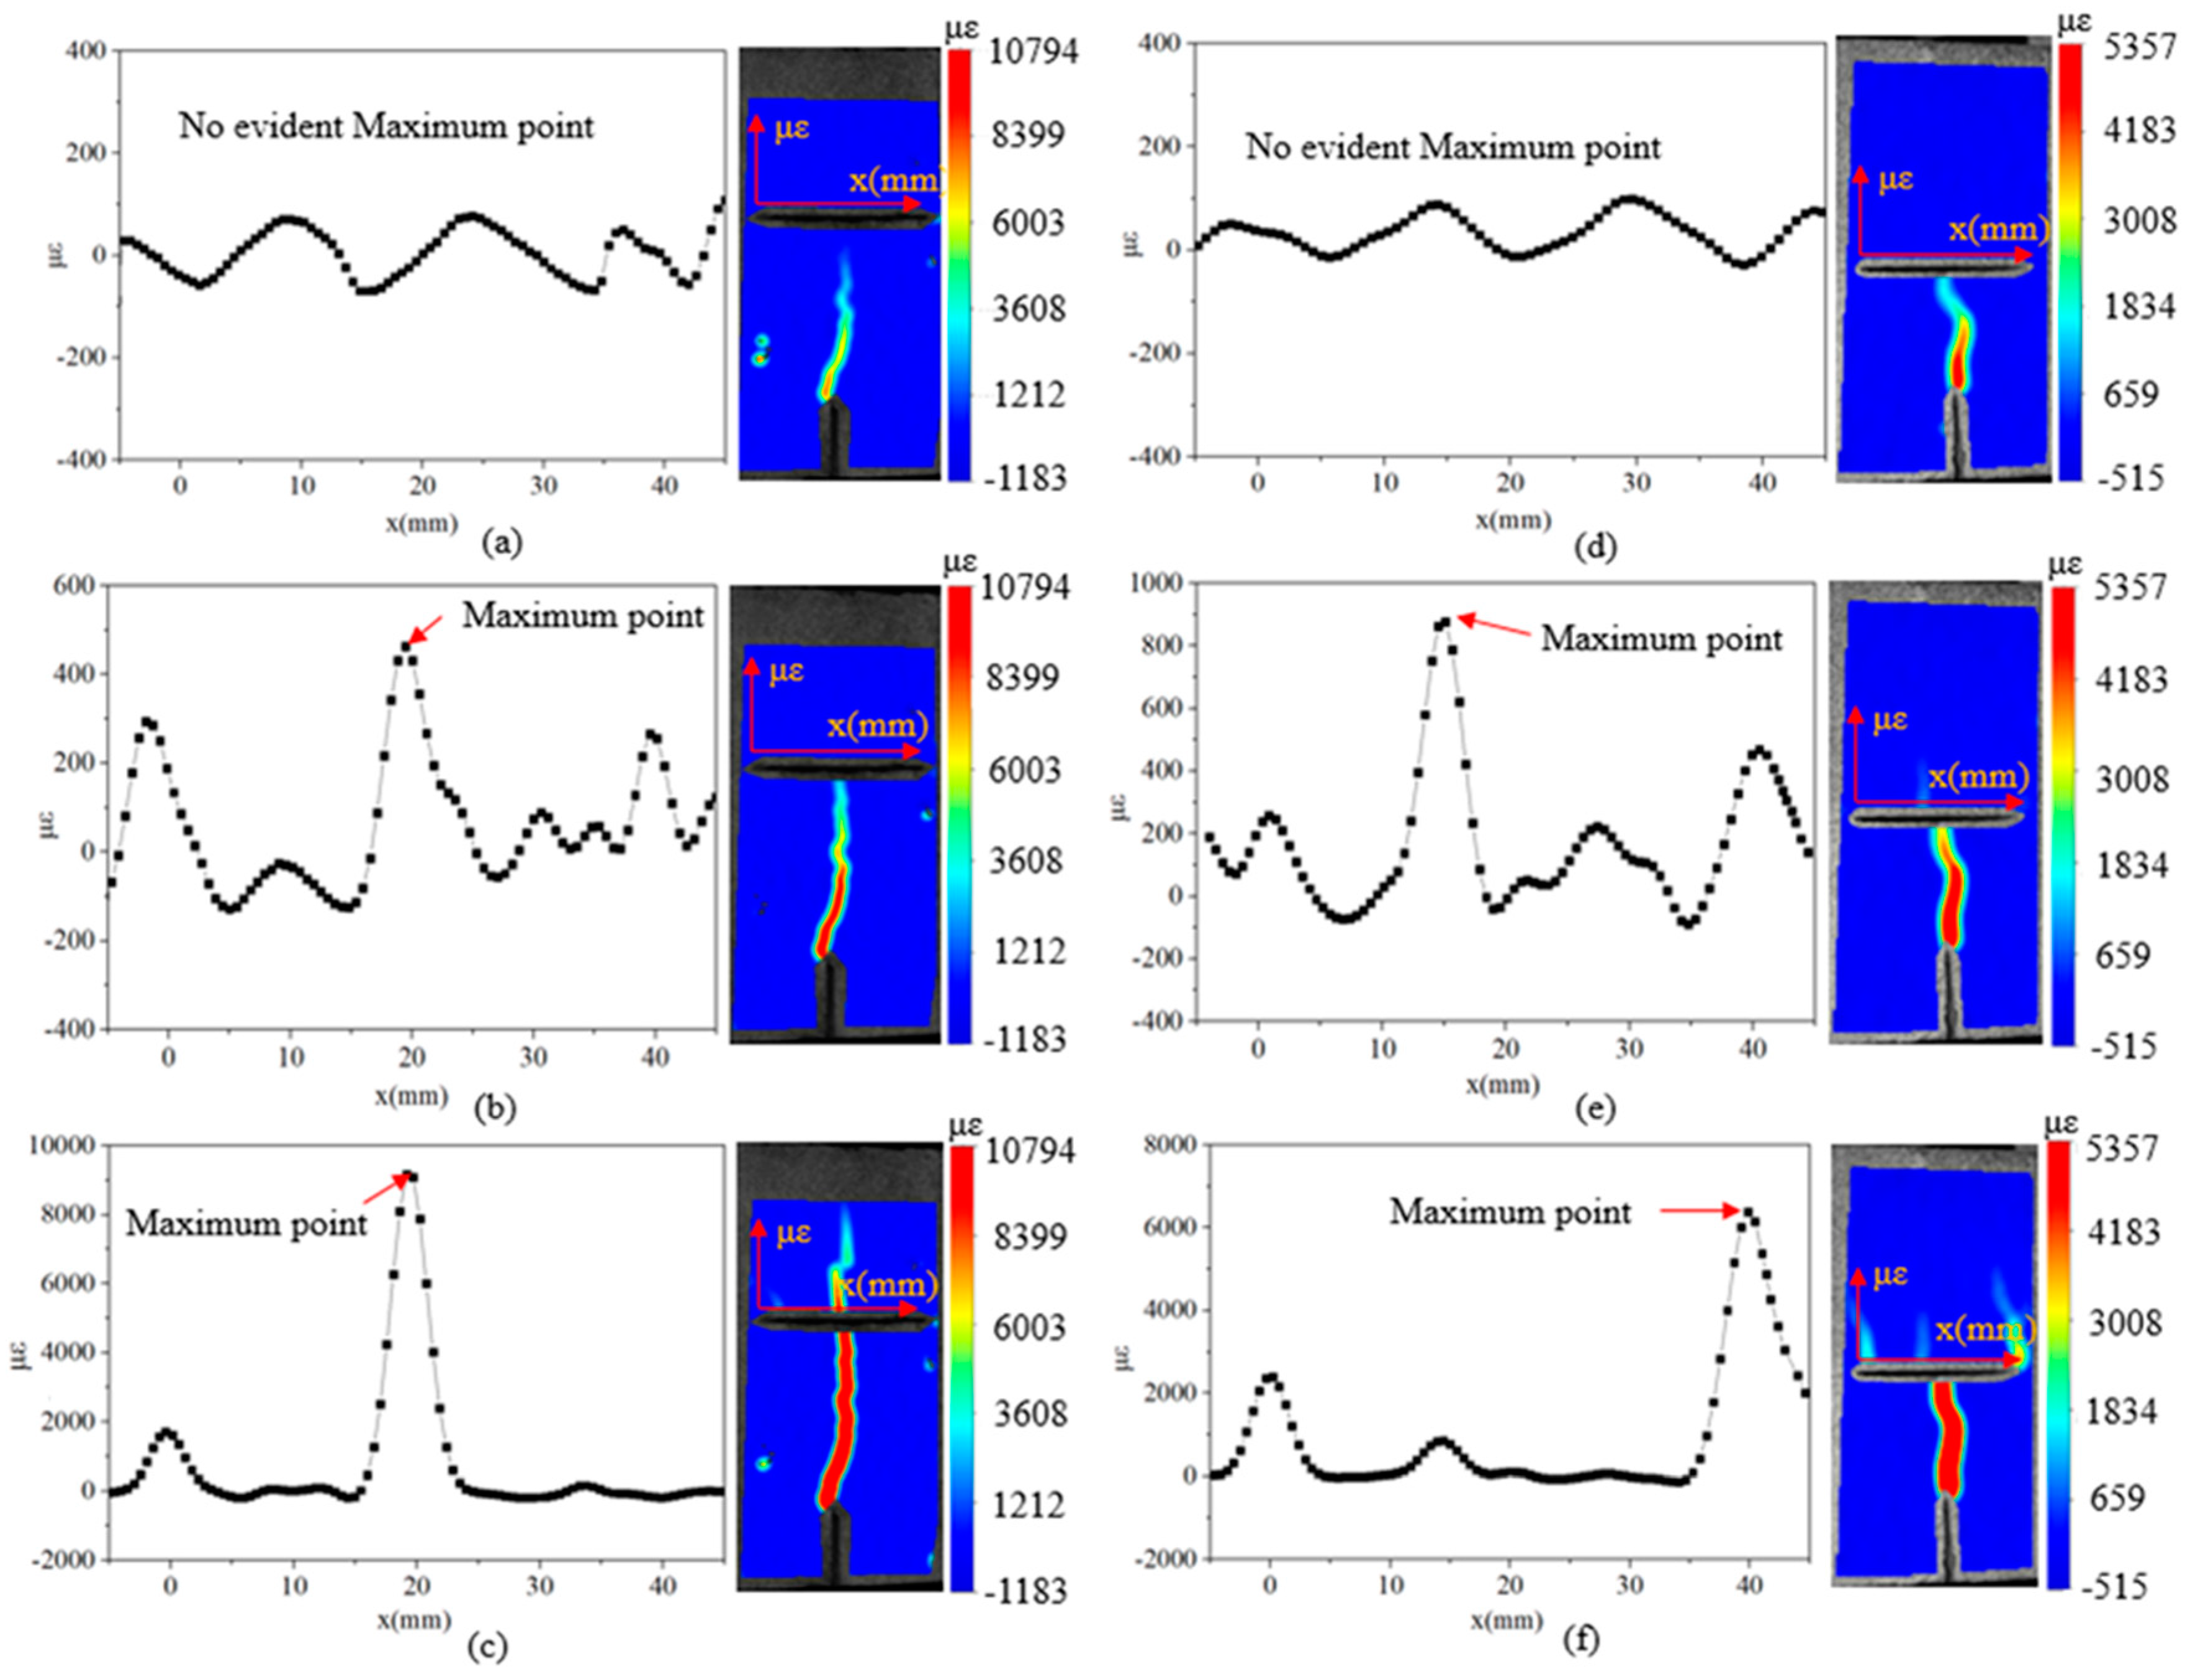
The TPB tests of concrete beams were performed using a mechanical testing machine, as shown in Figure 3. In the test, the concrete beam was placed in the clamp and loaded by a constant displacement rate of 0.05 mm/min right above the initial notch. The crack initiation was monitored and analyzed using acoustic emission technology, and the entire propagation process was monitored and analyzed using the DIC technology. The DIC analysis method of crack propagation is explained in detail in Section 2.4. One clip gauge was placed at the bottom of the notch and fixed by two steel plates to measure the CMOD. The experimental process can be divided into four steps. First, the test beam was placed into the clamp, and the clip gauge was attached on the notch mouth to measure the CMOD. Second, the acoustic emission (AE) sensors were placed on the surface of the test beam to obtain the crack initiation. Third, the DIC equipment was set up to start taking pictures. Finally, the loading force was applied using displacement control with a constant rate of 0.05 mm/min.

2.4. DIC Technology

DIC technology was used to obtain the deformation of the surface of the test beam in the experiment, as shown in Figure 3. In this test, digital images were obtained using cameras with a resolution of 2448 × 2408 pixels, 50 mm fixed focal lenses, and maximum acquisition frequency of 80 Hz. Approximately 0.25 m × 0.25 m area of the mid-span portion was captured by each camera. Moreover, the DIC setup was calibrated using a standard calibration panel with 4 mm and calibration deviation of 0.02 pixel.
In the test, the measuring surface of the test beam was preprocessed by creating an irregular matte black and white speckle pattern to provide adequate contrast, as shown in Figure 4. Moreover, external lighting was directed toward the measuring surface to enhance the image quality. During the entire test process, the images were shot once a second until the failure of the test beam. Meanwhile, the time of the first digital image was recorded and matched on the loading time curve during the loading stage to match the load values with the reference of time in the test.
The crack opening displacement (COD) profile along the crack path, which is an important input datum for calculating the cohesive stress distribution in the fracture process zone (FPZ), can be obtained from the displacement fields of specimen surface by DIC technology [26]. As shown in Figure 5, the x-axis and y-axis are along the span and height of the specimen, respectively. Figure 6a shows the displacement contours at the peak load of the standard TPB specimen without central preset crack. The displacement distributions along a line segment (between x = −10 mm and x = 10 mm) of four horizontal cross sections located at y = 3, 45, 55, 70 mm are observed in Figure 6b–e, in which x and y coordinates represent perpendicular and parallel to the crack surface, respectively. The displacement jump in the figures is due to the formation of microcracks; thus, the COD at one y coordinate can be easily obtained by the difference in the displacements between the beginning and end points of the jump. For instance, the value of COD is equal to 25.3 μm at y = 3 mm, 18.4 μm at y = 15 mm, 12.6 μm at y = 25 mm, and 4.5 μm at y = 40 mm. On the basis of this method, a COD is extracted along the y-axis per mm; accordingly, the overall COD profile along the crack path can be determined (Figure 6f).
The FPZ tip should be defined to determine the crack extension length Δa and investigate the crack reinitiation point. Wu [26] regarded the position of maximum tensile strain as the tip of the FPZ. Chen and Su [27] proposed that COD = 2 μm can be used as the FPZ tip of specimens. In the current study, the location with COD = 3 μm is selected for the identification of the FPZ tip. The length of the cohesive zone of approximately 43 mm is at the peak load.

3. Results and Discussion

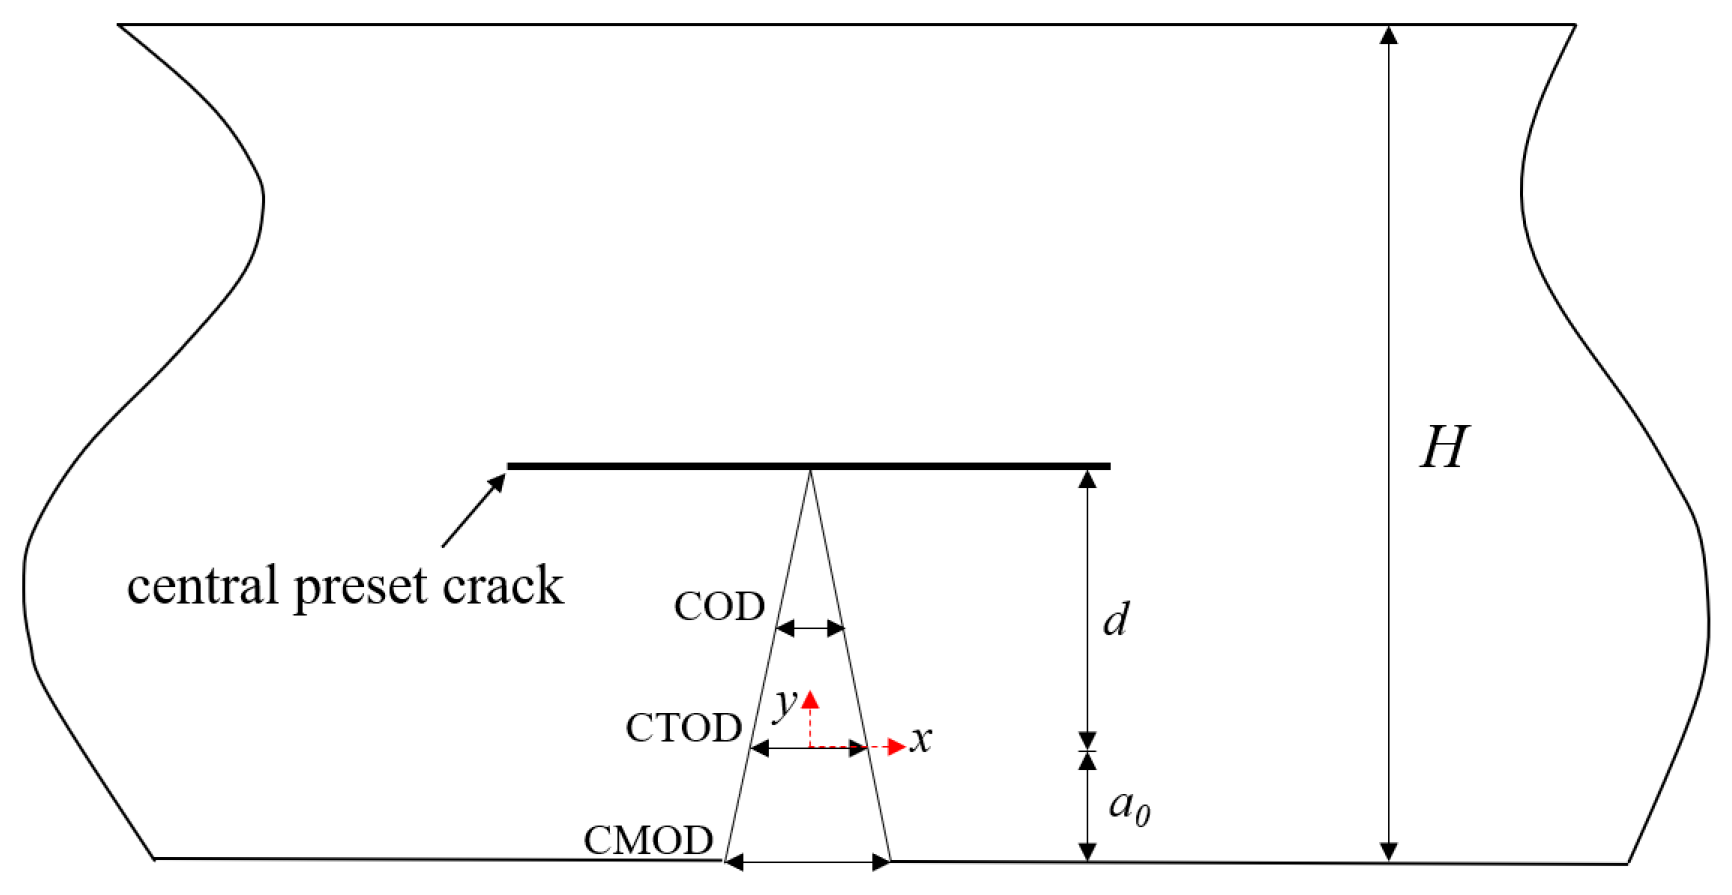
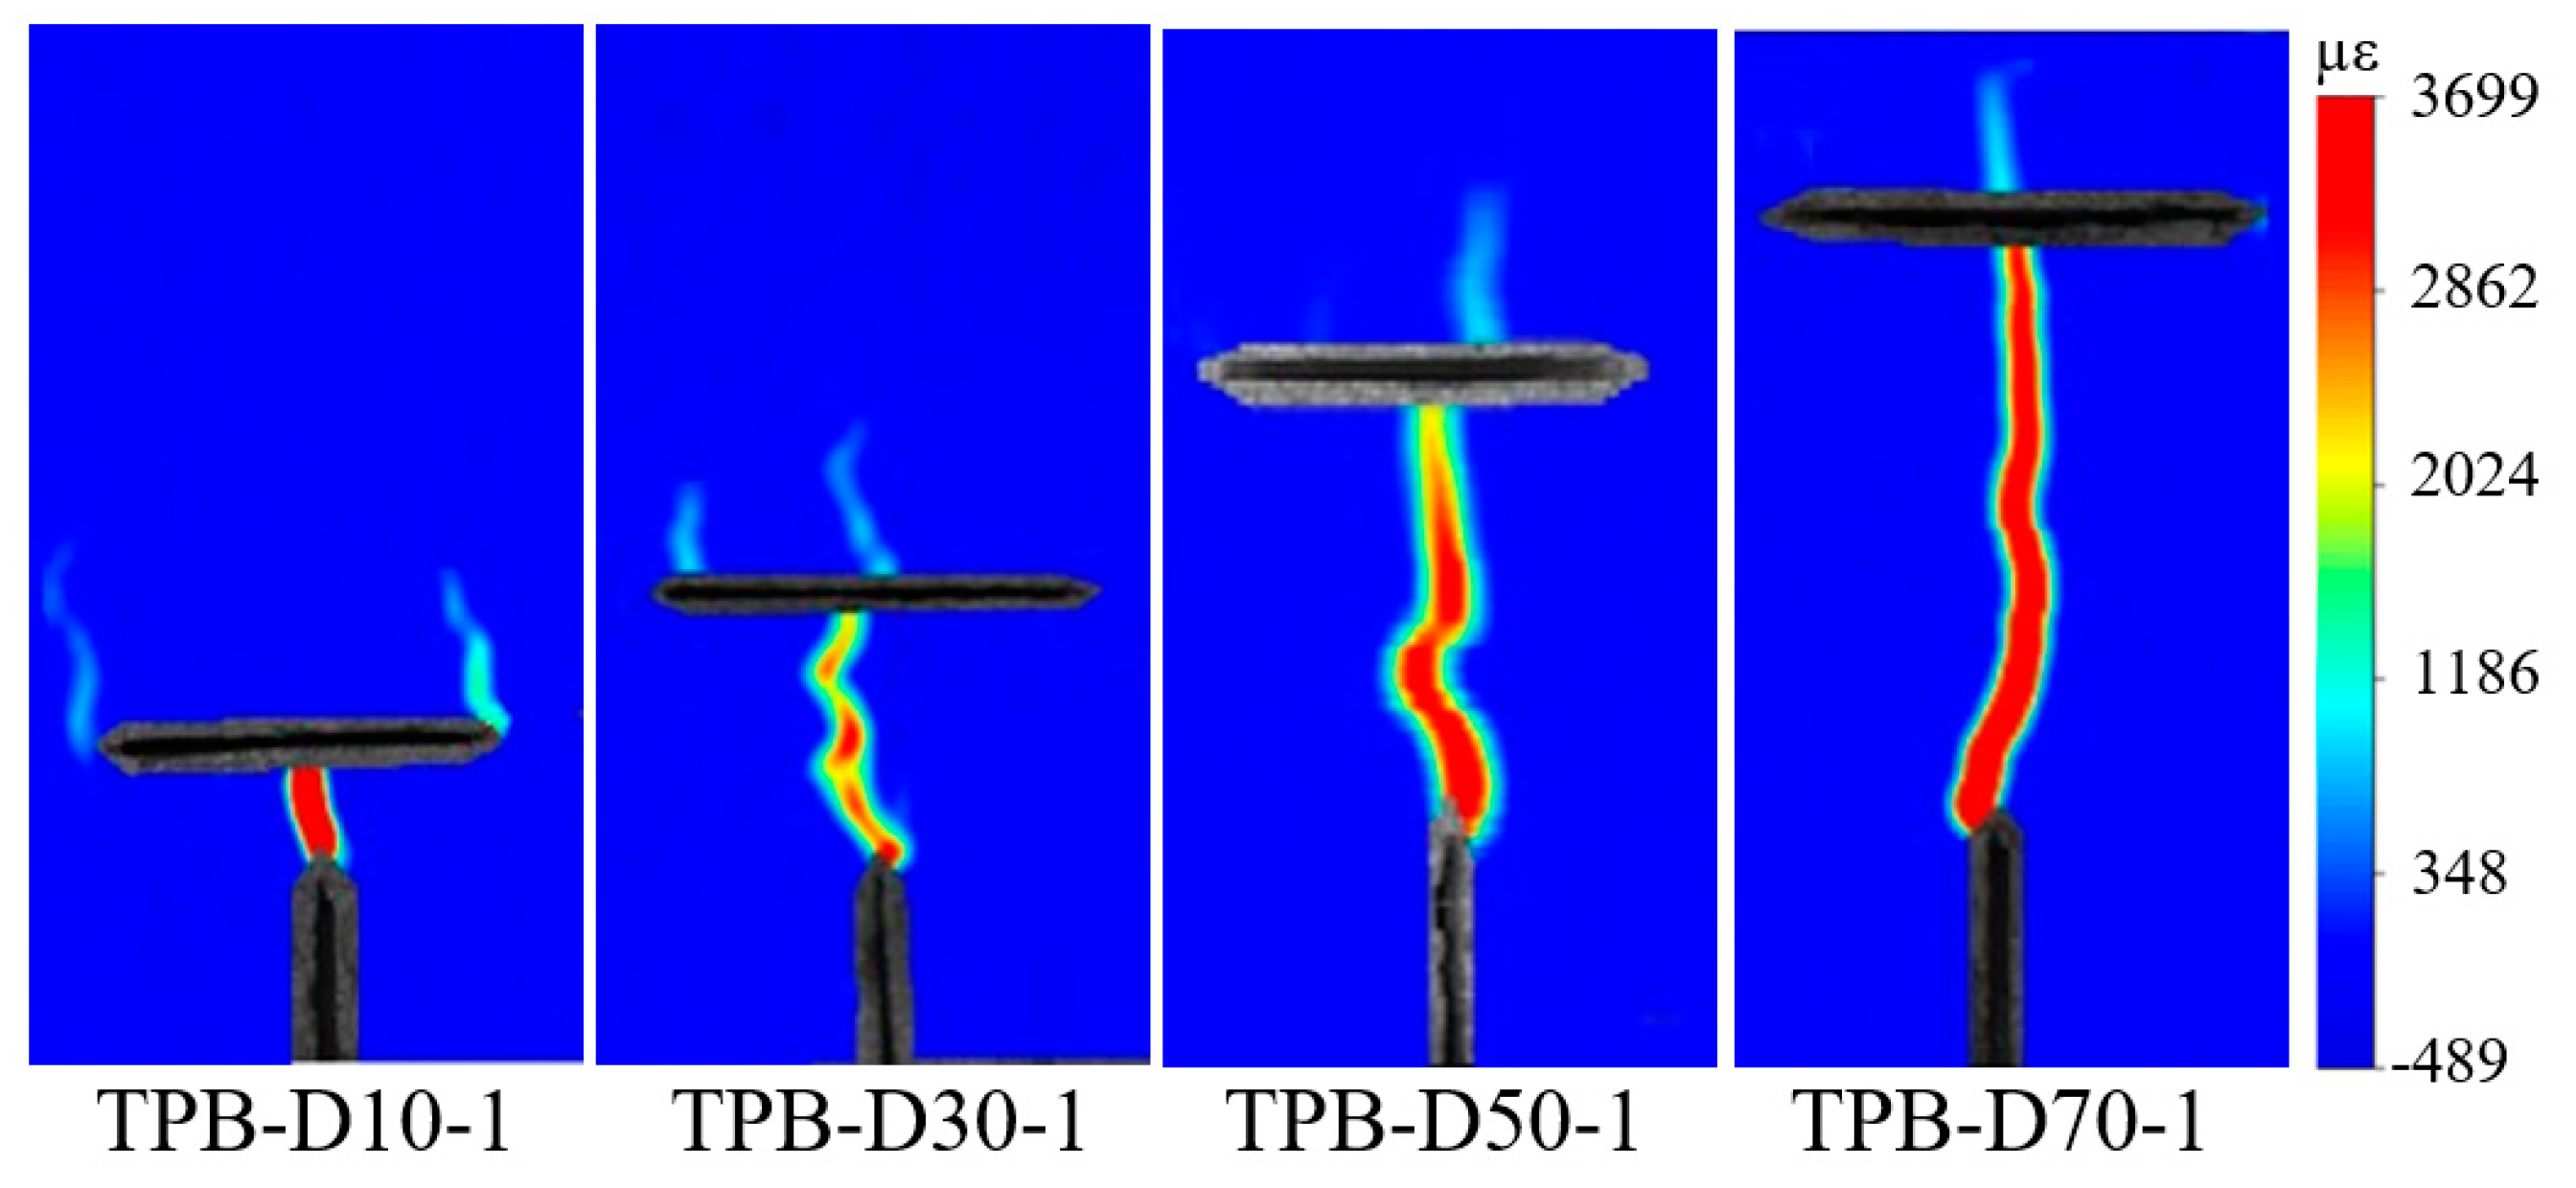
3.1. Preset Crack Position

Figure 7 illustrates the P-CMOD relations of the test beams with different preset crack positions. Table 3 lists the fracture parameters of the test beam with different preset crack positions. The test results of the beams with the distances of 30 and 50 mm between the preset crack and notch tip are close to each other. Meanwhile, the beam with a distance of 10 mm has a great reduction in carrying capacity. Therefore, the preset crack close to the notch tip accelerates the crack propagation into the unstable stage and induces the reduction in peak load. Figure 8 illustrates the strain contours of the test beams. In the crack path of the beams with different preset crack positions, the crack restart point after interaction is transformed from the preset crack tip to the middle of the preset crack. A long distance between the notch crack tip and the preset crack indicates a weak influence of the preset crack on the crack path.

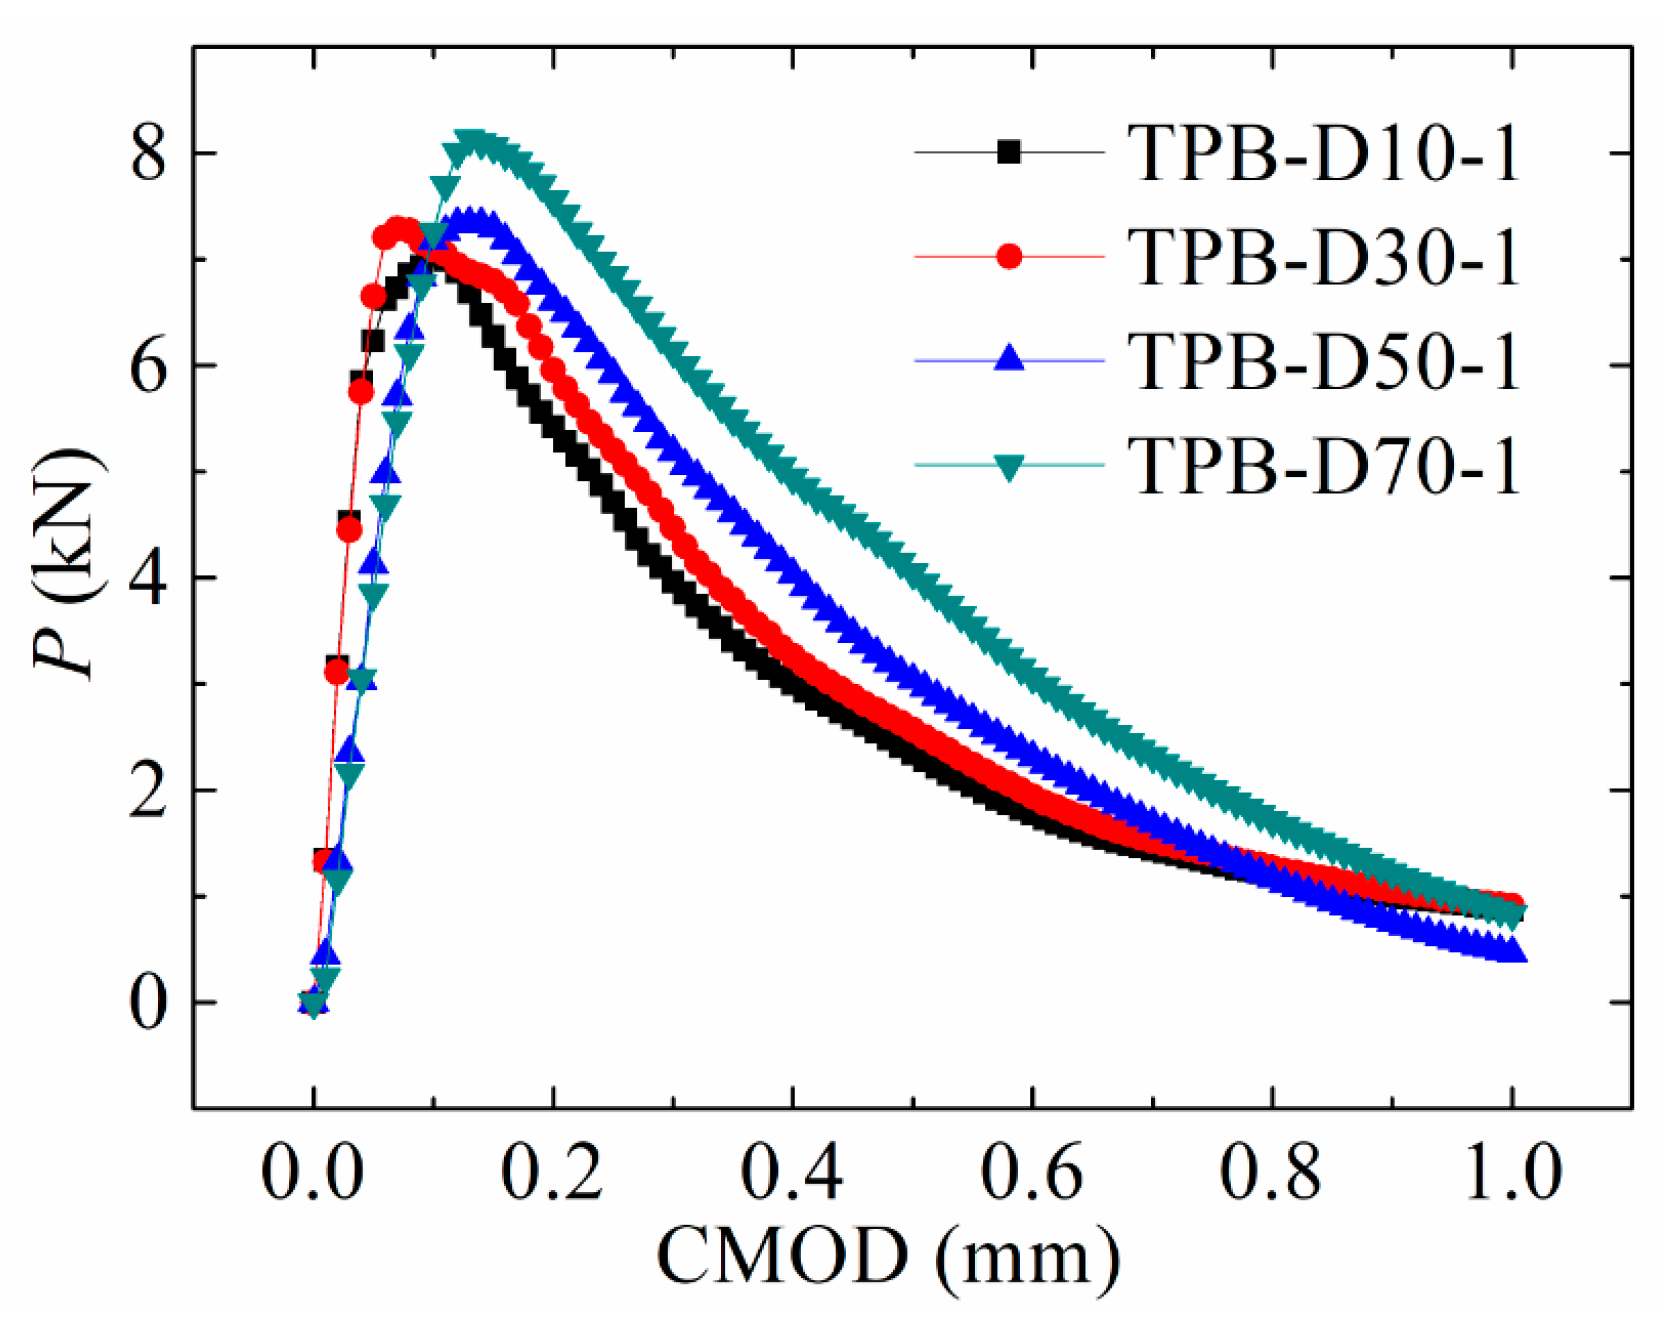
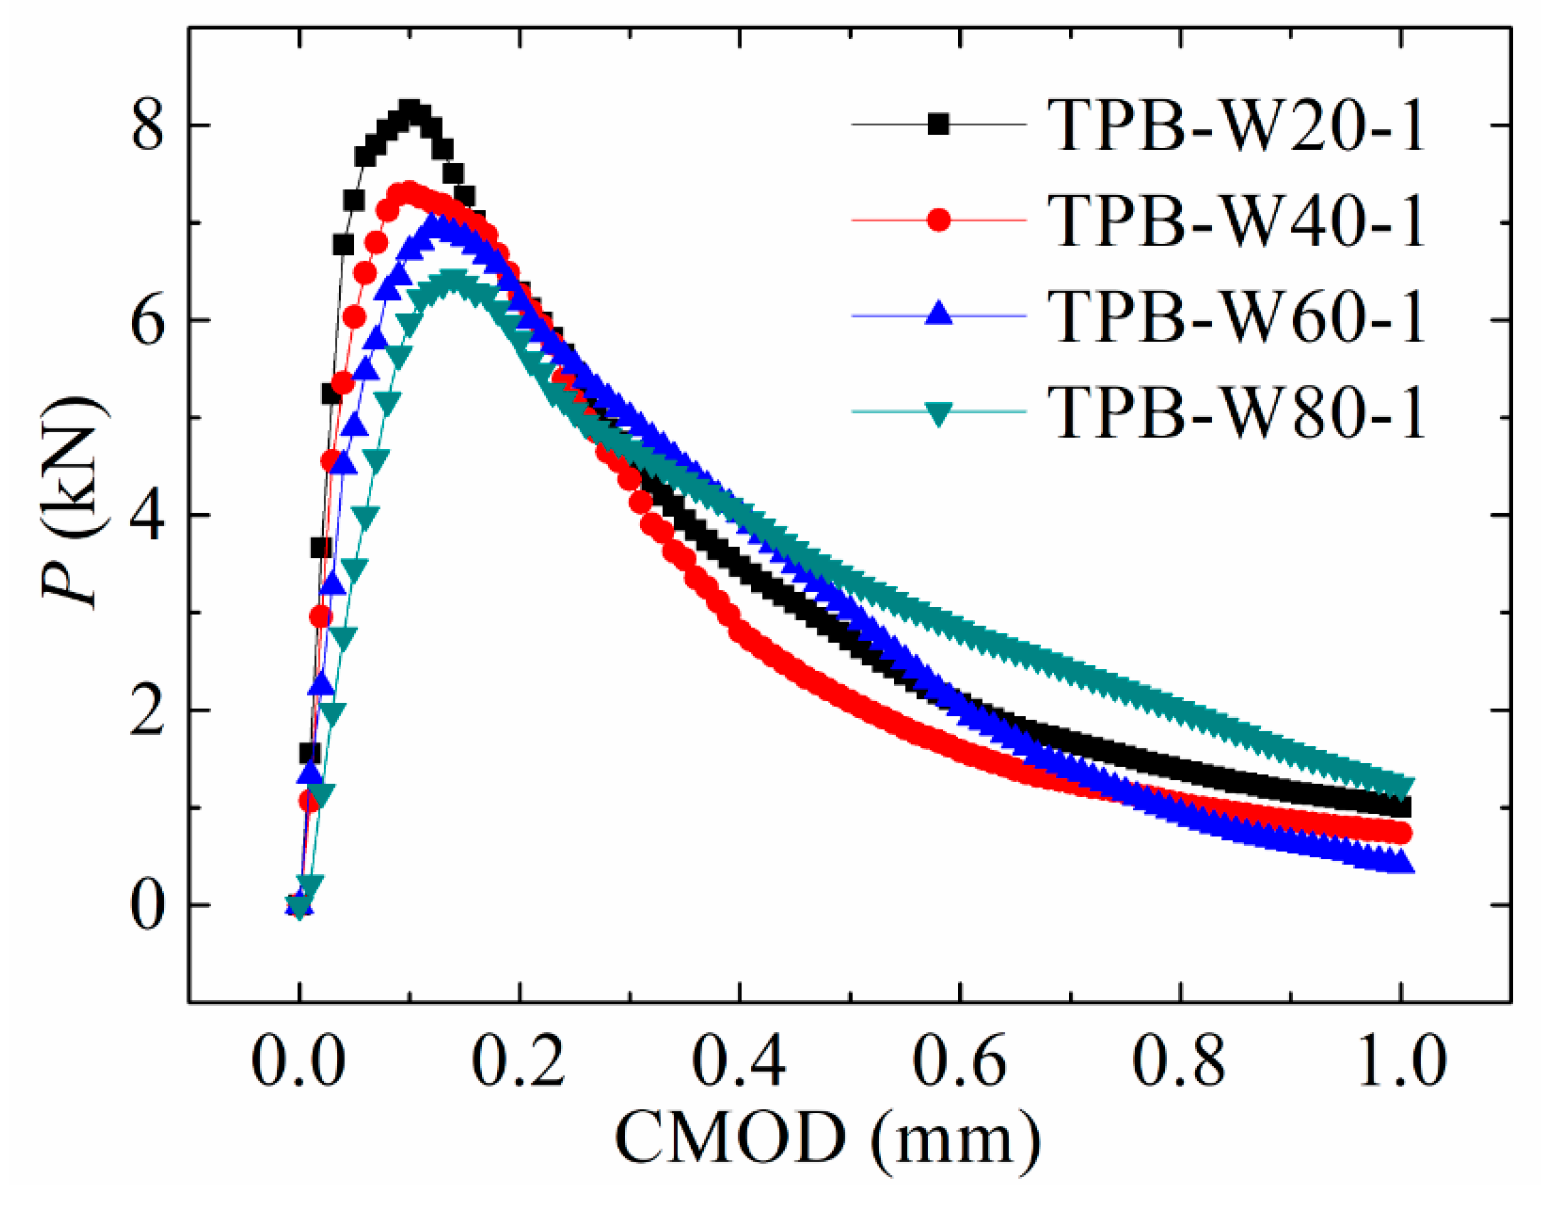
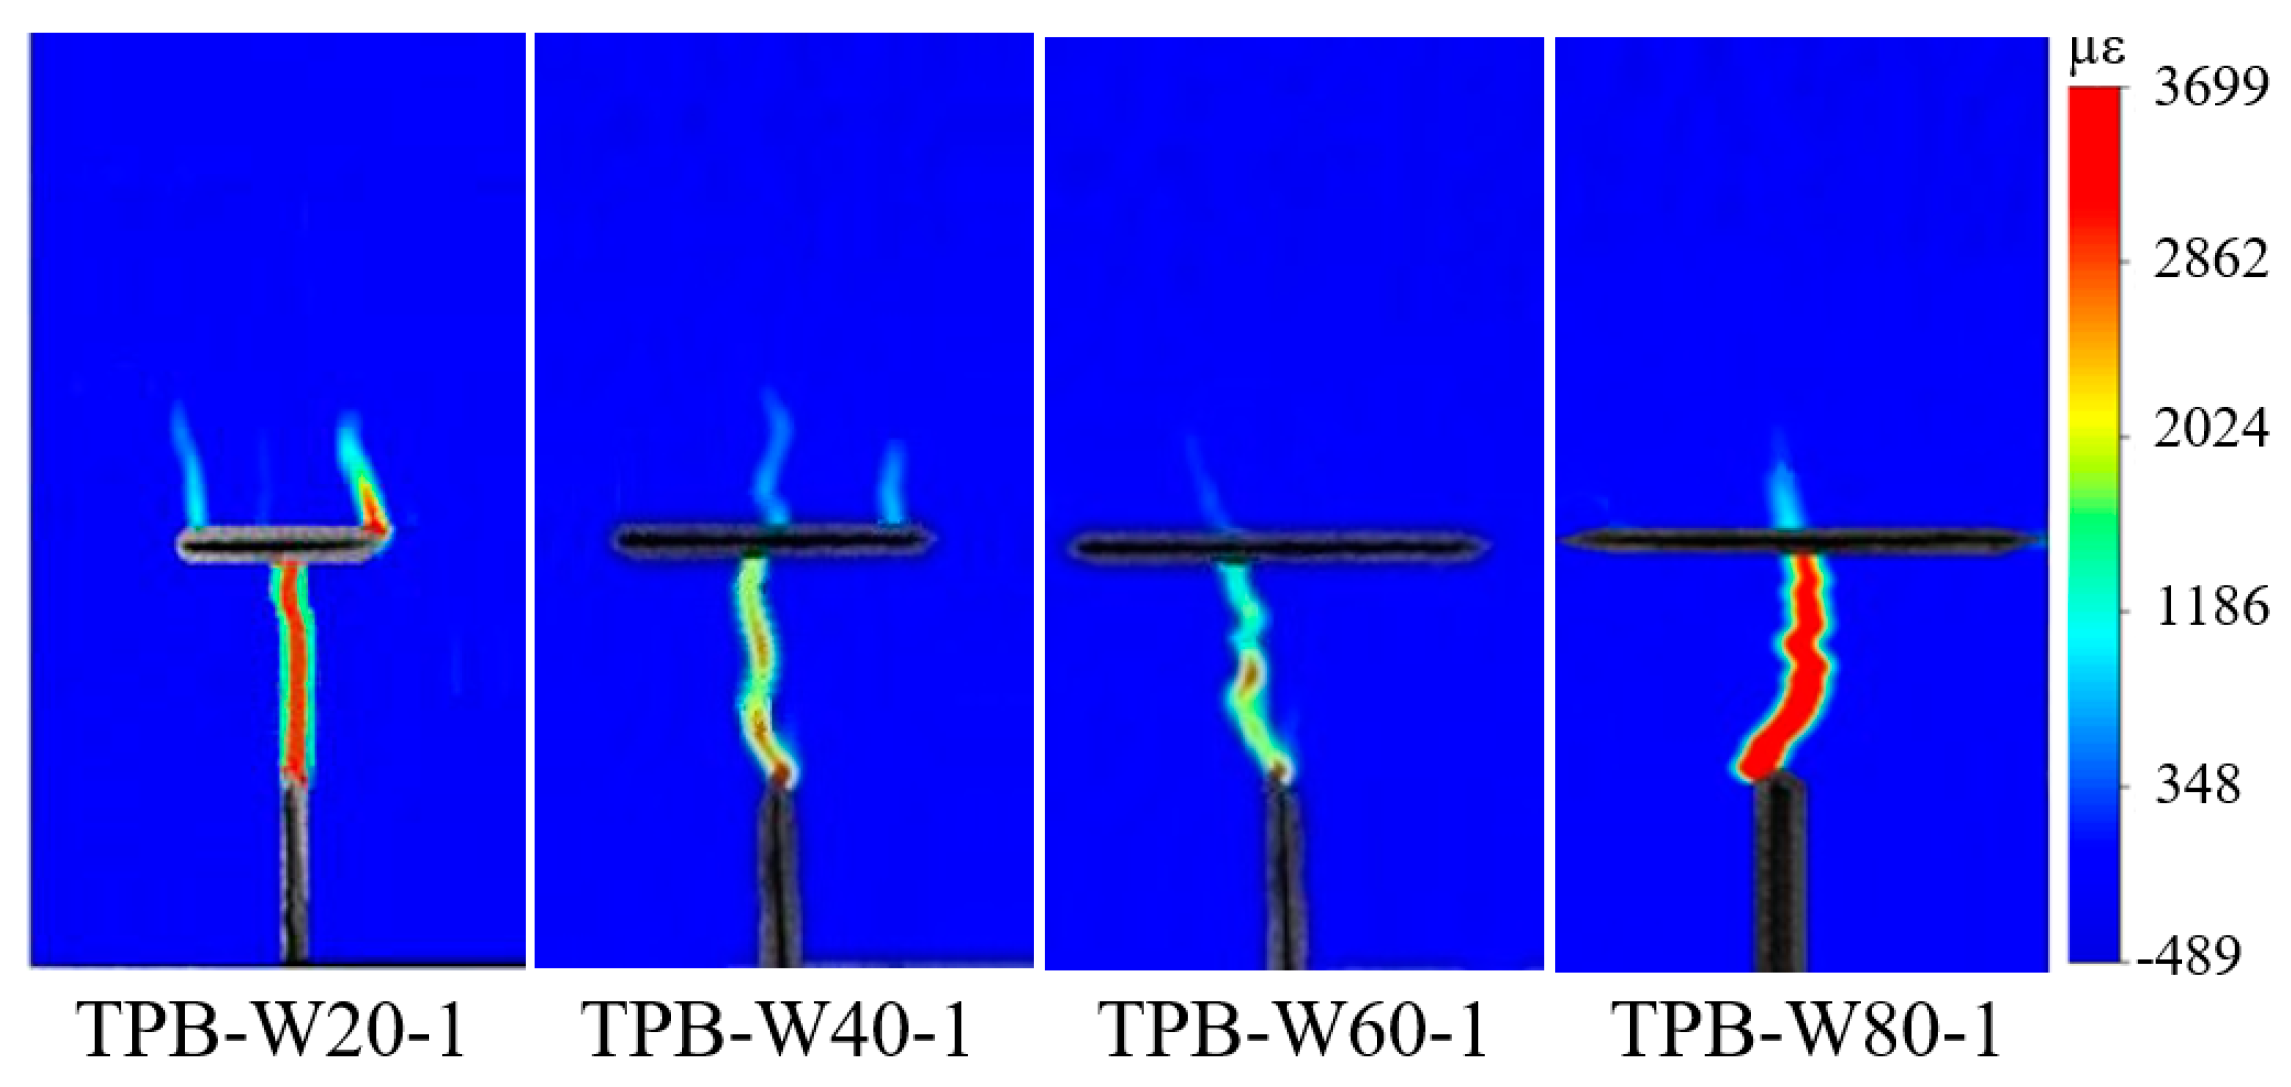
3.2. Preset Crack Length
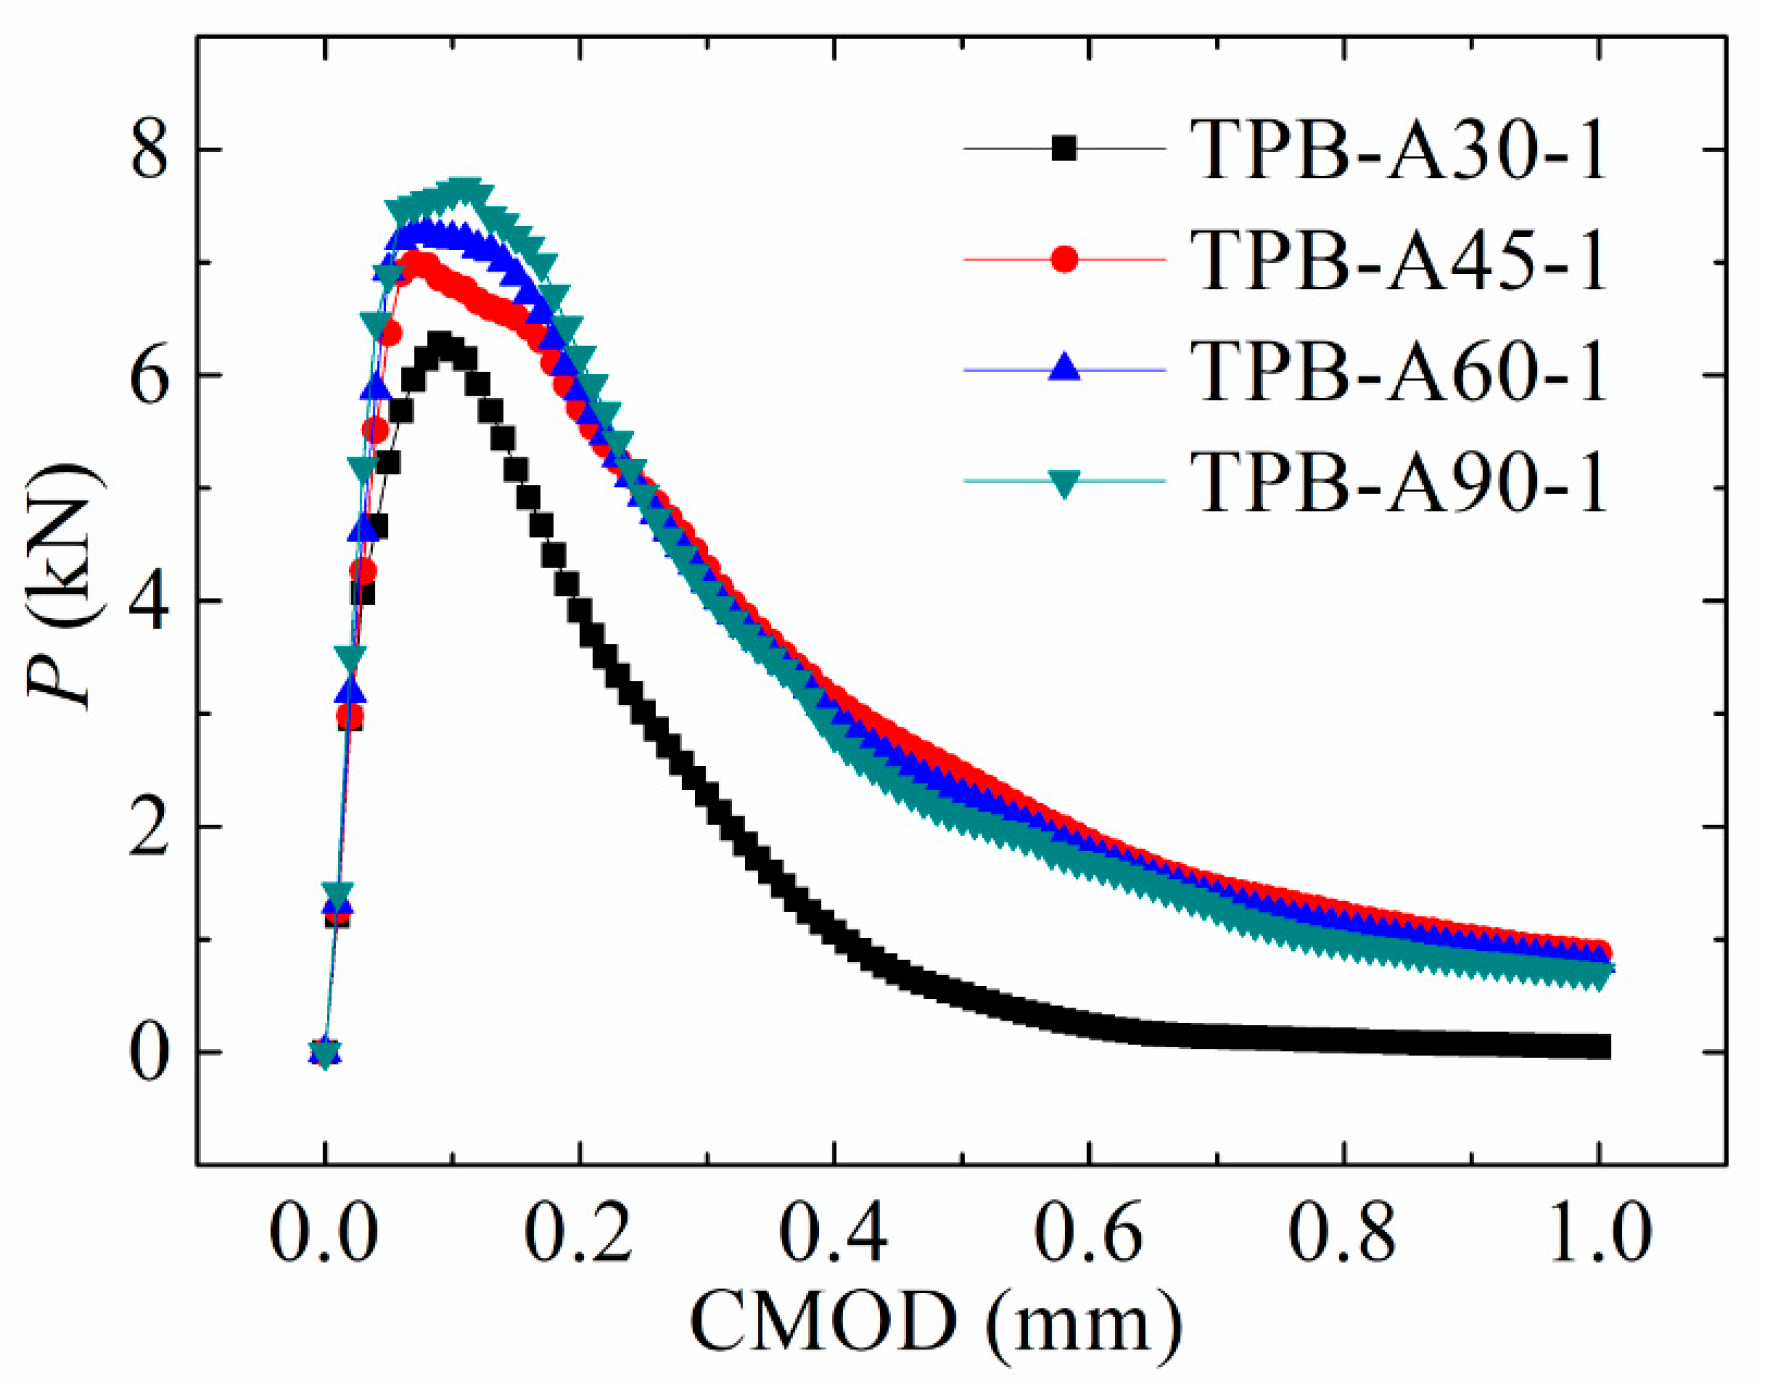
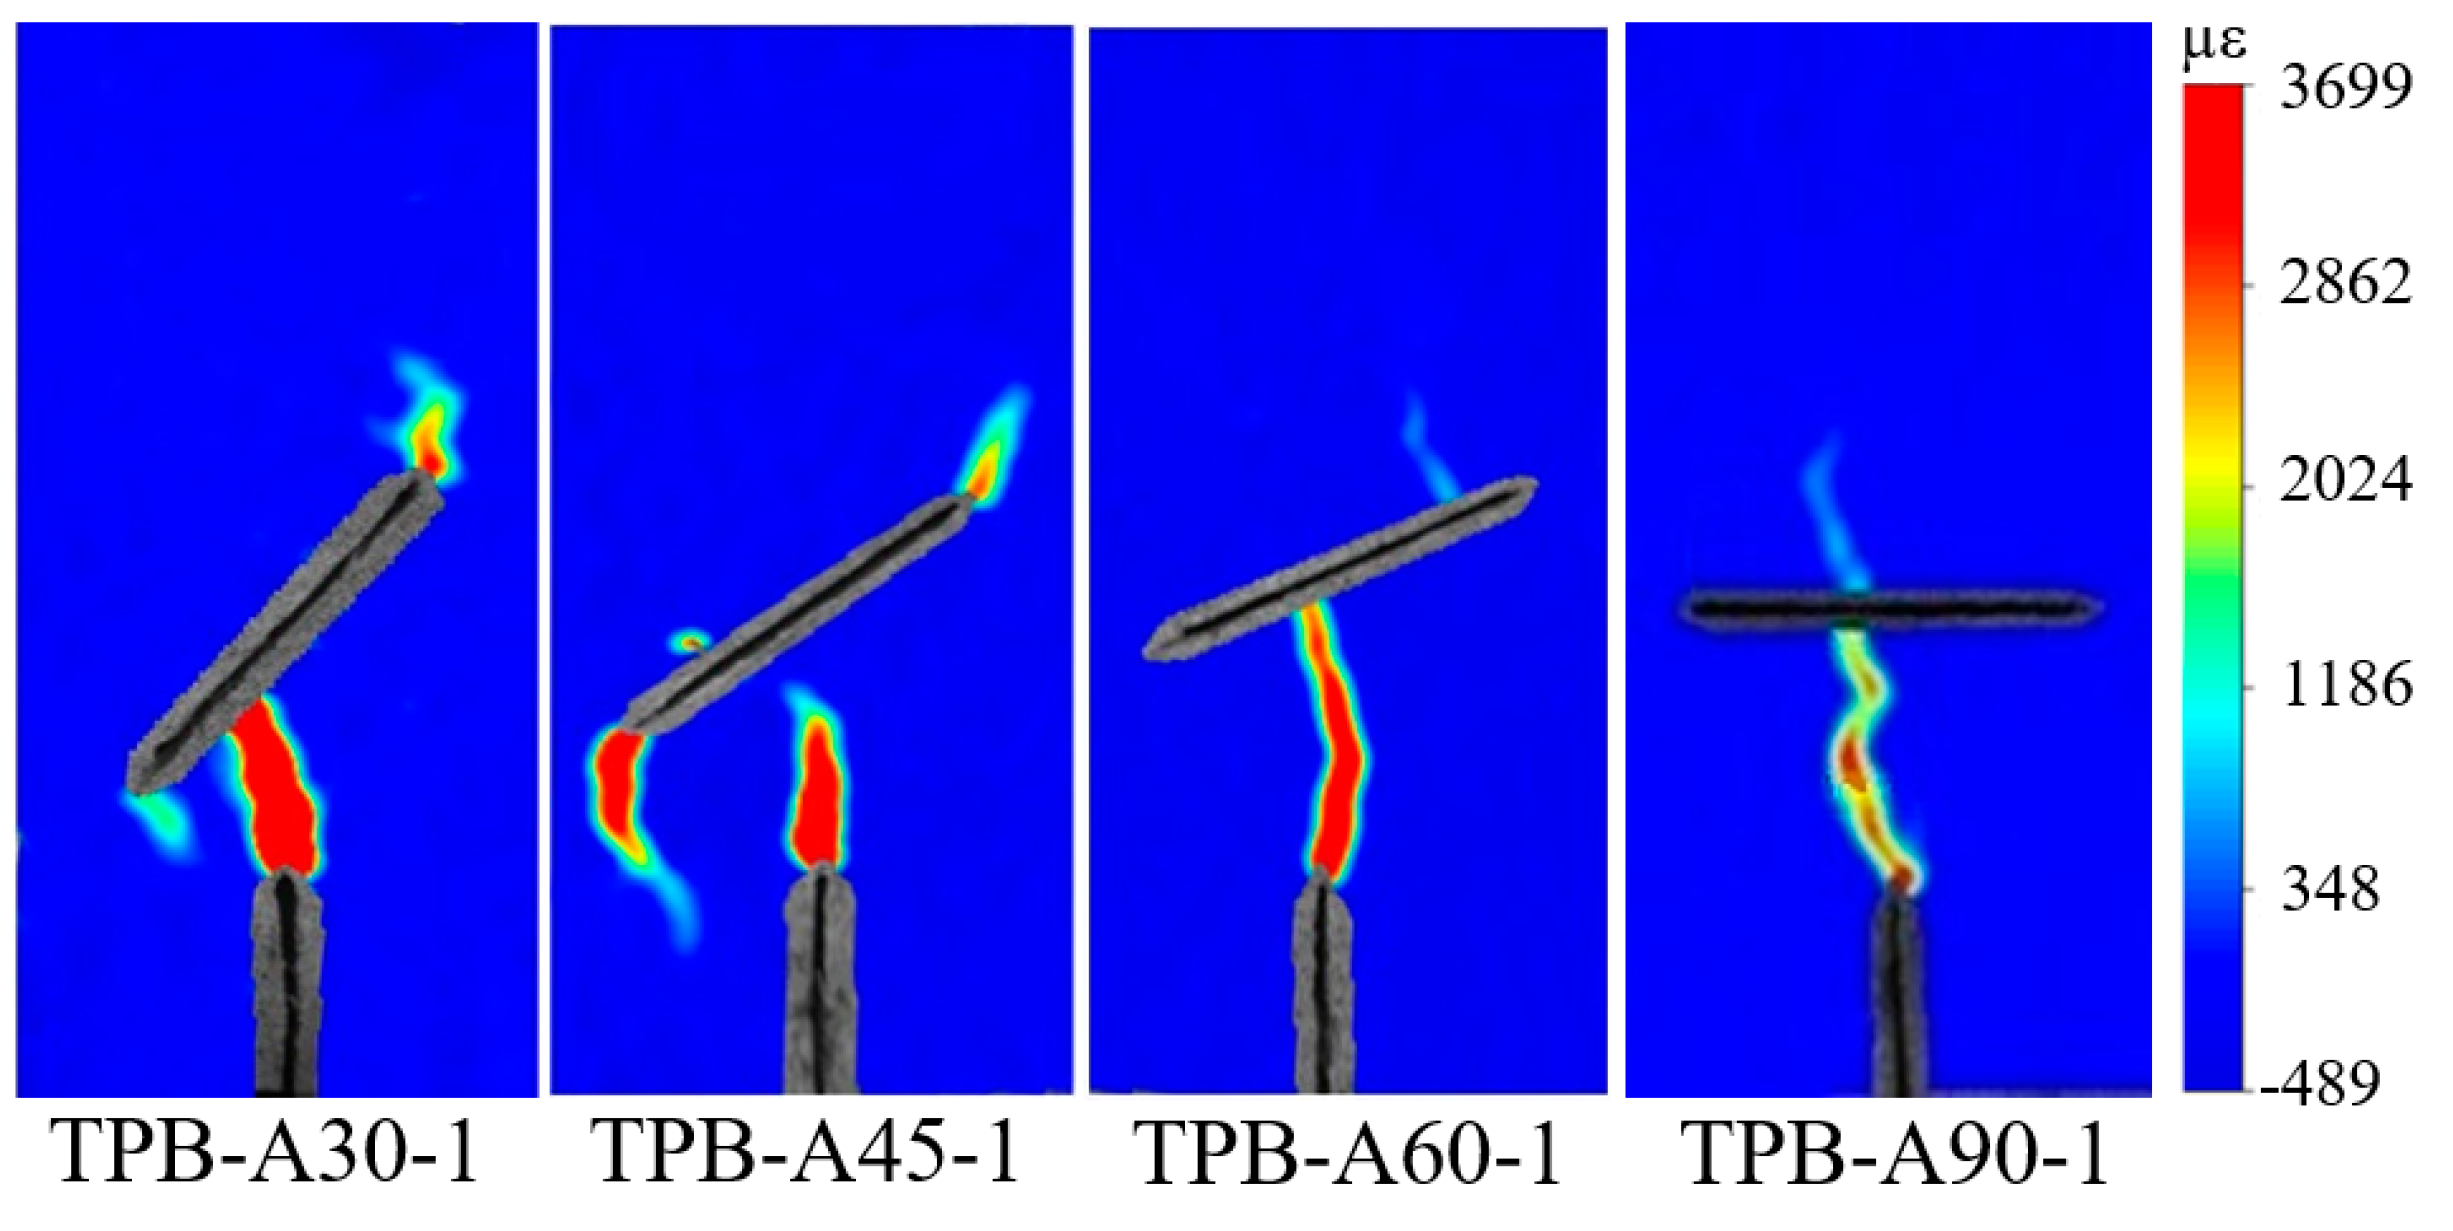
Figure 9 plots the P-CMOD relations of the concrete beams with different preset crack lengths. The results of the beams with the preset crack lengths of 20, 40, 60, and 80 mm have a good agreement with one another on the P-CMOD curve, and the peak load is reduced by the increment of the preset crack length. A long preset crack length corresponds to a high critical CMOD. Table 3 shows the fracture parameters of the test beam with different preset crack lengths. Figure 10 shows the strain contours of test beams. The crack restart points after interaction are transformed from the preset crack tip to the middle of the preset crack. A long preset crack length indicates a high possibility of the crack restart point at the middle of the preset crack.

3.3. Approach Angle

Figure 11 illustrates the P-CMOD relations of the concrete beams with different approach angles. The test results of the beams with the approach angles of 30°, 45°, 60°, and 90° indicate that a large approach angle corresponds to a large peak load and a small offset distance from the midpoint of preset crack. Table 3 lists the fracture parameters of test beams with different approach angles. Figure 12 shows the strain contours of the test beams. In the crack path of the beams with different approach angles, the crack restart points after interaction are transformed from the preset crack tip to the middle of the preset crack. A large approach angle results in a high possibility of the crack restart point at the middle of the preset crack.

4. Criterion of Crack Restart Point after Intersection

4.1. Traditional Criterion of Restarting Crack after Crack Intersection

The classical fracture toughness criterion was mainly used to predict the fracture propagation in the concrete. If the equivalent SIF, Ke is greater than the fracture toughness of the concrete, KIc, then the crack tends to propagate. The equivalent SIF Ke is calculated as [28]
K e = cos α 2 ( K I cos 2 α 2 3 K II 2 sin α )
where KI and KII represent the SIFs for mode I and II cracks. The calculation of KI and KII is introduced in the next section. α is the fracture propagation angle and is defined in the local polar coordinate system at the fracture tip. In accordance with the extremum problem on circumferential stress σθ, the angle of crack extension can be calculated as follows [28,29,30].
K I sin α + K II ( 3 cos α 1 ) = 0
or
α = 2 arctan 1 4 ( K I K II ± ( K I K II ) 2 + 8 )
The determinations of the KI and KII values of the crack tip are keys to predict the crack propagation after interactions.

4.2. Improved Criterion of Restarting Crack after Crack Intersection

A conventional SIF criterion of crack propagation is mainly considered when the reinitiation point is still at the crack tip after the intersection of cracks. However, the experimental results show that the restart point of the crack is not only at the crack tip but also at the point on the surface of preset crack. The extended Renshaw and Pollard criterion [31] is considered to be the crack propagation criterion, which assumes that the crack can cross the pre-existing natural fracture if the stress near the crack tip on the opposite side of the interfaces, which is obtained from maximum circumferential stress criterion, is adequate to reinitiate a new fracture. Thus, the improved criterion of the crack propagation after interaction is proposed by combining the equivalent SIF criterion and the maximum circumferential stress criterion, as follows:
  • When KeKIc and σmax < ft, the crack will restart at the preset crack tip;
  • When Ke < KIc and σmaxft, the crack will restart at the point on the surface of the preset crack;
  • When KeKIc and σmaxft, the crack will restart at the crack tip or at the point on the surface of the preset crack or both occur.
where Ke is the equivalent SIF of the preset crack tip; KIc is the fracture toughness; σmax is the maximum stress on the upper surface of the preset crack; ft is the tensile strength.

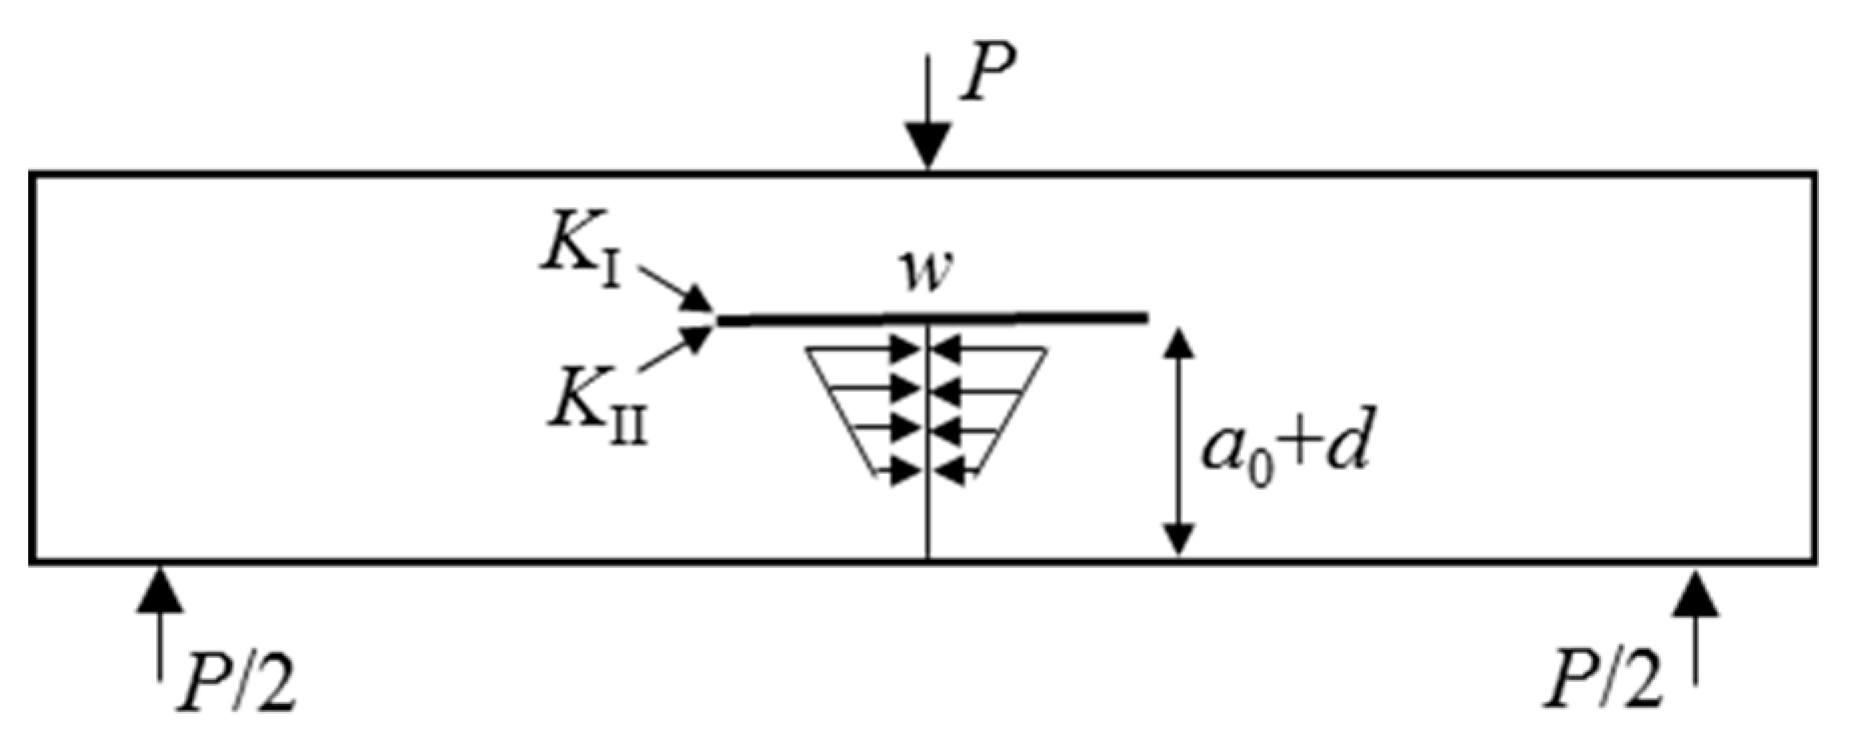
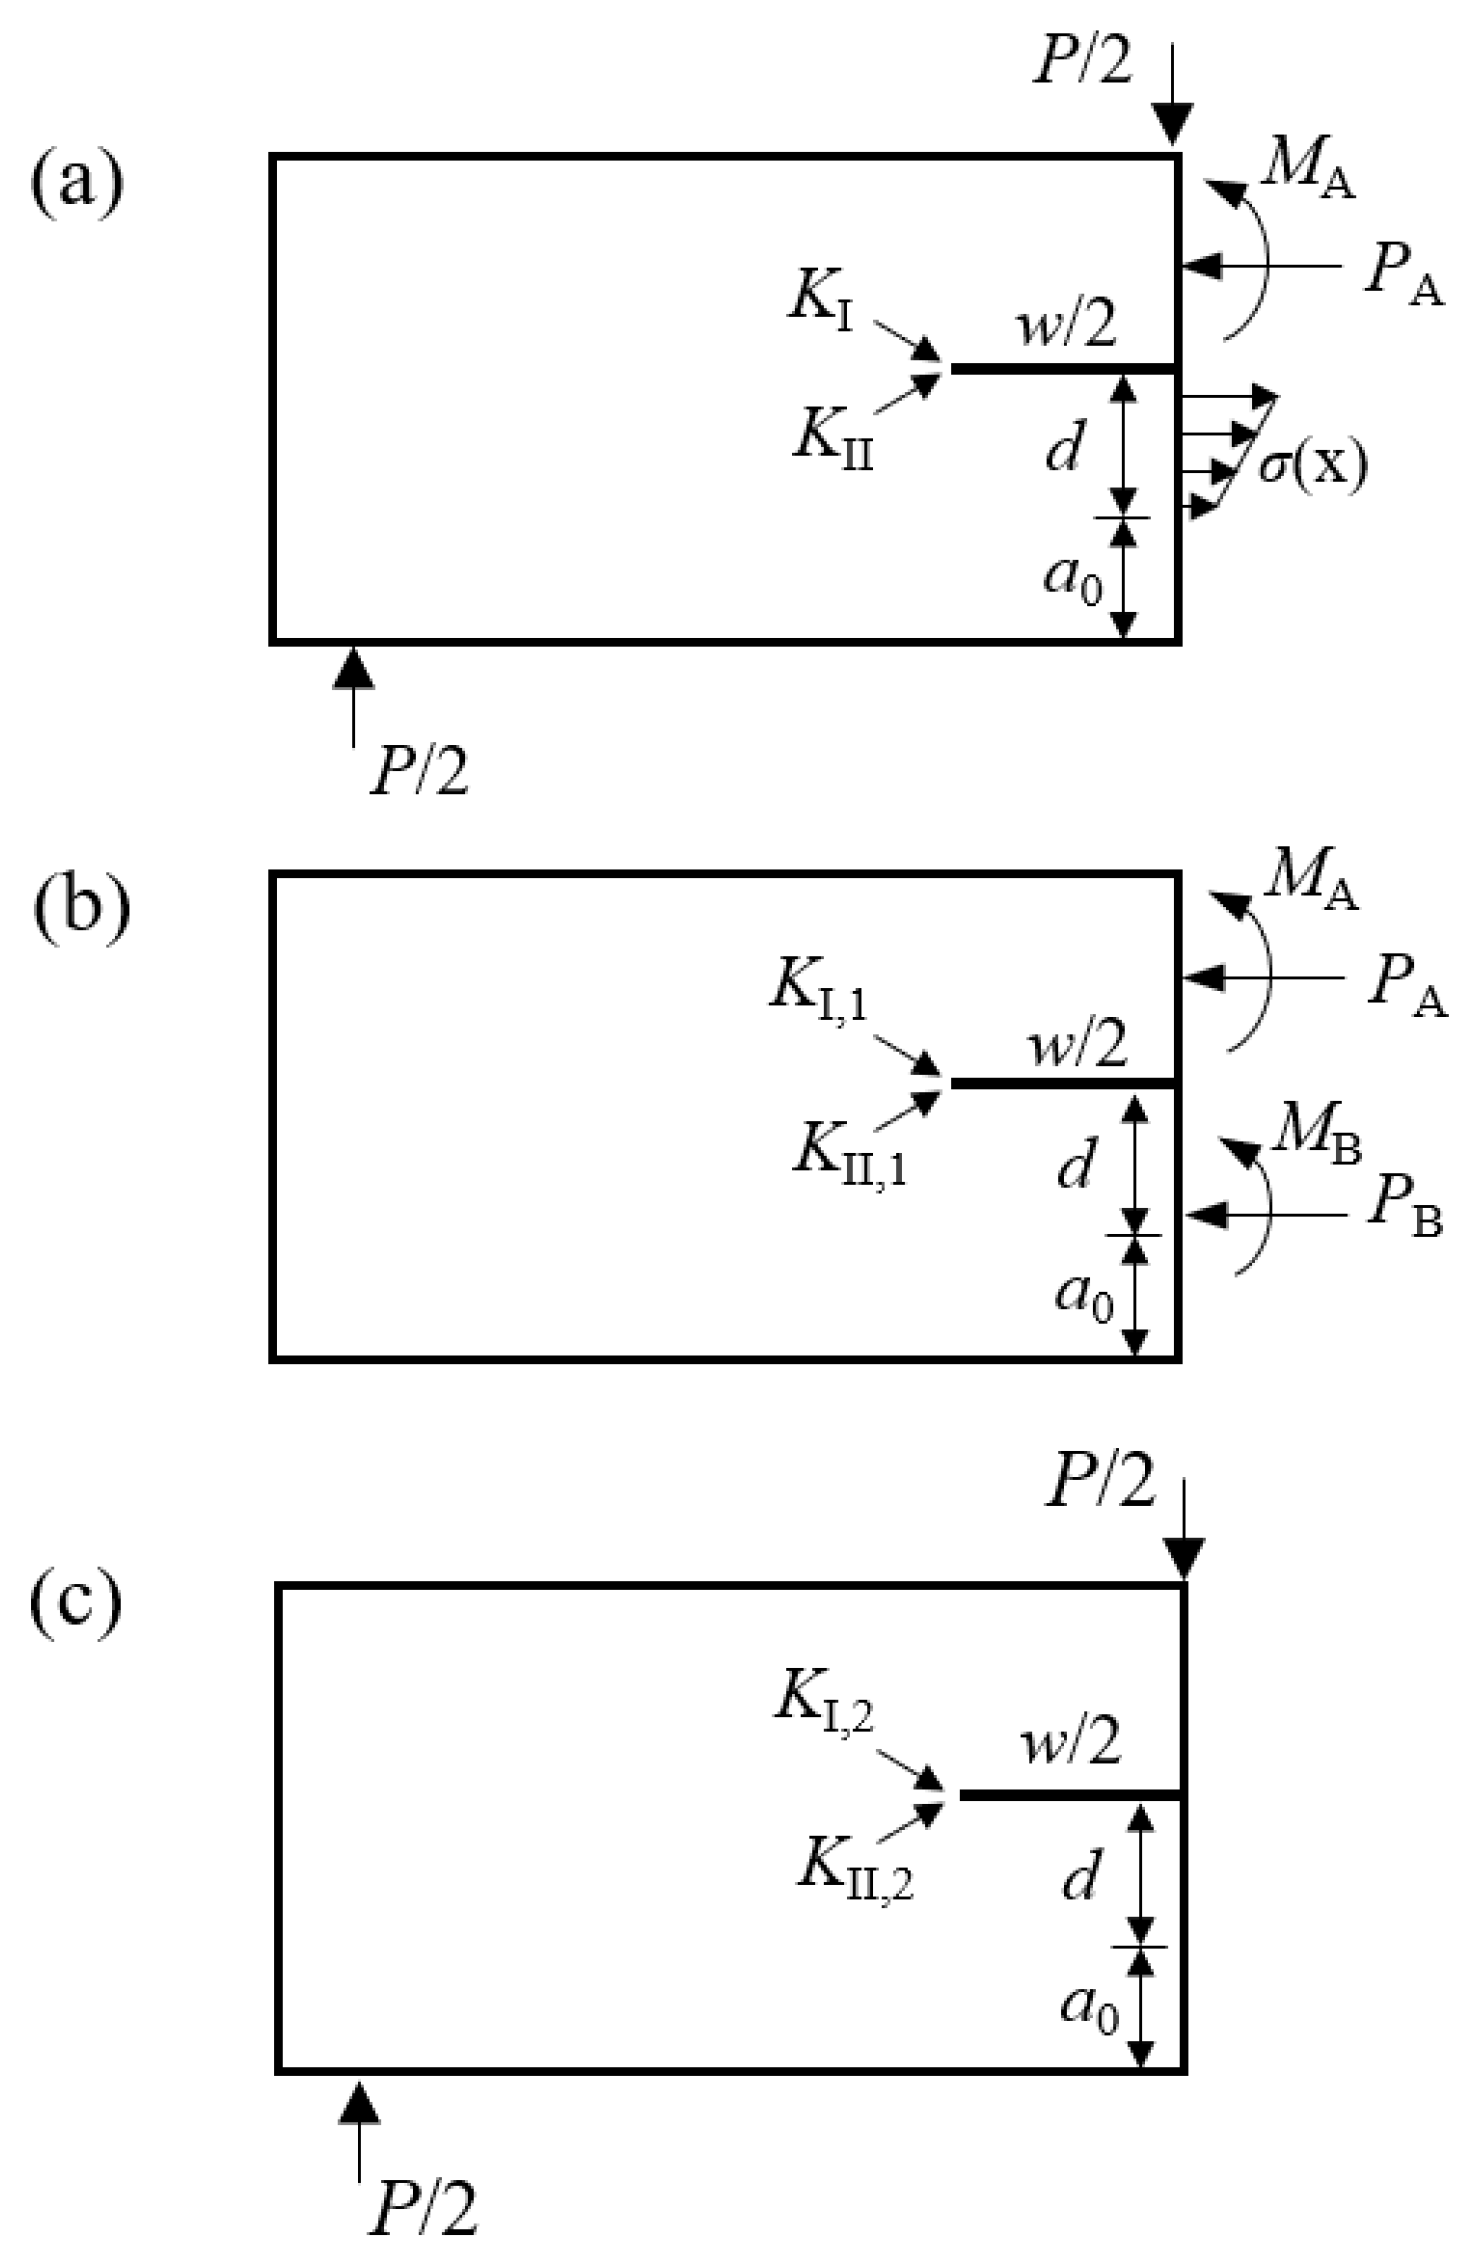
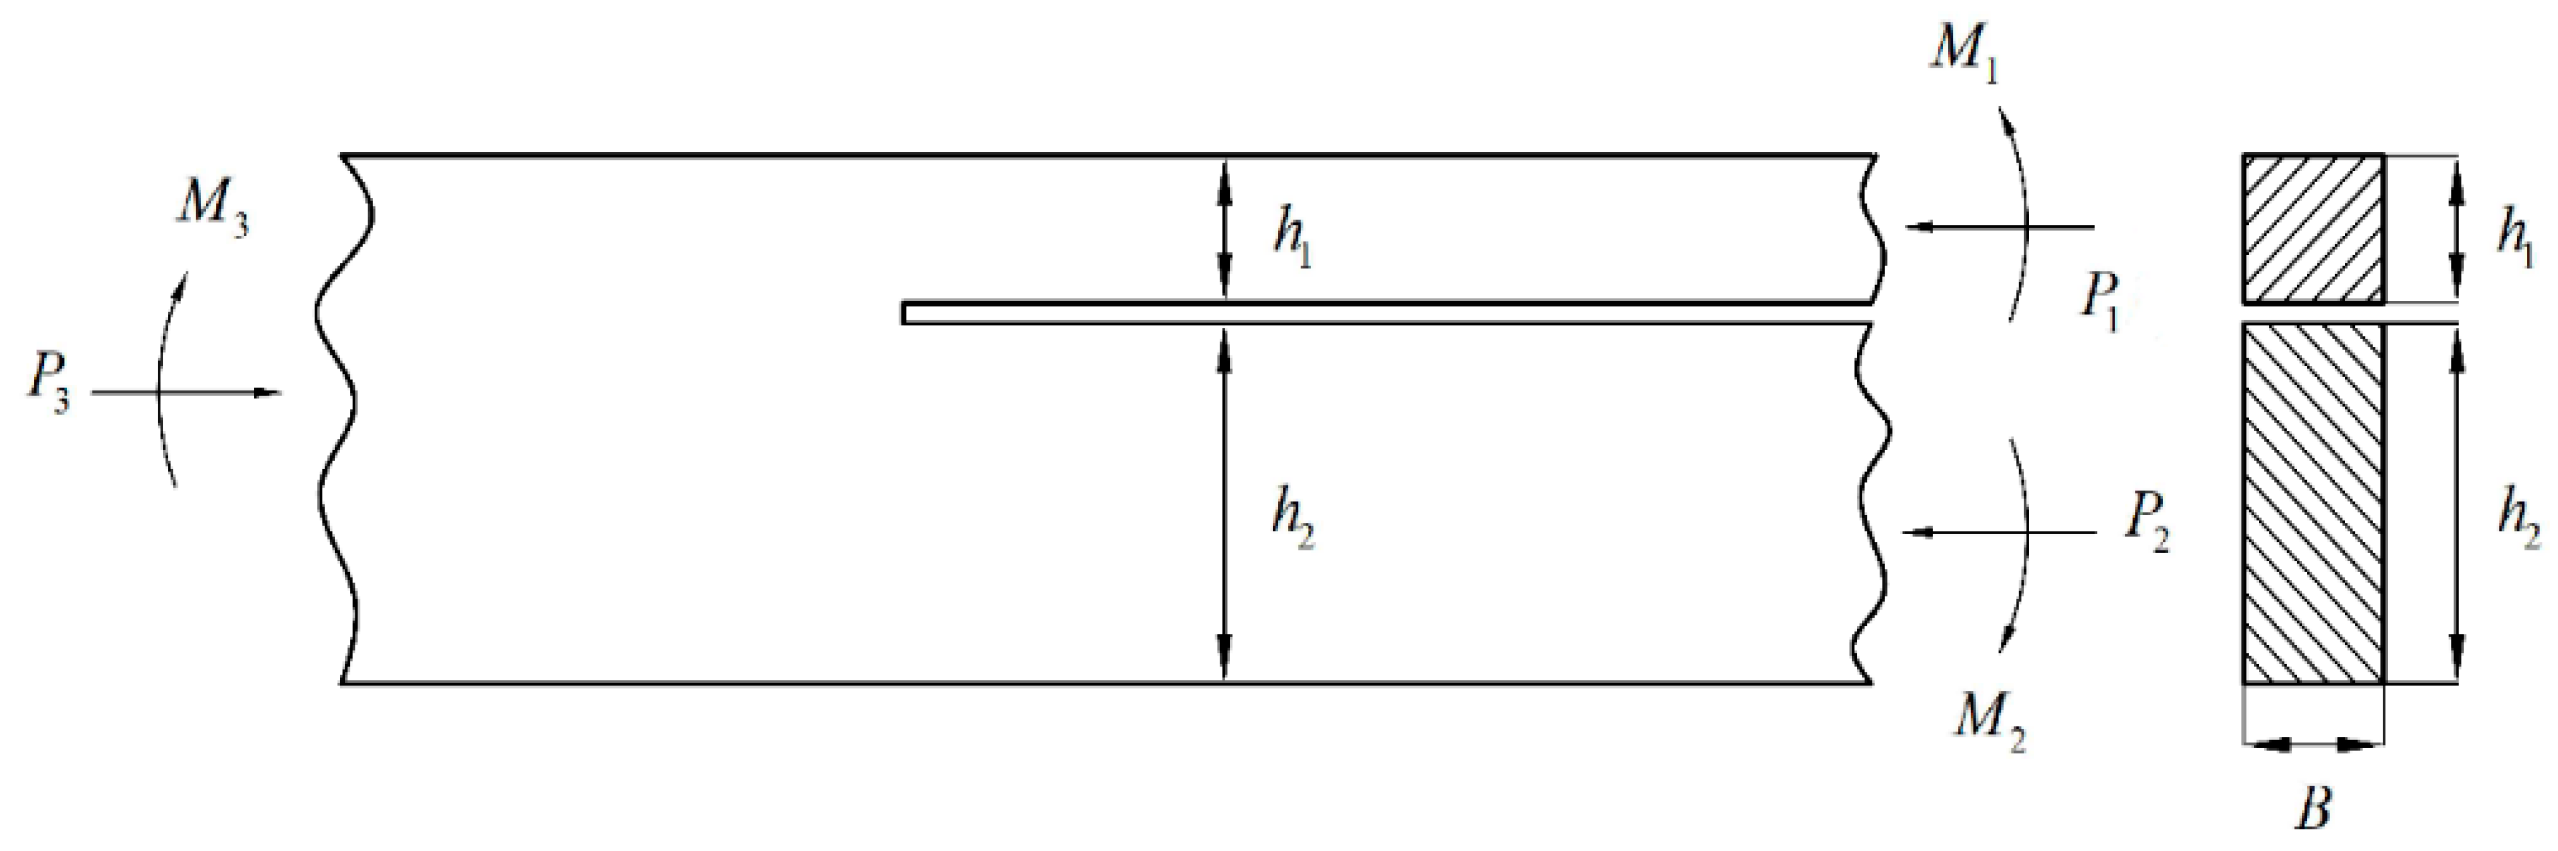
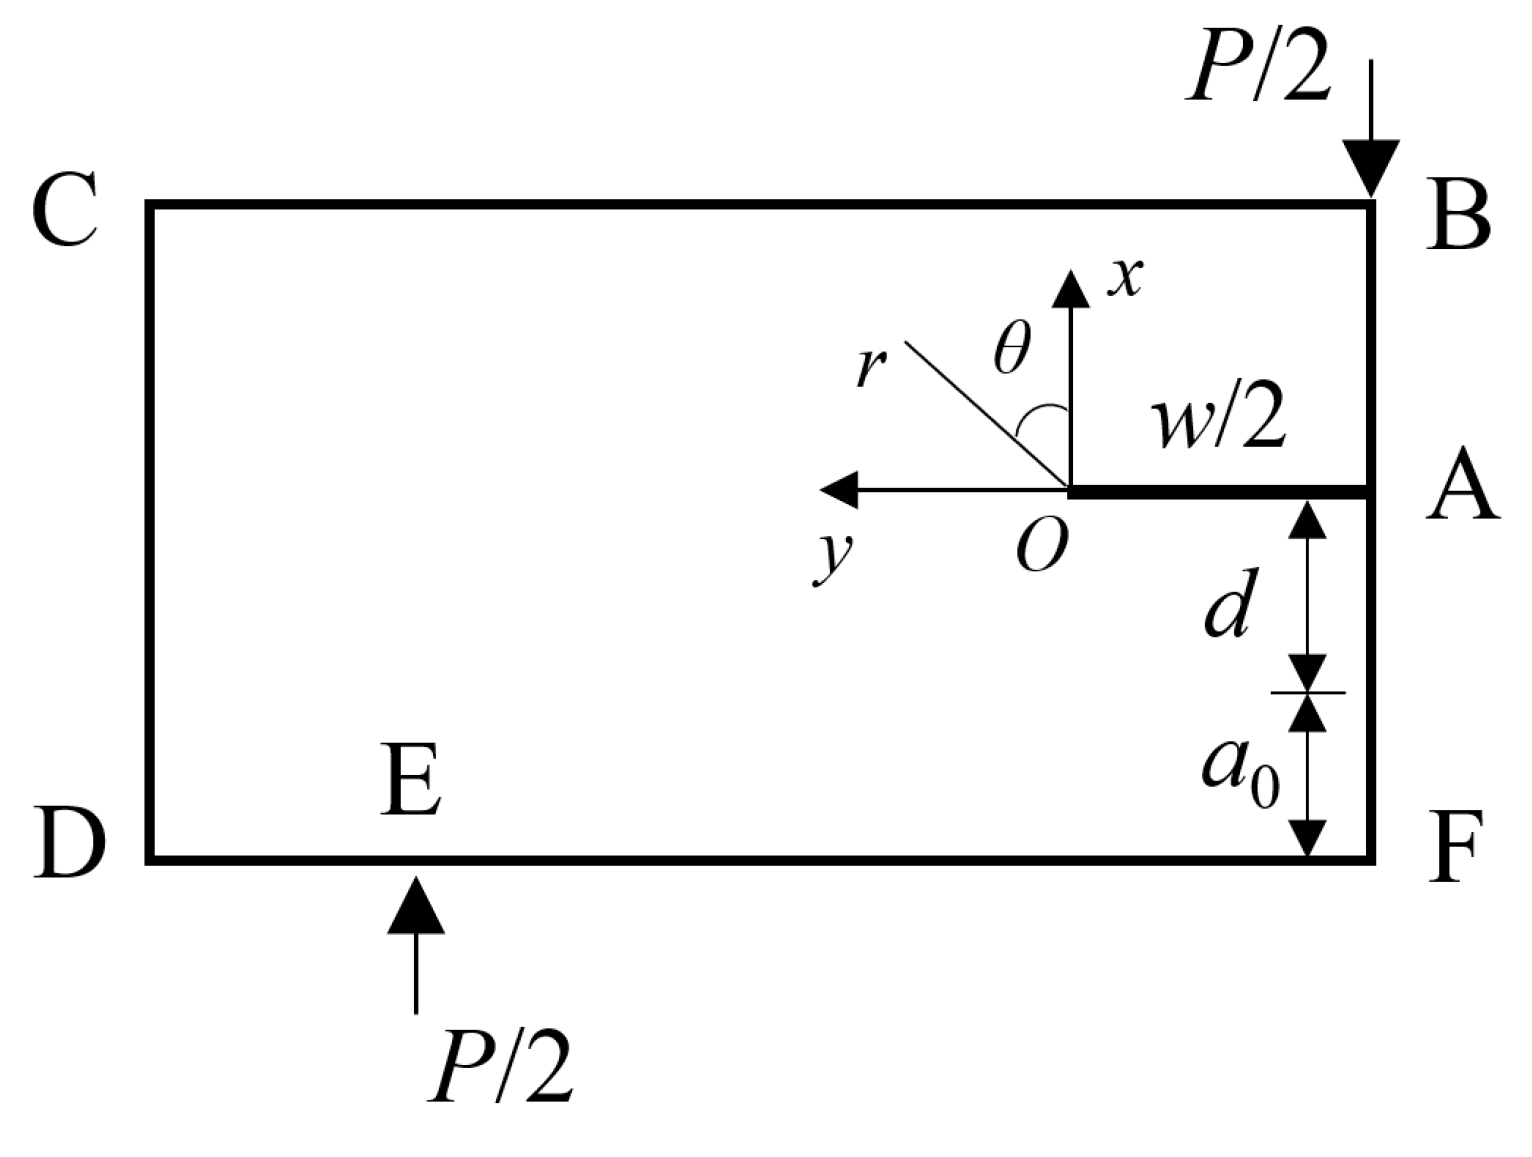
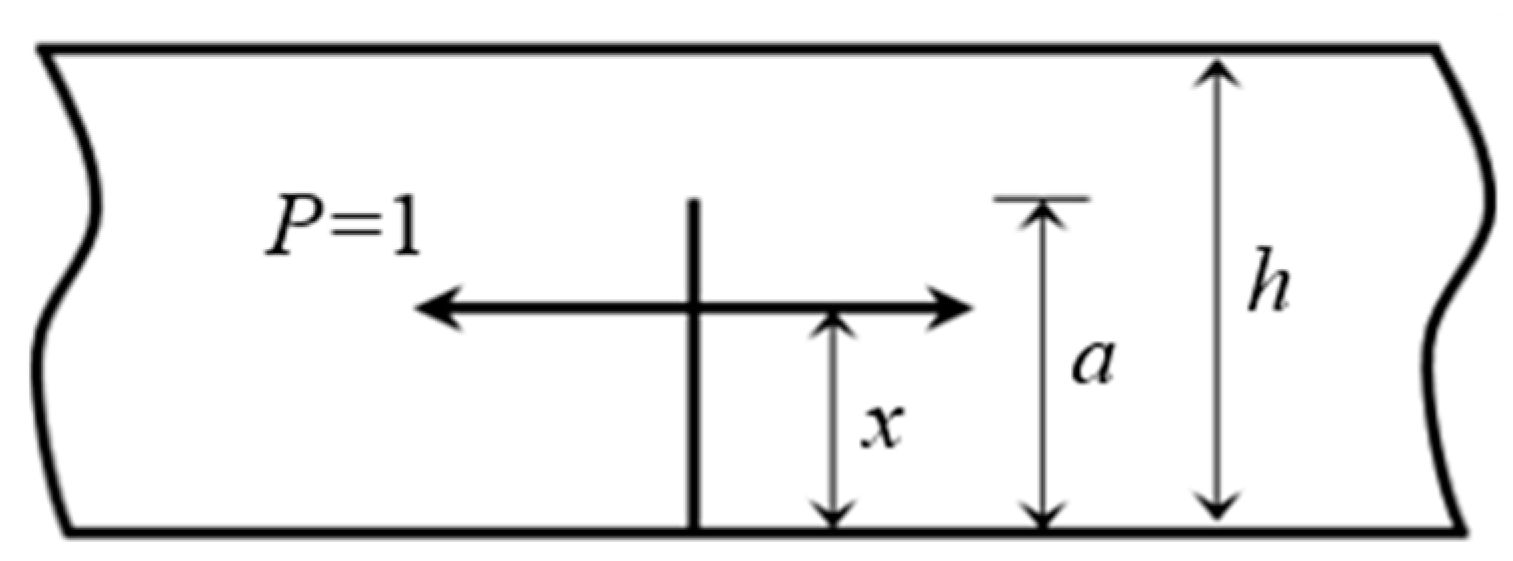
4.3. Determination of the SIF of the Preset Crack Tip

Figure 13 shows the forces of the notched concrete beam with the preset crack in the center, which include the applied mid-span load P, support reaction P/2, and cohesive stress in the FPZ σ(x). The load applied on the half concrete beam is analyzed, as shown in Figure 14a, to simplify the calculation of SIF of the preset crack tip induced by external forces. On basis of the principle of superposition for SIFs [32], SIFs KI, and KII can be obtained by adding KI,1 and KI,2 and KII,1 and KII,2, respectively, as shown in Equation (4).
{ K I = K I , 1 + K I , 2 K I I = K I I , 1 + K I I , 2
As shown in Figure 14b, KI,1 and KI,2 are SIFs produced by two parts: Part 1, force PB and moment MB generated by cohesive stress; Part 2, internal force PA and moment MA derived from the force and moment equilibrium principle, as shown in Equations (5) and (6). Figure 14c shows that KII,1 and KII,2 are SIFs caused by half of the mid-span load P/2 and support reaction P/2.
{ P A + P B = 0 M A + M B 1 2 P B H P S 4 = 0
or
{ P A = P B M A = M B + P S 4 + P B H 2
Therefore, the calculation of the SIFs KI and KII at the crack tip is transformed into calculating KI,1 and KI,2 and KII,1 and KII,2, respectively.
In accordance with the calculation in the SIF handbook [33], as shown in Figure 15, KI,1 and KII,1 can be determined from Equations (7) and (8).
{ K I , 1 = ( P / B ) 2 h f ( η ) cos ω ( η ) + ( M / B ) 2 h 3 g ( η ) sin [ ω ( η ) + γ ( η ) ] K I I , 1 = ( P / B ) 2 h f ( η ) sin ω ( η ) ( M / B ) 2 h 3 g ( η ) cos [ ω ( η ) + γ ( η ) ]
where η = h1/h2.
{ P = P 1 η 1 + η P 3 6 η 2 ( 1 + η ) 3 M 3 h , M = M 1 ( η 1 + η ) 3 M 3 f ( η ) = ( 1 + 4 η + 6 η 2 + 3 η 3 ) 1 / 2 , g ( η ) = 2 3 ( 1 + η 3 ) 1 / 2 ω ( η ) = 0.909 0.052 η , γ ( η ) = sin 1 [ 6 η 2 ( 1 + η ) f ( η ) g ( η ) ]
The forces acting on the specimens in Figure 14b are introduced into Equations (7) and (8), where P1 = PA = −PB, P3 = 0, M1 = MA, M2 = −MB, and M3 = 0.
For determining PB and MB induced by the cohesive stress, the bilinear softening model of the concrete proposed by Petersson [34] is used to calculate the magnitude of cohesive stress σ transmitted in the FPZ, which can be shown as follows:
σ ( w i ) = { f t w i ( f t σ s ) / w s   0 w i < w s σ s ( w i w 0 ) / ( w s w 0 ) w s w i < w 0 0 w 0 w i
When the propagating crack reaches the preset crack, wi is the COD of the crack at y = i mm (I = 0, 1, ..., d), which can be obtained by the DIC method mentioned in Section 2.4. As shown in Figure 16, σs and ws are the values of stress and displacement at the turning point of the curve, respectively. w0 is the value of COD when the transmitted stress decreases to 0 and follows Petersson’s proposed value [34], as shown as follows,
{ σ s = f t 3 w s = 0.8 G f f t w 0 = 3.6 G f f t
where ft and Gf are the material characteristics, which are measured from standard TPB specimen without central preset crack on fracture path. As mentioned above, ft and Gf are equal to 3.5 MPa and 110 N/mm, respectively.
In accordance with the cohesive stress distribution and equivalent principles of force system, resultant force PB and bending moment MB can be obtained as follows:
P B = i = 0 d σ ( w i ) B
M B = i = 1 n σ ( w i ) ( i + a 0 a 0 + d 2 ) B
The boundary collocation method [35] is used to determine the KI,2 and KII,2 values of the preset crack tip. By choosing m points on the boundary outside the crack and combining 2m boundary conditions at m points into a 2m-order linear equation system, the undetermined coefficients Xj and Yj are solved, and KI,2 and KII,2 are obtained.
φ = P W B i = 1 2 m { X j ( r i W ) j 2 + 1 [ cos ( j 2 1 ) θ i + j 2 + ( 1 ) j j 2 + 1 cos ( j 2 + 1 ) θ i ] + Y j ( ( r i W ) j 2 + 1 ) [ sin ( j 2 1 ) θ i + j 2 ( 1 ) j j 2 + 1 sin ( j 2 + 1 ) θ i ] }
φ n = P W j = 1 2 m { X j ( r i W ) j 2 [ cos ( j 2 θ i ω i ) j 2 cos ( ( j 2 2 ) θ i + ω i ) + ( j 2 + ( 1 ) j ) cos ( j 2 θ i + ω i ) ] + Y j ( r i W ) j 2 [ sin ( j 2 θ i ω i ) j 2 sin ( ( j 2 2 ) θ i + ω i ) + ( j 2 ( 1 ) j ) sin ( j 2 θ i + ω i ) ] }
{ φ ( r i , θ i ) = φ 0 ( r i , θ i ) φ ( r i , θ i ) n = φ 0 ( r i , θ i ) n   ( i = 1 , 2 , , m )
where φ and φ n are stress function and its normal derivative, respectively; φ(ri, θi) and φ ( r i , θ i ) n are the increment of external surface moment and negative value of tangential component of resultant force of external force from starting point to point (ri, θi), respectively; and φ0(ri, θi) and φ 0 ( r i , θ i ) n are the boundary values of φ(ri, θi) and φ ( r i , θ i ) n , respectively. In addition, r i = x i 2 + y i 2 , θ i = tg 1 y i x i , and ωi is the angle between the outer normal to the boundary and the x-axis. Table 4 lists the boundary conditions, as shown in Figure 17.
Therefore, KI,2 and KII,2 can be calculated by the following expressions:
{ K I , 2 = lim r 0 2 π r σ y y ( x , 0 ) = 2 π W P B X 1 K II , 2 = lim r 0 2 π r σ x y ( x , 0 ) = 2 π W P B Y 1

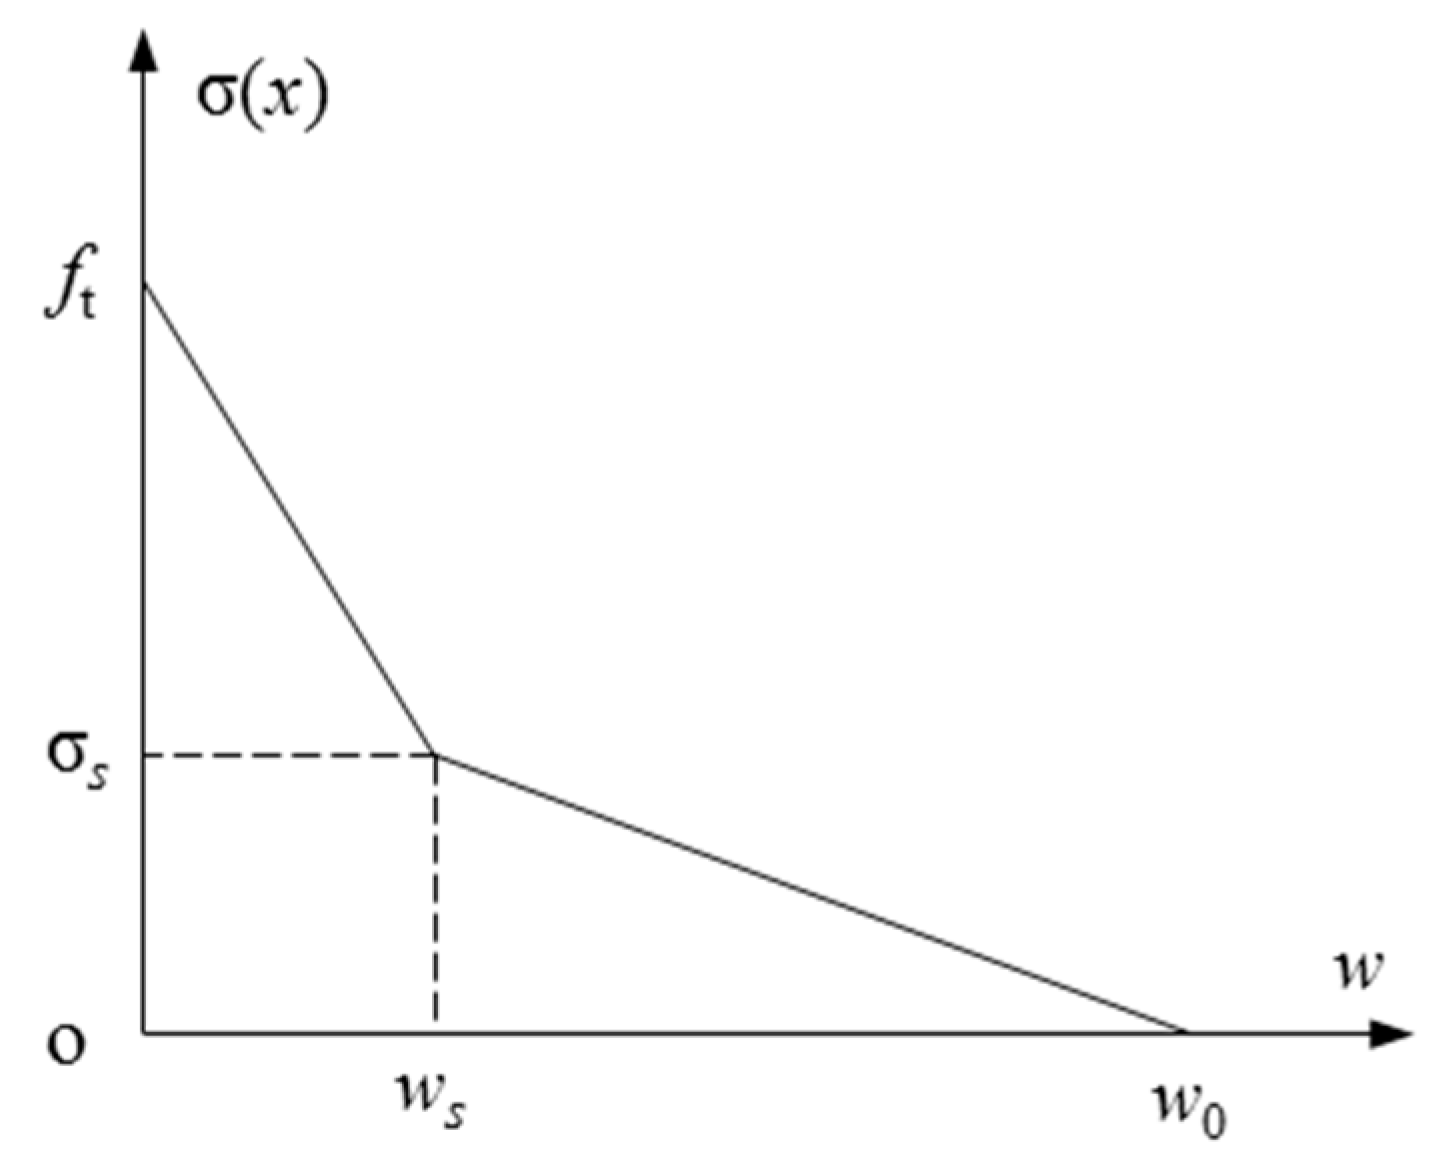
4.4. Determination of the Stress on the Preset Crack Upper Surface

The stress on the upper surface of preset crack has a strong relationship with the strain on the upper surface, when the approach angle is close to 90°. The distribution of stress is equal to the distribution of strain on the upper surface when two cracks interact. The distribution of strain can be evaluated by DIC technology. In our experiment, the strain on the upper surface of the preset crack can be divided into three distributions whether the reinitiation point is at the preset crack tip or on the upper surface of the preset crack, as shown in Figure 18.
For the beam with the restart point at the middle point of the preset crack, the transform of the stress distribution on the upper surface are shown in Figure 18a–c. For the beam with the restart point at the tip of the preset crack, the transform of the stress distribution on the upper surface is shown in Figure 18d–f. Figure 18a,d shows no evident maximum point for the distribution of strain before the propagating crack reaches the preset crack. Figure 18b,e shows the maximum point at the middle point of the upper surface of the preset crack (near the propagating crack tip where two cracks interact) when two cracks interact. Figure 18c,f shows the restart point on the upper surface of the preset crack and at the preset crack tip respectively, after two cracks interact.
Therefore, the maximum stress σmax on the upper surface is at the middle point of the upper surface near the propagating crack tip when two cracks interact. In accordance with the maximum circumferential stress criterion, the maximum stress σmax can be obtained by calculating the SIF of the propagating crack tip when two cracks interact. At that time, the stress field around the propagating crack tip can be obtained using Equation (17) [36]. If the maximum principal stress σmax reaches the concrete tensile strength ft, then a new fracture will initiate on the opposite side of the interface.
{ σ r = K I 2 ( 2 π r ) 1 / 2 ( 3 cos θ ) cos θ 2 σ θ = K I 2 ( 2 π r ) 1 / 2 ( 1 + cos θ ) cos θ 2 τ r θ = K I 2 ( 2 π r ) 1 / 2 sin θ cos θ 2
where KI is the SIF at the propagating crack tip induced by the vertical loading force and can be calculated using Equation (18); (r, θ) are the local polar coordinate systems defined at the crack tip.
K I = K I ( P , a ) + K I c
where K I ( P , a ) is the SIF induced by loading force and calculated using Equations (19) and (20). K I c is the SIF induced by the cohesion in the crack and can be calculated using the DIC and Equation (23).
K I ( P , a ) = 3 P S a 2 H 2 B F ( a H )
F ( a H ) = 1.99 a / H ( 1 a / H ) [ 2.15 3.93 a / H + 2.7 ( a / H ) 2 ] ( 1 + 2 a / H ) ( 1 a / H ) 3 / 2
For the notched beam subjected to a pair of tensile unit point forces in the crack at a distance x from crack mouth as shown in Figure 19, the SIF at the tip of crack is written as follows,
K I = 2 π a F ( x / a , a / h )
where the Green’s function F ( x / a , a / h ) is as follows:
F ( x a , a h ) = 3.52 ( 1 x a ) ( 1 a h ) 3 / 2 4.35 5.28 x a ( 1 a h ) 1 / 2 + { 1.3 0.3 ( x a ) 3 / 2 [ 1 ( x a ) 2 ] 1 / 2 + 0.83 1.76 x a } [ 1 ( 1 x a ) a h ]
Therefore, if the distribution of the loading force along the crack surface is determined, the SIF created by loading force applied in the crack can be calculated with the integral method.
The SIF induced by cohesive force can be calculated by Equations (23) and (24), the continuously distributed force of cohesive force was discretized into N concentrated forces and the SIF induced by cohesive force was transformed to the SIF induced by N concentrated forces as shown in Figure 20. Moreover, the concentrated force Pi was obtained by DIC technology based on the bilinear softening model.
K I c = a 0 a 2 σ ( x ) π a F 1 ( x a , a D ) d x = i = 1 N 2 P i ( a a 0 ) N π a F 1 ( x i a , a D )
F 1 ( x i a , a D ) = 3.52 ( 1 x i / a ) ( 1 a / D ) 3 / 2 4.35 5.28 x i / a ( 1 a / D ) 1 / 2 + [ 1.30 0.30 ( x i / a ) 3 / 2 1 ( x i / a ) 2 + 0.83 1.76 x i a ] [ 1 ( 1 x i a ) a D ]
Notably, the computational formulas of the SIF at the preset crack tip and the maximum stress on the upper surface cannot be obtained when the approach angle is less than 90°. In this case, these formulas are calculated by means of the finite element method. This topic will be discussed and investigated in the follow-up work.

4.5. Comparison of the Predicted and Experimental Results

Table 5 shows the predicted results of the crack restart point on the upper surface of the preset crack after interaction. Only a slight difference between the predicted results of the restart point of the crack and the experimental results is observed. The difference in the results of the restart point can be ignored by considering the randomness and divergence of the concrete properties. The improved criterion has great accuracy in predicting the crack restart point on the upper surface after crack intersection.

5. Conclusions

Crack propagation experiments in cracked concrete beams were presented in this work. The crack interaction behavior was directly observed by using the DIC technology. The experimental results of the test beams with different types of preset cracks were analyzed, and the improved propagation criterion of the crack reinitiation after interaction was proposed. The improved criterion in the crack reinitiation prediction after interaction was accurately evaluated by comparing the predicted and the experimental outcomes. The following conclusions can be drawn according to the experimental results:
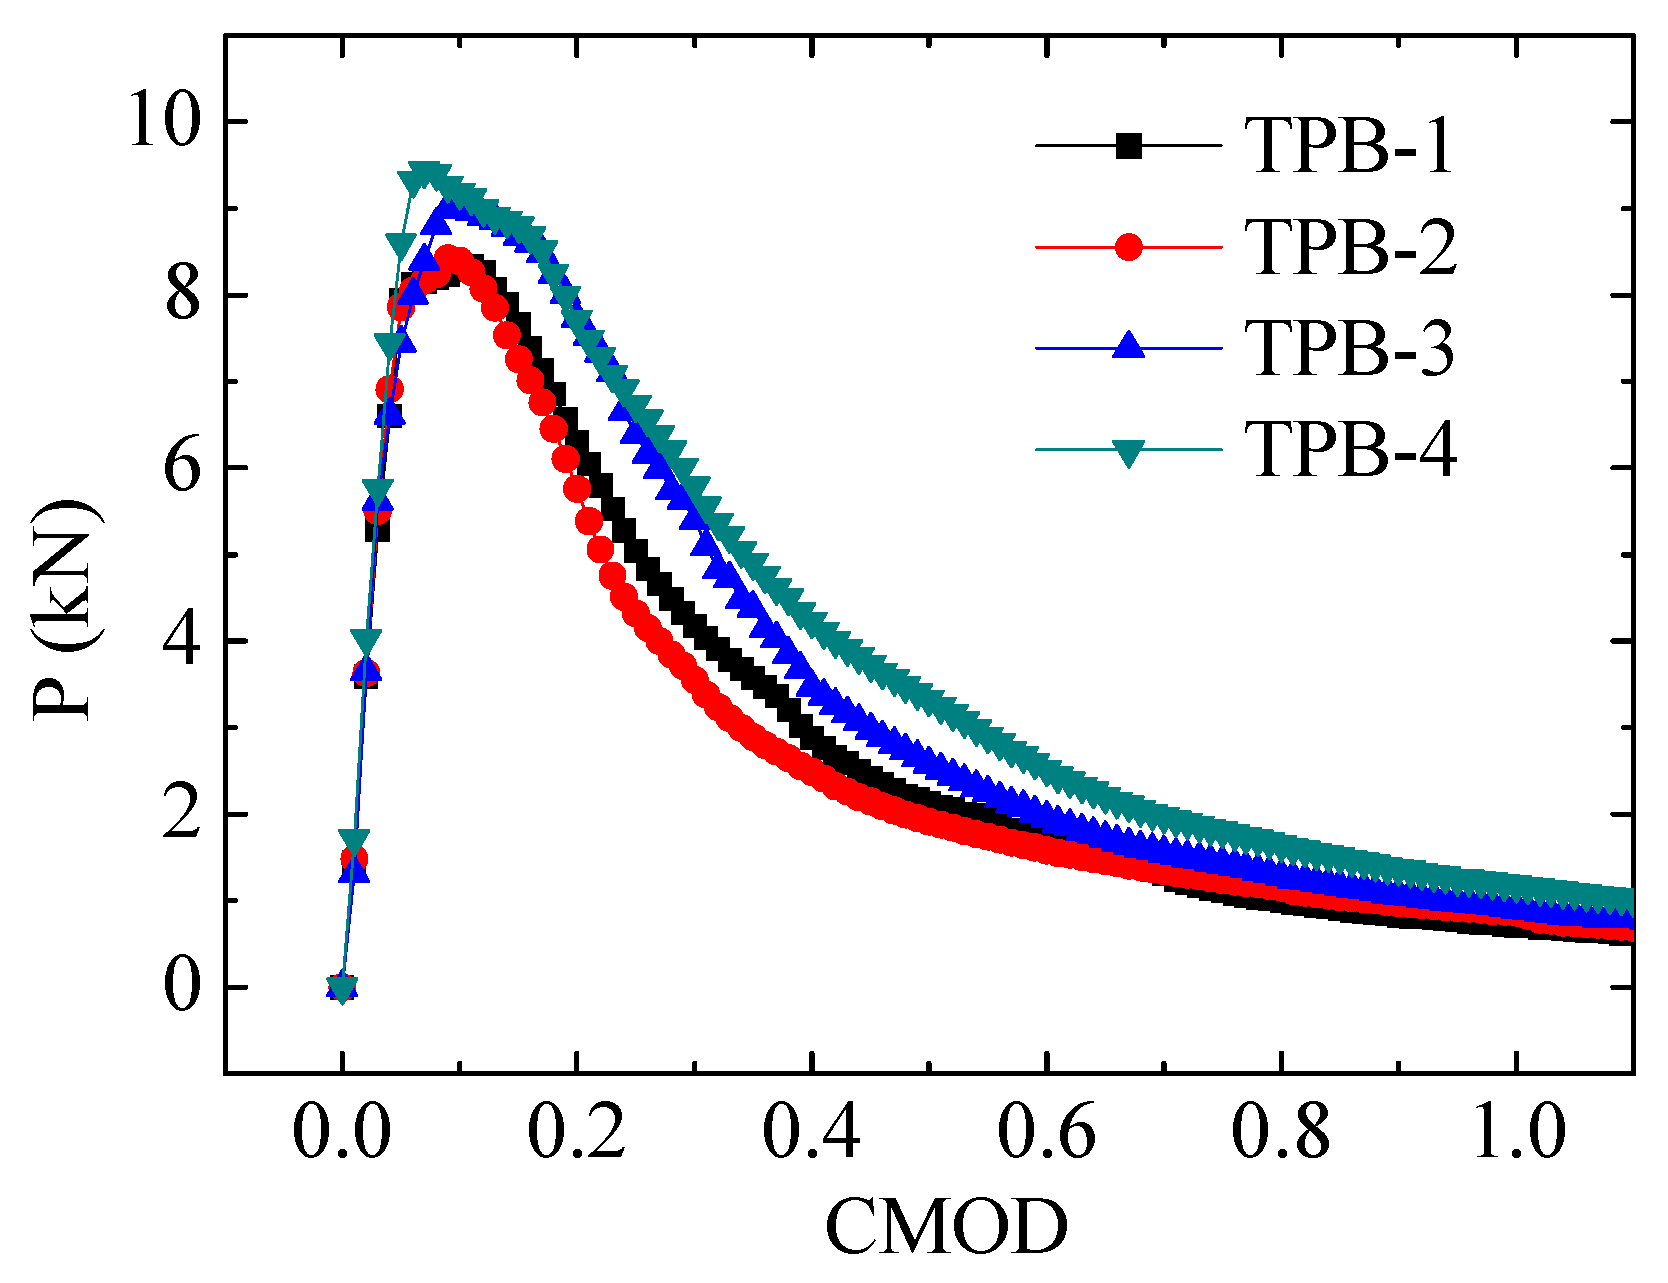
  • The edge crack of the test beams with different distances between the preset and the edge cracks vertically crosses through the preset crack when the relative distance was sufficiently long. The relative distance of the two cracks greatly influenced the peak load of the P-CMOD curve. The peak load was high when the relative distance was long;
  • The edge crack of the test beams with different preset crack lengths vertically crosses through the preset crack when such length was sufficiently long. The preset crack length greatly influenced the critical CMOD of the P-CMOD curve. The critical CMOD was high when the preset crack length was long;
  • The edge crack of the test beams with different approach angles vertically crosses through the preset crack when the approach angle was close to 90°. The approach angle greatly influenced crack propagation path and the carrying capacity. Such a path was close to upright and the peak load was high when the approach angle was large;
  • The improved crack initiation criterion for predicting the crack propagation path after interaction was proposed by combining the maximum circumferential stress theory and fracture toughness criterion. The predicted results were compared with the experimental outcomes of the reinitiation after crack interaction. Results indicated that the improved criterion accurately predicted the aforementioned path after crack interaction;
  • The DIC technology can effectively observe the crack intersection in concrete by this work. The accuracy crack opening displacement obtained by DIC technology indicated that it had good application prospects in investigating the complex problem of multiple crack propagation processes.

Author Contributions

Conceptualization, S.W. and S.H.; methodology, S.W. and S.H.; software, S.W. and S.H.; validation, S.H.; formal analysis, S.W.; investigation, S.W.; data curation, S.W.; writing—original draft preparation, S.W.; writing—review and editing, S.W. and S.H.; funding acquisition, S.W. and S.H.

Funding

This research was funded by the National Key Research and Development Project of China, 2016YFC0401902 and the National Natural Science Foundation of China, 51739008, 51527811.

Acknowledgments

This paper was funded by The National Key Research and Development Project of China (2016YFC0401902). The authors also acknowledge the financial supports for this research from the National Natural Science Foundation of China (Grant Nos. 51739008, 51527811).

Conflicts of Interest

The authors declare no conflict of interest.

References

  1. Beugelsdijk, L.J.L.; de Pater, C.J.; Sato, K. Experimental hydraulic fracture propagation in a multi-fractured medium. In Proceedings of the SPE Asia Pacific Conference on Integrated Modelling for Asset Management, Yokohama, Japan, 25–26 April 2000. [Google Scholar]
  2. Blanton, T.L. An experimental study of interaction between hydraulically induced and pre-existing fractures. In Proceedings of the SPE Unconventional Gas Recovery Symposium, Pittsburgh, PA, USA, 16–18 May 1982. [Google Scholar]
  3. Chen, Z.; Jeffrey, R.; Zhang, X.; Kear, J. Finite Element Simulation of a Hydraulic Fracture Interacting with a Natural Fracture. In Proceedings of the SPE Asia Pacific Unconventional Resources Conference and Exhibition, Brisbane, Australia, 9−11 November 2015. Paper SPE-176970-MS. [Google Scholar]
  4. Hubbert, M.K.; Willis, D.G. Mechanics of hydraulic fracturing. Trans. Soc. Pet. Eng. AIME 1957, 210, 153–163. [Google Scholar]
  5. Xu, S.; Reinhardt, H.W. Determination of double- K criterion for crack propagation in quasi-brittle fracture, Part III: Compact tension specimens and wedge splitting specimens. Int. J. Fract. 1999, 98, 179–193. [Google Scholar] [CrossRef]
  6. Xu, S.; Reinhardt, H.W. A simplified method for determining double-K fracture parameters for three-point bending tests. Int. J. Fract. 2000, 104, 181–209. [Google Scholar] [CrossRef]
  7. Mishin, V.M.; Sarrak, V.I. Critical local tensile stress as criterion of delayed brittle failure. Strength Mater. 1985, 17, 348–352. [Google Scholar] [CrossRef]
  8. Brizmerm, V.; Kligerman, Y.; Etsion, I. The effect of contact conditions and material properties on the elasticity terminus of a spherical contact. Int. J. Solids Struct. 2006, 43, 5736–5749. [Google Scholar] [CrossRef] [Green Version]
  9. Guo, H.; Aziz, N.I.; Schmidt, L.C. Rock cutting study using linear elastic fracture mechanics. Eng. Fract. Mech. 1992, 41, 771–778. [Google Scholar] [CrossRef]
  10. Wong, R.H.C.; Lin, P. Numerical study of stress distribution and crack coalescence mechanisms of solid containing multiple holes. Int. J. Rock Mech. Min. Sci. 2015, 79, 41–54. [Google Scholar] [CrossRef]
  11. Darby, M.I. A fracture mechanics approach to the failure of graphite in laboratory tests. Int. J. Fract. 1976, 12, 745–757. [Google Scholar]
  12. Lei, W.S. Fracture probability of a randomly oriented microcrack under multi-axial loading for the normal tensile stress criterion. Theor. Appl. Fract. Mech. 2016, 85, S016784421530166X. [Google Scholar] [CrossRef]
  13. Jenq, Y.S.; Shah, S.P. A Fracture toughness criterion for concrete. Eng. Fract. Mech. 1985, 21, 1055–1069. [Google Scholar] [CrossRef]
  14. Margolin, B.Z.; Shvetsova, V.A.; Gulenko, A.G.; Kostylev, V.I. Application of a new cleavage fracture criterion for fracture toughness prediction for RPV steels. Fatigue Fract. Eng. Mater. Struct. 2010, 29, 697–713. [Google Scholar] [CrossRef]
  15. Xu, Y.; Dai, F.; Zhao, T.; Xu, N.-W.; Liu, Y. Fracture toughness determination of cracked chevron notched Brazilian disc rock specimen via griffith energy criterion incorporating realistic fracture profiles. Rock Mech. Rock Eng. 2016, 49, 3083–3093. [Google Scholar] [CrossRef]
  16. Gu, H.; Weng, X.; Lund, J.; Mack, M.; Ganguly, U.; Suarez-Rivera, R. Hydraulic fracture crossing natural fracture at nonorthogonal angles: A criterion and its validation. SPE Prod. Oper. 2012, 27, 20–26. [Google Scholar] [CrossRef]
  17. Fu, W.; Ames, B.C.; Bunger, A.P.; Savitski, A.A. Impact of partially cemented and non-persistent natural fractures on hydraulic fracture propagation. Rock Mech. Rock Eng. 2016, 49, 4519–4526. [Google Scholar] [CrossRef]
  18. Hassan, F.; Hossain, M.M.; Sarmadivaleh, M. Numerical and experimental investigation of the interaction of natural and propagated hydraulic fracture. J. Nat. Gas Sci. Eng. 2017, 37, 409–424. [Google Scholar] [Green Version]
  19. Wang, W.; Olson, J.E.; Prodanovi, M.; Schultz, R.A. Interaction between cemented natural fractures and hydraulic fractures assessed by experiments and numerical simulations. J. Pet. Sci. Eng. 2018, 167, 506–516. [Google Scholar] [CrossRef]
  20. Chu, T.C.; Ranson, W.F.; Sutton, M.A. Applications of digital image correlation techniques to experimental mechanics. Exp. Mech. 1985, 25, 232–244. [Google Scholar] [CrossRef]
  21. Almeida, O.D.; Lagattu, F.; Brillaud, J. Analysis by a 3D DIC technique of volumetric deformation gradients: Application to polypropylene/EPR/talc composites. Compos. Part A Appl. Sci. Manuf. 2008, 39, 1210–1217. [Google Scholar] [CrossRef]
  22. Vogel, D.; Dudek, R.; Keller, J.; Michel, B. Combining DIC techniques and finite element analysis for reliability assessment on micro and nanoscale. In Proceedings of the 5th Electronics Packaging Technology Conference (EPTC 2003), Singapore, 12 December 2003. [Google Scholar]
  23. Tan, Y.Q.; Lei, Z.; Meng, G.; Li-yan, S. Investigation of the deformation properties of asphalt mixtures with DIC technique. Construct. Build. Mater. 2012, 37, 581–590. [Google Scholar]
  24. Helm, J.D. Digital image correlation for specimens with multiple growing cracks. Exp. Mech. 2008, 48, 753–762. [Google Scholar] [CrossRef]
  25. Li, D.; Huang, P.; Guo, X.; Zheng, X.; Lin, J.; Chen, Z. Fatigue crack propagation behavior of RC beams strengthened with CFRP under cyclic bending loads. Fatigue Fract. Eng. Mater. Struct. 2017, 41, 1–11. [Google Scholar] [CrossRef]
  26. Wu, Z.M.; Rong, H.; Zheng, J.J.; Xu, W.; Dong, W. An experimental investigation on the FPZ properties in concrete using digital image correlation technique. Eng. Fract. Mech. 2011, 78, 2978–2990. [Google Scholar] [CrossRef]
  27. Chen, H.; Su, R. Tension softening curves of plain concrete. Constr. Build Mater. 2013, 44, 440–451. [Google Scholar] [CrossRef] [Green Version]
  28. Erdoga, F.; Sih, G.C. On the crack extension in plates under plane loading and transverse shear. J. Basic Eng. Trans. ASME 1963, 85, 519–525. [Google Scholar] [CrossRef]
  29. Wang, X.L.; Shi, F.; Liu, C.; Lu, D.T.; Liu, H.; Wu, H.A. Extended finite element simulation of fracture network propagation in formation containing frictional and cemented natural fractures. J. Nat. Gas Sci. Eng. 2017, 50, 309–324. [Google Scholar] [CrossRef]
  30. Su, H.; Li, J.; Wen, Z.; Zhou, F. A bi-criteria combined evaluation approach for reinforcement effect of gravity dam with cracks. Int. J. Solids Struct. 2018, 147, 238–253. [Google Scholar] [CrossRef]
  31. Gu, H.; Weng, X.; Lund, J.B.; Mack, M.G.; Ganguly, U.; Suarez-Rivera, R. Hydraulic fracture crossing natural fracture at non-orthogonal angles, a criterion, its validation and applications. In Proceedings of the SPE Hydraulic Fracturing Technology Conference, The Woodlands, TX, USA, 24–26 January 2011. [Google Scholar]
  32. Aamodt, B.; Bergan, P.G. On the principle of superposition for stress intensity factors. Eng. Fract. Mech. 1976, 8, 437–440. [Google Scholar] [CrossRef]
  33. Murakami, Y.; Keer, L.M. Stress Intensity Factors Handbook; Pergamon Press: London, UK, 1989; Volume 3. [Google Scholar]
  34. Petersson, P.E. Crack Growth and Development of Fracture Zones in PLAIN Concrete and Similar Materials; Report TVBM-1006; Division of Building Materials, Lund Institute of Technology: Lund, Sweden, 1981. [Google Scholar]
  35. Cheung, Y.K.; Woo, C.W.; Wang, Y.H. The stress intensity factor for a double edge cracked plate by boundary collocation method. Int. J. Fract. 1988, 37, 217–231. [Google Scholar] [CrossRef]
  36. Gao, Y.C. Plane stress dynamic plastic field near a propagating crack tip. Int. J. Fract. 1987, 34, 111–129. [Google Scholar] [CrossRef]
Figure 1. Schematic view of three-point bending (TPB) beam with edge crack and preset crack.
Energies 12 03854 g001
Figure 2. Load force - crack mouth opening displacement (P-CMOD) curves of stand TPB tests.
Energies 12 03854 g002
Figure 3. Experimental setup.
Energies 12 03854 g003
Figure 4. Matte speckle pattern on the measuring surface of the test beam.
Energies 12 03854 g004
Figure 5. The crack opening displacements of the propagating crack.
Energies 12 03854 g005
Figure 6. Standard TPB at the peak load. (a) Opening displacement contour. (b) Opening displacement pattern along y = 40 mm. (c) Opening displacement pattern along y = 25 mm. (d) Opening displacement pattern along y = 15 mm. (e) Opening displacement pattern along y = 3 mm. (f) Crack opening displacement (COD) profile along the fracture process zone (FPZ).
Energies 12 03854 g006
Figure 7. P-CMOD curves of the beams with different preset crack positions.
Energies 12 03854 g007
Figure 8. Strain contours in the computational domain on the beams with different preset crack positions.
Energies 12 03854 g008
Figure 9. P-CMOD curves of the beams with different preset crack lengths.
Energies 12 03854 g009
Figure 10. Strain contours in the computational domain on the beams with different preset crack lengths.
Energies 12 03854 g010
Figure 11. P-CMOD curves of the beams with different approach angles.
Energies 12 03854 g011
Figure 12. Strain contours in the computational domain on the beams with different approach angles.
Energies 12 03854 g012
Figure 13. External forces applied on the test beam with a preset crack.
Energies 12 03854 g013
Figure 14. Calculation of the stress intensity factor (SIF) of the preset crack tip. (a) The load applied on the half concrete beam; (b) The force generating stress intensity factor KI,1 and KI,2; (c) The force generating stress intensity factor KI,2 and KII,2.;.
Energies 12 03854 g014
Figure 15. Analysis of the SIF of preset crack tip with external forces and bending moments.
Energies 12 03854 g015
Figure 16. The bilinear softening model of the concrete.
Energies 12 03854 g016
Figure 17. The boundary conditions.
Energies 12 03854 g017
Figure 18. The distribution of strain on the upper surface of preset crack. (a) The distribution of strain before the propagating crack reaches the preset crack (the restart point at the middle point of the preset crack); (b) The distribution of strain when two cracks interact (the restart point at the middle point of the preset crack); (c) The distribution of strain after two cracks interact (the restart point at the middle point of the preset crack); (d) The distribution of strain before the propagating crack reaches the preset crack (the restart point at the tip of the preset crack); (e) The distribution of strain when two cracks interact (the restart point at the tip of the preset crack); (f) The distribution of strain after two cracks interact (the restart point at the tip of the preset crack).
Energies 12 03854 g018
Figure 19. Beam applied a pair of tensile unit point forces.
Energies 12 03854 g019
Figure 20. Dissociation of the cohesion in propagating fractures.
Energies 12 03854 g020
Table 1. Dimensions of test beams.
Test Beama0 (mm)d (mm)w (mm)θ (°)
TPB-D1030104090
TPB-D3030304090
TPB-D5030504090
TPB-D7030704090
TPB-W2030302090
TPB-W4030304090
TPB-W6030306090
TPB-W8030308090
TPB-A3030306030
TPB-A4530306045
TPB-A6030306060
TPB-A9030306090
Table 2. Concrete mix proportions.
Water/Cement RatioCement (kg/m3)Water (kg/m3)Sand (kg/m3)Aggregate (kg/m3)
0.474682196411301
Table 3. The fracture parameters of test beams.
Test BeamE (GPa)Pini (kN)CMODini (mm)Pmax (kN)CMODc (mm)
TPB-D10-132.056.240.086.980.11
TPB-D10-234.236.070.117.130.13
TPB-D10-333.175.920.096.720.12
Average33.156.080.096.940.12
TPB-D30-131.356.200.057.210.08
TPB-D30-233.275.880.057.890.10
TPB-D30-330.195.930.066.830.08
Average31.606.000.057.310.09
TPB-D50-134.035.810.077.320.11
TPB-D50-232.375.950.077.010.12
TPB-D50-331.136.160.088.030.12
Average32.515.970.077.450.12
TPB-D70-135.215.820.058.120.08
TPB-D70-232.436.090.067.960.09
TPB-D70-333.155.920.058.350.07
Average33.605.940.058.140.08
TPB-W20-132.656.110.068.090.07
TPB-W20-233.385.840.068.210.08
TPB-W20-334.266.050.077.820.10
Average33.436.000.068.040.08
TPB-W40-135.216.080.077.310.11
TPB-W40-233.615.950.077.990.12
TPB-W40-333.255.980.076.930.10
Average34.026.000.077.410.11
TPB-W60-130.235.930.076.950.13
TPB-W60-234.216.240.097.140.14
TPB-W60-333.156.210.076.960.12
Average32.536.120.087.020.13
TPB-W80-130.255.960.076.320.15
TPB-W80-233.595.840.076.810.15
TPB-W80-331.626.110.076.370.14
Average31.825.990.076.500.15
TPB-A30-133.355.020.086.270.13
TPB-A30-231.314.970.065.620.11
TPB-A30-334.155.170.086.180.11
Average32.945.050.076.360.12
TPB-A45-134.315.960.076.980.10
TPB-A45-235.086.130.097.250.11
TPB-A45-330.125.990.096.510.13
Average33.176.030.086.910.11
TPB-A60-128.546.130.077.210.11
TPB-A60-229.795.980.067.040.09
TPB-A60-331.526.020.067.080.09
Average29.956.040.067.110.10
TPB-A90-130.015.970.087.630.09
TPB-A90-236.136.140.097.260.11
TPB-A90-329.555.990.086.650.12
Average31.906.030.087.180.11
Table 4. The boundary conditions.
Boundaryφ0φ0/∂n
AB00
BC ( y + w / 2 ) P 2 B 0
CD L P 4 B P 2 B
DE ( y + w / 2 ) P 2 B 0
EF S P 4 B 0
FA S P 4 B 0
Table 5. The predicted results and the experimental results of the crack restart point.
Test Beam P re   ( kN ) K I c   ( MPa · m 1 / 2 ) K e   ( MPa · m 1 / 2 ) σ m   ( MPa ) Restart Point
ExperimentPredicted
TPB-D10-16.580.430.673.03TipTip
TPB-D30-16.870.480.733.82Tip & MiddleTip & Middle
TPB-D50-16.980.590.484.15Near middleMiddle
TPB-D70-17.090.620.454.23MiddleMiddle
TPB-W20-16.630.560.713.17TipTip
TPB-W40-16.820.500.683.83Tip & MiddleTip & Middle
TPB-W60-16.950.430.434.05MiddleMiddle
TPB-W80-16.110.400.413.96MiddleMiddle
TPB-A30-16.12-0.653.23TipTip
TPB-A45-16.79-0.713.45Tip Tip
TPB-A60-17.05-0.673.84Near tipTip & Middle
TPB-A90-17.11-0.424.02MiddleMiddle

