Forecasting Methane Emissions from Hard Coal Mines Including the Methane Drainage Process


Abstract
1. Introduction
- −
- Degasification systems at underground coal mines (also commonly referred to as drainage systems);
- −
- Ventilation air from underground mines, which contains dilute concentrations of methane;
- −
- Abandoned or closed mines, from which methane may seep out through vent holes or through fissures or cracks in the ground;
- −
- Fugitive emissions from post-mining operations, in which coal continues to emit methane as it is stored in piles and transported.
2. Materials and Methods
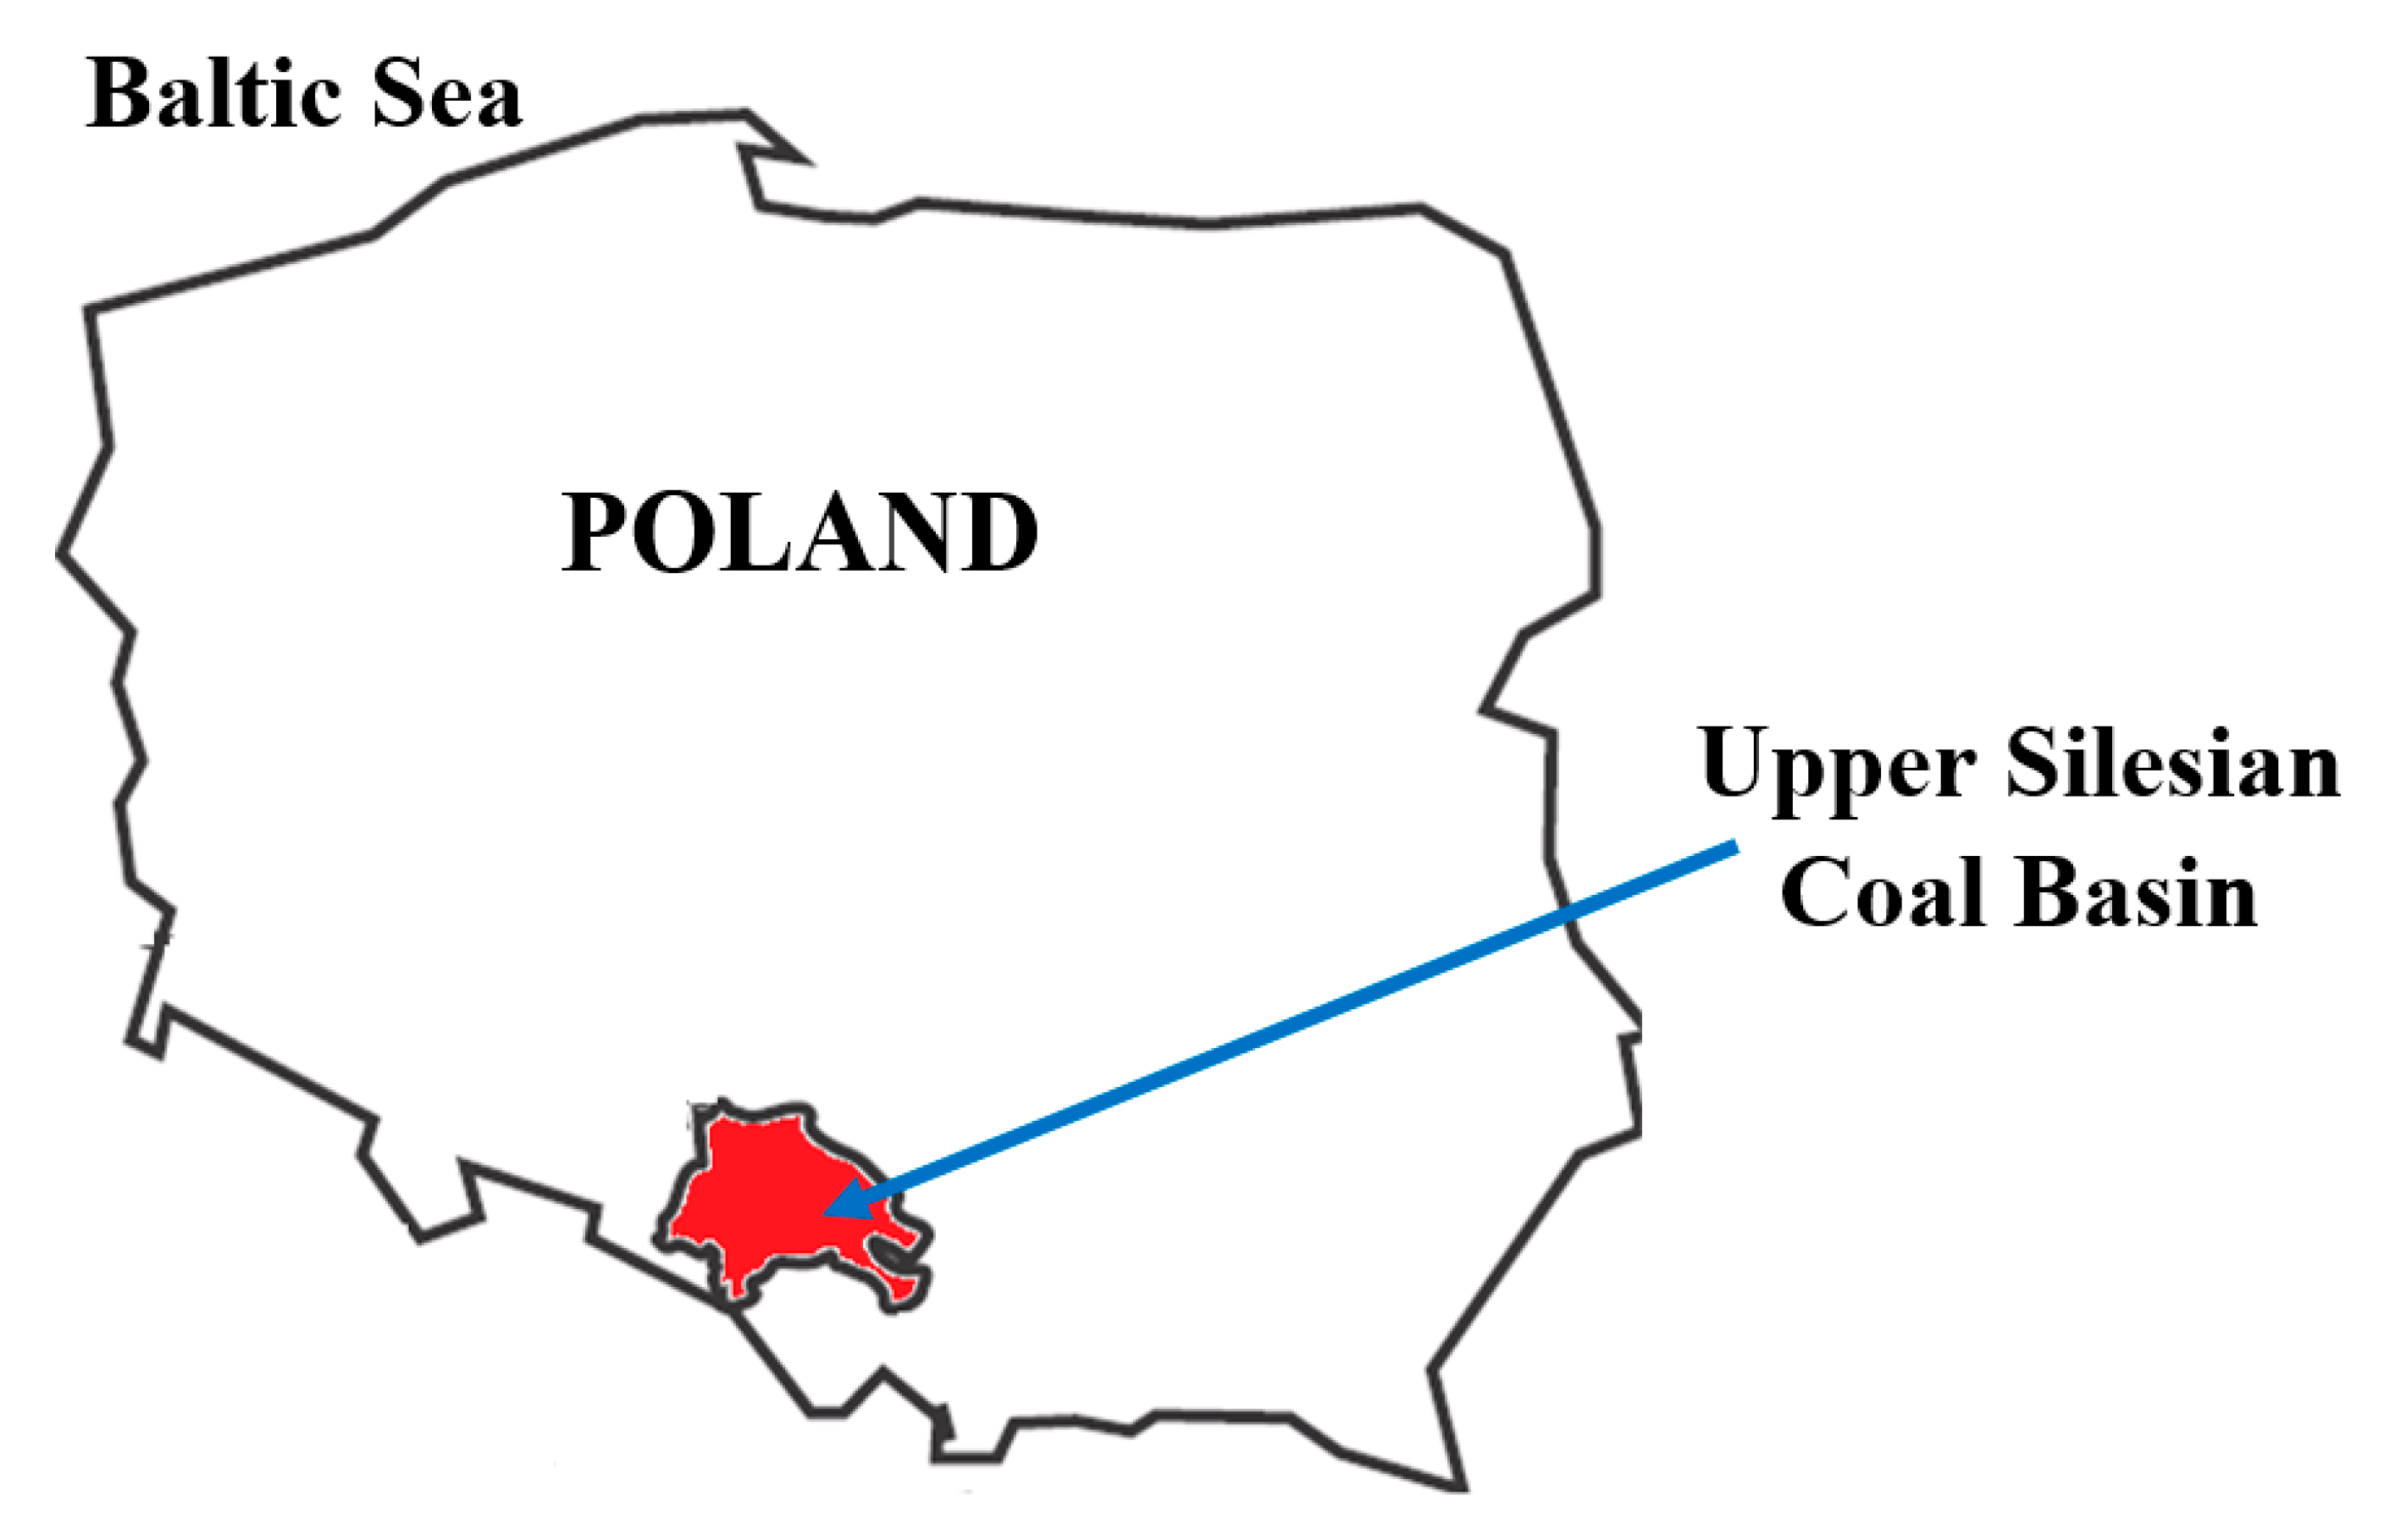
2.1. Study Area
2.2. Data
2.3. Methods
3. Results and Discussion
4. Conclusions
Author Contributions
Funding
Conflicts of Interest
References
- Crow, D.J.G.; Balcombe, P.; Brandon, N.; Hawkes, A.D. Assessing the impact of future greenhouse gas emissions from natural gas production. Sci. Total Environ. 2019, 668, 1242–1258. [Google Scholar] [CrossRef] [PubMed]
- Institute of Environmental Protection—National Research Institute. National Inventory Report 2016. Report Made for the Purposes United Nations Framework Convention on Climate Change and the Kyoto Protocol. Available online: https://www.kobize.pl/uploads/materialy/materialy_do_pobrania/krajowa_inwentaryzacja_emisji/NIR_2016_POL_Streszczenie_05.2016.pdf (accessed on 26 September 2019).
- Tong, R.; Yang, Y.; Ma, X.; Zhang, Y.; Li, S.; Yang, H. Risk Assessment of Miners’ Unsafe Behaviors: A Case Study of Gas Explosion Accidents in Coal Mine, China. Int. J. Environ. Res. Public Health 2019, 16, 1765. [Google Scholar] [CrossRef] [PubMed]
- Brodny, J.; Tutak, M. Analysis of Methane Emission into the Atmosphere as a Result of Mining Activity, 16th ed.; International Multidisciplinary Scientific GeoConference SGEM: Sofia, Bulgaria, 2016; Book 4; Volume 3, pp. 83–90. [Google Scholar] [CrossRef]
- Zhou, H.; Yang, Q.; Cheng, Y.; Ge, C.; Chen, J. Methane drainage and utilization in coal mines with strong coal and gas outburst dangers: A case study in Luling mine, China. J. Nat. Gas Sci. Eng. 2014, 20, 357–365. [Google Scholar] [CrossRef]
- Warmuzinski, K. Harnessing methane emissions from coal mining. Process Saf. Environ. Prot. 2008, 86, 315–320. [Google Scholar] [CrossRef]
- Balcombe, P.; Speirs, J.F.; Brandon, N.P.; Hawkes, A.D. Methane emissions: Choosing the right climate metric and time horizon. Environ. Sci. Process. Impacts 2018, 20, 1323–1339. [Google Scholar] [CrossRef] [PubMed]
- Climate Change 2013: The Physical Science Basis; Contribution of Working Group I to the Fifth Assessment Report of the Intergovernmental Panel on Climate Change; Cambridge University Press: Cambridge, UK; New York, NY, USA, 2013; p. 1535.
- Karacan, C.O.; Ruiz, F.A.; Cotèc, M.; Phipps, S. Coal mine methane: A review of capture and utilization practices with benefits to mining safety and to greenhouse gas reduction. Int. J. Coal Geol. 2011, 86, 121–156. [Google Scholar] [CrossRef]
- Kędzior, S. Accumulation of coalbed methane in the south-west part of the Upper Silesian Coal Basin (southern Poland). Int. J. C. Geol. 2009, 80, 20–34. [Google Scholar] [CrossRef]
- Yang, X.; Liu, Y.; Li, Z.; Zhang, C.; Xing, Y. Vacuum Exhaust Process in Pilot-Scale Vacuum Pressure Swing Adsorption for Coal Mine Ventilation Air Methane Enrichment. Energies 2018, 11, 1030. [Google Scholar] [CrossRef]
- Słoczyński, T.; Drozd, A. Coalbed methane (CBM)—Global experience and the prospects of development in Poland. Nafta Gaz Sci. Technol. Oil Gas Ind. 2017, 11, 851–856. [Google Scholar]
- Cheng, Y.; Wang, L.; Zhang, X. Environmental impact of coal mine methane emissions and responding strategies in China. Int. J. Greenh. Gas Control 2011, 5, 157–166. [Google Scholar] [CrossRef]
- EPA’s Report on the Environment. Available online: https://cfpub.epa.gov/roe/documents/EPAROE_FINAL_2008.PDF (accessed on 2 September 2019).
- Tucki, K.; Orynycz, O.; Świć, A.; Mitoraj-Wojtanek, M. The Development of Electromobility in Poland and EU States as a Tool for Management of CO2 Emissions. Energies 2019, 12, 2942. [Google Scholar] [CrossRef]
- Xie, S.; Lin, S.; Zhang, Q.; Tian, Z.; Wang, Y. Selective electrocatalytic conversion of methane to fuels and chemicals. J. Energy Chem. 2018, 27, 1629–1636. [Google Scholar] [CrossRef]
- WUG. Available online: http://www.wug.gov.pl/bhp/stan_bhp_w_gornictwie (accessed on 2 September 2019).
- Krause, E.; Łukowicz, K. Dynamic Prediction of Absolute Methane Emissions on Longwalls; Technical Guide; GIG: Katowice, Poland, 2000. [Google Scholar]
- Krause, E.; Smoliński, A. Analysis and Assessment of Parameters Shaping Methane Hazard in Longwall Areas. J. Sustain. Min. 2013, 12, 13–19. [Google Scholar] [CrossRef]
- Wierzbowski, M.; Filipiak, I.; Lyzwa, W. Polish energy policy 2050—An instrument to develop a diversified and sustainable electricity generation mix in coal-based energy system. Renew. Sustain. Energy Rev. 2017, 74, 51–70. [Google Scholar] [CrossRef]
- Mishra, D.P.; Kumar, P.; Panigrahi, D.C. Dispersion of methane in tailgate of a retreating longwall mine: A computational fluid dynamics study. Environ. Earth Sci. 2016, 75, 475. [Google Scholar] [CrossRef]
- Tutak, M.; Brodny, J. Analysis of Influence of Goaf Sealing from Tailgate on the Methane Concentration at the Outlet from the Longwall. IOP Conf. Ser. Earth Environ. Sci. 2017, 95, 042025. [Google Scholar] [CrossRef]
- Felka, D.; Brodny, J. Application of Neural-Fuzzy System in Prediction of Methane Hazard. In Proceedings of the International Conference on Intelligent Systems in Production Engineering and Maintenance, Wroclaw, Poland, 28–29 September 2017; Springer: Berlin/Heidelberg, Germany, 2017; pp. 151–160. [Google Scholar]
- Tutak, M.; Brodny, J. Predicting Methane Concentration in Longwall Regions Using Artificial Neural Networks. Int. J. Environ. Res. Public Health 2019, 16, 1406. [Google Scholar] [CrossRef]
- Liobikienė, G.; Butkus, M.; Matuzevičiūtė, K. The Contribution of Energy Taxes to Climate Change Policy in the European Union (EU). Resources 2019, 8, 63. [Google Scholar] [CrossRef]
- Tucki, K.; Orynycz, O.; Wasiak, A.; Świć, A.; Dybaś, W. Capacity Market Implementation in Poland: Analysis of a Survey on Consequences for the Electricity Market and for Energy Management. Energies 2019, 12, 839. [Google Scholar] [CrossRef]
- Duda, A.; Krzemień, A. Forecast of methane emission from closed underground coal mines exploited by longwall mining—A case study of Anna coal mine. J. Sustain. Min. 2018, 17, 189–194. [Google Scholar] [CrossRef]
- Krause, E.; Pokryszka, Z. Investigations on Methane Emission from Flooded Workings of Closed Coal Mines. J. Sustain. Min. 2013, 12, 40–45. [Google Scholar] [CrossRef]
- Kirchgessner, A.D.; Piccot, S.D.; Winkler, J.D. Estimate of global methane emissions from coal mines. Chemosphere 1993, 26, 453–472. [Google Scholar] [CrossRef]
- Sen, P.; Roy, M.; Pal, P. Application of ARIMA for forecasting energy consumption and GHG emission: A case study of an Indian pig iron manufacturing organization. Energy 2016, 116, 1031–1038. [Google Scholar] [CrossRef]
- Lotfalipour, M.R.; Ali Falahi, M.; Bastam, M. Prediction of CO2 Emissions in Iran using Grey and ARIMA Models. Int. J. Energy Econ. Policy 2013, 3, 229–237. [Google Scholar]
- Mohsen Hosseini, S.; Saifoddin, A.; Shirmohammadi, R.; Aslani, A. Forecasting of CO2 emissions in Iran based on time series and regression analysis. Energy Rep. 2019, 5, 619–631. [Google Scholar] [CrossRef]
- Kędzior, S. Potencjał zasobowy metanu pokładów węgla w Polsce w kontekście uwarunkowań geologicznych. Gosp. Sur. Min. 2008, 24, 155–173. [Google Scholar]
- Polish Geological Institute National Research Institute. Available online: https://www.pgi.gov.pl/psg-1/psg-2/informacja-i-szkolenia/wiadomosci-surowcowe/10856-zasoby-metanu-z-pokladow-wegla-w-polsce.html (accessed on 2 September 2019).
- Kędzior, S.; Dreger, M. Methane occurrence, emissions and hazards in the Upper Silesian Coal Basin, Poland. Int. J. Coal Geol. 2019, 211, 103226. [Google Scholar] [CrossRef]
- Kabiesz, J. Annual Report on the State of Basic Natural and Technical Hazards in Hard Coal Mining; GIG: Katowice, Poland, 2018. [Google Scholar]
- Sasiada, M.; Fraczek-Szczypta, A.; Tadeusiewicz, R. Efficiency testing of artificial neural networks in predicting the properties of carbon nanomaterials as potential systems for nervous tissue stimulation and regeneration. Bio-Algorithms Med-Syst. 2017, 13, 25–35. [Google Scholar] [CrossRef]
- Papagera, A.; Ioannou, K.; Zaimes, G.; Iakovoglou, V.; Simeonidou, M. Simulation and prediction of water allocation using artificial neural networks and a spatially distributed hydrological model. Econ. Inform. 2014, 6, 101–111. [Google Scholar]
- Ferreira, J.; Callou, G.; Josua, A.; Tutsch, D.; Maciel, P. An Artificial Neural Network Approach to Forecast the Environmental Impact of Data Centers. Information 2019, 10, 113. [Google Scholar] [CrossRef]
- Lee, S.; Jung, S.; Lee, J. Prediction Model Based on an Artificial Neural Network for User-Based Building Energy Consumption in South Korea. Energies 2019, 12, 608. [Google Scholar] [CrossRef]
- Bourobou, S.T.M.; Yoo, Y. User Activity Recognition in Smart Homes Using Pattern Clustering Applied to Temporal ANN Algorithm. Sensors 2015, 15, 11953–11971. [Google Scholar] [CrossRef] [PubMed]
- Lee, H.-J.; Jhang, S.-S.; Yu, W.-K.; Oh, J.-H. Artificial Neural Network Control of Battery Energy Storage System to Damp-Out Inter-Area Oscillations in Power Systems. Energies 2019, 12, 3372. [Google Scholar] [CrossRef]
- Kampelis, N.; Tsekeri, E.; Kolokotsa, D.; Kalaitzakis, K.; Isidori, D.; Cristalli, C. Development of Demand Response Energy Management Optimization at Building and District Levels Using Genetic Algorithm and Artificial Neural Network Modelling Power Predictions. Energies 2018, 11, 3012. [Google Scholar] [CrossRef]
- McCulloch, W.S.; Pitts, W. A logical calculus of the ideas immanent in nervous activity. Bull. Math. Biophys. 1943, 5, 115–133. [Google Scholar] [CrossRef]
- Barone, G.; Mazzoleni, P.; Spagnolo, G.V.; Raneri, S. Artificial neural network for the provenance study of archaeological ceramics using clay sediment database. J. Cult. Herit. 2019, 38, 147–157. [Google Scholar] [CrossRef]
- Viotti, P.; Liuti, G.; Di Genova, P. Atmospheric urban pollution: Applications of an artificial neural network (ANN) to the city of Perugia. Ecol. Model. 2002, 148, 27–46. [Google Scholar] [CrossRef]
- Werbos, P. Generalization of Backpropagation with application to a recurrent gas market model. Neural Netw. 1988, 1, 339–356. [Google Scholar] [CrossRef]
- Leonard, J.; Kramer, M.A. Improvement of the backpropagation algorithm for training neural networks. Comput. Chem. Eng. 1990, 14, 337–341. [Google Scholar] [CrossRef]
- Obuchowicz, A. Optimizing the architecture of neural networks. Biocybernetyka i inżynieria biomedyczna 2000, 6, 323–367. [Google Scholar]
- Hong, T.; Jeong, K.; Koo, K. An optimized gene expression programming model for forecasting the national CO2 emissions in 2030 using the metaheuristic algorithms. Appl. Energy 2018, 228, 808–820. [Google Scholar] [CrossRef]
- Antanasijevića, D.Z.; Ristić, M.D.; Perić-Grujić, A.A.; Pocajt, V.V. Forecasting GHG emissions using an optimized artificial neural network model based on correlation and principal component analysis. Int. J. Greenh. Gas Control 2014, 20, 244–253. [Google Scholar] [CrossRef]
- Intergovernmental Panel on Climate Change. Guidelines for National Greenhouse Gas Inventories; Institute for Global Environmental Strategies: Kanagawa, Japan, 2006; Volume 2. [Google Scholar]
- Patyńska, R. The methane emission factor from the coal mines in Poland. Zeszyty Naukowe Instytutu Gospodarki Surowcami Mineralnymi i Energią Polskiej Akademii Nauk 2016, 94, 67–78. [Google Scholar]


| Year | Hard Coal Output, Mt | Absolute Methane Content, million m3 | Methane Content in Ventilation Air, million m3 | Methane Drainage, million m3 | The Use of Methane, million m3 | Methane Emissions from Drainage Systems, million m3 |
|---|---|---|---|---|---|---|
| 1993 | 130.0 | 773.3 | 560.5 | 212.8 | 167.6 | 45.2 |
| 1994 | 132.3 | 762.0 | 560.8 | 201.2 | 136.3 | 64.9 |
| 1995 | 135.2 | 748.0 | 550.5 | 197.5 | 137.1 | 60.4 |
| 1996 | 136.0 | 748.4 | 555.9 | 192.5 | 147.5 | 45 |
| 1997 | 137.1 | 748.4 | 555.9 | 192.5 | 134.4 | 58.1 |
| 1998 | 115.9 | 763.3 | 559.7 | 203.6 | 152.7 | 50.9 |
| 1999 | 110.4 | 744.5 | 528.4 | 216.1 | 136.9 | 79.2 |
| 2000 | 102.5 | 746.9 | 530.8 | 216.1 | 124.0 | 92.1 |
| 2001 | 102.6 | 743.7 | 529.4 | 214.3 | 131.5 | 82.8 |
| 2002 | 102.1 | 752.6 | 545.3 | 207.3 | 122.4 | 84.9 |
| 2003 | 100.4 | 798.1 | 571.0 | 227.1 | 127.8 | 99.3 |
| 2004 | 99.5 | 825.9 | 575.0 | 250.9 | 144.5 | 106.4 |
| 2005 | 98.1 | 851.1 | 595.8 | 255.3 | 144.8 | 110.5 |
| 2006 | 95.4 | 870.3 | 580.8 | 289.5 | 158.3 | 131.2 |
| 2007 | 87.4 | 878.9 | 610.1 | 268.8 | 165.7 | 103.1 |
| 2008 | 83.6 | 880.9 | 606.7 | 274.2 | 156.5 | 117.7 |
| 2009 | 77.4 | 855.7 | 595.9 | 259.8 | 159.5 | 100.3 |
| 2010 | 76.1 | 834.9 | 579.0 | 255.9 | 161.1 | 94.8 |
| 2011 | 75.5 | 828.8 | 578.6 | 250.2 | 166.3 | 83.9 |
| 2012 | 79.2 | 828.2 | 561.5 | 266.7 | 178.6 | 88.1 |
| 2013 | 76.5 | 847.8 | 571.2 | 276.6 | 187.7 | 88.9 |
| 2014 | 72.5 | 891.2 | 570.1 | 321.1 | 211.4 | 109.7 |
| 2015 | 72.2 | 933.0 | 594.0 | 339 | 197.1 | 141.9 |
| 2016 | 70.4 | 933.8 | 591.7 | 342.1 | 195.0 | 147.1 |
| 2017 | 65.5 | 948.5 | 611.5 | 337.0 | 212.0 | 125 |
| 2018 | 63.4 | 916.1 | 599.1 | 317.0 | 203.1 | 113.9 |
| Sum | 2497.2 | 21454.3 | 14,869.2 | 6585.1 | 4159.8 | 2425.3 |
| Average | 96.05 | 825.17 | 571.89 | 253.27 | 159.99 | 93.28 |
| Standard deviation | 23.56 | 67.84 | 24.31 | 48.20 | 27.26 | 28.09 |
| Year | Absolute Methane Content per One Ton, m3 | Methane Content in Ventilation Air per One Ton, m3 | Methane Drainage per One Ton, m3 | The Use of Methane per One Ton, million m3 | Methane Emissions from Drainage Systems per One Ton, m3 |
|---|---|---|---|---|---|
| 1993 | 5.95 | 4.31 | 1.64 | 1.29 | 0.35 |
| 1994 | 5.76 | 4.24 | 1.52 | 1.03 | 0.49 |
| 1995 | 5.53 | 4.07 | 1.46 | 1.01 | 0.45 |
| 1996 | 5.50 | 4.09 | 1.42 | 1.08 | 0.33 |
| 1997 | 5.46 | 4.05 | 1.40 | 0.98 | 0.42 |
| 1998 | 6.59 | 4.83 | 1.76 | 1.32 | 0.44 |
| 1999 | 6.74 | 4.79 | 1.96 | 1.24 | 0.72 |
| 2000 | 7.29 | 5.18 | 2.11 | 1.21 | 0.90 |
| 2001 | 7.25 | 5.16 | 2.09 | 1.28 | 0.81 |
| 2002 | 7.37 | 5.34 | 2.03 | 1.20 | 0.83 |
| 2003 | 7.95 | 5.69 | 2.26 | 1.27 | 0.99 |
| 2004 | 8.30 | 5.78 | 2.52 | 1.45 | 1.07 |
| 2005 | 8.68 | 6.07 | 2.60 | 1.48 | 1.13 |
| 2006 | 9.12 | 6.09 | 3.03 | 1.66 | 1.38 |
| 2007 | 10.06 | 6.98 | 3.08 | 1.90 | 1.18 |
| 2008 | 10.54 | 7.26 | 3.28 | 1.87 | 1.41 |
| 2009 | 11.06 | 7.70 | 3.36 | 2.06 | 1.30 |
| 2010 | 10.97 | 7.61 | 3.36 | 2.12 | 1.25 |
| 2011 | 10.98 | 7.66 | 3.31 | 2.20 | 1.11 |
| 2012 | 10.46 | 7.09 | 3.37 | 2.26 | 1.11 |
| 2013 | 11.08 | 7.47 | 3.62 | 2.45 | 1.16 |
| 2014 | 12.29 | 7.86 | 4.43 | 2.92 | 1.51 |
| 2015 | 12.92 | 8.23 | 4.70 | 2.73 | 1.97 |
| 2016 | 13.26 | 8.40 | 4.86 | 2.77 | 2.09 |
| 2017 | 14.48 | 9.34 | 5.15 | 3.24 | 1.91 |
| 2018 | 14.45 | 9.45 | 5.00 | 3.20 | 1.80 |
| Sum | 240.03 | 164.73 | 75.30 | 47.22 | 28.08 |
| Average | 9.23 | 6.34 | 2.90 | 1.82 | 1.08 |
| Standard deviation | 2.85 | 1.68 | 1.19 | 0.71 | 0.51 |
| Variable | Hard Coal Output | Absolute Methane Content | Methane Content in Ventilation Air | Methane Drainage | The Use of Methane | Methane Emissions from Drainage Systems |
|---|---|---|---|---|---|---|
| Hard coal output | 1.0000 | −0.8354 | −0.6171 | −0.8645 | −0.7090 | −0.7955 |
| Absolute methane content | −0.8354 | 1.0000 | 0.8700 | 0.9686 | 0.8372 | 0.8497 |
| Methane content in ventilation air | −0.6171 | 0.8700 | 1.0000 | 0.7202 | 0.6179 | 0.6362 |
| Methane drainage | −0.8645 | 0.9686 | 0.7202 | 1.0000 | 0.8667 | 0.8750 |
| The use of methane | −0.7090 | 0.8372 | 0.6179 | 0.8667 | 1.0000 | 0.5168 |
| Methane emissions from drainage systems | −0.7955 | 0.8497 | 0.6362 | 0.8750 | 0.5168 | 1.0000 |
| Variable | Absolute Methane Content | Methane Content in Ventilation Air | Methane Drainage | The Use of Methane | Methane Emissions from Drainage Systems |
|---|---|---|---|---|---|
| Absolute methane content | 1.0000 | 0.9955 | 0.9909 | 0.9730 | 0.9462 |
| Methane content in ventilation air | 0.9955 | 1.0000 | 0.9736 | 0.9578 | 0.9271 |
| Methane drainage | 0.9909 | 0.9736 | 1.0000 | 0.9792 | 0.9587 |
| The use of methane | 0.9730 | 0.9578 | 0.9792 | 1.0000 | 0.8810 |
| Methane emissions from drainage systems | 0.9462 | 0.9271 | 0.9587 | 0.8810 | 1.0000 |
| Forecast Variant | Network Structure | Correlation Coefficient | Matching Error | Activation Function—Neurons | |
|---|---|---|---|---|---|
| Hidden | Output | ||||
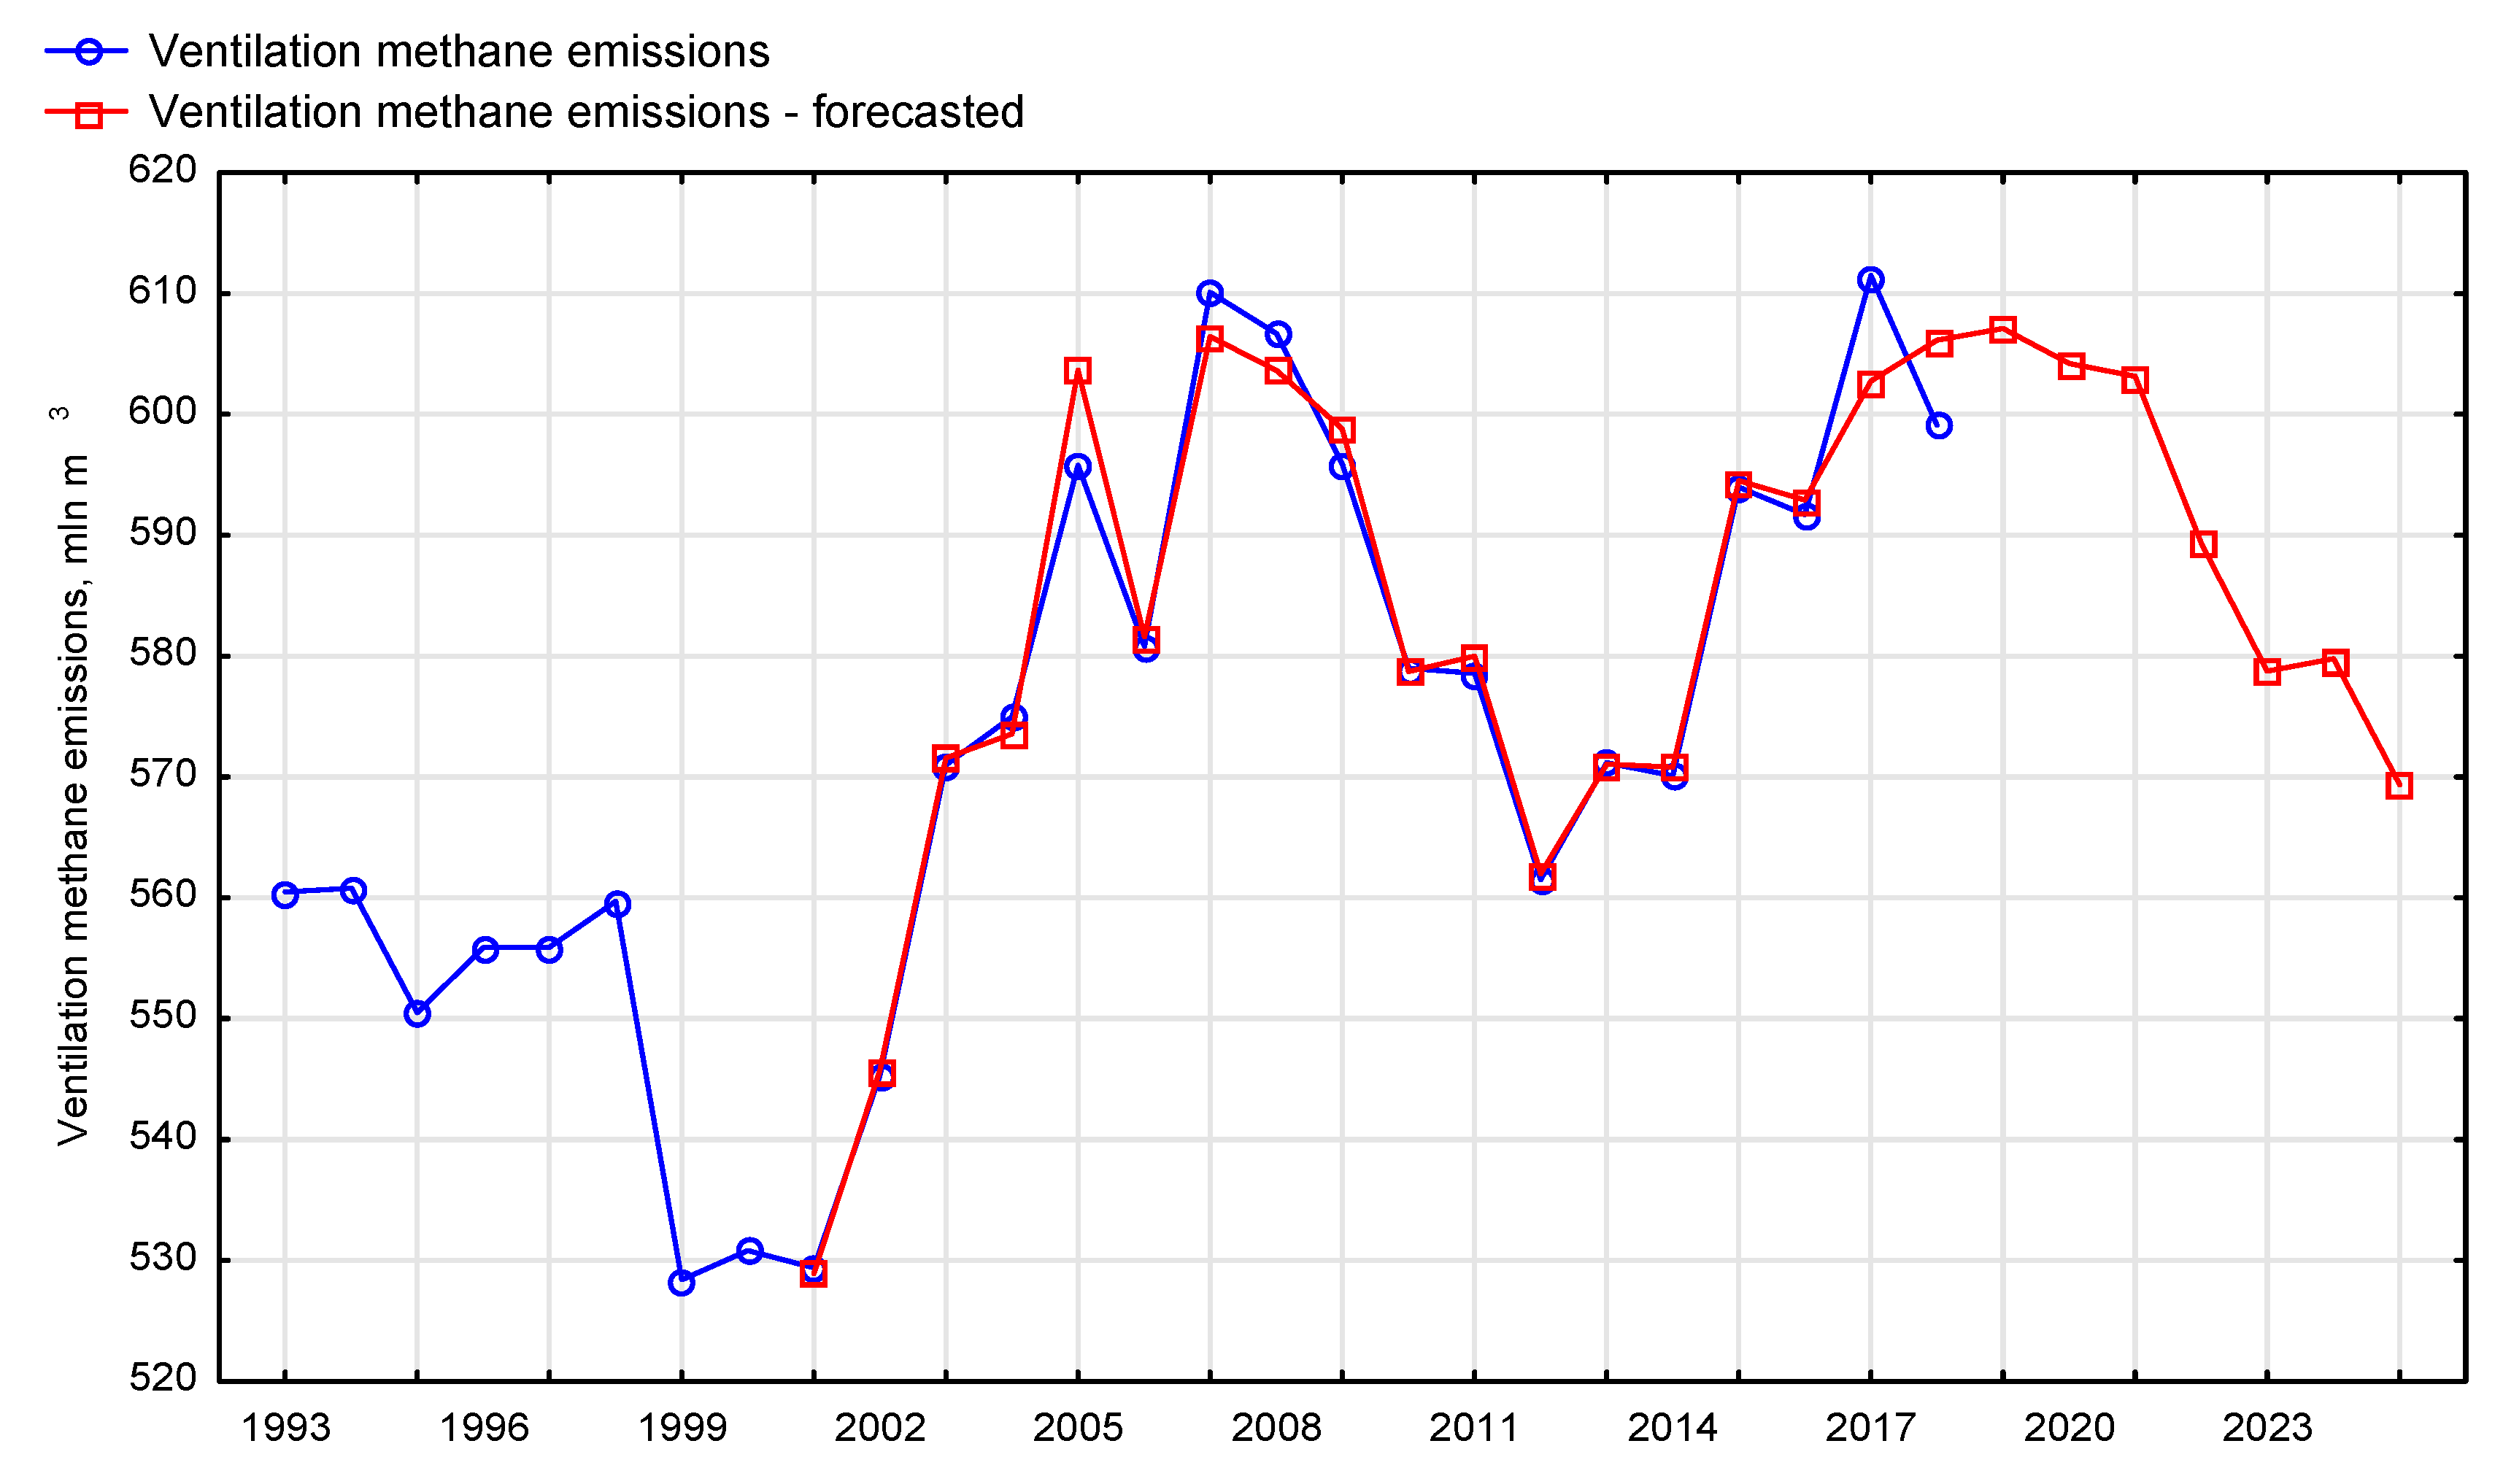
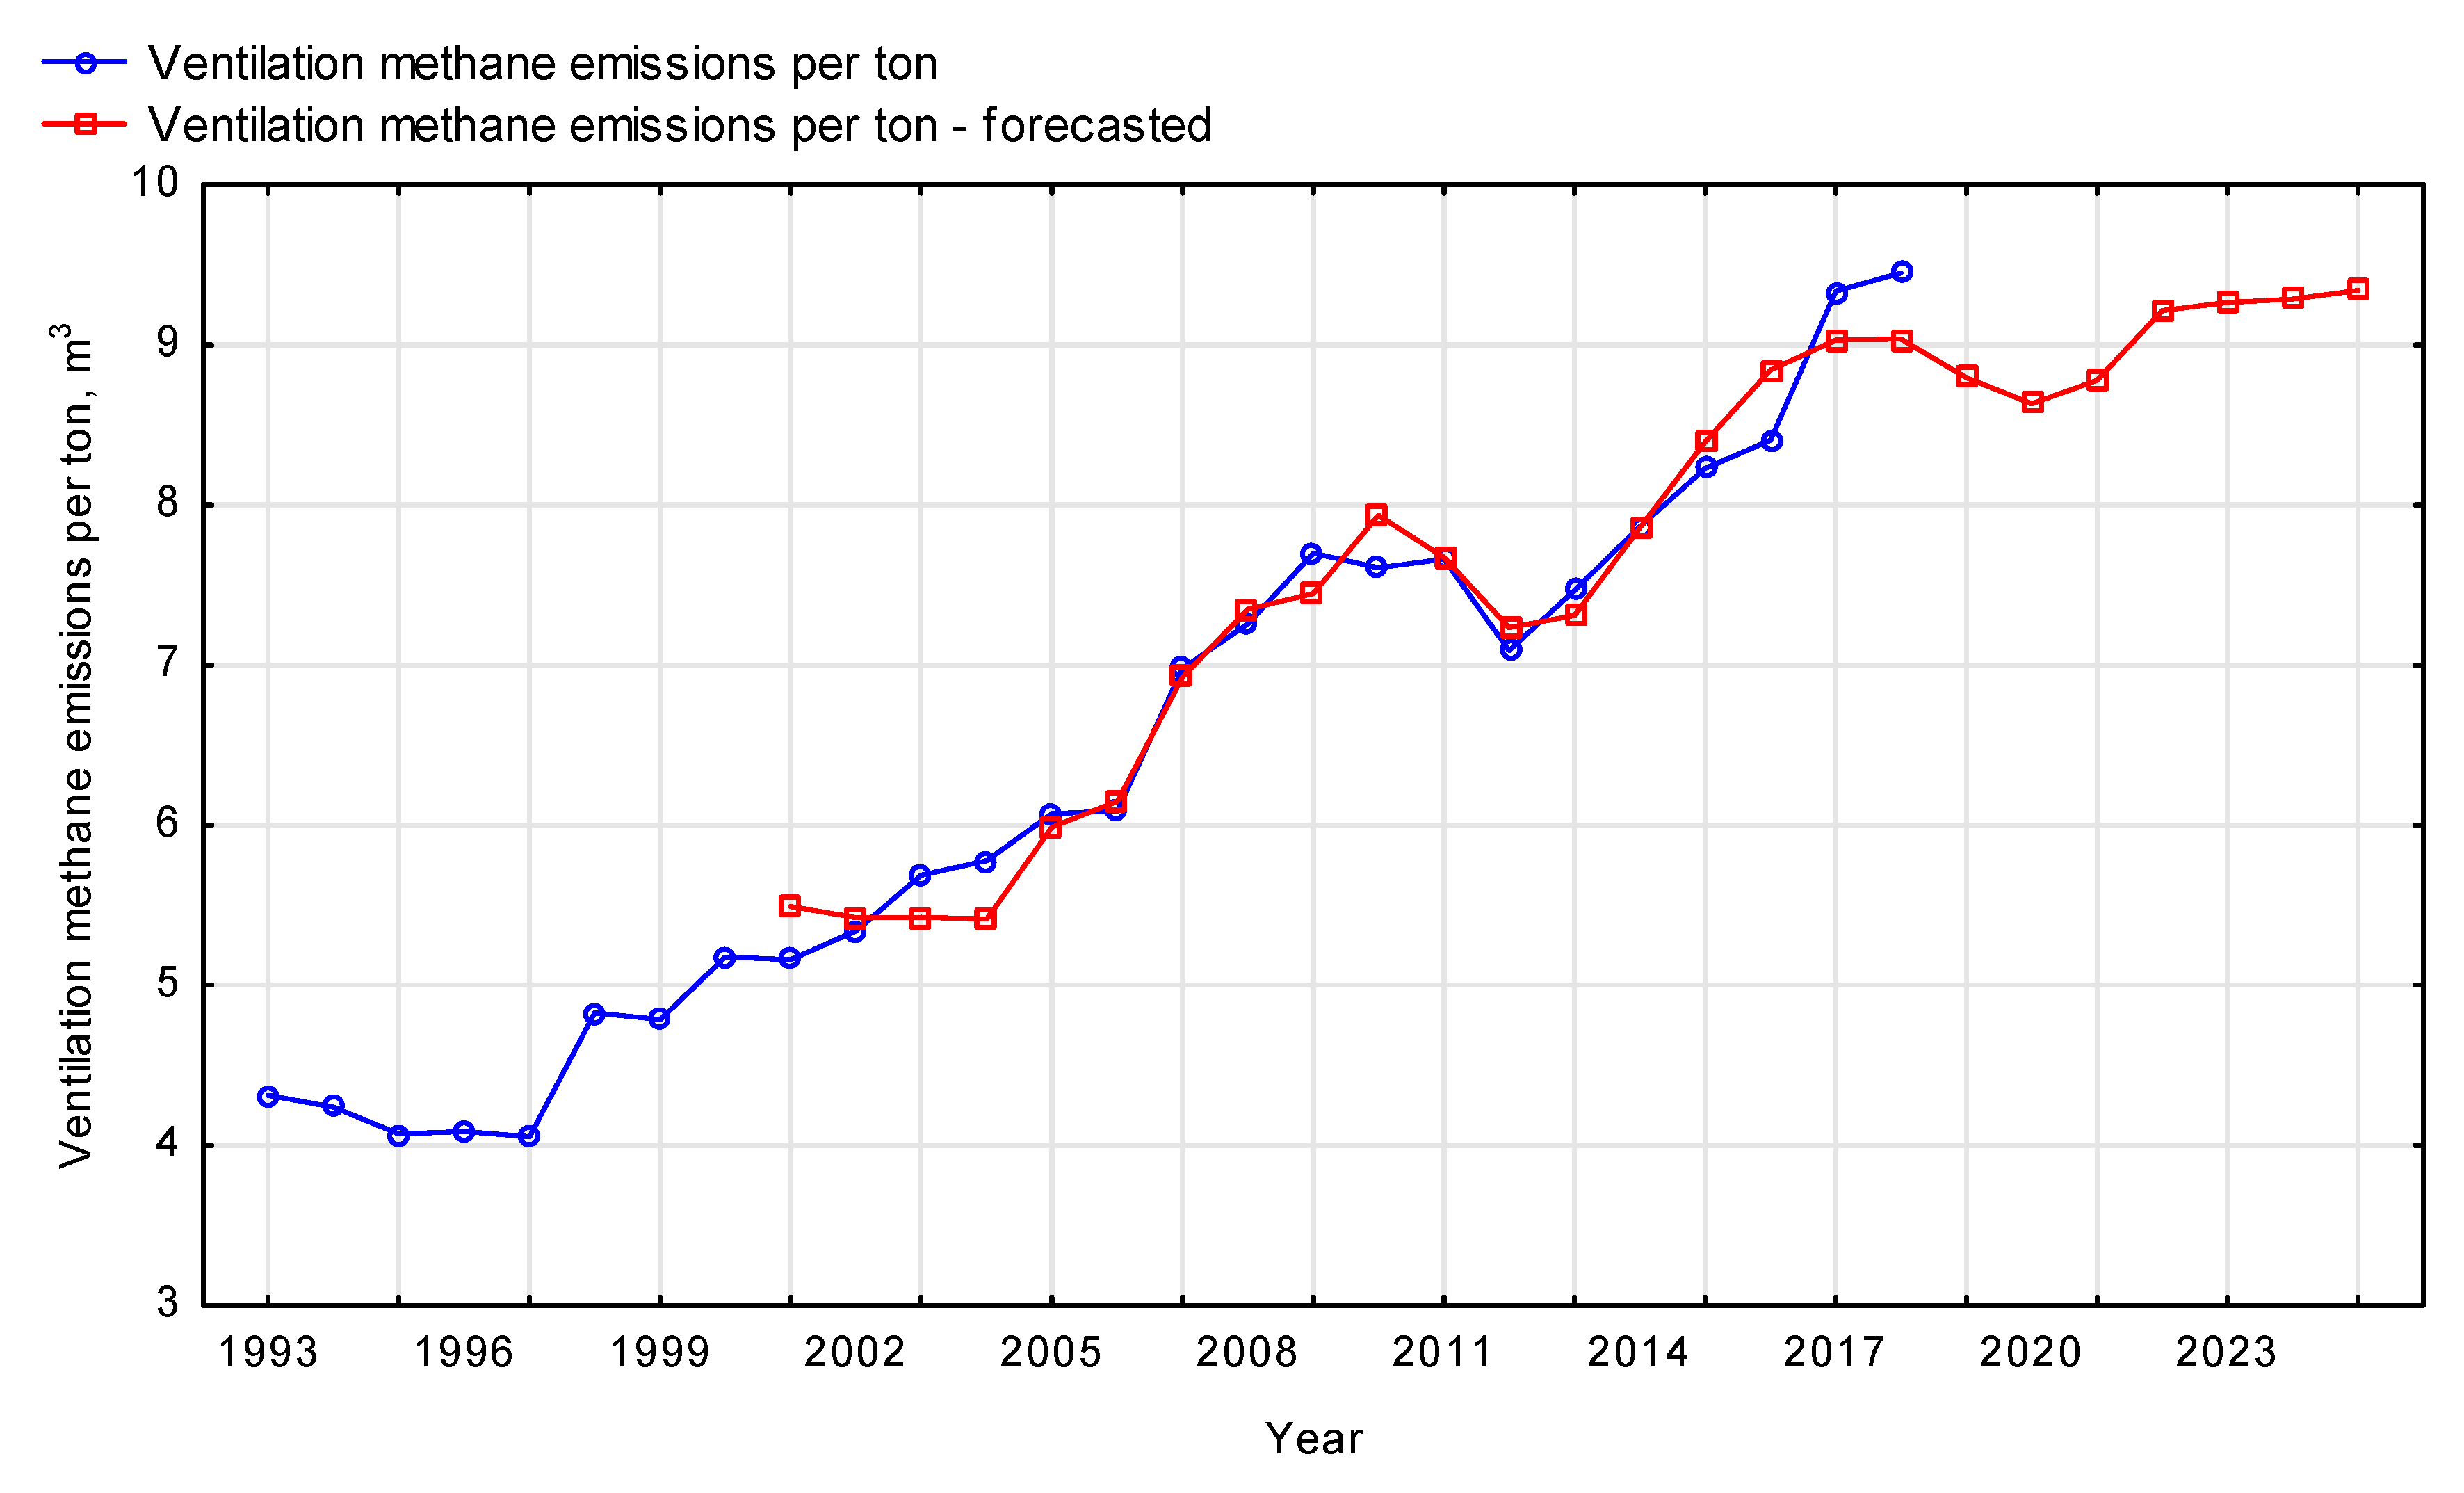
| Ventilation methane emissions | MLP 6-10-1 | 0.943 | 3.0417 | hyperbolic tangent | hyperbolic tangent |
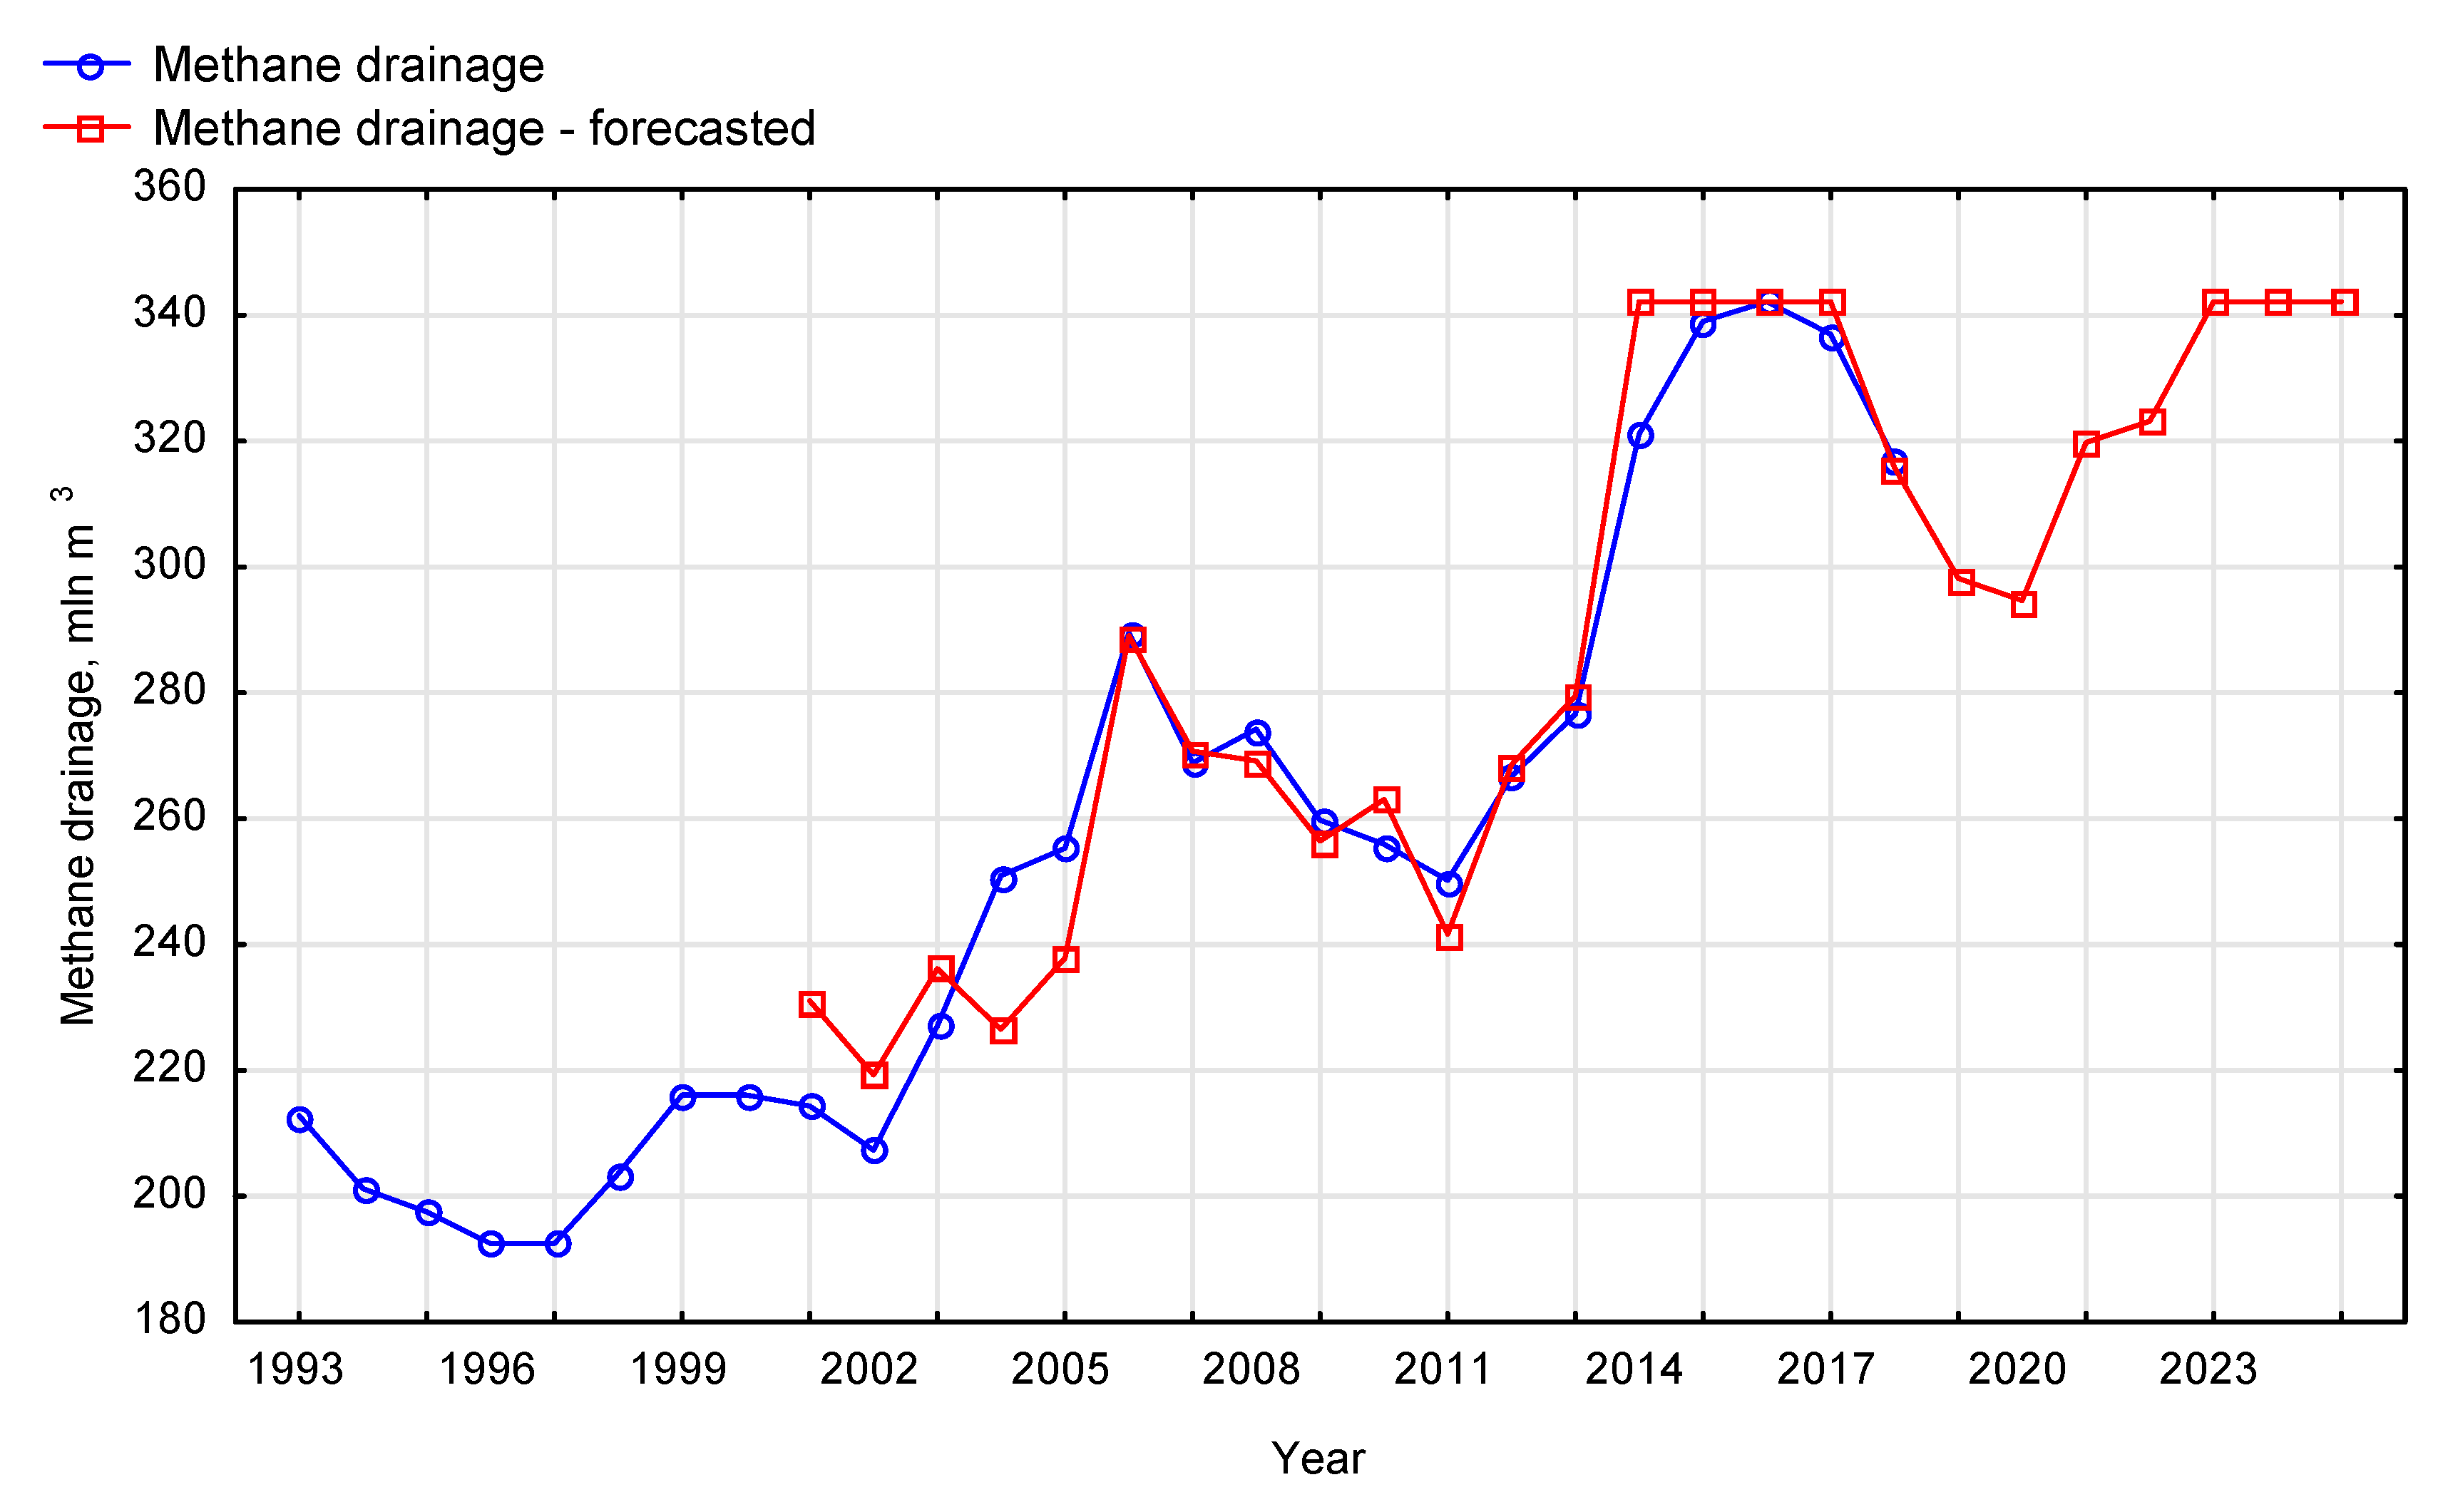
| Methane drainage | MLP 4-7-1 | 0.790 | 10.88 | exponential | exponential |
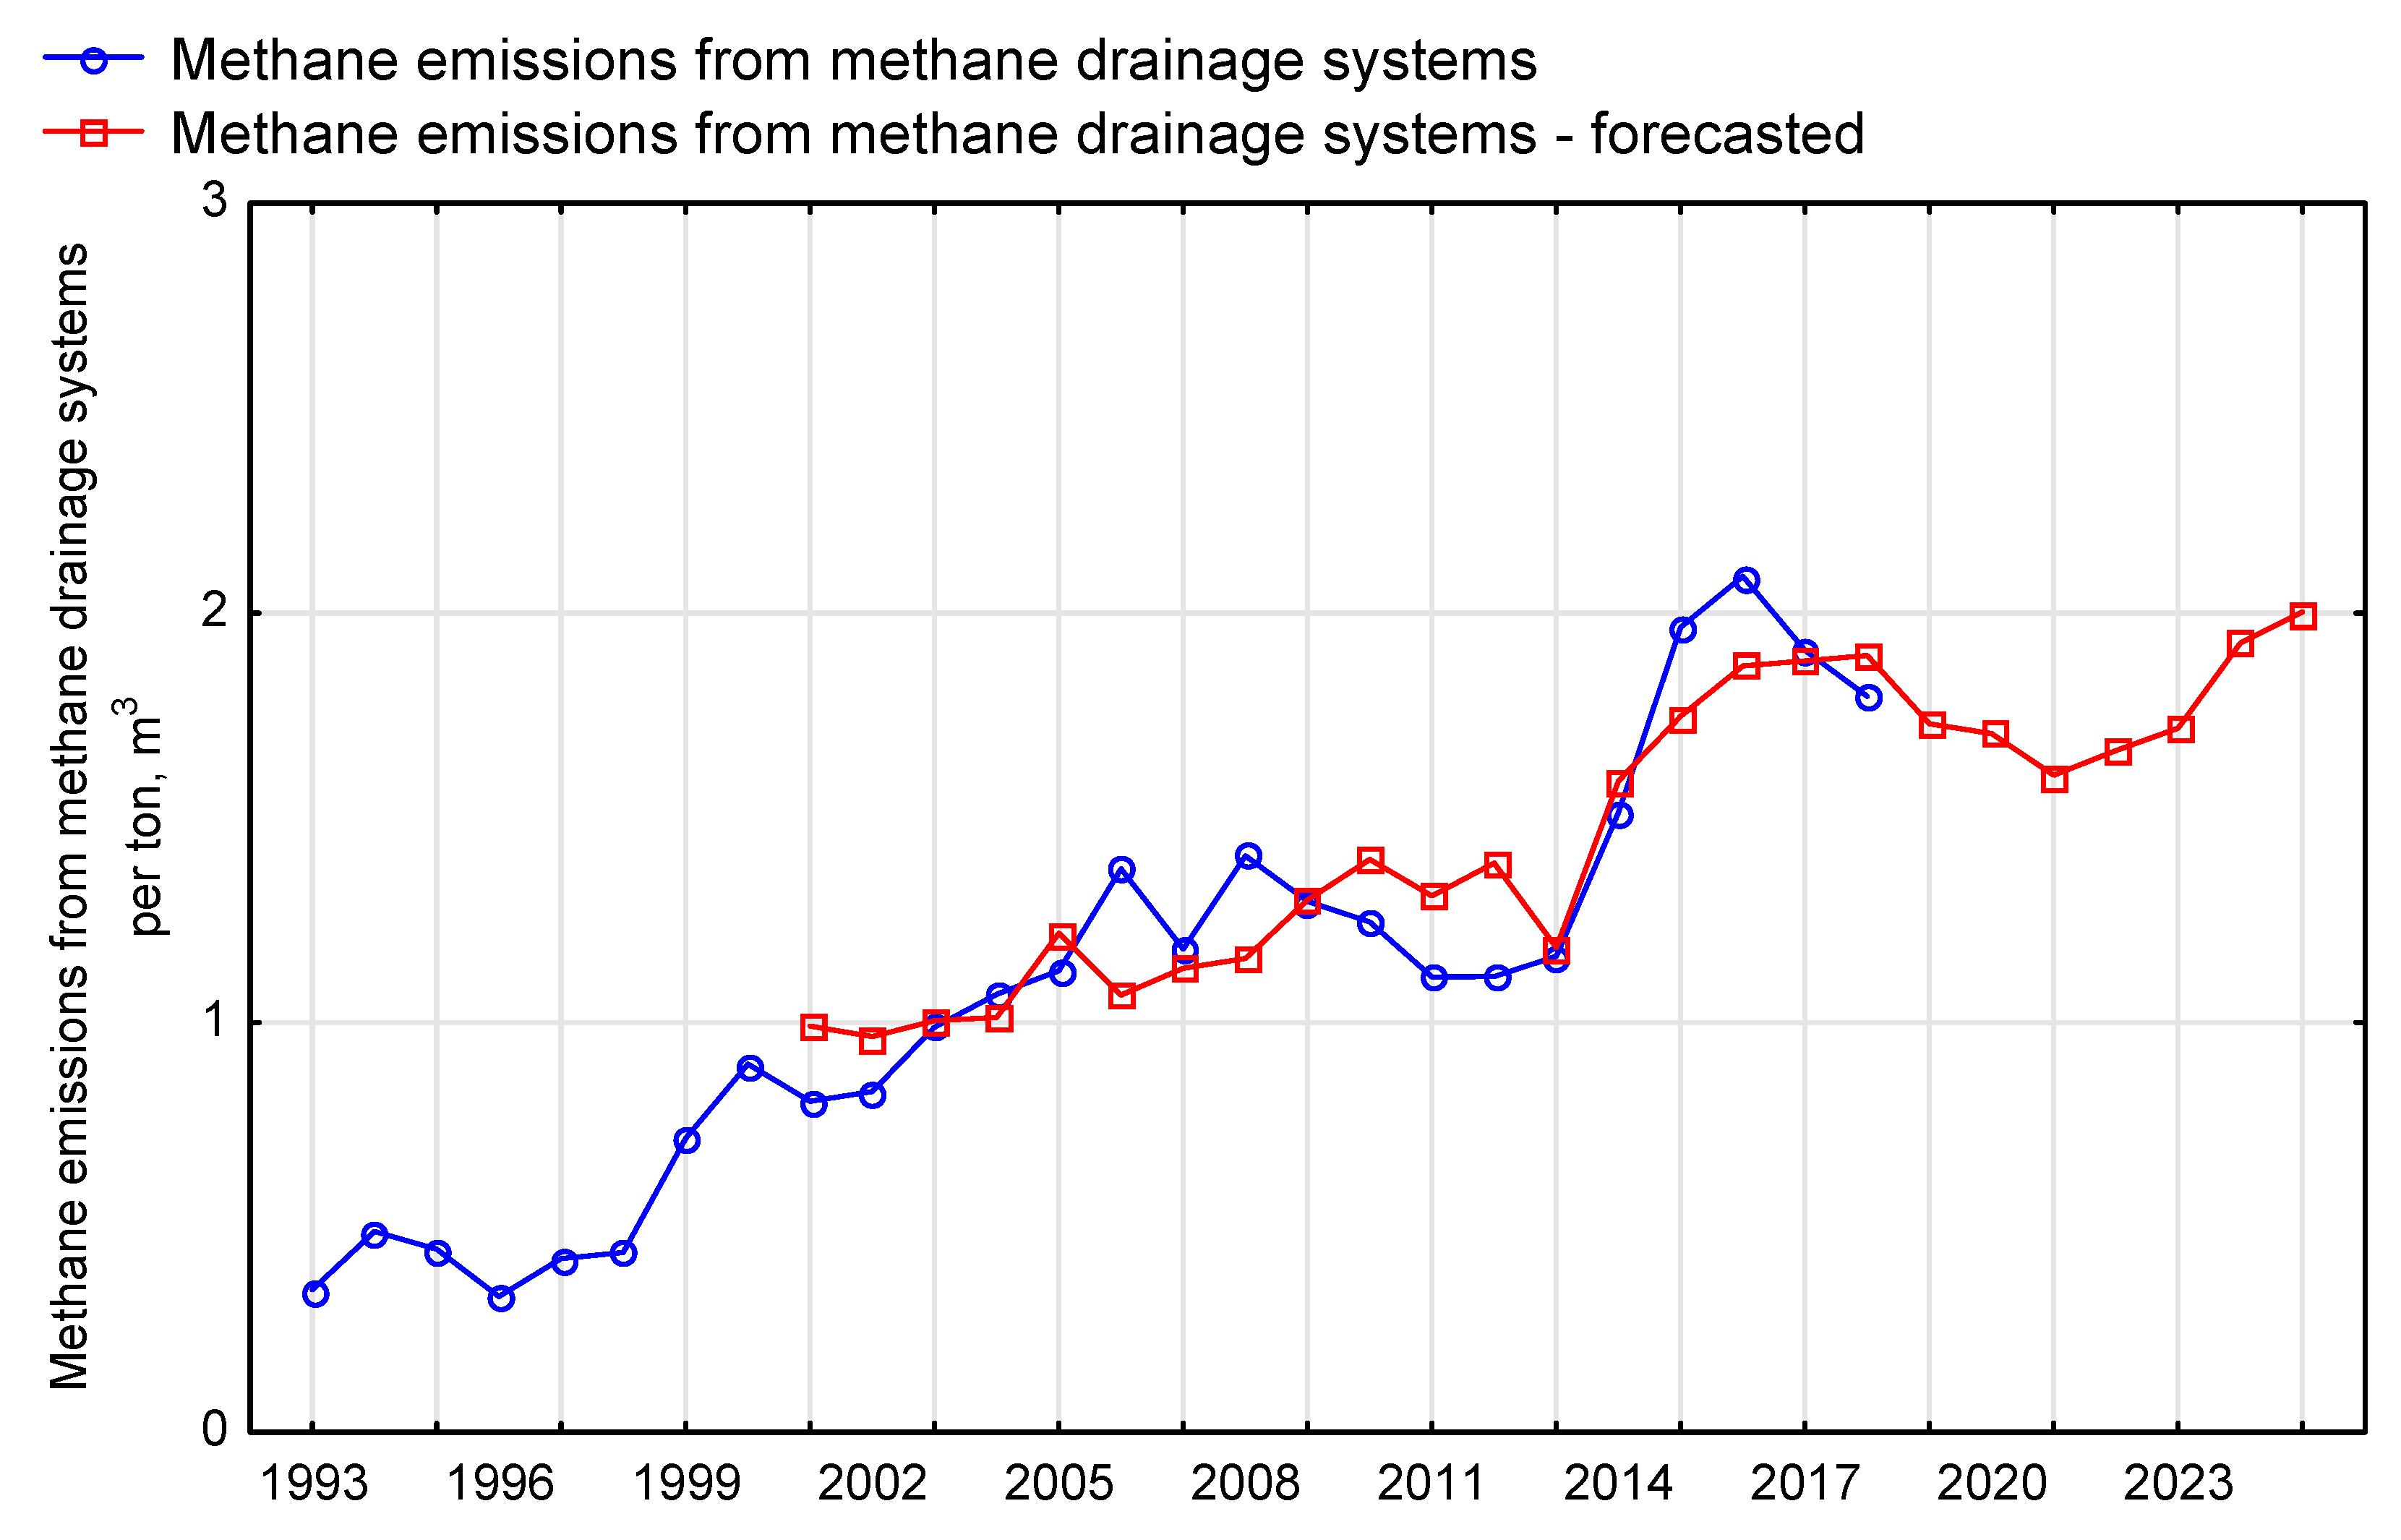
| Methane emissions from methane drainage systems | MLP 10-10-1 | 0.724 | 0.419 | exponential | logistic |
| Ventilation methane emissions per ton | MLP 4-15-1 | 0.721 | 0.0135 | logistic | logistic |
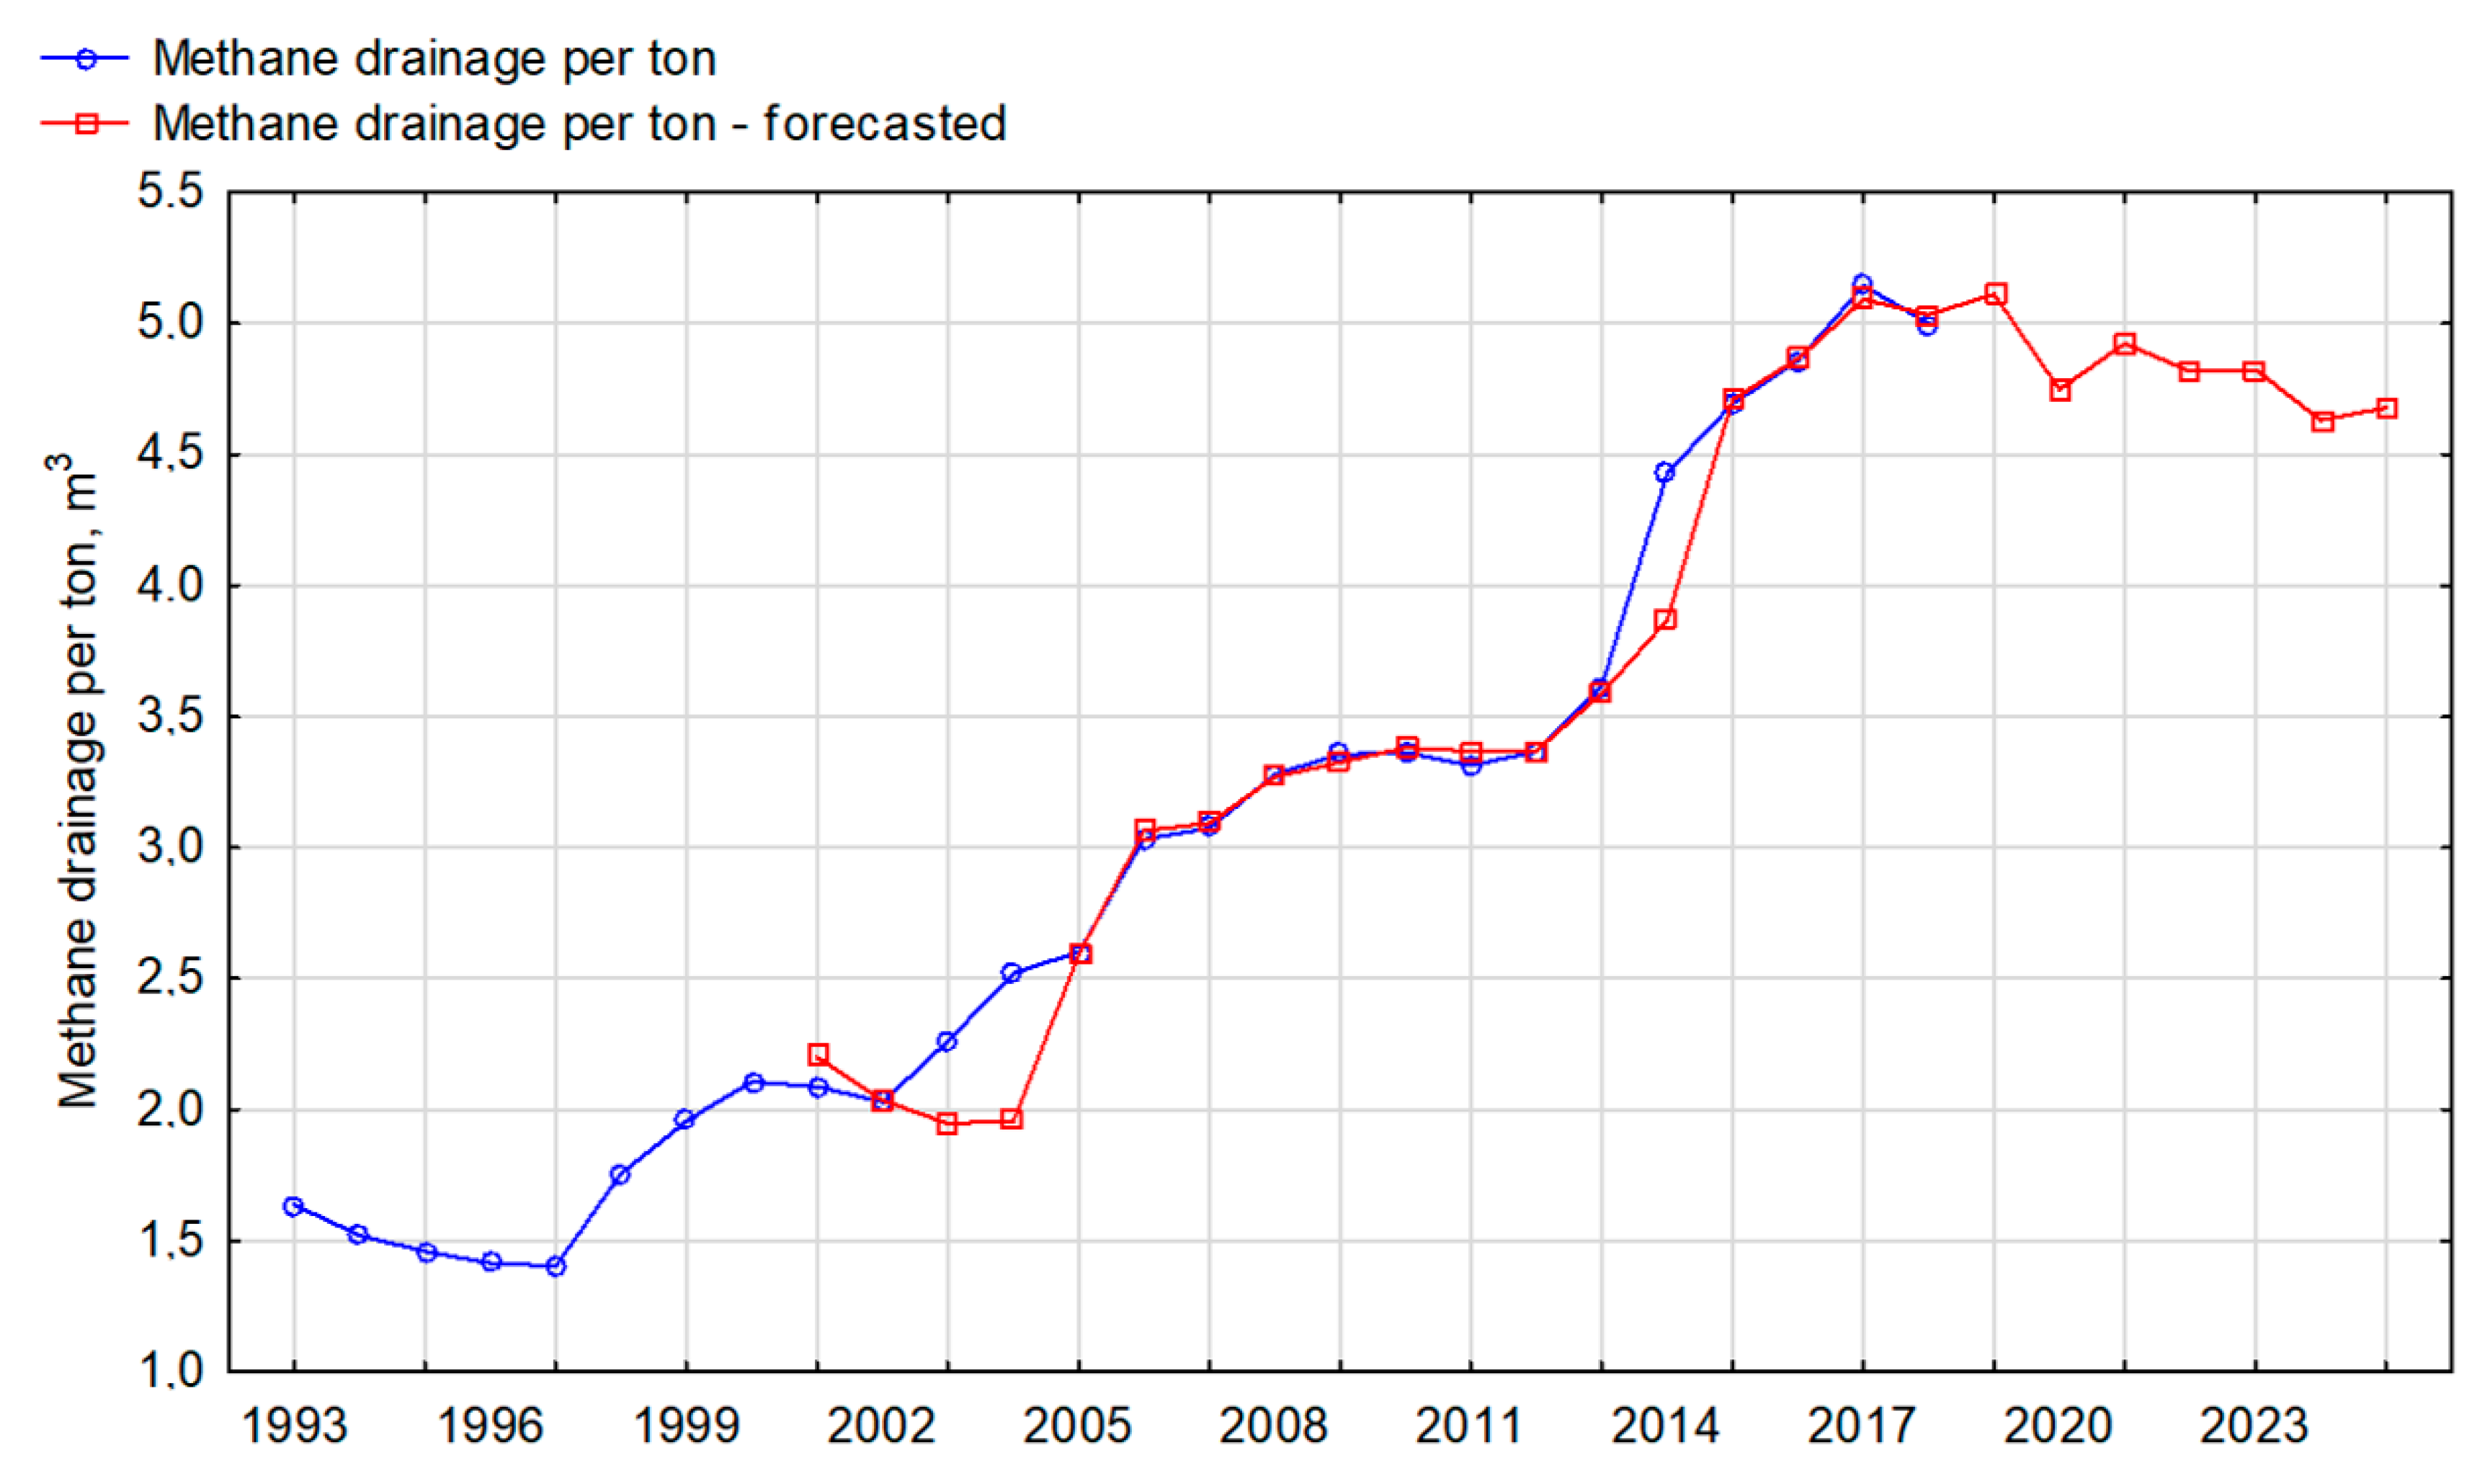
| Methane drainage per ton | MLP 4-5-1 | 0.799 | 0.0002 | hyperbolic tangent | linear |
| Methane emissions from methane drainage systems per ton | MLP 8-34-1 | 0.676 | 0.0062 | linear | exponential |
| Forecast Variant | MAE | MAPE, % | RMSE, % | RMSE Ex-ante | RMSE Ex-post |
|---|---|---|---|---|---|
| Ventilation methane emissions | 2.318 | 0.388 | 3.551 | 0.602 | 0.610 |
| Methane drainage | 7.843 | 3.079 | 10.698 | 3.130 | 3.872 |
| Methane emissions from methane drainage systems | 5.171 | 5.152 | 8.737 | 9.163 | 8.346 |
| Ventilation methane emissions per ton | 0.198 | 2.789 | 0241 | 2.662 | 3.362 |
| Methane drainage per ton | 0.104 | 3.494 | 0.205 | 4.244 | 6.059 |
| Methane emissions from methane drainage systems per ton | 0.126 | 9.936 | 0.157 | 9.565 | 11.751 |
© 2019 by the authors. Licensee MDPI, Basel, Switzerland. This article is an open access article distributed under the terms and conditions of the Creative Commons Attribution (CC BY) license (http://creativecommons.org/licenses/by/4.0/).
Share and Cite
Tutak, M.; Brodny, J. Forecasting Methane Emissions from Hard Coal Mines Including the Methane Drainage Process. Energies 2019, 12, 3840. https://doi.org/10.3390/en12203840
Tutak M, Brodny J. Forecasting Methane Emissions from Hard Coal Mines Including the Methane Drainage Process. Energies. 2019; 12(20):3840. https://doi.org/10.3390/en12203840
Chicago/Turabian StyleTutak, Magdalena, and Jarosław Brodny. 2019. "Forecasting Methane Emissions from Hard Coal Mines Including the Methane Drainage Process" Energies 12, no. 20: 3840. https://doi.org/10.3390/en12203840
APA StyleTutak, M., & Brodny, J. (2019). Forecasting Methane Emissions from Hard Coal Mines Including the Methane Drainage Process. Energies, 12(20), 3840. https://doi.org/10.3390/en12203840