Abstract
The interest in zero energy buildings is increasing in South Korea. Zero energy buildings need to save energy by using passive technology. The window performance is important to the thermal insulation of the building. Also, the government regulates the window performance through regulation and standards. However, it is difficult to predict window performance because the components of the window have become complicated due to the various materials used in the glass and frame. Based on window performance standards and regulations, the quality of window performance was managed. In this research, to consider thermal performance in proper window design in South Korea, we confirmed the impact on the thermal performance of the window through various kinds of materials and shapes. The authors also propose a window shape classification and frame calculation method based on actual test results. The authors analyzed the thermal performance data of the windows provided by the Korea Energy Agency and confirmed the change in the thermal performance of the windows by year and by frame material. The average U-value of the window decreased from 2012 to 2015 and maintained similar values until 2017. In 2018, this value was decreased to comply. Also, the authors confirmed the U-value of the windows through actual physical experiments and confirmed the change in thermal performance by the construction of the windows based on the results. The results show, in the case of aluminum windows, the U-value corresponding to Grade 3 (1.4–2.1 W/m2·K) was as high as about 60%. Regarding the analyzed results of the U-values of PVC windows, Grade 3 (U-value of 1.4–2.1 W/m2·K) accounted for about 35%, and Grade 2 (U-value of 1.0–1.4 W/m2·K) for about 29%. This paper also confirmed that the frame U-value of the PVC windows is lower than the frame U-value of the aluminum windows. Therefore, the authors proposed the performance index of the glazing part in PVC and aluminum window design. The results of this research can be used as basic data to identify problems in the method of determining the performance of windows in Korea.
1. Introduction
As part of a global effort to reduce greenhouse gas emissions, various methods for saving building energy have been attempted. The thermal performance of the building envelope, in particular, is a basic element. Moreover, this element has also been used in a passive energy saving method by appropriately designing the performance of windows suitable for each location. Smart window design does not imply a particular method, but this method includes energy analysis and a case study for selecting the optimal region, position, and performance of windows. However, curtain walls and façades have been used to satisfy the requirement for views, while meeting various aesthetic standards by increasing the area of the window. This has a disadvantageous thermal performance compared to a general wall with insulation. Thus, the demand for the performance improvement of the window has increased as the window area has increased in the building envelope. In the case of South Korea, interest in zero energy building is increasing and, in the case of new construction, the government regulates window performance criteria by building use and area through regulations and standards. The specified thermal performance requirement is the heat transmission coefficient (or U-value, W/m2·K). This test method is an actual test of a window sample according to the Korea industrial standards. Thus, Kim proposed guidelines for the standards and regulatory requirements of South Korea and other countries in previous research [1]. In reality, however, predicting a window’s performance is difficult because the components of windows have become complicated due to the various materials used in the glass and frame.
Cappelletti analyzed the influence of a window thermal bridge using a case study of clay walls that were externally insulated and had cavity insulation [2]. This study confirmed the position of the frame for reducing linear thermal transmittance. Results showed that moving the window from an internal to an external position reduced linear thermal transmittance by 70.75%. This decrease mainly depends on the installation position of the insulating layer within the window opening. This paper showed the importance of the suitable installation of a window in a wall. Adamus and Pomada [3] analyzed the effect of window installation for heat flow in a composite structure. This study experimented with simulation. Hee et al. [4] researched the importance of glazing performance on daylight and energy saving in buildings and found that the cost affects the qualities and performance of glazing proportionally. It is wise to perform techno-economic evaluations to obtain suitable glazing for a building. Tsikaloudaki et al. [5] also proposed methods to use the cooling energy saving of windows. In this study, cooling energy performance was assessed about ISO 18292 through the calculation of the cooling energy. This paper concluded that the results of the statistical analysis provided mathematical expressions, which were used in practice, with moderate errors, for predicting the cooling energy performance of windows concerning their thermal and optical properties. Kim et al. [6] verified the improved thermal performance of the double window system. In this paper, the patterns of airflow were also examined according to the operating mode change. The thermal performance analysis of conventional window systems showed that heat loss was reduced by 49% compared to the double window system. Carlosa and Corvacho [7] showed that the provided solar heat gain coefficient (SHGC) values depend on the airflow rate passing through the system and the portion of the glazed area about the glass portion of the window. These authors confirmed the effect of the SHGC, but these results also show the importance of the glass ratio of a window. According to these results, the designer needs to consider the ratio of glazing and frame in a window area. Wen et al. [8] proposed a new method of the window-to-wall ratio by case study. The authors also recommended that the window-to-wall ratio (WWR) maps for open office buildings in Japan be created, and noted that the impact of window selection is very important in building energy saving. Ihm et al. [9] studied the energy performance of residential buildings to determine the impact of window selection. In particular, the window-to-wall ratios were varied to determine the effect of window properties on heating, cooling, and total energy consumption.
Weather differences between Ulsan and Inchon, in South Korea, are also important; these cities are representative of the two major climate types in South Korea. Based on a life-cycle cost analysis, the cost-effectiveness of double Low-E clear glass filled with argon gas is greater for residential buildings in South Korea. Furthermore, this glass should be required by the building energy efficiency code. Thus, the designer must consider the design regulations and the energy performance of the window. For window design optimization, window size in the wall is very important [10]. Generally, optimizing the size of the window for energy-saving does not meet any of the predetermined visual acceptance criteria. Mangkuto et al. [11] also undertook a case study about design optimization considering window size, orientation, and wall reflectance. The analysis evaluated the effect of daylight dynamic metrics by the geometry and position of the opening, as well as the inside surface reflectance of the room. The study reached several conclusions applicable to window design [12]. In previous studies, researchers confirmed the effect of window installation in buildings. However, the optimization of window design for energy-saving and indoor comfort is difficult due to variations in climates and environments. Thus, the testing method of windows needs to be standardized through the use of official methods.
Prediction of window performance by various types of the window is important for energy consumption calculations in buildings. Thus, many researchers have reviewed the various types of window design and shapes, such as a complex window [13], design parameter for energy performance [14], window firm [15], transmittance [16], and current thermos chromic window [17]. These results highlight some of the preconditions. An important prerequisite is that the performance of all windows needs to be tested with the test organization’s official testing method. In South Korea, government officials responsible for construction regulations require the test paper of the actual window performance for permission of a new building. The actual test method of the window confirms the U-value of a window sample of the same size and configuration as the actual window to be installed. Furthermore, the Korean government manages a label system according to the level of performance. This system allows customers to easily select window products. Based on these standards and regulations, the quality of window performance is managed. However, studies on the performance of changing windows are not sufficient, relating only to changes in the components and appearance of the window. For efficient use of windows, smart window design must be used [18,19]. This method calculates the ratio of the window and frame in a window for energy-saving effects, such as passive control. In addition, this result should be applied to the appropriate position considering the performance of actual window products. Designers need to see how to calculate the thermal performance of windows through traditional testing methods. Window performance classification should separate the performance of each type of glazing and frame. In this research, to use thermal performance for smart window design in South Korea, we confirmed the tendency of the thermal performance of the window according to various kinds of materials and shapes. In this paper, we propose a window shape classification and frame calculation method based on actual test results. We confirm the trend of window thermal performance using the government database of window performance to provide a practical smart window design. Through window certification and window labeling system analysis in Korea, the authors show the minimum performance requirements of windows. Also, the authors confirmed the standard of the test environment and method and determined the variation of window thermal performance by year using the window database. This database was managed under the certification of the Korea Energy Agency. We also performed a complex performance analysis of the shape and type of glazing and frame according to the actual test results of the window. Finally, using these research results, we have a better understanding of the current level of window thermal performance. Figure 1 shows a flow chart of our method of research.
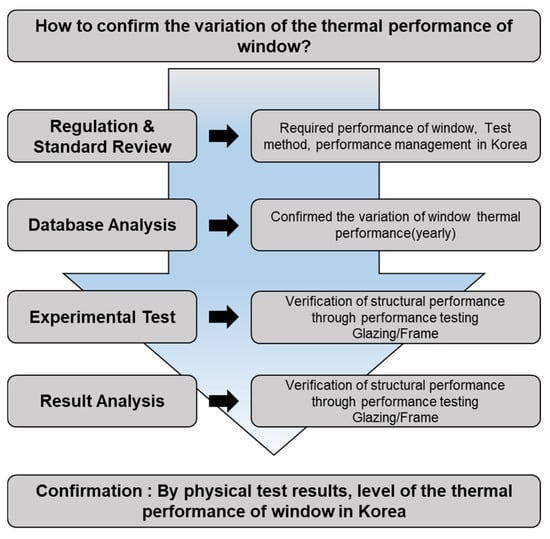
Figure 1.
Flow chart of method of research.
3. Changes in Window Thermal Performance through Database Analysis Results
In this section, the authors confirm the change in window thermal performance by year based on the database of the Energy standard and labeling program of the Korea Energy Agency. We also assess the effect of the variation of the frame on the thermal performance of a window.
3.1. The Variation of the Number of Registered Window by Year
Window data used in this chapter are managed by the Korean Energy Agency, and data on manufacturing and performance information are provided by the window set product category of manufacturer web pages. The performance was divided according to the grades of the ’Energy standard and labeling program’, which provides U-values. Thus, all information on window products were registered from 2012, and the database presented to the web page by product registration of each manufacturer [27].
As a result of confirming the number of registered products by year, we obtained the number of windows registered as 490 EA, 624 EA, 914 EA, 1037 EA, 848 EA, 1065 EA, and 975 EA in each year from 2012 to 2018, respectively. The number of registrations was highest in 2015 and decreased in 2016, but was nonetheless maintained at around 1000 per year. As a result of confirming the differences in frame material, the percentage of PVC windows was 56% in 2012. The ratio was 53% and 66% in 2013 and 2014, respectively. Percentages of 62%, 46%, 54%, 36% from 2015 to 2018, respectively, indicate that it occupies a considerably high proportion as compared with window frames made of other materials. Aluminum window percentages were 31%, 29%, 23%, 29%, 44%, 37%, and 53% from 2012 to 2018, respectively. In 2018, the aluminum window percentage of registered windows was greater than that of PVC windows. Figure 4 shows the results of the registration quantity of window frame materials.
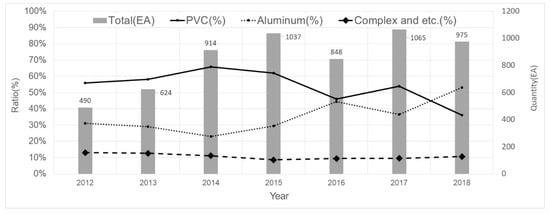
Figure 4.
Registration quantity of window by year.
3.2. Change in Window Thermal Performance by Year
From 2012 to 2018, the average U-value of windows was found to be 1.710 W/m2·K, 1.518 W/m2·K, 1.384 W/m2·K, 1.331 W/m2·K, 1.367 W/m2·K, 1.328 W/m2·K, and 1.190 W/m2·K, respectively. According to these results, we confirmed the U-value decreased by 0.192 W/m2·K and 0.134 W/m2·K in 2013 and 2014, respectively. From 2014 to 2017, the U-values of windows were nearly constant at 1.3 W/m2·K. Moreover, the U-value in 2018 was 1.190 W/m2·K, which is a very low value. Figure 5 shows the results of U-value variation by frame type.
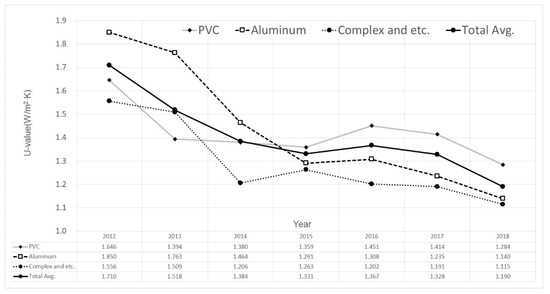
Figure 5.
Variation of U-value by frame type in each year.
By confirming the differences in window frames we confirmed that, in the case of PVC windows, from 2012 to 2018 the average U-values were 1.646 W/m2·K, 1.394 W/m2·K, 1.380 W/m2·K, 1.359 W/m2·K, 1.451 W/m2·K, 1.414 W/m2·K, and 1.284 W/m2·K, respectively. By the results of aluminum windows, from 2012 to 2018 we confirmed that the average U-values were 1.850 W/m2·K, 1.763 W/m2·K, 1.464 W/m2·K, 1.291 W/m2·K, 1.308 W/m2·K, 1.235 W/m2·K, and 1.140 W/m2·K, respectively. Also, in the case of complex, etc. window frames, from 2012 to 2018 the average U-values were 1.556 W/m2·K, 1.509 W/m2·K, 1.206 W/m2·K, 1.263 W/m2·K, 1.202 W/m2·K, 1.191 W/m2·K, and 1.115 W/m2·K, respectively.
3.3. Analysis of Window Thermal Performance Variation
According to the analysis of the performance data, in this paper, we confirmed that the average U-value of the window decreased from 2012 to 2015 and maintained a similar value until 2017. The window test results in 2016 do not tend for the U-value to be constantly compared to the 2015 window test results. The reason is that the tendency of the data decreases as the amount of performance testing of the windows decreases. Besides, the amount of performance testing of aluminum windows has increased, to be similar to the number of PVC windows, and it is considered that the latter has been exceeded. In 2018, this value decreased. In consideration of the decreasing tendency from 2016, as the registration number steadily increased from the start of registration in 2012 to 2015, it can be judged that the required performance value of the windows is generally satisfied based on 2015. Following the strengthening of the method of the heat transmission coefficient of Korea in 2018, it can also be judged that the value of the heat transmission coefficient is low because the thermal characteristics of the newly registered windows are improved. In terms of the frame material classification of windows, the aluminum frame was used because the heat transmission coefficient of aluminum frame windows steadily decreased from 1.4050 W/m2·K in 2012 to 1.140 W/m2·K in 2018. It is considered that the thermal performance of the window steadily increased. However, the performance of the window cannot be analyzed in detail based on the registered materials, such as the material of the frame, and the performance of the glass used for the configuration of the windows and the glass depends on the classification of the materials used. Therefore, the performance of the glass used for the actual composition and the ratio of the glass to the frame were confirmed [28], and that it was necessary to check the thermal performance according to the configuration of the windows [29].
4. Analysis of Changing Thermal Performance According to Window Composition
4.1. Constituent Classification of Windows and Physical Experiment Results
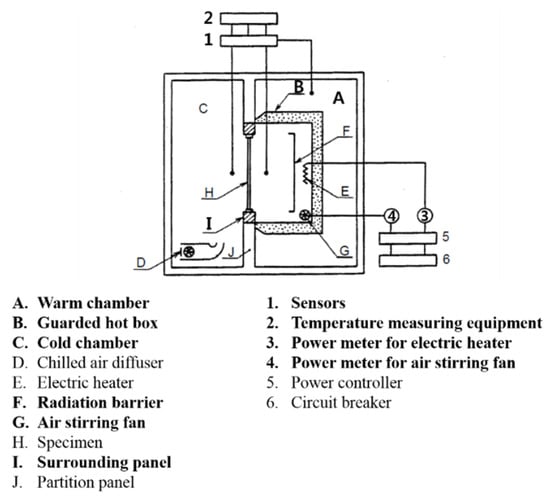
In general, the window can be divided into a transmission glass part (glazing) and a frame part. In order to confirm the thermal performance of the windows, significant effort is made to enhance the thermal performance of each part; however, in the case of physical testing of the thermal performance of the window, due to size restrictions of the windows, test windows may be composed of a ratio different from that of the windows of a building [30]. In particular, to register in the "Energy Standards and Labeling Program", specimens of 2 m width and 2 m length are required for testing laboratories. Therefore, there may be differences in thermal performance due to the difference between the glass area and the frame area. Also, the configuration of the frame and the glass portion may be different due to the form of the window, and the fragility of heat (this mean is more conductive than other parts) can be displayed differently [31]. In this study, the influence of the construction of the windows on the heat transmission coefficient derived from the physical examination was also analyzed for the glass applied to the fitting, and the frame material, the glass portion and the area ratio of the frame, the form of the windows, etc., were examined. The windows were classified as sliding, double cut-up sliding, quadruple cut-up sliding, fixed window, fixed window with a project (etc.), and project window. For the opening type and composition of glazing, we divided windows into single windows and double windows. Figure 6 shows the equipment of the window thermal performance and the classification of window type.
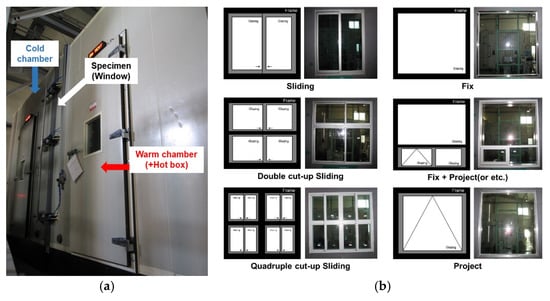
Figure 6.
Equipment of the window thermal performance test (a) and shapes of various window types (b).
The total number of windows used for the research was 134, and windows were utilized based on the actual physical examination data. Single windows numbered 109 and double windows numbered 25. As a result of examining the heat transmission coefficient from the data, the average heat transmission coefficient of the total number of windows tested was 1.597 W/m2·K; for single windows, the average heat transmission coefficient was 1.673 W/m2·K, and for double windows, it was 1.263 W/m2·K. Thus, the heat transmission coefficient of the double windows was about 24% lower than that of the single windows, and the lower thermal performance of the single window compared to the double window was confirmed. From the checking of the heat transmission coefficient of the windows by frame material, the U-values were found to be in a range of 0.675–3.560 W/m2·K, with an average U-value of 1.519 W/m2·K. The U-values of aluminum windows ranged from 0.811 to 3.246 W/m2·K, with an average U-value of 1.616 W/m2·K. As a result, the performance distribution of the material-specific windows showed that the U-value distribution of PVC windows appeared to be greater and that the average U-value of the PVC window was about 0.097 W/m2·K lower. Figure 7 shows the results of U-value distribution by frame material type.
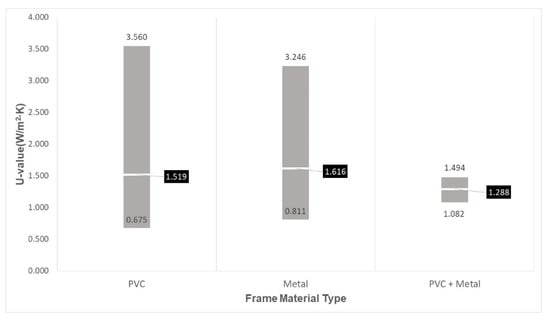
Figure 7.
U-value distribution by frame material type.
4.2. Thermal Performance Analysis of Glazing by Simulation
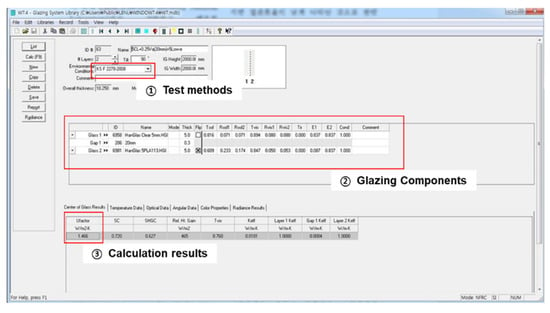
In the case of glazing applied to windows recently, heat insulation performance is enhanced using double glazing in which a gas layer is formed between two single glass plates or triple glazing in which gas layers are formed between three single glass plates [32]. In Korea, it is difficult to separately assess changes in the U-value of windows according to the type of glass since the U-value of the entire window is confirmed without separating the glass and the frame. In particular, the necessary thermal performance is derived through various constitutional differences, such as using low-E glass, which is a functional glass, and vacuum glass, and filling using an inert gas such as argon or others. Figure 8 shows an example scheme for multiple glazing components.
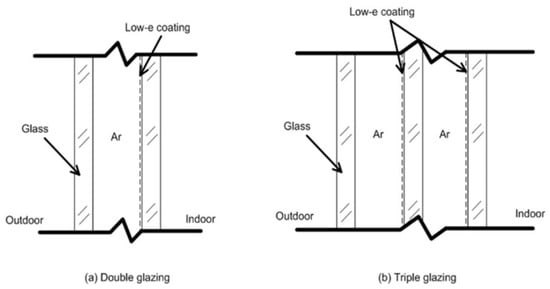
Figure 8.
Examples of glazing components.
In the case of glass, the IGDB provides a certified performance from each international manufacturer so that it can be used for simulations and other purposes. The thermal performance of glass can be confirmed according to the product model of each manufacturer using the simulation program. In this study, we confirmed the detailed product information of the glass used for the actual physical test windows. Thus, with reference to information on the applied glasses, double glazing was divided into six types, and each product model was applied. Triple glazing was classified into three types, and each product model was also applied. A U-value was derived for each glass configuration through simulation. The simulation tool used the WINDOW program provided by LBNL, and the environmental conditions, such as applied indoor and outdoor temperature and heat transfer resistance, were provided by KS F 2278.
As a result of confirming the U-value of the glass part by simulation, the average U-value was 1.401 W/m2·K. In the case of the aluminum window, the average U-value was 1.240 W/m2·K, and in the case of the PVC window, it was 2.136 W/m2·K. Thus, in the case of PVC windows, since the ratio of double windows is higher than that of aluminum windows, it is considered that the glazing performance of the latter is relatively low.
4.3. Analysis of Thermal Performance Due to Differences in Construction of Windows
The physical test results of the windows and the simulation results of the used glass part were integrated, and the difference in thermal performance according to the form and configuration of the windows was classified by frame material and analyzed. In the case of aluminum windows, the double window was formed as a quadruple cut-up sliding window, and the depth of the window was set to 235 to 250 mm. The proportion of the glass portion of the frame ratio averaged 65%, the average U-value of windows was 1.315 W/m2·K, and the average U-value of the glazing was 1.268 W/m2·K. Since it was a double window, it was considered that the ratio of the glazing part was low relative to the whole area and that the influence of the frame was large, although the performance of the glazing part could be set higher. In the case of an aluminum single window, the fixed and other ratio appears as its highest at about 48%, and in the fixed window the ratio is about 30%. When the ratio of the glazing portion exceeds 80%, it is confirmed that the area of the glazing portion of the window is relatively large, along with occupying a ratio of about 60% or more as a whole. The ratio of the U-value of windows corresponding to Grade 3 (1.4–2.1 W/m2·K) of the "Energy Standards and Labeling Program" was as high as about 60%. Glazing with U-values of 1.1–1.3 W/m2·K represented approximately 57% of the total, and it was confirmed that the U-value of the windows was higher than the performance of the glazing section. Figure 9 shows the analysis results of the aluminum window.
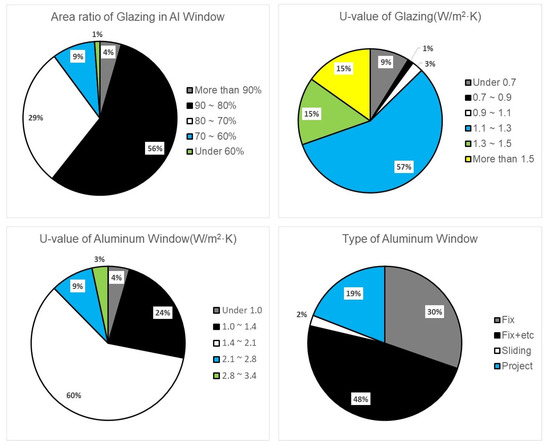
Figure 9.
Analysis results of the aluminum window.
In the case of PVC windows, the depth of the double window was set to 170 to 260 mm. In the case of the quadruple cut-up sliding windows, the proportion of glazing was generally about 52%–54%. In the case of sliding windows, the proportion of glazing was about 68%–76%, and the depth of the window was set to 235 to 250 mm. Also, we confirmed that the proportion of glazing was about 52%–54%, and the proportion of glazing in sliding windows was about 68%–76% in the case of quadruple cut-up sliding windows. By these results, the authors confirmed the U-values of the window and glazing as 1.460–1.613 W/m2·K and 3.353–3.952 W/m2·K, respectively. The performance of the glass was set to low, but it was constructed with double windows to improve the performance of the frame. Moreover, thereby, the performance of the whole window was set to the required level. When the U-value was 0.675 to 0.735 W/m2·K, the U-value of glazing was 1.217 to 1.300 W/m2·K. Therefore, the double window requires high-performance glazing for a window less than 1.0 W/m2·K. The proportion of the single PVC window was the highest at 71%. Compared to the frame, the proportion of glazing corresponding to a 70%–80% window was highest at 71%, and to an 80%–90% window was 18%. In the PVC window, we confirmed that the proportion of glazing was very high. From the results of the U-value of the windows, Grade 3 (U-value of 1.4–2.1 W/m2·K) represented about 35%, and Grade 2 (U-value of 1.0–1.4 W/m2·K) represented about 29%. From this result, it was confirmed that the U-value of 1.1 to 1.3 W/m2·K in the glazing range has the highest share at 33%. Figure 10 shows the analysis results of PVC windows.
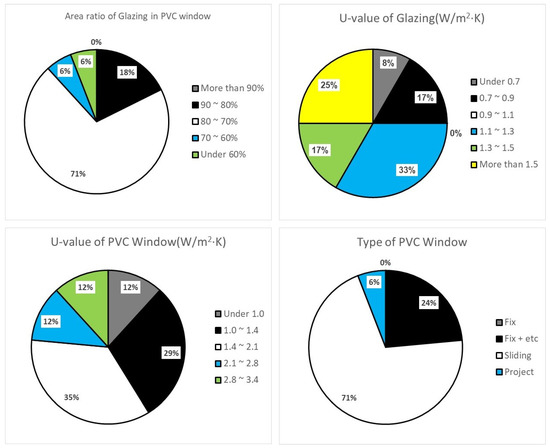
Figure 10.
Analysis results of PVC windows.
Equation (2) shows the frame U-value formula for each part’s performance, where UF is the U-value of the frame, and UW and UG are the U-values of the window and glazing, respectively. AW, AG, AF are the areas of the window, glazing, and frame, respectively. Since the value of the test result utilized in this study is the U-value of the entire window for which the type of spacer and the theoretical performance of the glass and frame cannot be confirmed, the spacer is installed and only the area is excluded from the glass UG calculation. In the test method conducted in this study, the frame performance of the window includes the performance of the spacer because the effect of the spacer cannot be measured separately. At this time, the area of the glass excludes the area where the spacer was used. The part of frame and the glass overlap is divided into the performance of the frame.
By the results of the aluminum window, the frame performance was confirmed considering the ratio of the window glass. If the glazing ratio was 90% or more, the average U-value of the frame was 3.872 W/m2·K; when the glazing ratio of 80% to 89%, it was 2.934 W/m2·K; also, the case of 70% to 79%, UF was 3.308 W/m2·K; and, the glazing ratio of 60% to 69% was 4.276 W/m2·K. As a result, it was confirmed that the frame U-values of the glazing ratio of 80% to 89%, which accounted for the highest proportion of frames among the total test results of the aluminum windows, was displayed at the lowest level. When PVC windows were analyzed, the frame performance was confirmed considering the ratio of the window glass. In the case of the glazing ratio of 80% to 89%, the U-value of the frame was 3.838 W/m2·K; and the portion of glazing of 70% to 79% has 2.658 W/m2·K. Also, in the case of the glazing ratio of 60% to 69%, U-value was 2.332 W/m2·K. It was confirmed that the frame U-value of the PVC windows was shown to be lower than the frame U-value of the aluminum windows.
4.4. Propose to the Performance Index of Glazing Parts in Window Design
According to the performance level of the energy and labeling program to distinguish the thermal performance of window in Korea, to confirm the performance of glazing that can achieve the evaluation of window, by using the grade of the Korean window obtained through this study, an index for selecting the performance of the glazing part was proposed. The performance index of the glazing part provided was based on the performance of the frame proposed in Equation (2), using the thermal performance of the surveyed Korean windows as a guide. The performance index of the glazing part is divided according to the ratio of the area of the glazing part in the window; also, this index proposed the minimum U-value of the glazing part for the suitable performance level. By experimental test results, the average U-value of the frame was applied to the frame U-value of each window. Moreover, the illustration of glazing components was described together in the figure.
The authors proposed the performance index of the glazing part to achieve the graded performance of the PVC window, as shown in the Figure 11. This index showed glazing area (each axis and example picture), glazing U-value (color spot on axis and value), frame U-value (Uf), and Grade level (color rhombus). By this index, a designer could consider the glazing U-value level by material type of window and glazing area level. In the case of the glazing part being 85%, a designer uses a glazing with a U-value of 0.5 W/m2·K or less in order to construct a window of Grade 1. In addition, in order to construct Grade 2 and 3 windows, the glazing sections must satisfy 0.97 W/m2·K and 1.79 W/m2·K, respectively. Cases of 75%, 65%, 55% area of glazing could use a glazing part corresponding to 0.45 W/m2·K, 0.28 W/m2·K, 0.28 W/m2·K to make a Grade 1 window. Therefore, it is not suitable for constructing a single sliding window using a general double-layer glazing or triple-layer glazing. In order to solve this, the construction of the window must be chosen for a double sliding window or the structure of the frame must be improved.
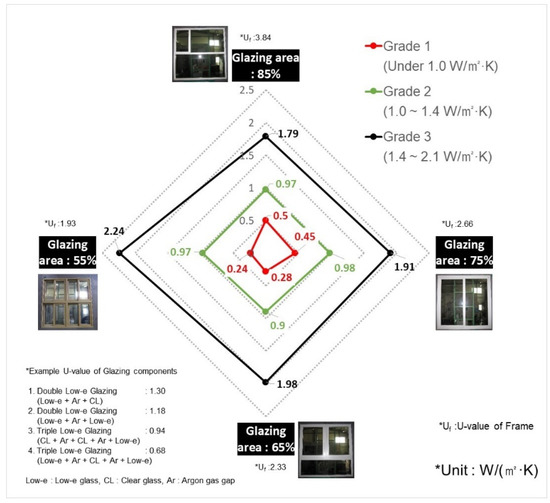
Figure 11.
Performance index of glazing part in PVC windows design.
As shown in Figure 12, the performance index of the aluminum window glazing part is different from the performance index of the glazing part of the PVC window. To achieve the Grade 1 window, it is necessary to set the glazing part to 0.85 W/m2·K when it corresponds to 95% of the glazing part. It is necessary to set the Grade 2 and Grade 3 window with glazing parts 1.27 W/m2·K and 2.01 W/m2·K, respectively. When the area of the glazing part corresponds to 65%, it was confirmed that the evaluation of each window cannot be achieved through the improvement of the performance of the glazing part. This is thought to be due to the low frame thermal performance of aluminum windows used in Korea.
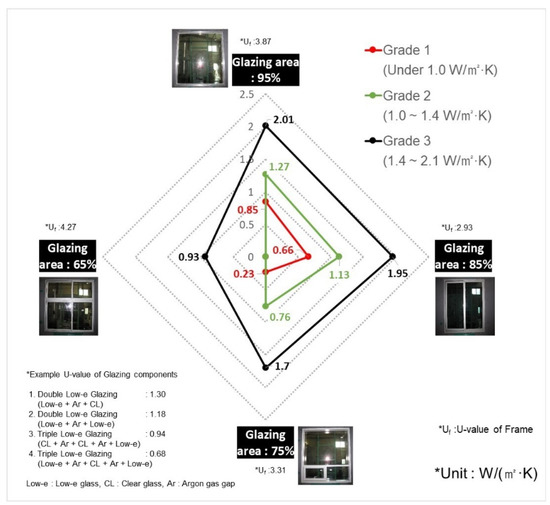
Figure 12.
Performance index of glazing part in aluminum windows design.
Based on these results, when designing a window, the designer can roughly grasp the performance of the glazing part according to the frame type, configuration, and form of the window. When the designer does not find suitable glazing performance about window design, they could apply the median value of similar glazing area or glazing components. According to the improvement of the frame performance, the area ratio can be predicted.
5. Conclusions
In this paper, we confirmed the regulation and certification of window performance in Korea and analyzed the method and management system for testing this performance. Based on this, the performance data of the managed windows were analyzed, and the form and performance of the windows were classified. Also, we confirmed the change in the heat insulation performance by window construction through actual physical experiment. The results of this study are as follows.
(1) Based on the results of the research on the performance of existing windows, we confirmed the method of performance assessment of the windows, and the performance required to meet both the Building Energy Conservation Design Standards related to windows and the energy standard and labeling program. To assess the performance of the windows required previously, we confirmed the method of measuring the performance of the windows used in Korea and confirmed that it is necessary to classify the factors affecting the performance of the windows. So, by these results, we could identify the limits of the measurement methods (specimen size, the ambiguity of performance division about glazing, and frame).
(2) In this study, we analyzed the thermal performance data of the windows provided by the Korea Energy Agency and confirmed the change in the thermal performance of the windows by year and the change in thermal performance by frame material. The average U-value of the windows decreased from 2012 to 2015 and maintained a similar value until 2017. In 2018, this value decreased. The aluminum frame was used because the U-value of the aluminum frame windows steadily decreased from 1.4050 W/m2·K in 2012 to 1.140 W/m2·K in 2018. It is considered that the thermal performance of the window steadily increased. By these results, we confirmed that the thermal performance of the window was affected by the grade of the energy labeling program. This means that the thermal performance of the window was determined by government requirements.
(3) The authors confirmed the U-value of the windows through actual physical experiments and confirmed the change in thermal performance by the construction of the windows based on the results. Besides, based on the results of the thermal performance analysis of glazing through simulation, the thermal performance was analyzed by the difference in the construction of the glazing and the frame. The proportion of aluminum windows with a U-value corresponding to Grade 3 (1.4–2.1 W/m2·K) was as high as about 60%. Glazing with a U-value of 1.1–1.3 W/m2·K accounted for approximately 57%, and it was confirmed that the U-value of the windows was higher than the performance of the glazing section. Regarding the analyzed results of the U-values of PVC windows, Grade 3 (U-value of 1.4–2.1 W/m2·K) accounted for about 35%, and Grade 2 (U-value of 1.0–1.4 W/m2·K) for about 29%. From this result, it was confirmed that glazing with a U-value range of 1.1 to 1.3 W/m2·K accounted for the highest share, of 33%. This paper also confirmed that the frame U-value of the PVC windows is lower than the frame U-value of the aluminum windows.
(4) By these results, the authors proposed the performance index of the glazing part in PVC and aluminum window design. In the case of PVC window design, the designer can roughly predict the performance of the glazing part according to the frame type, configuration, and form of window. Also, authors confirmed that the performance index of the glazing part in aluminum window design could not propose the performance of glazing for Grade 1 and Grade 2 window configuration.
Through this study, we confirmed the change in the performance of windows in Korea and the changes in thermal performance due to the composition and material. Especially the material of the frame is important for window shape and glazing area in the window area, because the cases occur where it is impossible to determine the combination of glazing parts to achieve the performance requirement value of the window.
Based on this result, it is expected to be useful for future Korean smart window design solutions. The results of this research can be used as basic data to identify problems in the method of determining the performance of windows in Korea. Since Korea specifies the required performance of the entire window, it is difficult to grasp the detailed thermal performances of changes in the glass and frame materials that make up the window. Also, although it is possible to compare the performance of the same specimen with the window performance test, it is difficult to predict the performance change of the window if the size of the actual applied window differs. Therefore, the authors would like to propose consideration of the prediction of the change of performance with the change of the size of the window in the future, using the analysis in this research for predicting the form of the window and the performance of the frame. So, the performance index of glazing part in PVC and aluminum window design was proposed for suitable chose of glazing thermal performance. Also, to consider the impact of cost and energy consumption, as with the results of this study, we will further understand the impact of cost and energy consumption associated with performance differences in window; further research is underway to confirm in future research.
Author Contributions
Conceptualization, methodology, writing—original draft preparation, writing—review and editing, S.-H.K. and H.J.; project administration, funding acquisition, S.C.
Funding
This research was funded by the Korea Institute of Energy Technology Evaluation and Planning (KETEP) and the Ministry of Trade, Industry & Energy (MOTIE) of the Republic of Korea, grant number 20172010105690 and The APC was funded by the Korea Institute of Energy Technology Evaluation and Planning (KETEP) and the Ministry of Trade, Industry & Energy (MOTIE) of the Republic of Korea (No. 20172010105690).
Acknowledgments
This work was supported by the Korea Institute of Energy Technology Evaluation and Planning (KETEP) and the Ministry of Trade, Industry & Energy (MOTIE) of the Republic of Korea (No. 20172010105690).
Conflicts of Interest
The authors declare no conflict of interest.
References
- Kim, S.; Kim, S.; Kim, K.; Cho, Y. A study on the proposes of energy analysis indicator by the window elements of office buildings in Korea. Energy Build. 2014, 73, 153–165. [Google Scholar] [CrossRef]
- Cappelletti, F.; Gasparella, A.; Romagnoni, P.; Baggio, P. Analysis of the influence of installation thermal bridges on windows performance: The case of clay block walls. Energy Build. 2011, 43, 1435–1442. [Google Scholar] [CrossRef]
- Adamus, J.; Pomada, M. Analysis of heat flow in composite structures used in window installation. Compos. Struct. 2018, 202, 127–135. [Google Scholar] [CrossRef]
- Hee, W.J.; Alghoul, M.A.; Bakhtyar, B.; Elaye, O.; Shameri, M.A.; Alrubaih, M.S.; Sopian, K. The role of window glazing on daylighting and energy saving in buildings. Renew. Sustain. Energy Rev. 2015, 42, 323–343. [Google Scholar] [CrossRef]
- Tsikaloudaki, K.; Theodosiou, T.; Laskos, K.; Bikas, D. Assessing cooling energy performance of windows for residential buildings in the Mediterranean zone. Energy Convers. Manag. 2012, 64, 335–343. [Google Scholar] [CrossRef]
- Kim, J.; Kim, T.; Leigh, S. Double window system with ventilation slits to prevent window surface condensation in residential buildings. Energy Build. 2011, 43, 3120–3130. [Google Scholar] [CrossRef]
- Carlosa, J.S.; Corvacho, H. Evaluation of the performance indices of a ventilated double window through experimental and analytical procedures: SHGC-values. Energy Build. 2015, 86, 886–897. [Google Scholar] [CrossRef]
- Wen, L.; Hiyama, K.; Kogane, M. A method for creating maps of recommended window-to-wall ratios to assign appropriate default values in design performance modeling: A case study of a typical office building in Japan. Energy Build. 2017, 145, 304–317. [Google Scholar] [CrossRef]
- Ihm, P.; Park, L.; Krarti, M.; Seo, D. Impact of window selection on the energy performance of residential buildings in South Korea. Energy Policy 2012, 44, 1–9. [Google Scholar] [CrossRef]
- Ochoa, C.E.; Aries, M.B.C.; van Loenen, E.J.; Hensen, J.L.M. Considerations on design optimization criteria for windows providing low energy consumption and high visual comfort. Appl. Energy 2012, 95, 238–245. [Google Scholar] [CrossRef]
- Mangkuto, R.A.; Rohmah, M.; Asri, A.D. Design optimisation for window size, orientation, and wall reflectance with regard to various daylight metrics and lighting energy demand: A case study of buildings in the tropics. Appl. Energy 2016, 164, 211–219. [Google Scholar] [CrossRef]
- Acosta, I.; Campano, M.; Molina, J.F. Window design in architecture: Analysis of energy savings for lighting and visual comfort in residential spaces. Appl. Energy 2016, 168, 493–506. [Google Scholar] [CrossRef]
- Sun, Y.; Wu, Y.; Wilson, R. A review of thermal and optical characterisation of complex window systems and their building performance prediction. Appl. Energy 2018, 222, 729–747. [Google Scholar] [CrossRef]
- Dussault, J.; Gosselin, L. Office buildings with electrochromic windows: A sensitivity analysis of design parameters on energy performance, and thermal and visual comfort. Energy Build. 2017, 153, 50–62. [Google Scholar] [CrossRef]
- Li, C.; Tan, J.; Chow, T.; Qiu, Z. Experimental and theoretical study on the effect of window films onbuilding energy consumption. Energy Build. 2015, 102, 129–138. [Google Scholar] [CrossRef]
- Fasi, M.A.; Budaiwi, I.M. Energy performance of windows in office buildings considering daylight integration and visual comfort in hot climates. Energy Build. 2015, 108, 307–316. [Google Scholar] [CrossRef]
- Ye, H.; Meng, X.; Xu, B. Theoretical discussions of perfect window, ideal near infrared solar spectrum regulating window and current thermos chromic window. Energy Build. 2012, 49, 164–172. [Google Scholar] [CrossRef]
- Kiran Kumar, G.; Saboor, S.; Kumar, V.; Kim, K.; Ashok Babu, T.P. Experimental and theoretical studies of various solar control window glasses for the reduction of cooling and heating loads in buildings across different climatic regions. Energy Build. 2018, 173, 326–336. [Google Scholar]
- Egan, J.; Finn, D.; Soares, P.H.D.; Baumann, V.A.R.; Aghamolaei, R.; Beagon, P.; Neu, O.; Pallonetto, F.; O’Donnell, J. Definition of a useful minimal-set of accurately-specified input data for Building Energy Performance Simulation. Energy Build. 2018, 165, 172–183. [Google Scholar] [CrossRef]
- Ministry of Land, Transport and Maritime Affairs. Building Energy Conservation Design Standard; Ministry of Land, Transport and Maritime Affairs: Sejong, Korea, 2008. [Google Scholar]
- Ministry of Knowledge Economy. Energy Efficiency Equipment Operating Regulations; Ministry of Knowledge Economy: Sejong, Korea, 2012. [Google Scholar]
- Korea Agency for Technology and Standards. KS F 3117: Windows Set, 2015. Available online: http://www.kssn.net/en/search/stddetail.do?itemNo=K001010105704 (accessed on 10 October 2019).
- Korea Agency for Technology and Standards. KS F 2278: Standard Test Method for Thermal Resistance for Windows and Doors. 2017. Available online: http://www.kssn.net/en/search/stddetail.do?itemNo=K001010113352 (accessed on 10 October 2019).
- Korea Agency for Technology and Standards. KS F 2292: The Method of Air Tightness for Windows and Doors. 2018. Available online: http://www.kssn.net/en/search/stddetail.do?itemNo=K001010122343 (accessed on 10 October 2019).
- Korea Agency for Technology and Standards. Available online: http://www.kats.go.kr/content.do? cmsid=27 (accessed on 10 October 2019).
- Lawrence Berkeley National Laboratory, COMFEN. Available online: http://www.lbl.gov/ (accessed on 10 October 2019).
- Korea Agency for Energy. Available online: http://eep.energy.or.kr/ (accessed on 10 October 2019).
- Alves, T.; Machado, L.; de Souza, R.G.; de Wilde, P. Assessing the energy saving potential of an existing high-rise office building stock. Energy Build. 2018, 173, 547–561. [Google Scholar] [CrossRef]
- Buenoa, B.; Cejudo-Lopez, J.M.; Kuhn, T.E. A general method to evaluate the thermal impact of complex fenestration systems in building zones. Energy Build. 2017, 155, 43–53. [Google Scholar] [CrossRef]
- Gou, S.; Nik, V.M.; Scartezzini, J.; Zhao, Q.; Li, Z. Passive design optimization of newly-built residential buildings in Shanghai for improving indoor thermal comfort while reducing building energy demand. Energy Build. 2018, 169, 484–506. [Google Scholar] [CrossRef]
- Cho, S.; Kim, S. Analysis of the Performance of Vacuum Glazing in Office Buildings in Korea: Simulation and Experimental Studies. Sustainability 2017, 9, 936. [Google Scholar] [CrossRef]
- Gustavsena, A.; Grynning, S.; Arasteh, D.; Jelle, B.P.; Goudey, H. Key elements of and material performance targets for highly insulating window frames. Energy Build. 2011, 43, 2583–2594. [Google Scholar] [CrossRef]
© 2019 by the authors. Licensee MDPI, Basel, Switzerland. This article is an open access article distributed under the terms and conditions of the Creative Commons Attribution (CC BY) license (http://creativecommons.org/licenses/by/4.0/).

