Article

Enhancing Oscillation Damping in an Interconnected Power System with Integrated Wind Farms Using Unified Power Flow Controller

1
College of Electrical and Information Engineering, Zhengzhou University of Light Industry, Zhengzhou 450002, China
2
Electrical and Computer Engineering Department, Oakland University, Rochester, MI 48309, USA
3
Department for Management of Science and Technology Development, Ton Duc Thang University, Ho Chi Minh City 800010, Vietnam
4
Faculty of Electrical and Electronics Engineering, Ton Duc Thang University, Ho Chi Minh City 800010, Vietnam
*
Author to whom correspondence should be addressed.
Energies 2019, 12(2), 322; https://doi.org/10.3390/en12020322
Submission received: 11 December 2018 / Revised: 13 January 2019 / Accepted: 14 January 2019 / Published: 21 January 2019

Abstract

:
The well-developed unified power flow controller (UPFC) has demonstrated its capability in providing voltage support and improving power system stability. The objective of this paper is to demonstrate the capability of the UPFC in mitigating oscillations in a wind farm integrated power system by employing eigenvalue analysis and dynamic time-domain simulation approaches. For this purpose, a power oscillation damping controller (PODC) of the UPFC is designed for damping oscillations caused by disturbances in a given interconnected power system, including the change in tie-line power, the changes of wind power outputs, and others. Simulations are carried out for two sample power systems, i.e., a four-machine system and an eight-machine system, for demonstration. Numerous eigenvalue analysis and dynamic time-domain simulation results confirm that the UPFC equipped with the designed PODC can effectively suppress oscillations of power systems under various disturbance scenarios.

1. Introduction

1.1. Motivation

In the past decade, renewable energy generation has developed quickly around the globe. The wind power generation installed capacity is currently ranked the second highest in renewable energy technology, after hydro [1]. By integrating large-scale wind farms, which are mainly doubly-fed induction generators (DFIG) [2], into a power system concerned, wind energy is expected to supply 20% of global electricity by 2030 [3].
In spite of the benefits of wind power generation, if not controlled properly, a high-level penetration of wind power generation could have negative impacts on power system dynamic stability, especially the oscillation damping characteristics. Oscillations are in-built phenomena of a power system, especially an interconnected one. Typically, the oscillation frequency in ≈0.1–2 Hz belongs to electromechanical oscillations, which can be classified as local mode oscillations and interarea mode oscillations [4,5,6]. In an M+N-machine interconnected power system including two independent power systems, i.e., a M-machine independent power system and a N-machine one, there will be M+N-1 electro-mechanical oscillation modes and numerous operating scenarios. Electro-mechanical oscillatory modes and damping may become worse if the power system operating condition changes, especially with the increasing penetration of wind power integration. Therefore, in a wind farm integrated power system, it is important to analyze the oscillation damping characteristics.

1.2. Literature Review

In 2003, the potential impacts of large-scale wind farm integration on power system damping characteristics was first investigated in Reference [7], and later followed by References [8,9]. The research work in References [10,11,12,13] shows that a large-scale wind power integrated power system suffers new challenges with respect to stability. More specifically, damping inter-area oscillation is becoming more difficult under many conditions in an interconnected power system with a large-scale integrated wind power. Therefore, it is necessary to carefully examine the impacts of DFIG on power system inter-area oscillation and find some strategies to enhance oscillation damping characteristics.
The well-known flexible AC transmission system (FACTS) is very effective in controlling power flow [14,15]. FACTS devices can also contribute to voltage stability improvement and oscillation damping enhancement. Because of its flexibility and capability in controlling power system dynamics effectively [16,17], the FACTS device has been employed for voltage support and stability improvement [18], as well as for making the transmission system with a small capacity margin operate more reliably.
In Reference [19], it is shown that with an appropriate controller design, it becomes possible to control the wind turbine under various operating conditions, while reducing the structural oscillations at the same time. In Reference [19], the classic proportional-integral-derivative (PID) controller, input–output pole placement controller and full state feedback controller for wind turbine pitch control are compared. Control of power flow and stability improvement in a power system with offshore wind and seashore wave farms using unified power flow controller (UPFC) are both discussed in Reference [20]. To mitigate sub-synchronous resonances in a power system, a comprehensive analysis on utilizing UPFC in the transmission system has been given [21], and a damping controller was interrogated through extensive time domain simulations so as to attain the best damping performance for oscillations.
In Reference [22], a simultaneous robust coordinated multiple damping controller design strategy for a power system incorporating the power system stabilizer (PSS), static Var compensator, power oscillation damper, and DFIG power oscillation damper is presented. Simulation results show that the proposed DFIG power oscillation damper can coordinate well with other damping controllers for enhancing power network damping performance. Some control strategies of UPFC, such as the widely-used proportional integral (PI) control, fuzzy control [23], robust finite-time control [24], and add-on self-tuning control [25], are applied to enhance the damping characteristics. Meanwhile, an adaptive fractional integral terminal sliding mode power controller of UPFC [26], a feedback controller [27], and a novel DFIG damping controller [28] are developed to maintain the supply and demand balance in a power system with high wind power penetration.

1.3. Contributions

Although the oscillation damping characteristics of wind farm generators have been reported in existing publications, some important issues are still not yet addressed. Impacts of the tie-line power, DFIG output and the UPFC damping controller on the damping oscillation characteristics of an interconnected power system have not yet been thoroughly examined. Given this background, the following issues are addressed in this work:
  • A power oscillation damping controller (PODC) is designed and used with UPFC for damping oscillations in an interconnected power system.
  • The continuous load fluctuation profile is employed for oscillation characteristics analysis.
  • Typical impacting factors such as tie-line power, DFIG output, and load disturbances, as well as the damping controller of UPFC, are considered as part of a small signal stability analysis of an interconnected power system.
  • Eigenvalue analysis and dynamic time-domain simulations are carried out to examine the capability of UPFC on improving inter-area oscillation mode and enhancing oscillation damping of an interconnected power system with wind farm integrated.
This paper is organized as follows. Models of UPFC and DFIG are presented in Section 2. Eigenvalue analysis for small signal stability is addressed in Section 3. Oscillation damping characteristics in a wind farm are presented in Section 4 and the PODC controller of UPFC developed in Section 5. Sensitivity studies are presented in Section 6, and a large system application in Section 7. Conclusions are given in Section 8.

2. System Configuration and Models

Figure 1 shows the block scheme of the studied power network with a DFIG, a synchronous generator, and a UPFC integrated together. This scheme is referred to the industry model and is used widely in commercial power system simulations. The currents and voltages are the outputs of the synchronous generator and UPFC.

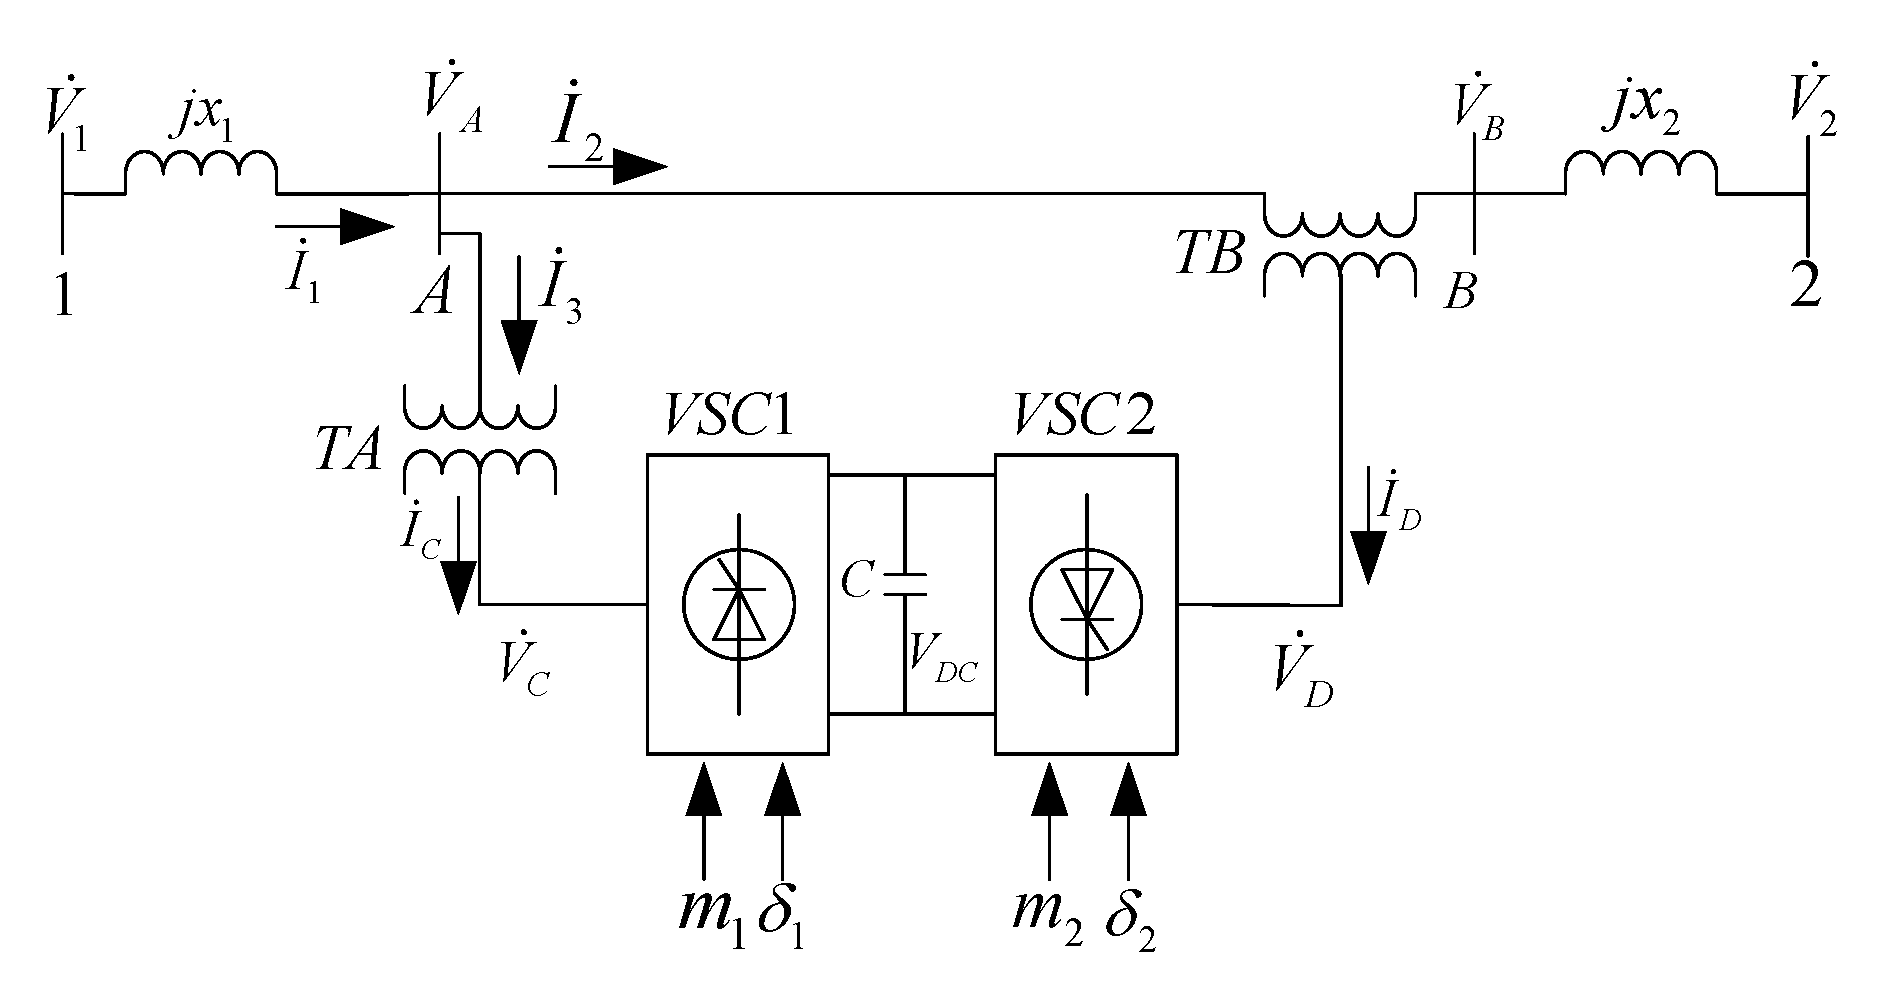
2.1. Modelling of UPFC

As illustrated in Figure 2, the UPFC contains a static synchronous shunt compensator (VSC1) and a series one (VSC2). VSC1 and VSC2 are coupled together through a DC link capacitor that provides bidirectional power exchanges between them. The parallel converter VSC1 is connected to the power system through a parallel transformer TA, and an adjustable reactive current is injected into the connecting point of the system. It is equivalent to a parallel current source, providing or absorbing reactive power, so as to control the connecting point voltage VA. VSC2 is connected to the system through the series transformer TB. Different from the parallel side, it can be used to control both active and reactive power on the line by placing an adjustable voltage to the connecting point. Regarding the regulation of UPFC, the series voltage source is used to exchange active and reactive power with the system by using a DC capacitor for transferring active power and simultaneously maintaining the stability of the capacitor voltage. The mathematical model of the UPFC is formulated as Equation (1):
{ [ V A d V A q ] = [ 0 x A x A 0 ] [ i 3 d i 3 q ] + 1 2 [ m 1 V D C cos δ 1 m 1 V D C sin δ 1 ] [ V B d V B q ] = [ 0 x B x B 0 ] [ i 2 d i 2 q ] 1 2 [ m 2 V D C cos δ 2 m 2 V D C sin δ 2 ] d V D C d t = 3 m 1 4 C [ cos δ 1 sin δ 1 ] [ i 3 d i 3 q ] 3 m 2 4 C [ cos δ 2 sin δ 2 ] [ i 2 d i 2 q ]
From Figure 2, the electric field energy exchange rate of the DC capacitor can be attained using:
C D C V D C d V D C d t = Re [ V ˙ C I ˙ C * V ˙ D I ˙ D * ]
The current and voltage of the parallel side and series side converters are subject to the following equation constraints:
{ ( r C + j ω l C ) I ˙ C = V ˙ A V ˙ C ( r D + j ω l D ) I ˙ D = V ˙ B V ˙ D
UPFC is a passive component, and the capacitor voltage must be maintained constant in steady state operation:
Re [ V ˙ C I ˙ C * V ˙ D I ˙ D * ] = 0

2.2. Modeling of DFIG

The mechanical power of DFIG can be computed using:
{ P m = 0.5 ρ A V 3 C p A = π R 2
where C P can be attained using:
{ C p ( λ , β ) = 0.22 ( 116 / λ 0 0.4 β 5 ) e 12.5 / λ 0 1 / λ i = 1 / ( λ + 0.08 β ) 0.035 / ( β 3 + 1 )
The dynamics of the drive train can be expressed as:
{ d ω r / d t = ( T s h T e D t ω r ) / 2 H g d θ t / d t = ω b ( ω t ω r ) d ω t / d t = ( T m T s h ) / 2 H t
where Te, Tsh, and Tm can be expressed as:
{ T m = P m / ω t = 0.5 ρ π R 2 C P V 3 / ω t T s h = K s h θ t + D s h ω b ( ω t ω r ) T e = L m ( i d s i q r i q s i d r )
Detailed DFIG models can be found in References [9,29,30]. In the d-q frame, the DFIG can be modeled using:
{ x s / ω s × d i d s / d t = [ r s + ( x s x s ) / ω s T 0 ] i d s +   x s i q s + v d s ( 1 s r ) e d s + e q s / ω s T 0 v d r L m / L r x s / ω s × d i q s / d t = [ r s + ( x s x s ) / ω s T 0 ] i q s x s i d s + v q s ( 1 s r ) e q s e d s / ω s T 0 v q r L m / L r d e d s / d t = s r ω s e q s ω s v q r L m / L r [ e d s + ( x s x s ) i q s ] / T 0 d e q s / d t = s r ω s e d s + ω s v d r L m / L r [ e q s ( x s x s ) i d s ] / T 0
The UPFC and DFIG models presented above are used in the next sections for small signal stability analysis in a power system with wind farms integrated.

3. Fundamentals of Small Signal Stability Analysis

The state space model of a power system can be formulated as a differential and algebraic equation (DAE) set as described by Equation (10), in which the differential equations and algebraic equations of UPFC and DFIG as described in Section 2 are included.
{ x ˙ = f ( x , y ) 0 = g ( x , y )
where, x and y are the vectors of the state variables and the algebraic variables, respectively.
The state space model can be linearized, and then eigenvalues and eigenvectors can be used to evaluate the small signal stability of the power system.
From the Taylor series expansion at a stable operating point (x0, y0), DAE can be linearized as
[ Δ x ˙ 0 ] = [ x f y f x g y g ] [ Δ x Δ y ] = [ A 1 B 1 C 1 D 1 ] [ Δ x Δ y ]
where ∇xf = ∂f(x,y)/∂x is the gradient of f(x,y); other symbols are defined similarly.
If ∇xg is nonsingular, Equation (11) can then be expressed as
Δ x ˙ = [ A 1 B 1 ( C 1 ) 1 D 1 ] Δ x = A Δ x
where A is the state matrix.
λ = σ + j ω is an eigenvalue of A. Any nonzero n-column vector/nonzero n-row vector respecting Equation (13) are called the right/left eigenvector associated with λ .
{ A w = λ w v A = λ v
where f = ω / 2 π is the oscillation frequency.
The damping ratio is defined as: ξ ( % ) = σ / σ 2 + ω 2 × 100 % . Based on the eigenvalues, the participation factors, which can reflect the relative contribution of each system state variable to a specified system mode, can be obtained with the right eigenvector w and left eigenvector v accordingly. Specifically, pij = wijvji/wTjvj is the participation factor of the i-th state variable to the j-th eigenvalue.

4. Oscillation Damping Analysis of a Power System Using UPFC with Compensated Wind Farms

4.1. Test System

The well-known two-area four-machine interconnected power system, as shown in Figure 3 [4], is widely used for small-signal stability analysis. In this system, G1–G4 represent a group of generators that are strongly coupled, and both local and inter-area oscillation modes are observed. Neglecting the magnetic saturation, G1–G4 are described by a six-order model equipped with an IEEE (Institute of Electrical and Electronics Engineers) type 1 voltage regulator [4]. G1 and G2, and G3 and G4, are equipped with fast and slow exciters, respectively. An equivalent wind farm is connected to bus 6 in area 1, representing a wind farm with a capacity of 30 MW or 20 DFIGs with 1.5 MW each. The data of DFIG with respect to the model presented in Section 2, are given in Table 1. Based on the residue index [31], an UPFC is located in line 8–9.
For the purpose of comparisons, a base scenario was defined as the system without the wind farm and UPFC. In this system, the total installed synchronous generation capacity was 2800 MW.
The active power transmission capability of the tie-line from area 1 to 2 was 400 MW. The electro-mechanical modes, as well as eigenvalues, damping, frequency, and dominant machines, are shown in Table 2.
The participation factor was used to assess the contributions of G1–G4 to an oscillatory mode, as demonstrated in Table 2. It can be seen that λ1 was characterized by the oscillation of G3 against G4 in area 2; λ2 was characterized by the oscillation of G1 against G2 in area 1; λ3 was characterized by the oscillation of G1 and G2, which were located in area 1, against G3 and G4, which were located in area 2; while λ4 was characterized by the oscillation among G1, G2, G3, G4, and DFIG.
Therefore, λ1 and λ2 represented local modes; λ3 and λ4 represented interarea oscillation modes. From the results presented in Table 2, it is known that the oscillation damping ratio tended to increase with the installation of UPFC.

4.2. Oscillation Damping Analysis in a Compensated Wind Farm

The oscillation damping circumstances in the power system with the integration of a compensated wind farm is addressed in this subsection to identify appropriate cases for further studies. The Power System Analysis Toolbox (PSAT) [32] and MATLAB/Simulink were employed to carry out simulations for various scenarios. Two main factors for oscillation damping analysis were investigated: (1) the level of the series compensation, and (2) the DFIG output.
The DFIG output was assumed to be 30 MW, while three various compensation levels, i.e., 30%, 50%, and 80%, were examined. A three-phase short-circuit grounding fault located at the tie-line between buses 7 and 8 is served for demonstration. The angle oscillations were obtained for different cases, while the time-domain responses are shown in Figure 4a. It is illustrated that with the increase of the series compensation level, the magnitude of oscillations became smaller.
Three different values, i.e., 10, 50, and 90 MW, were specified for the wind farm output. A fixed 80% series compensation was applied. The angle oscillations were obtained for different cases as shown in Figure 4b, and the time-domain responses show that the magnitude of oscillations became larger with the increase of the DFIG output.
Similar sets of simulations were conducted with different system conditions. It was observed that with the decreasing compensation level and increasing wind power output, the damping behaviors of the system tended to worsen. Hence, oscillation instability may happen under some combinations of a low compensation level and a high wind power output.

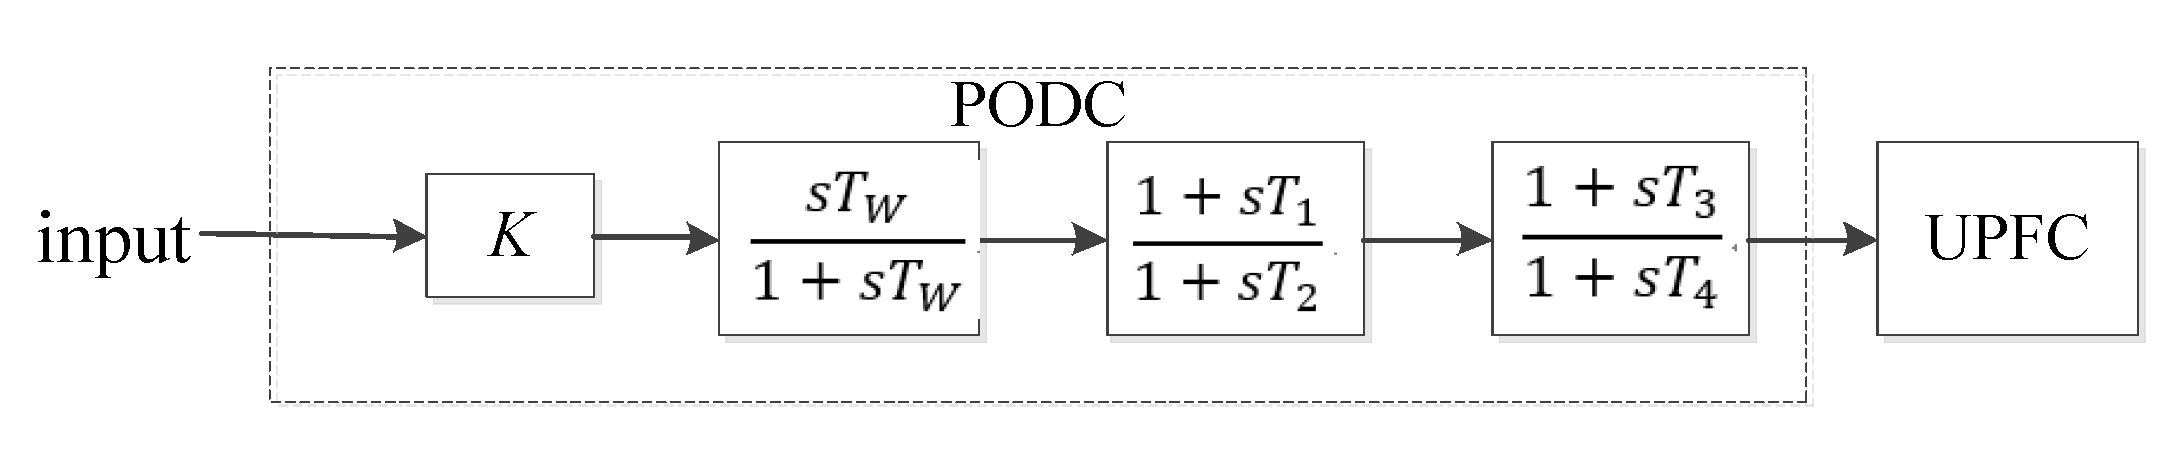
5. Power Oscillation Damping Controller of UPFC

A power oscillation damping controller (PODC) is developed based on swing equations to damp oscillations caused by disturbances in a power system.
The input signals of the PODC can be various quantities associated with the tie-line, such as voltage, current, or the power flow on the tie-line. The output of this controller is fed as an input to the shunt side of the UPFC. The configuration of the PODC is displayed in Figure 5 and is very similar to the PSS controller. It consists of two lead and lag components; gain K; time constants Tl, T2, T3, and T4; and the time constant for the washout circuit Tw. The data of the PODC are listed in Table 3.
It was specified that the load on bus 7 fluctuates 5% during the period from 1.0 s to 1.5 s; the active power output from each generator in G1, G2, G3, and G4 was 700 MW; the power output from the wind farm was 30 MW, and the transmitted power from region 1 to region 2 was 430 MW. Figure 6 shows the power angle response curve of G4 and the voltage curve at bus 9.
As shown in Figure 6, when the system low frequency oscillation occurs, the oscillation amplitude increased and tended to be stable for a long time without the installation of the PODC; especially in Figure 6b, the voltage curve became jagged due to the numerical oscillation problem. When the PODC was added, the oscillation amplitude decreased, and tended to be stable in short time.
Compared with the results presented in Reference [22], similar conclusions can be drawn that the relative power angle low frequency oscillations can be damped out by equipping a PODC.

6. Sensitivity Analysis

This section presents sensitivity analysis to explore the oscillation damping characteristics of a wind farm integrated power system, under different operating conditions.

6.1. Disturbance of Tie-Line Power Change

To investigate the effects of the UPFC capability on mitigating the intra-area damping oscillation, the damping oscillation modes under different degrees of the tie-line power flow are examined. For this purpose, the outputs of G1–G4 were adjusted under various operating conditions and the output power of DFIG was set at 30 MW with a compensation level of 80%.
The tie-line power transmitted from area 1 to 2 can be changed by adjusting the outputs of G1–G2 in area 1. The related damping characteristic trends of the intra-area oscillation modes are given in Table 4.
For the sake of comparisons, the following three cases are investigated:
  • Without UPFC: Basic case
  • With UPFC, Without PODC: Corresponding to the scenario described in Section 4
  • With both UPFC and PODC: Corresponding to the scenario described in Section 5
It is demonstrated, from the results in Table 4, that with the variation of the tie-line power from 46 MW to 430 MW, ξ of the intra-area oscillation mode 2 shown decreased for all three cases, while the oscillation damping ratio for the case with both UPFC and PODC equipped increased.
As shown in Figure 7, the UPFC was indeed effective in mitigating the oscillations. Similar sets of simulations were conducted with different levels of tie-line power, and the similar response curve profiles attained are given in Figure 7.

6.2. Disturbance of Transmission Line Outage

The effect of UPFC in damping oscillations during transmission line outage is investigated in this subsection. In this case, the active power flow in the tie-line was around 430 MW, and the power output from the wind farm was 30 MW. It was assumed that the transmission line between bus 7 and bus 9 was out of service at 1 s. As shown in Figure 8, the results were similar with those in Section 6.1. Figure 8 shows the voltage response curves at bus 7 under different scenarios. As shown, the employment of both UPFC and PODC resulted in better performance in damping oscillations compared with the case with only UPFC, even in worse conditions.

6.3. Oscillation Modes with Different Levels of Wind Penetration

The performance of the UPFC in damping oscillations under different wind penetration levels is addressed in this subsection. As described in Section 6.1, the DFIG output was 30 MW. To maintain the tie-line power from region 1 to region 2 at 400 MW, the power outputs from G1 and G2 were adjusted under different levels of wind penetration.
The interarea oscillation modes under different DFIG penetration levels are shown in Table 5. The examined wind power output level was from 0 to 70 MW and the oscillation damping characteristics are then investigated. From Table 5, it was known that with the increase of the output power of DFIG, f of the intra-area oscillation mode 1 tends to decrease, ξ decreases initially and then increases, while f and ξ of the intra-area oscillation mode 2 tend to increase under different system conditions with the UPFC equipped. The results indicate that the employment of the UPFC can make interarea oscillation eigenvalues fall into the region with a larger stability margin.

6.4. System Robustness Analysis

In order to systematically examine the UPFC performance on enhancing power system robustness, suppose at tf = 1.0 s, a three-phase short-circuit grounding fault occurred on bus 8, and was cleared at tc = 1.2 s.
The following three cases are investigated:
  • Case 1: Both the UPFC and PODC were not equipped. The power output of the wind farm was 30 MW, and the tie-line power from region 1 to region 2 was 430 MW;
  • Case 2: The UPFC was equipped and the PODC was not. The power output of the wind farm and the tie-line power from region 1 to region 2 were the same with those in Case 1;
  • Case 3: Both the UPFC and PODC were equipped. The power output of the wind farm was 50 MW, and the tie-line power from region 1 to region 2 was 449 MW.
The curves of δ G 1 and P4 are shown in Figure 9. The superior performance in mitigating oscillations using the UPFC is demonstrated, compared with the case without the UPFC equipped. The oscillations were damped in 12 s after the fault was cleared for the case with the UPFC equipped, and in about 20 s for the case without the UPFC equipped. Moreover, the capability of the UPFC in mitigating oscillations was further enhanced by the coordinated use of the PODC and UPFC. In other words, oscillations were more significantly mitigated by the combined use of the UPFC and PODC, and in this case the oscillations were damped in 7 s. This clearly demonstrated the efficiency of the joint employment of the UPFC and PODC for damping oscillations in wind farm integrated power systems.

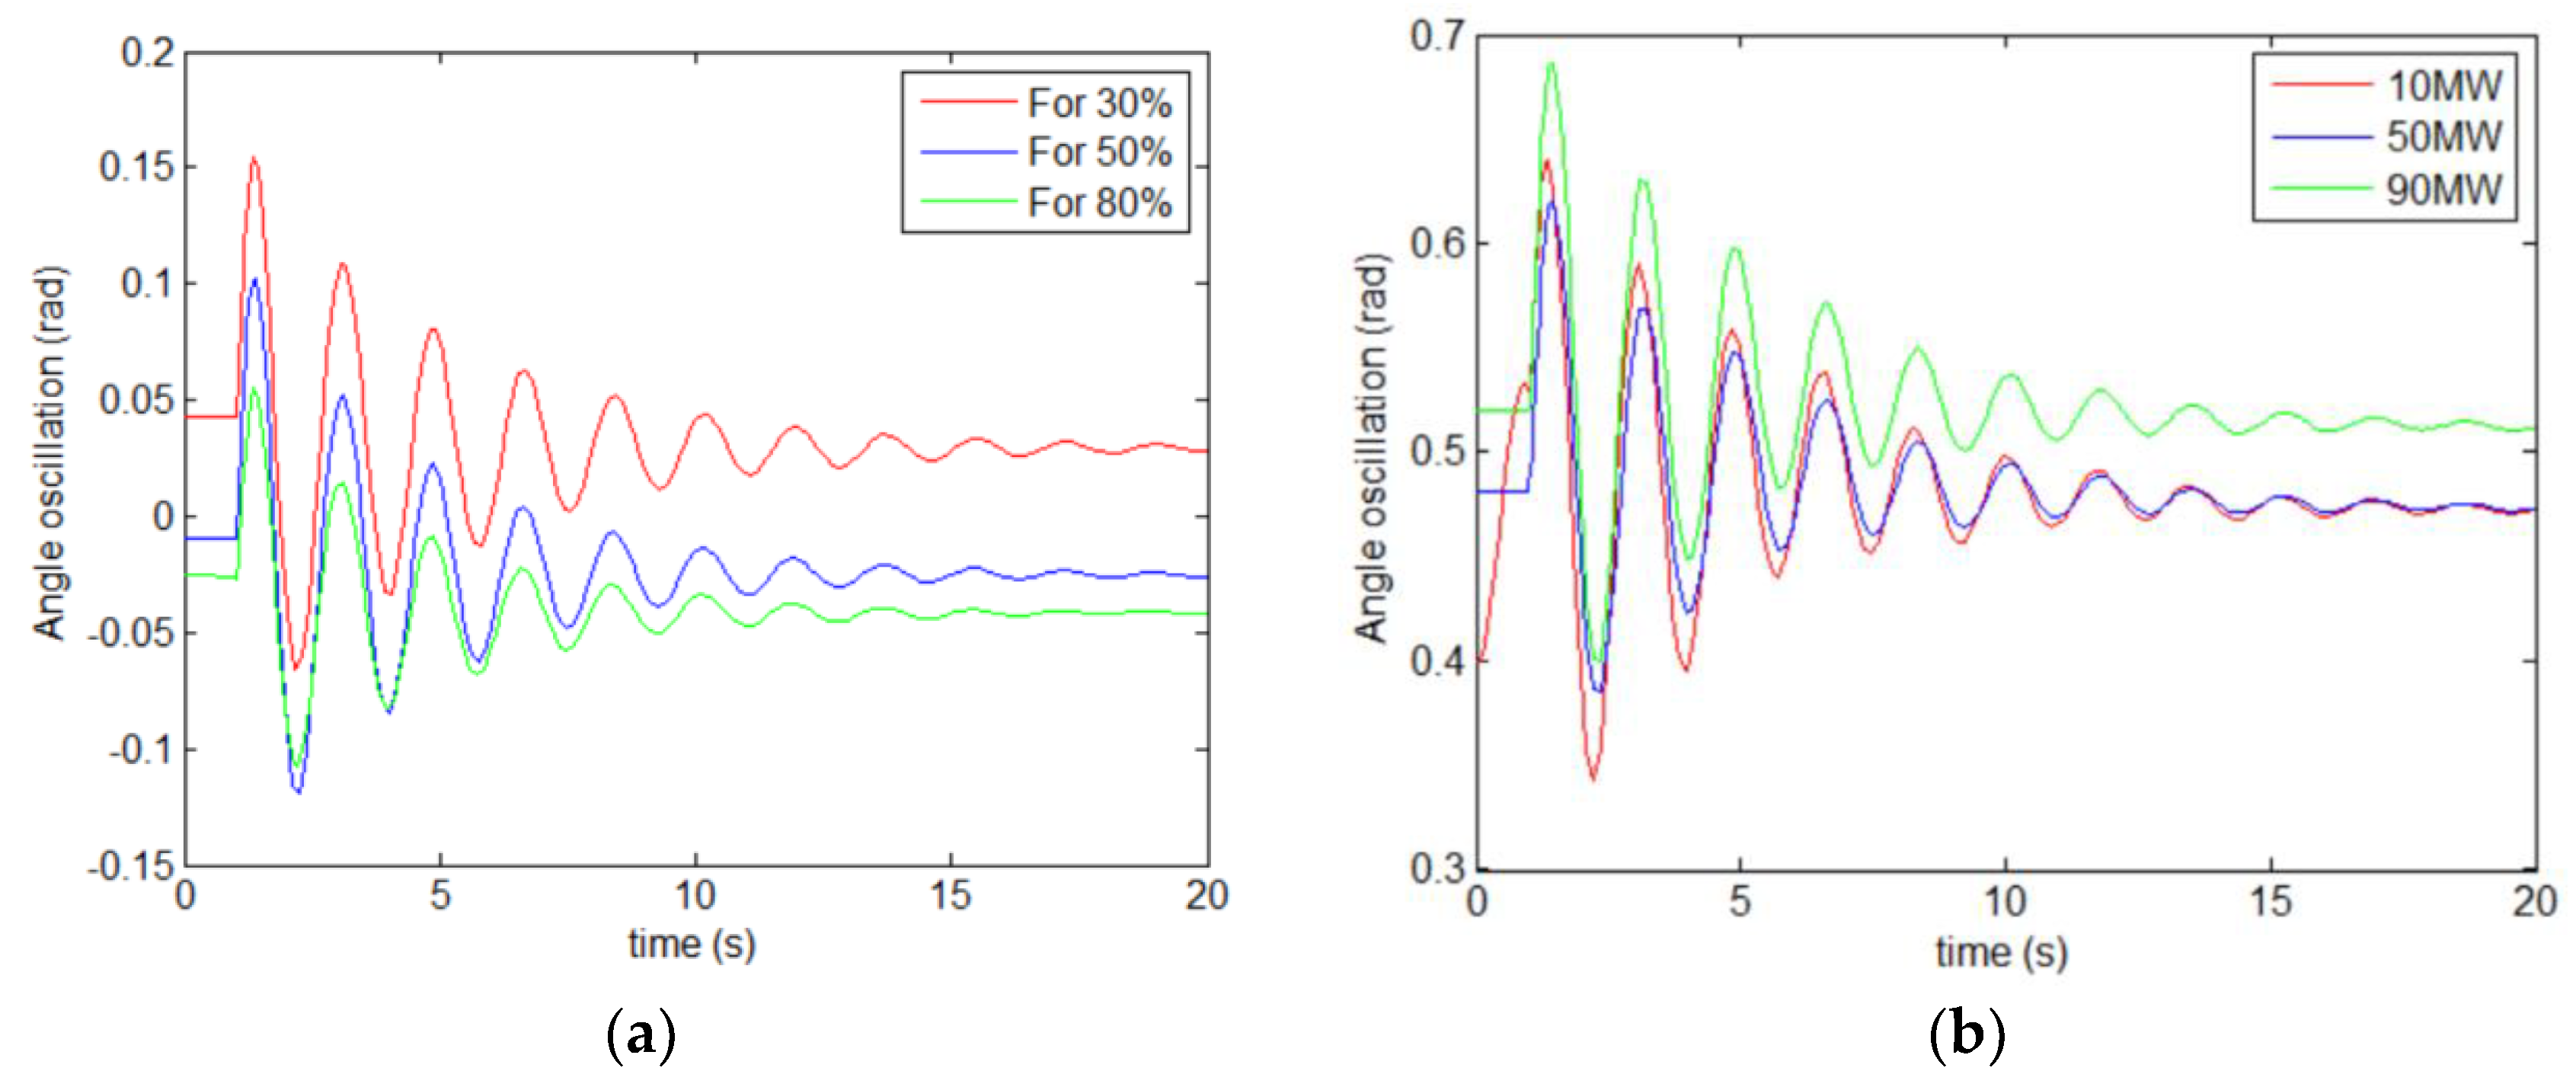
6.5. Variations of Load and Wind Power Output

In this subsection, the same cases as those in Section 6.1 are investigated, i.e., (1) without UPFC; (2) with UPFC, without PODC; and (3) with both UPFC and PODC. The basic power output of the wind farm was 90 MW, and the transmission power from region 1 to region 2 was about 520 MW.
The load on bus 7 was subject to variations. The wind power output was assumed to fluctuate by 5% at 30 s, while the load at bus 7 declined by 5% at t = 1 s and t = 30 s, and increased by 10% at t = 15 s and t = 45 s. Variations of the load at bus 7 and wind power output are shown in Figure 10.
Figure 11 depicts the power angle curves of G1, δG1, and voltage curves at bus 10 for the three cases. As shown in Figure 11a, δG1 was continuously variable with time due to variations of the load at bus 7 and the wind power output, and presented an insignificant increase, while the voltage at bus 10 decreased from 0.988 to 0.968 p.u., as shown in Figure 11b.
It can be clearly observed from these responses that the power angle and voltage fluctuations due to variations of the load at bus 7 tended to be stable after several oscillation periods in the case without the UPFC equipped, while the fluctuations were effectively suppressed with the UPFC equipped, especially in the case with the PODC equipped as well.

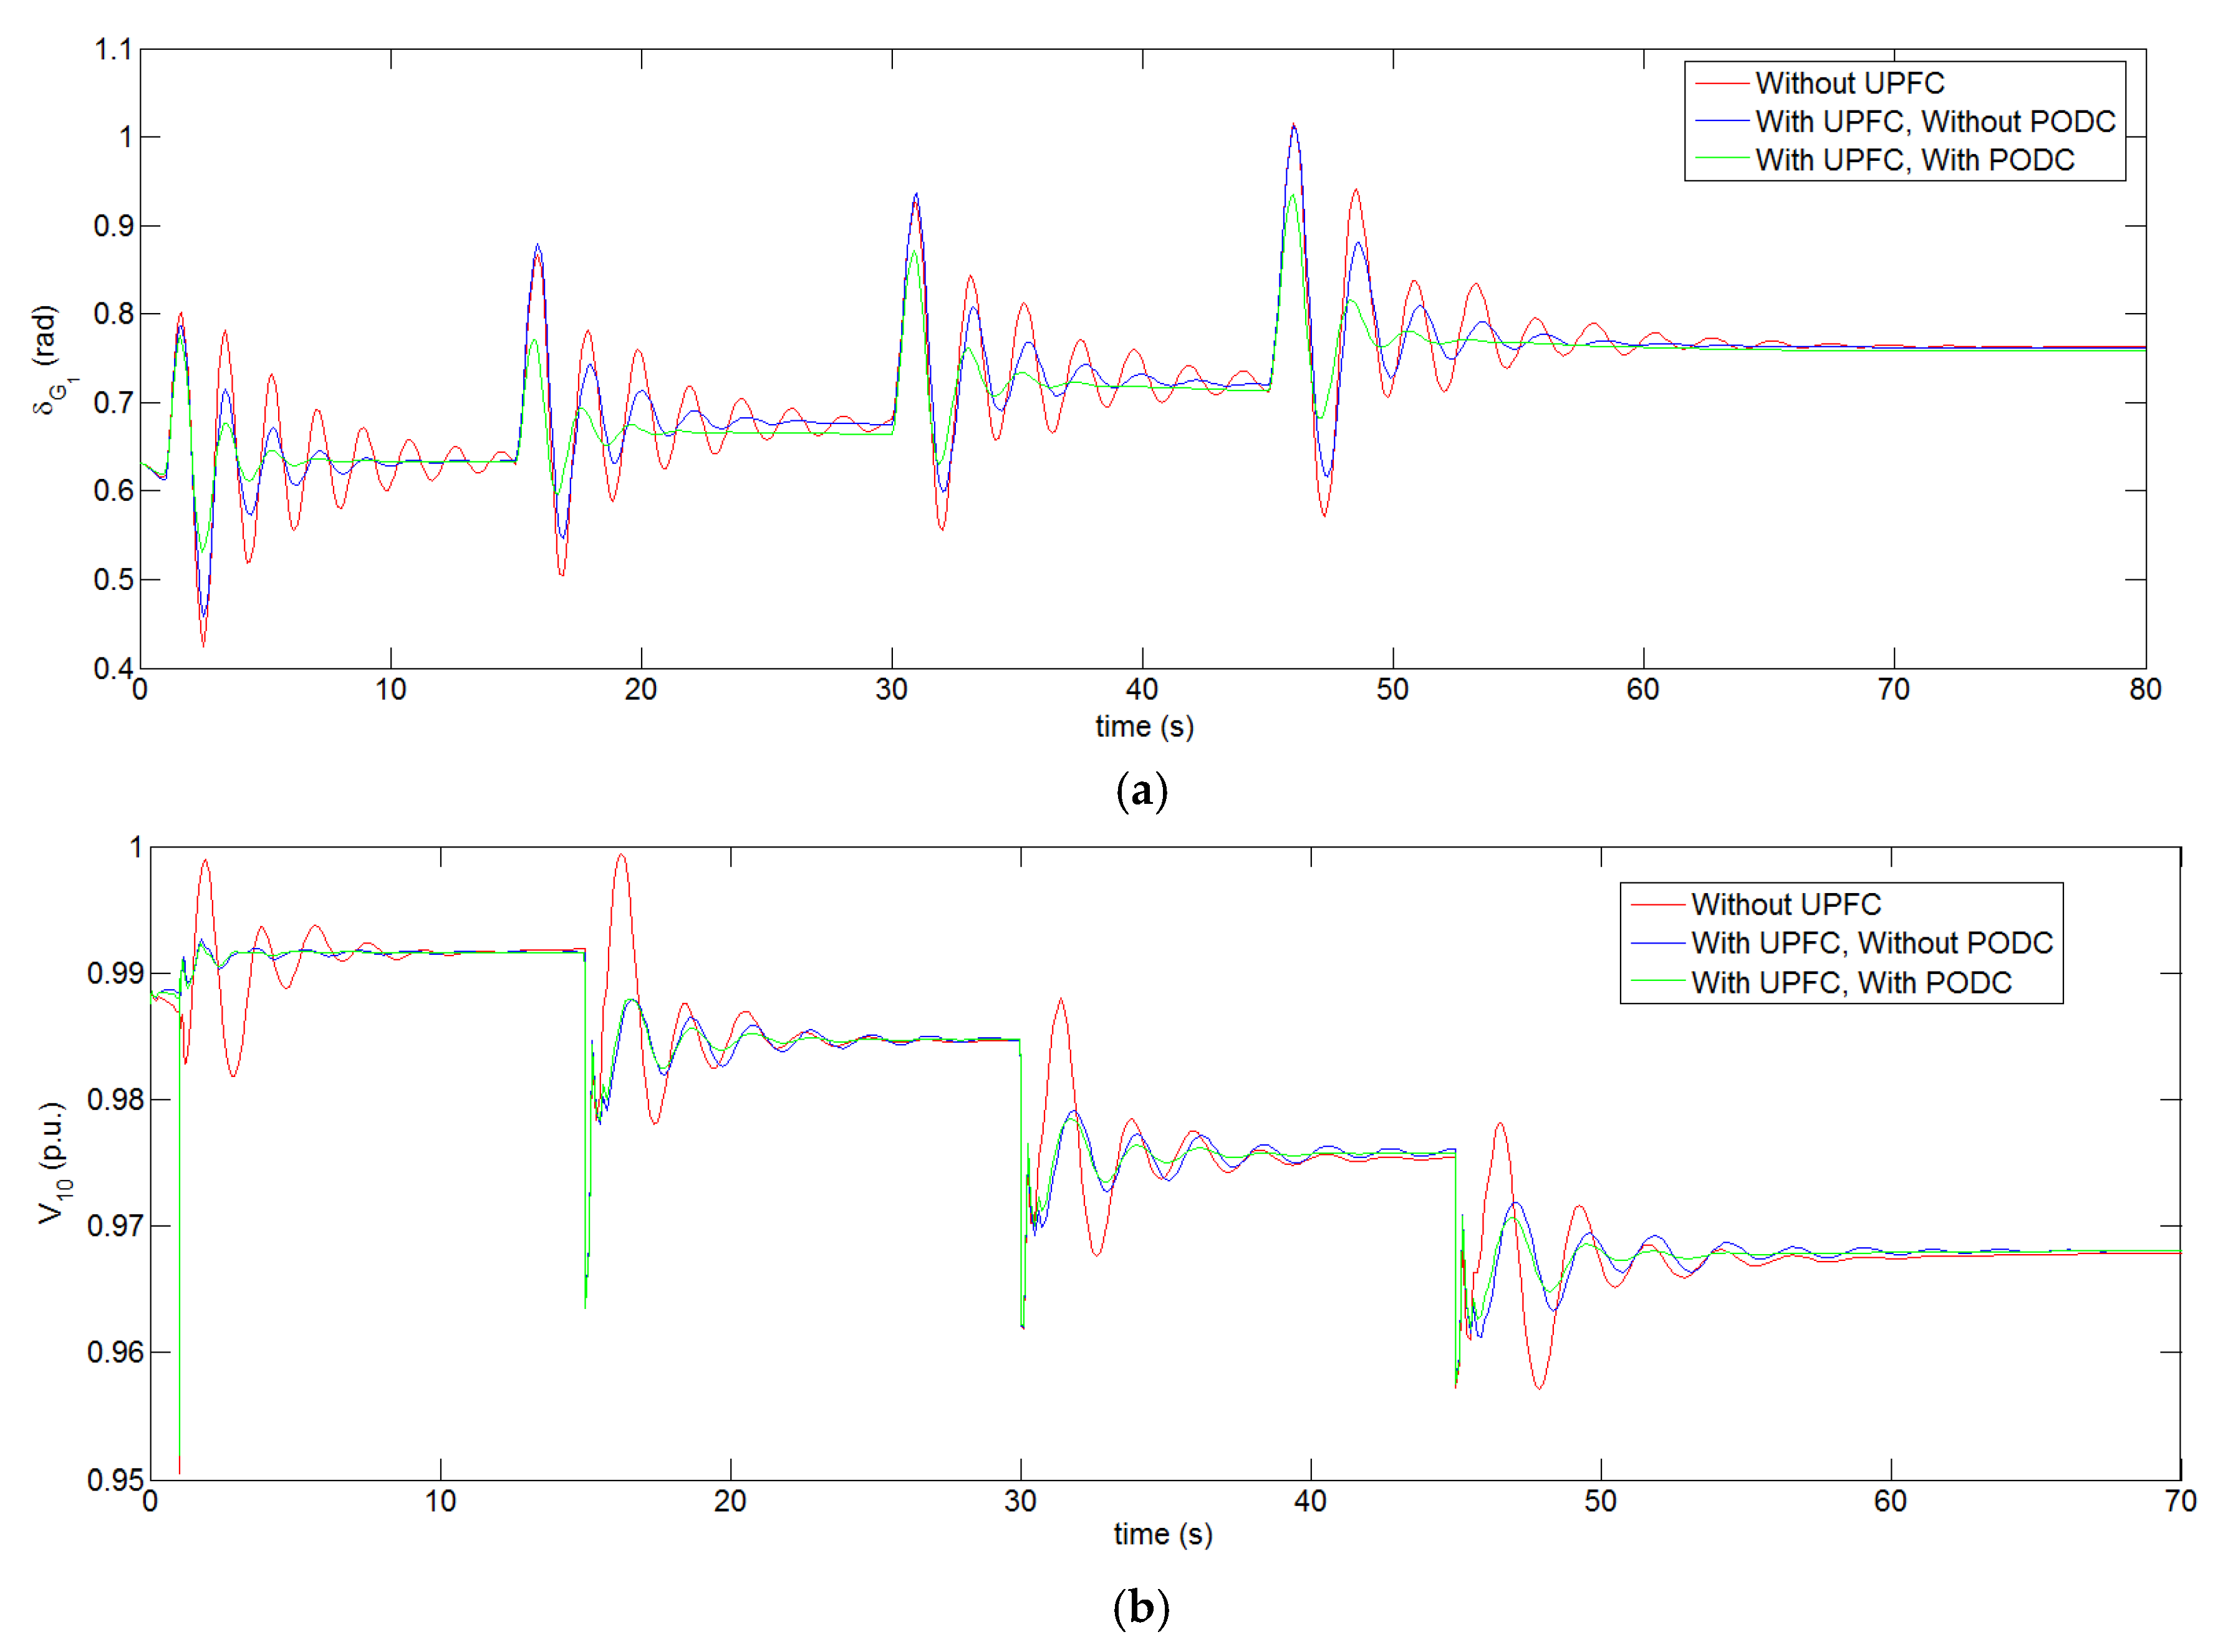
7. Applications in a Larger Sample Power System

To investigate the applicability and scalability of the UPFC and PODC, a larger power system with 2 areas, 8 generators, and 24 nodes [9] was employed. Each generator is represented by a sixth-order model. Area 1 included G6–G8, while area 2 included G1–G5. The regional tie-lines included two channels, i.e., the single-branch circuit 6–7 and the double-branch circuit 4–10 and 4–11. There were four interarea oscillation modes caused by oscillations of generators located in area 1 against those in area 2. In general, the load in the single-circuit channel was heavier than that in the double-circuit channel. Therefore, the single-circuit channel 6–7 was considered to be equipped with a UPFC. An equivalent DFIG wind unit was connected to bus 2 in area 1, then there was one more interarea oscillation mode related to the DFIG with an oscillation frequency around 0.6 Hz.
The following case studies are carried out:
  • Case 1. Without UPFC. This represents the basic case. The total active power output of the wind farm was around 50 MW, and the tie-line power from region 1 to 2 through the tie-line 6–7 was 265 MW;
  • Case 2. With UPFC, Without PODC. This case corresponded to the one in Section 4, and the other operating conditions were the same as Case 1;
  • Case 3. Withboth UPFCand PODC. This case corresponded to the one in Section 5, and the other operating conditions were the same as Case 1.
The electro-mechanical oscillation modes in these three cases are given in Table 6. It is known that in these three cases, f and ξ in modes 1–4 do not change significantly. ξ1 and ξ4 tend to increase, while ξ2 and ξ3 tend to decrease. Regarding the interarea mode 5, f tends to decrease while ξ tends to increase; this is consistent with the analysis in Section 6. Similar to previous case study results, the combined use of UPFC and PODC significantly improves the oscillation damping characteristics of this wind farm integrated power system.
Suppose that a three-phase grounding short-circuit fault occurred at tf = 1.0 s on the line between buses 8 and 11, and was cleared at tc = 1.2 s. Figure 12 presents the active power output curves of G8, and the joint capability of the UPFC and PODC in suppressing oscillations is obvious.

8. Conclusions

In this work, the oscillation damping characteristics of a wind farm integrated power system with UPFC equipped was investigated. The distribution of the system eigenvalues was extended after wind farms were integrated into a given power system. This made the problem of suppressing inter-area oscillations more challenging. In this work, the d-q axis equivalent model was employed for DFIG, and the damping controller for the shunt converter of the UPFC was designed. The effectiveness of the proposed UPFC was evaluated using an eigenvalue analysis and time-domain simulation approach for various scenarios. Extensive simulation studies on a 2-area 4-machine 13-node power system and a 2-area 8-machine 24-node power system demonstrated the effects of UPFC, as well as the joint employment of UPFC and PODC, in suppressing oscillations in wind farm integrated power systems. Moreover, it was shown by the simulation results that the joint employment of UPFC and PODC could attain significantly better effects than the sole employment of UPFC in suppressing oscillations.

Author Contributions

P.H. proposed the methodological framework and mathematical model, performed simulations, and drafted the manuscript; F.W. organized the research team, and reviewed and improved the methodological framework and simulations; S.A.A. reviewed the manuscript and improved the simulations; C.L., Y.J., and Y.T. reviewed and polished the manuscript. All authors discussed simulation results and came to an agreement regarding submission.

Funding

This work is jointly supported by the National Natural Science Foundation of China (NSFC) (No. 51507157 and No. 51607158), the Scientific and Technological Research Foundation of Henan Province (No. 182102210161), the Project for University Key Teachers of Henan Province (2017GGJS093), and National Key Research and Development Program of China (2017YFB0902900).

Conflicts of Interest

The authors declare no conflict of interest.

Nomenclature

A. Acronym
UPFCUnified power flow controller
PODCPower oscillation damping controller
DFIG Doubly-fed induction generators
GWECGlobal Wind Energy Council
FACTSFlexible AC transmission system
VSC1Static synchronous shunt compensator
VCS2Static synchronous series compensator
TAParallel transformer
TBSeries transformer
DCDirect current
PSSPower system stabilizer
PIProportional integral
ACAlternating current
DAEDifferential algebraic equation
B. Parameters
V A d / V A q d-q axis component of connecting point voltage VA
V B d / V B q d-q axis component of connecting point voltage VB
x A Reactance of transformer TA
i 3 d / i 3 q d-q axis component of current I3
x B Reactance of transformer TB
i 2 d / i 2 q d-q axis component of current I2
m 1 / δ 1 Amplitude modulation ratio/phase angle of VSC1
m 2 / δ 2 Amplitude modulation ratio/phase angle of VSC2
CDC capacitor
V D C Voltage across DC capacitor
I ˙ C / V ˙ C Current/voltage of the parallel side converter
I ˙ D / V ˙ D Current/voltage of the series side converter
I ˙ C * / I ˙ D * The conjugate value of I ˙ C / I ˙ D
Z C / Z D Equivalent reactance of the parallel/series sides
P m Output of the wind wheel
C P Wind energy utilization factor
R The wind turbine generators blade radius
A Swept area of the wind wheel
ρ Density of air
VWind speed
λ Tip speed ratio
C P max Maximum wind energy utilization factor
ω r / ω b / ω t Speeds of generator/reference/wind turbine
H t / H g Inertia constants of the turbine/the generator
θ t Shaft twist angle
D t Damping coefficient of wind turbine
T e / T s h / T m Torque of electromagnetic/shaft/mechanical
K s h Shaft stiffness coefficient
D s h Damping coefficient
L m Mutual inductance
i d s / i q s d-q axis stator currents
i d r / i q r d-q axis rotor currents
L s / L r / L m Stator/rotor self-inductance/the mutual inductance
  r r / s r / x s / x s Rotor resistance/slip/stator reactance/stator transient reactance
T 0 Rotor circuit time
e d s / e q s Voltages behind the transient reactance of d-q axis
v d s / v q s / v d r / v q r Stator voltages/rotor voltages of d-q axis
x / y Vectors of the state variables and the algebraic variables
AState matrix
λ Eigenvalue of state matrix
σ Real part of eigenvalue
ω Imaginary part of eigenvalue
p i j Participation factor of the i-th state variable to the j-th eigenvalue
w Right eigenvector
v Left eigenvector
K Gain
T w Washout circuit
f Oscillation frequency
t f Three-phase short-circuit grounding fault time
t c Three-phase short-circuit grounding fault clearing time
C. Variables
λ i Eigenvalues of mode i
ξ Damping ratio
ξ i Damping ratio of mode i
V b u s i voltage of bus i
δ G i Power angle of Gi

References

  1. Ackermann, T. Wind Power in Power Systems; John Wiley & Sons Press: Hoboken, NJ, USA, 2005. [Google Scholar]
  2. Edrah, M.; Lo, K.L.; Anaya-Lara, O. Reactive power control of DFIG wind turbines for power oscillation damping under a wide range of operating conditions. IET Gener. Transm Distrib. 2016, 10, 3777–3785. [Google Scholar] [CrossRef] [Green Version]
  3. GWEC. Global Wind Reports 2016. Available online: http://gwec.net/publications/global-wind-report-2 /global-wind-report-2016/ (accessed on 5 May 2017).
  4. Kundur, P. Power System Stability and Control; McGraw-Hill Press: New York, NY, USA, 1994. [Google Scholar]
  5. Klein, M.; Rogers, G.J.; Kundur, P. A fundamental study of interarea oscillations in power systems. IEEE Trans. Power Syst. 1991, 6, 914–921. [Google Scholar] [CrossRef]
  6. Anderson, P.M.; Fouad, A.A. Power System Control and Stability. 2003. Available online: https://ieeexplore.ieee.org/book/5264012?bknumber=5264012 (accessed on 15 November 2018).
  7. Slootweg, J.G.; Klind, W.L. The impact of large scale wind power generation on power system oscillations. Electr. Power Syst. Res. 2003, 67, 9–20. [Google Scholar] [CrossRef]
  8. Singh, M.; Allen, A.J.; Muljadi, E.; Gevorgian, V.; Zhang, Y.C.; Santoso, S. Interarea oscillation damping controls for wind power plants. IEEE Trans. Sustain. Energy 2015, 6, 967–975. [Google Scholar] [CrossRef]
  9. He, P.; Wen, F.S.; Ledwich, G.; Xue, Y.S. An investigation on interarea mode oscillations of interconnecte-dpower systems with integrated wind farms. Int J. Electr. Power Energy Syst. 2016, 78, 145–157. [Google Scholar] [CrossRef]
  10. Lin, Z.; Wen, F.S.; Ding, Y.; Xue, Y.S. Wide-area coherency identification of generators in interconnected power systems with renewables. IET Gener. Transm. Distrib. 2017, 11, 4444–4455. [Google Scholar] [CrossRef]
  11. Ma, J.; Qiu, Y.; Li, Y.N.; Thorp, J.S. Stability analysis of power system with multiple operating conditions considering the stochastic characteristic of wind speed. IET Gener. Transm Distrib. 2016, 10, 1056–1066. [Google Scholar] [CrossRef]
  12. Yang, Y.D.; Zhao, J.X.; Liu, H.; Qin, Z.J.; Deng, J.; Qi, J.J. A matrix-perturbation-theory-based optimal strategy for small-signal stability analysis of large-scale power grid. Protect. Control Mod. Power Syst. 2018, 3, 353–363. [Google Scholar] [CrossRef]
  13. Lin, Z.; Wen, F.S.; Ding, Y.; Xue, Y.S.; Liu, S.Y.; Zhao, Y.X.; Yi, S.M. WAMS-based coherency detection for situational awareness of power systems with high penetration levels of renewable generation. IEEE Trans. Power Syst. 2018, 33, 5410–5426. [Google Scholar] [CrossRef]
  14. Eremia, M.; Liu, C.C.; Edris, A.A. Advanced Solutions in Power Systems: HVDC, FACTS, and Artificial Intelligence. 2016. Available online: https://onlinelibrary.wiley.com/doi/book/10.1002/9781119175391 (accessed on 30 September 2016).[Green Version]
  15. Bhushan, R.; Chatterjee, K. Effects of parameter variation in DFIG-based grid connected system with a FACTS device for small-signal stability analysis. IET Gener. Transm. Distrib. 2017, 11, 2762–2777. [Google Scholar] [CrossRef]
  16. Yang, S.T.; Liu, Y.; Wang, X.R.; Gunasekaran, D.; Karki, U.; Peng, F.Z. Modulation and control of transformer-less UPFC. IEEE Trans. Power Electron. 2016, 31, 1050–1063. [Google Scholar] [CrossRef]
  17. Arun Kumar, K.; Singh, S.P. Congestion mitigation using UPFC. IET Gener. Transm. Distrib. 2016, 10, 2433–2442. [Google Scholar]
  18. Song, P.; Xu, Z.; Dong, H. UPFC-based line overload control for power system security enhancement. IET Gener. Transm. Distrib. 2017, 11, 3310–3317. [Google Scholar] [CrossRef]
  19. Jelavić, M.; Perić, N.; Petrović, I. Damping of wind turbine tower oscillations through rotor speed control. In Proceedings of the Ecologic Vehicles and Renewable Energies International Exhibition and Conference (EVER), Monte Carlo, Monako, 29 March–1 April 2007; pp. 1–10. [Google Scholar]
  20. Wang, L.; Li, H.W.; Wu, C.T. Stability analysis of an integrated offshore wind and seashore wave farm fed to a power grid using a unified power flow controller. IEEE Trans. Power Syst. 2013, 28, 2211–2221. [Google Scholar] [CrossRef]
  21. Golshannavaz, S.; Aminifar, F.; Nazarpour, D. Application of UPFC to enhancing oscillatory response of seriescompensated wind farm integrations. IEEE Trans. Smart Grid 2014, 5, 1961–1968. [Google Scholar] [CrossRef]
  22. Zuo, J.; Li, Y.; Shi, D.; Duan, X. Simultaneous robust coordinated damping control of power system stabilizers (PSSs), static Var compensator (SVC) and doubly-fed induction generator power oscillation dampers (DFIG PODs) in multimachine power systems. Energies 2017, 10, 565. [Google Scholar]
  23. Mohanty, A.; Patra, S.; Ray, P.K. Robust fuzzy-sliding mode based UPFC controller for transient stability analysis in autonomous wind-diesel-PV hybrid system. IET Gener. Transm. Distrib. 2016, 10, 1248–1257. [Google Scholar] [CrossRef]
  24. Shotorbani, A.M.; Ajami, A.; Aghababa, M.P.; Hosseini, S.H. Direct lyapunov theory-based method for power oscillation damping by robust finite-time control of unified power flow controlle. IET Gener. Transm. Distrib. 2013, 7, 691–699. [Google Scholar] [CrossRef]
  25. Malhotra, U.; Gokaraju, R. An add-on self-tuning control system for a UPFC application. IEEE Trans. Ind. Electron. 2014, 61, 2378–2388. [Google Scholar] [CrossRef]
  26. Dash, P.K.; Patnaik, R.K.; Mishra, S.P. Adaptive fractional integral terminal sliding mode power control of UPFC in DFIG wind farm penetrated multimachine power system. Protect. Control Mod. Power Syst. 2018, 3, 79–92. [Google Scholar] [CrossRef]
  27. Miao, Z.; Fan, L.; Osborn, D.; Yuvarajan, S. Control of DFIG-based wind generation to improve interarea oscillation damping. IEEE Trans. Energy Convers. 2009, 24, 415–422. [Google Scholar] [CrossRef]
  28. Tan, A.; Lin, X.; Sun, J.; Lyu, R.; Li, Z.; Peng, L.; Khalid, M.S. A novel DFIG damping control for power system with high wind power penetration. Energies 2016, 9, 521. [Google Scholar] [CrossRef]
  29. Pena, R.; Clare, J.C.; Asher, G.M. Doubly fed induction generator using back-to-back PWM converters and its application to variable speed wind-energy generation. IEE Proc.-Electr. Power Appl. 1996, 143, 231–241. [Google Scholar] [CrossRef]
  30. Bourdoulis, M.K.; Alexandridis, A.T. Direct power control of DFIG wind systems based on nonlinear modeling and analysis. IEEE J. Emerg. Sel. Top. Power Electron. 2014, 2, 764–775. [Google Scholar] [CrossRef]
  31. Wang, K.W. Robust PSS Design Based on Probabilistic Approach; The Hong Kong Polytechnic University: Hong Kong, China, 2000. [Google Scholar]
  32. Milano, F. An open source power system analysis toolbox. IEEE Trans. Power Syst. 2005, 20, 1199–1206. [Google Scholar] [CrossRef]
Figure 1. Block scheme of a power system with a UPFC and a DFIG.
Energies 12 00322 g001
Figure 2. Configuration of UPFC.
Energies 12 00322 g002
Figure 3. The two-area four-machine interconnected power system.
Energies 12 00322 g003
Figure 4. Power angle oscillation curves: (a) different compensation levels, and (b) different wind farm power outputs.
Energies 12 00322 g004
Figure 5. The schematic diagram of the PODC.
Energies 12 00322 g005
Figure 6. Response curves without and with the PODC: (a) the angle curves of G4, and (b) the voltage curve on bus 9.
Energies 12 00322 g006
Figure 7. Power angle curves of G1.
Energies 12 00322 g007
Figure 8. Response curves under different scenarios.
Energies 12 00322 g008
Figure 9. Response curves under different cases: (a) power angle curves of G1, and (b) active power output curves of G4.
Energies 12 00322 g009
Figure 10. Variations of the load at bus 7 and wind power output.
Energies 12 00322 g010
Figure 11. Dynamic responses subject to variations of the load at bus 7 and the wind power output: (a) power angle curves of G1, and (b) voltage curves at bus 10.
Energies 12 00322 g011
Figure 12. Active power output curves of G8.
Energies 12 00322 g012
Table 1. DFIG data.
Table 1. DFIG data.
ParameterValueParameterValue
Power30 MWRotor Resistance0.005 p.u.
Frequency60 HzRotor Reactance0.156 p.u
Blade Length75 mMagnetization Reactance3.5 p.u.
Stator Resistance0.00706 p.uInertia constant3 kWs/kVA
Stator Reactance0.171 p.uGear Box Ratio1/89
Table 2. Electro-mechanical oscillatory modes under different conditions.
Without UPFCWith UPFC
No.λξ (%)f (Hz)λξ (%)f (Hz)Dominant Machines
Without DFIG1−3.0984 ± j8.867232.991.4949−3.1008 ± j8.866533.011.4950G3, G4
2−1.9635 ± j7.534125.851.2391−1.9722 ± j7.528925.341.2387G1, G2
3−0.6609 ± j4.011416.260.6470−0.6563 ± j3.984516.250.6427G1, G4
With DFIG1−3.1005 ± j8.866433.011.4949−3.1029 ± j8.865833.031.4950G3, G4
2−2.0195 ± j7.535725.891.2417−2.0267 ± j7.530625.991.2412G1, G2
3−0.6634 ± j4.026716.260.6495−0.6589 ± j4.000516.250.6453G1, G4
4−0.6092 ± j0.756862.710.1546−0.6238 ± j0.747064.100.1549ALL
Table 3. The data of the PODC.
ParameterKTwTlT2T3T4
Value0.1 p.u.10 s0.35 s0.2 s0.5 s0.3 s
Table 4. The interarea oscillation modes under different degrees of the tie-line power flow.
No.Tie-Line Power/MWWithout UPFCWith UPFC, Without PODCWith Both UPFC and PODC
λξ (%)f (Hz)λξ (%)f (Hz)λξ (%)f (Hz)
Interarea mode 146−0.5790 ± j3.956414.480.6364−0.6054 ± j4.042614.810.6506−1.7012 ± j4.368836.280.7462
143−0.5720 ± j4.020114.090.6463−0.5730 ± j4.029614.080.6478−1.0519 ± j3.749727.010.6198
239−0.6687 ± j4.032816.360.6506−0.6670 ± j4.039416.290.6516−1.0583 ± j3.530328.720.5866
335−0.6656 ± j4.041816.250.6519−0.6618 ± j4.041716.160.6518−1.0247 ± j3.448228.490.5725
430−0.6634 ± j4.026716.260.6495−0.6581 ± j4.014416.180.6474−1.0090 ± j3.384328.570.5621
Interarea mode 246−0.4905 ± j0.432075.040.1040−0.5010 ± j0.425376.240.1046−0.4693 ± j0.462971.190.1049
143−0.5090 ± j0.505570.950.1142−0.5173 ± j0.496872.130.1142−0.5088 ± j0.543868.320.1185
239−0.6026 ± j0.657867.550.1420−0.6105 ± j0.646368.670.1415−0.5887 ± j0.678765.520.1430
335−0.6073 ± j0.707065.160.1483−0.6153 ± j0.694166.340.1476−0.6024 ± j0.731763.560.1508
430−0.6092 ± j0.756862.710.1546−0.6178 ± j0.741963.990.1537−0.6119 ± j0.785461.460.1585
Table 5. The interarea oscillation modes under different DFIG outputs.
No.Wind Power Output/MWWithout UPFCWith UPFC, Without PODCWith Both UPFC and PODC
λξ (%)f (Hz)λξ (%)f (Hz)Λξ (%)f (Hz)
Interarea mode 10−0.6609 ± j4.011416.260.6470−0.6563 ± j3.984516.250.6427−0.9429 ± j3.492126.070.5757
10−0.6605 ± j4.029316.180.6498−0.6560 ± j4.003116.170.6456−0.9358 ± j3.505525.790.5775
30−0.6634 ± j4.026716.260.6495−0.6589 ± j4.000516.250.6453−0.9350 ± j3.504725.780.5773
70−0.6700 ± j4.022816.430.6491−0.6654 ± j3.996916.420.6449−0.9328 ± j3.504425.720.5772
Interarea mode 20−0.5455 ± j0.550170.410.1233−0.5602 ± j0.539072.060.1237−0.5406 ± j0.539870.760.1216
10−0.6120 ± j0.722064.660.1506−0.6273 ± j0.715565.920.1515−0.6231 ± j0.744664.180.1545
30−0.6092 ± j0.756862.710.1546−0.6238 ± j0.747064.100.1549−0.6198 ± j0.781562.140.1588
70−0.5967 ± j0.851157.410.1654−0.6106 ± j0.837858.900.1650−0.6089 ± j0.886856.600.1712
Table 6. Interarea oscillation modes in three cases.
No.Without UPFCWith UPFC, Without PODCWith Both UPFC and PODCDominant Generators
λξ (%)f (Hz)Λξ (%)f (Hz)λξ (%)f (Hz)
1−0.9215 ± j10.66618.611.7038−0.9289 ± j10.63028.711.6983−0.9490 ± j10.67798.851.7061G1, G7
2−0.53111 ± j9.26465.721.4769−0.5421 ± j9.26675.841.4774−0.4303 ± j8.86924.851.4132G1, G2, G7
3−0.6954 ± j7.52789.201.2032−0.7014 ± j7.54619.251.2062−0.7366 ± j7.59109.661.2137G5, G6
4−0.4685 ± j6.45097.241.0294−0.4792 ± j6.46227.401.0313−0.5226 ± j6.50648.011.0389G1, G5, G6
5−0.00354 ± j3.74250.09460.5956−0.00201 ± j3.50110.05740.5572−0.0412 ± j 3.59261.150.5718G1, G5, DFIG

