Abstract
Owing to the shortcomings of existing series arc fault detection methods, based on a summary of arc volt–ampere characteristics, the change rule of the line current and the relationship between the voltage and current are deeply analyzed and theoretically explained under different loads when series arc faults occur. A series arc fault detection method is proposed, and the software flowchart and principles of the applied hardware implementation are given. Finally, a prototype of an arc fault detection device (AFDD) with a rated voltage of 220 V and a rated current of 40 A is developed. The prototype was tested according to experimental methods provided by the Chinese national standard, GB/T 31143-2014. The experimental results show that the proposed detection method is simple and practical, and can be implemented using a low-cost microprocessor. The proposed method will provide good theoretical guidance in promoting the research and development of an AFDD.
1. Introduction
An arc is a continuous luminous discharge of electricity across an insulating medium, usually accompanied by a partial volatilization of the electrodes, and is a very complicated electromagnetic reaction process [1]. An arc fault is the phenomenon of a gas-free discharge caused by an air breakdown owing to the aging of the insulation in electrical lines or equipment, loosening of electrical connections, air humidity, and/or a sharp rise in voltage or current [2]. An arc occurs continuously during a certain period of time, and the internal temperature of the arc fault can reach 5000–15,000 °C [3], which is an important factor that may cause an electrical fire. When a series arc fault occurs in a line, a traditional circuit breaker cannot provide protection because the line current is less than the normal working current [4]. Therefore, a reliable series arc detection method and protection technology is important for reducing electrical fires. Major countries worldwide have promulgated standards for arc fault detection and protection. For example, in 1998, the United States promulgated the relevant design standard, UL 1699, for arc fault circuit interrupters. The International Electrotechnical Commission (IEC) promulgated the International Standard, IEC 62606: 2013, namely, “General Requirements for Arc Fault Detection Appliances (AFDD),” in 2013. China also promulgated two national standards related to arc fault detection and protection in 2014 [2,5]. At the same time, research into series arc fault detection technologies has become a research hotspot in the field of electrical safety.
When series arc faults occur, the waveform of the current will show “shoulders” and sudden changes in current. At the same time, the electrode or cable will be volatilized owing to the occurrence of arc faults, which will lead to inconsistent current waveforms in different half cycles under arc fault conditions. Using the above features to detect the series arc, many algorithms have been proposed, including temporal analysis [6], the three-cycle algorithm [7], broadband noise [8], and algebraic derivative [9]. More studies have used frequency domain analysis methods. A harmonic analysis has been conducted on a specific frequency band of the line current when arc faults occur [10,11,12,13,14]. Some time–frequency analysis methods, such as a short-time Fourier transform [15], wavelet transform [11,16,17,18,19,20,21,22], and Hilbert–Huang transform [23], have also been used for fault arc detection. In addition, some pattern recognition methods have been used to help classify the situation when an arc fault occurs, such as support vector machines [13] and neural networks [11,20,21,23]. Most of the above methods need to extract the current characteristics under the arc fault condition based on the current waveform at the time of the arc fault and determine whether an arc fault has occurred. The reasons for these phenomena have not been theoretically analyzed, and the features extracted by some of the methods lack a practical physical meaning. The results under normal conditions as calculated using many different algorithms have differed greatly under different loads and have intersected with the calculation results for faults of other loads. If the number of current waveforms analyzed and processed is insufficient, the extraction of features will be limited. Moreover, these methods only detect the line current, and it is difficult to determine the type of load, which increases the difficulty of correctly detecting series arc faults.
When a series arc fault occurs, the arc can be regarded as a dynamic nonlinear resistance element in the circuit network. Its volt–ampere characteristics will affect the line current waveform and the relationship between the supply voltage and line current. Based on the volt–ampere characteristics of the series arc, the influence of a series arc fault on the circuit under different load conditions has been deeply analyzed. On this basis, a series arc fault detection method and a corresponding hardware implementation principle are proposed, and a prototype machine developed for test verification is described. The difference between the research ideas in the present paper and most of the previous studies conducted is that the former theoretically analyze and explain the causes of shoulders, pulse currents, randomness, and other characteristics of series currents under different load conditions. The present paper will provide good theoretical guidance in promoting the development of arc fault detection and protection devices.
2. Volt–Ampere Characteristics of an Arc
The curve of arc voltage uh to arc current ih in a single cycle, that is, the volt–ampere characteristic curve of an AC arc current, is shown in Figure 1. The arrow in the figure indicates the direction of changes in ih. The volt–ampere characteristics of the arc indicate the relationship between the arc voltage and current, which is one of the most important characteristics of an arc. Under a stable combustion state, if the distance of the arc gap is constant, because the ambient temperature has little influence on the VA characteristics [24], during a zero-crossing of ih the arc will be extinguished and the arc gap resistance Rh will be large.
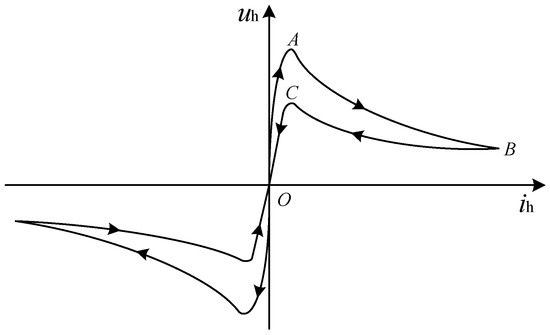
Figure 1.
Volt–ampere characteristic curve of an AC arc.
Here, Rh is numerically equal to the ratio of uh to ih. It can be seen from Figure 1 that Rh changes dynamically. Before uh increases to the ignition voltage Uz (point A), ih is small, and Rh is basically kept at a large value, generally above the giga-ohm scale. When uh increases to Uz, Rh will fall below 1 Ω in tens of nanoseconds [25,26,27]. In addition, ih will begin to increase and Rh will further decrease. This can be further interpreted as ih increasing and uh decreasing. When ih starts to decrease after reaching the maximum value (point B), Rh will increase. However, owing to the thermal inertia of the electrode and arc column gas, under the same current, Rh is less during the period of a decrease in current than during the period of an increase in current. When ih drops to near zero, uh will reach Us (point C), which is the arc-extinguishing voltage. At point C, the arc will be extinguished and Rh will significantly increase. The arc volt–ampere characteristic curve in the third quadrant is similar to that in the first quadrant except for the opposite current direction.
In fact, the volt–ampere characteristics of the AC arc are related to the temperature of the arc, the magnitude of the supply voltage, and the material of the electrode [24,28]. The composition may not be exactly the same each time an arc occurs, and thus the volt–ampere characteristics of the AC arc may not be exactly the same.
Based on the circuit shown in Figure 2, the voltage and current waveforms of the measured AC arc are as shown in Figure 3. A series arc is generated during the period of t0 to t1. Although the current is large at this time, because the arc gap is broken, the arc gap resistance Rh is very small, and thus the voltage uh across the arc gap is also extremely small. The value of line current i is mainly determined based on the power supply voltage u and load impedance Z. Because Rh is connected in series in the circuit, although Rh is small, it will cause the effective value of i to be smaller than under normal working conditions. When i drops to zero at time t1, the arc is extinguished. If uh is extremely small at this time, it will be insufficient to continue breaking the arc gap. The value of Rh can be equivalent to a very large resistance, and i will be substantially zero for a certain period of time, which is often called a shoulder. That is, when a series arc occurs in an AC circuit, the line current is very close to zero for a period near the natural zero-crossing point.
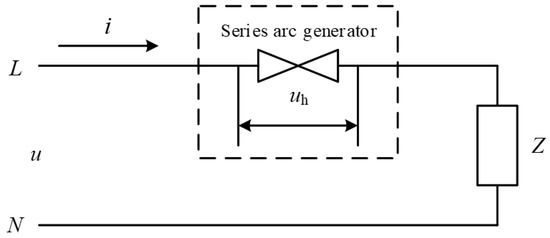
Figure 2.
Test circuit of an AC series arc.
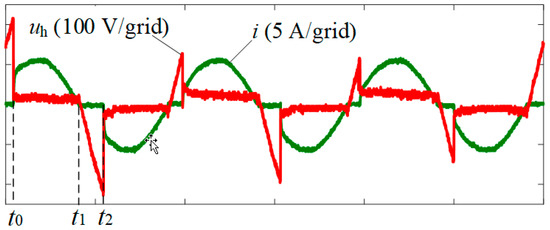
Figure 3.
Voltage and current waveforms of an AC arc.
Because AC is used as the power supply and Rh is extremely large when the arc gap is not broken, uh can be approximated as the power supply voltage u. When u changes according to the sinusoidal law and reaches the arcing voltage Uz at time t2, the arc gap is broken, the arc is ignited, and Rh will rapidly decrease to an extremely small value. At this time, Rh will be substantially negligible compared to the load impedance Z. In addition, i will start from zero and increase rapidly to Uz/|Z|, which is a sudden change in current when a series arc occurs.
It can also be seen from Figure 3 that the values of Uz are not exactly the same during different half cycles. The main reason for this is that when a series arc occurs, an arc combustion is often accompanied by a local volatilization of the electrode, resulting in dynamic changes in the arc gap spacing, the composition of the surrounding gas, and the temperature of the arc. Therefore, the arcing voltage Uz is not exactly the same every time a series arc occurs. As a result, the effective value and moment of a sudden change of line current i in each adjacent half cycle have a certain degree of randomness.
3. Effects of Arc Volt–Ampere Characteristics on Different Types of Loads
In the previous sections, based on the causes of a series arc and its volt–ampere characteristics, the reasons for the shoulder phenomenon, the sudden change in the line current, and the randomness of the line current when a series arc fault occurs were analyzed. Such characteristics will produce different line current waveforms and voltage–current relationships under different circuit loads.
In this section, we describe the effects of the volt–ampere characteristics of an arc on the line currents, and the relationship between the voltage and current under various load conditions, such as a purely resistive load, a load from a diode rectifier with a capacitor filter, and an inductive load.
3.1. Purely Resistive Load
Here, RL indicates when load Z of the test circuit in Figure 2 is purely resistive. Figure 4a shows the voltage and current waveforms when no arc fault occurs under a purely resistive load, and Figure 4b shows the waveforms when a series arc fault occurs. Because the line load impedance is purely resistant, a series arc can also be equivalent to a resistance whose value undergoes a dynamic change, and thus i and u are in phase, as shown in Figure 4b. When u decreases to zero, i also falls to zero, and the arc will be extinguished. During this period, the value of arc resistance Rh is much larger than the load resistance RL, and uh is approximately equal to u. Here, i = u/Rh, and the value of i is close to zero. When u increases to Uz, the arc gap is broken and a series arc is generated. The value of Rh will decrease rapidly and become much smaller than RL, and thus i will quickly increase from zero to Uz/RL. During the following period, the value of i is basically determined based on u and RL, where i ≈ u/RL. Because the arc-extinguishing voltage Us is small, when u decreases to approximately zero, i decreases to zero, and the arc will be extinguished. The voltage and current waveforms during the period of decrease are not much different from the period during which no fault arc occurs. After that, Rh will rapidly increase. Until u increases to Uz again, the value of i remains at zero.
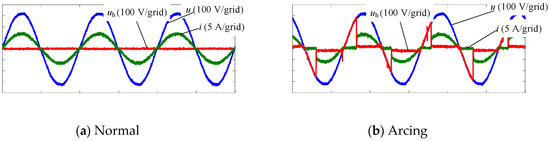
Figure 4.
Resistive load.
It can be seen from the above analysis that when the load is purely resistive and series arc faults occur, the circuit has the following characteristics:
- i is in phase with u;
- The shoulders are obvious;
- There will be a sudden change when i increases from zero, and i will suddenly increase from zero to a certain value, which is mainly determined based on Uz and RL;
- While i decreases to zero, it has an approximately sinusoidal curve.
It should be noted that when series arc faults occur, the actual distance of the arc gap is indeterminate. With a burning arc, the distance of the arc gap will change. The value of Uz is variable, and Rh is a dynamic resistance, which causes the line current waveform to appear to be random during different half cycles.
3.2. Diode Rectifier with Capacitor Filter
A diode rectifier with a capacitor filter is an important part of a switching power supply. Many household appliances, such as computers, chargers, and liquid crystal displays, require such a power supply.
This section analyzes the effects of the arc volt–ampere characteristics on the line current waveform and the relationship between the voltage and current under the load of a diode rectifier with a capacitor filter.
The output of the rectifier with a capacitor filter circuit is DC voltage, and the load of the circuit can be equivalent to resistor R. Assume that the output voltage is Uc. In general, to suppress the conducted electromagnetic interference (EMI) generated by a switching power supply, it is necessary to add an EMI filter in front of the circuit [29]. Figure 5 shows a diode rectifier with a capacitor filter circuit. Figure 6 shows a diode rectifier with a capacitor filter circuit equipped with an EMI filter, LCM is a common-mode inductor.
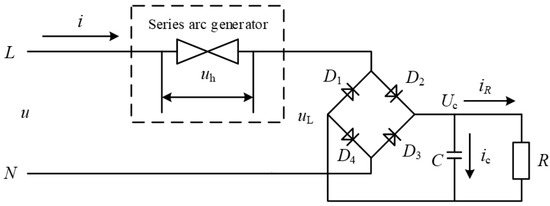
Figure 5.
Test circuit of diode rectifier with capacitive filter without an electromagnetic interference (EMI) filter.
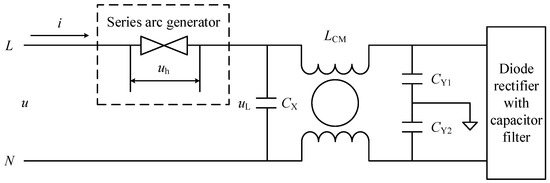
Figure 6.
Test circuit of diode rectifier with capacitive filter and EMI filter.
Figure 7a shows the waveforms of the current and voltage when no series arc faults occur and when the load is from a diode rectifier with a capacitor filter circuit, whereas Figure 7b shows the waveforms when series arc faults occur. Pulses are present in the two current waveforms and have similar shoulders. As the reason for the results in Figure 7a, when u is less than Uc, the diodes are not conducting. The current waveform shown in Figure 7b has random characteristics owing to the dynamic change in the arc resistance when an arc fault occurs. By detecting randomness, one can detect whether an arc fault has occurred.
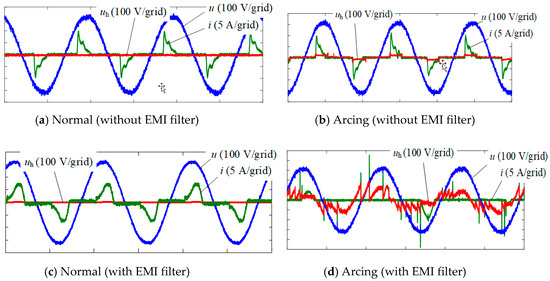
Figure 7.
Diode rectifier with capacitive filter.
Figure 7c shows waveforms of the voltage and current when the load is from a diode rectifier with a capacitor filter circuit equipped with an EMI filter and when no series arc faults occur, whereas Figure 7d shows the waveforms when series arc faults do occur. It can be seen from Figure 7c that there is no sudden change in the line current waveform owing to the presence of inductance in the filter. Although it has similar shoulders, the time frame is much longer than the shoulders caused by the arc faults under a purely resistive load. Moreover, the current waveforms in each half cycle are approximately the same, and no randomness occurs.
The explanation of the results in Figure 7d is as follows. Assume that the voltage on capacitance Cx is uL. When |u − uL| < Uz, the arc gap cannot be broken, the arc gap resistance Rh is extremely large, and current i is zero; however, when |u − uL| > Uz, the arc gap is broken, a series arc occurs, and Rh rapidly decreases. Because uL is less than Uc, the diodes remain in a reverse blocking state. Moreover, the inductance in the EMI filter will block the passage of the current. Most of current i will charge Cx. In addition, i will increase rapidly from zero to Uz/Rh. Because the capacity of capacitance Cx is too small, uL increases much faster than u, causing uh to decrease rapidly and become smaller than Us; the arc will then be extinguished, and i will rapidly decrease to zero, which is why the pulses appear in the current waveform. Owing to the influence of the filter inductor, the voltage uL on Cx does not change much during the following period. With the increase in u, when u > (uL + Uz), the arc gap will be broken again. A pulse again appears in i. Other pulses also appear for the same reason. Moreover, uL will continue to increase, and when its value approaches Uc, if u continues to increase and meets the condition |u| > Uc + Uz, the arc will occur again. During this period, the diodes are randomly turned on or off, the reason for which is as follows: because the distance of the arc gap is uncertain, the arc-extinguishing voltage Us is uncertain even at the same current. When the arc gap is broken, if uh is always larger than Us during the increase in uL, the arc will be not extinguished, and the diodes will turn on. If uh < Us at some point during the period of increase in uL, the arc will be extinguished, and the diode will not turn on.
From the above analysis, when series arc faults occur when the load is from a diode rectifier with a capacitor filter equipped with an EMI filter, the current waveform of the circuit has the following characteristics:
- Pulses will occur multiple times within a half cycle, and because the diodes are likely to conduct as the voltage decreases, forming a stable line current i, there are more pulses during the period of voltage increase than during the period of decrease;
- The waveform of i also has random characteristics in different half cycles.
Based on the above characteristics, it is easier to judge whether series arc faults occur under this load. When arc faults occur, the volt–ampere characteristics are mainly affected by the capacitance Cx. Thus, analyses and a summarization of the waveforms when series arc faults occur under a pure capacitive load are not provided herein.
3.3. Inductive Load
When load Z in Figure 2 is inductance L, Figure 8a shows the voltage and current waveforms of the line when no fault arc occurs, and Figure 8b shows the waveform when the circuit incurs a series arc fault. In Figure 8b, the phase of i lags u by approximately 90°, and when u is at maximum, i crosses zero, and the arc will be extinguished. At this time, it can be determined from the arc volt–ampere characteristics that uh is approximately zero, which is insufficient to break the arc gap. However, after the arc fault is extinguished, Rh will increase rapidly, which is equivalent to adding u to the arc gap. Because the phase difference between u and i is approximately 90°, u is near the peak and is larger than Uz, and thus the arc gap will be quickly broken, and Rh will rapidly decrease. Therefore, the shoulders are much smaller than under a purely resistive load.
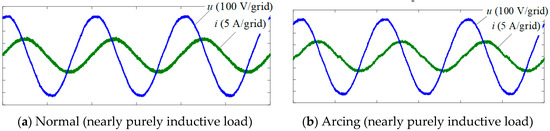
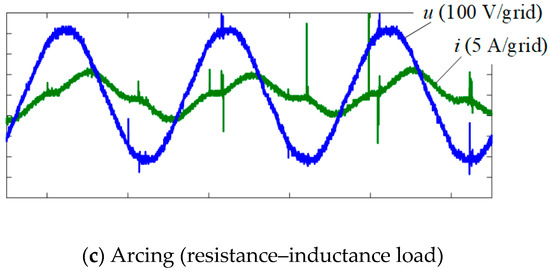
Figure 8.
Resistance–inductance load.
According to the above analysis, when the load impedance is close to the pure inductive load and a series arc fault occurs, the circuit has the following characteristics:
- The phase of u is approximately 90° ahead of i;
- The shoulders are not obvious;
- There is no sudden change in current, and i is similar to a sinusoidal wave.
Figure 8c shows waveforms of the voltage and current when series arc faults occur in a circuit when the load is from a motor. A pulse current may occur when series arc faults occur, the main reason for which is that parasitic capacitance Cw appears in the inductor, as shown in Figure 9. Differing from a point close to a purely inductive load, when i crosses zero, the arc will be extinguished, and Rh will rapidly increase. Although the arc gap voltage is equal to u at this point, u is not near the peak. If u is less than Uz, it will not break the arc gap, and the arc will be extinguished. When u is increased, the arc gap will be broken. Most of i will charge Cw at that moment. If the capacity of Cw is sufficiently large, a pulse current will occur; otherwise, a pulse current will not occur. This is because, if the capacity of Cw is extremely small, the voltage of Cw will quickly increase to the power supply voltage, whereas the increase in pulse current will be smaller.
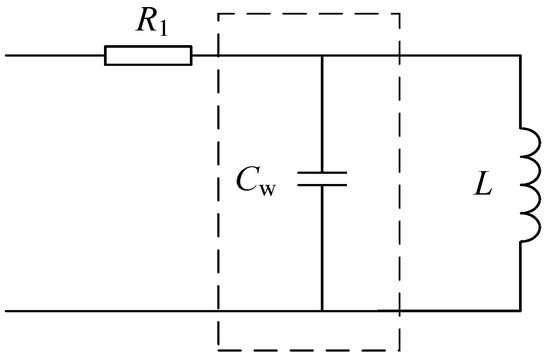
Figure 9.
Equivalent circuit of resistance–inductance load.
From the above analysis, the circuit has the following characteristics when series arc faults occur in the resistance–inductance load:
- The phase of u is ahead of i;
- There are obvious shoulders;
- There may be several pulse currents in the shoulders.
The above characteristics can be used as a basis for detecting series arc faults under a resistance–inductance load.
4. Series Arc Fault Detection
From the above analysis, the line current and relationship between the voltage and current will be influenced by the series arc under a purely resistive load, the diode rectifier with a capacitor filter, and the inductive load. A way to utilize the shoulders, impulse current, randomness, and other characteristics of a fault current waveform for detecting a series arc fault is introduced in this section. This section also describes the designed hardware and software and an experimental verification.
4.1. AFDD Hardware Circuit Design
The hardware of the AFDD includes a control section, input voltage detection, line current detection, and tripping, as shown in Figure 10. The digital signal processor (DSP) TMS320F28035 from Texas Instruments (TI) is adopted as the core of the control system. The input voltage is collected by the voltage detection circuit and processed by the signal conditioning circuit, and then input to the DSP; the amplitude and phase information of the voltage is then obtained. The line current is collected by the current sensor, and then enters the DSP. When the DSP detects a series arc fault, it outputs a control signal to trip the circuit breaker and protect the line.
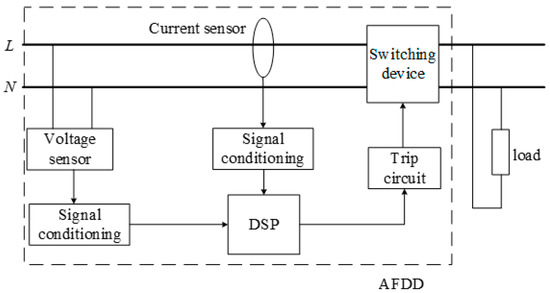
Figure 10.
Hardware circuit diagram of arc fault detection device (AFDD).
4.2. Series Arc Fault Detection Method
Figure 11a–c shows flowcharts of the main program, the voltage and current signal acquisition program, and the arc fault detection program, respectively. The main program mainly judges whether the number of arc events in a given time meets the conditions to start the corresponding alarm and protection programs. When the number of arc events exceeds the set number of arc events requiring an alarm during a given period of time, it can be judged that series arc faults have occurred in the line, which can prevent a series arc from being judged as a fault arc when plugging into and pulling out of the socket. The voltage and current signal acquisition program is realized using the Analog-to-Digital (A/D) interrupt service program, which samples and saves the voltage and current signal regularly. The arc fault detection program is also implemented using an interrupt service routine. The zero-crossing point of the AC input voltage is used as the triggering of the external interrupt source, that is, every half cycle is used as an arc fault identification time unit. When series arc faults are detected in an identified unit of time, the program judges that the identified unit of time is a fault unit, and a value of 1 is added to the number of arc events.
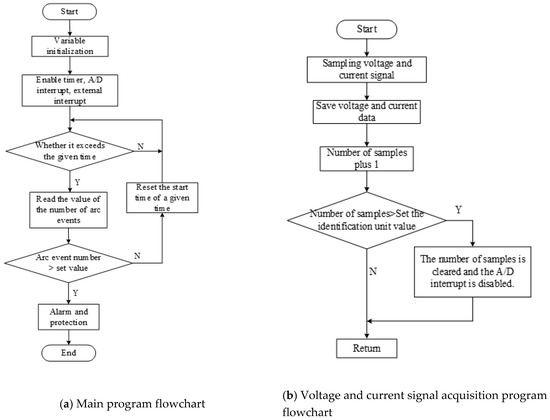
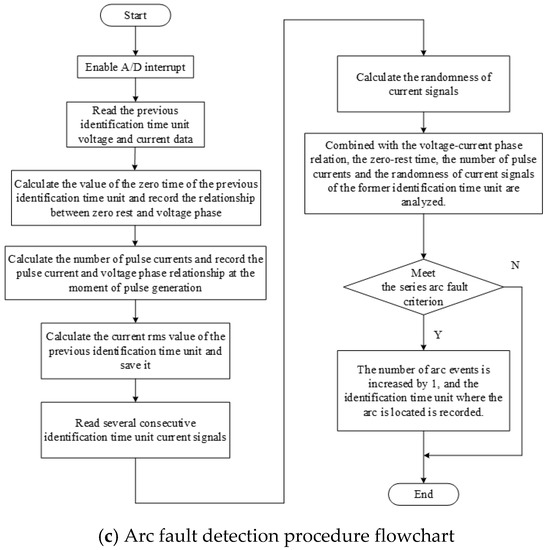
Figure 11.
Flowchart of series arc fault detection method.
In the algorithm design, to adjust the threshold value of each criterion and adopt the appropriate detection algorithm, the phase relation between the voltage and load current of the power supply is first detected, and the load type is judged preliminarily. Then, the times of the shoulders, pulse currents, randomness, and other parameters of the line current are detected.
4.2.1. Detection of Shoulder Time
The method for detecting the shoulder time is as follows. In each arc fault identification time unit, N current signals are collected at a fixed frequency. When the absolute value of the sampling is below the threshold (Imax1) and the absolute value of the difference between one sampling point and the next sampling point is below the threshold (Imax2), this sampling point is judged as the current zero-crossing point. The number of current zero-crossing points in the zero-crossing zone in each identification time unit can be considered as a shoulder time in the identification time unit.
4.2.2. Detection of Pulse Current
The detection method of the pulse current is as follows. The difference between each of two adjacent current signals collected in one identification time unit is calculated. Because the sampling time is fixed, it can be considered that the difference between two adjacent current signals is the rising or falling rate of the current signal in this identification time unit. When the rising and falling rates of the current exceed a certain threshold, it is considered that a pulse current has occurred. The number of pulse currents in each recognition unit, and the time of occurrence, are counted and calculated, respectively.
4.2.3. Detection of Randomness
The procedure for detecting the randomness of a line current waveform is as follows.
The absolute value of N current signals collected in each arc fault identification time unit is taken and recorded as x(n)m, where m represents the unit number, and n represents the sample point number within each unit, where 1 ≤ n ≤ N.
The randomness of the corresponding sampling points of three adjacent units are calculated according to Equation (1):
and the Z values of all N points are added.
When no arc occurs, δ is generally small; when an arc occurs, δ is generally large. When δ is greater than a certain threshold, it can be determined that the identification time units are faulty.
The method needs to know the current data of at least three identification time units. For some loads, such as air compressors, or when certain loads are started, δ is large. More identification time units need to be calculated to avoid false positives.
5. Test Verification and Analysis
To verify the correctness of the series arc fault detection method proposed in this paper, an AFDD prototype was developed. The relevant electrical parameters are as follows: a rated voltage of 220 V, and a rated current of 40 A. Figure 12 shows the AFDD prototype.
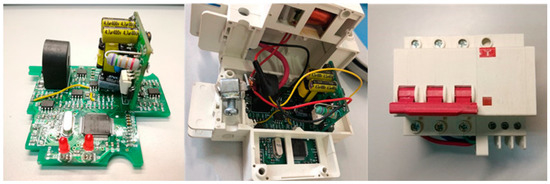
Figure 12.
Prototype of an AFDD.
A series arc fault test platform was designed and built with reference to the Chinese national standard GB/T 31143-2014. Figure 13a shows the series arc fault test circuit. Figure 13b shows the arc generator. Figure 13c shows the laboratory test platform. The arc generator consists of a stationary electrode and a moving electrode; one electrode is a carbon-graphite rod and the other electrode is a copper rod. We adjust the distance between the two electrodes by controlling a stepper motor, which will produce a continuous arc when the two electrodes are separated by a certain distance. The digital oscilloscope model used is a Tektronix DPO3054. A TCP0030 current probe is used for current signal acquisition, and a P5200A/50 MHz high-voltage differential probe is used to collect the voltage signals.
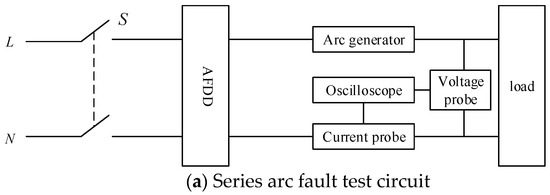
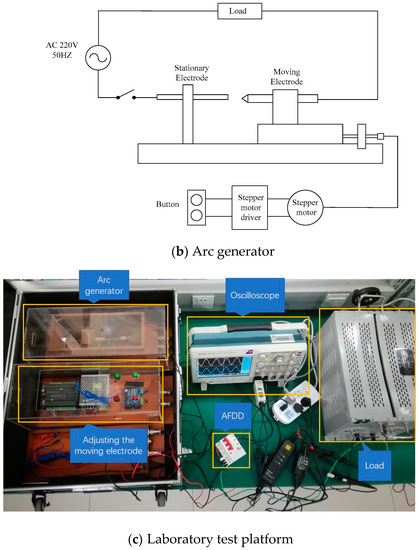
Figure 13.
Series arc fault test.
The AFDD prototype was tested under a purely resistive load, and using a vacuum cleaner and a desktop computer. The load voltage, line current, and breaking time of the AFDD prototype were recorded simultaneously during the test. Figure 14 shows the waveforms of the series arc fault detection under a purely resistive load, and when using the vacuum cleaner and desktop computer. The breaking times of the AFDD prototype are shown in Figure 14. The breaking time of the purely resistive load (at 660 W) is 0.1386 s, the breaking time of the vacuum cleaner (at 1100 W) is 0.1204 s, and the breaking time of the desktop computer (at 500 W) is 0.0792 s. In summary, the AFDD prototype can detect the series arc faults correctly for the resistance load, vacuum cleaner, and desktop computer. The breaking time meets the time limit stipulated by GB/T 31143-2014.
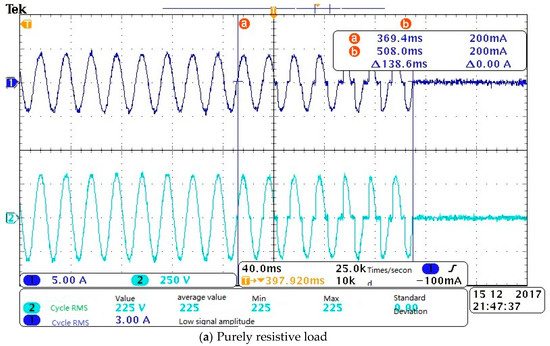
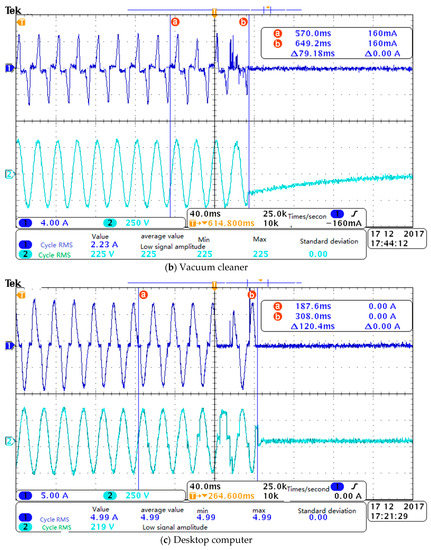
Figure 14.
Detection waveforms of series arc faults.
It should be pointed out that, as analyzed in Section 3.3, the effective value of the current will decrease to a certain extent when a series arc fault occurs under a purely inductive load; however, the shoulders, pulse current, and even randomness are not obvious, which brings about great difficulty in the detection of a series arc fault. However, under actual circumstances, a purely inductive load is almost absent, and the load is mostly a resistor–inductance load. At present, the two standards GB/T 31143-2014 and GB 14287.4-2014 promulgated in China are only for series arc fault detection under several specific load conditions. For these loads, the analysis method described in this paper can also summarize the characteristics of the line current waveform and the relationship between the voltage and current when series arc faults occur, thereby obtaining the detection basis of a series arc fault.
To further verify the effectiveness of the detection method proposed in this paper, the AFDD prototype was tested under certain loads, such as fluorescent lamps, halogen lamps, inverter air conditioners, hand drills, dimming lamps, and their combination, as specified in GB/T 31143-2014.
Three hundred tests were carried out under each load, and the test results are shown in Table 1. It can be seen from Table 1 that the AFDD prototype can operate correctly regardless of the load, and the breaking time meets the requirements of GB/T 31143-2014. It should be pointed out that in the laboratory test, if the arc fault occurs, the current is small. The collected current signals have fewer pulses and less randomness, and the threshold will be difficult to determine. Sometimes missed judgments occur. The accuracy of the series arc fault detection reaches 95% or higher for all test processes. The correctness of the series arc fault detection method proposed by this paper is thus verified.

Table 1.
Test results of AFDD prototype.
6. Conclusions
Based on a summary of the arc volt–ampere characteristics, this paper analyzes the causes and features of the shoulders, pulse currents, and randomness of series currents under different load conditions. In addition, a series arc fault detection method is proposed.
An AFDD prototype with a rated voltage of 220 V and rated current of 40 A was developed, and a software flowchart and hardware implementation principle of the AFDD were provided. The prototype was tested using the GB/T 31143-2014 test method, and a large number of tests were carried out under various loads and different power conditions, the results of which show that the proposed detection method is simple and practical, with high detection accuracy and low cost for microprocessor implementation. This study will have a good role in promoting the development of arc fault detection and protection devices.
Author Contributions
Methodology, Q.L.; software, Z.G.; validation, Z.Y.; writing—original draft preparation, T.W. and Z.Y.; writing—review and editing, Q.L. and Y.Z.
Funding
The study was supported by National Natural Science Foundation of China (NSFC) under Grant No. 51577187.
Conflicts of Interest
The authors declare no conflict of interest.
References
- Underwriters Laboratories Inc. UL Standard for Arc-Fault Circuit-Interrupters, 2nd ed.; Underwriters Laboratories Inc.: New York, NY, USA, 2011. [Google Scholar]
- General Administration of Quality Supervision, Inspection and Quarantine of the People’s Republic of China; Standardization Administration of the People’s Republic of China. Electrical Fire Monitoring System–Part 4: Arcing Fault Detectors (GB14287.4-2014); Standards Press of China: Beijing, China, 2014.
- George, D.G.; Gary, W.S. The arc-fault circuit interrupter: An emerging product. IEEE Trans. Ind. Appl. 1998, 34, 928–933. [Google Scholar]
- Seong, W.K.; Eun, D.L.; Dong, H.J.; Seung, W.S. A physical and logical security framework for multilevel AFCI systems in smart grid. IEEE Trans. Smart Grid. 2011, 2, 496–506. [Google Scholar]
- General Administration of Quality Supervision, Inspection and Quarantine of the People’s Republic of China; Standardization Administration of the People’s Republic of China. General Requirements for Arc Fault Detection Devices (AFDD) (GB/T 31143); Standards Press of China: Beijing, China, 2014.
- Jinmi, L.; Patrick, S.; Serge, W.; Etienne, T.; Patrice, J. Arc Fault Detection Based on Temporal Analysis. In Proceedings of the IEEE Conference on Electrical Contacts, New Orleans, LA, USA, 12–15 October 2014. [Google Scholar]
- Pellon, C.V.; Rabiner, M.D.; Nicolls, C.A.; Zanelli, R.; Fontaine, L.; Edmunds, L.; Parker, M.; Kawate, K.W.; Mayer, R.D.; Lavado, M.J.; et al. Apparatus and Method for Detecting Arc Faults. European Patent 1 638 181 A2, 22 March 2006. [Google Scholar]
- Carlos, E.R. Arc fault detection and discrimination methods. In Proceedings of the Electrical Contacts-2007 the 53rd IEEE Holm Conference on Electrical Contacts, Pittsburgh, PA, USA, 16–19 September 2007. [Google Scholar]
- Etienne, T.; Jinmi, L.; Patrick, S.; Yves, B. Series arcing detection by algebraic derivative of the current. Electr. Power Syst. Res. 2015, 119, 91–99. [Google Scholar]
- Giovanni, A.; Antonio, C.; Valentina, C.; Dario, D.C.; Salvatore, N.; Giovanni, T. Arc fault detection method based on CZT low-frequency harmonic current analysis. IEEE Trans. Instrum. Meas. 2017, 66, 888–896. [Google Scholar]
- Joshua, E.S.; Shane, P.; Yongbin, S.; Sanjay, E.S. Real-time Deep Neural Networks for internet-enabled arc-fault detection. Eng. Appl. Artif. Intell. 2018, 74, 35–42. [Google Scholar]
- Nedzad, H.; Miomir, K.; Zoran, R. Detection of series arcing in low voltage electrical installations. Eur. Trans. Electr. Power. 2009, 19, 423–432. [Google Scholar]
- Yang, K.; Zhang, R.; Yang, J.; Liu, C.; Chen, S.; Zhang, F. A novel arc fault detector for early detection of electrical fires. Sensors 2016, 16, 500. [Google Scholar] [CrossRef]
- Yang, K.; Zhang, R.; Chen, S.; Zhang, F.; Yang, J.; Zhang, X. Series Arc Fault Detection Algorithm Based on Autoregressive Bispectrum Analysis. Algorithms 2015, 8, 929–950. [Google Scholar] [CrossRef]
- Cheng, H.; Chen, X.J.; Liu, F.Y.; Wang, C. Series arc fault detection and implementation based on the short-time Fourier transform. In Proceedings of the 2010 Asia-Pacific Power and Energy Engineering Conference (APPEEC), Chengdu, China, 28–31 March 2010. [Google Scholar]
- Qi, P.; Jovanovic, S.; Lezama, J.; Schweitzer, P. Discrete wavelet transform optimal parameters estimation for arc fault detection in low-voltage residential power networks. Electr. Power Syst. Res. 2017, 143, 130–139. [Google Scholar] [CrossRef]
- Ji, H.K.; Wang, G.; Kim, W.H.; Kil, G.S. Optimal Design of a Band Pass Filter and an Algorithm for Series Arc Detection. Energies 2018, 11, 992. [Google Scholar] [CrossRef]
- Lu, Q.W.; Wang, T.; Li, Z.R.; Wang, C. Detection method of series arcing fault based on wavelet transform and singular value decomposition. Trans. Chin. Electr. Soc. 2017, 32, 208–217. (In Chinese) [Google Scholar]
- Zeng, K.; Xing, L.D.; Zhang, Y.J.; Wang, L. Characteristics analysis of AC arc fault in time and frequency domain. In Proceedings of the 2017 Prognostics and System Health Management Conference (PHM-Harbin), Harbin, China, 9–12 July 2017; pp. 288–292. [Google Scholar]
- Liu, Y.W.; Wu, C.J.; Wang, Y.C. Detection of serial arc fault on low-voltage indoor power lines by using radial basis function neural network. Electr. Power Energy Syst. Res. 2016, 83, 149–157. [Google Scholar] [CrossRef]
- Wu, C.J.; Liu, Y.W. Smart detection technology of serial arc fault on low-voltage indoor power lines. Int. J. Electr. Power Energy Syst. 2015, 69, 391–398. [Google Scholar] [CrossRef]
- Kostyantyn, K.; Bei, G.; Joel, A. A low-cost power-quality meter with series arc-fault detection capability for smart grid. IEEE Trans. Power Deliv. 2013, 28, 1584–1591. [Google Scholar]
- Liu, W.J.; Zhang, X.B.; Ji, R.P.; Dong, Y.J.; Li, W.L. Arc fault detection for AC SSPC in MEA with HHT and ANN. In Proceedings of the IEEE International Conference on Aircraft Utility Systems (AUS), Beijing, China, 10–12 October 2016. [Google Scholar]
- Alireza, K.; Steffen, F.; Dirk, U.; Sergey, G.; Ralf, P.M. Electrical arc model based on physical parameters and power calculation. IEEE Trans. Plasma Sci. 2015, 43, 2721–2729. [Google Scholar]
- Kumar, V.V.; Thomas, M.J.; Naidu, M.S. Influence of Switching Conditions on the VFTO Magnitudes in a GIS. IEEE Trans. Power Del. 2001, 16, 539–544. [Google Scholar] [CrossRef]
- Povh, D.; Schmitt, H.; Valcker, O.; Wutzmann, R. Modelling and Analysis Guidelines for Very Fast Transients. IEEE Trans. Power Deliv. 1996, 11, 2028–2035. [Google Scholar] [CrossRef]
- Lin, X.; Wang, N.; Xu, J.Y. Calculation and analysis of very fast transient over-voltage characteristic on the condition of dynamic arcing model. Proc. CSEE 2012, 32, 157–164. (In Chinese) [Google Scholar]
- Parise, G.; Martirano, L.; Laurini, M. Simplified arc-fault model: The reduction factor of the arc current. IEEE Trans. Ind. Appl. 2013, 49, 1703–1710. [Google Scholar] [CrossRef]
- Krishna, M.; Ramesh, O. Conducted EMI mitigation techniques for switch-mode power converters: A survey. IEEE Trans. Power Electron. 2010, 25, 2344–2356. [Google Scholar]


© 2019 by the authors. Licensee MDPI, Basel, Switzerland. This article is an open access article distributed under the terms and conditions of the Creative Commons Attribution (CC BY) license (http://creativecommons.org/licenses/by/4.0/).