Influence of Demographics on Consumer Preferences for Alternative Fuel Vehicles: A Review of Choice Modelling Studies and a Study in Portugal


Abstract
1. Introduction
2. Previous Review Studies
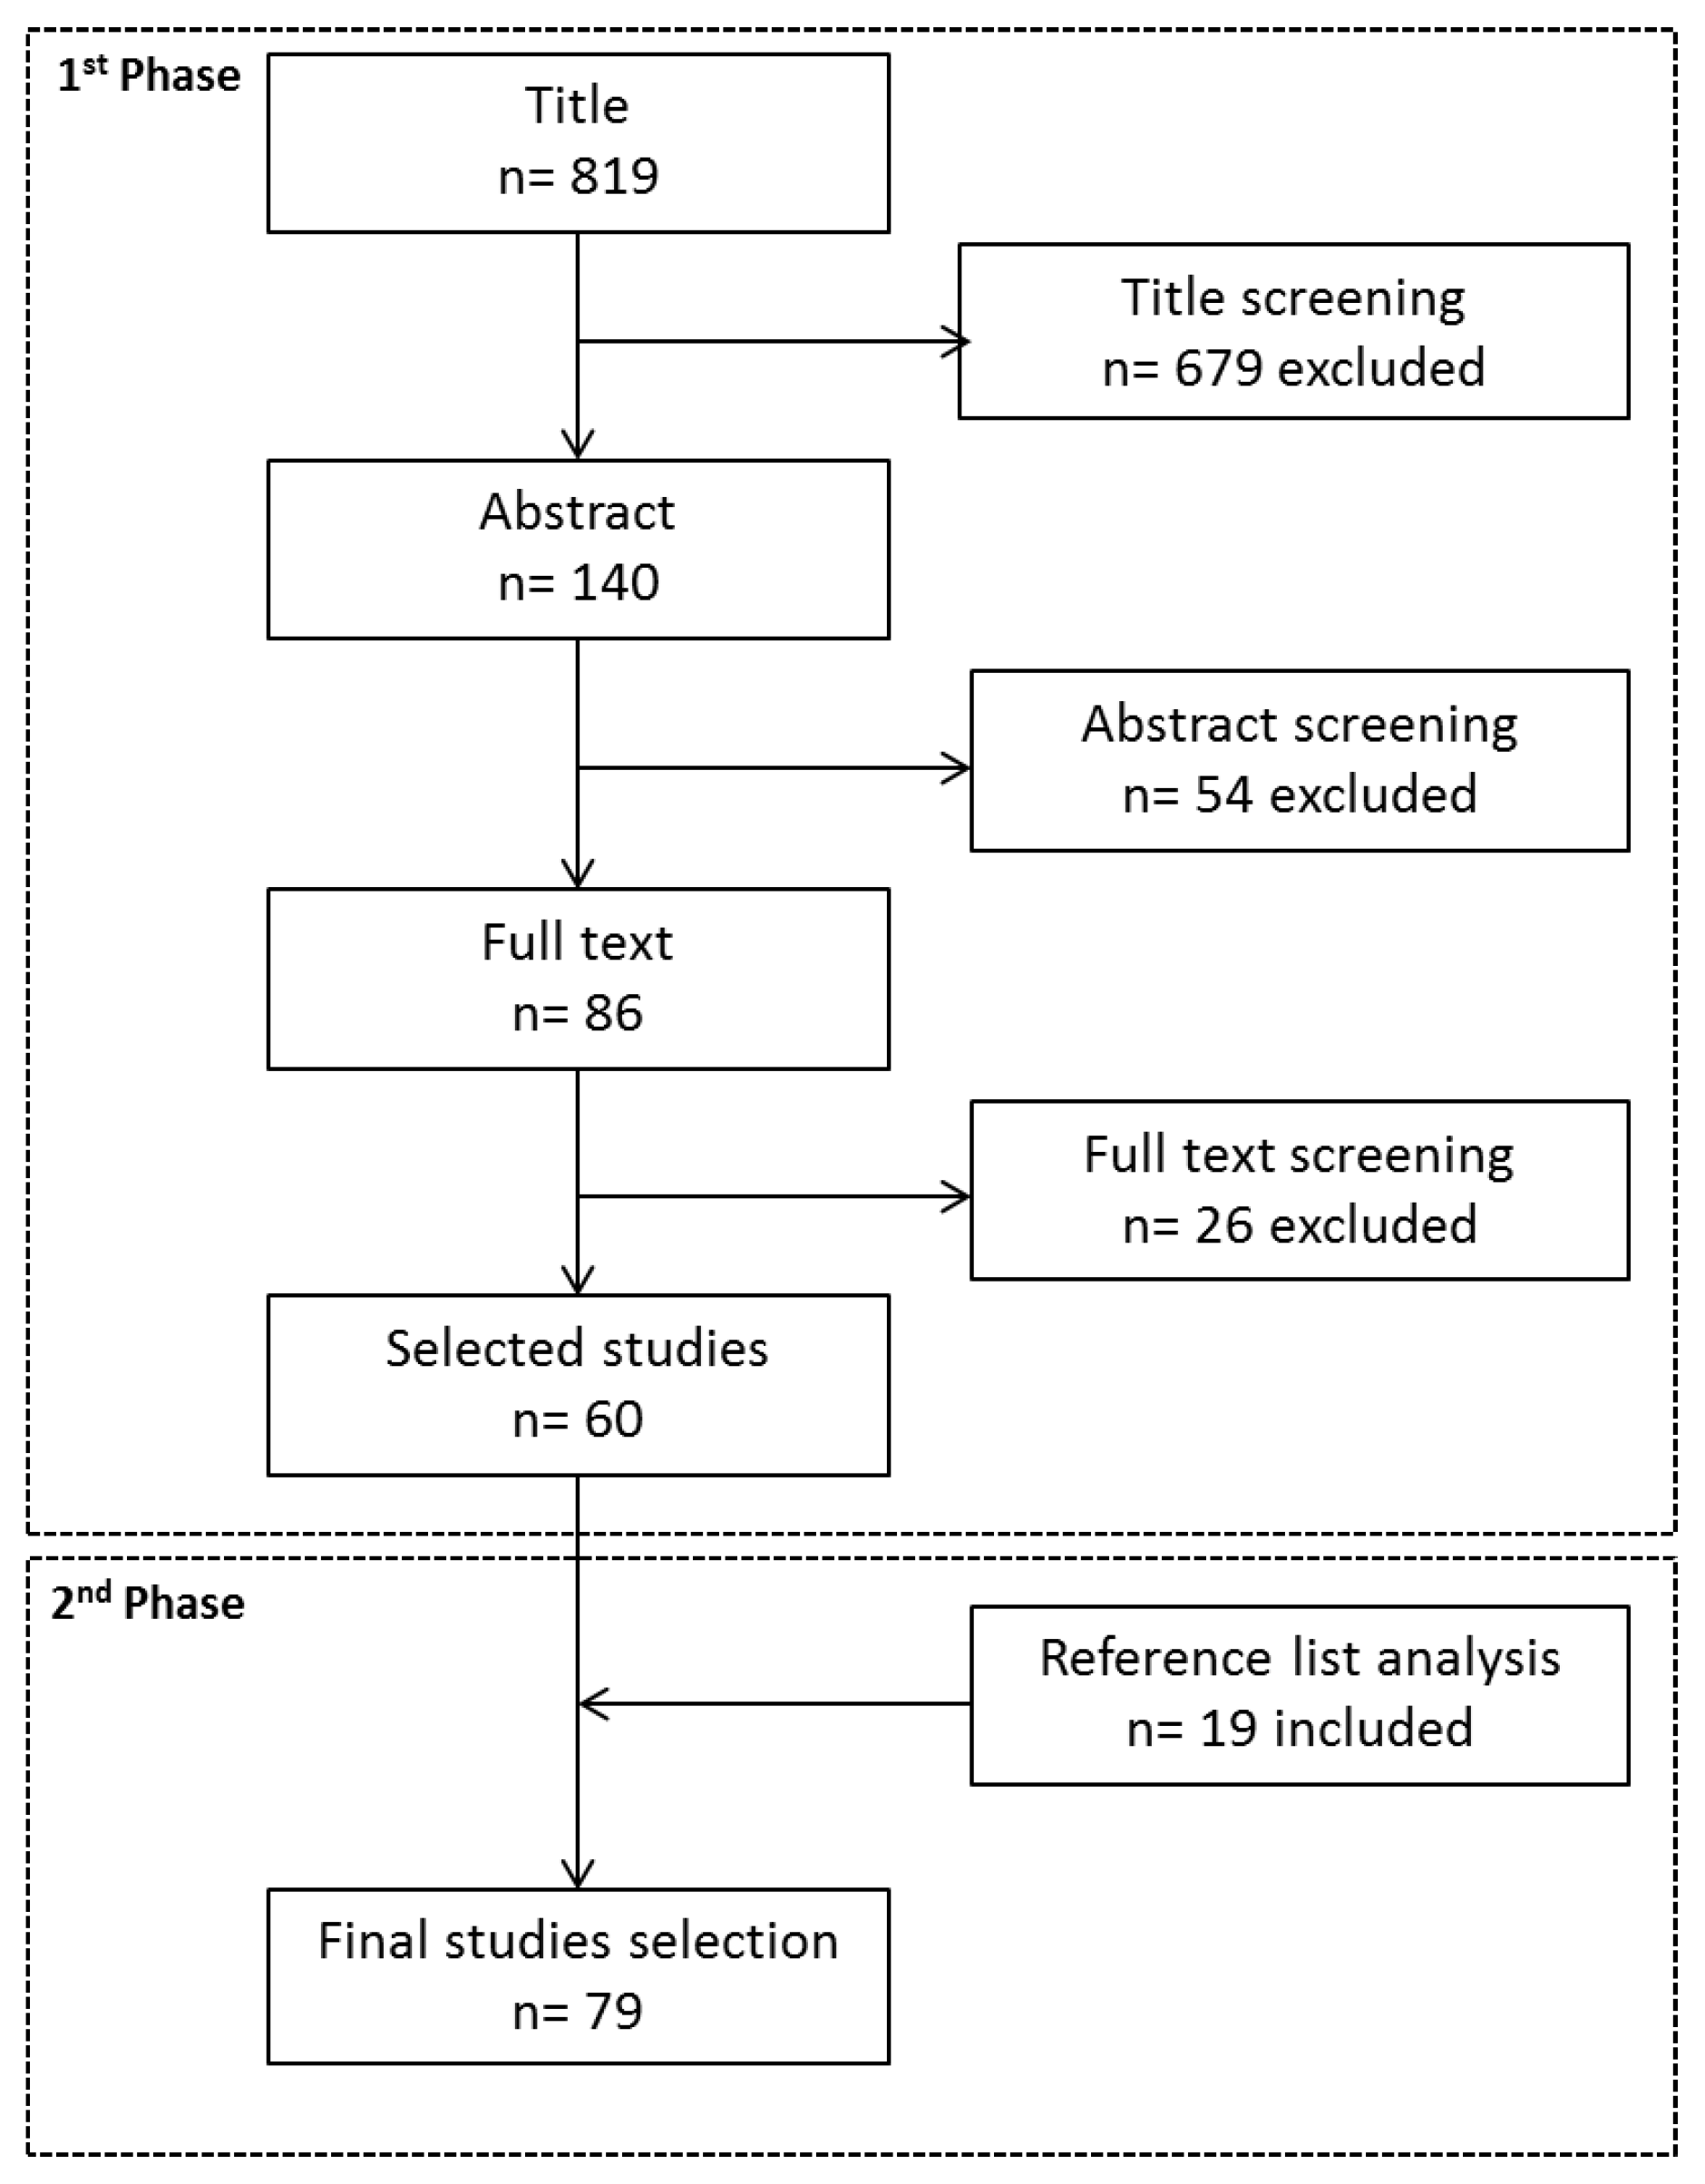
3. Data Collection Strategy
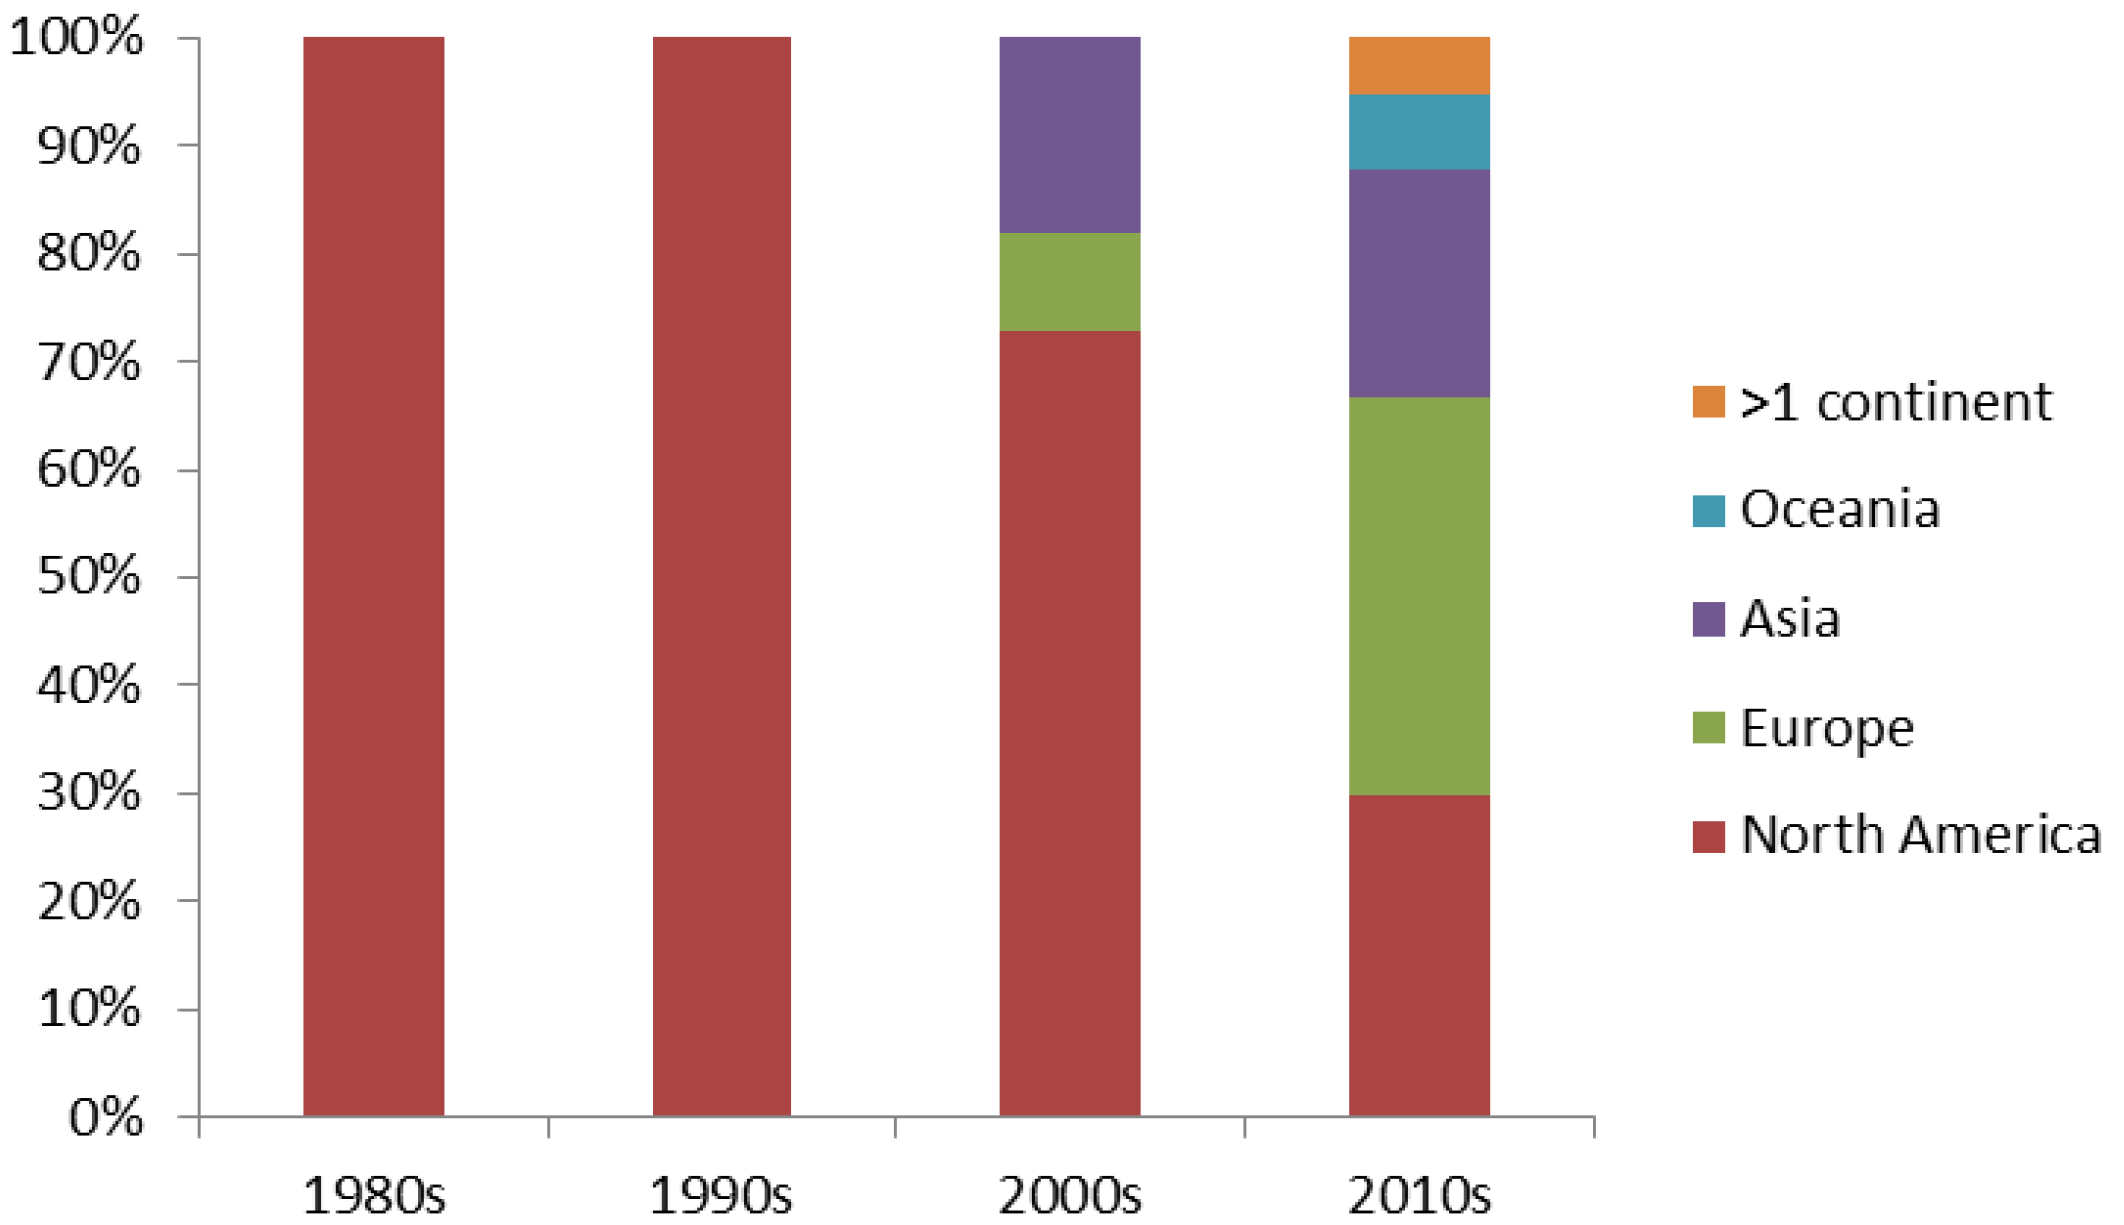
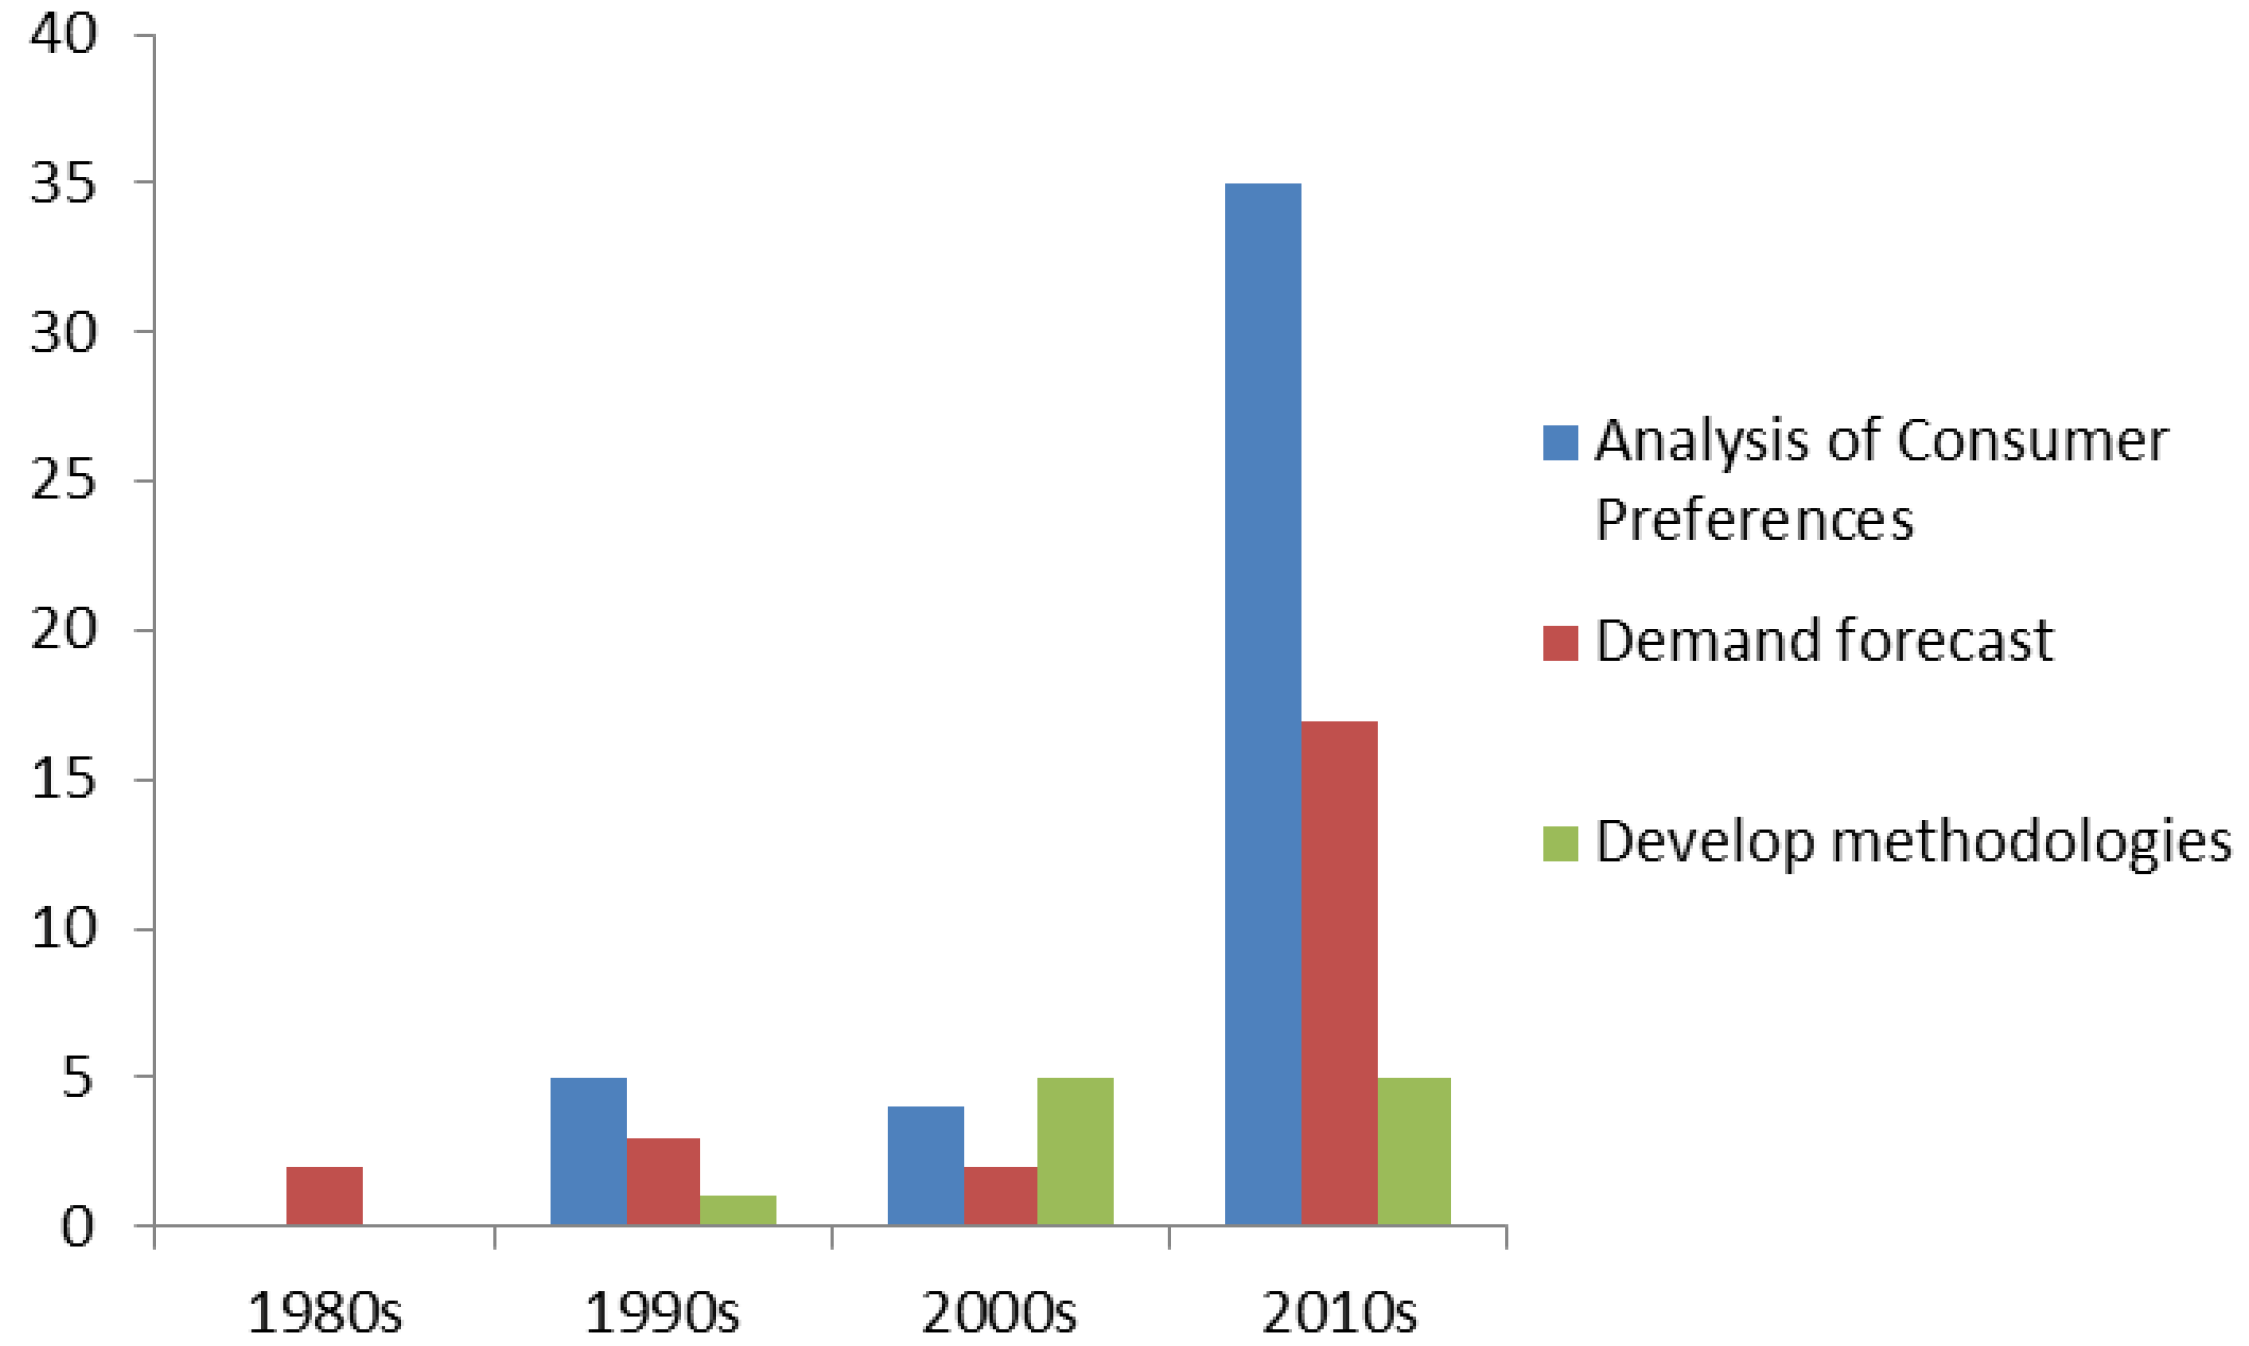
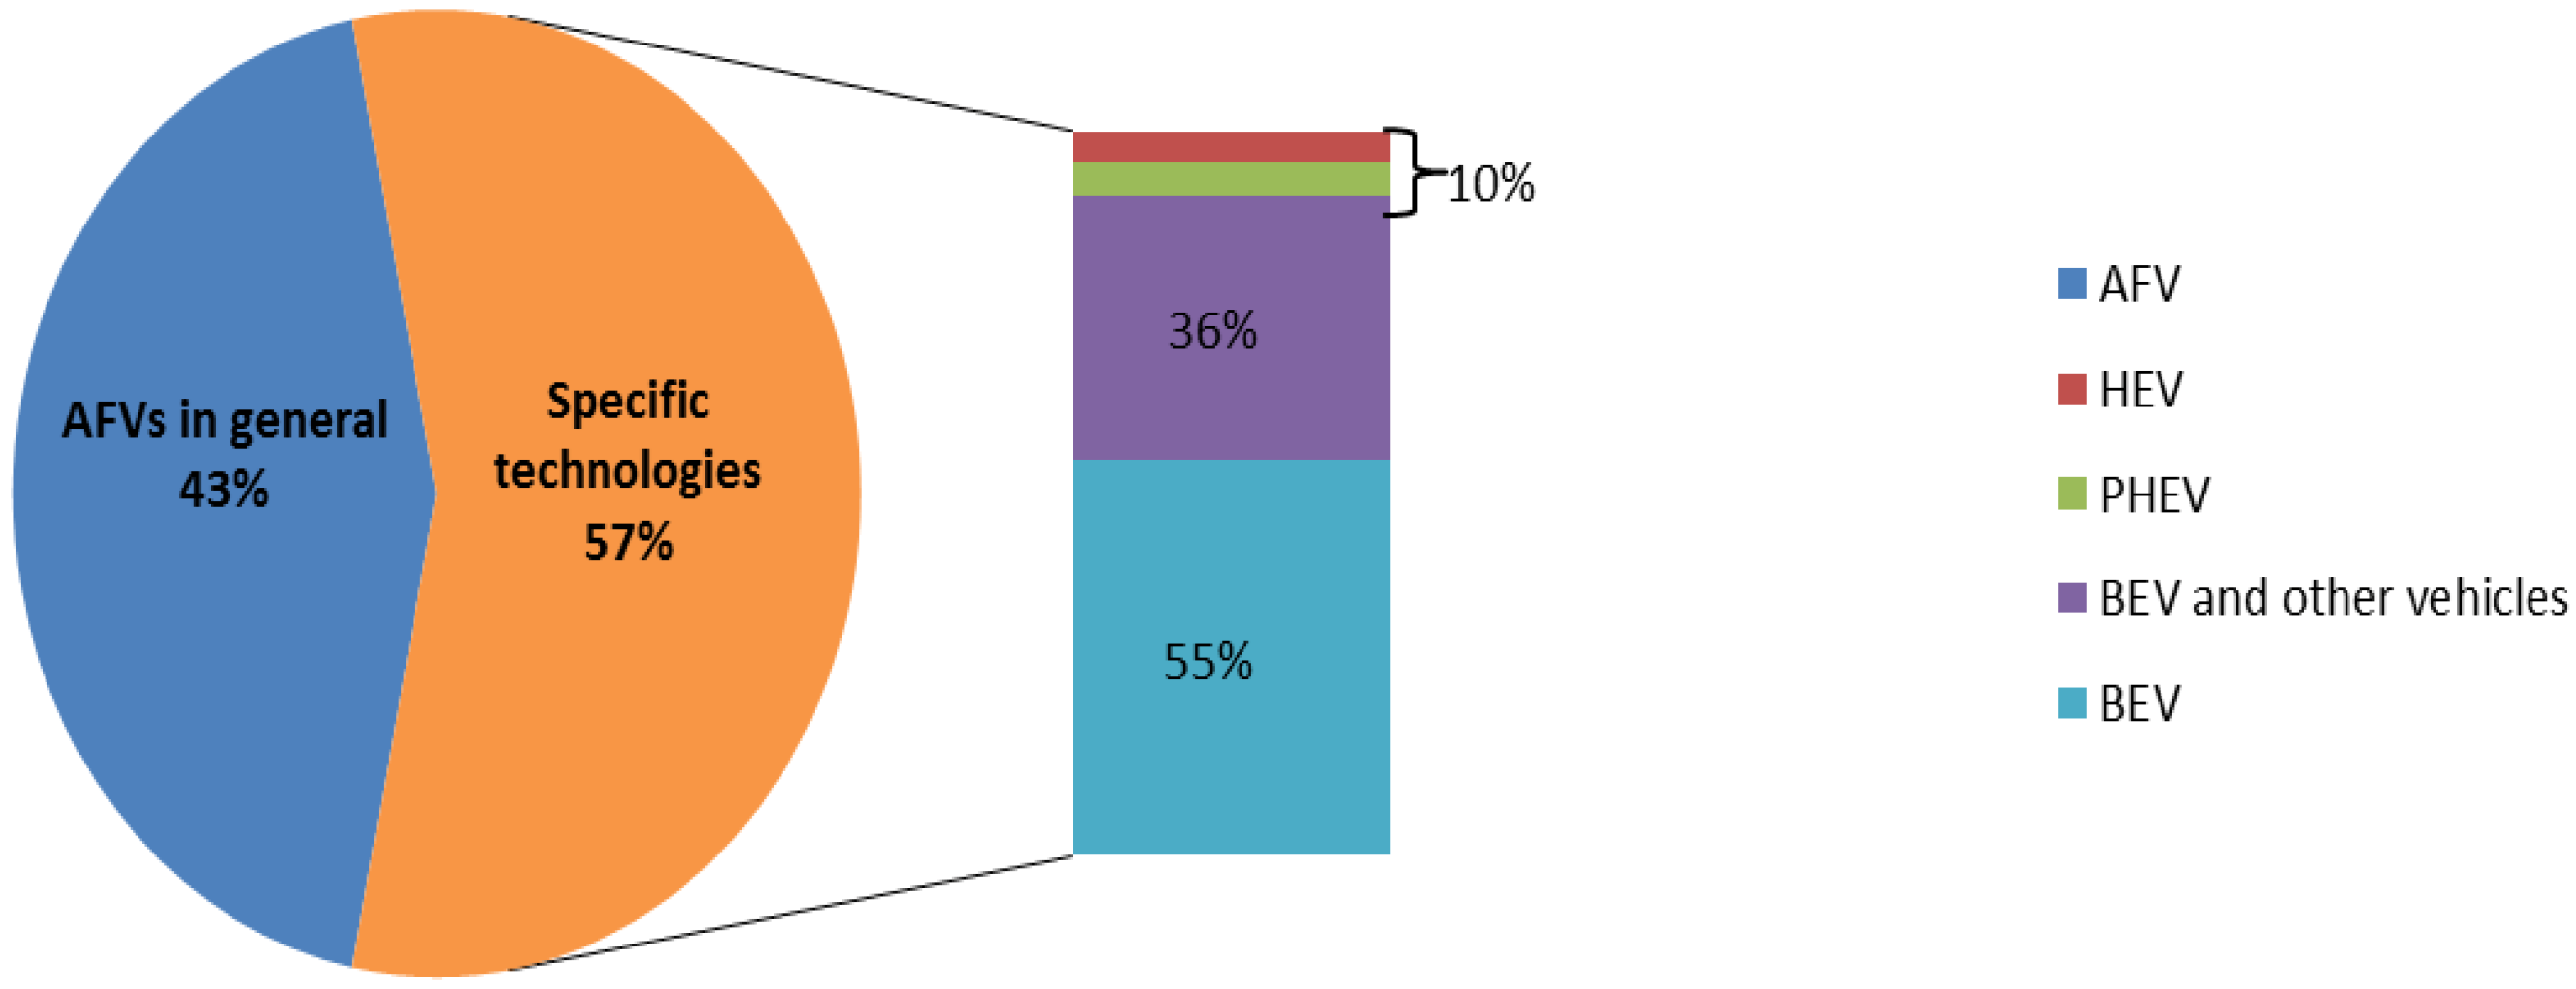
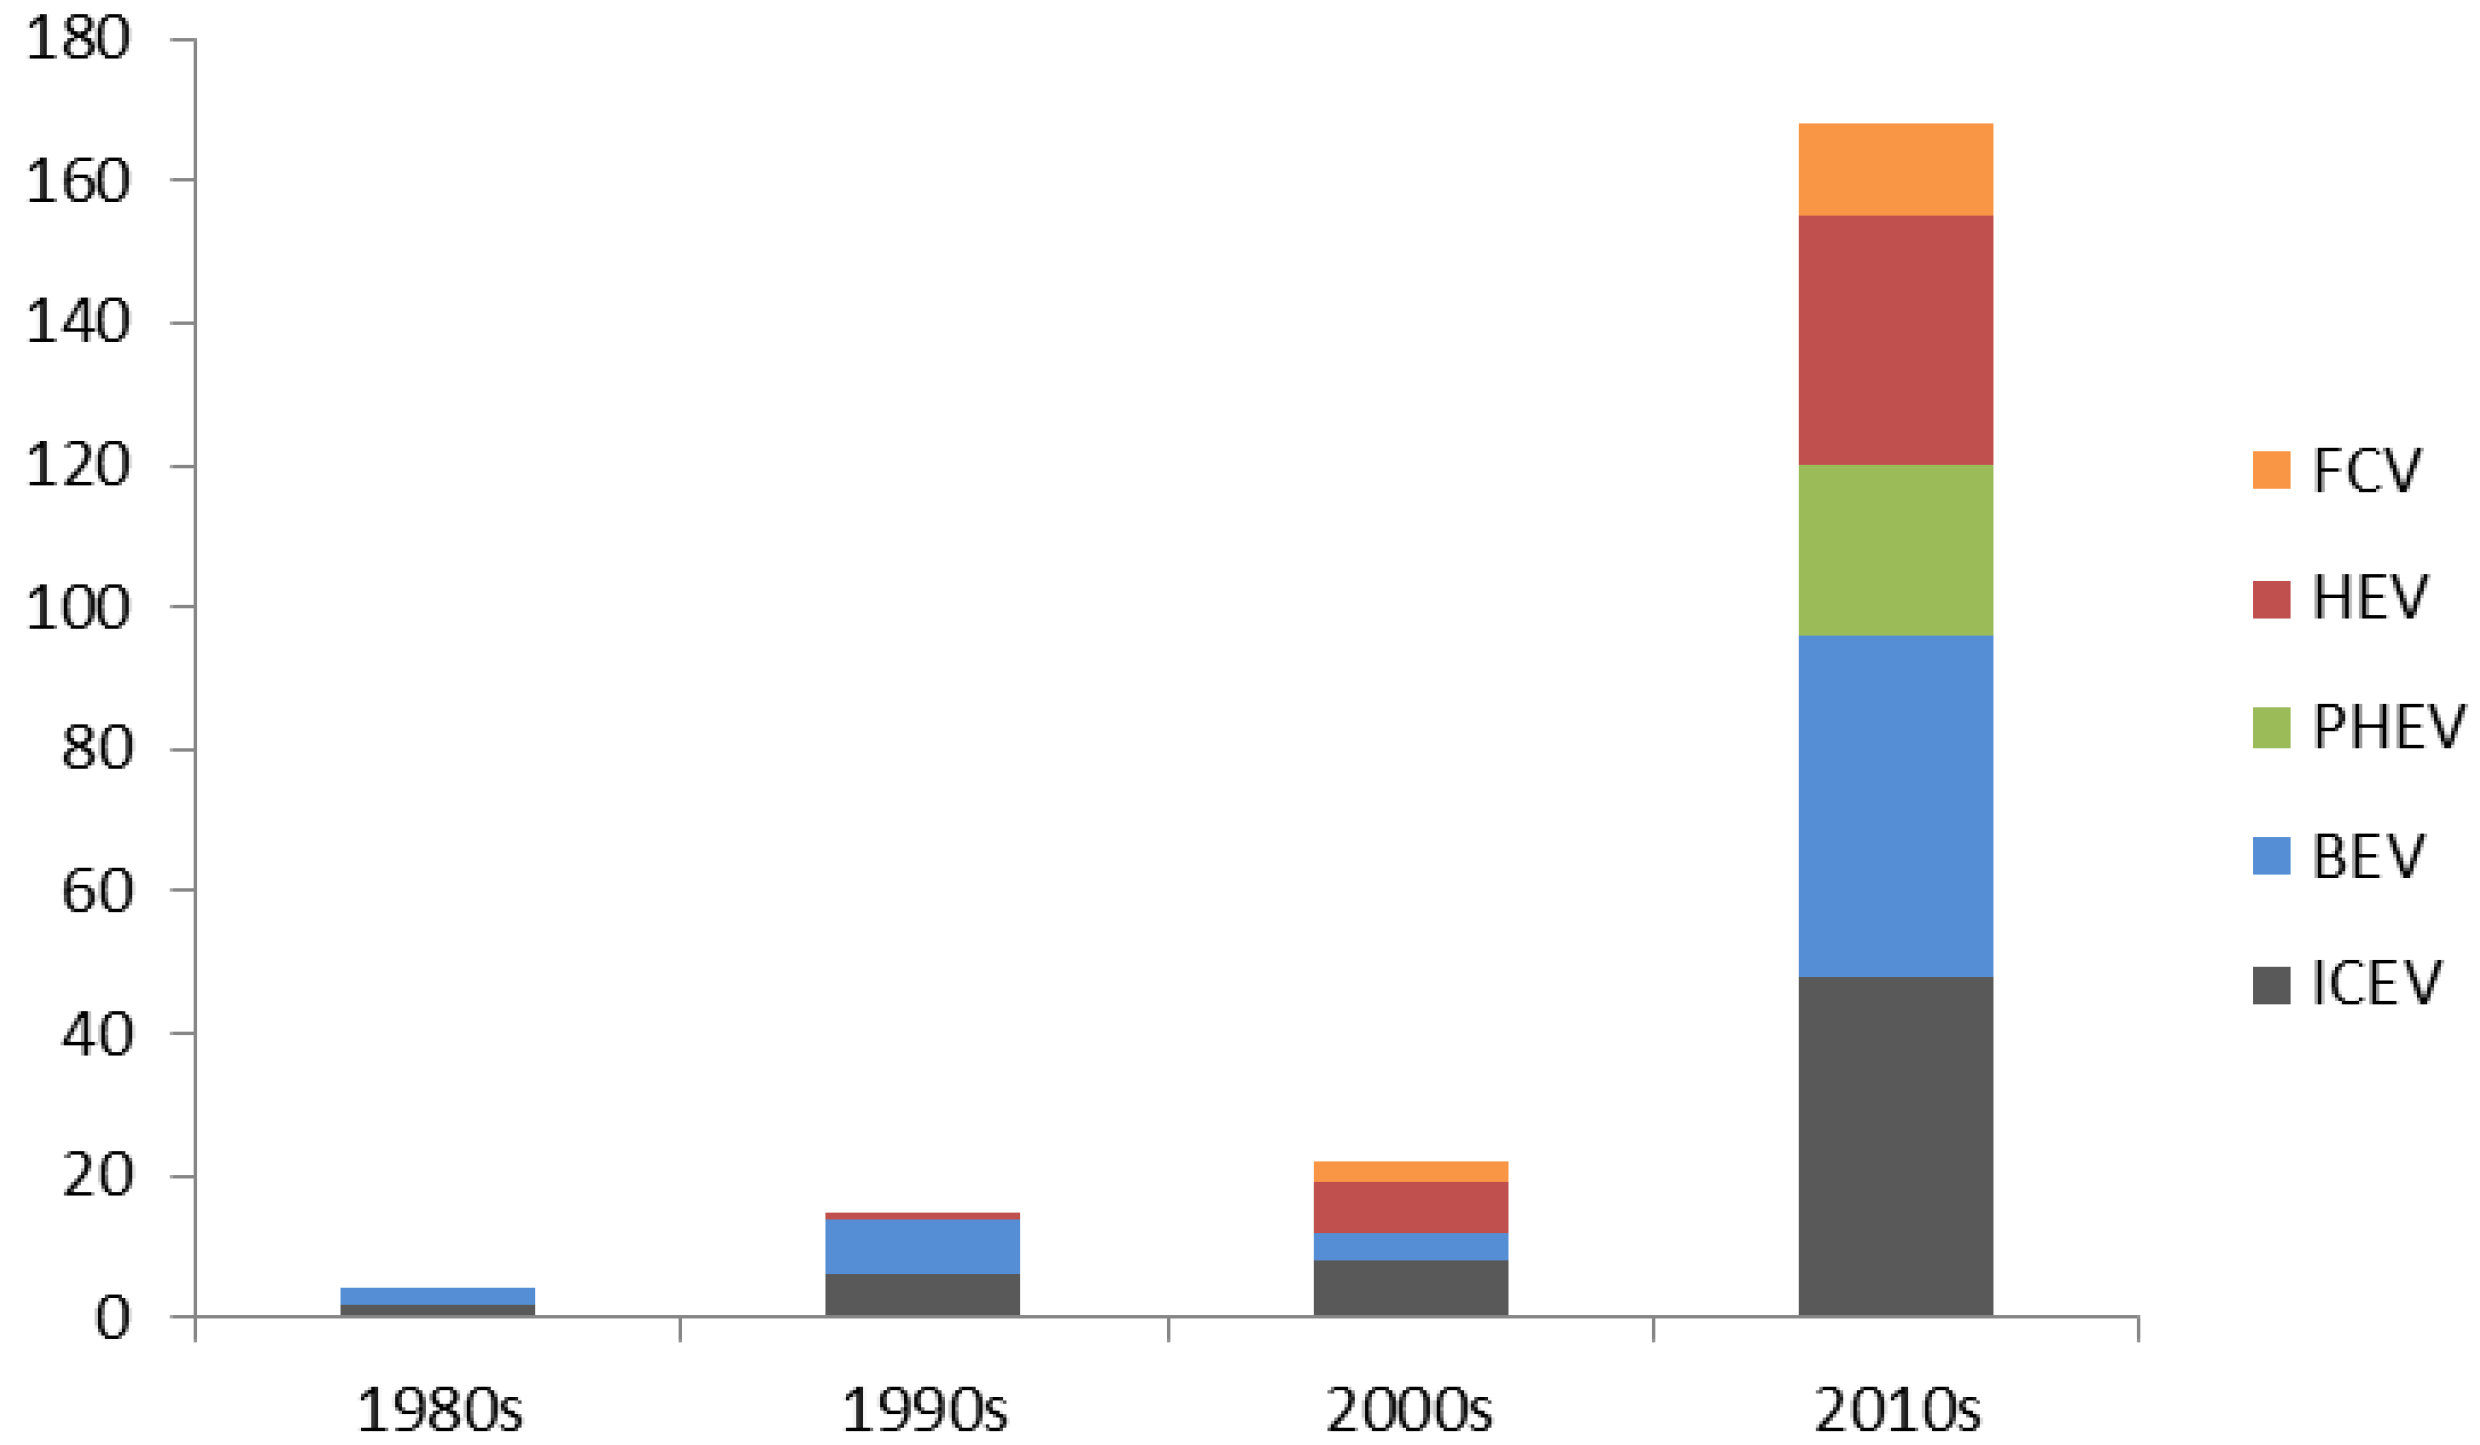
4. CM Studies
5. Individual Characteristics of Consumers
5.1. Sample Size and Representativity
5.2. Relation between Consumer Preferences for Vehicle Type and Demographic Data
5.2.1. Age Influence
5.2.2. Gender Influence
5.2.3. Income Influence
5.2.4. Level of Education Influence
5.2.5. Family Size Influence
5.2.6. Vehicle-Related Demographics Influence
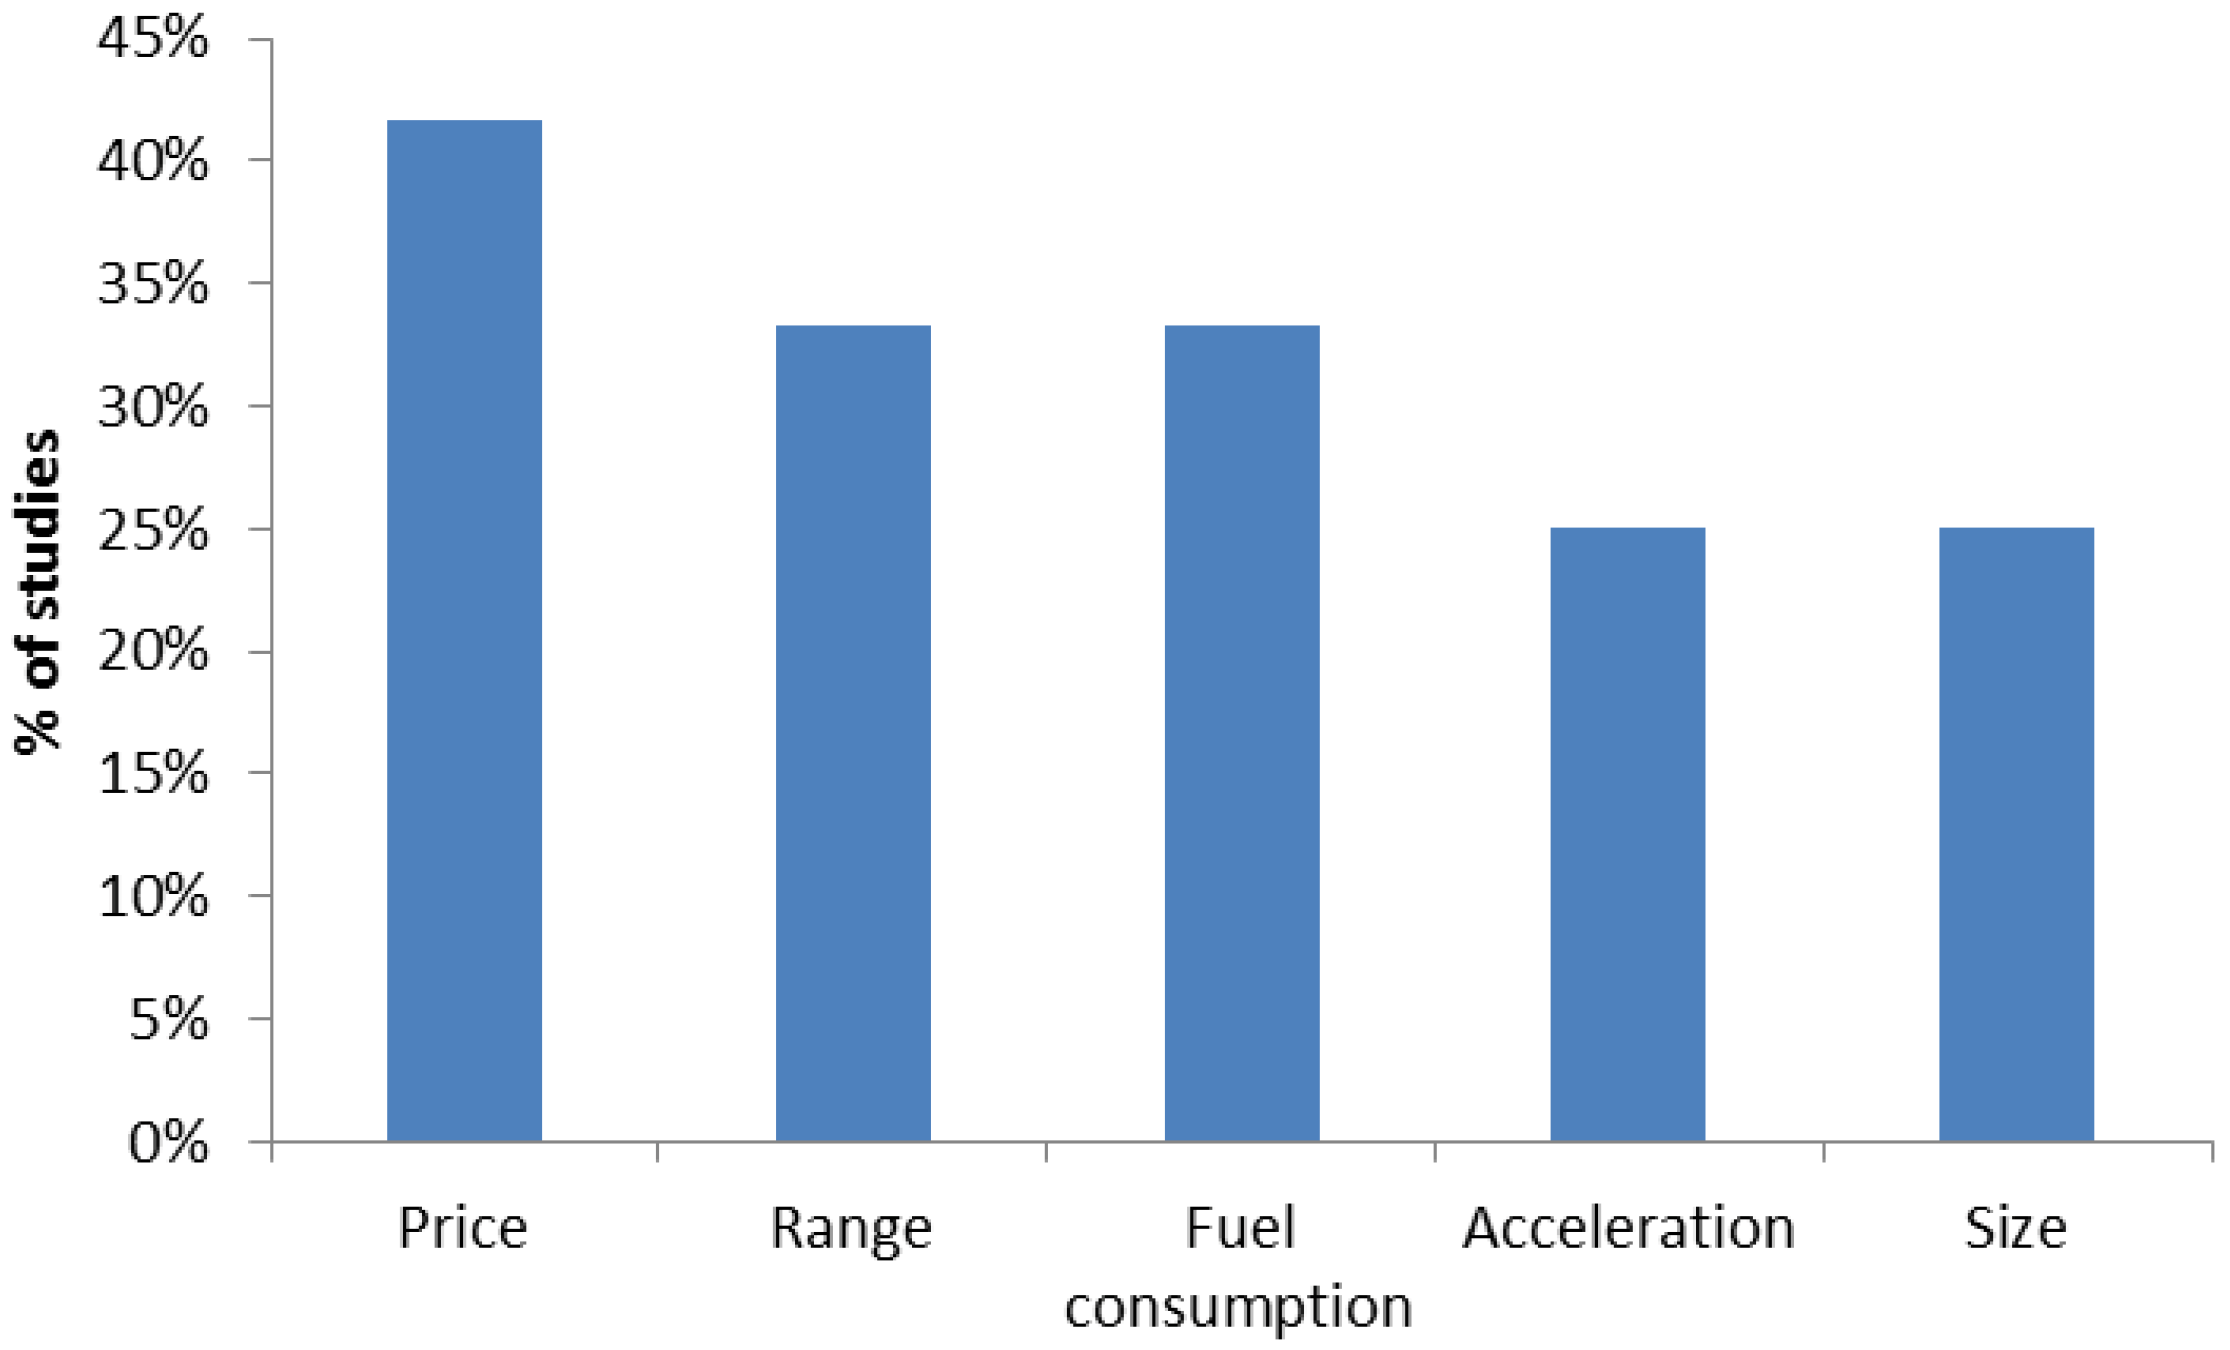
5.3. Relation between Consumer Preferences for Vehicle Attributes and Demographic Data
6. The Portuguese Case
- -
- Purchase price: cost to acquire a vehicle, measured in €;
- -
- Range: distance that can be driven without fueling/charging the vehicle, measured in km;
- -
- Fuel consumption: cost to drive 100 km, measured in €/100 km;
- -
- CO2 emissions: quantity of CO2 emissions released to the environment during the usage phase of the vehicle, measured in g/km.
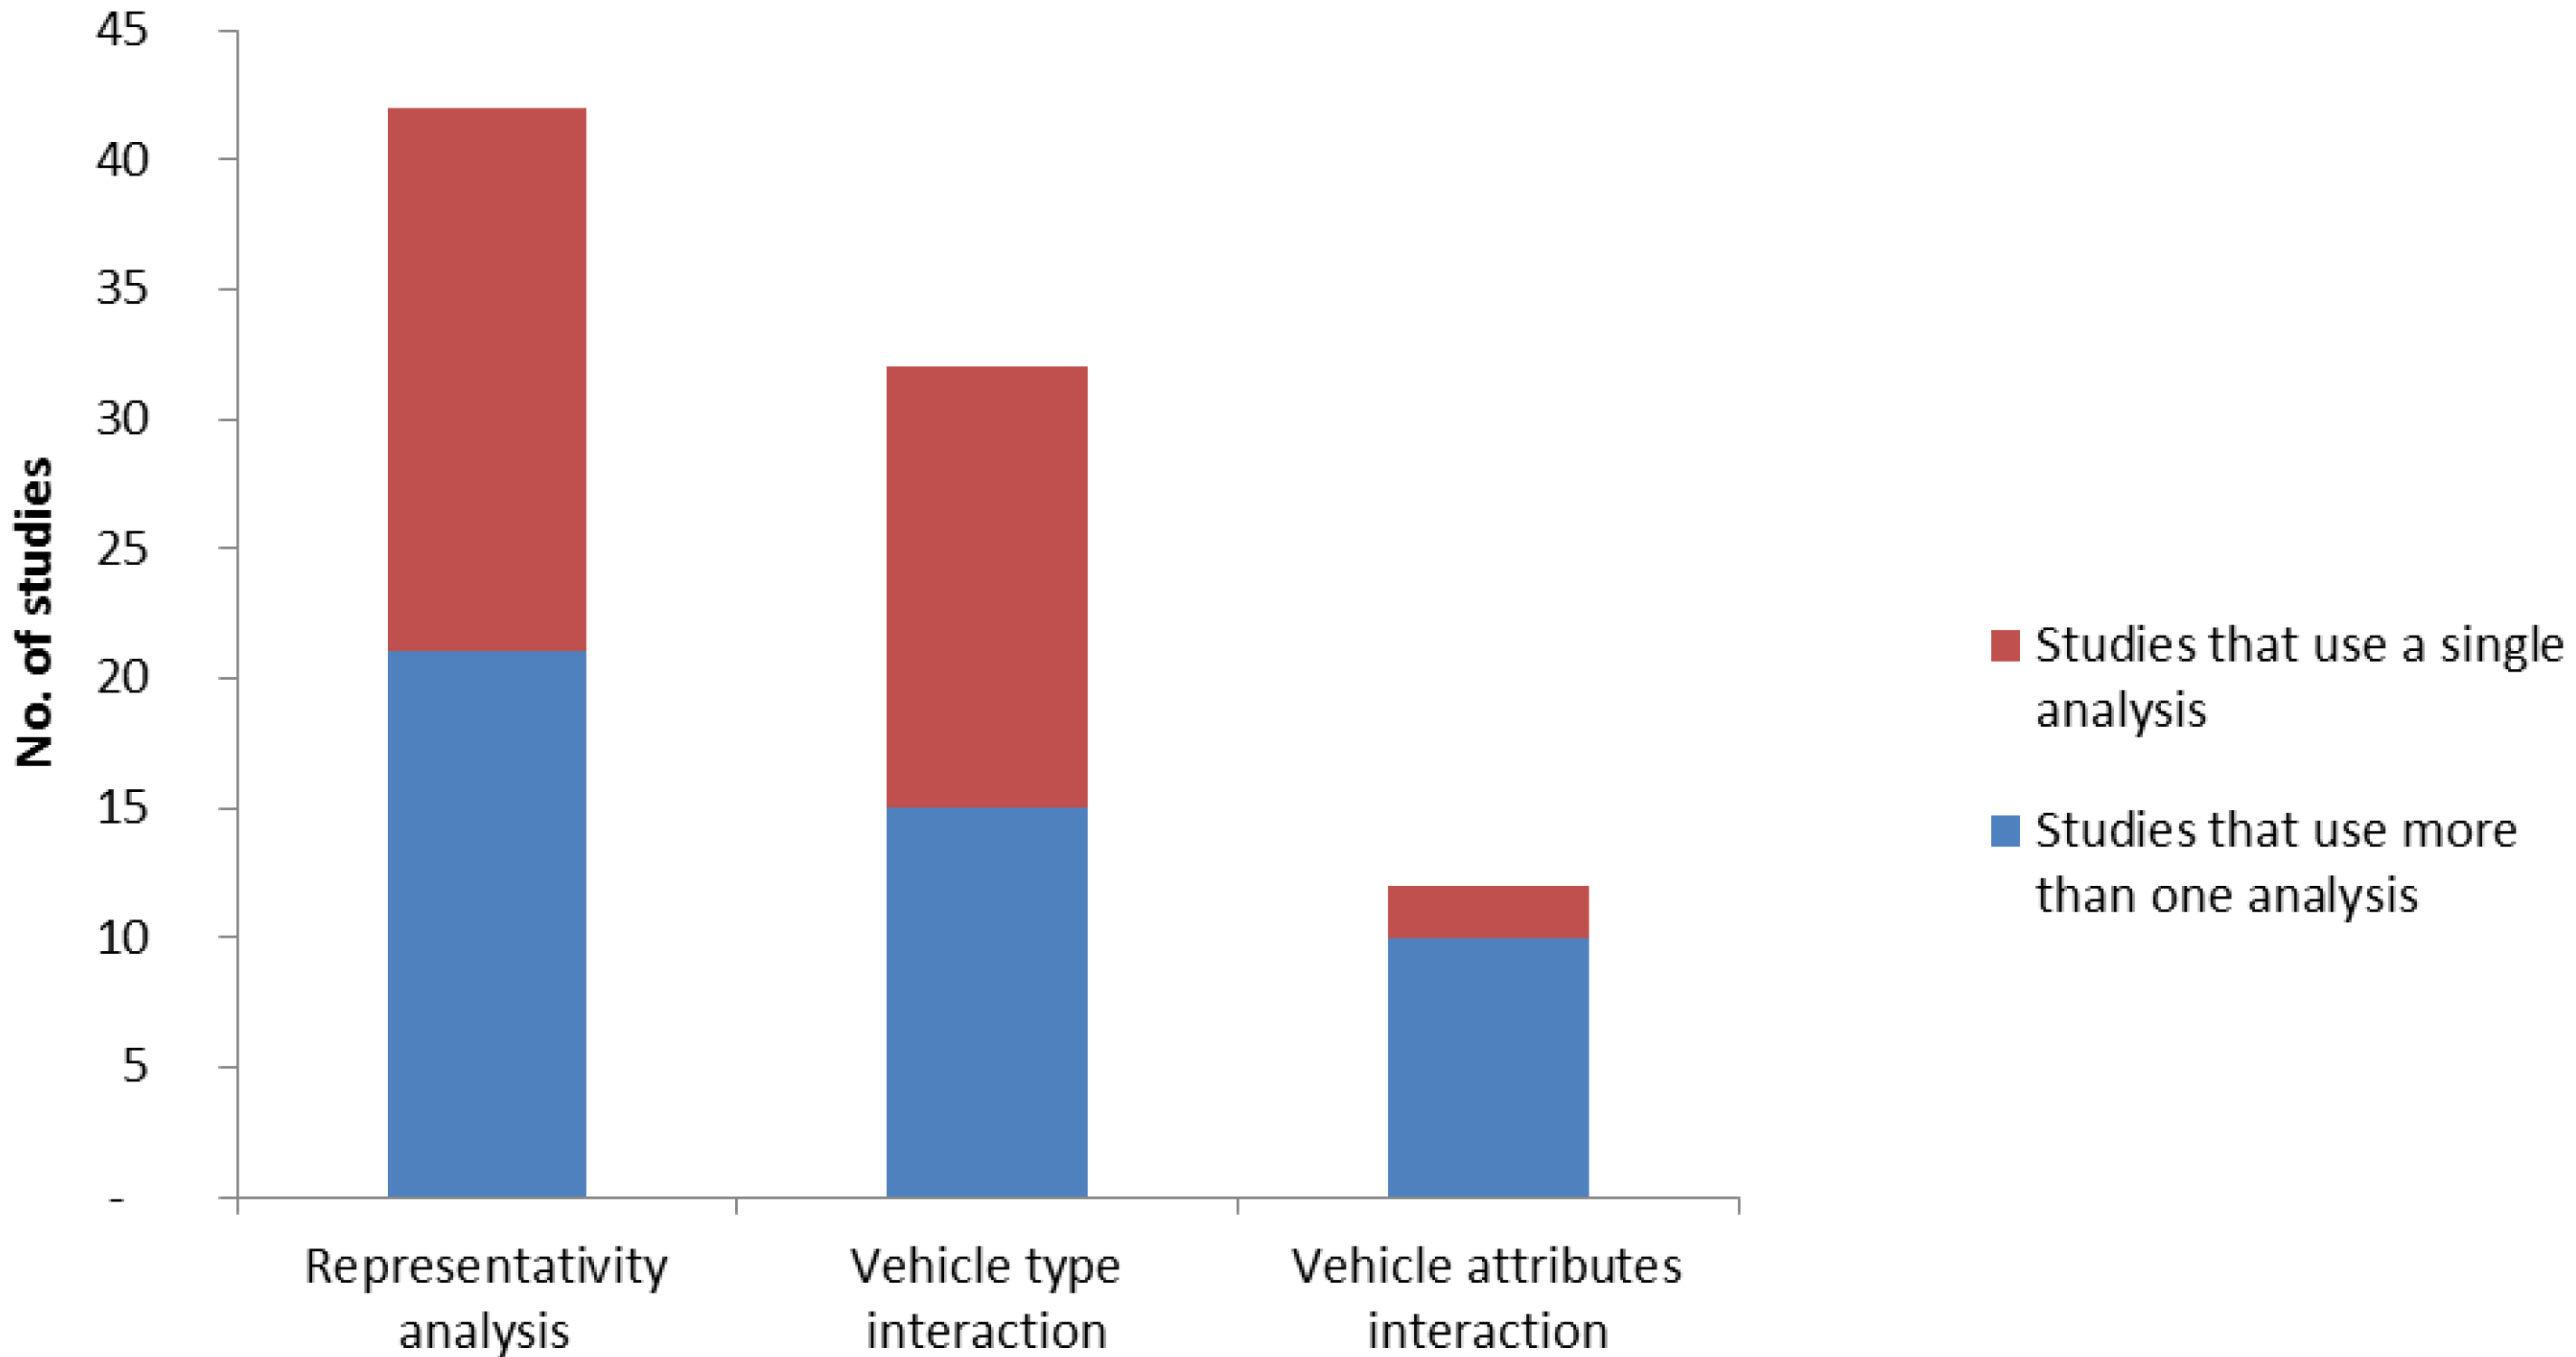
6.1. Analysis of Sample Representativity
6.2. Analysis of the Interaction of Demographic Data with Vehicle Type and Attributes
- -
- Consumers with higher education are more price sensitive;
- -
- City drivers are less sensitive to range;
- -
- Older consumers and consumers that drive less are more sensitive to fuel consumption;
- -
- Lower knowledge consumers are less sensitive to lower emission values.
7. Main Conclusions and Discussion
8. Research Gaps and Recommendations for Future Research
Author Contributions
Funding
Acknowledgments
Conflicts of Interest
References
- European Commission. Statistical Pocketbook 2018; European Commission: Brussels, Belgium, 2018.
- IPCC. Global Warming of 1.5 °C; Report from Intergovernmental Panel on Climate Change; IPCC: Geneva, Switzerland, 2018. [Google Scholar]
- Ahn, J.; Jeong, G.; Kim, Y. A forecast of household ownership and use of alternative fuel vehicles: A multiple discrete-continuous choice approach. Energy Econ. 2008, 30, 2091–2104. [Google Scholar] [CrossRef]
- García, I.; Miguel, L.J. Is the electric vehicle an attractive option for customers? Energies 2012, 5, 71–91. [Google Scholar] [CrossRef]
- Potoglou, D.; Kanaroglou, P.S. Household demand and willingness to pay for clean vehicles. Transp. Res. D Transp. Environ. 2007, 12, 264–274. [Google Scholar] [CrossRef]
- Hidrue, M.K.; Parsons, G.R.; Kempton, W.; Gardner, M.P. Willingness to pay for electric vehicles and their attributes. Resour. Energy Econ. 2011, 33, 686–705. [Google Scholar] [CrossRef]
- Wang, Y.; Liu, Z.; Shi, J.; Wu, G.; Wang, R. Joint optimal policy for subsidy on electric vehicles and infrastructure construction in highway network. Energies 2018, 11, 2479. [Google Scholar] [CrossRef]
- ICTT. European Vehicle Market Statistics: Pocketbook 2017/18; ICTT: Berlin, Germany, 2017. [Google Scholar]
- EPA. Light-Duty Automotive Technology, Carbon Dioxide Emissions, and Fuel Economy Trends: 1975 through 2014; United States Environmental Protection Agency: Washington, DC, USA, 2014.
- Electric Vehicle Sales Growing, but Supply, Lack of Knowledge Remain Barriers. Available online: https://www.ctvnews.ca/autos/electric-vehicle-sales-growing-but-supply-lack-of-knowledge-remain-barriers-1.4060309 (accessed on 28 December 2018).
- Lack of Models, not Charging Points, Holding Back Electric Car Market. Available online: https://www.theguardian.com/environment/2018/feb/27/lack-of-models-not-charging-points-holding-back-electric-car-market (accessed on 28 December 2018).
- Sovacool, B.; Hirsh, R. Beyond batteries: An examination of the benefits and barriers to plug-in hybrid electric vehicles (PHEVs) and a vehicle-to-grid (V2G) transition. Energy Policy 2008, 37, 1095–1103. [Google Scholar] [CrossRef]
- Kemp, R.; Schot, J.; Hoogma, R. Regime shifts to sustainability through processes of niche formation: The approach of strategic niche management. Technol. Anal. Strateg. 1998, 10, 175–195. [Google Scholar] [CrossRef]
- Leiby, P.; Rubin, J. Understanding the transition to new fuels and vehicles: Lessons learned from analysis and experience of alternative fuel and hybrid vehicles. In The Hydrogen Energy Transition: Moving Toward the Post Petroleum Age in Transportation; Sperling, D., Cannon, J.S., Eds.; Elsevier Academic Press: Burlington, MA, USA, 2004. [Google Scholar]
- Urban, G.L.; Weinberg, B.D.; Hauser, J.R. Premarket forecasting of really-new products. J. Mark. 1996, 60, 47–60. [Google Scholar] [CrossRef]
- Ewing, G.; Sarigöllü, E. Car fuel-type choice under travel demand management and economic incentives. Transp. Res. D Transp. Environ. 1998, 3, 429–444. [Google Scholar] [CrossRef]
- Axsen, J.; Bailey, J.; Andrea, M. Preference and lifestyle heterogeneity among potential plug-in electric vehicle buyers. Energy Econ. 2015, 50, 190–201. [Google Scholar] [CrossRef]
- Hoen, A.; Koetse, M.J. A choice experiment on alternative fuel vehicle preferences of private car owners in the Netherlands. Transp. Res. A Policy Pract. 2014, 61, 199–215. [Google Scholar] [CrossRef]
- Shin, J.; Bhat, C.R.; You, D.; Garikapati, V.M.; Pendyala, R.M. Consumer preferences and willingness to pay for advanced vehicle technology options and fuel types. Transp. Res. C Emerg. Technol. 2015, 60, 511–524. [Google Scholar] [CrossRef]
- Achtnicht, M.; Bühler, G.; Hermeling, C. The impact of fuel availability on demand for alternative-fuel vehicles. Transp. Res. D Transp. Environ. 2012, 17, 262–269. [Google Scholar] [CrossRef]
- Ziegler, A. Individual characteristics and stated preferences for alternative energy sources and propulsion technologies in vehicles: A discrete choice analysis for Germany. Transp. Res. A Policy Pract. 2012, 46, 1372–1385. [Google Scholar] [CrossRef]
- Ito, N.; Takeuchi, K.; Managi, S. Willingness-to-pay for infrastructure investments for alternative fuel vehicles. Transp. Res. D Transp. Environ. 2013, 18, 1–8. [Google Scholar] [CrossRef]
- Hackbarth, A.; Madlener, R. Consumer preferences for alternative fuel vehicles: A discrete choice analysis. Transp. Res. D Transp. Environ. 2013, 25, 5–17. [Google Scholar] [CrossRef]
- Tanaka, M.; Ida, T.; Murakami, K.; Friedman, L. Consumers’ willingness to pay for alternative fuel vehicles: A comparative discrete choice analysis between the US and Japan. Transp. Res. A Policy Pract. 2014, 70, 194–209. [Google Scholar] [CrossRef]
- Huang, Y.; Qian, L. Consumer preferences for electric vehicles in lower tier cities of China: Evidences from south Jiangsu region. Transp. Res. D Transp. Environ. 2018, 63, 482–497. [Google Scholar] [CrossRef]
- Sheldon, T.L.; Deshazo, J.R.; Carson, R.T. Electric and plug-in hybrid vehicle demand: Lessons for an emerging market. Econ. Inq. 2017, 55, 695–713. [Google Scholar] [CrossRef]
- Turcksin, L.; Mairesse, O.; Macharis, C. Private household demand for vehicles on alternative fuels and drive trains: A review. Eur. Transp. Res. Rev. 2013, 5, 149–164. [Google Scholar] [CrossRef]
- Green, P.E.; Krieger, A.M.; Wind, Y. Thirty years of conjoint analysis: Reflections and prospects. Interfaces 2001, 31, 56–73. [Google Scholar] [CrossRef]
- Da Silva, M.B.; Moura, F. Electric vehicle diffusion in the Portuguese automobile market. Int. J. Sustain. Transp. 2016, 10, 49–64. [Google Scholar] [CrossRef]
- Potoglou, D.; Kanaroglou, P.S. Disaggregate demand analyses for conventional and alternative fueled automobiles: A review. Int. J. Sustain. Transp. 2008, 2, 234–259. [Google Scholar] [CrossRef]
- Al-Alawi, B.M.; Bradley, T.H. Review of hybrid, plug-in hybrid, and electric vehicle market modeling studies. Renew. Sustain. Energy Rev. 2013, 21, 190–203. [Google Scholar] [CrossRef]
- Rezvani, Z.; Jansson, J.; Bodin, J. Advances in consumer electric vehicle adoption research: A review and research agenda. Transp. Res. D Transp. Environ. 2015, 34, 122–136. [Google Scholar] [CrossRef]
- Liao, F.; Molin, E.; Wee, B.V. Consumer preferences for electric vehicles: A literature review. Transp. Rev. 2017, 37, 252–275. [Google Scholar] [CrossRef]
- Verlegh, P.W.J.; Steenkamp, J.-B.E.M. A review and meta-analysis of country-of-origin research. J. Econ. Psychol. 1999, 20, 521–546. [Google Scholar] [CrossRef]
- Beggs, S.; Cardell, S.; Hausman, J. Assessing the potential demand for electric cars. J. Econom. 1981, 16, 1–19. [Google Scholar] [CrossRef]
- Calfee, J. Estimating the demand for electric automobiles using fully disaggregated probabilistic choice analysis. Transp. Res. B Methodol. 1985, 19, 287–301. [Google Scholar] [CrossRef]
- Bunch, D.S.; Golob, T.F.; Occhiuzzo, G.P. Demand for clean-fuel vehicles in California: A discrete-choice stated preference pilot project. Transp. Res. A Policy Pract. 1993, 27A, 237–253. [Google Scholar] [CrossRef]
- Golob, T.; Kitamura, R.; Bradley, M.; Bunch, D. Predicting the market penetration of electric and clean-fuel vehicles. Sci. Total Environ. 1993, 134, 371–381. [Google Scholar] [CrossRef]
- Brownstone, D.; Bunch, D.S.; Golob, T.F.; Ren, W. A transactions choice model for forecasting demand for alternative-fuel vehicles. Res. Transp. Econ. 1996, 4, 87–129. [Google Scholar] [CrossRef]
- Kurani, K.S.; Turrentine, T.; Sperling, D. Testing electric vehicle demand in hybrid households using a reflexive survey. Transp. Res. D Transp. Environ. 1996, 1, 131–150. [Google Scholar] [CrossRef]
- Chéron, E.; Zins, M. Electric vehicle purchasing intentions: The concern over battery charge duration. Transp. Res. A Policy Pract. 1997, 31, 235–243. [Google Scholar] [CrossRef]
- Tompkins, M.; Bunch, D. Determinants of alternative fuel vehicle choice in the continental United States. Transp. Res. Rec. J. Transp. Res. B 1998, 1641, 130–138. [Google Scholar] [CrossRef]
- Kavalec, C. Vehicle choice in an aging population: Some insights from a stated preference survey for California. Energy J. 1999, 20, 123–128. [Google Scholar] [CrossRef]
- Brownstone, D.; Bunch, D.S.; Train, K. Joint mixed logit models of stated and revealed preferences for alternative-fuel vehicles. Transp. Res. B Methodol. 2000, 34, 315–338. [Google Scholar] [CrossRef]
- Ewing, G.; Sarigöllü, E. Assessing consumer preferences for clean-fuel vehicles: A discrete choice experiment. J. Public Policy Mark. 2000, 19, 106–118. [Google Scholar] [CrossRef]
- Dagsvik, J.K.; Wennemo, T.; Wetterwald, D.G.; Aaberge, R. Potential demand for alternative fuel vehicles. Transp. Res. B Methodol. 2002, 36, 361–384. [Google Scholar] [CrossRef]
- Horne, M.; Jaccard, M.; Tiedemann, K. Improving behavioral realism in hybrid energy-economy models using discrete choice studies of personal transportation decisions. Energy Econ. 2005, 27, 59–77. [Google Scholar] [CrossRef]
- Hess, S.; Train, K.E.; Polak, J.W. On the use of a Modified Latin Hypercube Sampling (MLHS) method in the estimation of a mixed logit model for vehicle choice. Transp. Res. B Methodol. 2006, 40, 147–163. [Google Scholar] [CrossRef]
- Bolduc, D.; Boucher, N.; Alvarez-daziano, R.; Laval, U. Hybrid choice modeling of new technologies for car use in Canada. Transp. Res. Rec. J. Transp. Res. B 2008, 2082, 1–18. [Google Scholar]
- Mau, P.; Eyzaguirre, J.; Jaccard, M.; Collinsdodd, C.; Tiedemann, K. The ‘neighbor effect’: Simulating dynamics in consumer preferences for new vehicle technologies. Ecol. Econ. 2008, 68, 504–516. [Google Scholar] [CrossRef]
- Axsen, J.; Mountain, D.C.; Jaccard, M. Combining stated and revealed choice research to simulate the neighbor effect: The case of hybrid-electric vehicles. Resour. Energy Econ. 2009, 31, 221–238. [Google Scholar] [CrossRef]
- Dagsvik, J.K.; Liu, G. A framework for analyzing rank ordered data with application to automobile demand. Transp. Res. A Policy Pract. 2009, 43, 1–12. [Google Scholar] [CrossRef]
- Caulfield, B.; Farrell, S.; McMahon, B. Examining individuals preferences for hybrid electric and alternatively fuelled vehicles. Transp. Policy 2010, 17, 381–387. [Google Scholar] [CrossRef]
- Kudoh, Y.; Motose, R. Changes of Japanese consumer preference for electric vehicles. World Electr. Veh. J. 2011, 4, 880–889. [Google Scholar] [CrossRef]
- Eggers, F.; Eggers, F. Where have all the flowers gone? Forecasting green trends in the automobile industry with a choice-based conjoint adoption model. Technol. Forecast. Soc. 2011, 78, 51–62. [Google Scholar] [CrossRef]
- Hensher, D.A.; Greene, W.H. Random regret minimization or random utility maximization: An exploratory analysis in the context of automobile fuel choice. J. Adv. Transp. 2011, 47, 667–678. [Google Scholar] [CrossRef]
- Mabit, S.L.; Fosgerau, M. Demand for alternative-fuel vehicles when registration taxes are high. Transp. Res. D Transp. Environ. 2011, 16, 225–231. [Google Scholar] [CrossRef]
- Qian, L.; Soopramanien, D. Heterogeneous consumer preferences for alternative fuel cars in China. Transp. Res. D Transp. Environ. 2011, 16, 607–613. [Google Scholar] [CrossRef]
- Şentürk, I.; Erdem, C.; Şimşek, T.; Kılınç, N. Determinants of vehicle fuel-type preference in developing countries: A case of Turkey. Int. J. Glob. Warm. 2011, 3, 329–338. [Google Scholar] [CrossRef]
- Zhang, T.; Gensler, S.; Garcia, R. A study of the Diffusion of Alternative Fuel Vehicles: An Agent-Based Modeling Approach. J. Prod. Innov. Manag. 2011, 28, 152–168. [Google Scholar] [CrossRef]
- Zhang, Y.; Yu, Y.; Zou, B. Analyzing public awareness and acceptance of alternative fuel vehicles in China: The case of EV. Energy Policy 2011, 39, 7015–7024. [Google Scholar] [CrossRef]
- Hess, S.; Fowler, M.; Adler, T. A joint model for vehicle type and fuel type. Transportation 2012, 39, 593–625. [Google Scholar] [CrossRef]
- Lebeau, K.; Mierlo, J.V.; Lebeau, P.; Mairesse, O.; Macharis, C. The market potential for plug-in hybrid and battery electric vehicles in Flanders: A choice-based conjoint analysis. Transp. Res. D Transp. Environ. 2012, 17, 592–597. [Google Scholar] [CrossRef]
- Alvarez-Daziano, R.; Bolduc, D. Incorporating pro-environmental preferences toward green automobile technologies through a Bayesian Hybrid Choice Model. Transportmetrica A 2013, 9, 74–106. [Google Scholar] [CrossRef]
- Alvarez-Daziano, R.; Chiew, E. On the effect of the prior of Bayes estimators of the willingness to pay for electric-vehicle driving range. Transp. Res. D Transp. Environ. 2013, 21, 7–13. [Google Scholar] [CrossRef]
- Axsen, J.; Orlebar, C.; Skippon, S. Social influence and consumer preference formation for pro-environmental technology: The case of a U.K. workplace electric-vehicle study. Ecol. Econ. 2013, 95, 96–107. [Google Scholar] [CrossRef]
- Beck, M.J.; Rose, J.M.; Hensher, D.A. Environmental attitudes and emissions charging: An example of policy implications for vehicle choice. Transp. Res. A Policy Pract. 2013, 50, 171–182. [Google Scholar] [CrossRef]
- Chorus, C.G.; Koetse, M.J.; Hoen, A. Consumer preferences for alternative fuel vehicles: Comparing a utility maximization and a regret minimization model. Energy Policy 2013, 61, 901–908. [Google Scholar] [CrossRef]
- Jensen, A.F.; Cherchi, E.; Mabit, S.L. On the stability of preferences and attitudes before and after experiencing an electric vehicle. Transp. Res. D Transp. Environ. 2013, 25, 24–32. [Google Scholar] [CrossRef]
- Glerum, A.; Stankovikj, L.; Thémans, M.; Bierlaire, M. Forecasting the demand for electric vehicles: Accounting for attitudes and perceptions. Transp. Sci. 2014, 48, 483–499. [Google Scholar] [CrossRef]
- Parsons, G.R.; Hidrue, M.K.; Kempton, W.; Gardner, M.P. Willingness to pay for vehicle-to-grid (V2G) electric vehicles and their contract terms. Energy Econ. 2014, 42, 313–324. [Google Scholar] [CrossRef]
- Hevelston, J.; Liu, Y.; Mcdonnell, E.; Fuchs, E.; Klampfl, E.; Michalek, J.J. Will subsidies drive electric vehicle adoption? Measuring consumer preferences in the U.S. and China. Transp. Res. A Policy Pract. 2015, 73, 96–112. [Google Scholar] [CrossRef]
- Lieven, T. Policy measures to promote electric mobility—A global perspective. Transp. Res. A Policy Pract. 2015, 82, 78–93. [Google Scholar] [CrossRef]
- Qian, L.; Soopramanien, D. Incorporating heterogeneity to forecast the demand of new products in emerging markets: Green cars in China. Technol. Forecast. Soc. 2015, 91, 33–46. [Google Scholar] [CrossRef]
- Valeri, E.; Danielis, R. Simulating the market penetration of cars with alternative fuelpowertrain technologies in Italy. Transp. Policy 2015, 37, 44–56. [Google Scholar] [CrossRef]
- Axsen, J.; Goldberg, S.; Bailey, J. How might potential future plug-in electric vehicle buyers differ from current ‘Pioneer’ owners? Transp. Res. D Transp. Environ. 2016, 47, 357–370. [Google Scholar] [CrossRef]
- Bahamonde-birke, F.J.; Hanappi, T. The potential of electromobility in Austria: Evidence from hybrid choice models under the presence of unreported information. Transp. Res. A Policy Pract. 2016, 83, 30–41. [Google Scholar] [CrossRef]
- Hackbarth, A.; Madlener, R. Willingness-to-pay for alternative fuel vehicle characteristics: A stated choice study for Germany. Transp. Res. A Policy Pract. 2016, 85, 89–111. [Google Scholar] [CrossRef]
- Krause, R.M.; Lane, B.W.; Carley, S.; Graham, J.D. Assessing demand by urban consumers for plug-in electric vehicles under future cost and technological scenarios. Int. J. Sustain. Transp. 2016, 10, 742–751. [Google Scholar] [CrossRef]
- Rudolph, C. How may incentives for electric cars affect purchase decisions? Transp. Policy 2016, 52, 113–120. [Google Scholar] [CrossRef]
- Beck, M.J.; Rose, J.M.; Greaves, S.P. I can’t believe your attitude: A joint estimation of best worst attitudes and electric vehicle choice. Transportation 2017, 44, 753–772. [Google Scholar] [CrossRef]
- Cherchi, E. A stated choice experiment to measure the effect of informational and normative conformity in the preference for electric vehicles. Transp. Res. A Policy Pract. 2017, 100, 88–104. [Google Scholar] [CrossRef]
- Cirillo, C.; Liu, Y.; Maness, M. A time-dependent stated preference approach to measuring vehicle type preferences and market elasticity of conventional and green vehicles. Transp. Res. A Policy Pract. 2017, 100, 294–310. [Google Scholar] [CrossRef]
- Dimatulac, T.; Maoh, H. The spatial distribution of hybrid electric vehicles in a sprawled mid-size Canadian city: Evidence from Windsor, Canada. J. Transp. Geogr. 2017, 60, 59–67. [Google Scholar] [CrossRef]
- Higgins, C.D.; Mohamed, M.; Ferguson, M.R. Size matters: How vehicle body type affects consumer preferences for electric vehicles. Transp. Res. A Policy Pract. 2017, 100, 182–201. [Google Scholar] [CrossRef]
- Jensen, A.F.; Cherchi, E.; Mabit, S.L.; Ortúzar, J.D.D. Predicting the potential market for electric vehicles. Transp. Sci. 2017, 51, 427–440. [Google Scholar] [CrossRef]
- Liu, Y.; Cirillo, C. A generalized dynamic discrete choice model for green vehicle adoption. Transp. Res. Procedia 2017, 23, 868–886. [Google Scholar] [CrossRef]
- Ma, S.; Gao, P.; Tan, H. The impact of subsidies and charging facilities on demand for electric vehicles in China. Environ. Urban 2017, 8, 230–242. [Google Scholar] [CrossRef]
- Smith, B.; Olaru, D.; Jabeen, F.; Greaves, S. Electric vehicles adoption: Environmental enthusiast bias in discrete choice models. Transp. Res. D Transp. Environ. 2017, 51, 290–303. [Google Scholar] [CrossRef]
- Byun, H.; Shin, J.; Lee, C.-Y. Using a discrete choice experiment to predict the penetration possibility of environmentally friendly vehicles. Energy 2018, 144, 312–321. [Google Scholar] [CrossRef]
- Choi, H.; Shin, J.; Woo, J. Effect of electricity generation mix on battery electric vehicle adoption and its environmental impact. Energy Policy 2018, 121, 13–24. [Google Scholar] [CrossRef]
- Costa, E.; Montemurro, D.; Giuliani, D. Consumers’ willingness to pay for green cars: A discrete choice analysis in Italy. In Environment, Development and Sustainability; Springer: Dordrecht, The Netherlands, 2018; pp. 1–18. [Google Scholar]
- Ferguson, M.; Mohamed, M.; Higgins, C.D.; Abotalebi, E.; Kanaroglou, P. How open are Canadian households to electric vehicles? A national latent class choice analysis with willingness-to-pay and metropolitan characterization. Transp. Res. D Transp. Environ. 2018, 58, 208–224. [Google Scholar] [CrossRef]
- Hahn, J.-S.; Lee, J.-H.; Choi, K. Heterogeneous preferences of green vehicles by vehicle size: Analysis of Seoul case. Int. J. Sustain. Transp. 2018, 1–11. [Google Scholar] [CrossRef]
- Liao, F.; Molin, E.; Timmermans, H.; Wee, B.V. The impact of business models on electric vehicle adoption: A latent transition analysis approach. Transp. Res. A Policy Pract. 2018, 116, 531–546. [Google Scholar] [CrossRef]
- Liu, Y.; Cirillo, C. Modeling green vehicle adoption: An integrated approach for policy evaluation. Int. J. Sustain. Transp. 2018, 1–11. [Google Scholar] [CrossRef]
- Soto, J.J.; Cantillo, V.; Arellana, J. Incentivizing alternative fuel vehicles: The influence of transport policies, attitudes and perceptions. Transportation 2018, 1–33. [Google Scholar] [CrossRef]
- Wolbertus, R.; Kroesen, M.; Hoed, R.V.D.; Chorus, C.G. Policy effects on charging behaviour of electric vehicle owners and on purchase intentions of prospective owners: Natural and stated choice experiments. Transp. Res. D Transp. Environ. 2018, 62, 283–297. [Google Scholar] [CrossRef]
- Laroche, M.; Bergeron, J.; Barbaro-Forleo, G. Targeting consumers who are willing to pay more for environmentally friendly products. J. Consum. Mark. 2001, 18, 503–520. [Google Scholar] [CrossRef]
- Straughan, R.D.; Roberts, J.A. Environmental segmentation alternatives: A look at green consumer behavior in the new millennium. J. Consum. Mark. 2011, 16, 558–575. [Google Scholar] [CrossRef]
- Kaushik, A.K.; Rahman, Z. Perspectives and dimensions of consumer innovativeness: A literature review and future agenda. J. Int. Consum. Mark. 2014, 26, 239–263. [Google Scholar] [CrossRef]
- Johnson, R.; Orme, B. Sample Size Issues for Conjoint Analysis. Getting Started with Conjoint Analysis: Strategies for Product Design and Pricing Research; Research Publishers LLC: Madison, WI, USA, 2010; pp. 57–66. [Google Scholar]
- Laukkanen, T.; Laukkanen, P. Innovation resistance among mature consumers. J. Consum. Mark. 2007, 24, 419–427. [Google Scholar] [CrossRef]
- Lambert-Pandraud, R.; Gilles, L. Why do older consumers buy older brands? The role of attachment and declining innovativeness. J. Mark. 2010, 74, 104–121. [Google Scholar] [CrossRef]
- Leventhal, R.C. Aging consumers and their effects on the marketplace. J. Consum. Mark. 1997, 14, 276–281. [Google Scholar] [CrossRef]
- Tellis, G.J.; Yin, E.; Bell, S. Global consumer innovativeness: Cross-country differences and demographic commonalities. J. Int. Mark. 2009, 17, 1–22. [Google Scholar] [CrossRef]
- Lim, H.; Park, J.-S. The effects of national culture and cosmopolitanism on consumers’ adoption of innovation: A cross-cultural comparison. J. Int. Consum. Mark. 2013, 25, 16–28. [Google Scholar] [CrossRef]
- Kim, W.; Benedetto, C.A.D.; Lancioni, R.A. The effects of country and gender differences on consumer innovativeness and decision processes in a highly globalized high-tech product market. Asia Pac. J. Mark. Logist. 2011, 23, 714–744. [Google Scholar] [CrossRef]
- Pinto, D.C.; Herter, M.M.; Rossi, P.; Borges, A. Going green for self or for others? Gender and identity salience effects on sustainable consumption. Int. J. Consum. Stud. 2014, 38, 540–549. [Google Scholar] [CrossRef]
- Im, S.; Bayus, B.L.; Mason, C.H. An empirical study of innate consumer innovativeness, personal characteristics, and new-product adoption behavior. J. Acad. Mark. Sci. 2003, 31, 61–73. [Google Scholar] [CrossRef]
- Lennon, S.J.; Johnson, K.K.P.; Jolly, L.D.; Jasper, C.R. A Longitudinal Look at Rural Consumer Adoption of Online Shopping. Psychol. Mark. 2007, 24, 375–401. [Google Scholar] [CrossRef]
- Steenkamp, J.; Gielens, K. Consumer and market drivers of the trial probability of new consumer packaged goods. J. Consum. Res. 2003, 30, 368–384. [Google Scholar] [CrossRef]
- Meyer, A. Does education increase pro-environmental behavior? Evidence from Europe. Ecol. Econ. 2015, 116, 108–121. [Google Scholar] [CrossRef]
- IEA. Hybrid and electric vehicles: The electric drive delivers. In Implementing Agreement for Co-operation on Hybrid and Electric Vehicle Technologies and Programmes; International Energy Agency: Paris, France, 2015. [Google Scholar]
- Oliveira, G.D.; Dias, L.C. Which criteria matter when selecting a conventional or electric vehicle? In Proceedings of the Energy for Sustainability 2015—Sustainable Cities: Designing for People and the Planet, Coimbra, Portugal, 14–15 May 2015; pp. 1–10. [Google Scholar]
- INE. Censos 2011: Definitive Results—Portugal; National Statistics Institute Report; INE: Lisbon, Portugal, 2012.
- Huijts, N.M.A.; Molin, E.J.E.; Steg, L. Psychological factors influencing sustainable energy technology acceptance: A review-based comprehensive framework. Renew. Sustain. Energy Rev. 2012, 16, 525–531. [Google Scholar] [CrossRef]
- Keith, D.R. Essays on the Dynamics of Alternative Fuel Vehicle Adoption: Insights from the Market for Hybrid- Electric Vehicles in the United States. Ph.D. Thesis, Engineering Systems Division, Massachusetts Institute of Technology, Cambridge, MA, USA, 2012. [Google Scholar]
- ACEA. Overview of Purchase and Tax Incentives for Electric Vehicles in the EU in 2015; European Automobile Manufacturers Association: Brussels, Belgium, 2015. [Google Scholar]


| Study | Year | Country | Goal | Scope | Estimation procedure | Sample |
|---|---|---|---|---|---|---|
| Beggs et al. [35] | 1981 | USA | To assess the potential demand for BEVs | BEVs | Ordered logit model | 197 Households |
| Calfee [36] | 1985 | USA | To estimate the potential demand for BEVs | BEVs | Disaggregated Multinomial Logit (MNL) models | 51 Automobile owners |
| Bunch et al. [37] | 1993 | USA | To determine how demand for clean-fuel vehicles is likely to vary as a function of differential attributes | AFVs | Nested MNL models Binomial logit models | 717 Households |
| Golob et al. [38] | 1993 | USA | To predict the effect on personal vehicle purchases of differential attributes of clean-fuel vehicles | AFVs | MNL model | 3000 Households |
| Brownstone et al. [39] | 1996 | USA | To construct a vehicle choice model for producing annual forecasts of new and used vehicle demand | BEVs | MNL model | 4747 Individuals |
| Kurani et al. [40] | 1996 | USA | To examine household consideration of a BEV | BEVs | Statistical analysis | 454 Multi-car households |
| Chéron and Zins [41] | 1997 | Canada | To determine which are the most determinant factors blocking the purchase of BEVs | BEVs | Statistical analysis | 37 Car users |
| Ewing and Sarigöllü [16] | 1998 | Canada | To examine the factors likely to influence the demand for lower emission and zero emission vehicles | AFVs | MNL model | 811 Suburban driver commuters |
| Tompkins and Bunch [42] | 1998 | USA | To perform an independent survey of consumers in US concerning their vehicle preferences and to compare to the preferences of California households | AFVs | Restricted conditional MNL model | 1149 Individuals |
| Kavalec [43] | 1999 | USA | To investigate the potential effects that an aging “baby boomer” generation will have on gasoline use through their vehicle choice decisions | AFVs | "Mixed" logit error-components model | 4552 Households |
| Brownstone et al. [44] | 2000 | USA | To compare MNL with mixed logit models for data on California households’ revealed and stated preferences for vehicles | AFVs | Mixed logit models MNL model | 7387 Households |
| Ewing and Sarigöllü [45] | 2000 | Canada | To explore if government regulation can influence consumer preferences for clean-fuel vehicles | AFVs | MNL model | 881 Commuters who drive regularly |
| Dagsvik et al. [46] | 2002 | Norway | To analyze the potential demand for AFVs | AFVs | Ranked logit model | 642 Individuals |
| Horne et al. [47] | 2005 | Canada | To analyze how people choose between technologies, and incorporate it into energy-economy models | AFVs | Hybrid model | 866 Individuals |
| Hess et al. [48] | 2006 | USA | To apply a modified Latin Hypercube Sampling approach for use in the estimation of Mixed MNL models | AFVs | Mixed MNL model | 500 Individuals |
| Potoglou and Kanaroglou [5] | 2007 | Canada | To examine the factors and incentives that are most likely to influence households’ choice for cleaner vehicles | AFVs | Nested logit model | 482 Potential vehicle Buyers |
| Ahn et al. [3] | 2008 | South Korea | To analyze how adding AFVs to the market will affect patterns in demand for passenger cars | AFVs | Multiple discrete continuous choice model | 280 Households who own passenger cars |
| Bolduc et al. [49] | 2008 | Canada | To study the application of Hybrid CM about personal choices of vehicles with technological innovations | AFVs | Hybrid choice models | 866 Consumers |
| Mau et al. [50] | 2008 | Canada | To elicit consumer preferences for HEVs and FCVs with manipulation of the respondents’ decision environment | HEVs and FCVs | CIM SMNL model | 916 Individuals (HEVs study) 1019 Individuals (FCVs study) |
| Axsen et al. [51] | 2009 | Canada and USA | To estimate preference dynamics associated with the adoption of HEVs to improve the behavioral realism of CIMS | HEVs | CIMS MNL model | 523 Vehicle owners (Canada) 408 Vehicle owners (USA) |
| Dagsvik and Liu [52] | 2009 | China | To specify and estimate models of household demand for conventional gasoline cars and AFVs in Shanghai | AFVs | Generalized Extreme Value random utility model | 100 Households |
| Caulfield et al. [53] | 2010 | Ireland | To examine individual motivations when purchasing vehicles | AFVs | MNL model Nested Logit model | 168 Customers of a car company |
| Kudoh and Motose [54] | 2010 | Japan | To understand consumer preferences for BEVs to define their specifications or policies to expand these vehicles | BEVs | Conditional Logit model | 1st wave: 6935 Individuals 2nd wave: 9657 Individuals |
| Eggers and Eggers [55] | 2011 | Germany | To apply choice-based conjoint to analyse the future acceptance of AFVs | BEVs | Choice-Based Conjoint/Hierarchical Bayes | 242 Individual respondents |
| Hensher and Greene [56] | 2011 | Australia | To apply the random regret minimization model framework to model choice among durable goods | AFVs | MNL | 3172 Households who had purchased a vehicle in the last 2 years |
| Hidrue et al. [6] | 2011 | USA | To analyze to which extent experience affects preferences and the impact of attitudes on the choice between BEVs and conventional vehicles | BEVs | MNL model Latent class model | 3029 Potential car buyers |
| Mabit and Fosgerau [57] | 2011 | Denmark | To investigate the potential future of AFVs in Denmark | AFVs | Mixed logit model | 2146 New car buyers |
| Qian and Soopramanien [58] | 2011 | China | To model consumer preferences for alternative fuel cars and conventional fueled cars | AFVs | MNL model Nested Logit model | 527 Households |
| Senturk et al. [59] | 2011 | Turkey | To identify the factors that affect the preferences for vehicle fuel types in Turkey | AFVs | MNL model | 1983 Participants |
| Zhang, Gensler, et al. [60] | 2011 | USA | To investigate which factors can speed the diffusion of AFVs | AFVs | Choice-based conjoint/Hierarchical Bayes | 7595 Individuals |
| Zhang, Yu, et al. [61] | 2011 | China | To identify the factors that impact consumer preferences for AFVs | BEVs | Binary logistics regression models | 229 Respondents from driving schools |
| Achtnicht et al. [20] | 2012 | Germany | To study the impact of fuel availability on demand for AFVs | AFVs | Logit model | 600 Individuals |
| Hess et al. [62] | 2012 | USA | To investigate the prevalence of correlation along two dimensions of choice, vehicle type and fuel type | AFVs | Cross-nested logit model | 500 Individuals |
| Lebeau et al. [63] | 2012 | Belgium | To examine the market potential of PHEVs and BEVs in Flanders | BEVs and PHEVs | Choice-based conjoint/Hierarchical Bayes | 1197 Individuals |
| Ziegler [21] | 2012 | Germany | To examine the preferences for alternative energy sources or propulsion technologies in vehicles (mainly BEVs) | BEVs | Multinomial probit models | 598 Car buyers |
| Alvarez-Daziano and Bolduc [64] | 2013 | Canada | To implement a Bayesian approach to a hybrid choice model in order to analyse choices of Canadian consumers for AFVs | AFVs | Bayesian hybrid choice model | 866 individuals (same sample as Horne et al. 2005) |
| Alvarez-Daziano and Chiew [65] | 2013 | USA | To study the relevance of the prior in a discrete choice model through the use of Bayes’ estimator | BEVs | Bayesian discrete choice model | 500 Individuals who were intending to purchase a new car within 3 years |
| Axsen et al. [66] | 2013 | United Kingdom | To investigate the roles of social influence in the formation of consumer perceptions and preferences for pro-environmental technologies | BEVs | MNL model | 500 Individuals |
| Beck et al. [67] | 2013 | Australia | To identify how environmental attitudes can influence how consumers behave under an emissions charge policy | AFVs | Latent class model | 650 Recent car buyers |
| Chorus et al. [68] | 2013 | Netherlands | To compare two discrete choice methodologies, utility maximization and regret minimization model | AFVs | Random regret minimization-based model Random utility maximization model | 616 Company car leasers |
| Hackbarth and Madlener [23] | 2013 | Germany | To analyze the potential demand for AFVs | AFVs | Mixed logit model | 711 Potential buyers of a new car in a short-term |
| Ito et al. [22] | 2013 | Japan | To investigate potential demand for infrastructure investment for AFVs | AFVs | Nested MNL model | 1531 Individuals |
| Jensen et al. [69] | 2013 | Denmark | To analyze to which extent experience affects preferences and the impact of attitudes on the choice between BEVs and conventional vehicles | BEVs | Mixed logit model | 369 Households who had bought a car within the last 5 years or at least intended to buy one |
| Glerum et al. [70] | 2014 | Switzerland | To present an integrated methodology to forecast the demand for BEVs and to enhance the forecasting power of a model developed on stated preference data | BEVs | Hybrid choice models | 593 Recent buyers of a new car (in the last 3 years) |
| Hoen and Koetse [18] | 2014 | Netherlands | To get insight into preferences of Dutch private car owners for AFVs and their characteristics | AFVs | MNL model Mixed logit model | 1802 Households (market for privately owned cars) |
| Parsons et al. [71] | 2014 | USA | To analyze the potential demand for vehicle-to-grid vehicles | BEVs | MNL model Latent Class model | 3029 Potential car buyers (same as Hidrue et al. (2011)) |
| Tanaka et al. [24] | 2014 | USA and Japan | To estimate and compare consumers’ willingness to pay for BEVs and PHEVs in US and Japan | AFVs | Mixed logit model | 4202 Consumers (USA) 2000 Consumers (Japan) |
| Axsen et al. [17] | 2015 | Canada | To characterize heterogeneity in preferences and motivations regarding PHEVs | PHEVs and BEVs | Latent class model | 1754 New vehicle buyinghouseholds |
| Hevelston et al. [72] | 2015 | USA and China | To identify and compare consumer preferences for BEVs in China and US and to analyze the influence of subsidies in those preferences | BEVs | MNL model Mixed logit model | 312 Individuals (US) 572 Individuals (China) |
| Lieven [73] | 2015 | 20 countries (5 continents) | To analyze the effect of incentives that influence car buyers voluntary behaviour on the adoption of BEVs | BEVs | Choice-Based Conjoint/Hierarchical Bayes | 8147 Individual respondents in total (20 countries) |
| Qian and Soopramanien [74] | 2015 | China | To forecast the demand of green cars in emerging markets accounting for preference heterogeneity and market dynamics | HEVs and BEVs | Nested logit model | 527 Households |
| Shin et al. [19] | 2015 | South Korea | To assess consumer preferences for various technology options and vehicle fuel types, and to evaluate the marginal willingness-to-pay for various smart vehicle features | AFVs | Multiple Discrete Continuous Probit model Multinomial Probit model | 675 Individuals |
| Valeri and Danielis [75] | 2015 | Italy | To evaluate the market penetration of cars with AFV technologies in Italy under various scenarios | AFVs | Mixed Error Component Logit model | 121 Respondents |
| Axsen et al. [76] | 2016 | Canada | To compare the characteristics, preferences, and motivations of pioneers and potential early mainstream buyers | PHEVs | MNL Latent class model | 1754 conventional new vehicle buyers 94 Plug EV owners |
| Bahamonde-birke and Hanappi [77] | 2016 | Austria | To analyze the acceptance of electric vehicles by the Austrian population | BEVs | Hybrid Discrete Choice model | 1449 Individuals |
| Braz da Silva and Moura [29] | 2016 | Portugal | To estimate the fleet wide energy consumption and corresponding CO2 emissions up to 2030 | BEVs and PHEVs | Nested Logit model | 348 Respondents |
| Hackbarth and Madlener [78] | 2016 | Germany | To study the heterogeneity of car buyers’ preferences | AFVs | MNL model Latent Class model | 711 (same as Hackbarth and Madlener (2013)) |
| Krause et al. [79] | 2016 | USA | To assess how consumer demand might change with various breakthroughs in PHEVs technology | PHEVs | MNL model | 961 Potential new vehicle purchasers |
| Rudolph [80] | 2016 | Germany | To investigate the impact of five different incentives for buyers of zero emission vehicles | BEVs | Mixed Logit model | 875 Respondents |
| Beck et al. [81] | 2017 | Australia | To examine attributes in a best–worst scaling framework | BEVs, PHEVs and HEVs | Rank-ordered logit model | 204 Respondents |
| Cherchi [82] | 2017 | Denmark | To measure the effect of both informational and normative conformity in the preference for EVs versus ICEVs | BEVs | Mixed logit model | 2363 respondents |
| Cirillo et al. [83] | 2017 | USA | To analyze household future preferences for gasoline, HEVs and BEVs in a dynamic marketplace | BEVs and HEVs | Mixed MNL model | 456 Respondents |
| Dimatulac and Maoh [84] | 2017 | Canada | To study the determinants that led to the observed spatial distribution of HEVs vehicles | HEVs | MNL model | 348 HEVs owners |
| Higgins et al. [85] | 2017 | Canada | To examine how preferences for HEVs, PHEVs and BEVs are shaped by vehicle body size or type | HEVs, PHEVs and BEVs | Multivariate analysis of variance and probit model | 15,392 households |
| Jensen et al. [86] | 2017 | Denmark | To discuss the prediction of EVs market shares and to suggest a method combining a diffusion model with advanced discrete choice models | BEVs | Mixed Logit model | 196 Respondents |
| Liu and Cirillo [87] | 2017 | USA | To propose a generalized dynamic discrete choice approach that models purchase behavior and forecasts future preferences | EVs | MNL model | 456 Maryland households |
| Ma et al. [88] | 2017 | China | To investigate the potential impact of purchase subsidies and charging facilities on demand for EVs | BEVs | MNL model | 465 Respondents |
| Sheldon et al. [26] | 2017 | USA | To estimate demand for PHEVs relative to BEVs and to explore heterogeneity in demand for these vehicles | BEVs and PHEVs | Mixed logit model Latent class model | 1261 New car buyers |
| Smith et al. [89] | 2017 | Australia | To investigate consumer preferences and attitudes towards EVs | BEVs | Nested logit model | 440 households |
| Byun et al. [90] | 2018 | South Korea | To analyze consumer preferences for vehicles and predict the dynamic market share of environmentally friendly vehicles | BEVs and FCVs | Mixed Logit model | 615 Adult respondents |
| Choi et al. [91] | 2018 | South Korea | To analyze how the consumer adoption of BEVs and their environmental impact can be changed by improving the environmental performance of the electricity generation mix | BEVs | Mixed Logit model | 1002 Respondents |
| Costa et al. [92] | 2018 | Italy | To investigate consumers’ willingness to pay a premium price for lower CO2 emitting cars | AFVs | Conditional MNL model | 278 Potential car buyers |
| Ferguson et al. [93] | 2018 | Canada | To assess attitudes and preferences towards consumer electric vehicles | HEVs, PHEVs and BEVs | Latent class choice model | 17,953 households |
| Hahn et al. [94] | 2018 | South Korea | To understand consumers’ preferences for green vehicles | HEVs, PHEVs and BEVs | Mixed model and nested logit model | 4548 consumers |
| Huang and Qian [25] | 2018 | China | To investigate consumer preferences for EVs in lower tier cities of China | BEVs and PHEVs | Nested Logit model | 348 Respondents |
| Liao et al. [95] | 2018 | Netherlands | To assess the impact of business models, in particular battery and vehicle leasing, on EVs adoption | BEVs and PHEVs | Latent Class Choice model | 1003 Respondents |
| Liu and Cirillo [96] | 2018 | USA | To forecast households’ future preferences on vehicle type, quantity and use, and to estimate greenhouse gas emissions | EVs | Multinomial probit model | 456 Maryland households |
| Soto et al. [97] | 2018 | Canada | To evaluate the influence of policies, attitudes and perceptions when incentivizing AFVs | AFVs | Hybrid choice models | 1065 Respondents |
| Wolbertus et al. [98] | 2018 | Netherlands | To estimate the effect of policy measures aimed at EV adoption and charging behavior | HEVs, PHEVs and BEVs | Mixed logit model | 149 respondents |
| Study | Demographic Variables Collected | Demographic Data Collected to Analyze | |||||||||
|---|---|---|---|---|---|---|---|---|---|---|---|
| Age | Gender | Income | Education | Family Size | No. Vehicles/Family | Driving Habits | Other | Representativity | Vehicle Type Interaction | Vehicle Attributes Interaction | |
| Beggs et al. [35] | ✓ | ✓ | ✓ | ✓ | ✓ | ✓ | |||||
| Bunch et al. [37] | ✓ | ✓ | ✓ | ✓ | ✓ | ✓ | |||||
| Golob et al. [38] | ✓ | ✓ | ✓ | home ownership status, no. of drivers | ✓ | ||||||
| Brownstone et al. [39] | ✓ | ✓ | ✓ | ✓ | |||||||
| Ewing and Sarigöllü [16] | ✓ | ✓ | ✓ | ✓ | ✓ | home language, ownership status | |||||
| Kurani et al. [40] | NM | ||||||||||
| Chéron and Zins [41] | NM | ||||||||||
| Tompkins and Bunch [42] | ✓ | ✓ | ✓ | ✓ | ✓ | ✓ | ✓ | vehicle body type, vehicle size | |||
| Kavalec [43] | ✓ | ✓ | ✓ | ✓ | |||||||
| Brownstone et al. [44] | ✓ | ✓ | ✓ | ✓ | ✓ | ||||||
| Ewing and Sarigöllü [45] | ✓ | ✓ | ✓ | ||||||||
| Dagsvik et al. [46] | ✓ | ✓ | ✓ | price, top speed, range, fuel consumption | |||||||
| Horne et al. [47] | ✓ | ✓ | ✓ | ✓ | region, vehicle type, commuting habits | ✓ | |||||
| Potoglou and Kanaroglou [5] | ✓ | ✓ | ✓ | ✓ | ✓ | ✓ | acceleration, price | ||||
| Bolduc et al. [49] | ✓ | ✓ | ✓ | ✓ | mode of transportation | ||||||
| Mau et al. [50] | ✓ | ✓ | ✓ | ✓ | |||||||
| Axsen et al. [51] | ✓ | ✓ | ✓ | ✓ | house location | ✓ | |||||
| Dagsvik and Liu [52] | ✓ | ✓ | ✓ | ✓ | |||||||
| Caulfield et al. [53] | ✓ | ✓ | ✓ | ✓ | ✓ | ✓ | |||||
| Kudoh and Motose [54] | ✓ | ✓ | ✓ | ||||||||
| Eggers and Eggers [55] | ✓ | ✓ | current car | ✓ | |||||||
| Hensher and Greene [56] | ✓ | ✓ | ✓ | price, fuel consumption, engine capacity, seating capacity | |||||||
| Hidrue et al. [6] | ✓ | ✓ | ✓ | ✓ | ✓ | ✓ | type of residence | ✓ | ✓ | ||
| Mabit and Fosgerau [57] | ✓ | ✓ | ✓ | ✓ | ✓ | ✓ | acceleration, range, price | ||||
| Qian and Soopramanien [58] | ✓ | ✓ | ✓ | ✓ | ✓ | average distance from home to workplace, no. of working members | ✓ | ||||
| Senturk et al. [59] | ✓ | ✓ | ✓ | ✓ | ✓ | ✓ | ✓ | ||||
| Zhang, Yu, et al. [61] | ✓ | ✓ | ✓ | ✓ | ✓ | ✓ | no. family members with driver license | ✓ | |||
| Achtnicht et al. [20] | ✓ | ✓ | ✓ | ✓ | ✓ | ||||||
| Hess et al. [48] | ✓ | ✓ | ✓ | house location, no. of workers | ✓ | ||||||
| Lebeau et al. [63] | ✓ | ✓ | ✓ | region | ✓ | ||||||
| Ziegler [21] | ✓ | ✓ | ✓ | ✓ | ✓ | ✓ | habitation location | ✓ | |||
| Alvarez-Daziano and Bolduc [64] | ✓ | ✓ | ✓ | ✓ | mode of transportation to commute | ✓ | |||||
| Axsen et al. [66] | ✓ | ✓ | ✓ | ✓ | |||||||
| Beck et al. [67] | ✓ | ✓ | ✓ | ✓ | ✓ | employment status, no. of hours worked, driver’s license years | |||||
| Hackbarth and Madlener [23] | ✓ | ✓ | ✓ | ✓ | home ownership status | ✓ | ✓ | ||||
| Ito et al. [22] | ✓ | ✓ | ✓ | ✓ | ✓ | vehicle size | |||||
| Jensen et al. [69] | ✓ | ✓ | ✓ | ✓ | |||||||
| Glerum et al. [70] | ✓ | ✓ | ✓ | language | ✓ | ||||||
| Hoen and Koetse [18] | ✓ | ✓ | ✓ | ✓ | ✓ | possibility of home, current vehicle type | ✓ | price | |||
| Parsons et al. [71] | ✓ | ✓ | ✓ | ✓ | ✓ | ||||||
| Tanaka et al. [24] | ✓ | ✓ | ✓ | ✓ | marital status, house dwelling, AFVs interest | ✓ | ✓ | ||||
| Axsen et al. [17] | ✓ | ✓ | ✓ | ✓ | residence type, PHEVs familiarity | ✓ | |||||
| Hevelston et al. [72] | ✓ | ✓ | ✓ | ✓ | ✓ | ✓ | marital status, access to vehicle charging | ✓ | |||
| Lieven [73] | ✓ | ✓ | ✓ | ✓ | range | ||||||
| Qian and Soopramanien [74] | ✓ | ✓ | ✓ | ✓ | ✓ | distance home to work, no. of working members | ✓ | ✓ | |||
| Shin et al. [19] | ✓ | ✓ | ✓ | ✓ | ✓ | dwelling size | ✓ | ||||
| Valeri and Danielis [75] | ✓ | ✓ | ✓ | ✓ | price, acceleration, range, annual operating cost | ||||||
| Axsen et al. [76] | ✓ | ✓ | ✓ | ✓ | |||||||
| Bahamonde-birke and Hanappi [77] | ✓ | ✓ | ✓ | marital status | ✓ | engine size | |||||
| Braz da Silva and Moura [29] | ✓ | ✓ | ✓ | ✓ | ✓ | ✓ | region and employment status | ✓ | |||
| Hackbarth and Madlener [78] | ✓ | ✓ | ✓ | ✓ | ✓ | ✓ | ✓ | ✓ | |||
| Krause et al. [79] | ✓ | ✓ | ✓ | Race | ✓ | ✓ | |||||
| Rudolph [80] | ✓ | ✓ | ✓ | ✓ | type of employment | ✓ | |||||
| Beck et al. [81] | ✓ | ✓ | ✓ | ✓ | ✓ | ✓ | |||||
| Cherchi [82] | ✓ | ✓ | ✓ | ✓ | ✓ | ✓ | Job | charging time, fuel/electricity cost | |||
| Cirillo et al. [83] | ✓ | ✓ | ✓ | ✓ | work status, home type | ✓ | ✓ | ||||
| Dimatulac and Maoh [84] | ✓ | ✓ | ✓ | type of occupation | ✓ | ||||||
| Higgins et al. [85] | ✓ | ✓ | ✓ | ✓ | ✓ | language, marital status, dwelling type, dwelling tenure | ✓ | vehicle size, vehicle body | |||
| Jensen et al. [86] | ✓ | ✓ | ✓ | ✓ | ✓ | ✓ | no. children | ✓ | |||
| Liu and Cirillo [87] | ✓ | ✓ | ✓ | ✓ | ✓ | ✓ | |||||
| Ma et al. [88] | ✓ | ✓ | ✓ | ✓ | region | ✓ | ✓ | ||||
| Sheldon et al. [26] | ✓ | ✓ | ✓ | ✓ | ✓ | ✓ | |||||
| Smith et al. [89] | ✓ | ✓ | ✓ | ✓ | ✓ | ||||||
| Byun et al. [90] | ✓ | ||||||||||
| Choi et al. [91] | ✓ | ✓ | ✓ | ✓ | |||||||
| Costa et al. [92] | ✓ | ✓ | ✓ | ✓ | |||||||
| Ferguson et al. [93] | ✓ | ✓ | ✓ | ✓ | ✓ | marital status, dwelling type, dwelling tenure | ✓ | ✓ | |||
| Hahn et al. [94] | ✓ | ✓ | ✓ | ✓ | driving experience, housing type, occupation | ✓ | |||||
| Huang and Qian [25] | ✓ | ✓ | ✓ | ✓ | ✓ | ✓ | no. children, car use experience | ✓ | |||
| Liao et al. [95] | ✓ | ✓ | ✓ | ✓ | ✓ | ✓ | ✓ | ||||
| Liu and Cirillo [96] | ✓ | ✓ | ✓ | ✓ | ✓ | ||||||
| Soto et al. [97] | ✓ | ✓ | ✓ | ✓ | ✓ | ✓ | |||||
| Wolbertus et al. [98] | ✓ | ✓ | ✓ | ✓ | ✓ | full employment | ✓ | ✓ | |||
| Attribute | Levels |
|---|---|
| Type of Engine | BEV/PHEV/HEV/Diesel/Gasoline |
| Price | 24,000 €/27,000 €/30,000 €/32,000 €/34,000 € |
| Range | 150 km/250 km/350 km/900 km/1200 km |
| Fuel/electricity costs (per 100 km) | 2 €/4 €/6 €/8 €/10 € |
| CO2 emissions (per km) | 50 g/90 g/110 g/130 g/150 g |
| Variable | Sample (%) | INE (2011 National statistics) (%) |
|---|---|---|
| Age | ||
| <45 | 61 | 43 |
| ≥45 | 39 | 57 |
| Gender | ||
| Women | 44 | 53 |
| Men | 56 | 47 |
| Level of education | ||
| No higher education | 27 | 84 |
| College degree | 40 | 13 |
| Master/PhD degree | 33 | 3 |
| Demographic variables | ||||||||||||||
|---|---|---|---|---|---|---|---|---|---|---|---|---|---|---|
| Age | Gender | Level of education | ||||||||||||
| Attribute | <45 | ≥45 | Dif. | M | F | Dif. | No higher education | College degree | Master/PhD degree | |||||
| Type of engine | ||||||||||||||
| BEV | 19% | 25% | −6% | 22% | 20% | +2% | 23% | 22% | 17% | |||||
| PHEV | 40% | 44% | −4% | 42% | 40% | +2% | 46% | 42% | 35% | |||||
| HEV | 40% | 38% | +3% | 40% | 38% | +2% | 35% | 36% | 49% | |||||
| Gasoline | 33% | 18% | +15% | 24% | 33% | −9% | 18% | 31% | 33% | |||||
| Diesel | 49% | 46% | +3% | 48% | 49% | −1% | 50% | 46% | 50% | |||||
| Sig. within group | 0.01 | 0.01 | 0.01 | 0.01 | 0.01 | 0.01 | 0.01 | |||||||
| Sig. between groups | 0.05 | Not Sig. | Not Sig. | |||||||||||
| Price | ||||||||||||||
| 24,000 | 45% | 38% | +7% | 41% | 45% | −4% | 40% | 42% | 49% | |||||
| 27,000 | 50% | 49% | +1% | 50% | 50% | 0% | 46% | 47% | 59% | |||||
| 30,000 | 28% | 28% | −1% | 29% | 27% | +3% | 29% | 30% | 24% | |||||
| 32,000 | 25% | 23% | +1% | 26% | 22% | +4% | 21% | 25% | 26% | |||||
| 34,000 | 17% | 22% | −5% | 18% | 19% | −1% | 26% | 20% | 9% | |||||
| Sig. within group | 0.01 | 0.01 | 0.01 | 0.01 | 0.01 | 0.01 | 0.01 | |||||||
| Sig. between groups | Not Sig. | Not Sig. | 0.05 | |||||||||||
| Range | ||||||||||||||
| 150 | 15% | 19% | −3% | 17% | 16% | +2% | 20% | 17% | 13% | |||||
| 250 | 21% | 28% | −7% | 25% | 22% | +2% | 27% | 25% | 19% | |||||
| 350 | 20% | 32% | −12% | 25% | 24% | +1% | 25% | 26% | 20% | |||||
| 900 | 35% | 28% | +7% | 34% | 32% | +1% | 30% | 33% | 35% | |||||
| 1200 | 45% | 44% | +1% | 43% | 46% | −3% | 44% | 44% | 46% | |||||
| Sig. within group | 0.01 | 0.01 | 0.01 | 0.01 | 0.01 | 0.01 | 0.01 | |||||||
| Sig. between groups | Not Sig. | Not Sig. | Not Sig. | |||||||||||
| Fuel consumption | ||||||||||||||
| 2 | 28% | 30% | −2% | 30% | 27% | +2% | 28% | 29% | 28% | |||||
| 4 | 34% | 41% | −7% | 38% | 34% | +4% | 43% | 38% | 26% | |||||
| 6 | 42% | 48% | −6% | 43% | 44% | −1% | 45% | 43% | 45% | |||||
| 8 | 34% | 22% | +12% | 29% | 32% | −3% | 26% | 31% | 34% | |||||
| 10 | 25% | 15% | +10% | 19% | 24% | −6% | 15% | 20% | 31% | |||||
| Sig. within group | 0.01 | 0.01 | 0.01 | 0.01 | 0.01 | 0.01 | 0.05 | |||||||
| Sig. between groups | 0.05 | Not Sig. | Not Sig. | |||||||||||
| CO2 Emissions | ||||||||||||||
| 50 | 28% | 33% | −5% | 32% | 28% | +3% | 32% | 31% | 26% | |||||
| 90 | 31% | 33% | −2% | 30% | 32% | −2% | 35% | 32% | 27% | |||||
| 110 | 34% | 34% | 0% | 31% | 36% | −5% | 33% | 32% | 38% | |||||
| 130 | 45% | 41% | +3% | 45% | 42% | +3% | 43% | 42% | 47% | |||||
| 150 | 29% | 23% | +6% | 27% | 27% | 0% | 21% | 29% | 29% | |||||
| Sig. within group | 0.01 | Not sig | 0.01 | 0.01 | 0.05 | Not Sig. | 0.01 | |||||||
| Sig. between groups | Not Sig. | Not Sig. | Not Sig. | |||||||||||
| Demographic variables | |||||||||
|---|---|---|---|---|---|---|---|---|---|
| Route | Km per Year | Knowledge | |||||||
| Attribute | City | Intercity | Dif. | ≤30,000 | >30,000 | Dif. | Low | Medium/High | Dif. |
| Type of engine | |||||||||
| BEV | 25% | 16% | +9% | 21% | 16% | +6% | 19% | 23% | −4% |
| PHEV | 41% | 41% | 0% | 42% | 34% | +8% | 38% | 45% | −6% |
| HEV | 36% | 43% | −7% | 40% | 38% | +2% | 44% | 35% | 9% |
| Gasoline | 21% | 36% | −15% | 25% | 49% | −24% | 29% | 27% | 2% |
| Diesel | 49% | 48% | +1% | 48% | 50% | −2% | 52% | 45% | 6% |
| Sig. within group | 0.01 | 0.01 | 0.01 | 0.01 | 0.01 | 0.01 | |||
| Sig. between groups | 0.01 | 0.05 | Not Sig. | ||||||
| Price | |||||||||
| 24,000 | 40% | 47% | −7% | 42% | 53% | −11% | 45% | 41% | +3% |
| 27,000 | 47% | 53% | −6% | 49% | 52% | −2% | 54% | 45% | +10% |
| 30,000 | 32% | 23% | +10% | 28% | 25% | +3% | 25% | 31% | −6% |
| 32,000 | 24% | 25% | −1% | 25% | 17% | +8% | 22% | 26% | −4% |
| 34,000 | 20% | 17% | +3% | 19% | 14% | +5% | 17% | 21% | −4% |
| Sig. within group | 0.01 | 0.01 | 0.01 | 0.01 | 0.01 | 0.01 | |||
| Sig. between groups | Not Sig. | Not Sig. | Not Sig. | ||||||
| Range | |||||||||
| 150 | 21% | 12% | +9% | 17% | 13% | +4% | 13% | 20% | −7% |
| 250 | 28% | 18% | +10% | 24% | 20% | +4% | 22% | 25% | −3% |
| 350 | 27% | 21% | +6% | 27% | 10% | +17% | 24% | 24% | 0% |
| 900 | 30% | 36% | −6% | 31% | 45% | −13% | 33% | 32% | +1% |
| 1200 | 42% | 46% | −4% | 45% | 42% | +2% | 46% | 43% | +3% |
| Sig. within group | 0.01 | 0.01 | 0.01 | 0.01 | 0.01 | 0.01 | |||
| Sig. between groups | 0.05 | Not Sig. | Not Sig. | ||||||
| Fuel consumption | |||||||||
| 2 | 32% | 24% | +8% | 29% | 25% | +4% | 26% | 32% | −6% |
| 4 | 38% | 34% | +5% | 38% | 23% | +15% | 33% | 39% | −6% |
| 6 | 41% | 47% | −5% | 43% | 48% | −5% | 46% | 41% | +5% |
| 8 | 26% | 35% | −9% | 29% | 43% | −15% | 32% | 28% | +4% |
| 10 | 22% | 22% | 0% | 21% | 28% | −7% | 25% | 18% | +7% |
| Sig. within group | 0.01 | 0.01 | 0.01 | 0.01 | 0.01 | 0.01 | |||
| Sig. between groups | Not Sig. | 0.05 | Not Sig. | ||||||
| CO2 Emissions | |||||||||
| 50 | 33% | 27% | +6% | 31% | 25% | +5% | 25% | 35% | −10% |
| 90 | 32% | 31% | +1% | 31% | 36% | −5% | 31% | 31% | 0% |
| 110 | 30% | 38% | −7% | 34% | 34% | 0% | 37% | 30% | +7% |
| 130 | 44% | 43% | +2% | 44% | 40% | +5% | 43% | 44% | −1% |
| 150 | 26% | 29% | −3% | 26% | 32% | −6% | 31% | 23% | +7% |
| Sig. within group | 0.01 | 0.01 | 0.01 | Not Sig. | 0.01 | 0.01 | |||
| Sig. between groups | Not Sig. | Not Sig. | 0.05 | ||||||
© 2019 by the authors. Licensee MDPI, Basel, Switzerland. This article is an open access article distributed under the terms and conditions of the Creative Commons Attribution (CC BY) license (http://creativecommons.org/licenses/by/4.0/).
Share and Cite
Oliveira, G.D.; Dias, L.C. Influence of Demographics on Consumer Preferences for Alternative Fuel Vehicles: A Review of Choice Modelling Studies and a Study in Portugal. Energies 2019, 12, 318. https://doi.org/10.3390/en12020318
Oliveira GD, Dias LC. Influence of Demographics on Consumer Preferences for Alternative Fuel Vehicles: A Review of Choice Modelling Studies and a Study in Portugal. Energies. 2019; 12(2):318. https://doi.org/10.3390/en12020318
Chicago/Turabian StyleOliveira, Gabriela D., and Luis C. Dias. 2019. "Influence of Demographics on Consumer Preferences for Alternative Fuel Vehicles: A Review of Choice Modelling Studies and a Study in Portugal" Energies 12, no. 2: 318. https://doi.org/10.3390/en12020318
APA StyleOliveira, G. D., & Dias, L. C. (2019). Influence of Demographics on Consumer Preferences for Alternative Fuel Vehicles: A Review of Choice Modelling Studies and a Study in Portugal. Energies, 12(2), 318. https://doi.org/10.3390/en12020318