Article

A New Conceptual Design and Dynamic Analysis of a Spar-Type Offshore Wind Turbine Combined with a Moonpool

Naval Architecture and Ocean Engineering, University of Ulsan, Ulsan 44610, Korea
*
Author to whom correspondence should be addressed.
Energies 2019, 12(19), 3737; https://doi.org/10.3390/en12193737
Submission received: 11 September 2019 / Revised: 28 September 2019 / Accepted: 29 September 2019 / Published: 30 September 2019

Abstract

:
Floating offshore wind turbines promise to provide an abundant source of energy. Currently, much attention is being paid to the efficient performance and the economics of floating wind systems. This paper aims to develop a spar-type platform to support a 5-MW reference wind turbine at a water depth of 150 m. The spar-type platform includes a moonpool at the center. The design optimization process is composed of three steps; the first step uses a spreadsheet to calculate the platform dimensions; the second step is a frequency domain analysis of the responses in wave conditions; and the final step is a fully coupled simulation time domain analysis to obtain the dynamic responses in combined wind, wave, and current conditions. By having a water column inside the open moonpool, the system’s dynamic responses to horizontal and rotating motions are significantly reduced. Reduction of these motions leads to a reduction in the nacelle acceleration and tower base bending moment. On the basic of optimization processes, a spar-type platform combined with a moonpool is suggested, which has good performance in both operational conditions and extreme conditions.

Graphical Abstract

1. Introduction

The South Korean government has released an ambitious plan, known as “Renewable Energy 3020”, to increase new renewable energy source power generation by 48.7 GW by 2030. The target is to provide 16.5 GW from wind energy which includes 13 GW from offshore wind. Focusing on a water depth of 150 m in the East Sea offshore area of South Korea, floating offshore wind turbines (FOWT) are considered to be the best candidate to fulfill this target. The main types of floating foundations are the semi-submersible, spar, and tension leg platforms (TLP). The semi-submersible concept is stabilized by the water plane area of the column separation which provides a large restoring force to the roll and pitch, and hence, requires large platform displacement. The first demonstration of semi-submersible concepts are Principle Power (WindFloat) [1] and Fukushima FORWARD [2]. There are also several semi-submersible model designs [3,4,5,6,7]. The TLP concept is stabilized by a high-tension mooring system; for this reason, the anchor system for TLP is complex [8,9,10]. The spar concept usually uses heavy ballast materials such as concrete at the bottom to provide a lower center of gravity for stabilization [11,12,13,14,15].
The most reliable concept for floating platform wind turbines is the spar-type platform. The first floating wind farm, with a 30 MW power generation capacity, began operating at the end of 2017 in Scotland. The platform was upscaled from the Hywind concept which was developed by Statoil to support a 2.3 MW wind turbine [16]. On the basic of the Hywind concept, The National Renewable Energy Laboratory (NREL) developed a spar-type platform [11], known as OC3-Hywind, to support a 5 MW offshore wind turbine [17]. The OC3-Hywind spar model has been widely used to study dynamic responses and performances of FOWT systems. In order to compare it with other concepts, numerical simulations and experiments were performed [18,19,20]. It is clear that the OC3-Hywind spar-type model has larger a nacelle acceleration and tower base bending moment than those of the semi-submersible or TLP types. The cause of the large bending moment at the tower-base of the OC3-Hywind spar model is the long distance from the nacelle to the rotating point, which leads to a large horizontal translation motion and acceleration at the nacelle, creating large inertia forces. The solution for reducing the tower base bending moment is a reduction in the translation and rotation motions of the wind turbine system. This paper aim to solve this issue by adding a vertical moonpool at the center of a conventional spar-type platform. The water column inside the moonpool contributes more mass in the horizontal direction and inertia to the FOWT system; therefore, the horizontal translation motion and rotating motion will be reduced.

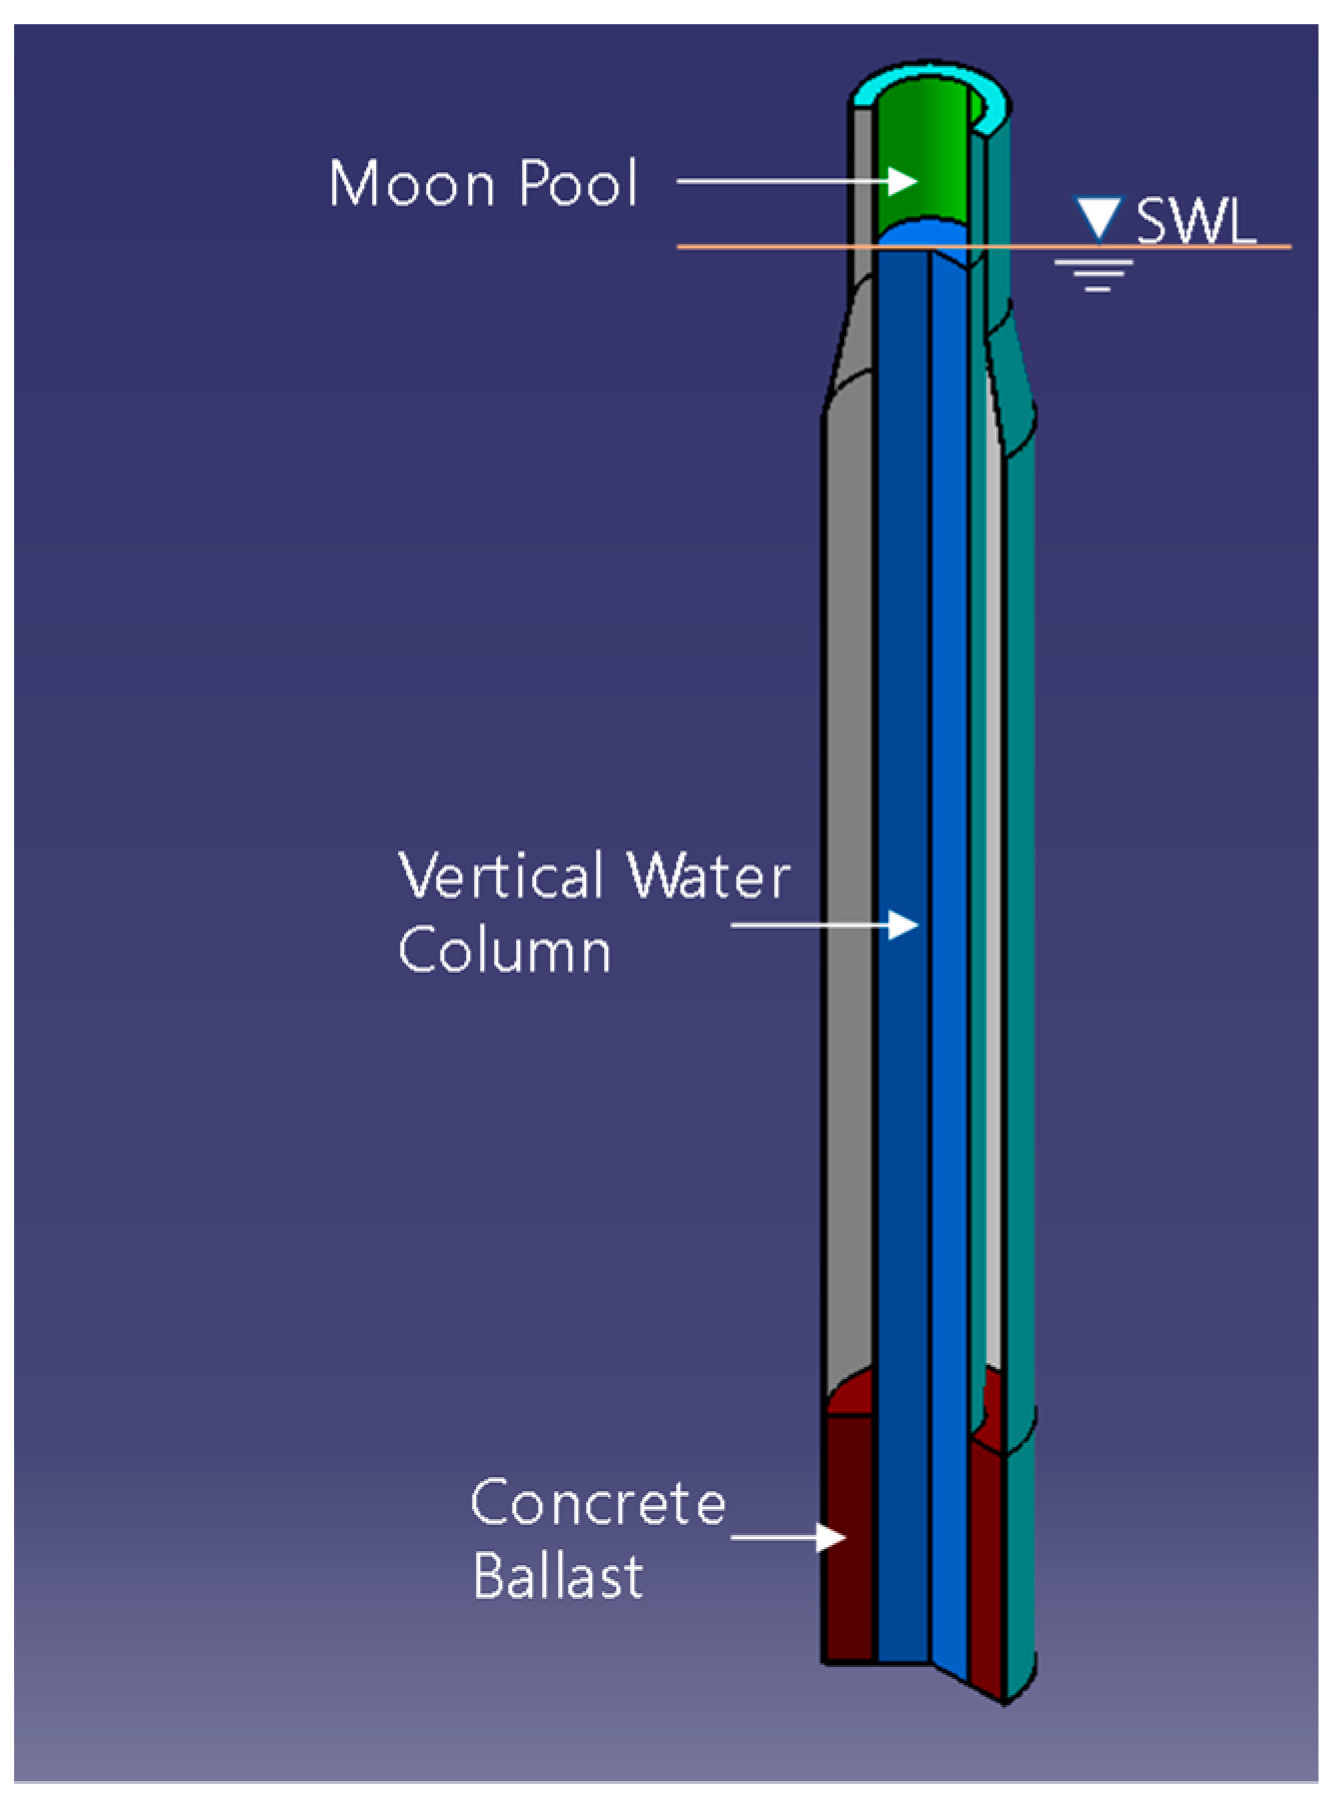
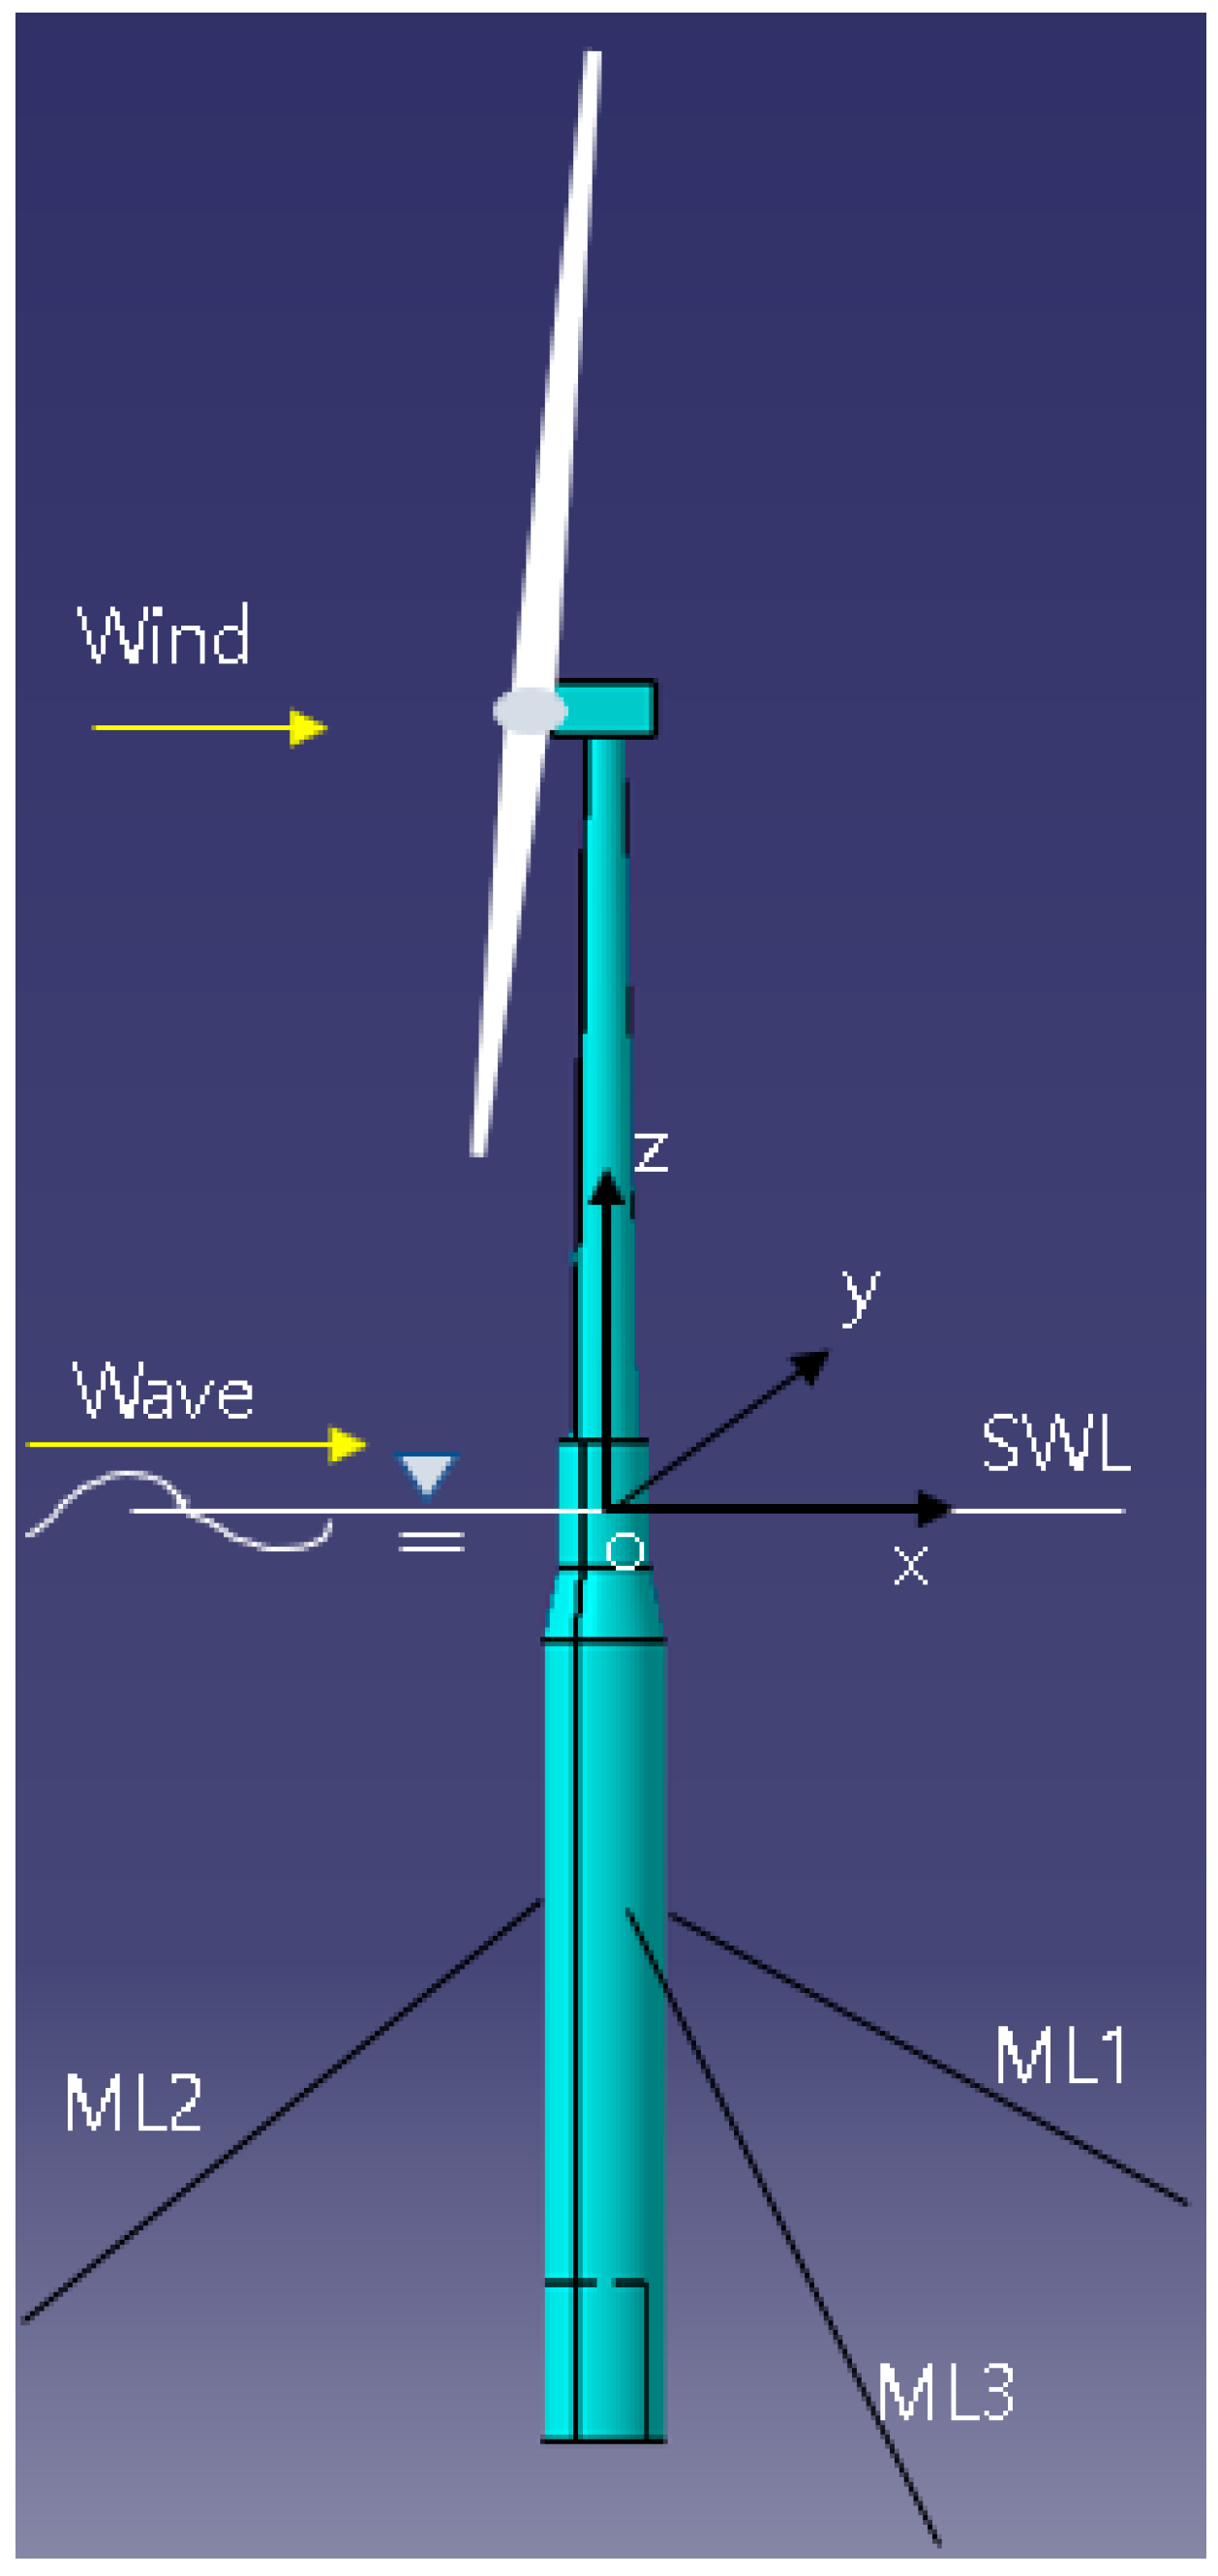
2. Model Descriptions
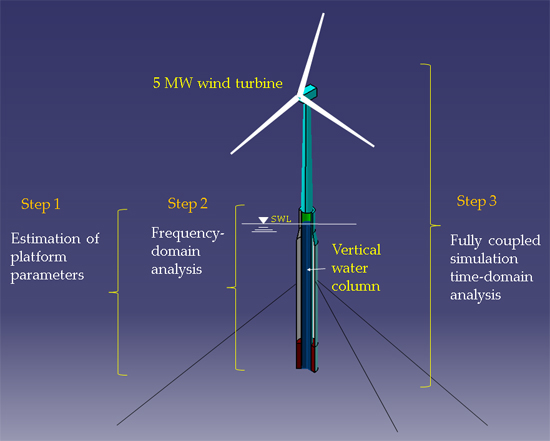
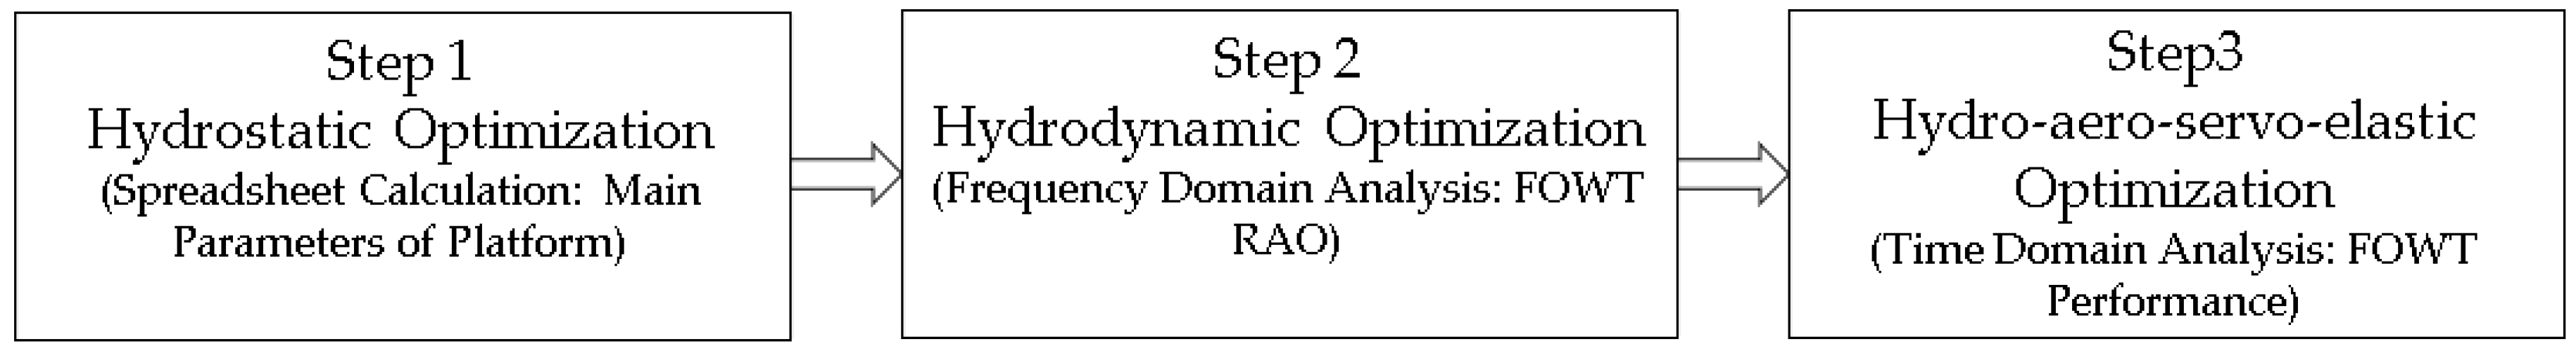
The spar-type floating offshore wind turbine combined with a moonpool is designed to support a 5-MW reference offshore wind turbine [17]. The wind turbine has a 126 m rotor diameter located at the top of the tower with a hub height of 90 m above the sea water level (SWL). The tower connects to the platform at 10 m above SWL. Table 1 describes the main parameters of the 5 MW offshore wind turbine. The spar-type platform combined with a moonpool model has an open moonpool along the center, inside which sea water is freely displaced as can be seen in Figure 1. Considering the 150 m water depth of the reference site in the East Sea of South Korea, the design draft of the platform should be shorter than the 120 m draft for the OC3-Hywind model. To obtain enough stability, the ballast material should be concrete, in order to keep the center of mass (CM) of the total system lower than the center of buoyancy (CB). Figure 2 shows the overview of the FOWT system. The global coordinate system is located at SWL of the center line of the platform.
In this study, a conventional catenary mooring system is designed for all models of the spar-type platform combined with a moonpool. The mooring system sustains the floating wind system via three catenary mooring lines. Mooring line (ML) 2 is directed in the upwind direction and ML1 and ML3 are arranged uniformly around the platform. The horizontal stiffness of the mooring system is maintained at the same level as in the OC3-Hywind mooring system. The main parameters of the mooring line are selected according to the fact that the mooring line used is a studless chain, the material grade is R3 [21], and the nominal common link diameter is 90 mm. The total horizontal stiffness of the mooring system is calculated as in Equations (1) and (2) [22] by estimation of horizontal pretension TH. The mooring line length is set as in Equation (3).
C 11 , m o o r = μ g [ 2 1 + 2 a z + cosh 1 ( 1 + z a ) ] 1
where a = T H / μ g , TH is the horizontal pretension, μ is the weight of mooring line per meter in water, z is the vertical distance from anchor to fairlead, and C11,moor is the horizontal stiffness of one mooring line.
C 11 , t o t a l = 1 3 C 11 , m o o r , i cos 2 Ψ i
L m o o r = z 2 T max μ g z 1
where C11,total is the linear horizontal stiffness of the mooring system, Ψ is the angle of mooring line on the horizontal plane of the global coordinate system (here, Ψi = 60°, 180°, 300°), Lmoor is the mooring line length and Tmax is the proof load of the mooring chain.
A 2D static mooring in-house code was used to calculate the horizontal distance from anchor to fairlead and the vertical force of the mooring was based on the pretension in the horizontal direction TH. The total vertical force of the mooring system is used in the next step to determine the mass of the platform. The mooring system properties are shown in Table 2.

3. Design Process

For the design optimization of a floating offshore wind turbine, the design process is made up of three steps, as shown in Figure 3. The first step is hydrostatic optimization. The basic platform geometrics and mass distribution are estimated based on the constraint conditions and with the objective of reducing the structure mass and platform volume displacement. The second step analyzes the hydrodynamic responses of the platform models which were selected from step 1. Considering the total FOWT that a rigid body experiences in regular waves, the response amplitude operator (RAO) is obtained using in-house codes of the University of Ulsan (UOU). A set of platform models with smaller RAOs is used in step 3 for a fully coupled hydro-aero-servo-elastic dynamic simulation in the time domain using the NREL FAST code [23]. The final model is selected considering, not only better performance, but also the structure mass and ease of manufacturing.

3.1. Hydrostatic Optimization

The main dimensions of the spar-type platform combined with a moonpool are the platform draft h, moonpool diameter d, upper diameter d1, and lower diameter d2. The elevation to the top of the platform above sea water level (SWL) is 10 m. These parameters are shown in Figure 4. The water plane area is kept the same as for the OC3-Hywind model in order to draw a comparison with their numerical simulation results. For a given moonpool diameter d, the upper diameter d1 is derived. The design space of the platform specification is determined from constraint conditions which are the pitch angle of the platform at the rated pitch θ5 smaller than 5 degrees and natural periods of heave and pitch larger than 25–30 s. Steel mass is calculated from the hull shape, which has steel plate thickness of 50 mm (average); the ballast mass is extracted from Equation (4). According to the distribution of the hull steel and concrete ballast, the center of mass and inertia of the platform are derived, respectively. Equations (4)–(7) are used in this step. The variables selected for this step are platform draft h, ranging from 55 to 100 m; moonpool diameter d, ranging from 2 to 10 m; and ballast materials of 2300 kg/m3 and 4000 kg/m3.
ρ g V 0 = g ( m R N A + m t o w e r ) + g ( m s t e e l + m b a l l a s t ) p l a t f o r m + 1 n F V _ m o o r i n g
θ 5 = F t h r u s t H B C 55
T 33 = 2 π m 33 _ F O W T + A 33 ρ g A w
T 55 = 2 π I 55 _ F O W T + I 55 _ V W C + A 55 C 55
where Fthrust is the rated thrust force of the wind turbine; HB is the distance from the hub to the center of buoyancy of the platform; V0 is the displacement volume of the platform; Aw is the water plane area; m33_FOWT is the total mass of the FOWT system; A33 is heave added mass; C55 is the restoring coefficient of pitch; T33 and T55 are natural periods of heave and pitch. Here, I55_FOWT is the total pitch inertia of the FOWT, and I55-VWC is the pitch inertia of the vertical water column (VWC) about the CM of the FOWT system.

3.2. Hydrodynamic Optimization

To evaluate the hydrodynamic properties of the spar-type platform combined with a moonpool, frequency domain analysis is applied. The process involved in this step can be seen in Figure 5. The linear response amplitude operator (RAO) for six degree of freedoms (DOF) at the CM of the FOWT can be obtained using an in-house code. In this step, FOWT is modeled as a rigid body, where only regular wave forces excite the system, and the aerodynamic load and current load are neglected. UOU in-house codes, including the radiation solver and diffraction solver, are used to obtain the hydrodynamic-added-mass and damping matrices (Aij (ω), Bij (ω)), and the wave-exciting force matrix per unit wave amplitude Fi (ω). The mass matrix [M], hydrodynamic linear damping matrix [B], and stiffness of the FOWT system [K] are obtained by running the linearization mode of the FAST code [24]. The stiffness matrix includes the hydrostatic stiffness and linear stiffness of the mooring system. The VWC inside the moonpool distributes the mass in the surge and sway directions, as well as distributes the roll and pitch inertia to the FOWT system; therefore, RAOs of surge, sway, roll, and pitch include the effects of the mass and inertia of the VWC, respectively. The RAOs are calculated as Equation (8).
R A O ( ω ) = | [ F ( ω ) ] [ K ] ω 2 [ M + A ( ω ) ] + i ω [ B + B ( ω ) ] |

3.3. Fully Coupled Hydro-Aero-Servo-Elastic Dynamic Optimization

The equation of motion for the FOWT under the fully coupled analysis in the time domain can be expressed as in Equation (9).
( M i j + A i j ( ) ) x . . ( t ) + 0 t K i j ( τ ) x . ( t τ ) d τ + C i j x ( t ) = F i ( t )
F i ( t ) = F H ( t ) + F W ( t ) + F V ( t ) + F M ( t )
where Mij is the mass and the mass inertia matrix of the FOWT structure, Aij( ) is the added mass matrix at ω = , Cij is the restoring stiffness coefficient matrix, and Kij is the retardation function which is expressed by the wave radiation damping matrix Bij(ω) as in Equation (11).
K i j ( t ) = 2 π 0 B i j ( ω ) cos ( ω t ) d ω
Fi(t) is the sum of the external forces matrix, composed of the hydrodynamic forces of the platform FH(t) including hydrostatic force, wave-exciting forces and current force; the restoring forces of the mooring system FM(t); the viscous drag forces from Morison’s equation; and the wind forces FW(t), including the aerodynamic forces of the wind turbine and tower drag forces. The total external forces are expressed in Equation (10). In order to calculate the coupled effect of the VWC inside the moonpool, the mass and the inertia of the VWC are added to the added mass matrix Aij in surge-surge, sway-sway, roll-roll, and pitch-pitch components. Using FAST v8 [23], a fully coupled hydro-aero-servo-elastic time domain analysis can be conducted for FOWTs. The strucutre of the FAST code is shown in Figure 6. The primary parameters, such as the elastic model of the blades and tower, aerodynamic properties of the blades, control schedule of generator torque and blade pitch angle, and hydrodynamic data of the platform, are input to FAST v8 to simulate all FOWT systems under complex environmental conditions.
To analyze the dynamic responses and loads of candidate models of the spar-type FOWT with a moonpool, three design load cases (DLC) are selected based on the IEC standard [25]. Two of the three DLCs are: DLC1.1, which analyzes normal wind turbine operational conditions under normal sea state; and DLC.1.6a, which analyzes the normal wind turbine operational conditions under an extreme sea state over a 50-year-return period. Both DLC1.1 and DLC1.6a use the normal turbulent wind model and normal current model. DLC6.1a analyzes the parked wind turbine condition under extreme turbulent wind speed, extreme wave and extreme current speed over a 50-year-return period. Details of the DLCs and environmental conditions are presented in Table 3 and Table 4 describes the wind, wave and current conditions. Sea states 1-11 are normal sea states and sea state 12 is the extreme sea state over a 50-year-return period. Irregular waves are generated based on the JONSWAP (Joint North Sea Wave Project) spectrum by FAST. Turbulent wind models are generated by the Turbsim program [26].

4. Results

The results from the first step give a clear design space to select the platform parameters. With each dimension of the moonpool diameter and design draft of the platform, and for the concrete density, the rated pitch angle is calculated for each displacement of the platform. As can be seen in Figure 7, the smaller the rated pitch angles, the larger the displacements and the heavier the concrete density. To optimize the parameters of the platform in this step, 12 candidate models (M1-M12) were selected, which have rated pitch angles of about 5 degrees, being the limit of the design. By using concrete density 4000 kg/m3, three groups of moonpool diameters and four groups of platform design drafts are used to derive the remaining parameters of the platform for next step. The trends for steel mass and concrete ballast mass for those models are shown in Figure 8. Table 5 describes the main parameters of the candidate models.
Table 5 shows that the lower diameter of the platform d2 increases when the platform draft h decreases, and as the moonpool diameter d decreases, d2 decreases. However, the platform masses of each platform draft group are similar. Therefore, the response analysis in the frequency domain in the second step is to optimize the platform draft. The comparisons of surge and pitch RAOs for the three groups of moonpool diameter with different platform drafts (Figure 9) show that a 100 m platform draft experiences the smallest response, while the 55 m draft experiences the largest. Therefore, here, three models of the 100 m platform draft are selected for the final step. Those are: model M1, the moonpool diameter (d) = 10 m; model M5, d = 6 m; and model M9, d = 2 m.
Before conducting the fully coupled analysis of the selected models, free decay simulation tests were performed by applying initial platform displacement without the excitation of wave, wind, or current. The natural frequencies were determined based on the Fourier transforms of the simulation time histories, as shown in Figure 10. The natural frequencies of the surge, heave, and pitch were obtained and compared with those of the spreadsheet calculation in Table 6. The calculation frequencies of pitch are slightly larger than those of simulations because the calculation values are undamped natural frequencies, but the simulation values are damped natural frequencies. Four models have the same waterplane area, and total system mass, therefore their heave natural frequencies are almost similar.
The results of the final step are shown in Figure 11, Figure 12 and Figure 13. To evaluate the performance of the three models, a comparison between them and the OC3-Hywind model is performed. All four models use the same mooring system for a 150 m water depth and the same wind turbine control system. The wind, wave, and current directions are the same at zero heading angle. Figure 11 shows the standard deviation of wind turbine responses, tower-base bending moment My, and generator power under DLC1.1 environmental condition. All four models show good performance and small dynamic responses under normal operational conditions except model M1, which has larger pitch standard deviation near rated wind speed. However, the nacelle acceleration of model M1 is similar to that of model M5 and both are smaller than that of model M9 and the OC3-Hywind model. In stronger waves above 14 m/s, the average turbulent wind speed dynamic tower-base bending moments of M9 and the OC3-Hywind model are larger than those of M1 and M5. It is clear that under small wave conditions, wind turbine performances of the three spar-type platforms with moonpools are in quite good agreement with the OC3-hywind model. In the DLC1.6a extreme wave condition, the effects of the moonpool can be seen clearly. Figure 12 presents the responses and load spectrums of the wind turbines at 12 m/s average wind speed, irregular waves of significant height (11.57 m), and peak periods of 14.52 s. Because of the large added mass and added inertia from the VWC inside the moonpool, the surge and pitch responses of model M1 and M5 are significantly reduced, whereas the surge and pitch responses of Model M9 and the OC3-Hywind model are similar. It should be noted that the mass ratios between the water column inside the moonpool at still water and the platform of models M1, M5, and M9 are 1.134, 0.408, and 0.045, respectively. The mass ratio of model M9 is quite small, therefore the effect of the moonpool is trivial. On the other hand, a large mass ratio, such as in model M1, leads to an increase in the pitch response at a low frequency; however, the slow motion of the surge and pitch has little effect on the nacelle acceleration. Smaller surge and pitch responses at the wave-exciting frequency cause a reduction in the nacelle acceleration in the x direction as well as reduction of the tower-base bending moment My. In the spectrum of acceleration, the peak points of M1 and M5 are 13.4% and 20% of the OC3-Hywind model, and regarding the spectrum of tower-base bending moments, the peak points of M1 and M5 are 11% and 18% of the OC3-Hywind model, respectively.
The extreme responses and loads of the four models were extracted from all time-series outputs of the three DLCs, as presented in Figure 13. The figure shows that the maximum nacelle accelerations in DLC1.6a of M9 and the OC3-Hywind model are over 0.3 g, where g is the gravitational acceleration; however, those of M1 and M5 are lower than that. Under extreme environmental conditions with the wind turbine being in parked conditions, the extreme loads and responses of M1 and M5 are smaller than those of M9 and the OC3-Hywind model.
The final design for the spar-type platform combined with a moonpool could be model M5. In terms of the connection between the platform and tower, model M5 is better than M1 because the tower-base diameter is about 6.5 m. The moonpool diameter for M1 is 10 m and for M5 is 6 m. Furthermore, the steel mass of M1 is higher than M5. Therefore, this study suggests model M5 to be a good candidate to support the 5 MW offshore wind turbine. This model can also be scaled up to support larger wind turbines to be installed at a water depth of 150 m.

5. Conclusions

In this study, a new conceptual design of a spar-type platform to support a 5 MW offshore wind turbine is suggested. This concept solves several issues associated with the OC3-hywind model, such as the high nacelle acceleration and tower-base bending moment. It does so by placing an open moonpool at the center of the platform. The water column inside the moonpool plays a role in increasing the mass and inertia of the entire wind system on the x and y axes. With a large enough moonpool diameter, the nacelle acceleration and tower-base bending moment can be reduced.
To define the parameters of the spar-type platform combined with a moonpool concept, three designs and analysis steps were implemented. Before going through the design process, a mooring system was designed for a water depth of 150 m. The platform mass can be estimated more accurately in balance with the buoyancy force, wind turbine mass, and mooring weight effect. The first design step evaluated the main parameters of the platform, which are the moonpool diameter, platform displacement and shape, and the platform mass distribution. Twelve candidate models were defined in this step to analyze the hydrodynamic effect of each model. Step 2 used UOU in-house codes and the linearization mode of the FAST code to obtain amplitude responses of the platforms in the frequency domain. For each moonpool diameter, longer draft models create a smaller surge and pitch response. Finally, three models, all of which had the same 100 m draft and the smallest displacement, but different moonpool diameters, were selected for the fully coupled analysis in the time domain. Free decay simulation tests were performed to obtain the natural frequencies of those models. The natural frequencies of the surge, heave, and pitch were compared with those of the spreadsheet calculation. The comparison shows a good agreement between results from simulation and spreadsheet calculation. The fully coupled analyses were carried out under several environmental conditions in the East Sea offshore area of South Korea. The results from the third step show that the performance and response results of the spar-type model with the 2 m diameter moonpool are similar to those of the OC3-Hywind model; however, the nacelle acceleration and tower-base bending moment results of the models with 10 m and 6 m moonpool diameter are significantly smaller than those of the OC3-Hywind model. The responses and loads of the 10 and 6 m moonpool diameter models are not very different. In the case of the model with the 10 m moonpool diameter, it has a higher steel mass and viscous drag force caused by the larger platform diameter. Therefore, this paper suggests a spar-type platform combined with a moonpool, which has a draft of 100 m, a moonpool diameter of 6 m, and uses heavy density concrete for ballasting. This model can be scaled up for larger wind turbines to be installed at a depth of 150 m, such as a 10 MW wind turbine.
In the future, we will focus on the detail design such as structure strength of the platform and the relative motion between the water column and the platform.

Author Contributions

Conceptualization and supervision: H.S.; investigation, methodology, calculation and simulation, writing original draft, writing review & editing: H.S. and T.D.P.

Funding

This work was supported by the Korea Institute of Energy Technology Evaluation and Planning (KETEP), and the Ministry of Trade, Industry & Energy (MOTIE) of the Republic of Korea (No. 20184030202280), and also by Korea Electric Power Corporation (Grant number: R18XA03).

Acknowledgments

The authors thank the anonymous reviewers and all the editors in the process of manuscript revision.

Conflicts of Interest

The authors declare no conflict of interest.

References

  1. Roddier, D.; Cermelli, C.; Aubault, A.; Weinstein, A. WindFloat: A floating foundation for offshore wind turbines. J. Renew. Sustain. Energy 2010, 2, 33104. [Google Scholar] [CrossRef]
  2. Fukushima Forward Fukushima Floating Offshore Wind Farm Demonstration Project; Fukushima offshore Wind Consortium: Tokyo, Japan, 2014.
  3. Viselli, A.M.; Goupee, A.J.; Dagher, H.J. Model Test of a 1:8-Scale Floating Wind Turbine Offshore in the Gulf of Maine1. J. Offshore Mech. Arct. Eng. 2015, 137, 041901. [Google Scholar] [CrossRef] [Green Version]
  4. Robertson, A.; Jonkman, J.; Masciola, M. Definition of the Semisubmersible Floating System for Phase II of OC4; Technical Report NREL/TP-5000-60601; National Renewable Energy Laboratory-NREL: Golden, CO, USA, 2014. [Google Scholar]
  5. Kvittem, M.I.; Berthelsen, P.A.; Eliassen, L.; Thys, M. Calibration of Hydrodynamic Coefficients for a Semi-Submersible 10 MW Wind Turbine. ASME 2018 37th International Conference on Ocean, Offshore and Arctic Engineering. American Society of Mechanical Engineers Digital Collection: 2018; V010T09A080. Available online: https://asmedigitalcollection.asme.org/OMAE/proceedings-abstract/OMAE2018/51319/V010T09A080/278216 (accessed on 1 September 2019).
  6. Berthelsen, P.A.; Bachynski, E.E.; Karimirad, M.; Thys, M. Real-Time Hybrid Model Tests of a Braceless Semi-Submersible Wind Turbine: Part III—Calibration of a Numerical Model. ASME 2016 35th International Conference on Ocean, Offshore and Arctic Engineering. American Society of Mechanical Engineers Digital Collection: 2016; V006T09A047. Available online: https://asmedigitalcollection.asme.org/OMAE/proceedings-abstract/OMAE2016/49972/V006T09A047/281295 (accessed on 1 September 2019).
  7. Liu, Y.; Li, S.; Yi, Q.; Chen, D. Developments in semi-submersible floating foundations supporting wind turbines: A comprehensive review. Renew. Sustain. Energy Rev. 2016, 60, 433–449. [Google Scholar] [CrossRef]
  8. Bachynski, E.E.; Moan, T. Design considerations for tension leg platform wind turbines. Mar. Struct. 2012, 29, 89–114. [Google Scholar] [CrossRef]
  9. Oguz, E.; Clelland, D.; Day, A.H.; Incecik, A.; López, J.A.; Sánchez, G.; Almeria, G.G. Experimental and numerical analysis of a TLP floating offshore wind turbine. Ocean Eng. 2018, 147, 591–605. [Google Scholar] [CrossRef] [Green Version]
  10. Kausche, M.; Adam, F.; Dahlhaus, F.; Großmann, J. Floating offshore wind—Economic and ecological challenges of a TLP solution. Renew. Energy 2018, 126, 270–280. [Google Scholar] [CrossRef]
  11. Jonkman, J. Definition of the Floating System for Phase IV of OC3; Technical Report NREL/TP-500-47535; National Renewable Energy Laboratory-NREL: Golden, CO, USA, 2010. [Google Scholar]
  12. Bredmose, H.; Lemmer, F.; Borg, M.; Pegalajar-Jurado, A.; Mikkelsen, R.F.; Larsen, T.S.; Fjelstrup, T.; Yu, W.; Lomholt, A.K.; Boehm, L.; et al. The Triple Spar campaign: Model tests of a 10MW floating wind turbine with waves, wind and pitch control. Energy Procedia 2017, 137, 58–76. [Google Scholar] [CrossRef] [Green Version]
  13. Utsunomiya, T.; Matsukuma, H.; Minoura, S.; Ko, K.; Hamamura, H.; Kobayashi, O.; Sato, I.; Nomoto, Y.; Yasui, K. On Sea Experiment of a Hybrid SPAR for Floating Offshore Wind Turbine Using 1/10 Scale Model. J. Offshore Mech. Arct. Eng. 2013, 135, 034503. [Google Scholar] [CrossRef]
  14. Shin, H.; Dam, P.T.; Jung, K.J.; Song, J.; Rim, C.; Chung, T. Model test of new floating offshore wind turbine platforms. Int. J. Nav. Archit. Ocean Eng. 2013, 5, 199–209. [Google Scholar] [CrossRef] [Green Version]
  15. Shin, H.; Lee, W.; Jung, K.; Kim, J. Model test and simulation of modified spar type floating offshore wind turbine with three catenary mooring lines. J. Renew. Sustain. Energy 2014, 6, 042009. [Google Scholar] [CrossRef]
  16. Skaare, B. Development of the Hywind Concept. In 2017 36th International Conference on Ocean, Offshore and Arctic Engineering; American Society of Mechanical Engineers Digital Collection: 2017; V009T12A050; Available online: https://asmedigitalcollection.asme.org/OMAE/proceedings-abstract/OMAE2017/57779/V009T12A050/279375 (accessed on 1 September 2019).
  17. Jonkman, J.; Butterfield, S.; Musial, W.; Scott, G. Definition of a 5-MW Reference Wind Turbine for Offshore System Development; National Renewable Energy Laboratory-NREL: Golden, CO, USA, 2009. [Google Scholar]
  18. Matha, D. Model Development and Loads Analysis of an Offshore Wind Turbine on a Tension Leg Platform with a Comparison to Other Floating Turbine Concepts; National Renewable Energy Laboratory-NREL: Golden, CO, USA, 2009. [Google Scholar]
  19. Jonkman, J.M.; Matha, D. Dynamics of offshore floating wind turbines—Analysis of three concepts. Wind Energy 2011, 14, 557–569. [Google Scholar] [CrossRef]
  20. Goupee, A.J.; Koo, B.J.; Kimball, R.W.; Lambrakos, K.F.; Dagher, H.J. Experimental Comparison of Three Floating Wind Turbine Concepts. J. Offshore Mech. Arct. Eng. 2014, 136, 020906. [Google Scholar] [CrossRef]
  21. DNV.GL. DNVGL-OS-E302 Offshore Mooring Chain; DNV-GL: Oslo, Norway, 2015. [Google Scholar]
  22. Faltinsen, O. Sea Loads on Ships and Offshore Structures; Cambridge University Press: Cambridge, UK, 1994; ISBN 0521372852. [Google Scholar]
  23. Jonkman, B.; Jonkman, J. FAST v8. 2018. Available online: https://nwtc.nrel.gov/FAST8 (accessed on 27 July 2016).
  24. Jonkman, J.M.; Buhl, M.L., Jr. FAST User’s Guide; National Renewable Energy Laboratory-NREL: Golden, CO, USA, 2005. [Google Scholar]
  25. International Electrotechnical Commission. IEC 61400-3-2, Wind Energy Generation System—Part 3-2: Design Requirements for Floating Offshore Wind Turbines; Technical Specification; IEC: Geneva, Switzerland, 2019; ISBN 978-2-8322-5986-3. [Google Scholar]
  26. Jonkman, B.J. TurbSim User’s Guide v2. 00.00; National Renewable Energy Laboratory-NREL: Golden, CO, USA, 2014. [Google Scholar]
Figure 1. Concept of spar-type floating offshore wind turbine (FOWT) combined with an open moonpool. Note: SWL = sea water level.
Energies 12 03737 g001
Figure 2. Overview of spar-type FOWT and global coordinate system. Note: ML = Mooring line.
Energies 12 03737 g002
Figure 3. Design processes. Note: RAO = response amplitude operator.
Energies 12 03737 g003
Figure 4. Main dimensions of spar-type platform combined with a moonpool.
Energies 12 03737 g004
Figure 5. Frequency domain analysis. Note: DOF = degrees of freedom, CM = center of mass, UOU = University of Ulsan.
Energies 12 03737 g005
Figure 6. Time domain analysis of fully coupled hydro-aero-servo-elastic dynamic model of a total FOWT system.
Energies 12 03737 g006
Figure 7. Relation between mean pitch angle at rated thrust force for the spar-type platform with a moonpool wind turbine with differences in displacement, draft and moonpool diameter of the platform.
Energies 12 03737 g007
Figure 8. The trend of the mass distribution for steel and ballast mass.
Energies 12 03737 g008
Figure 9. Comparisons of surge and pitch RAOs for difference moonpool diameters.
Energies 12 03737 g009
Figure 10. Free decay simulation by FAST, (a) surge, (b) heave, and (c) pitch.
Energies 12 03737 g010
Figure 11. Standard deviation of models M1, M5, M9, and the OC3-Hywind model in DLC1.1 - normal operation cases: (a) surge, (b) heave, (c) pitch, (d) nacelle acceleration, (e) tower-base bending moment My, and (f) generator power.
Energies 12 03737 g011
Figure 12. Spectrum of the FOWT systems at 12 m/s turbulent wind speed, irregular wave Hs = 12.12 m, Tp =14.17 s, and 0.37 m/s current speed.
Energies 12 03737 g012
Figure 13. Ultimate loads and responses of the FOWT systems for three DLCs.
Energies 12 03737 g013
Table 1. Wind turbine specifications.
ParameterUnitValue
Design Water Depthm150
Wind Turbine Rated PowerMW5
Hub Heightm90
Cut-In, Rated, and Cut-Out Wind Speedsm/s3, 11.4, 25
Rotor Masskg110,000
Nacelle Masskg240,000
Tower Mass (for offshore)kg249,718
Vertical Center of Mass (CM) of Wind Turbine (Rotor, Nacelle, and Tower)m70.34
Table 2. Mooring system properties.
ParameterUnitValue
Number of Mooring Lines -3
Angle Between Adjacent Lines Degree120
Depth to Anchors Below Sea Water Level (SWL) (Water Depth) m150
Depth to Fairleads Below SWL m41
Distance from Fairlead to Anchorm939
Unstretched Mooring Line Length m970
Mooring Chain Common Link Diameter mm90
Mooring Line Mass Density in Air kg/m178
Mooring Line Weight in Water (μ)N/m1518.8
Mooring Line Extensional Stiffness MN729.0
Minimum Breaking Load (MBL)MN6.65
Total Weight Effect of Three Mooring Lines in Static Conditionkgf120,946
Table 3. Design Load Cases (DLCs) [25].
ItemDLC 1.1DLC 1.6aDLC 6.1a
WindNTMNTMEWM
WavesNSSSSSESS
Wind and wave directionality0°, COD0°, COD0°, COD, Yaw ±8°, 0°
CurrentNCMNCMECM
Wind turbine statusOperationOperationParked,
blades:90°
COD: Co-directional; ECM: Extreme current model; ESS: Extreme sea state; EWM: Extreme wind speed model; NCM: Normal current model; NSS: Normal sea state; NTM: Normal turbulence model; SSS: Severe sea state.
Table 4. Environmental conditions.
Sea StateMean Wind Speed at Hub (m/s)Irregular WaveCurrent Speed (m/s)
Hs (m)Tp (s)
140.78 6.20 0.37
260.78 6.20 0.37
380.80 6.22 0.37
4100.94 6.32 0.37
5121.60 6.83 0.37
6142.26 7.34 0.37
7162.92 7.85 0.37
8183.58 8.36 0.37
9204.25 8.87 0.37
10224.91 9.38 0.37
11245.57 9.89 0.37
12 39.511.57 14.52 1.63
Where Hs and Tp are the significant wave height and peak period of an irregular wave.
Table 5. The main parameters for the 12 candidate platform models.
Model/ParameterDisplacementhd1d2dPlatform MassPlatform CM
(m3)(m)(m)(m)(m)(Ton)(m)
M17627.55 100.00 11.93 14.22 10.00 7097.33 −79.63
M28430.45 85.00 11.93 15.34 10.00 7920.31 −69.22
M39634.80 70.00 11.93 17.12 10.00 9154.77 −58.26
M411,240.60 55.00 11.93 19.98 10.00 10,800.71 −46.74
M57627.55 100.00 8.85 11.75 6.00 7097.33 −81.56
M68430.45 85.00 8.85 13.09 6.00 7920.31 −70.45
M79634.80 70.00 8.85 15.14 6.00 9154.77 −58.99
M811,240.60 55.00 8.85 18.33 6.00 10,800.71 −47.15
M97627.55 100.00 6.80 10.30 2.00 7097.33 −82.71
M108430.45 85.00 6.80 11.81 2.00 7920.31 −71.18
M119634.80 70.00 6.80 14.06 2.00 9154.77 −59.43
M1211,240.60 55.00 6.80 17.46 2.00 10,800.71 −47.40
Table 6. Comparison of the natural frequencies of the model M1, M5, M9, and OC3-Hywind between spreadsheet calculation and numerical simulation.
Natural FrequenciesUnitM1M5M9OC3-Hywind
Cal.Sim.Cal.Sim.Cal.Sim.Cal.Sim.
Surge Hz-0.006-0.007-0.008-0.0085
HeaveHz0.0320.0320.0320.0320.0330.0330.0320.033
PitchHz0.0230.0210.0290.0270.0330.0350.0330.032

