1. Introduction
A continually growing power demand since the beginning of the 21st century should contribute to the rapid development of electricity generation and transmission infrastructure. However, changes in this branch of industry are taking place surprisingly slowly. This problem is particularly evident in developing countries, such as Poland.
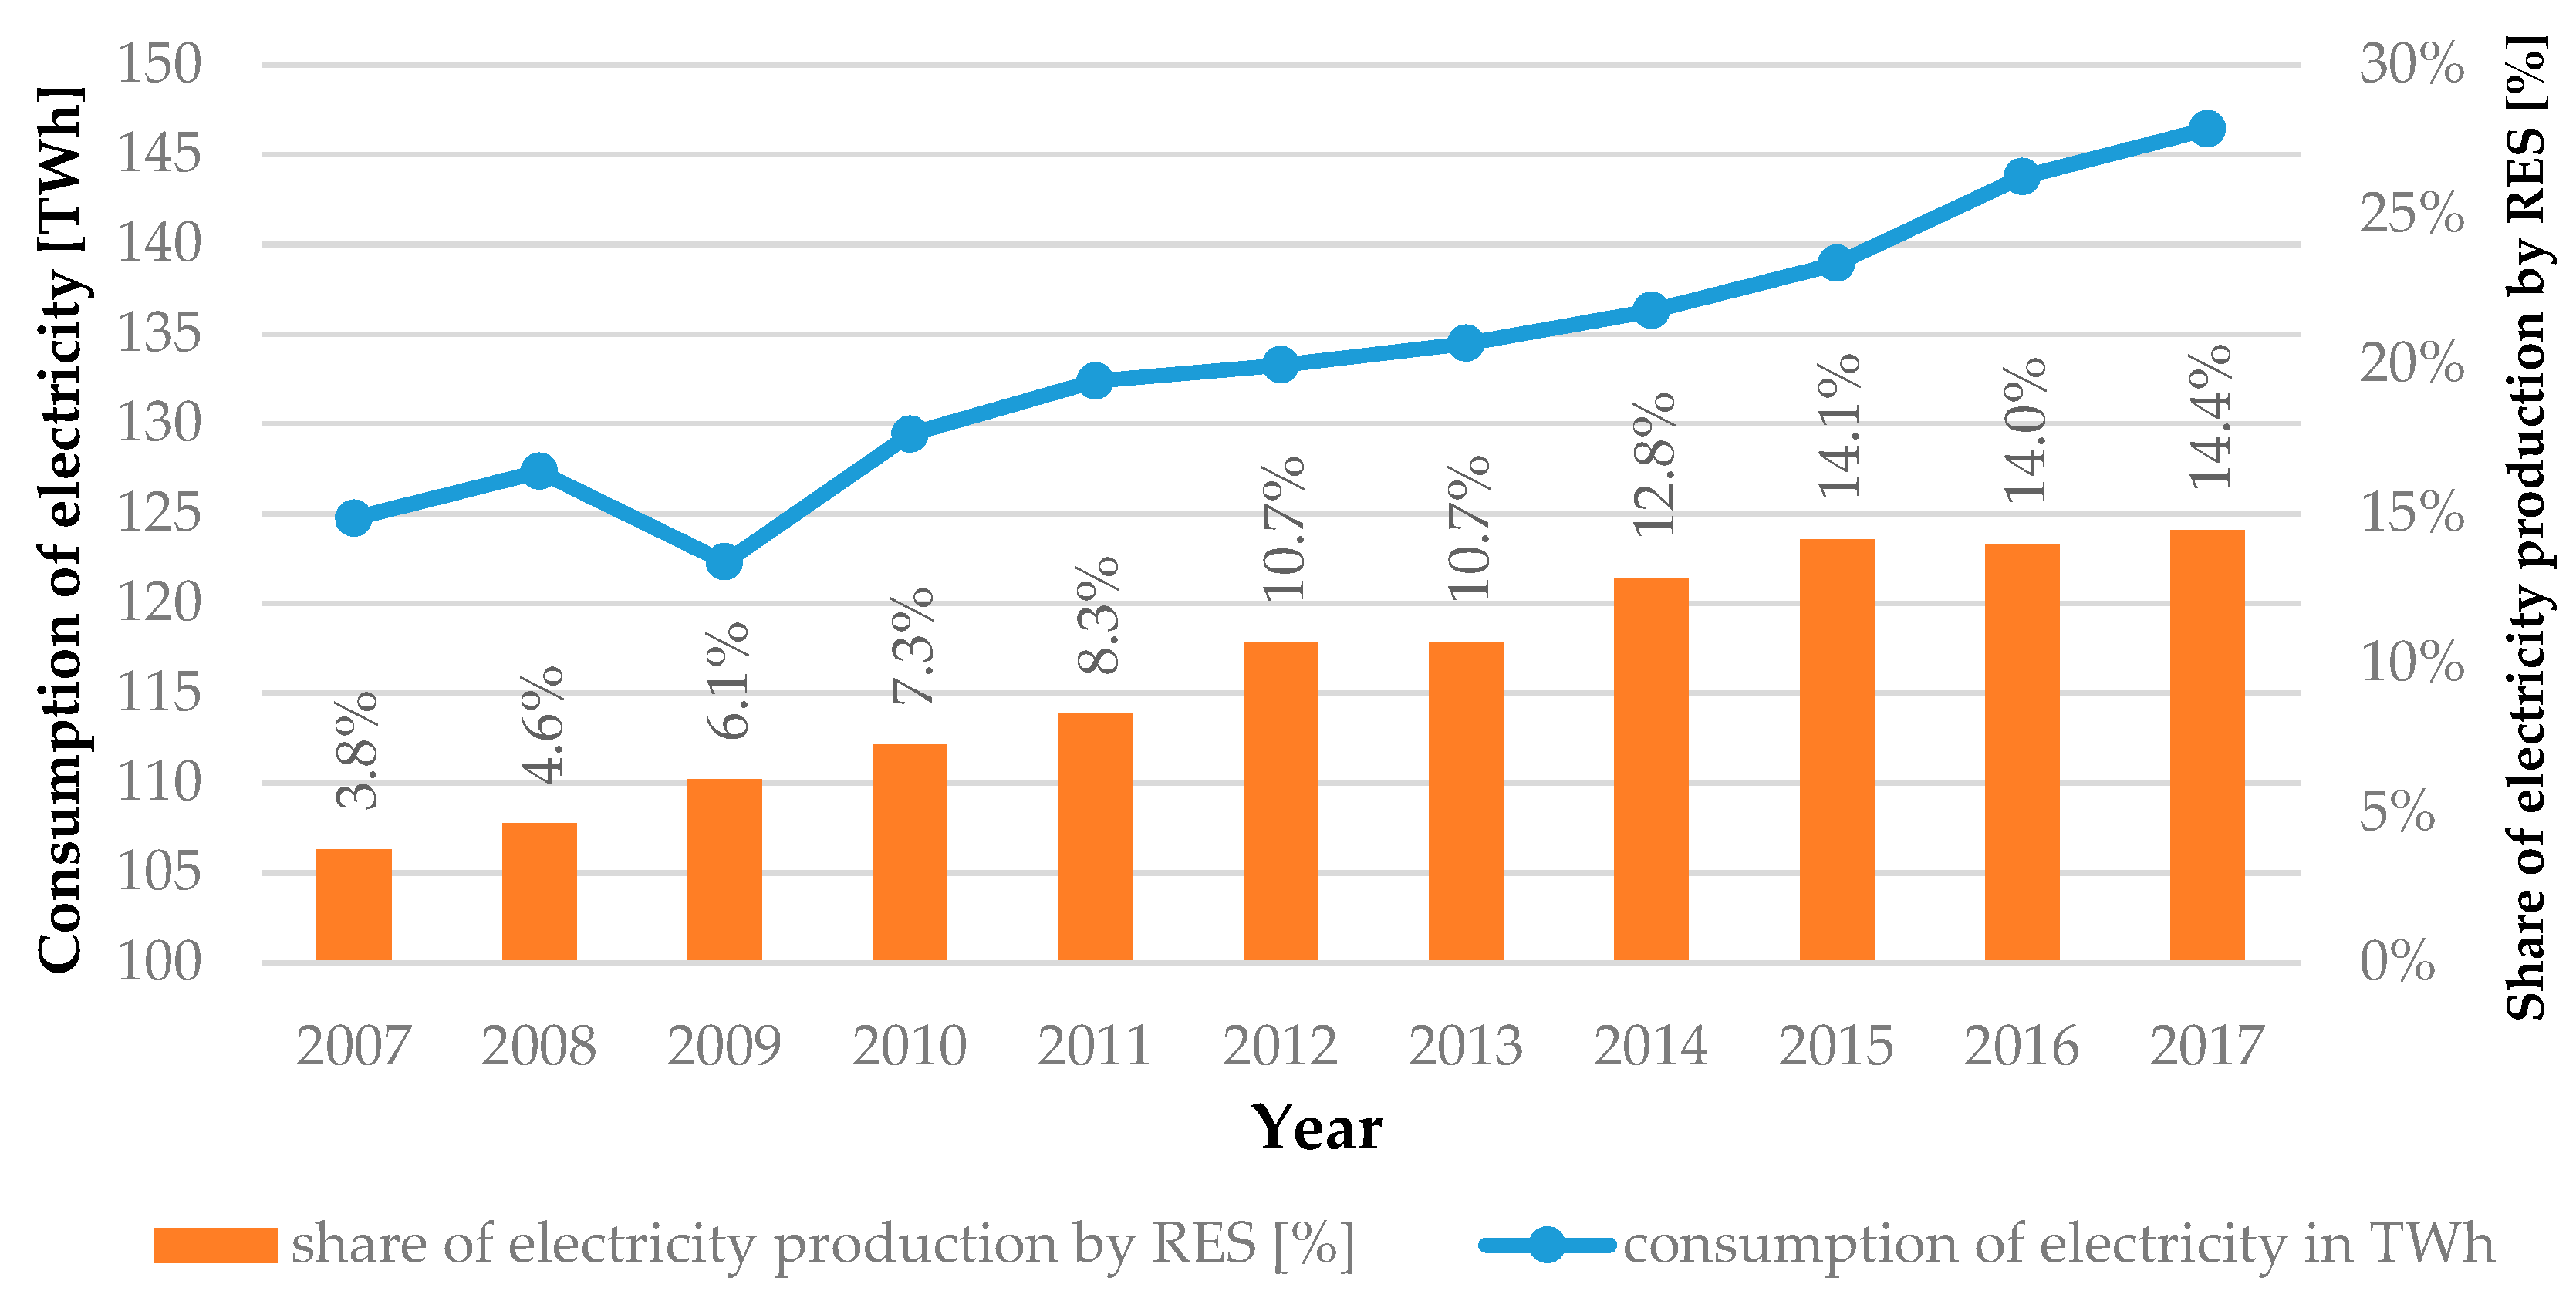
Figure 1 shows the increase of the electricity consumption and the share of the renewable energy in the energy production in Poland. It was not until the last decade that we have been able to observe increased efforts in respect of widely understood progress in the electric power industry. Currently, outdated power systems of most developing countries are suffering from a number of problems, such as low efficiency, high energy consumption, poor integration of renewable energy sources, a small possibility to control the demand side (DSR—Demand Side Response), and many others [
1]. Using the experience of countries, such as Denmark, Germany, or the United Kingdom (UK), who have each undergone a significant transformation of energy systems, can solve most of these problems.
The solutions to the problems of the electric power system are computerization and automation. The term Smart Grids (SG) was defined amongst other by IEC and reads, as follows [
3]: ‘electric power system that utilizes information exchange and control technologies, distributed computing and associated sensors and actuators, for purposes, such as:
—to integrate the behaviour and actions of the network users and other stakeholders, and
—to efficiently deliver sustainable, economic and secure electricity supplies’.
The SG-type networks usually have the nature of a distributed network. Therefore, with the development of SG, new possibilities of efficient energy management (EMS; Energy Management System) emerged.
Currently, the EMSs are mainly concentrating on an improvement of the energy efficiency of the whole system, without paying attention to residential end user. With the progress of computerization, the EMSs amass and process increasing amounts of data that are necessary for decision-making. Additionally, these data belong to many categories, such as: energy performance (i.e., power demand; production capabilities), or infrastructure-related data (i.e., building data, geographical data, etc.). Therefore, the development of a new model that facilitates the description of a residential user as an EMS-controlled element is becoming a challenge [
4,
5].
Current energy management research reveals the use of a semantic web for tackling these energy management challenges. Since the beginning of the current decade, the Semantic Web technologies have been used for development of ontologies representing energy data for different levels of detail and different end uses. These systems are implemented in different SG scenarios: smart homes, urban environments (i.e., building, district, city, etc.), virtual power plants (VPP), and demand side management—Demand Response (DR) [
1].
Generally, ontology is an explicit formal specification of how to represent the objects, concepts, and other entities that are assumed to exist in some area of interest and the relationships that hold among them:
A language of ‘sets’
There are typically three different levels to the content of an ontology: taxonomy of concepts, an internal concept structure, and the relationship between concepts and explicit axioms that define restrictions for relationships and properties [
6].
Ontologies are currently used in many different research projects. The ThinkHome ontology [
7,
8] contains data on electricity consumption and production and information about the weather and the energy class of the building. The SAREF4EE ontology [
9] allows for the collection of data on equipment in electrical devices, the size of the house, and environmental conditions. The BOnSAI ontology [
10] focuses on data on home furnishings, building construction, users, and the energy class of the building. The ProSGV ontology [
1] is designed for such complex Prosumer oriented SG, which enables the autonomous integration and real-time management of distributed and heterogeneous sources. The DEHEMS [
11] is a European Union (EU) funded initiative to influence the energy consumption behaviour of household by providing the advice on efficient energy consumption and visibility to their energy consumption data. The SUMO [
11] is an upper foundation ontology that could be used by variety of problem solving programs and is owned by the IEEE. The DomoML-env ontology [
12] focused for human home interactions aims to connect household appliances to each other, to exchange their services and information, and to overcome or extend their individual capabilities.
Table 1profiles selected ontologies. The profile takes into account mainly the level of detail of a described field of knowledge. The three levels of detail have been adopted [
6]:
high (+++)—the ontology contains many different terms arranged in an expanded hierarchy of categories
medium (++)—the ontology contains many different terms arranged in less expanded hierarchy of categories
low (+)—the ontology contains a few terms and categories.
Table 1 indicates that a given field of knowledge can be represented to a different degree in accordance with needs. Therefore, there is a need for unified energy ontology that can be used in many scenarios of individual end user behavior [
6,
11].
Despite the innovative content of the articles that are described in
Table 1, there is no ontology that explicitly focuses on household energy consumption in developing countries. The authors of the article modeled mainly on the ThinkHome [
7,
8] and ProSGV [
12] ontologies, which supplements them with information specific to Polish households.
In future, this customer (especially an aware user of electrical energy) might become a Prosumer. The Prosumer blurs the line between the producer and the end user of electrical energy. It forces a two-way flow of electricity in the power system, which was created to send energy in one direction (from the energy producer to the end user). As in the case of end users of energy, there are both business (industrial or services companies) and residential Prosumers. The Prosumer’s priority is to produce energy for their personal use, and only then to supply the energy that is produced into the power grid. Therefore, it seems extremely fundamental to develop a model that facilitates the specification of the Prosumer’s power needs and production capabilities [
13].
The impact a residential end user has on the workings of the electric power system is slight; however, it should be realized that there is a large number of final customers who might become Prosumers in the future.
This document is organized as follows:
Section 2 shows the energy profile of households in Poland;
Section 3 presents differences between Polish and EU households;
Section 4 describes the ontology, which was used in the
Section 5; finally,
Section 5 presents the conclusions.
2. Household Profile in Poland
In 2018, there were 13.3 M households in Poland. Over 50% of them had an area not exceeding 60 m
2 and a volume of up to 200 m
3, in which most often 2–3 individuals lived (
Figure 2). Over the last decade, it could have been seen that newly built flats are consistently increasingly bigger than existing, whereas the average number of members in a household is decreasing [
14].
The household electricity demand profile was derived from the Eurostat guidelines—Manual for statistics on energy consumption in households” (MESH) and on the data from Statistics Poland. The appliances were broken down into six groups [
15]:
equipment for heating rooms;
equipment for heating water;
equipment for cooking food;
equipment for cooling rooms;
lighting, household appliances and electronic goods; and,
other, not mentioned in the other groups.
Five point three percent (5.3%) of flats are equipped with room heaters. By reason of significant costs and high availability of other energy vectors (especially coal), heating with the use of electrical equipment is not used in Poland on a large scale. The electrical heating equipment mainly serves as supplementary sources of heat or are used where no other type of heating can be used. However, attention should be paid to the fact that electrical floor heating has become increasingly common in bathrooms of new flats [
14].
Electrical equipment for heating water (water heaters, boilers) are installed in 23.5% of households. The number of this equipment has not been decreasing in recent years and its average age is nine years [
14].
Figure 3 illustrates the breakdown of equipment for cooking food. The data indicates that there is at least one item of electrical equipment for cooking food in most flats. A steady increase in households equipped with a microwave oven as the alternative appliance for heating up food is also noticeable.
Less than 0.5% of households are equipped with air conditioners, but the number has been significantly increasing in recent years, primarily out of newly built higher end flats. Mostly, these items of equipment are intended for cooling single rooms. Only 0.04% of flats are equipped with multi split air conditioning.
The penultimate group includes lighting equipment, electronic goods, and household appliances. The average power of installed light sources (including also energy-saving fluorescent and LED sources) in a flat was 550 W in 2018. Knowing the average power of the installed light sources and the average area of flats, it is possible to calculate the power indicator of installed bulbs per flat area—this indicator was 7.2 W/m
2 in 2018. These values are much lower than in the Western European countries. The profile of the most common electronic goods and household appliances is illustrated in
Table 2, from which it appears that this equipment was marked with an A-class energy label in at least 50% of the case [
14].
The other electrical equipment (such as: a lawnmower or a pool heater) constituted a marginal share in the consumption of electrical energy in households and they were omitted from the profile discussed.
3. Households in Poland Compared to the EU Countries
The number of households in Poland accounts for 6.4% of total households in the EU countries. The average number of members in a household in Poland is 2.8 (a similar quantity is recorded in Cyprus, Ireland, Malta, Romania, and Slovakia) and it was higher than the EU average of 2.3 members. The lowest average number of members in a household was recorded in Sweden (1.9 members) and Germany (2 members) [
16,
17,
18,
19].
In
Table 3, selected energy indices for the EU countries are juxtaposed. By analysing the consumption of electrical energy in each of the countries, it can be noticed that [
14,
16,
17,
18,
19]:
electricity consumption in 2015 by the whole Polish economy amounted to 139 TWh and is compared with electricity consumption by German households,
Spain—which is comparable in terms of population—consumes annually 2.5 times more energy in households than Poland,
in Poland only 8% of the electrical energy consumed annually is used for heating, whereas the average in the EU amounts to 20.3%. In Central Europe, only Germany (6.4%) have a lower share of consumption of electrical energy for heating flats. Percentage shares in the Czech Republic and Slovakia is 17.6% and 9%, respectively. The EU country with the largest share of consumption of electrical energy for heating is Sweden. This is mainly a result of the climate conditioned by geographical location,
electricity consumption per household in Poland (2147.17 kWh/household) is one of the lowest in Europe—it is nearly two times lower than the EU average (3921.74 kWh/household), and
the total consumption of energy for heating and hot water in Poland (1.0 toe/ household) is lower than the EU average (1.12 toe/flat) and the lowest in Central Europe. By reason of the climatic conditions, the countries of the south of Europe are characterised by a lower electrical energy consumption index for heating purposes and for heating water.
As a result of the analysis performed, it can be deduced that households in Poland are characterised by relatively low consumption of electrical energy when compared to the EU countries. The main reason for this is that no significant share of electrical energy in the production of heat for households. In the years to come, this index should remain on the increase (
Figure 2) as the amount of electrical equipment, mainly low-power equipment (consumer electronics, e.g., computers), in flats is constantly increasing.
One of the priorities of the European Commission is to also improve energy efficiency in respect of consumption of energy by residential end users. The Commission of the European Union is monitoring the implementation of adopted climate and energy policy in the Member States, e.g., by publishing the indices colloquially referred to as Europe 2020. One of the most significant indices for the sector households is the energy efficiency index for households. In Poland, it is 76% and is 5% lower than the average of the EU countries. This results from the replacement of obsolete household appliances and electronic goods by newer and energy-saving ones, and that LED-type light sources are becoming increasingly popular. On the other hand, the emissions of CO2 per flat in the country are approx. 25% higher than the EU average and they amount to 2.47 tCO2 per year. The relatively high value of this index is the outcome of the national energy mix, which mainly relies on fossil fuel (hard coal and brown coal).
As a result of the data shown, it can be deduced that a Prosumer might be an important element in the expansion of the SG.
4. Ontology Description
Creating an ontology that places a residential end user’s energy performance in the central point is an extremely difficult task and it requires the resolution of many problems. Such an ontology should be characterised by high flexibility as the Prosumer’s environment is subject to constant changes. The following are changing [
20]:
technologies of production, use and accumulation of electrical energy for the needs of a residential customer,
methods for transmission and collection of IT data about the Prosumer’s micro-grid,
methods for control and automation of the Prosumer’s micro-grid,
electromobility-related (e-mobility) technologies are being developed dynamically, of which the V2G (Vehicle to Grid) technology seems to be highly promising,
technologies related to electrical energy management in the Prosumer’s micro-grid, and
methods for measurement of consumption and of quality parameters of electrical energy.
Figure 4 illustrates the simplified micro-grid of a residential Prosumer. From the SG’s perspective, this is an object characterized by three basic features, such as:
volume of electrical energy consumption (electrical equipment),
electrical energy production capabilities (electrical energy production equipment),
electrical energy accumulation potential (energy storage bins).
Therefore, the three main categories of equipment should be distinguished and categorized:
equipment consuming electrical energy,
equipment producing electrical energy, and
energy storage.
The first category is electrical equipment with which the Prosumer’s domestic micro-grid is equipped. This group is quite numerous, and
Figure 5 illustrates the simplified taxonomy of equipment. The electrical equipment was broken down into a number of subgroups depending on the intended use of an equipment item. Every item of equipment consuming electrical energy is described with at least the two features: installed power expressed in watts [W] and this item of equipment estimated working life during the day expressed in hours. Furthermore, the set of features of an equipment item can be extended to include information from the EU energy label if a given item of equipment bears such a label. This information is taken from the EPREL (European Registry for Energy Labelling) database, as on 1 January 2019 new requirements for energy-consuming equipment took effect. Every EU market product that is to bear an energy label must be previously registered in EPREL). The requirements related to energy labelling for particular groups of products are formulated according to the EU framework Regulation on energy efficiency labels (2017/1369). The product groups subject to obligatory registration in EPREL which have been placed on the Community market are the following [
21]:
air conditioners,
lighting,
televisions,
refrigerator and refrigerator/freezer side-by-side,
(household) dishwashers,
(household) washing-machines,
driers (combined washer-driers, clothes-dryers),
hoods,
ovens,
hot-water tanks and heater packages with solar panels,
professional refrigerators,
ventilation units,
solid-fuel boiler and their packages, and
heaters—including local space heaters (air heaters, solid-fuel heaters) and multifunctional space heaters and their packages (boilers, combined heat and power, heat pumps), also water heaters.
Account should also be taken of a changing trend as regards vehicle drive systems. Households are increasingly considering the purchase of an electric drive vehicle. This fact, in turn, contributes to a considerable modification in the end user’s energy profile [
22].
The consumption of electrical energy in a domestic micro-system is affected not only by the technical parameters of electrical equipment and electric vehicles, but also by the method of their use. An example of an item of equipment used by all of the household members is a fridge or a television, whereas a hair straightener or a game console might only be used by one of the household members. The ontology should categorise electrical equipment users and assign selected qualities to them, such as: user type (a(n) group or individual user, age, sex…) [
11].
By means of this created ontology, relations between the household members and electrical equipment in the household can be established.
Figure 6 illustrates an example of such a relation.
The second category of equipment is backyard electrical energy production systems. This group can be broken down according to natural resources (non-renewable and renewable resources), which are used for electrical energy production.
Figure 7 illustrates the simplified taxonomy. For reasons of rapid development of technologies taking advantage of renewable energy sources, mainly solar energy, the proposed ontology should include an ontology that is related to weather forecasting, e.g., WeatherOntology.owl [
8].
The last category of equipment is equipment related to the storage of electrical energy. There are at least a few methods for the storage of energy, but for reasons of costs and technical constraints, not all of them are available to every Prosumer. Currently, large-scale work is underway on the industrial storage of electrical energy in the form of:
The aforementioned technologies are not used in Prosumers’ micro-systems. Now, the most favorable technology of accumulation of energy by Prosumers is batteries produced with the use of different technologies, such as: Lithium batteries, Sodium-sulfur batteries (NaS), Lead-acid batteries, Flow batteries, or Nickel batteries [
23,
24].
A specific subcategory of the energy storage facility category may be electric vehicles (EV) taking advantage of the Vehicle to Grid (V2G) technology. The V2G technology facilitates the participation of electric vehicles (EV) in an energy exchange with the SG. As a result of the V2G technology, the vehicles can use their batteries to provide systemic services, such as the reduction of 24-h load unevenness [
25,
26].
It should be noticed that the above description is only a part of the ontology being discussed. Complements are the types of data related to infrastructure, the quality of energy supplied, and to the energy management system.
Figure 8 illustrates a general diagram of the ontology. The authors realize the incompleteness of the ontology and the necessity to expand it to include further categories and subcategories through the integration with other ontologies.
Figure 9 illustrates this process.
The development of ontology should include the following processes: Identification of the Ontology’s Purpose, Ontology Development (Ontology Capture, Ontology Coding, Integration of Existing Ontologies), Ontology Evaluation, and Ontology Documentation [
27].
5. Application of the Proposed Ontology
The shown example is simplified and it relates to a possibility of using the ontology discussed for identification of the needs of future Prosumers from the perspective of a 250 kVA 15/0.4 kV transformer station relying on the real measurement whose results are provided in
Figure 10. The example only concentrates on the modification of the existing energy model of a part of the grid to include a new category of equipment, which is the electric vehicle. By reason of the relatively wide popularity of the Nissan leaf 2016, this car’s parameters were used to perform the analysis below. This car has 30 kWh batteries installed, with a charging time of 0–80% being approx. five hours with a 6.6 kW on-board charger [
26].
Twenty (20) urban customers are connected to this station. According to
Figure 10, all of the phases are approximately equally loaded, however a higher load of the second phase than of the other phases can be noticed between 11:00 p.m. and 3:00 a.m. Using the database, calculations were performed, whose results are provided in
Figure 11. The comparison of the impact of charging vehicles at night, during the day and in the evening on the 24-h load was made, if 10% and 25% of those connected to this station are charging their vehicles.
According to
Figure 11a, the given station is not heavily loaded if no electric vehicles are being charged—the maximum consumed active power is only 120 kW during the evening peak (07:00 p.m.). The minimum load occurred at 06:00 a.m., with a value that was equal to 30 kW. The total power of the station was calculated as the sum of power at each phase, treating the station as an asymmetrical receiver. The variant illustrating charging vehicles at night (
Figure 11b) was performed when the station load is the lowest, i.e., 02:00 a.m.–06:00 p.m. When 25% of the customers begin to charge their vehicles, the maximum consumed power will amount to no more than 125 kW, i.e., like during the evening peak without electric vehicles, when 10%—the power during charging will oscillate below 80 kW. It can be observed that active power demand has significantly increased; however, in the case of distribution of charging by the users throughout the night, this should not cause any unwelcome effects.
The situation completely changes when the customers would like to charge their vehicles in the morning (
Figure 11c). For 10% of the customers, the power values will not exceed 145 kW, so the power demand is not relatively much higher. Also when 25% of the customers will be charging their vehicles, the power values will be maximally 189 kW.
Under the charts that are illustrated in
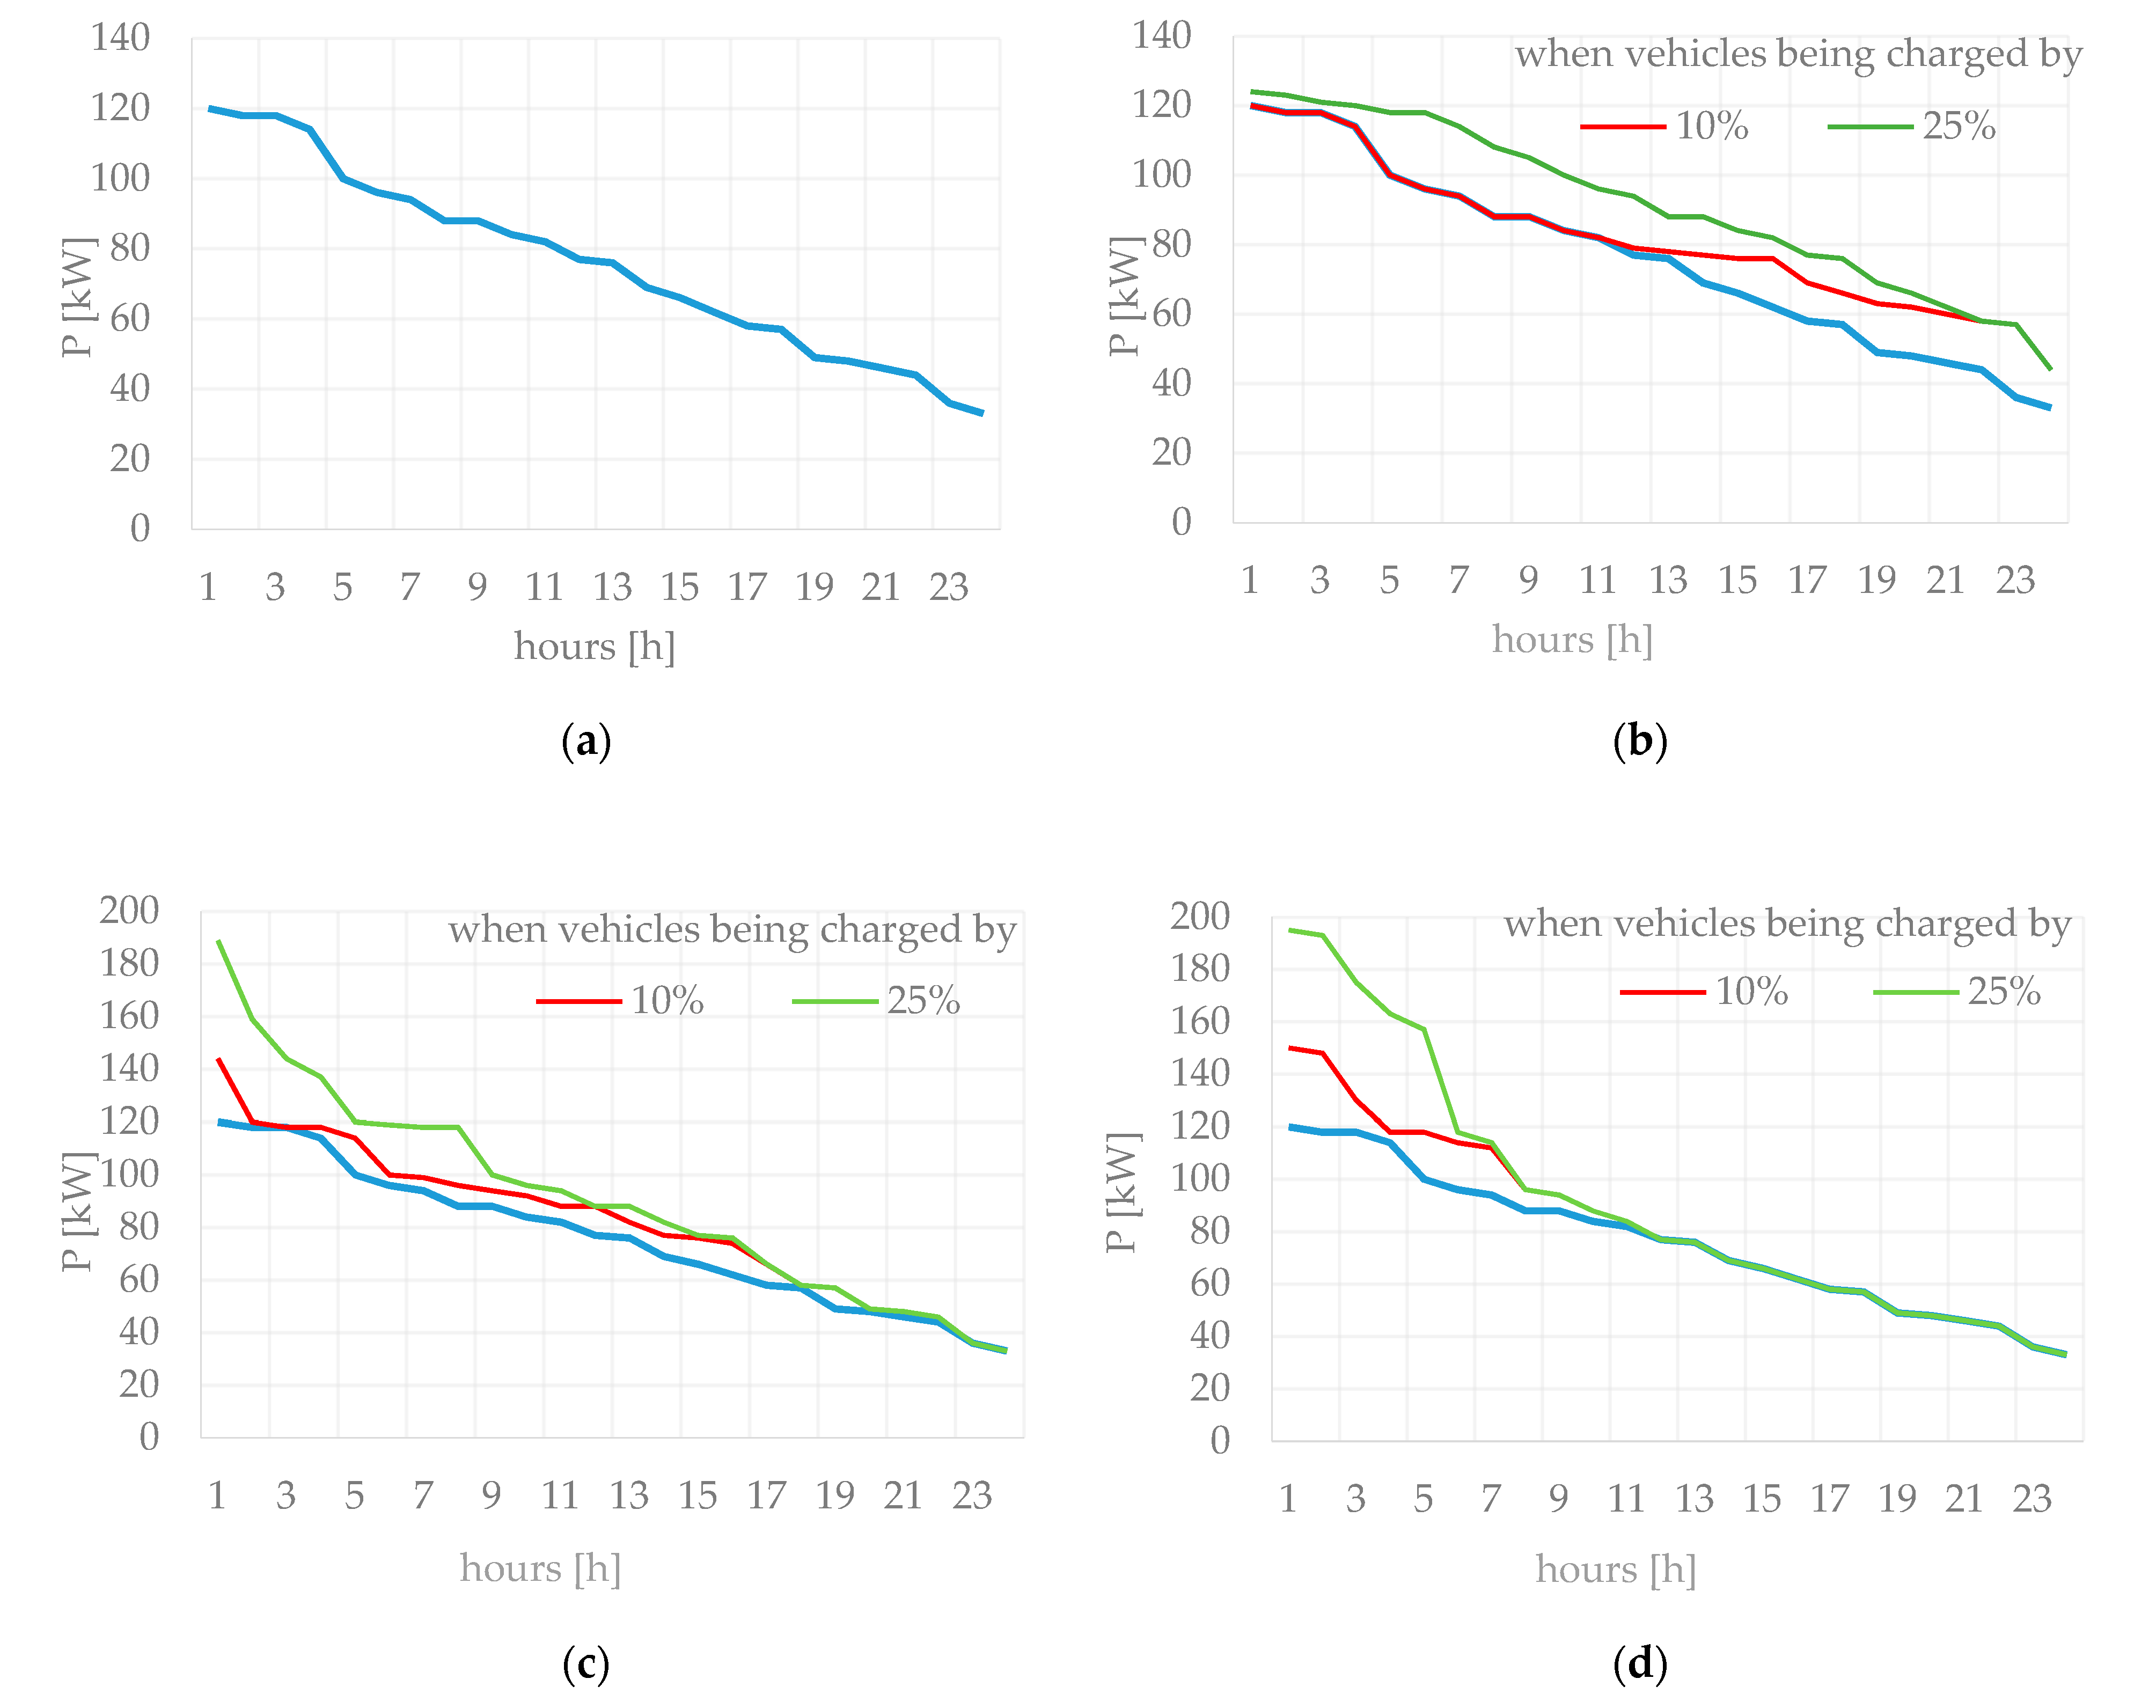
Figure 12, the load duration curves of the 24-h load of the given transformer station were prepared.
According to
Figure 12a, this grid is now unevenly loaded the whole day. The peak load of 120 kW lasts three hours. The most favorable variant, from the perspective of the transformer station, is the variant of charging vehicles at night by 10% of the customers—then the curve inclination is the smallest (
Figure 12b). It is best shown by the trend lines, plotted on the station load duration curve without electric vehicles, and when 10% of this station customers charge their vehicles at night. The direction component decreases by 22%, therefore this solution would have a positive impact on the levelling of the load during the day. The variant in which 25% of this station customers charge their vehicles at night also results in the levelling of the load, however to a lesser degree than in the case of 10% of this station customers.
Charging the vehicles both in the morning, and in the evening (
Figure 12c,d) bring about a significant increase in the diversification of the load duration curve and an increase in the maximum power values. It is an unfavorable situation from the perspective of the transformer station, as it requires modernization of the existing power infrastructure, starting from the expansion of electricity power lines, through the replacement of transformers, to the installation of additional high-power sources. However, it must be remembered that households only account for 20% of the overall consumption of electric current in Poland’s economic sectors, therefore an increase in consumed power at an appropriate level does not have to necessarily involve the installation of supplementary power units. These sources would be used in a short span of time, increasing the system power reserves in the remaining hours. A bigger difference between the power values during the day would imply the necessity to, even temporarily, come off the power units, which is tantamount to a significant increase in the costs of production of energy. Therefore, the levelling of the load during the day must be sought at any price.
Afterwards, calculations for a single customer in the urban area were performed based on the real measurements. Separate calculations were performed for a working day and for a non-working day (Saturday) for the following charging variants: at night, in the morning, and in the evening.
Figure 13 illustrates the results of the calculations performed for the working day.
Two pivotal moments can be noticed during the working day in this customer (
Figure 13a), the so-called morning peak (7:00 a.m.–8:00 a.m.), and evening peak (05:00 p.m.–09:00 p.m.), when an increase in consumed power is observed. The reason for this is the typical daily rhythm during the week for people who wake up in the morning, go to work, and then spend the evening at home, while using all sorts of appliances. By reason of so early evening peak, a conclusion could be drawn that the load measurement was performed in a winter month. The maximum active power consumed by this customer was 2.4 kW. Therefore, plugging in a vehicle for charging with the use of an on-board charger with an operating power of 6 kW implies a significant increase in power demand. According to
Figure 13b–d, it does not make much of a difference whether the vehicle will be charged at night, or in the morning. When charging the vehicle in the evening, the power consumed will exceed 8 kW. The charging price is of significance—if a customer would like to charge their vehicle at night, they would pay less than if they did it during the evening peak. The charging time for this charger is only five hours, however it should be borne in mind that in the case of lower power chargers or charging a vehicle straight from the socket, this charging time would be much longer. When charging a vehicle in the evening, a difference between the maximum and minimum load is over 8 kW, which, on a scale of a single customer, is a tremendous value. The difference is smaller if the customer would like to charge their vehicle at night—over 6 kW.
According to
Figure 14a, the 24-h load for a customer on the non-working day has certain differences when compared to the working day. First, the morning peak begins later and lasts longer (from 08:00 a.m. to 11:00 a.m.), and the power demand during these hours is higher than on the working day. The evening peak begins at the same time as on the working day and it lasts equally as long, however, higher power consumption is observed during the other hours during the day than on the working day.
The increased morning power consumption in normal mode while the vehicle is being charged will result in a significantly higher power requirement than during the working day (
Figure 14b). In principle, charging the vehicle in the morning and evening peaks do not differ in terms of the values of active power obtained—the consumed power exceeds a value of 8 kW in both of these cases (
Figure 14c,d).
Calculations were performed on the basis of data from section two (households) and by taking advantage of the ontology discussed in Section three. The calculations illustrate how charging the electric vehicle affects energy consumption by the typical household in Poland. According to the data from Statistics Poland, average annual mileage for an urban customer is 12,387 km, which gives 34 km a day. As the catalogue range of Nissan Leaf of 2016 is 250 km, it needs to be charged at least 50 times for the annual mileage given. During one full charging cycle, the electric vehicle consumes energy that is equivalent to the accumulator capacity, i.e., 30 kWh, therefore 1500 kWh needs to be designated within year for charging the electric vehicle. According to the data from Statistics Poland, the average annual consumption of electrical energy in 2018 was 2173 kWh.
Figure 15a illustrates how the consumption of electrical energy by the typical household is distributed, with a breakdown into appliances grouped according to the MESH simplified instructions. The household appliances, which generate as much as 65% of energy consumption, are composed of: refrigerator/freezer side-by-side, electric cooker, kettle, microwave oven, dish washing machine, and washing machine. Whereas, 20% of the annual power demand is designated for lighting. The last group is electrical goods composed of: radio receivers, television, and computer, which consume 15% of electrical energy in a household.
Figure 15b illustrates how the consumption of electrical energy by the typical household is distributed, including the electric vehicle. It can be observed that charging electric vehicles accounts for over 40% of the annual electrical energy consumption.
The results shown indicate that, by reason of an increase in power consumed by customers, the load of transformer stations on estates will also significantly increase. This might pose a great challenge for the stability of the electric power system. Uncontrolled charging of electric vehicles may involve grid, transformer, and system overloads. This implies the need of modernisation of the existing infrastructure, e.g., line repairs, the replacement of transformers, and the installation of supplementary manufacturing sources.
6. Conclusions
In this paper, we have presented an ontology proposal tailored to the conditions of the Polish household sector. The characteristics of households that we presented allowed for us to show differences in the manner and amount of electricity consumed between households in different parts of Europe. Electricity consumption by households in developing countries, such as Poland, is much lower than in highly developed countries, but it is steadily growing (
Figure 1). Therefore, the way of energy consumption and management in this sector of the economy becomes important. Based on the experience of highly developed countries and while taking into account the proposed ontology, it is possible to develop an effective way of managing energy in those places where it is possible. Effective management of micro-grid will primarily contribute to reduce the energy consumption of the entire household sector and to reduce greenhouse gases emitted by the Polish energy sector, in which 80% comes from coal power plants [
2].
The taxonomy that we have presented allows for us to change the perception of the end user in accordance with current trends in power system management. The end user can be seen as a prosumer as well as a user who can change his energy consumption profile, for example by changing his household equipment.
Changing the profile of electricity consumption by the final customer is described in
Section 4. The actual electricity consumption of a selected group of end users has been increased by the consumption of electricity intended for charging electric vehicles. The research shows that this change will cause significant fluctuations in the demand for electricity. In extreme cases, this demand might exceed the maximum load of the transformer in the selected area of the power grid. The energy management system should meet the requirements of end users while maintaining acceptable grid loads.
The created ontology encodes knowledge about electrical devices, energy sources, and energy reservoirs found in the household (microgrids), which makes it possible to create models for effective microgrid management. The presented results are the beginning of research aimed at improving the energy efficiency of the end user and checking the possibility of controlling such a grid from a higher level.


