1. Introduction
Considering that reliable energy transport is fundamental for on- and offshore infrastructures, the aspects of maintaining the quality control regulations for newly installed and service aged cable connections are of importance. As a result, important questions about maintaining/updating internal procedures for a reliable network operation are:
How to perform, in a sensitive and non-destructive way, the detection of poor workmanship defects of newly installed cable circuits?
How to perform non-destructive diagnostics of cable circuits in service to determine the actual condition?
Following present IEC standards for power cables [
1,
2,
3], the after-installation testing protocols for power cables are limited to manufacturer’s minimum recommendations and therefore do not cover the present needs to keep possible failure risk during operation as small as possible. As a result considering responsible operation and asset management of offshore power cables the following aspects have to be considered:
After installation, testing of newly installed cable systems to find:
Manufacturing related defects → due to the high level of quality control less probable;
Accessories parts delivery problems → due to the diversification in the supply chains more probable;
Installation related defects → due to the diversification in the installation supply chains highly probable.
Maintenance and diagnostic testing of cable systems in operation to estimate:
Operational damages and electrical and thermal over-stresses → cannot be neglected e.g., transients and over-voltages;
Aging processes → depends on many operational and local factors, e.g., presence of installation defects, load constriction or load increase works;
The remaining life → goal of most asset managers to keep capital expenditure (CAPEX) and operational expenditure (OPEX) on an optimal level.
Unfortunately, regarding testing of offshore power cables, parties involved are not aware of risk management of those cable circuits and in their testing, specifications are simply referring to IEC procedures to ensure their quality testing procedures. About 30 years ago these standards were introduced for onshore application by manufacturers only e.g., the IEC 60502, IEC 60840, and IEC 62067 [
1,
2,
3]. These cable manufacturers’ standards are extensively discussing the factory testing aspects. However, only basic tests for the after-installation test are mentioned. Furthermore, no guidelines are provided regarding the maintenance of cable circuits and maintenance/diagnostic testing. In contrast to the IEC standards, the standards IEEE 400 [
4] and IEEE 400.4 [
5] recommend partial discharge monitored testing, e.g., by continuous or damped AC voltages (DAC).
The number of onshore and offshore wind farms is growing worldwide due to the increase in demand for renewable energy. An important aspect of an offshore wind farm is the submarine or subsea cables. They play a vital role in bringing the generated power from the wind turbine to the offshore substation and eventually to shore. In case of damage to this critical infrastructure repairing any damages can be challenging and costly [
6].
In the past years, an average of at least 10 subsea cable failures is declared to wind farm insurers each year by the wind park owners. The financial severity of such a cable failure continues to grow. It is stated that the cable failures are accounting for 77% of the total global cost of offshore wind farm losses [
7]. Almost 70% of the cable faults recorded in the claims database can be attributed to contractor errors during installation. However, those errors do not always become evident until the wind farms start operations or are operational for a certain time.
As the development of (offshore) wind turbines results in the increase of the physical dimensions as well as the generating capacity, the operating voltage of export cables up to 230 kV and the inter-array cable up to 66 kV networks needs to be increased. Both voltage classes have their own technical challenges. Besides the difference in the network components, also the quality assessment of the installed cable systems is different. High voltage cable testing is among the challenges facing this relatively new part of the offshore wind farm industry.
Advanced risk management and quality control are becoming more and more important. The main challenge during the installation phase is to have specialized teams for cable installation and testing activities. To reduce possible risks or to exclude failures during operation, it is important that systematic testing and diagnosis is performed during manufacturing, transportation, installation, and operation. It has been noticed that the after-installation testing protocol for offshore wind farms is still under consideration. The current state of the international standards is not based on long term experiences as obtained in the offshore sector, but more or less a copy of existing onshore standards and recommendations. As a result, the provided solutions do not cover the actual problems experienced on inter-array cables [
6,
7].
Evaluating the risks and the obtained valuable experiences, it shows that the offshore industry needs to set up their own reliable specifications for submarine cable testing and diagnosis. The first steps for this are done, for instance, in the new published CIGRE Technical Brochure 722 and the upcoming IEC 63026. Unfortunately, a serious gap in those recommendations is present in the practical implementation regarding offshore after installation testing.
2. Integral Quality Fingerprint
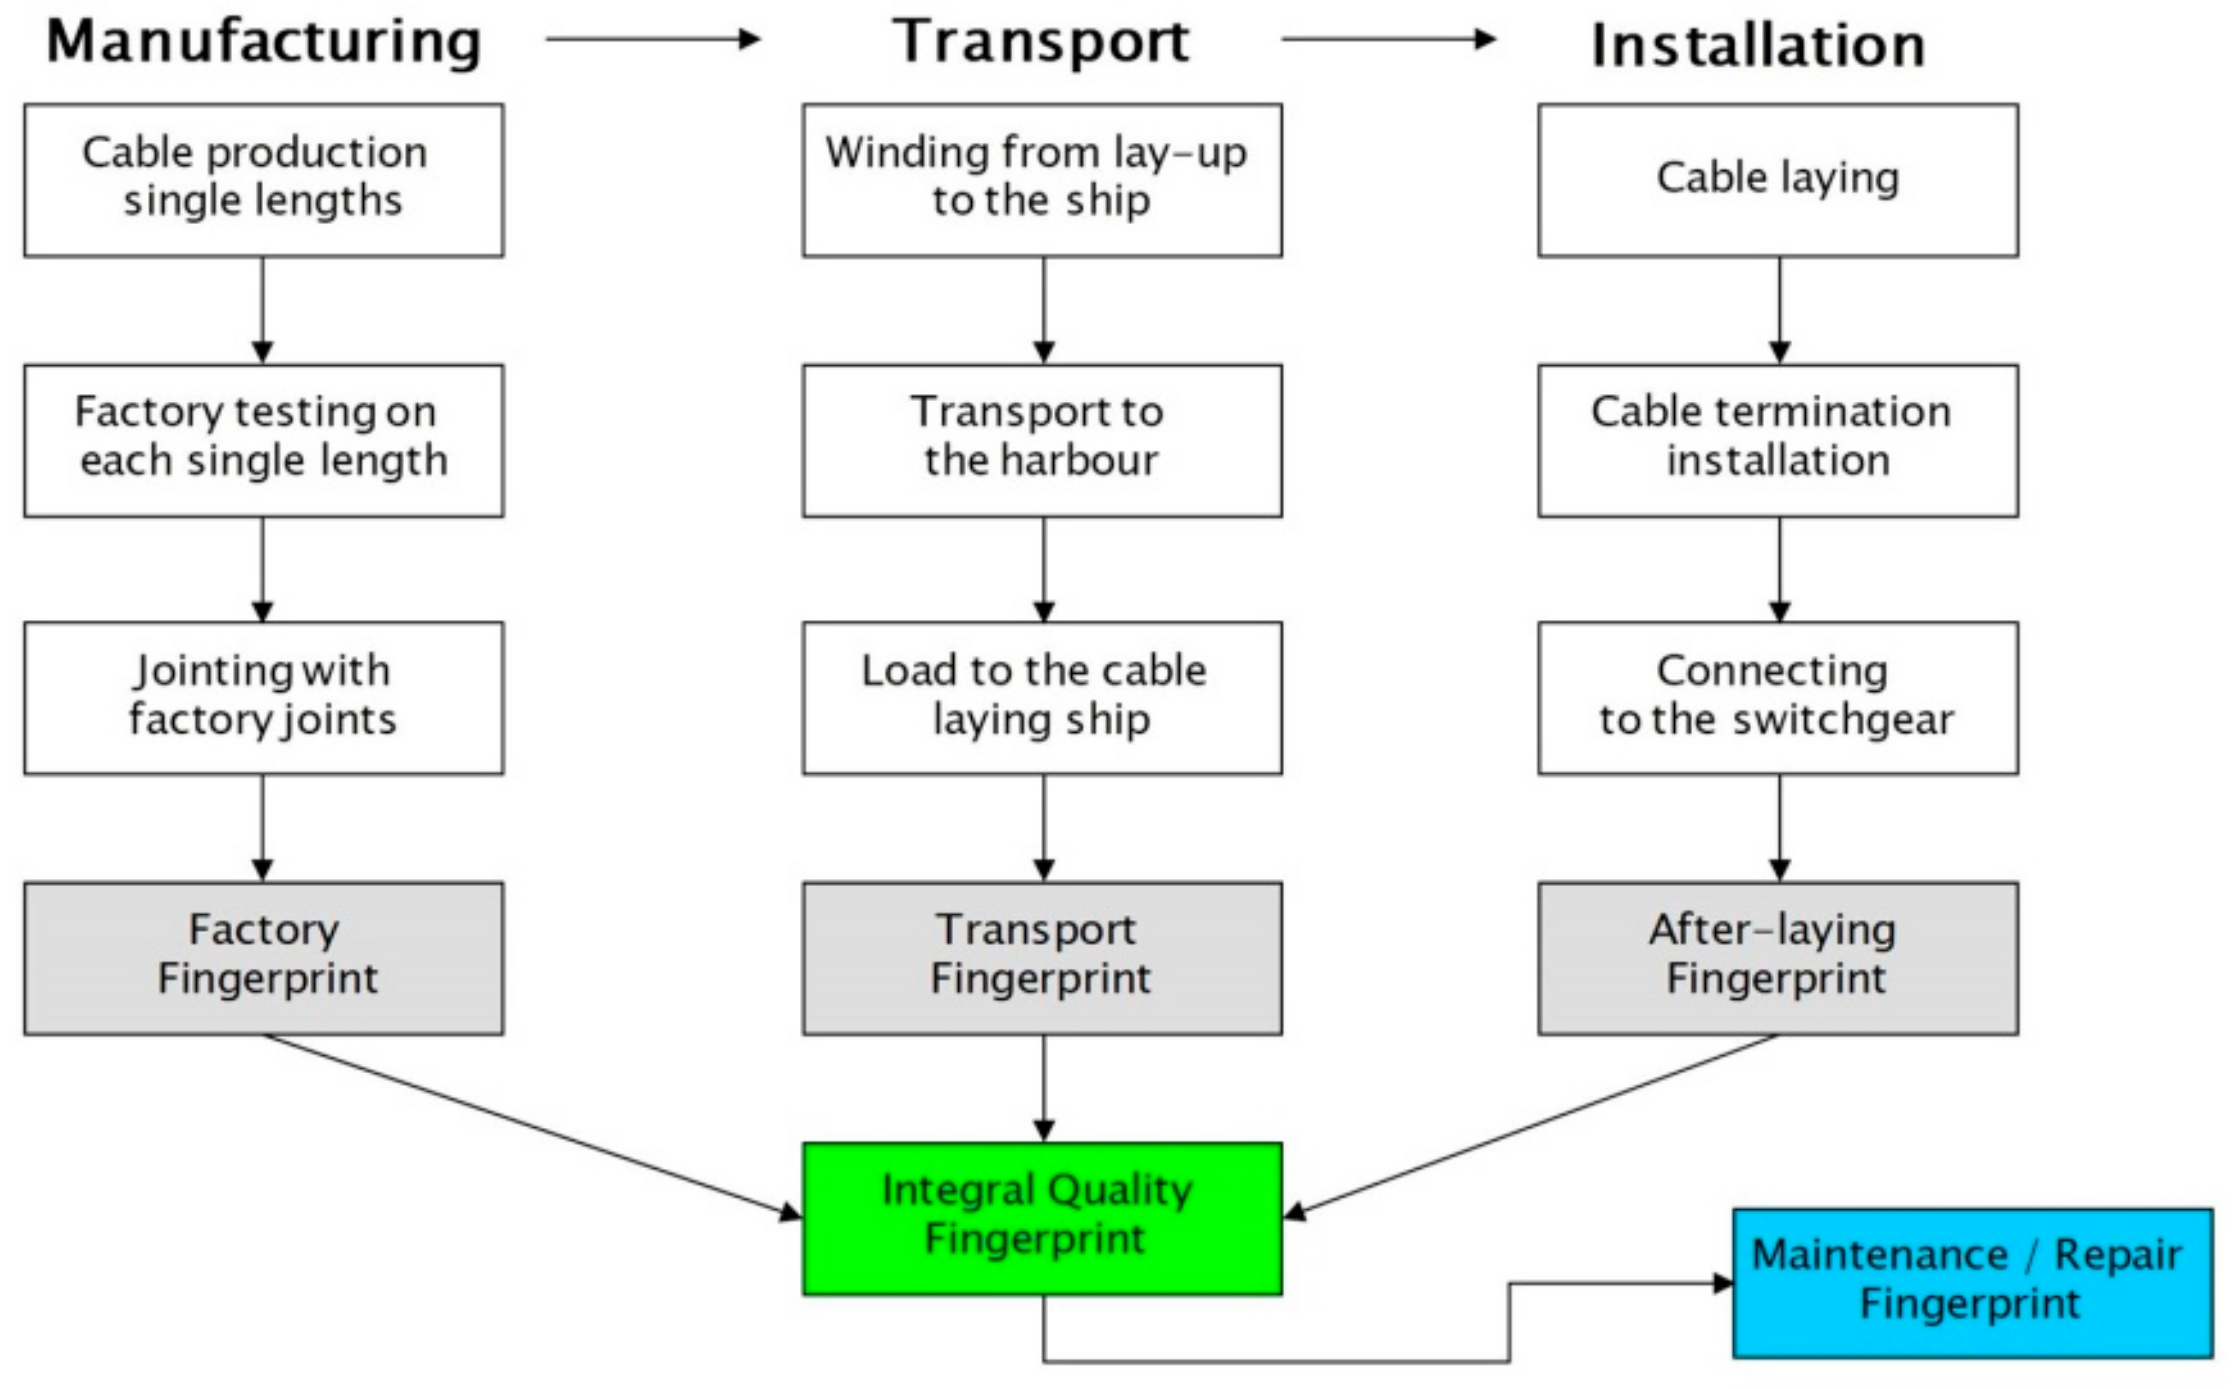
As offshore cables are often produced in very long lengths compared to onshore cables and a lot of typical handling is taken place from manufacturing up to the offshore installation, there are the risks of cable damages. Those can be related to manufacturing, transportation, and the installation stages of the cable. Therefore, there is a need to use an integral approach where the condition of the cables will be verified. Having such fingerprints as obtained during these stages, a comparison could be made to verify the cable quality. This can also be used as a good basis for the cable maintenance activity later on, see
Figure 1.
The applied technologies for such fingerprinting for quality control have to be suitable [
8,
9]:
For offshore testing, taking into account restrictions regarding e.g., size, weight, weather protection;
To provide adequate information: voltage testing and fingerprinting (e.g., partial discharges (PD) and dissipation factor (tan δ TD)) during the whole installation and operation process;
To ensure reliable operation of the submarine power cables;
To provide contractors the basis for lowering the risks during the warranty period;
To enable service providers during operation a good basis for condition-based maintenance.
Moreover, the criteria for the risk management for the contractor (e.g., 5-year warranty), system operators and insurers have to be related to the quality control system applied during construction. This means that the various testing techniques provided in the international standards differ significantly in the effectiveness of cable quality assessment after the installation. Therefore the indicated testing options could be classified in different warranty levels:
Soak Test ((non-) monitored): Due to lack of information about operational reliability = No warranty.
Non-monitored voltage withstand test only: due to showing extreme defects only = Limited warranty.
Monitored voltage withstand test (damped AC voltage (DAC) resp. AC Voltage test) with sensitive (PD, TD) fingerprinting: Providing complete information = Full warranty.
Several testing technologies are available to perform on-site testing of power cables. In
Table 1 an overview of several test techniques is given including weighting of important aspects. As can be seen from the table DAC monitored testing of offshore cables has several advantages.
3. Damped AC
Damped AC (DAC) is a technology that is already for 20 years commercially available for testing all types of distribution and transmission cables [
9,
10,
11,
12,
13,
14,
15,
16,
17,
18,
19]. With DAC it is possible to energize very long lengths of power cables with high capacitance, due to its low input power demand. Moreover this technology can be combined with diagnostic measurements like partial discharges (PD). Damped AC is applicable for factory PD monitored acceptance testing and it is already in use for on-site after-laying/commissioning, maintenance, and diagnostic testing. It is an approved testing methodology, in accordance with relevant testing parameters from international standards and recommendations (IEEE, IEC, and CIGRE).
3.1. DAC Principle
The application of damped AC (DAC) voltages including standardized conventional PD detection and analysis is accepted worldwide for on-site testing and diagnosis of (Extra) High Voltage power cables [
5]. The DAC technology has been first introduced on the Jicable conference in 1999 and is now already 20 years worldwide in use to test and diagnose MV and HV power cables [
19]. In addition to the equivalence of sinusoidal DAC voltages (in the frequency range of 20–300 Hz) compared to the 50/60 Hz network stresses, the characteristics of the applied technology meet the specification of modern on-site testing system:
Lightweight modular system;
Compactness in relation to the output voltage;
Low effort for system assembling;
Low power demand incl. long cable lengths;
Low level of EM noises and the possibility of sensitive PD detection and localization as well as dissipation factor measurements.
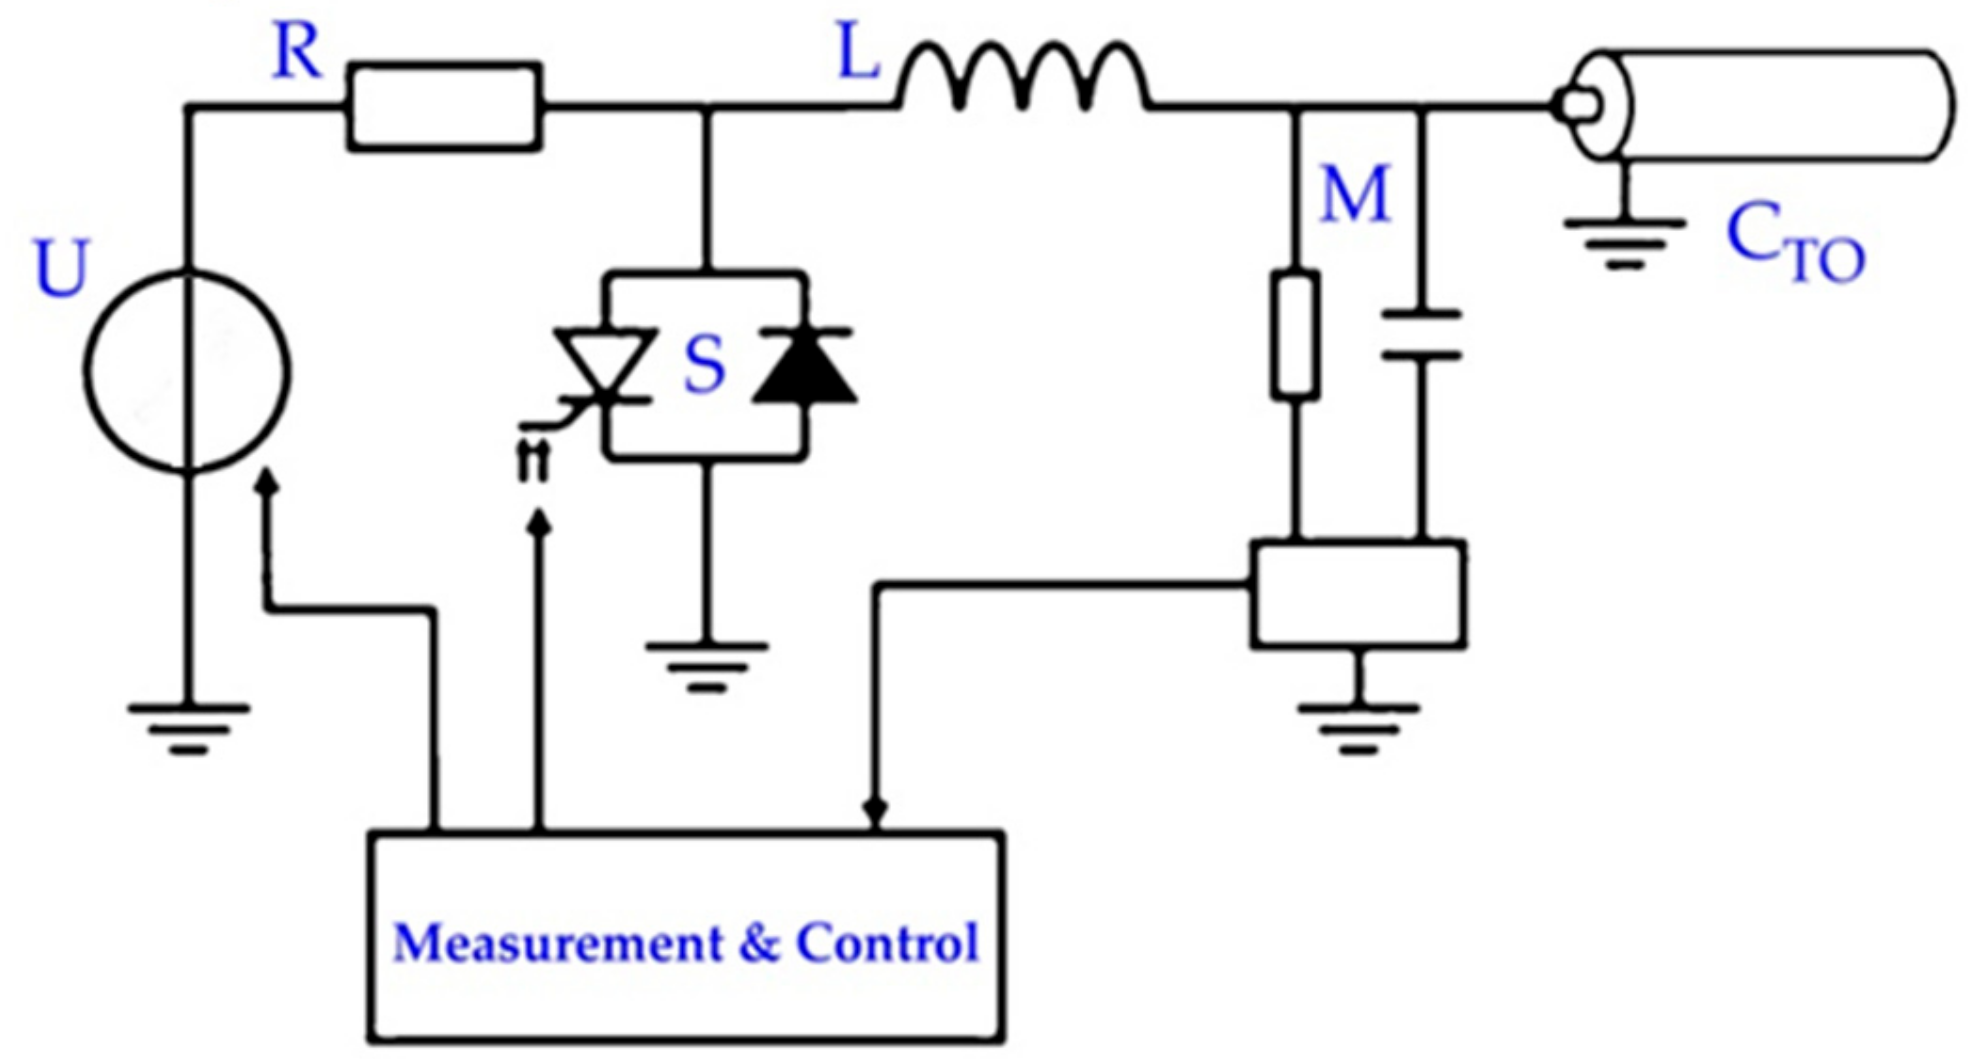
DAC testing is used almost always in combination with partial discharge (PD) and dissipation factor (tan δ TD) measurements for new installed and service-aged cables. The use of DAC voltages for testing power cables is in compliance with relevant testing parameters derived from IEC, IEEE, and CIGRE international standards and guidelines. The DAC method is used to energize and to test on-site power cables with sinusoidal AC frequencies [
5]. The system consists of a digitally controlled high voltage power supply to energize capacitive load of power cables with large capacitance (e.g., 10 µF), see
Figure 2.
The energizing time depends on the maximum available load current of the high voltage power supply, the test voltage, and the capacitance of the test object and has to stay below 100 s [
2]. During a number of AC voltage cycles (of several hundred milliseconds), the PD signals are initiated in a way similar to 50/60 Hz inception conditions [
5,
20,
21,
22]. In accordance with [
5], no DC stresses are applied to the test object, and the DAC stress can be considered similar to factory partial discharge testing conditions, i.e., a 50 Hz AC test combined with a PD measurement. Due to the continuous voltage increase and immediate transition to the DAC voltage after the maximum test voltage is reached, no steady-state condition occurs, and the low electric field strength in the insulation (typically <20 kV/mm), and short durations (less than a second up to tens of seconds) of bipolar stresses ensures no space charge accumulation.
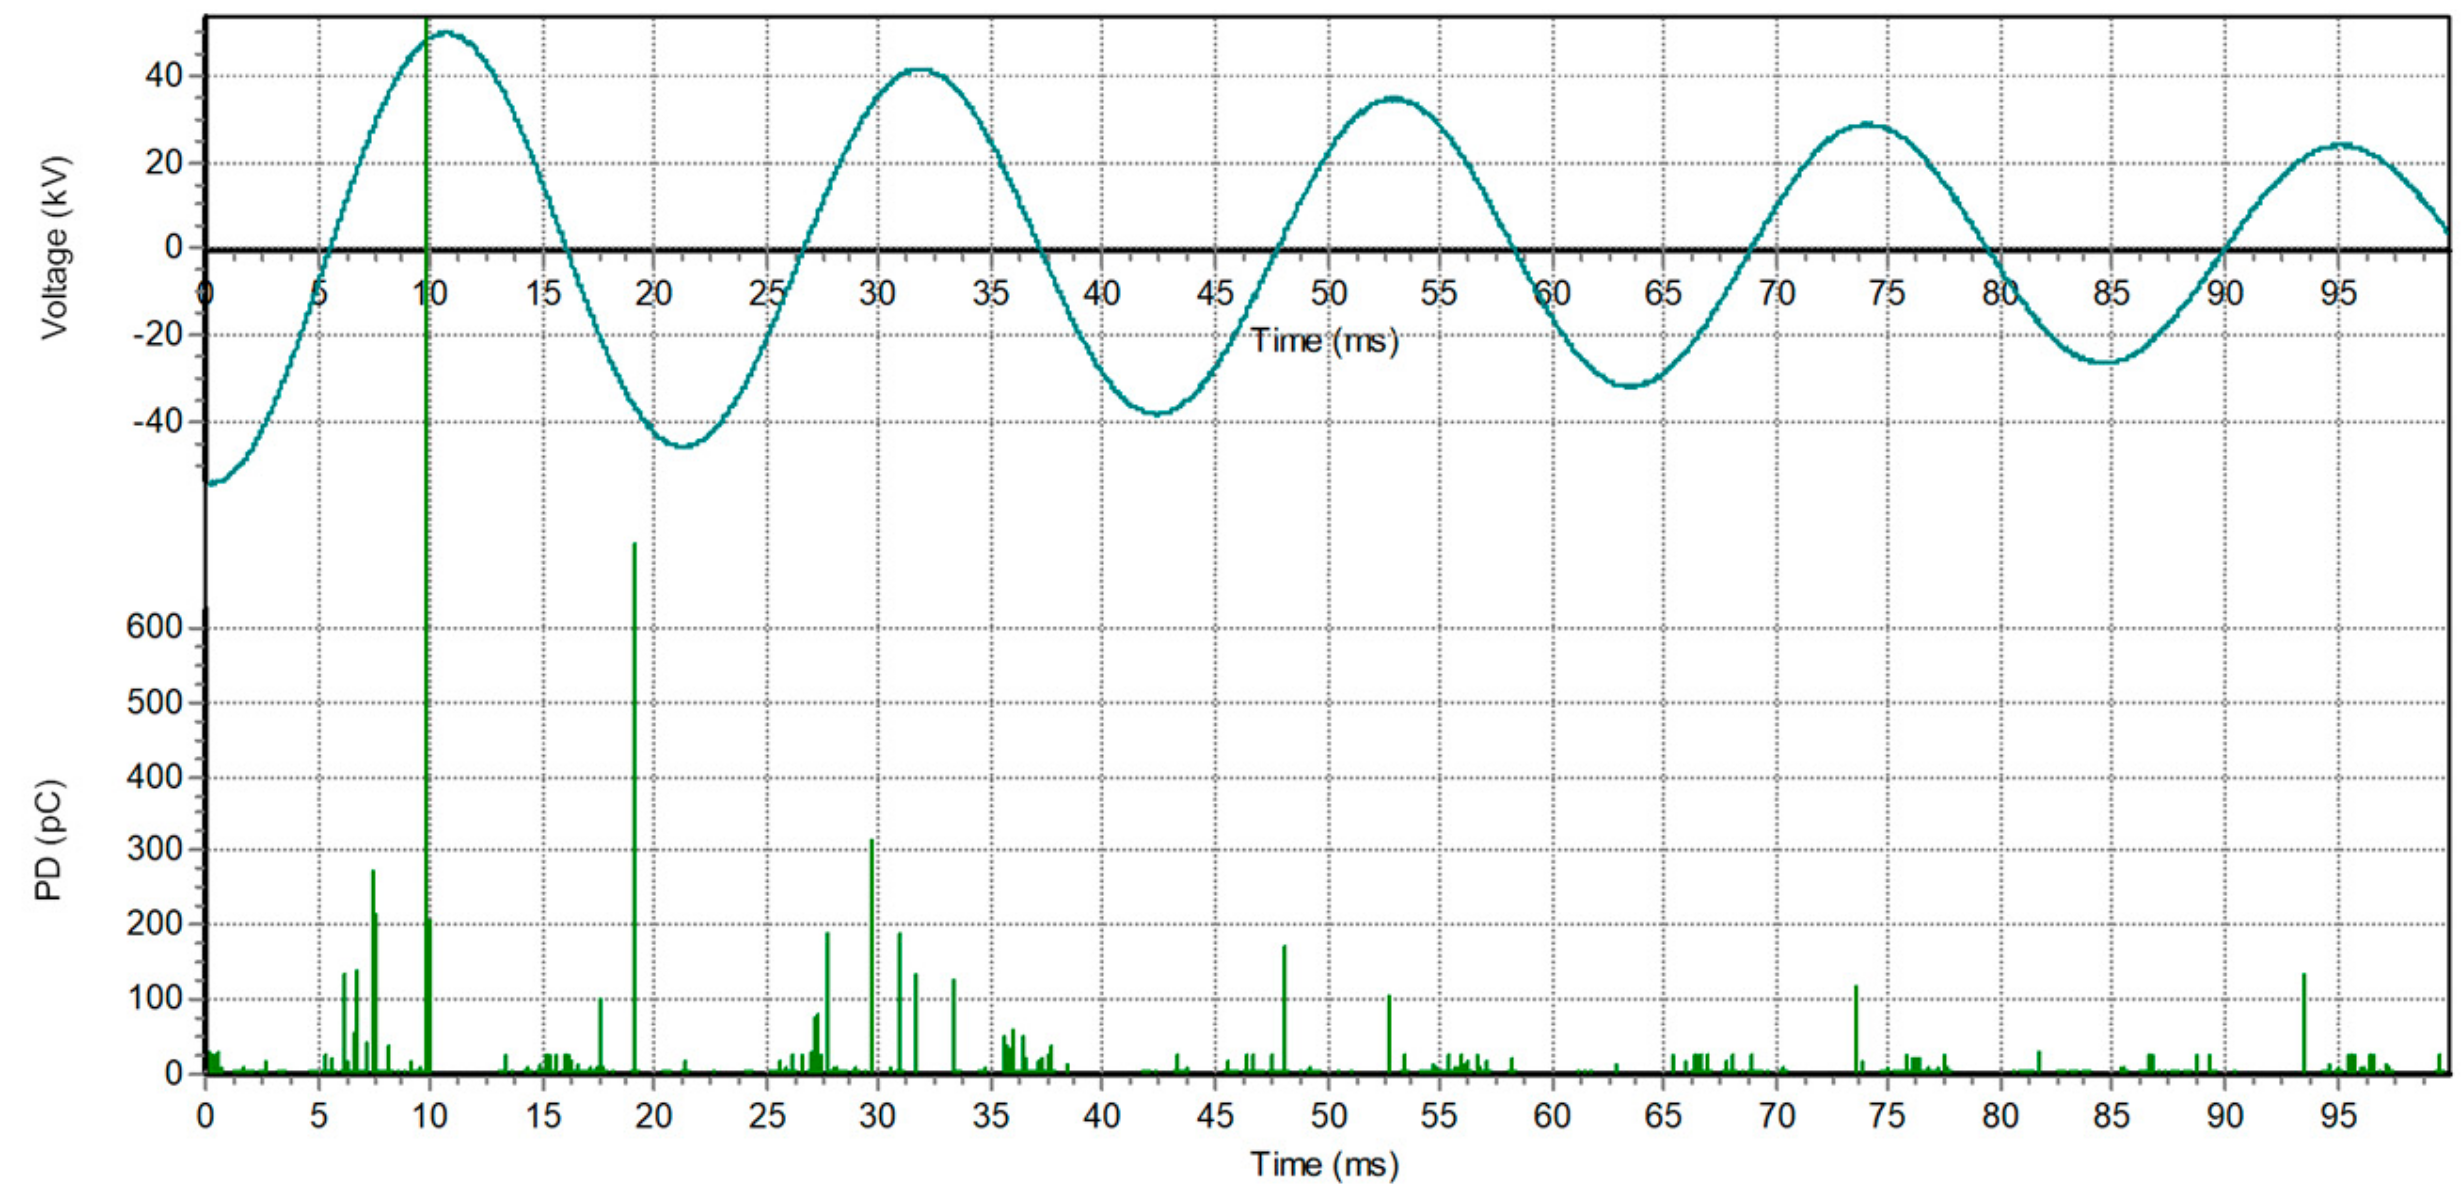
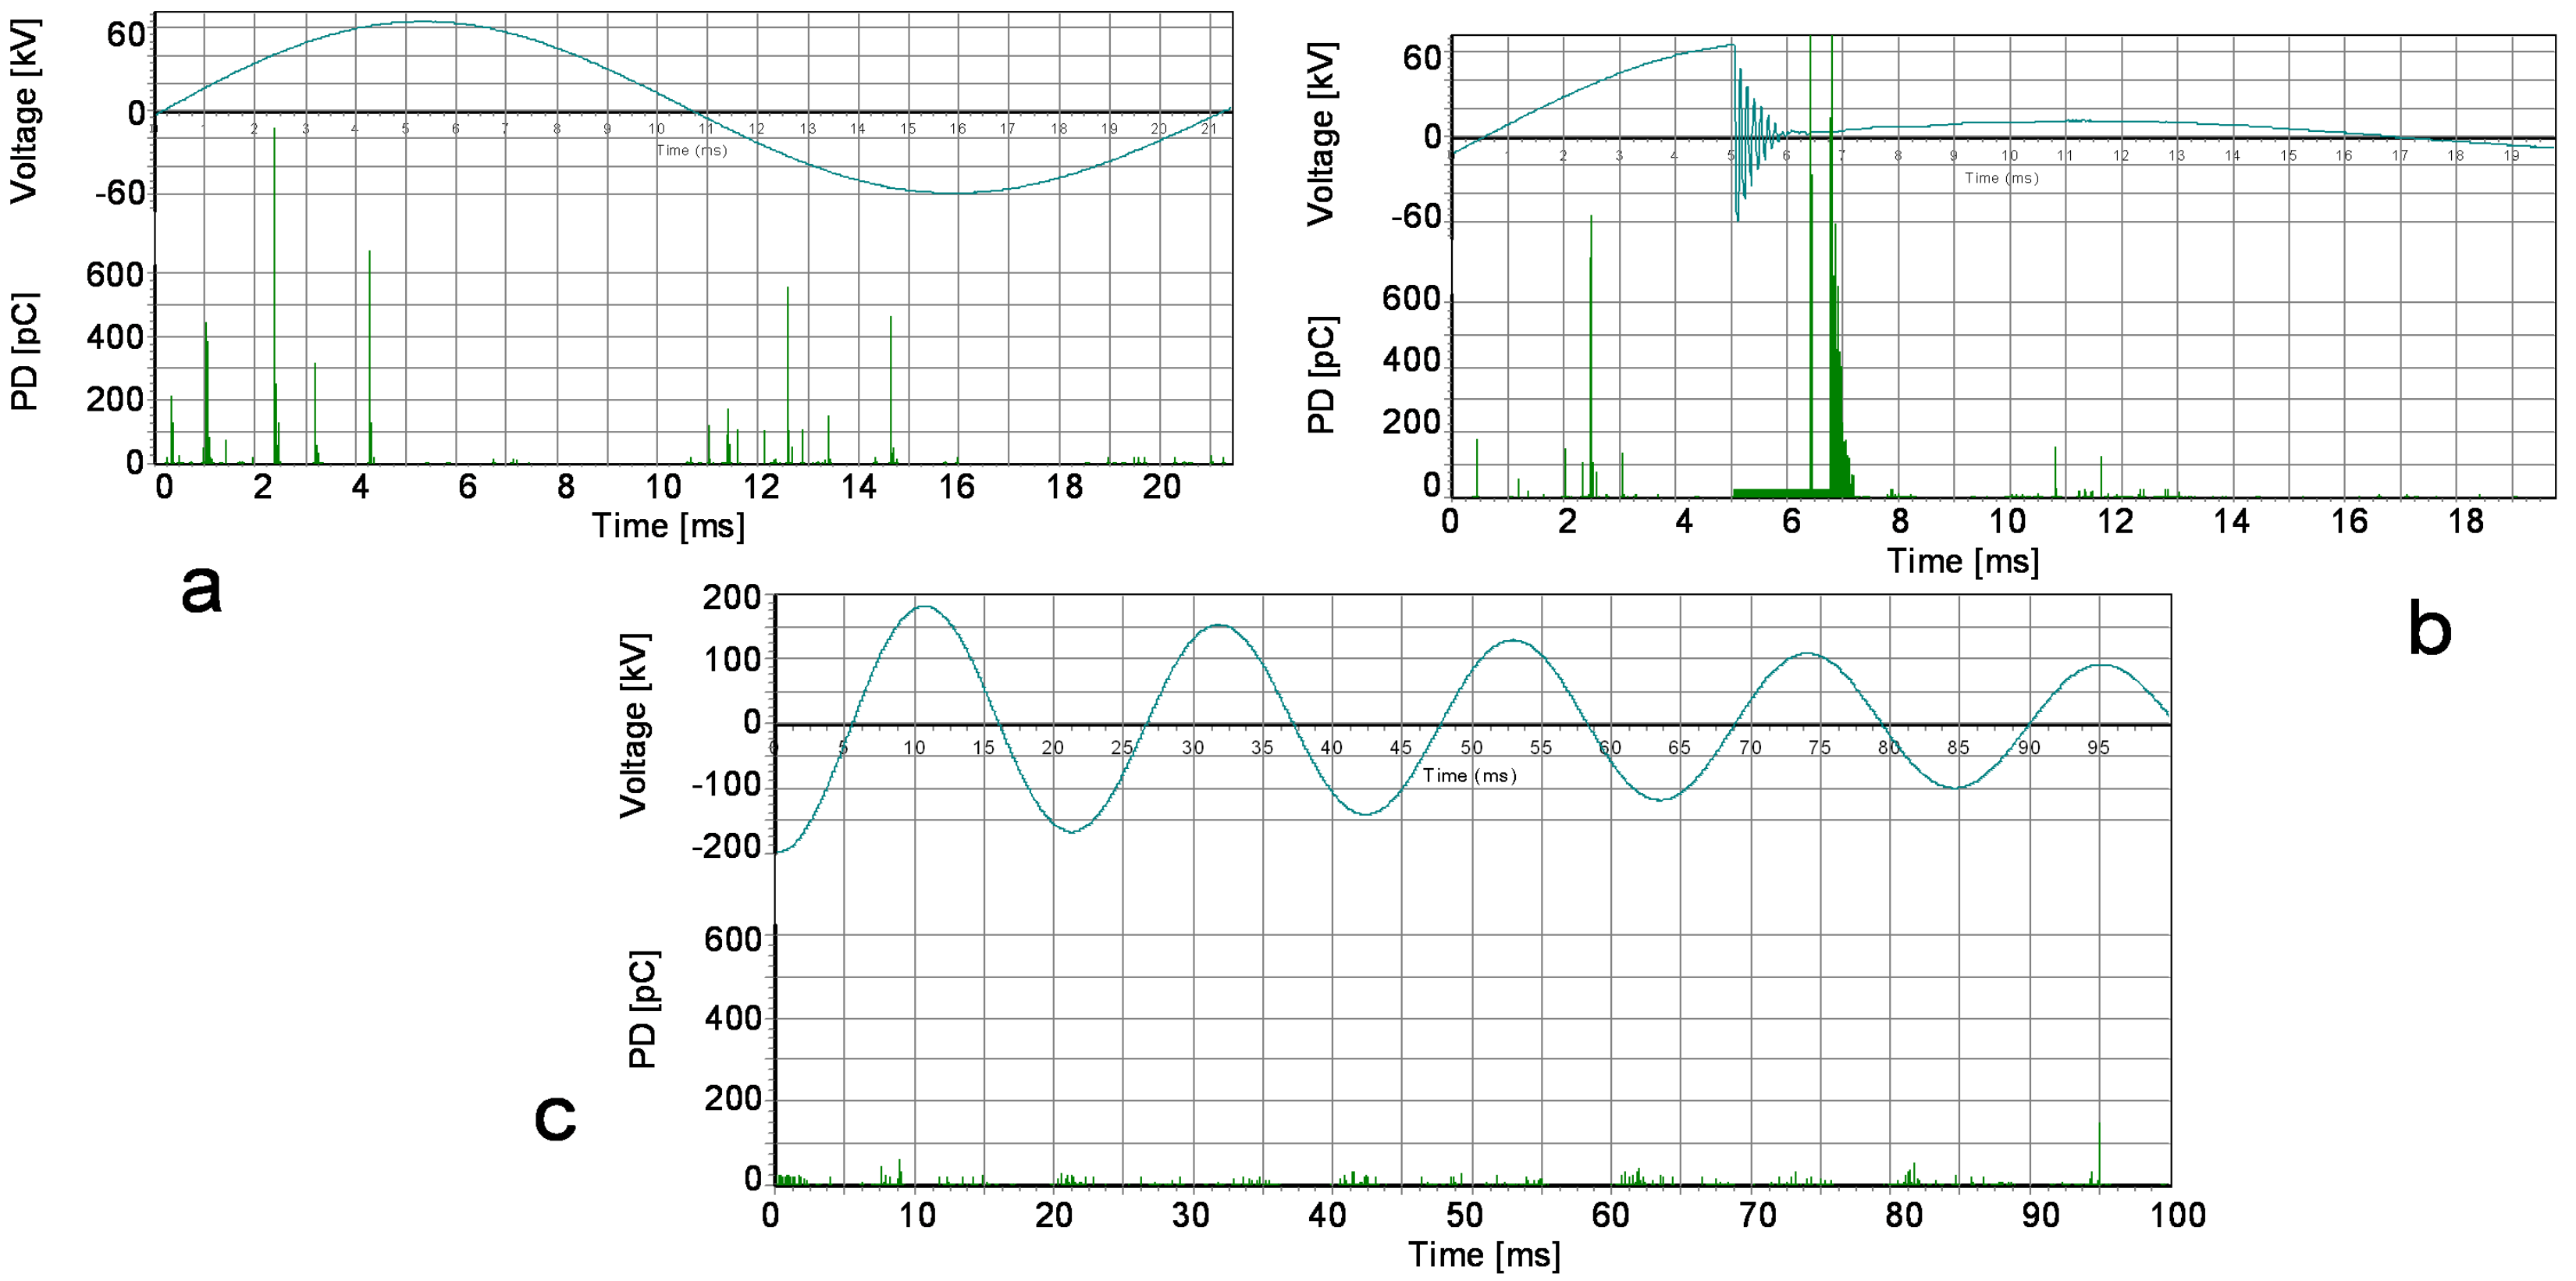
During the AC resonance phase, the DAC voltage is characterized by a decaying sine wave with a frequency given by the inductance used and the capacitance of the cable under test. Inductor values of DAC systems are chosen such that the DAC voltage frequency is in the near power frequency range of 10‒500 Hz, see
Figure 3. The maximum cable length is only limited by the energizing time and the maximum current capabilities of the semiconductor switch, therefore DAC systems can be easily used to test cable lengths up to tens of kilometers.
By applying DAC voltage-sensitive PD detection and PD localization of the fault in the power cables is possible. Using time-domain reflectometry (TDR), PD presences in cable terminations, joints, or cable parts can be localized, see
Figure 4. According to IEEE 400.4 [
5] to execute voltage withstand test this procedure should be repeated for 50 excitations followed after each other to perform a voltage withstand test on the maximum test voltage. Considering the time from the PD initiation until breakdown and the shorter duration of the excitation and decaying characteristics of the voltage, DAC test results obtained may differ from those obtained by continuous AC withstand voltage testing [
5]. Assuming that testing should not necessarily be destructive and that the PD inception indicates presence of defects, this difference in the time until breakdown has to be considered as an advantage of DAC testing. In practice, a monitored damped AC hold test is performed to determine whether the cable passes or fails the damped AC test. Due to additional information as provided by PD detection, the monitoring insulation properties during a damped AC withstand test, and the effect of the test voltage during its application can improve the evaluation of the insulation condition.
3.2. DAC Diagnostic Testing
3.2.1. Partial Discharge Measurement (PD)
The DAC voltage source does not produce EM interference signals during the PD measurements, thus a sensitive PD detection and localization of the fault in power cables is possible. Therefore the PD monitored voltage withstand testing using damped AC voltage is a very effective method to detect most insulation weak-spots. The PD measurement can be used to pinpoint the exact location of insulation defects at an early stage [
19,
20,
21], by means of time-domain reflectometry (TDR). With TDR, the PD presences in cable terminations, joints, or cable parts can be made, see
Figure 4.
3.2.2. Dissipation Factor Estimation (tan δ TD)
DAC systems are able to estimate the dissipation factor from the damping of the decaying sine wave during the LC resonant phase [
22,
23]. The degradation of oil-impregnated insulation of HV power cable can be investigated with this parameter.
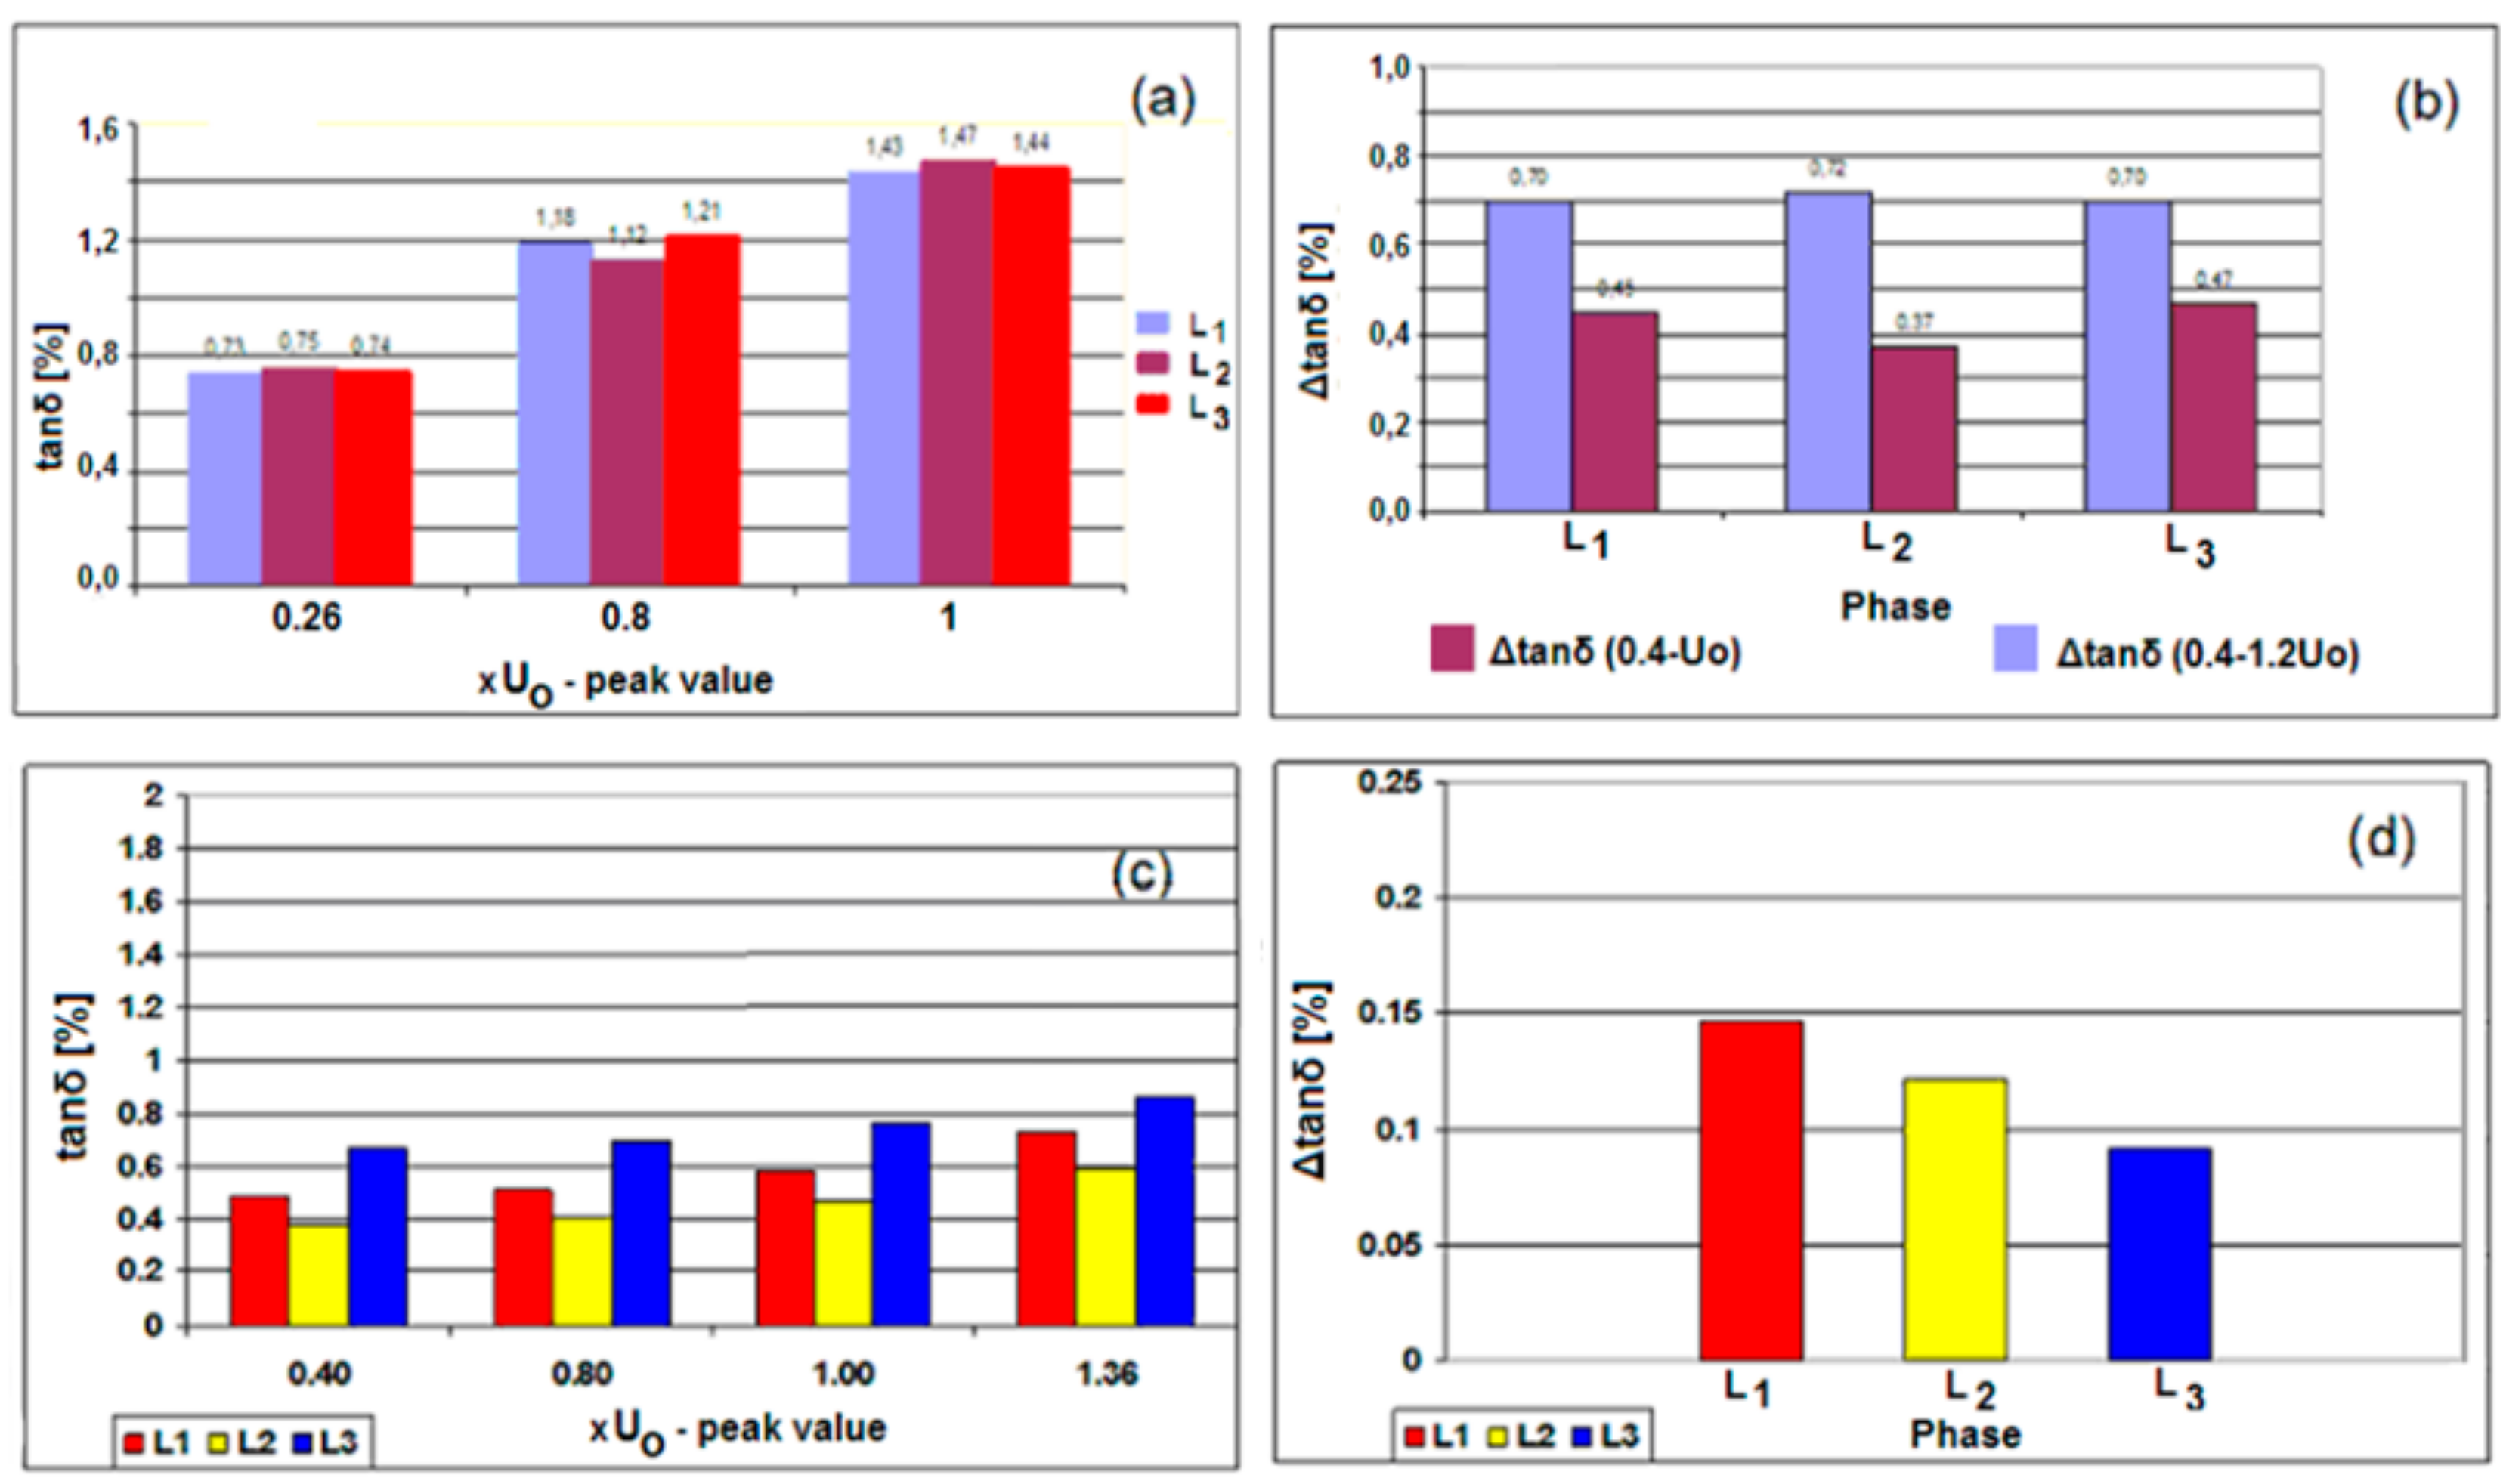
Applying DAC voltages the dissipation factor tan δ can be estimated using the decay characteristics of the damped AC voltage at different testing voltage levels and the change in the dissipation factor (delta tan delta) in relation to the increasing voltage can be especially valuable for finding insulation ageing development in power cables [
5], see
Figure 5.
4. On-Site Testing and PD Detection of Long Lengths Export Cables up to 230 kV
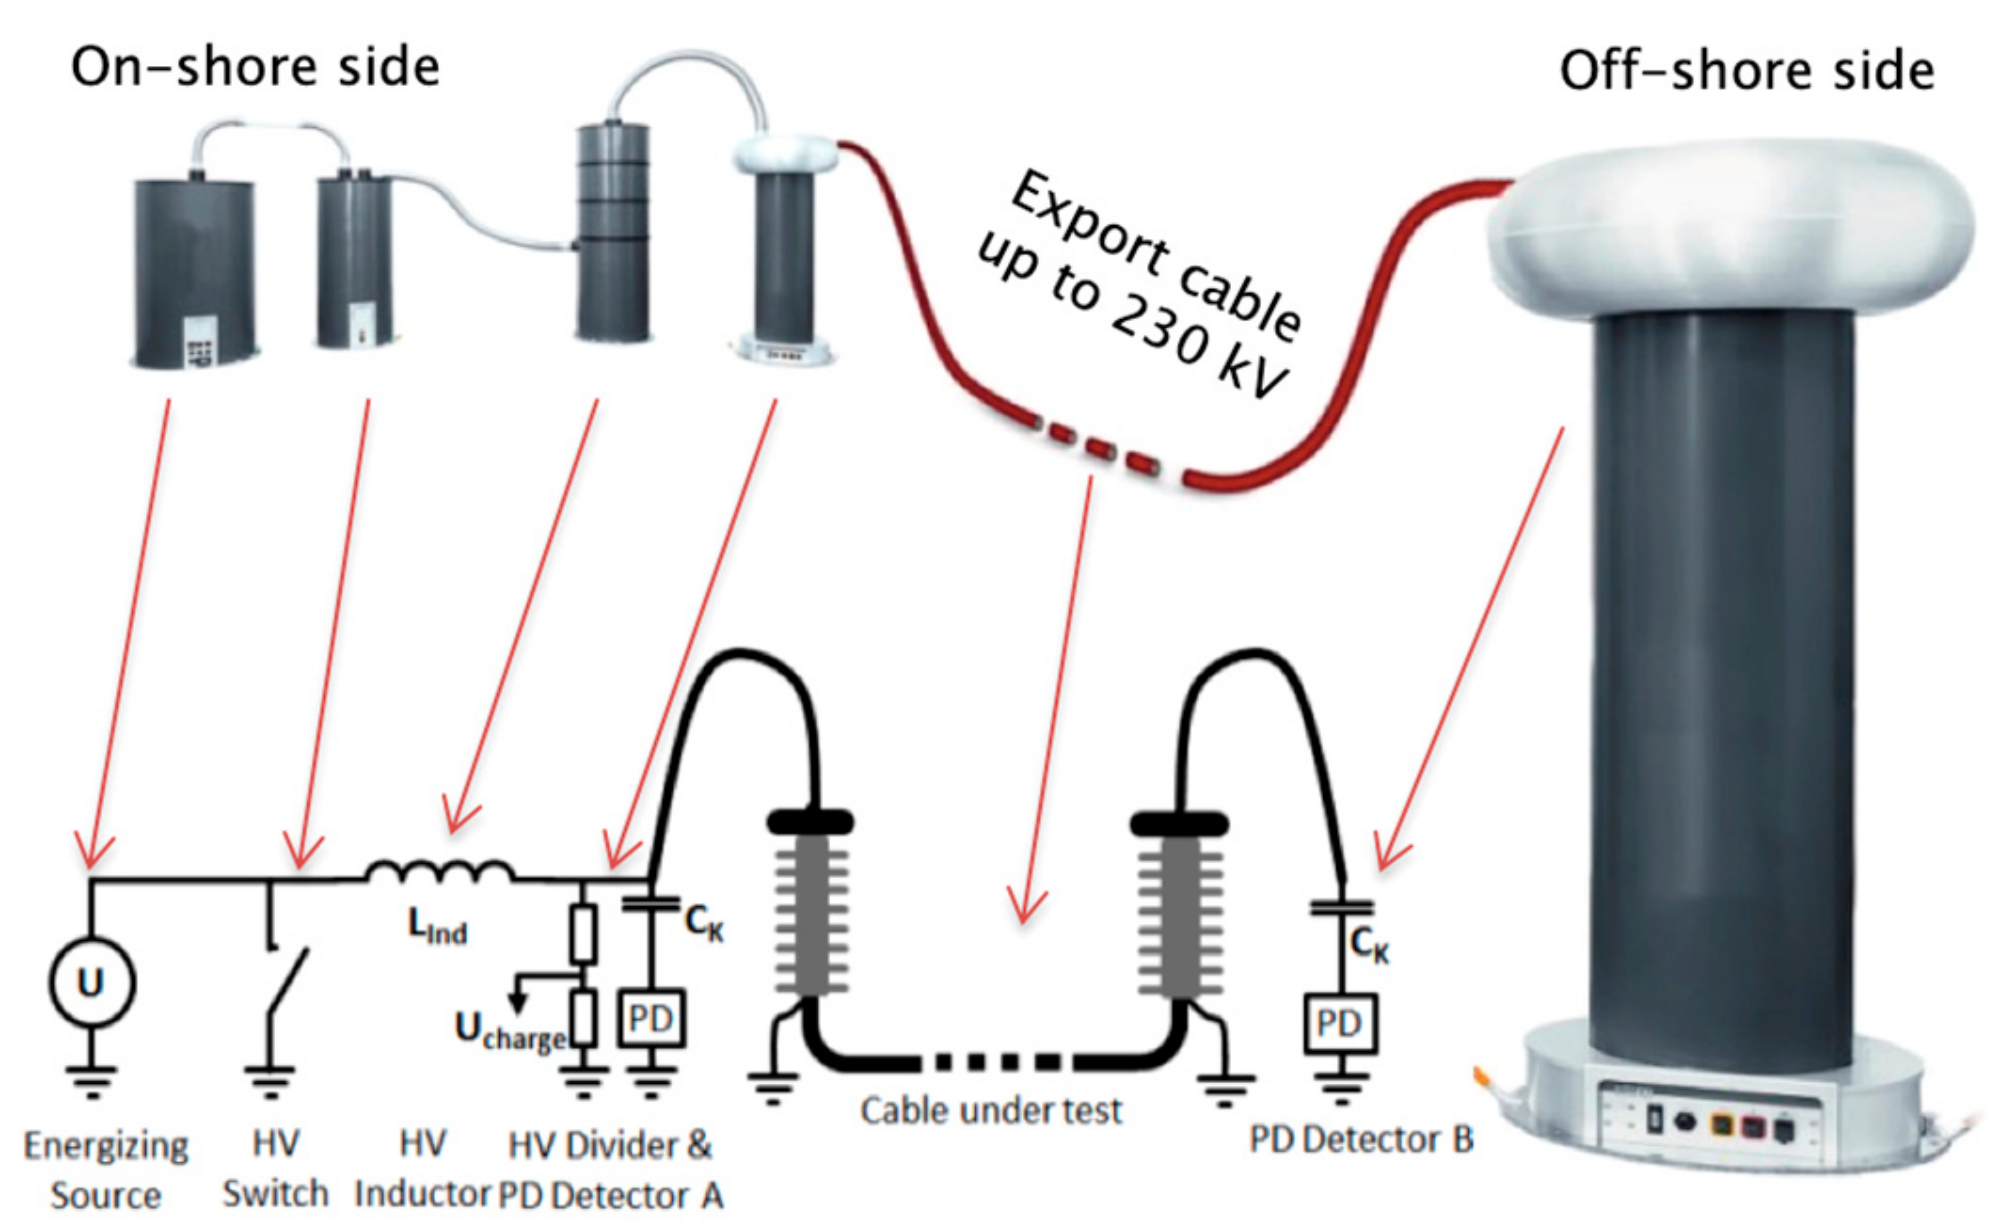
Detection and localization of PD in export cable system with long lengths e.g., 30 km can be improved by performing PD measurements at both sides of the cable circuit. This will, for the worst-case situation (PD at the near end), reduce the traveling distance for PD pulses by a factor of 2. In a single-sided measurement setup, a near end partial discharge has to travel through the whole cable length to the far end and the whole cable length back to the near end. The overall traveling distance is, therefore, two times the cable length. In a dual-sided measurement, the near end PD only has to travel to the far end to be detected there, so it only has to travel the cable length once. For this dual-sided measurement system, a damped AC system for energizing the cable system is used, see
Figure 6. This system uses a coupling capacitor with PD detector on the near end side and a second PD detector at the far end side [
11].
The main advantage of the dual-sided measurement is the better sensitivity compared to the single-sided measurement. The PD pulses have to propagate only to the ends of the cable. No reflection at the far end is necessary. As a result there is no additional attenuation due to imperfect reflection or attenuation for traveling through the whole cable once again. The attenuation decreases the amplitude of measurable partial discharge pulses.
Due to the attenuation, the decreasing PD amplitude has about 70% of the original amplitude. In a single-sided measurement setup, the reflected pulse over the far end decreases to 5%. A dual- sided measurement increases the remaining PD amplitude to about 26% [
24].
5. On-Site Testing of HVDC Cables
Besides testing HVAC cables with DAC, the technology is also suitable for testing HVDC cables. In particular, the HVDC (submarine) power cable circuits have some typical characteristics:
Installing a (submarine) HVDC cable is a costly and challenging activity and the technical interventions for its repairing in the case of faults are also costly and difficult;
High capacitance that requires extremely high-power demand for conventional HVAC test systems;
A large number of (factory) joints are installed.
Besides the enormous and unrealistic effort required to generate, on-site, the requested power (numbers of required AC resonance test (ACRT) sets) the testing with AC resonant systems only provides a go/no go based on the occurrence of a breakdown and does not provide the desired selection criteria to obtain an overall cable condition assessment where diagnostic parameters like PD and dissipation factor are included. When compared to HVAC cable systems and accessories, the HVDC cables are designed differently, which might result in the damage of the insulation of the HVDC cable and accessories in case of a defect breakdown under the regular AC voltage over-stresses. As the cable field design of HVDC cable insulation is based on the resistive field distribution, which is strongly temperature-dependent, the use of continuous AC stresses as produced by the AC resonant testing is related to a temperature increase (in particular by long lengths), which in its turn could be destructive for the HVDC insulation.
DAC testing makes it possible to energize very long lengths of AC as well as HVDC power cable with high capacitance, due to its low input power demand. Actually, possible defects can be detected in the installed HVDC cable length, as introduced in the factory or after the installation and transportation, and located by means of DAC voltage testing including single- or dual-side partial discharge detection at the cable terminations [
19,
22]. It is known that about 80% of the insulation defects in power cable circuits are visible through to partial discharges as detected at AC voltage stresses. As a result non-destructive DAC testing avoids the unnecessary temperature load and providing IEC conform sensitive PD detection to detect the insulation defects [
11].
6. Field Example Diagnostic Test Offshore Export and Inter-Array Cables
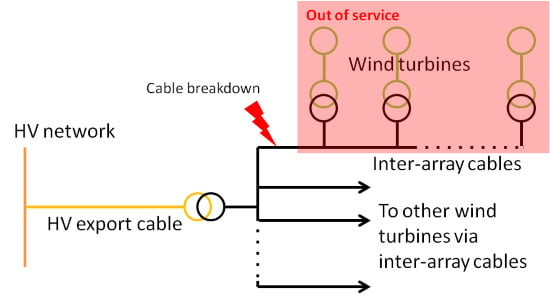
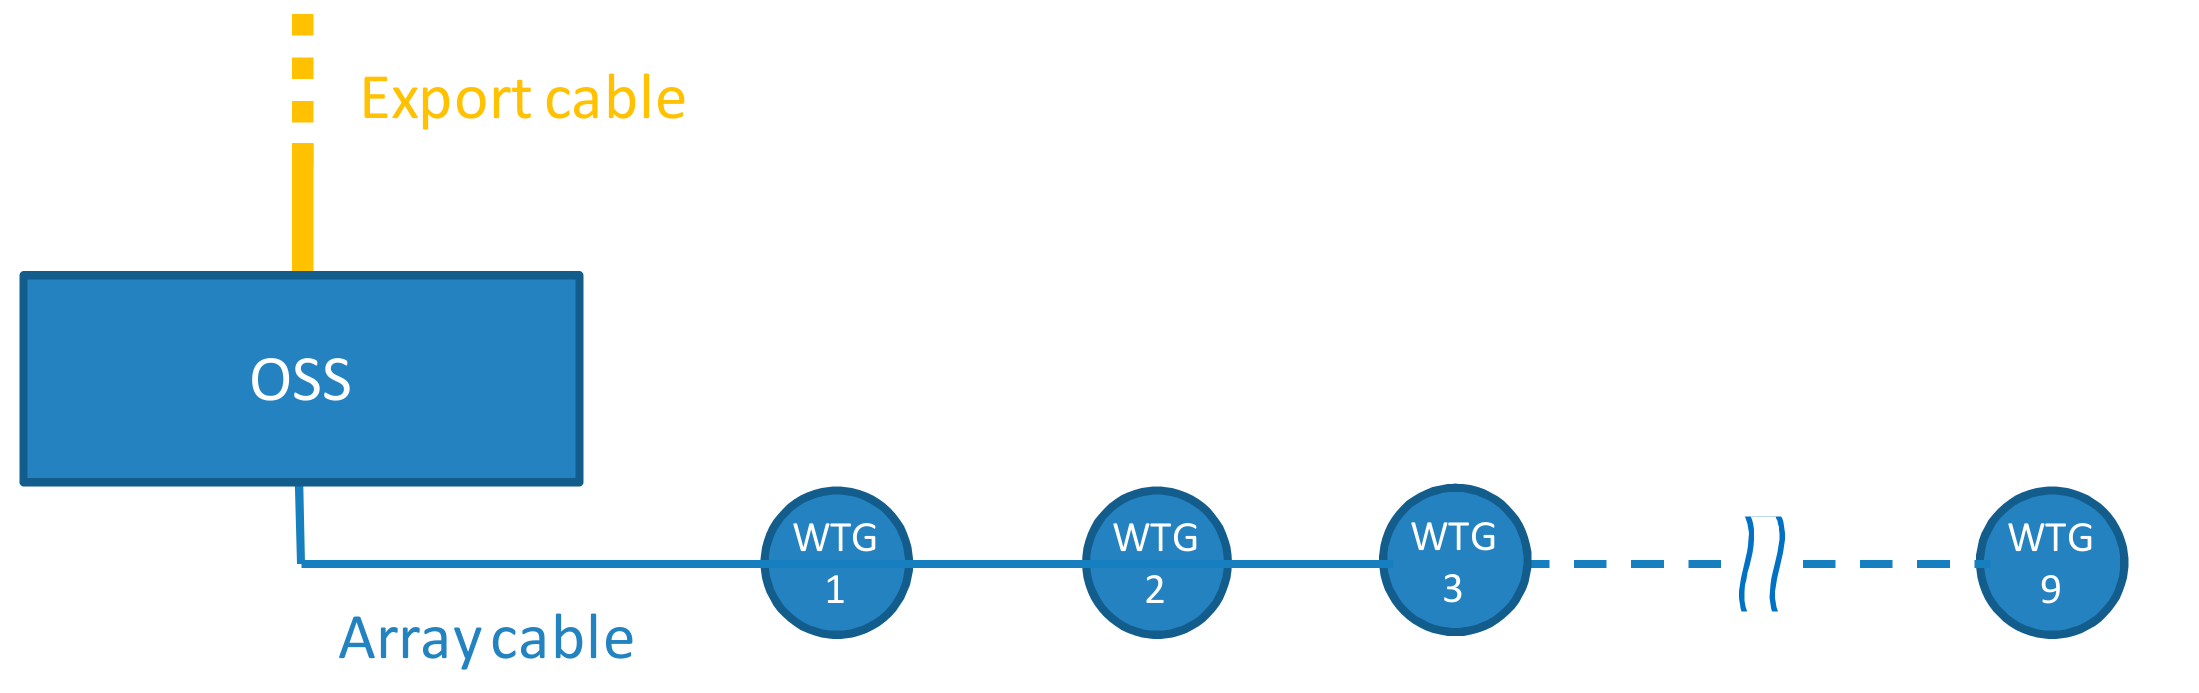
During a maintenance outage of an offshore wind farm, diagnostic testing was performed using DAC testing. Ten complete strings of inter-array cables from the offshore substation (OSS) to the wind turbine generator (WTG) were DAC tested. For this purpose, the switchgear in each wind turbine was switched in such a way that all the inter-array cables between the wind-turbines were connected with each other, see
Figure 7. The DAC test system was connected via a special test adapter in the switchgear on the offshore substation (OSS) to the cable string under test. The maximum total lengths of the strings were up to almost 10 km length.
The benefit, in this case, was that the test system did not need to be transported between the tests, as all tests could be performed from the OSS, which required only a single mobilization of the test equipment.
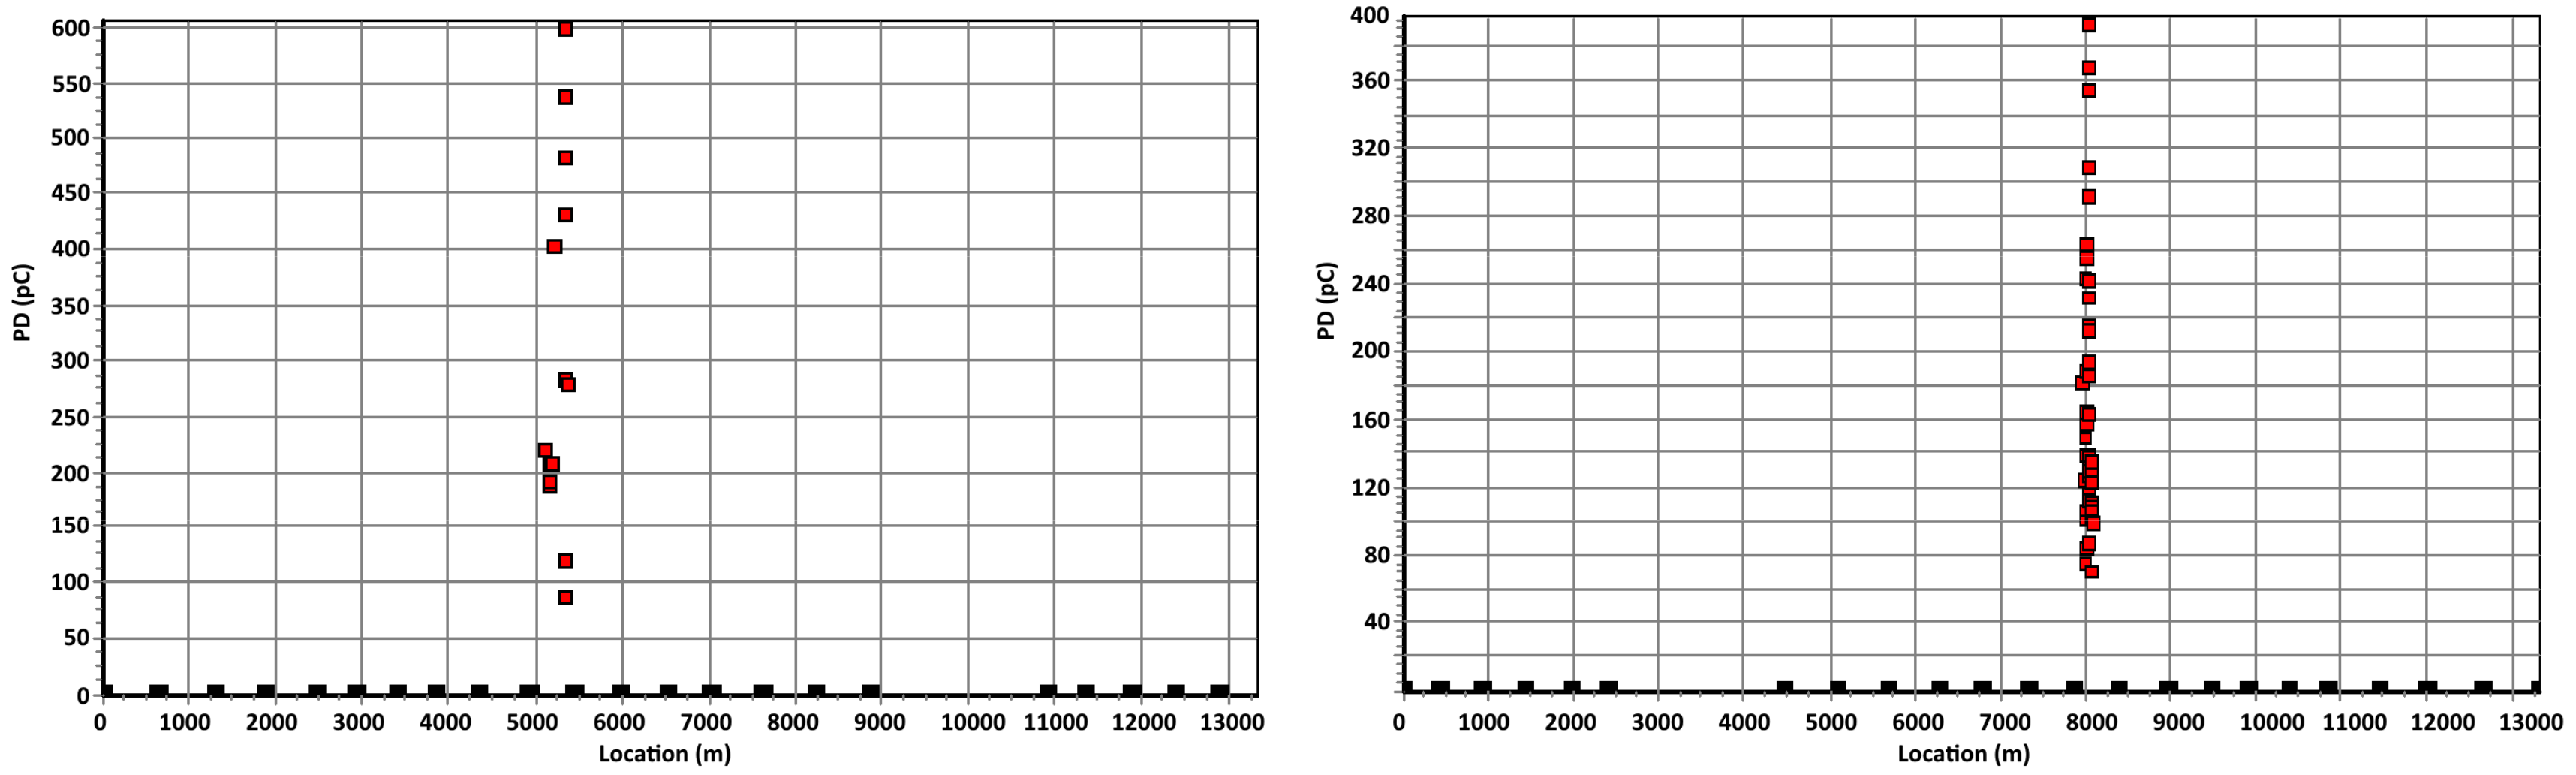
In a string of 8.4 km length of inter-array cables between the OSS and nine wind turbines, partial discharges were detected and localized. Each phase was individually tested using a damped AC offshore system with a DAC frequency of 100 Hz (total cable capacitance 1.85 µF). The test voltage level was ramped up in steps up to the maximum applied test voltage level of 1.4
Uo. PD was monitored during the voltage ramp-up phase and during the withstand testing of 50 DAC excitations at the maximum test voltage. No breakdown was observed during the withstand test, however as the damped AC test voltage was increased up to 1.4
Uo, PD activity was observed in phases L2 and L3 of the string, see
Figure 8. PD mapping revealed the PD concentration at WTG 5 in phase L3 and at WTG 6 km in phase L2.
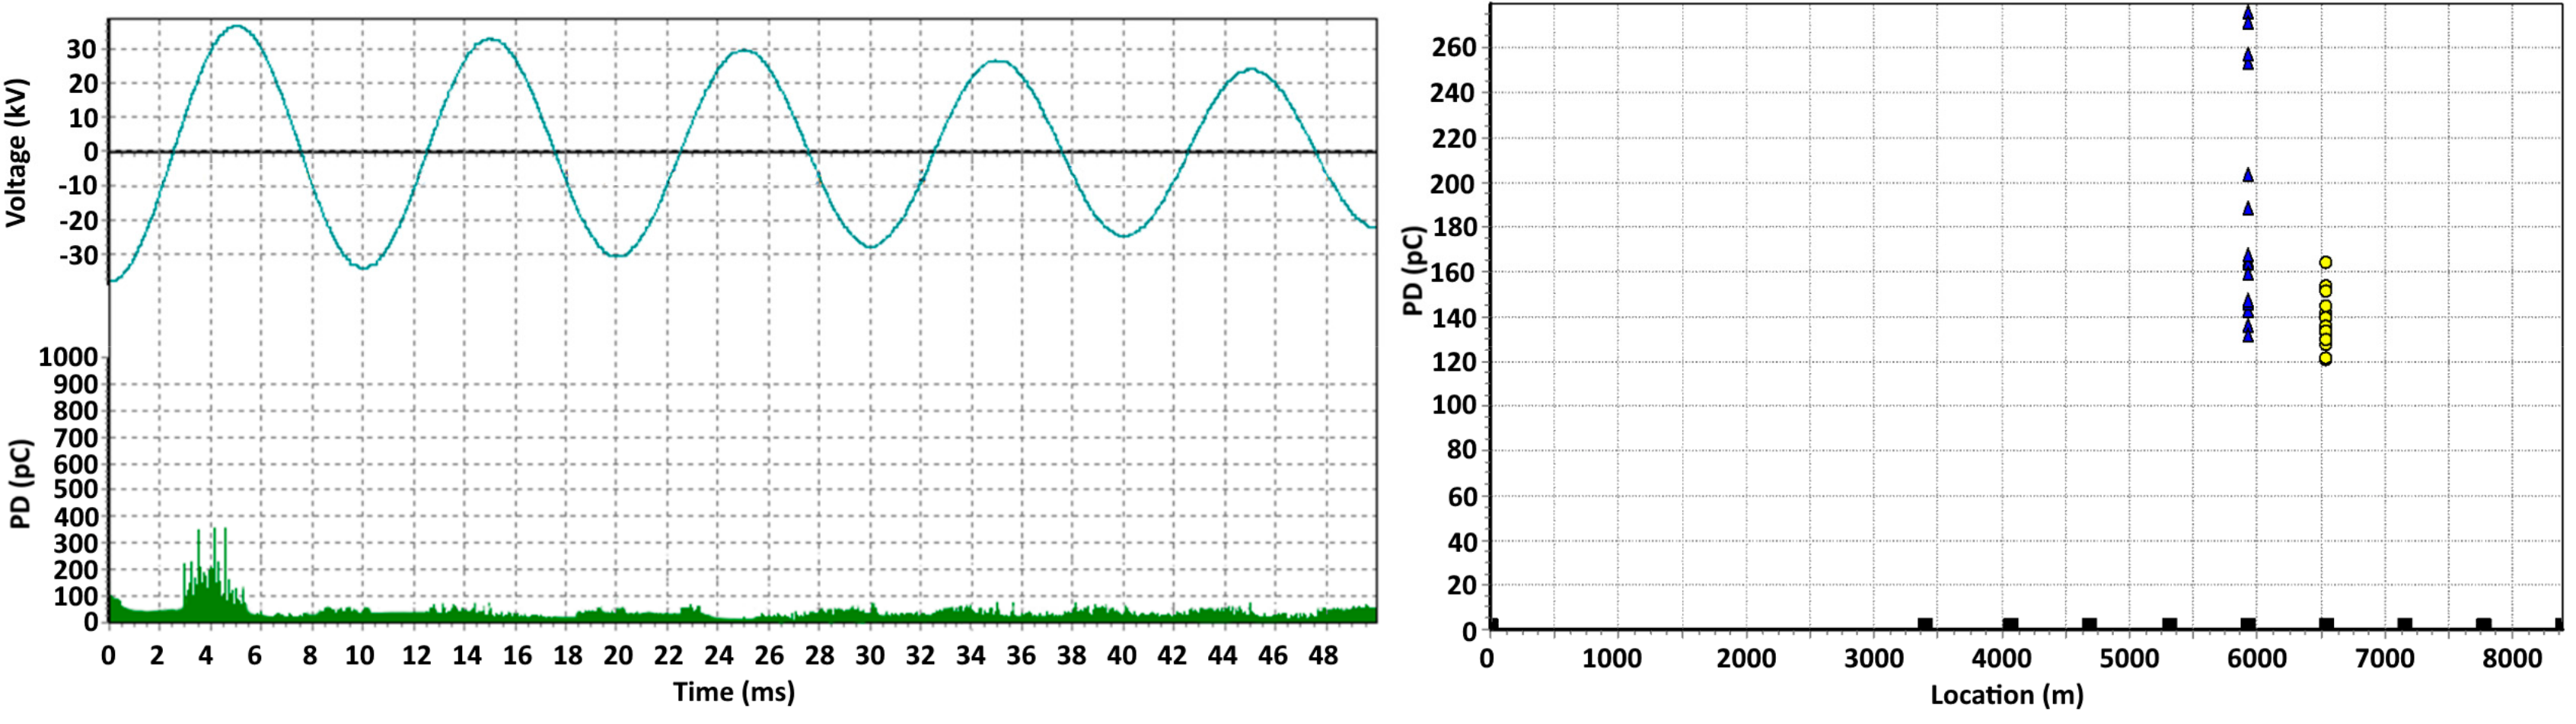
A second field example is from an after-laying test of a newly installed 13.3 km long, 220 kV XLPE insulated submarine cable circuit. This cable was tested using a damped ac system at 49 Hz, applying up to 1.3
Uo, (
Figure 9,
Figure 10 and
Figure 11). Monitored withstand testing was performed. As the damped ac test voltage was increased starting from 0.2
Uo, PD activity was observed in phase L1. An increase in the test voltage resulted in an increase of PD activity, At 0.4
Uo test voltage, a breakdown at the discharging site occurred. PD mapping revealed the PD concentration at 5.3 km indicated the breakdown position in the cable. The defect produced PD before an actual breakdown occurred, and with TDR analysis, the PD defect location could be determined. The other two phases fulfilled the after laying conditions and successfully passed the test. No internal PD activity in the cable insulation and accessories and no breakdown occurred during the tests of the other phases. The breakdown occurred during the first test, however the failure was high ohmic and the PD test could be continued on a lower voltage. Therefore the measurement could be repeated from the other end of the cable (phase L1). The PD activity occurring before the breakdown could be localized at 8 km, which is the same location seen from the original tests (13.3 − 8 = 5.3 km).
The cable was repaired at the indicated location. After repair, the cable was re-tested and no further PD activity was detected.
7. Failure Statistics and Financial Impact
On an offshore wind farm (OSWF), partial discharge was monitored using voltage withstand tests using DAC and was performed to obtain a full condition assessment. During the test sequence on both wind farms, PD activity was detected and localized in the inter-array cables. It could be verified that on multiple cable terminations, installation issues were the cause for the PD activity. If the number of affected cable terminations in relation to the total number of terminations installed is observed, it can be seen that in this case up to 3.7% of the terminations are affected, see
Table 2.
It can be concluded that a considerable number of wind turbines have increased risk of a failure due to the presence of PD at voltages higher than Uo. These PD sites are probably related to poor workmanship during the installation.
The costs for the testing and the costs for a possible failure of a cable termination during operation can be evaluated. The typical costs for testing are in the range of € 10,000 to € 15,000 per turbine dependent on the scope of works of testing; this cost reduces with volume.
Financial losses due to turbines out of operation can very quickly reach more than 100,000 € within three days, i.e., the mean time to repair (MTTR), which depends on fault location in a string (number of wind turbines which are affected), inter-array cable topology, and the weather conditions during the fault, see
Table 3. With consideration of failure rates for terminations and other relevant factors, e.g., the MTTR for a 33 kV cable termination, an after-installation test can have a positive financial effect if it prevents the first cable termination fault in a wind farm.
However, the size (i.e., the power rating) of the turbine also plays an important role. In the future, larger turbines will be built were a termination fault will lead quickly to higher financial loss due to the greater loss of energy. As a result, a proper after-installation testing program is beneficial to verify the cable quality and can prevent costly failures during operation. The economic impact of an HVAC or HVDC export cable failure can be examined under the following categories:
The cost of cable repair includes:
- (a)
The precise location of the fault;
- (b)
Mobilization of a suitable repair vessel, equipment, and personnel;
- (c)
de-burial of the failed cable;
- (d)
Removal of a length of cable (often several hundred meters long—that includes the fault location);
- (e)
Jointing in a length of spare cable to replace the removed section;
- (f)
Reburying or otherwise protecting the repaired cable.
HVAC and HVDC export cable links costs will depend on market conditions and weather conditions during the repair, but can be extremely high. Based on several export cable failures (which can be compared to a submarine HVDC cable) in the UK, it is calculated that the average repair cost from those failures is £12.5 million (ranging from £5.3 million to £15.5 million).
It has been estimated that the cost of a pre-emptive repair is substantially less than the cost of an unplanned repair. It is so much lower than the costs for the unplanned repairs that it is safe to state that the cost of a pre-emptive (estimated on £ 3.5 million) repair will be much lower than that of an unplanned repair.
As a result, based on the repair costs, the actual repair times, and the typical price of a loss of supplied energy (£/MWh), a rough estimate of the total cost to the industry due to cable failures can be calculated. This means that the above-stated costs for a failure repair can easily be doubled if the loss of supplied energy is also taken into consideration.
8. Conclusions
In the past 20 years field testing experiences have been obtained with damped AC testing. For several years now, this technology has also been applied to testing submarine cables at offshore wind farms. Besides this, the basic aspects of failure risks of export and inter-array cables for offshore wind farms have been discussed in this contribution. The following conclusions may be drawn after-installation testing:
Based on the international failure statistics, it can be seen that the cable systems are the most critical parts of complete wind farm installations with a failure impact rate of 30%. However, up until now, the present international standards guidelines are not covering the needs of high-quality after-installation testing of export and inter-array cabling;
Performing non-destructive PD monitored sensitive testing is a good basis for condition assessment and future life estimation of export and inter-array cables. With this after-installation testing, the faults that can occur as a result of stresses during manufacturing, transportation, and installation can be detected;
For on-site cable testing, the PD monitored DAC voltage withstand testing is, in many countries, a common practice. PD measurement, including PD-pattern information and time domain reflectometry (PD localization), helps to detect and locate discharging defects in the insulation and accessories of power cables;
DAC is a very suitable test technology to test long lengths of onshore and offshore export HVAC and HVDC power cable with a low demand of on-site power needed and with the possibility of sensitive PD detection and localization. This testing method makes it possible to obtain an integral cable fingerprinting by damped AC testing, which provides an assessment of the cable circuit integrity for the installation of both newly installed and under operation cables;
Presented case studies have shown the value of applying the damped AC testing including PD detection and dissipation factor estimation to find upcoming failures prior to service operation. It is shown in the presented example that up to 3.7% of the installed cable terminations had partial discharges in this particular case. Those defects could not be found during traditional un-monitored (i.e., without PD measurements) voltage withstand testing, at which is only tested if the cable system withstands the over-voltage for a certain duration;
Although testing of cables involves costs, it has shown that the testing with DAC is a cost-effective solution compared to the costs, for example, of a termination failure in an operational offshore wind farm.


