Article

Gravity Drainage Mechanism in Naturally Fractured Carbonate Reservoirs; Review and Application

by
Faisal Awad Aljuboori
1,*,
Jang Hyun Lee
1,
Khaled A. Elraies
1 and
Karl D. Stephen
2
1
Petroleum Engineering Department, Universiti Teknologi Petronas, Seri Iskandar 32610, Perak Darul Ridzuan, Malaysia
2
Institute of GeoEnergy Engineering, Heriot-Watt University, Edinburgh EH14 4AS, UK
*
Author to whom correspondence should be addressed.
Energies 2019, 12(19), 3699; https://doi.org/10.3390/en12193699
Submission received: 29 August 2019 / Revised: 17 September 2019 / Accepted: 23 September 2019 / Published: 27 September 2019

Abstract

:
Gravity drainage is one of the essential recovery mechanisms in naturally fractured reservoirs. Several mathematical formulas have been proposed to simulate the drainage process using the dual-porosity model. Nevertheless, they were varied in their abilities to capture the real saturation profiles and recovery speed in the reservoir. Therefore, understanding each mathematical model can help in deciding the best gravity model that suits each reservoir case. Real field data from a naturally fractured carbonate reservoir from the Middle East have used to examine the performance of various gravity equations. The reservoir represents a gas–oil system and has four decades of production history, which provided the required mean to evaluate the performance of each gravity model. The simulation outcomes demonstrated remarkable differences in the oil and gas saturation profile and in the oil recovery speed from the matrix blocks, which attributed to a different definition of the flow potential in the vertical direction. Moreover, a sensitivity study showed that some matrix parameters such as block height and vertical permeability exhibited a different behavior and effectiveness in each gravity model, which highlighted the associated uncertainty to the possible range that often used in the simulation. These parameters should be modelled accurately to avoid overestimation of the oil recovery from the matrix blocks, recovery speed, and to capture the advanced gas front in the oil zone.

1. Introduction

Fossil fuels constitute a significant portion of world energy consumption, and the world demand on this type of energy is expected to grow in the coming decades [1,2]. Many major economic sectors are significantly influenced by oil prices. The global oil market has attributed prices as an essential factor to all world economics [3]. However, the currently producing fields are not able to meet the future increment to the fuel energy demand, which requires an increase in production from low-recovery reservoirs or to develop new prospects. Carbonate reservoirs host about 70% of the conventional oil reserves in the Middle East, and most of them are naturally fractured [4]. The Naturally Fractured Carbonate Reservoirs (NFCR) are well known for their low recoveries [5,6] compared to the clastic reservoirs due to the multiscale of geological heterogeneities, [5,7,8]. Therefore, accurate modelling of reservoir heterogeneities is a critical and an essential stage for further improvements in the modelling and simulation process, which enhance historical matching or future prediction. Furthermore, sustaining oil and gas production is key to a successful secondary or tertiary recovery project.
NFCRs are frequently simulated using the dual medium. The matrix, which is often known as a stagnant medium, provides most of the fluid reserves. Meanwhile, fractures provide faster corridors for the flowing fluids. The interaction between the two mediums has a growing interest as it represents the primary pillar of the dual-porosity model. It is represented by different physical phenomena such as diffusion, gravity drainage, imbibition, and capillarity, which are the main recovery mechanisms that control the flowing fluid between the matrix blocks and the surrounding fractures. In a gas–oil system, gravity drainage represents the major recovery mechanism in the reservoir during natural depletion or in gravity-assisted processes [9,10,11]. Therefore, it is necessary to understand the transfer function evolution before evaluating the effectiveness and performance of the various mathematical expressions of gravity drainage using the dual-porosity model. The dual-porosity model has the advantage of requiring significantly less CPU time for the simulation run compared to high-resolution models. However, high-resolution models are superior in representing the reservoir heterogeneity and accurately depicting the gravity drainage process. Therefore, high-resolution models are often used as a reference scenario to evaluate the improvements in the developed formulas for the dual-porosity model (e.g., [12,13,14]).
Saturation profiles and recovery speed are among the challenges that face gravity drainage models. Inappropriate selection of gravity model or misuse of matrix characteristics results in overestimation of oil recovery from the matrix blocks, hence inaccurate representation or matching actual reservoir behavior. Furthermore, several authors (e.g., [15,16,17]) have proposed transfer function formulas to calculate the fluid exchange rate between the matrix and the fractures. Most of these formulas include a gravity term to account for the contribution of gravity drainage in the overall oil recovery from the matrix blocks. The suggested principle by Barenblatt [18] and Warren and Root [19] established the foundation of most of the mathematical expressions of the transfer functions that have Darcy-equation forms. Despite the suggested improvements to the transfer functions, they are still responsible for the accurate mimicry of the recovery speed from the matrix blocks.
Barenblatt [18] described the concept of liquid transfer between the matrix and the fissures, in addition to highlighting the pressure discontinuity (i.e., fluid pressure differences between the fractures and the adjacent matrix cells) as shown in Equation (1).
τ = α * μ ( P m P f )
where τ is the liquid rate that flowed from the matrix cells to the fractures, and α * is a dimensionless characteristic of the fractures that depends on the fluid viscosity μ in addition to the pressure difference between P m , and P f , which represents the liquid pressure in the matrix and fracture respectively. The dimensionless α * in Equation (1) was redefined by Warren and Root [19] to be ( k m [ L 2 ] . σ [ L 2 ] ), where they defined σ as a shape factor, and k m is the matrix permeability as illustrated in Equations (2) and (3):
τ = σ k m μ ( P m P f )
σ = 4 n ( n + 2 ) L 2
where n represents the number of the natural fracture sets and L related to the matrix dimensions. It could be highlighted that Equation (2) has the form of the Darcy equation. This equation form represents one of the suggested solutions to simulate the fluid exchanges between the matrix and fractures. However, other approaches (e.g., empirical models) have also been suggested for the same purpose, but they have not been investigated in the current work. The Darcy-form transfer functions have explained in detail as they are available in the commercial simulators (e.g., ECLIPSE) which can apply at both small and field scales.
Kazemi [20] extended the Warren and Root model to the multiphase flow to account for capillary and gravity forces, where he illustrated the multiphase flow in both fractures and matrix mediums as he proposed in his simulator. Moreover, Kazemi explained that the shape factor σ in the extension of Equation (2) for the three-dimensional case of cubic cells could be calculated using the formulas [15];
σ = 4 1 L x 2 + 1 L y 2 + 1 L z 2
Further improvement in representing the gravity effect was suggested by Gilman and Kazemi [16] by using the subdomain approach, where they demonstrated that using matrix grid refinement could rigorously capture the saturation profile and more accurate representation of fluid exchange between the fracture and matrix subdomain; see Figure 1.
They suggested that the potential differences between the matrix subdomain and fracture can be calculated using the equation:
Δ Φ α = P f s P α m s γ α ( D f s D m s )
where the s refers to the subdomain system and α refers to the fluid phase. The pressure in the fractures P f s can be calculated in an oil–water system according to the following formulas:
P f s = P f I γ ( h w f h s )
P f I = P f γ ( Δ z 2 h w f )
The term P f I in Equation (6) refers to the pressure at the interface between the oil and the water phase while the ( Δ z / 2 ) represent the gridblock center. Gilman and Kazemi validated their improved gravity model by comparing its results with fine-grid models.
Quandalle and Sabathier [17] referred to the non-equal influence of the three active forces of recovery (viscosity, gravity, and capillarity) that should be adjusted, where three coefficients were defined ( K v , K g , a n d , K c ) to represent the former mentioned active forces which should be multiplied by the matrix–fracture exchange to adjust the flow for the corresponding force. Abushaikha and Gosselin [21] derived the transfer function proposed by Quandalle and Sabathier [17] as each matrix block face has its own potential, mobility, and permeability. The equation has the following form, where the vertical transfer function is separated from the horizontal transfer function:
τ j = σ Q ( k m , h k r j ) μ j P j m P c j m P j f + P c j f + σ G D k m , v k r j , z + μ j , z + ( P j m P c j m P j f + P c j f + ( P j f P j * f ) g L z 2 ) + σ G D k m , v k r j , z μ j , z ( P j m P c j m P j f + P c j f ( P j f P j * f ) g L z 2 )
Moreover, Abushaikha and Gosselin [21] explained that the horizontal shape factor ( σ Q ) and vertical shape factor ( σ G D ) may be defined as follows:
σ Q = 4 1 L x 2 + 1 L y 2 a n d , σ G D = 2 1 L z 2
Gilman and Kazemi [16,22] proposed a modification to the Sonier [23] formula to improve the representation of the gravity effect by replacing the gridblock thickness ( Δ z ) with matrix block thickness ( L z ), in addition to adding the depth for both fracture and matrix to approximate the gravity segregation in the fractures as illustrated in the following equation:
τ α = σ k m ( k r μ B ) P α f P α m + γ α f ( h α f D f ) γ α m ( h α m D m )
where h α f and h α m are the phase α saturation height in the fracture and matrix respectively, which could be calculated using the formula for both fracture and matrix:
h α f , m = S α f , m S α i r f , m 1 S r f , m S α i r f , m L z
Uleberg and Kleppe [24] referred to the importance of capillary pressure continuity in the matrix blocks that significantly impacted oil recovery, especially in the gas–oil gravity drainage process. Furthermore, they highlighted the importance of other parameters such as the shape of the matrix block, re-infiltration process, and diffusivity, which required accurate representation to depict the physical flow phenomena occurring between the fracture and matrix.
Alkandari [25] worked on scaling up the centrifugal experiments into the reservoir scale in a gas–oil system to evaluate recovery under gravity drainage. He concluded a hyperbolic decline of the oil recovery due to gravity drainage and he recommended construction of the transfer function using the oil recovery curves of the experimental results. Balogun [26] used several scenarios to demonstrate the effect of different recovery mechanisms and to improve the transfer function by matching the results of a fine-grid model. Abushaikha and Gosselin [21] studied the effect of the shape factor using different matrix shapes and they examined several sensitivity scenarios, in addition to comparing and evaluating different forms of shape factors and transfer functions including the gravity term.
Su [27] suggested using a dynamic shape factor derived from a comparative study using fine-grid model results. The author proposed a simple correlation to fit the shape factor by using fitting parameters as illustrated below:
σ v ( L z = 6.34 m ( 20.8 f t ) ) n = S n o ( n 1 ) α * * β
where α * * and β in Equation (12) are fitting parameters that adjust the dual-porosity model results to match the fine-model outcome. Furthermore, as the formula illustrates, these results are limited for specific vertical matrix block dimension L z of 6.34 m (20.8 ft) and it is required to be adjusted for different matrix block heights. Despite the good results obtained by the new suggested shape factor, it was only able to match the recovery profile of the uppermost cell of the vertical stacked cells 1D model, while a block-to-block connection is used for the rest of the cells. Moreover, the error evaluation of the model validation cannot be supported as it was based on the same fine model that the improved shape factor was fitted to in order to match its results. This was in addition to the difficulties of determining the uppermost cells in the real reservoir model, which were made using their suggestions that were impractical for real case studies. Other transfer functions with non-Darcy-form equations (e.g., [28,29]) have not been tested in the current work due to their unstable performance.
The transfer function has been intensively studied to represent the physical parameters accompanying fluid exchange (e.g., gravity, capillary pressure, diffusion) that should be accurately accounted for in order to improve the calculation of the dual-porosity model. Despite the abovementioned progress in modelling the exchange rate between the matrix and fractures for the dual-porosity model, it is still impossible to capture the transient flow effect as a single value only of fluid saturation assigned to the matrix. Moreover, Gilman and Kazemi’s suggestion [16] of matrix refinement resulted in an overwhelming number of cells that can be equal to the number of cells in the fine model that required significantly higher computation time compared to the original dual-porosity model and nullified the advantage of the model. However, Quandalle’s model [17] is preferable due to separation of the vertical flow potential from the horizontal flow, as the gravity drainage works mainly in the vertical direction, which reduces oil recovery overestimation and improves the model outcomes due to elimination of the gravity effect in the horizontal flow direction.
The current work has two objectives. The first is to illustrate the importance of the gravity drainage mechanism in the gas–oil system using fine-scale modelling as well as investigating the consequences of using various mathematical models on the field performance and saturation profiles across the reservoir. This objective was achieved using various modelling scales—fine-, medium-, and reservoir-scale models—to demonstrate these differences. The second is to evaluate the impact of gravity drainage parameters, such as matrix block dimensions and matrix permeability, on the speed and amount of the oil recovery. The effect of the abovementioned parameters has been shown through several sensitivity scenarios to compare the oil recovery for an acceptable range of each parameter. Furthermore, this work helps to gain an understanding to improve the modelling of the gravity drainage mechanism, and carefully select the matrix characteristics that control the oil recovery and recovery speed from the matrix blocks.

2. The Recovery Mechanism of the Gravity Drainage-Model Comparisons and Parameters Sensitivities

Despite the presented improvements in some mathematical formulas of the gravity drainage process or the transfer function in general. It would be impossible to apply these equations at the field scale. Furthermore, their performance and stability have not been verified at this scale. Therefore, the available options in the ECLIPSE simulator have been used to compare the behavior of different gravity models and their consequences on the traditional history-matching parameters such as Bottom Hole Pressure (BHP), Gas–Oil Ratio (GOR), and oil production rate. Furthermore, sensitivity cases have been implemented to evaluate the role of both matrix permeability in the vertical direction ( k z ) and the height of the matrix blocks ( L z ) on the ultimate oil recovery.
The current work was divided into three evaluation steps. The evaluation started from the medium scale to illustrate the differences between various gravity drainage models. Then, a fine grid was constructed to examine the fluid exchanges between the matrix blocks and fractures driven by gravity effect due to density differences between the gas and oil until the system reaches to an equilibrium state. Finally, there was an investigation into the gravity drainage effect at a full-field scale using a real case of a fractured reservoir.

2.1. The Effect of the Gravity Drainage Medium-Scale Modelling

The second 2D model of the 6th SPE comparative solution project [30] has been used to illustrate the effect of the different gravity drainage expressions that were mentioned previously on the ultimate recovery from the matrix gridblocks and to estimate the remaining oil saturation in the matrix cells. The 6th SPE comparative solution project consists of a simple cross-sectional dual-porosity model which comprises five layers with uniform thickness as shown in Figure 2. Further model details, dimensions, and rock and fluid properties can be found in [30]. A natural depletion scenario was simulated in the model using a single well producing from the fifth layer.
The following comparison and sensitivity cases have implemented to evaluate the gravity formulas effect on the model performance:

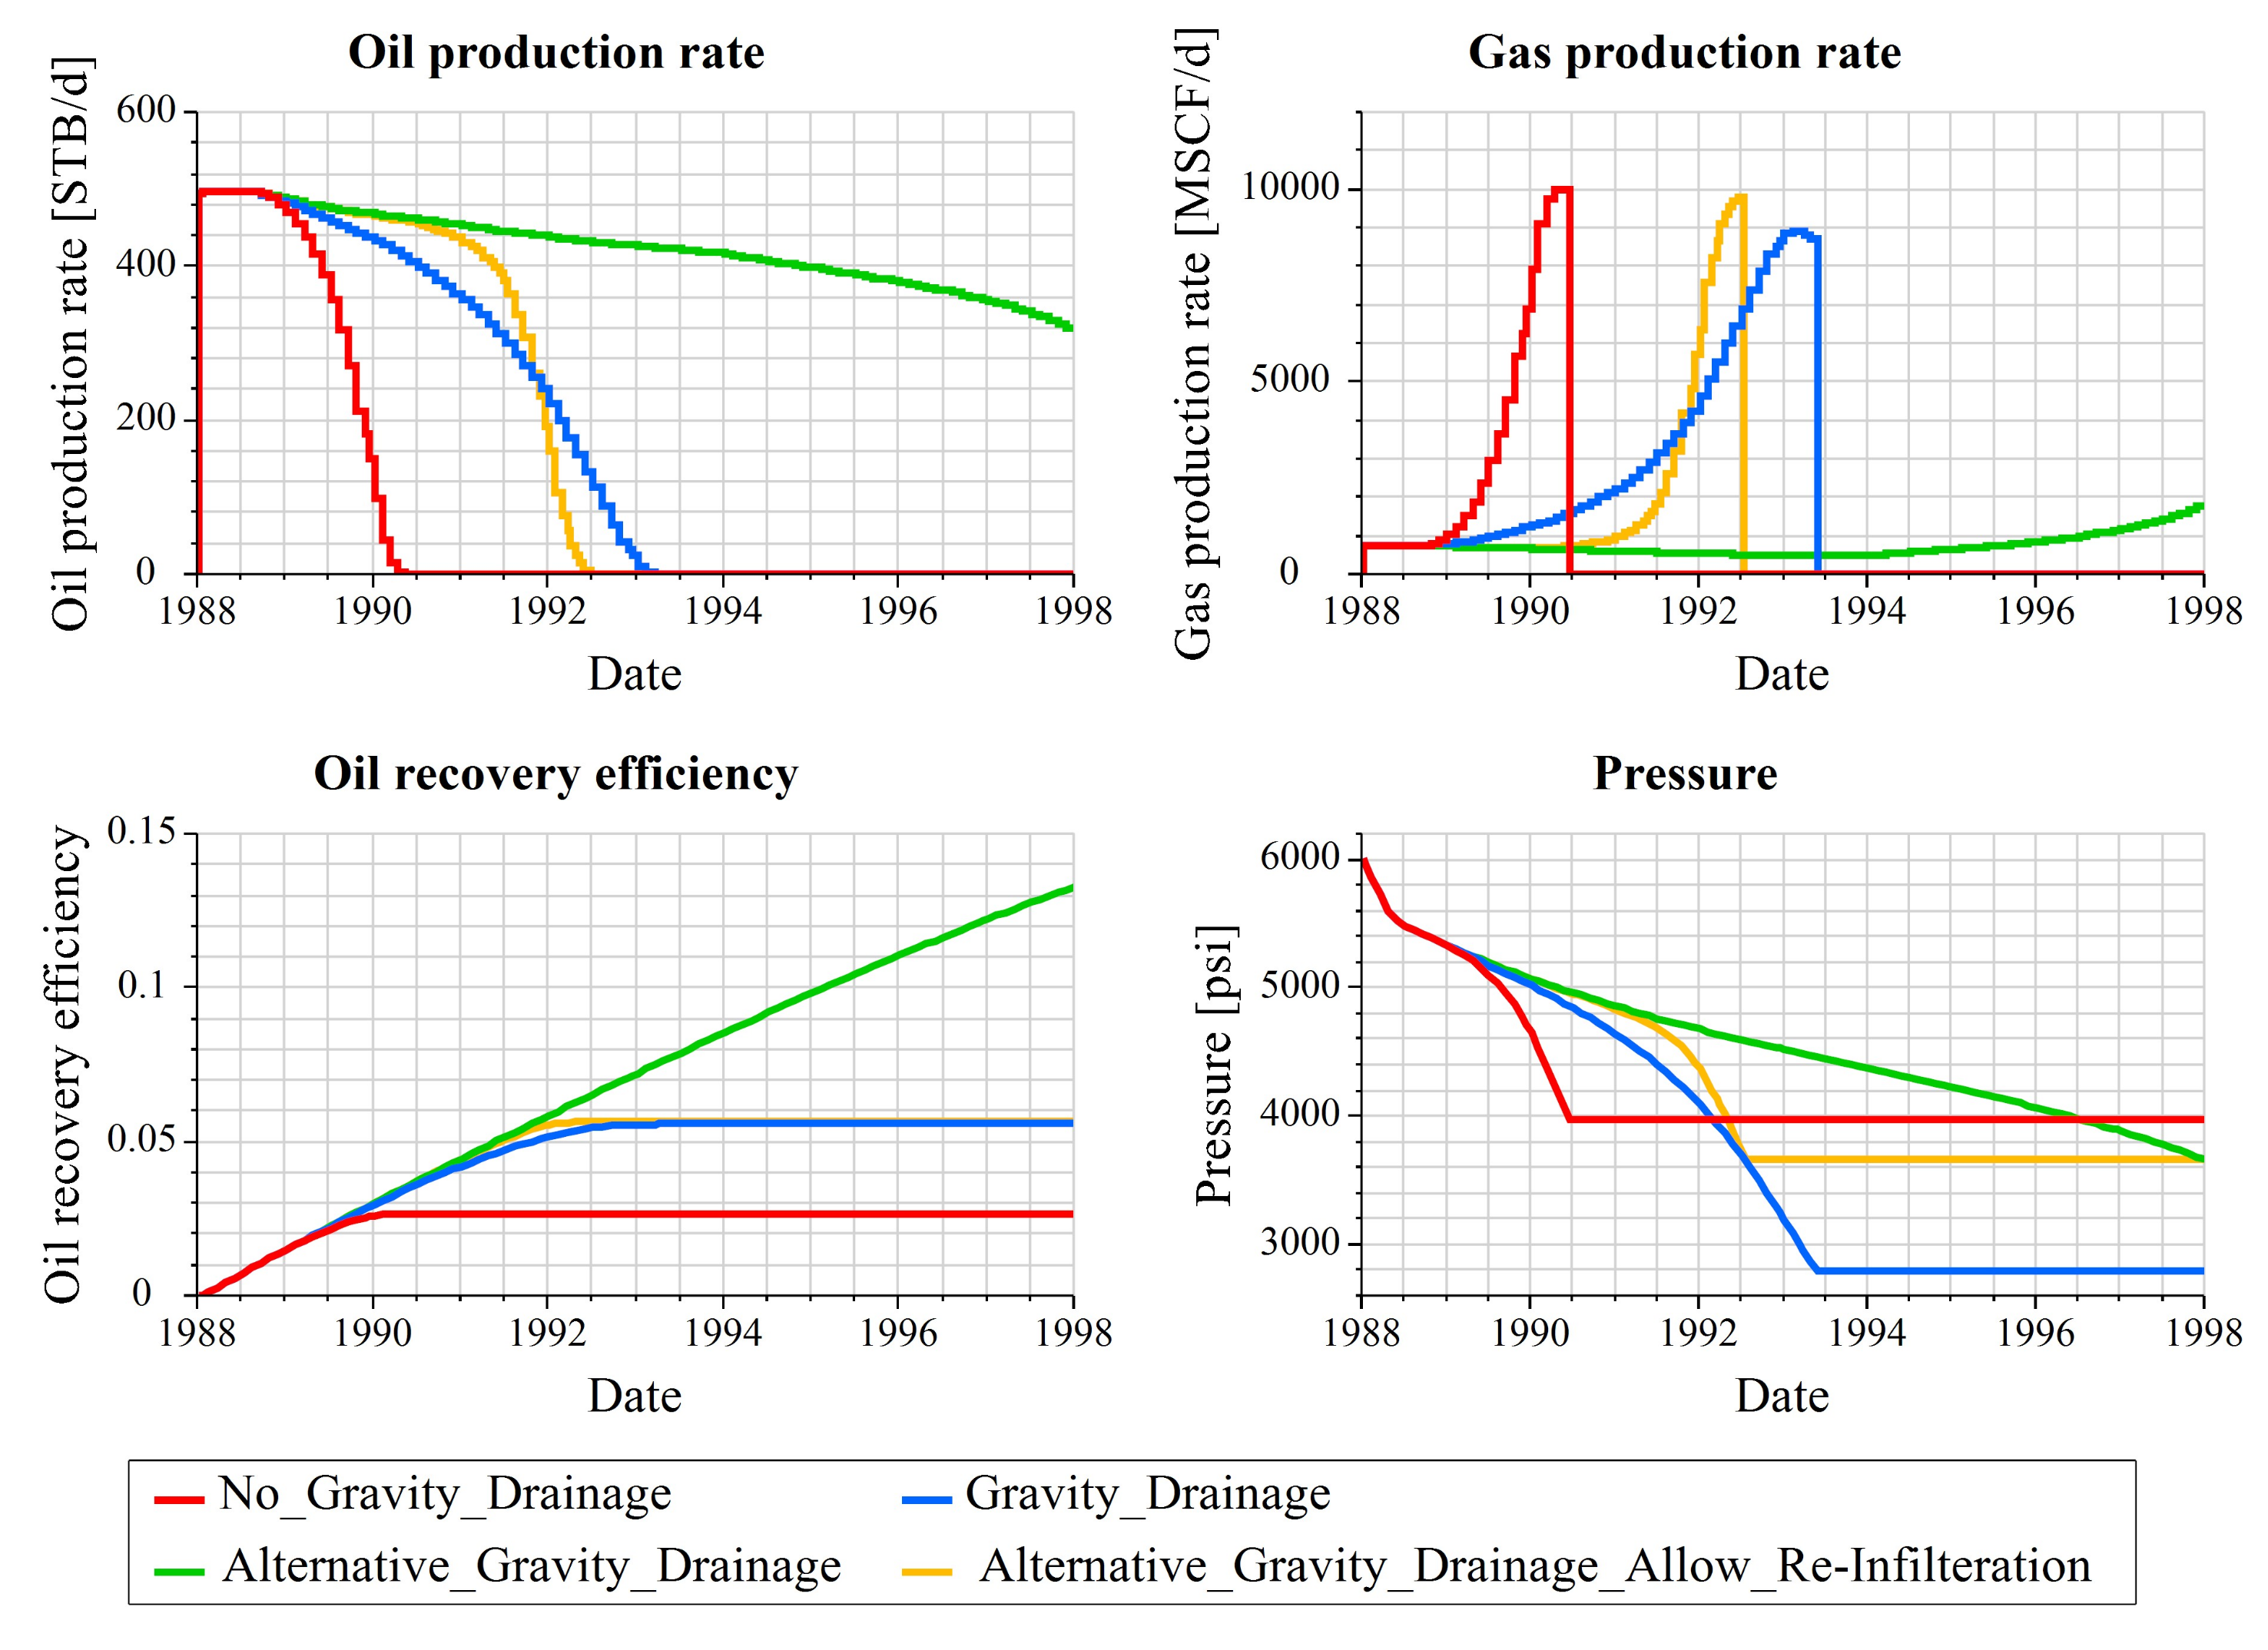
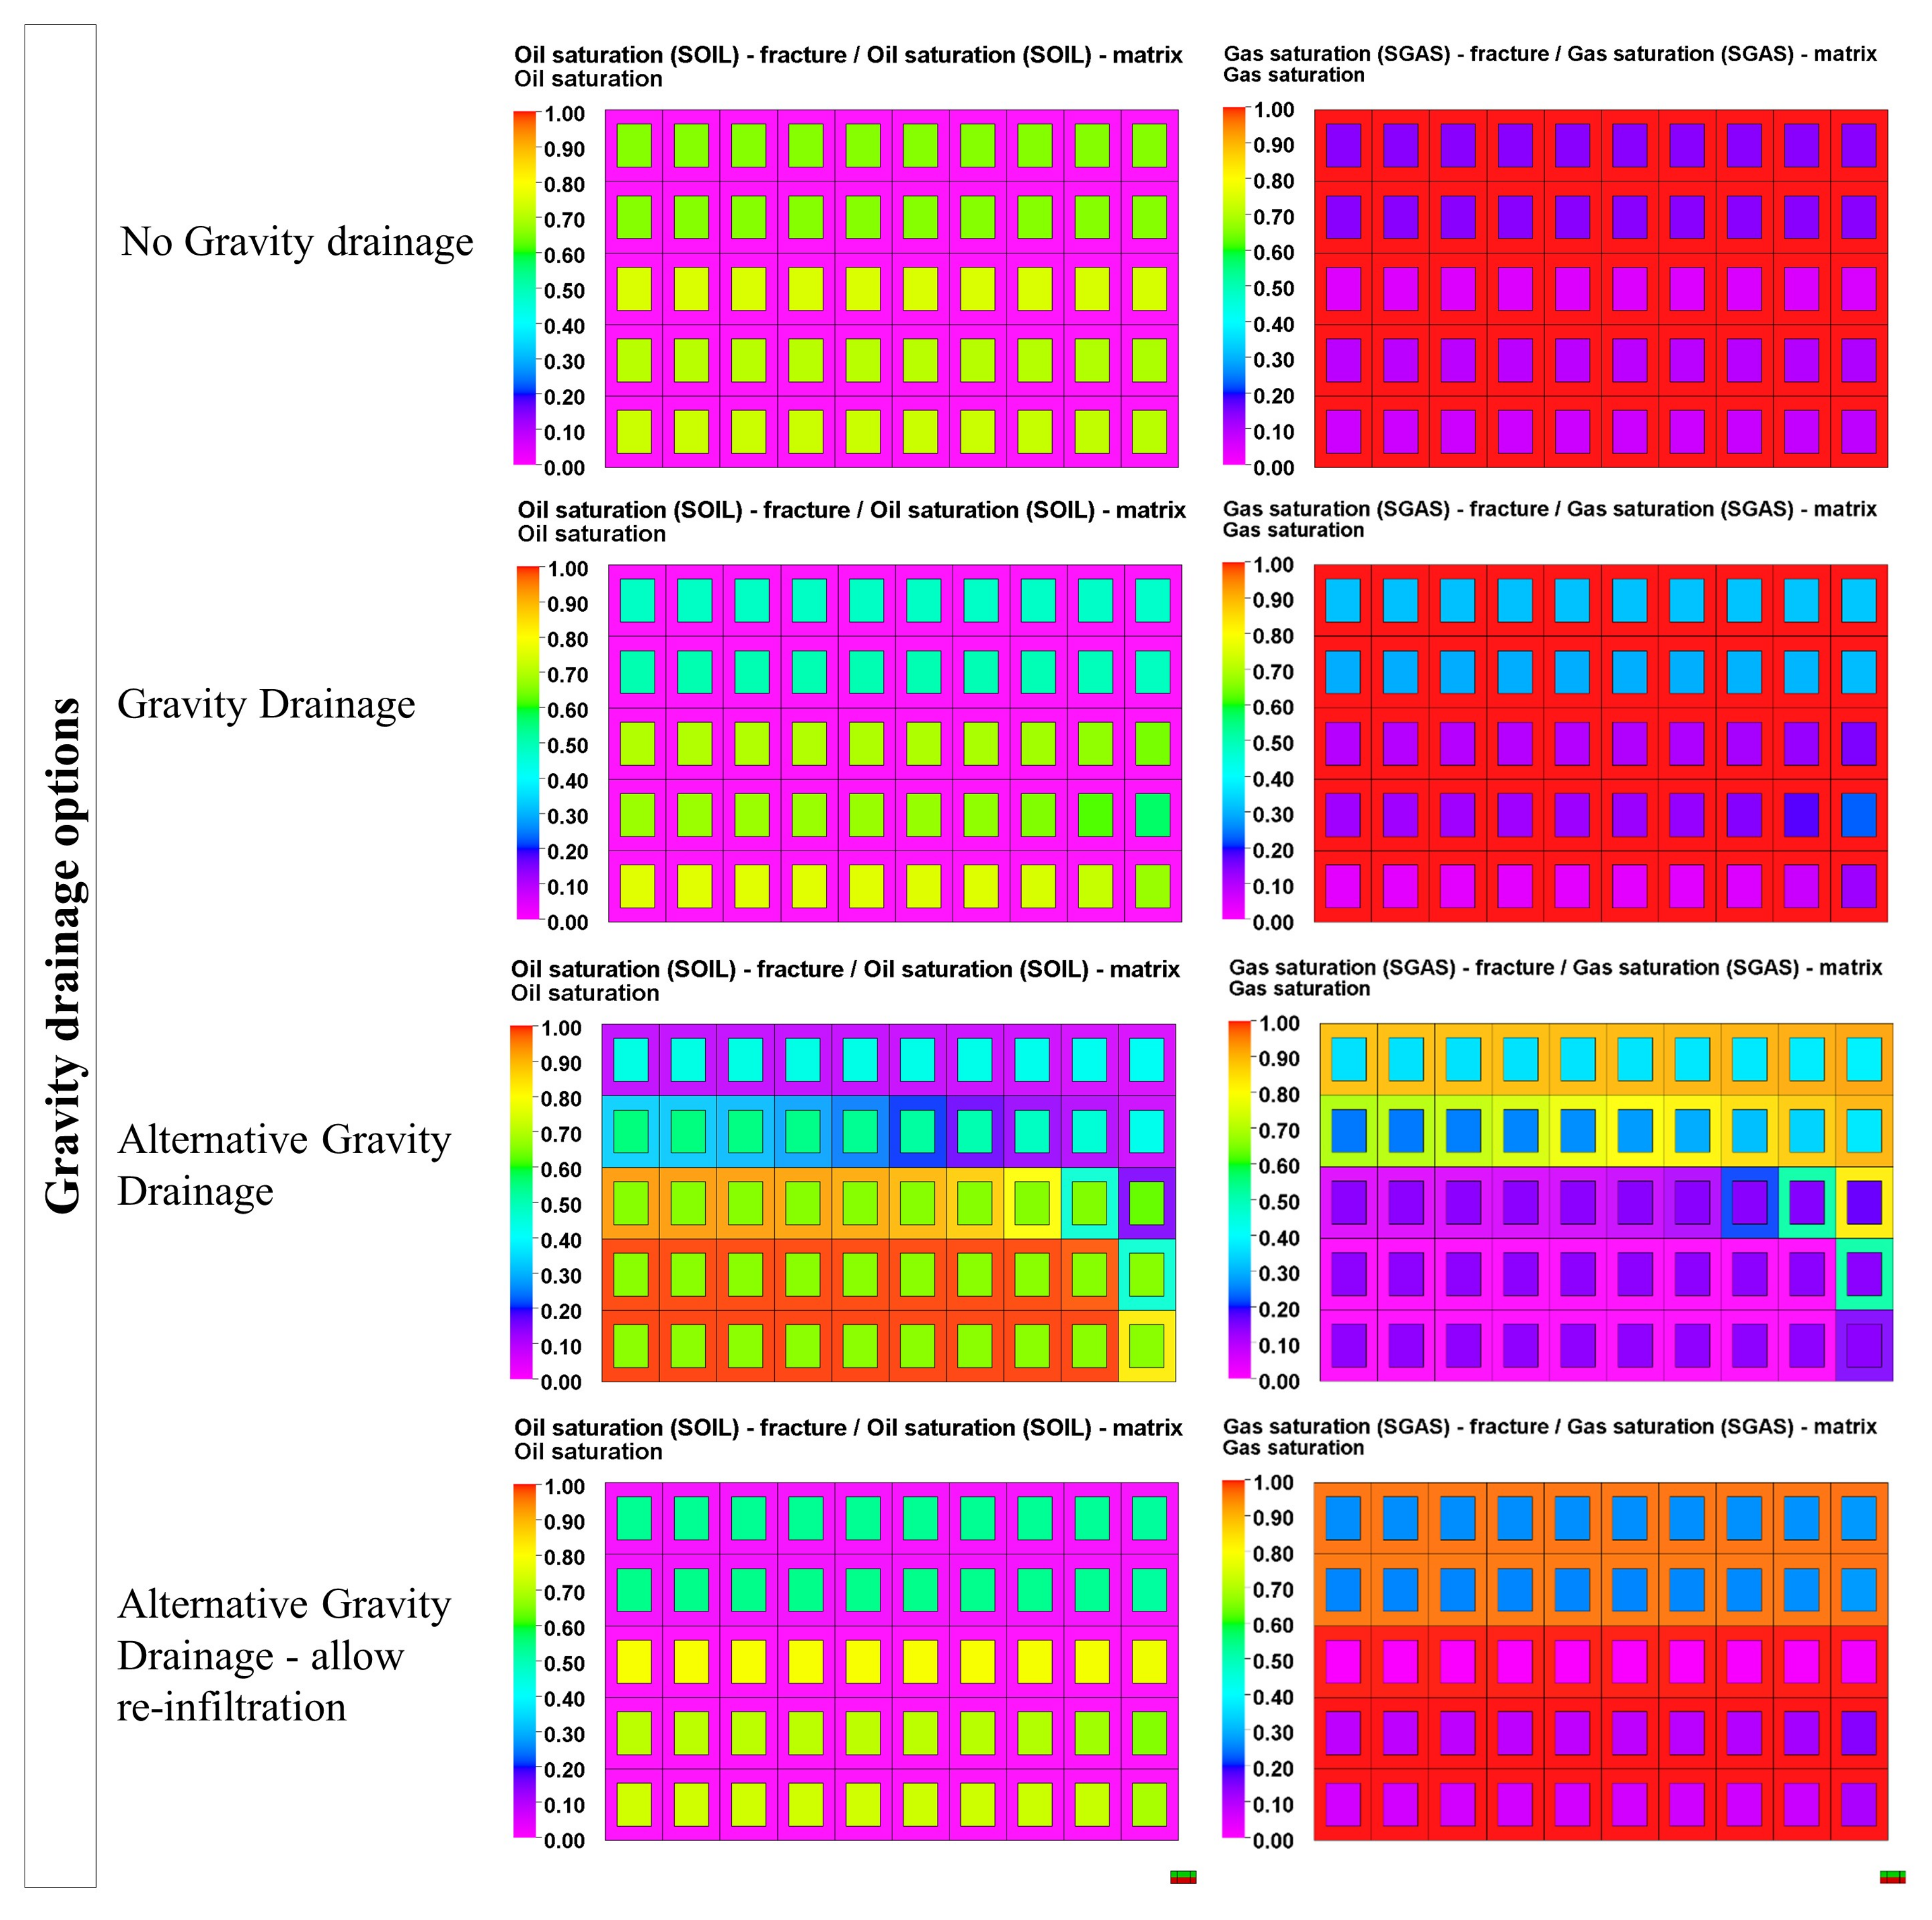
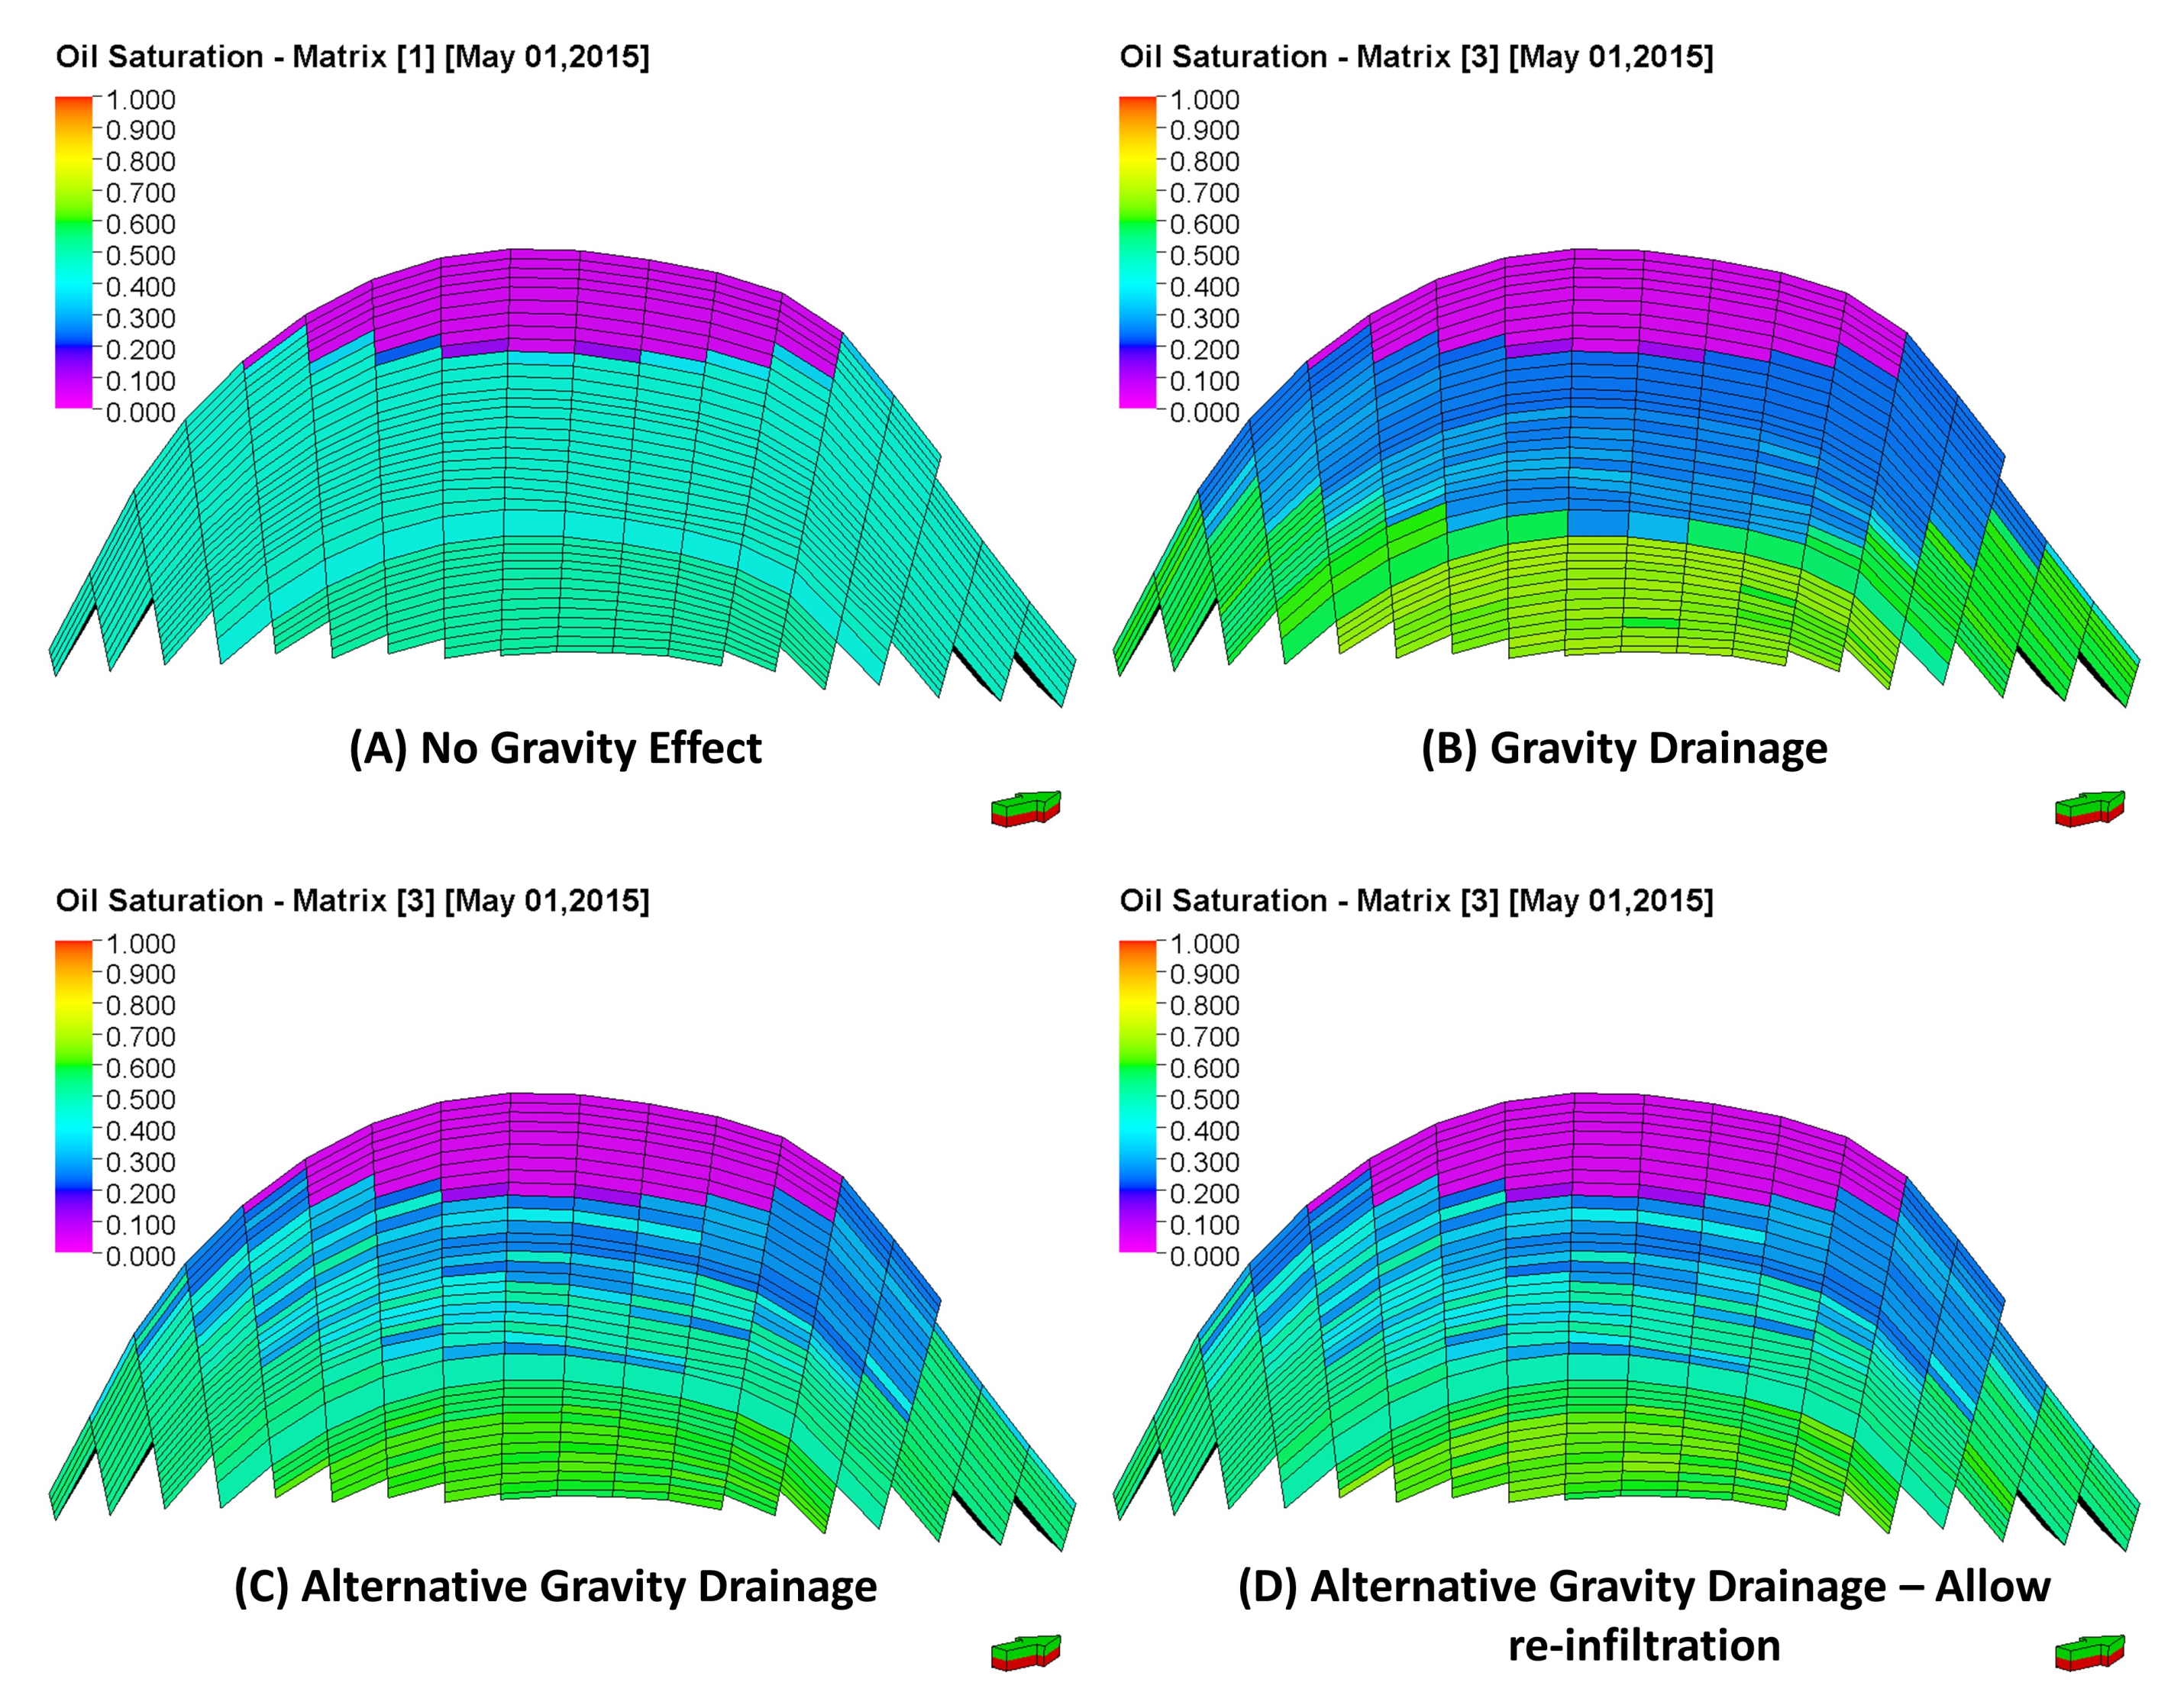
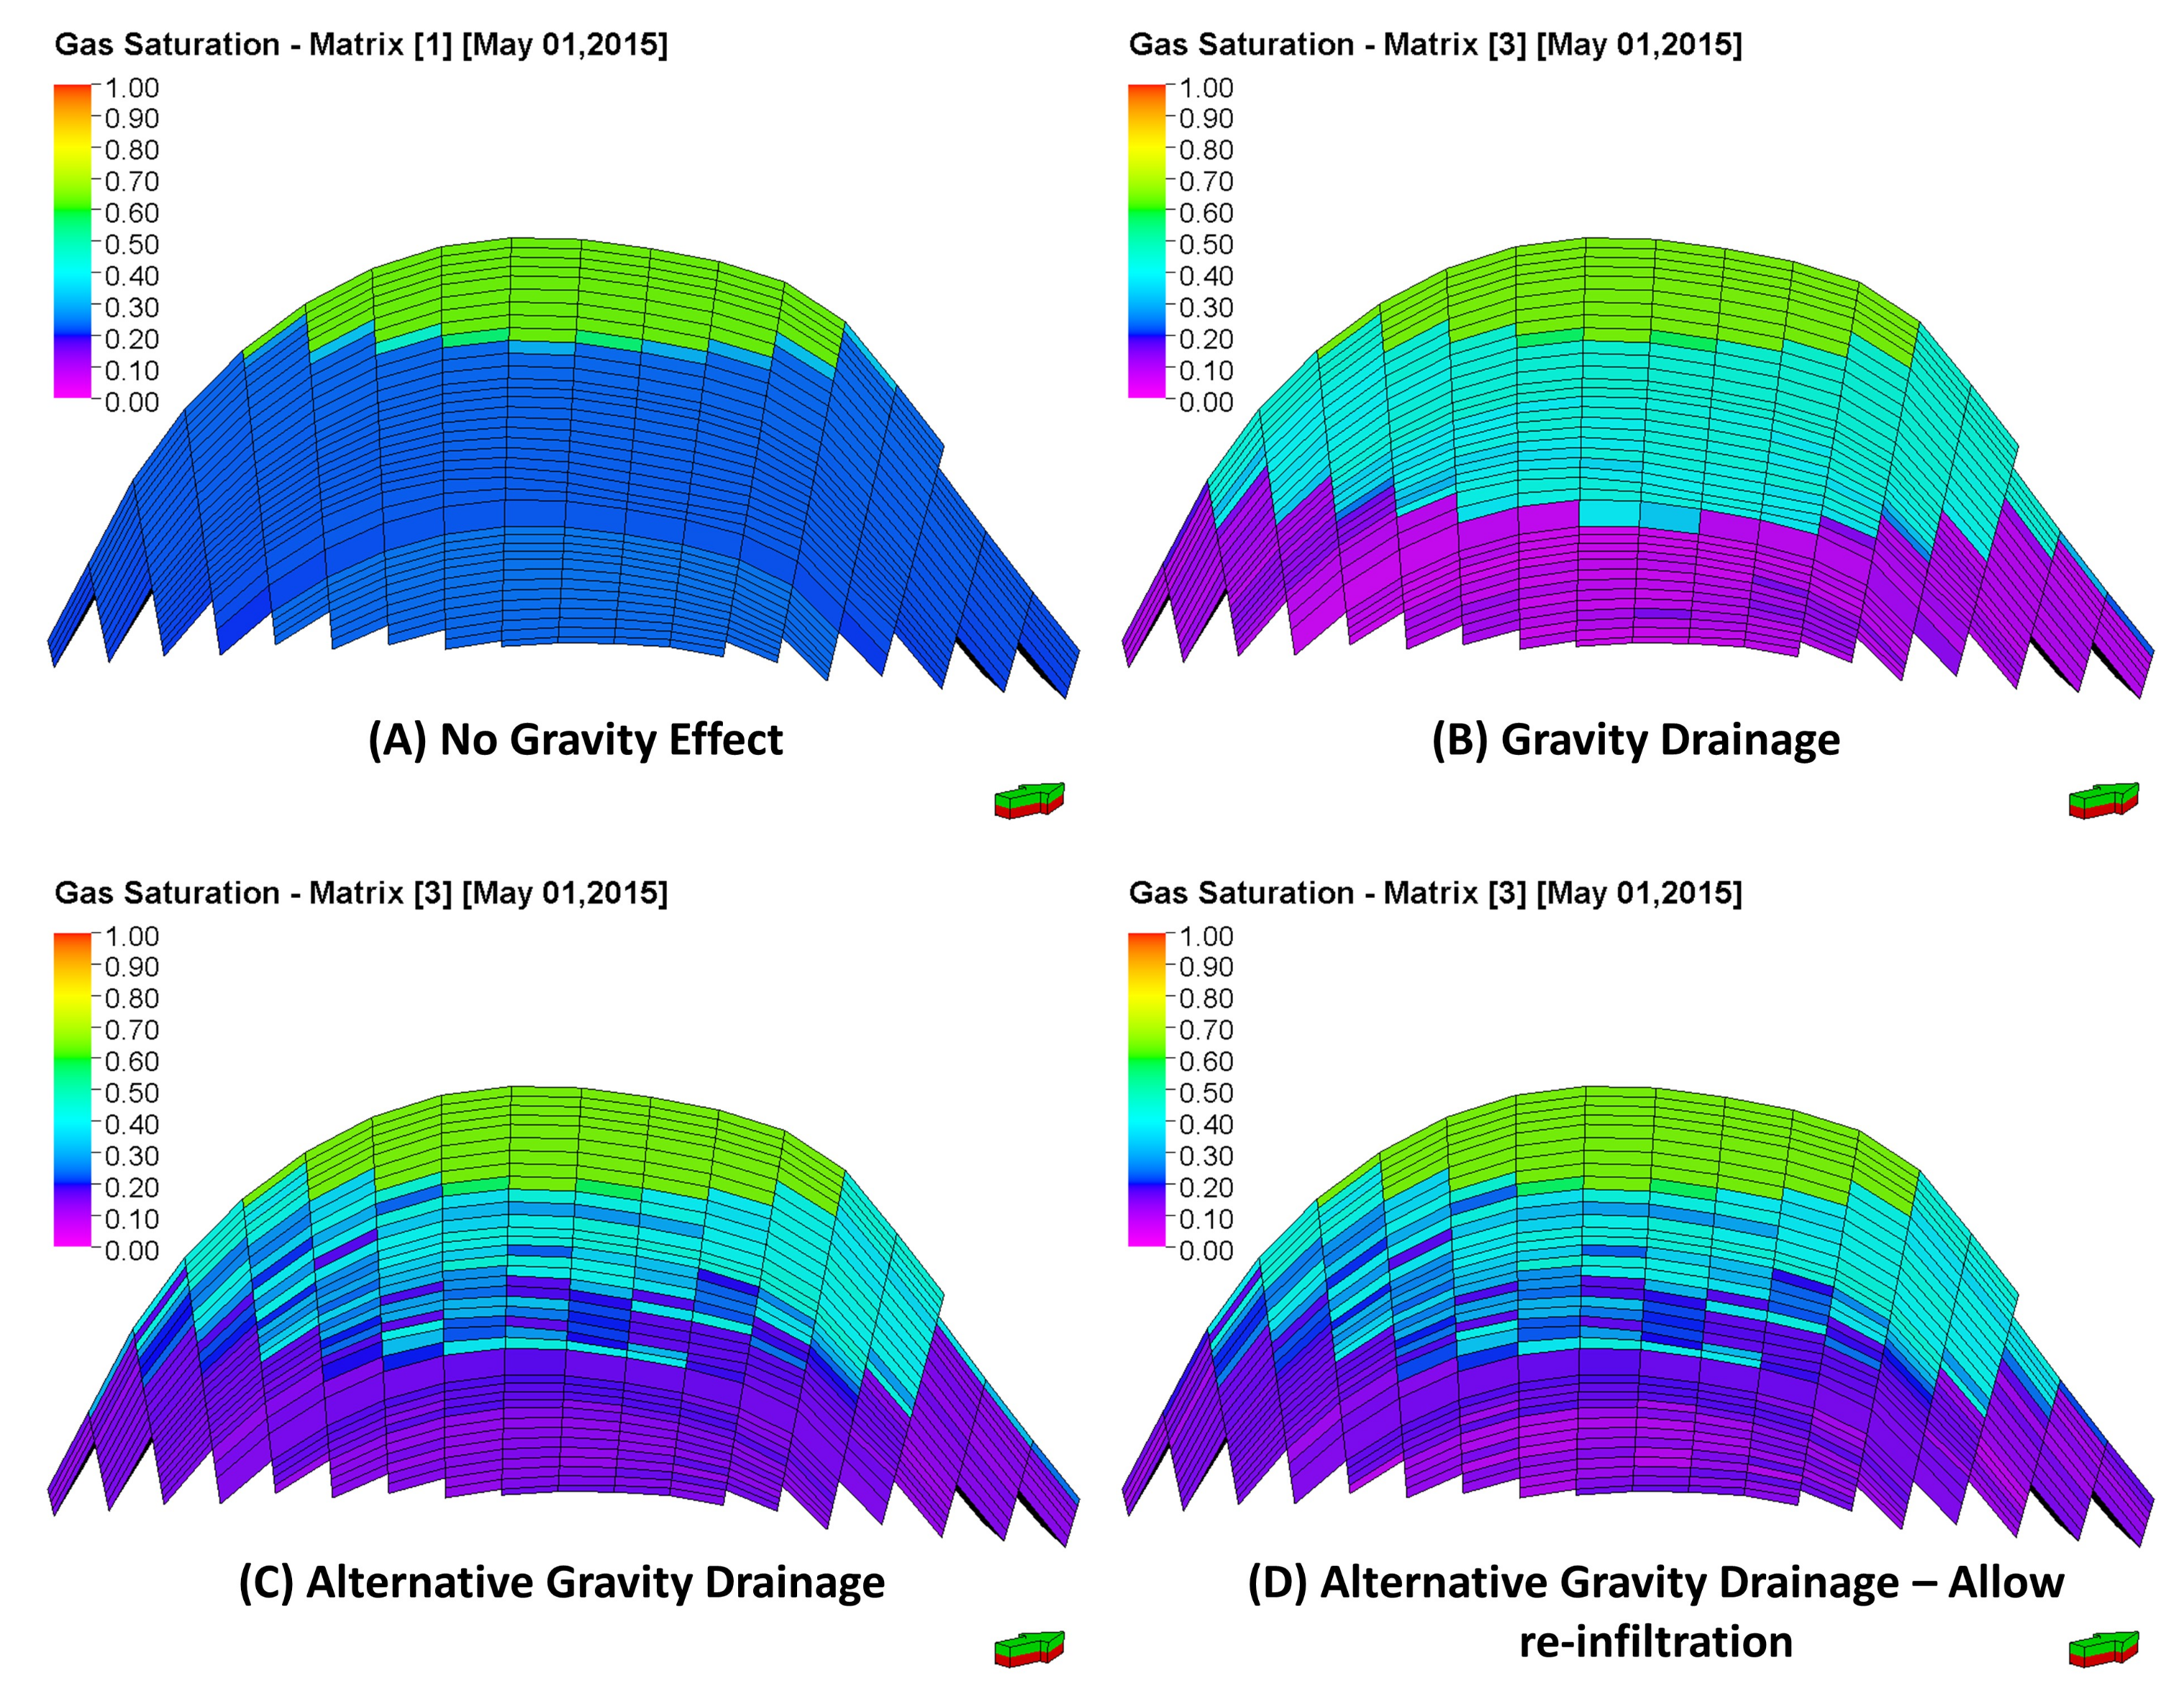
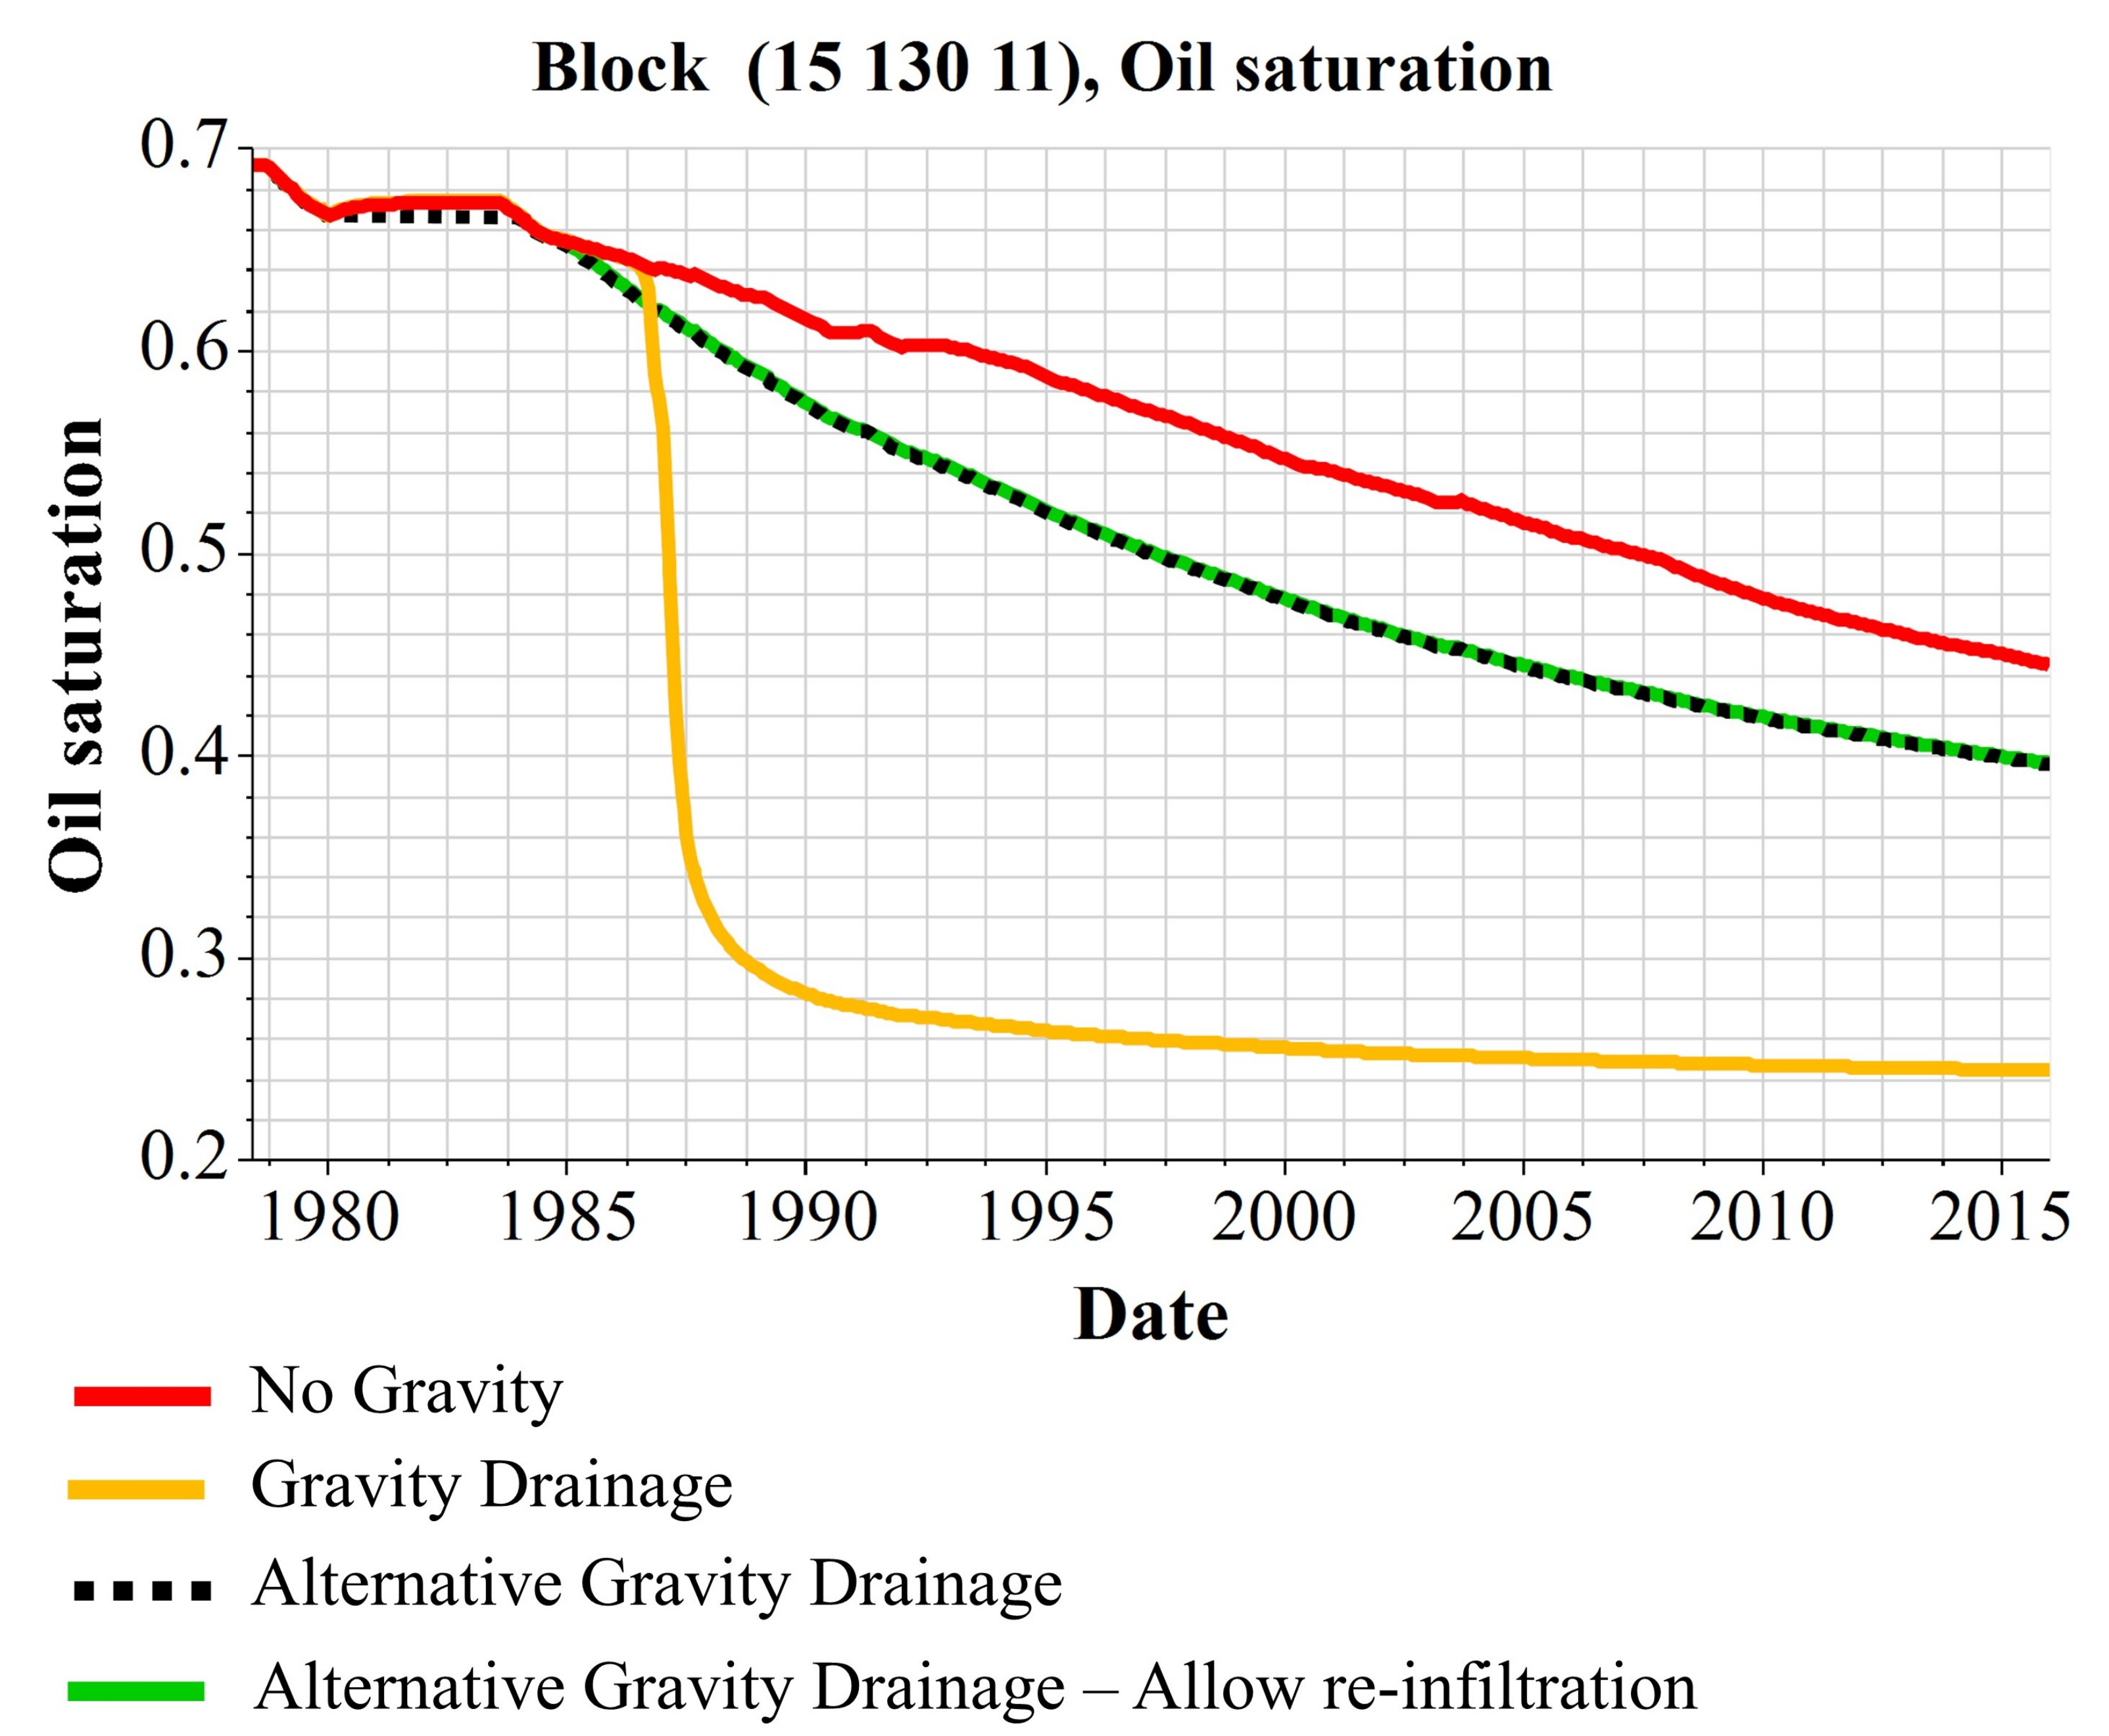
2.1.1. Comparison of the Gravity Drainage Models

There are several gravity drainage formulations suggested for evaluating the fluid exchange between the matrix and fracture domain due to gravity force. Light is shed on some of the gravity expressions in Equations (8) and (10) where, in these equations, the oil is allowed to flow from the matrix to the fractures but the reverse flow of oil is not allowed (e.g., [15,17]). Moreover, Quandalle and Sabathier formulations can be set to allow the flow of oil from the fractures to the beneath matrix block (i.e., re-infiltration as explained in Figure 3) to represent the fluid flow between the two domains due to gravity. In the 6th comparative solution project, the Kazemi gravity model was used in the project, and the results were compared to the other results of various gravity drainage models, as listed below:
A.
No gravity drainage
B.
Gravity Drainage (Gilman and Kazemi Model)
C.
Alternative Gravity Drainage (Quandalle and Sabathier Model 1)
D.
Alternative Gravity Drainage allowing re-infiltration (Quandalle and Sabathier Model 2)
The simulation results of the abovementioned gravity drainage options (A, B, C, and D) for the 6th comparative solution project are illustrated in Figure 4. The simulation outcome exhibited remarkable differences in model behavior, which highlighted the role of the gravity mechanism. Oil recovery could be a clear example to demonstrate that oil recovery increased by approximately 10% when the gravity option switched from No Gravity to Alternative Gravity Drainage.
Furthermore, the performance of each gravity drainage formula can be demonstrated by comparing the oil and gas saturation distribution at the end of the simulation time as shown in Figure 5. The three scenarios (No Gravity, Gravity Drainage and Alternative Gravity Drainage-allow re-infiltration) have demonstrated a lower performance by lower oil recovery (Figure 4), high gas saturation in the fractures, and poor matrix block recovery compared to the Alternative Gravity Drainage scenario.

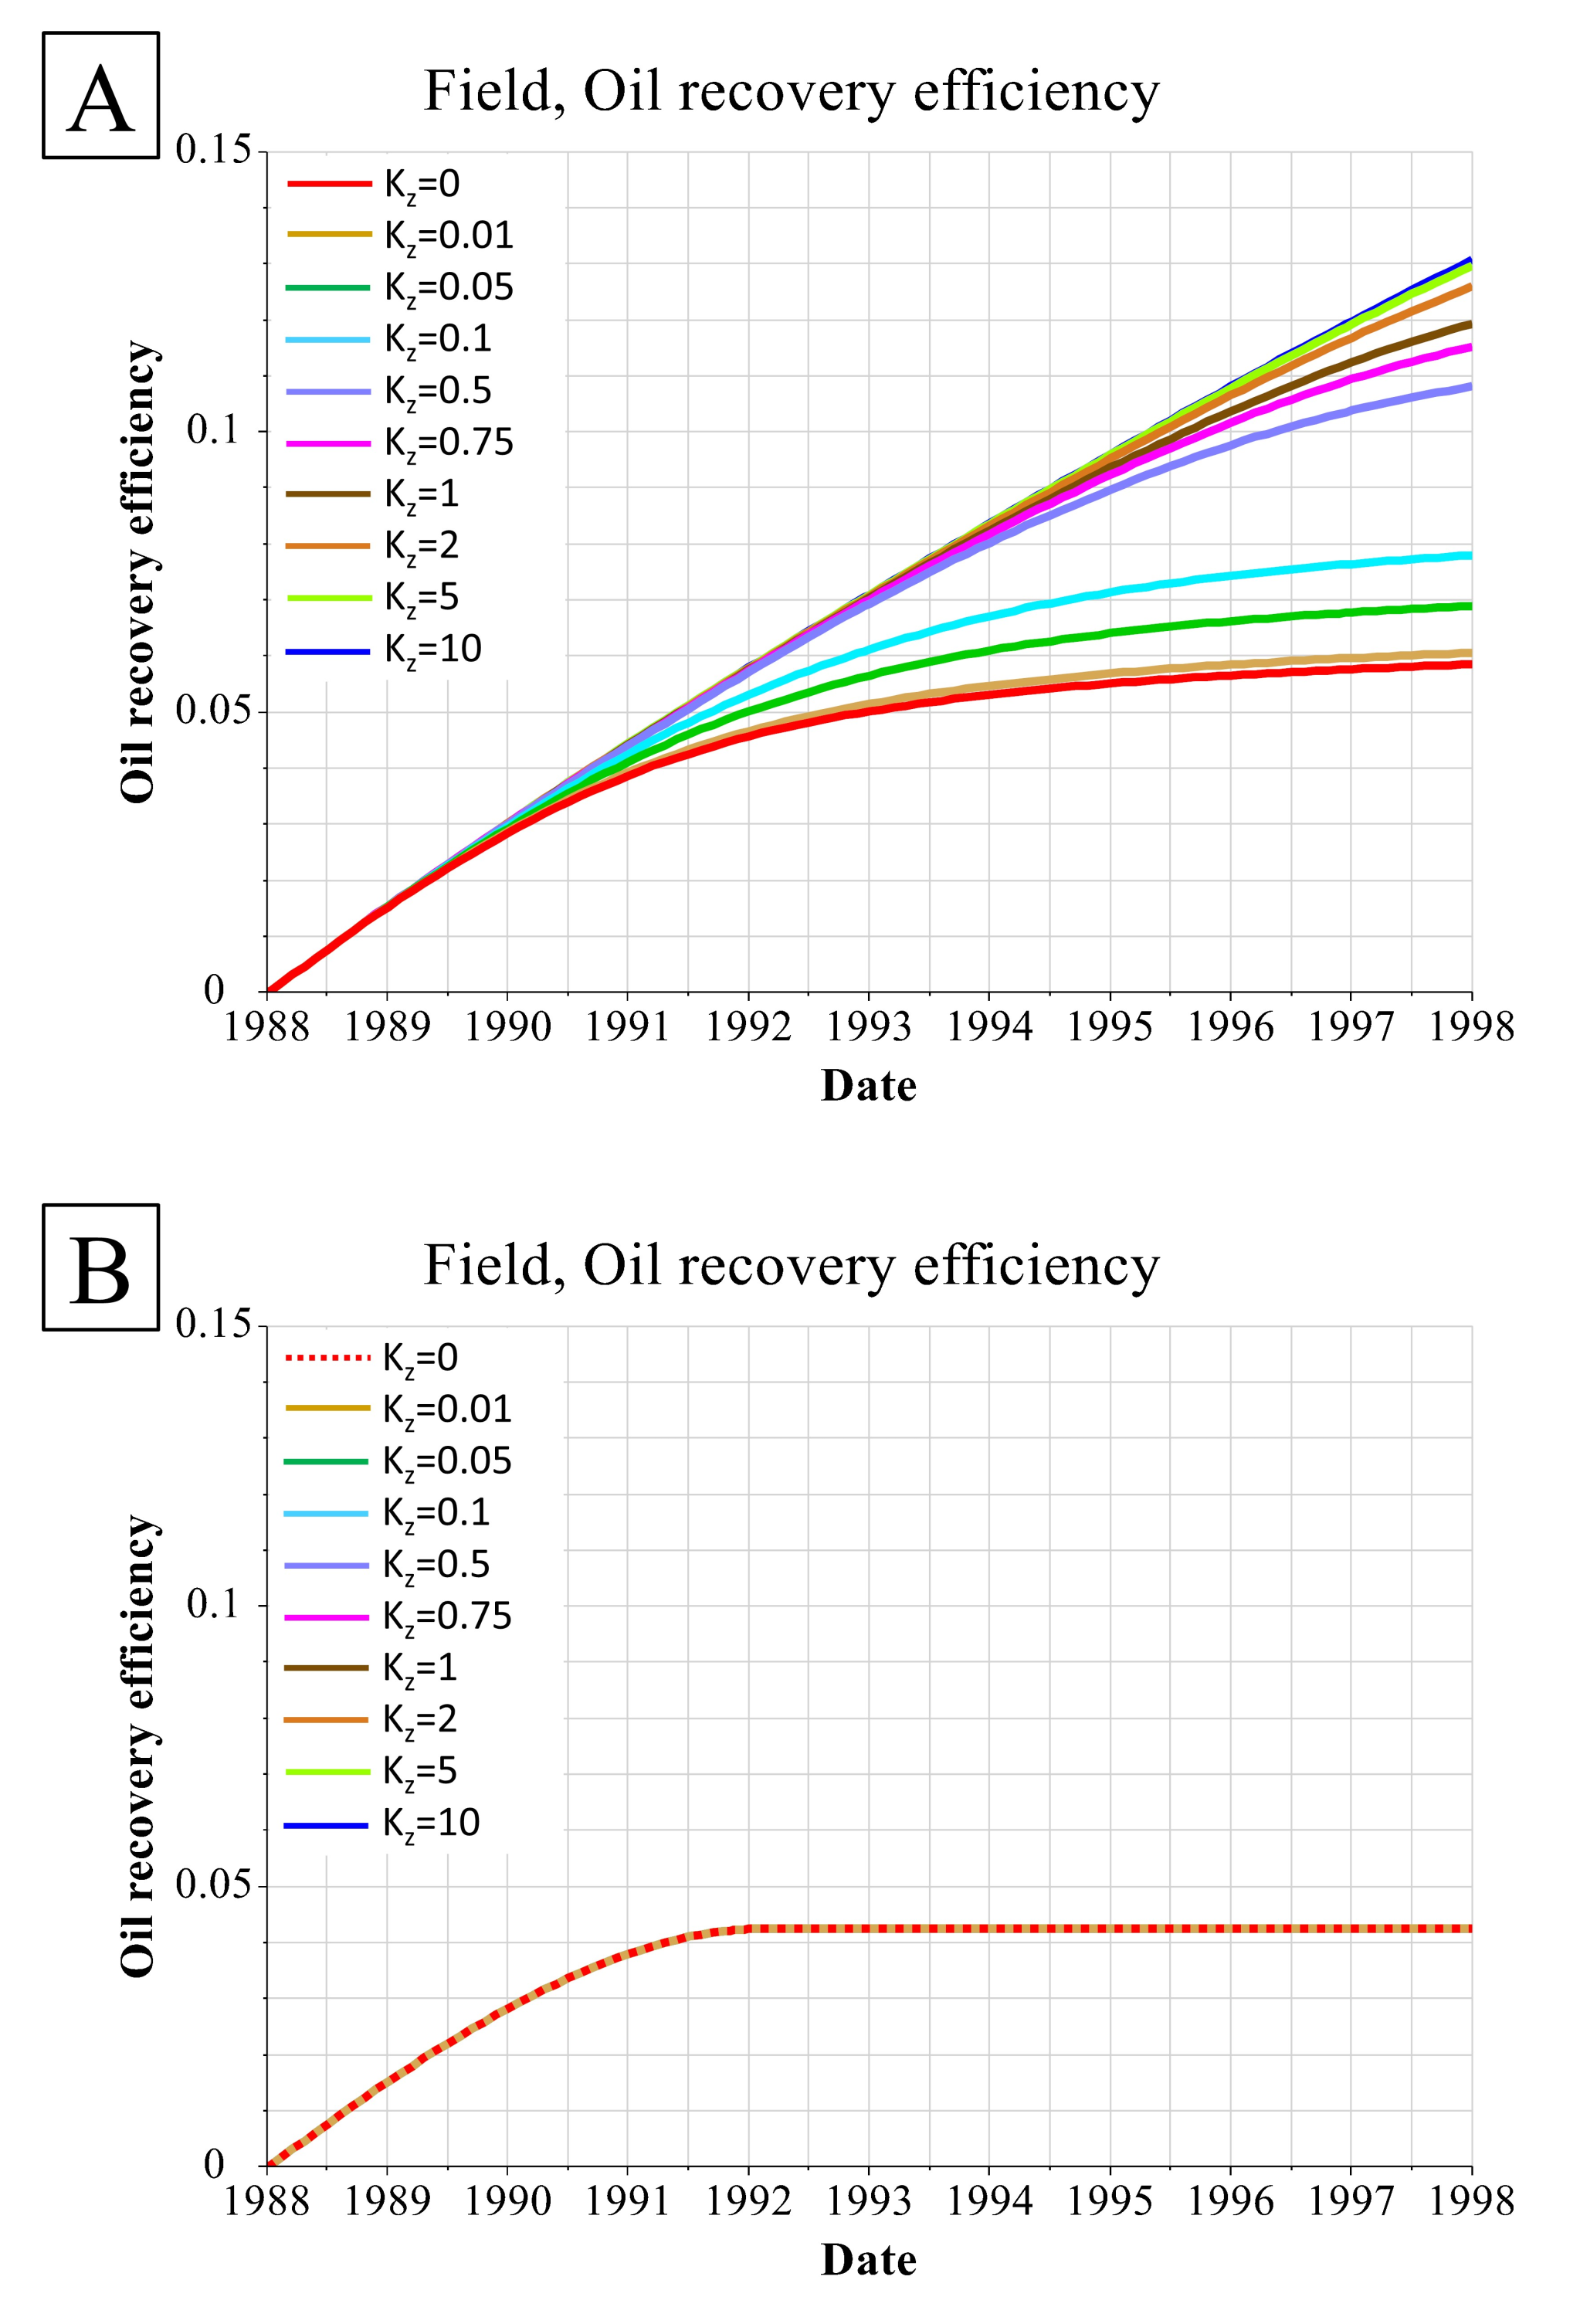
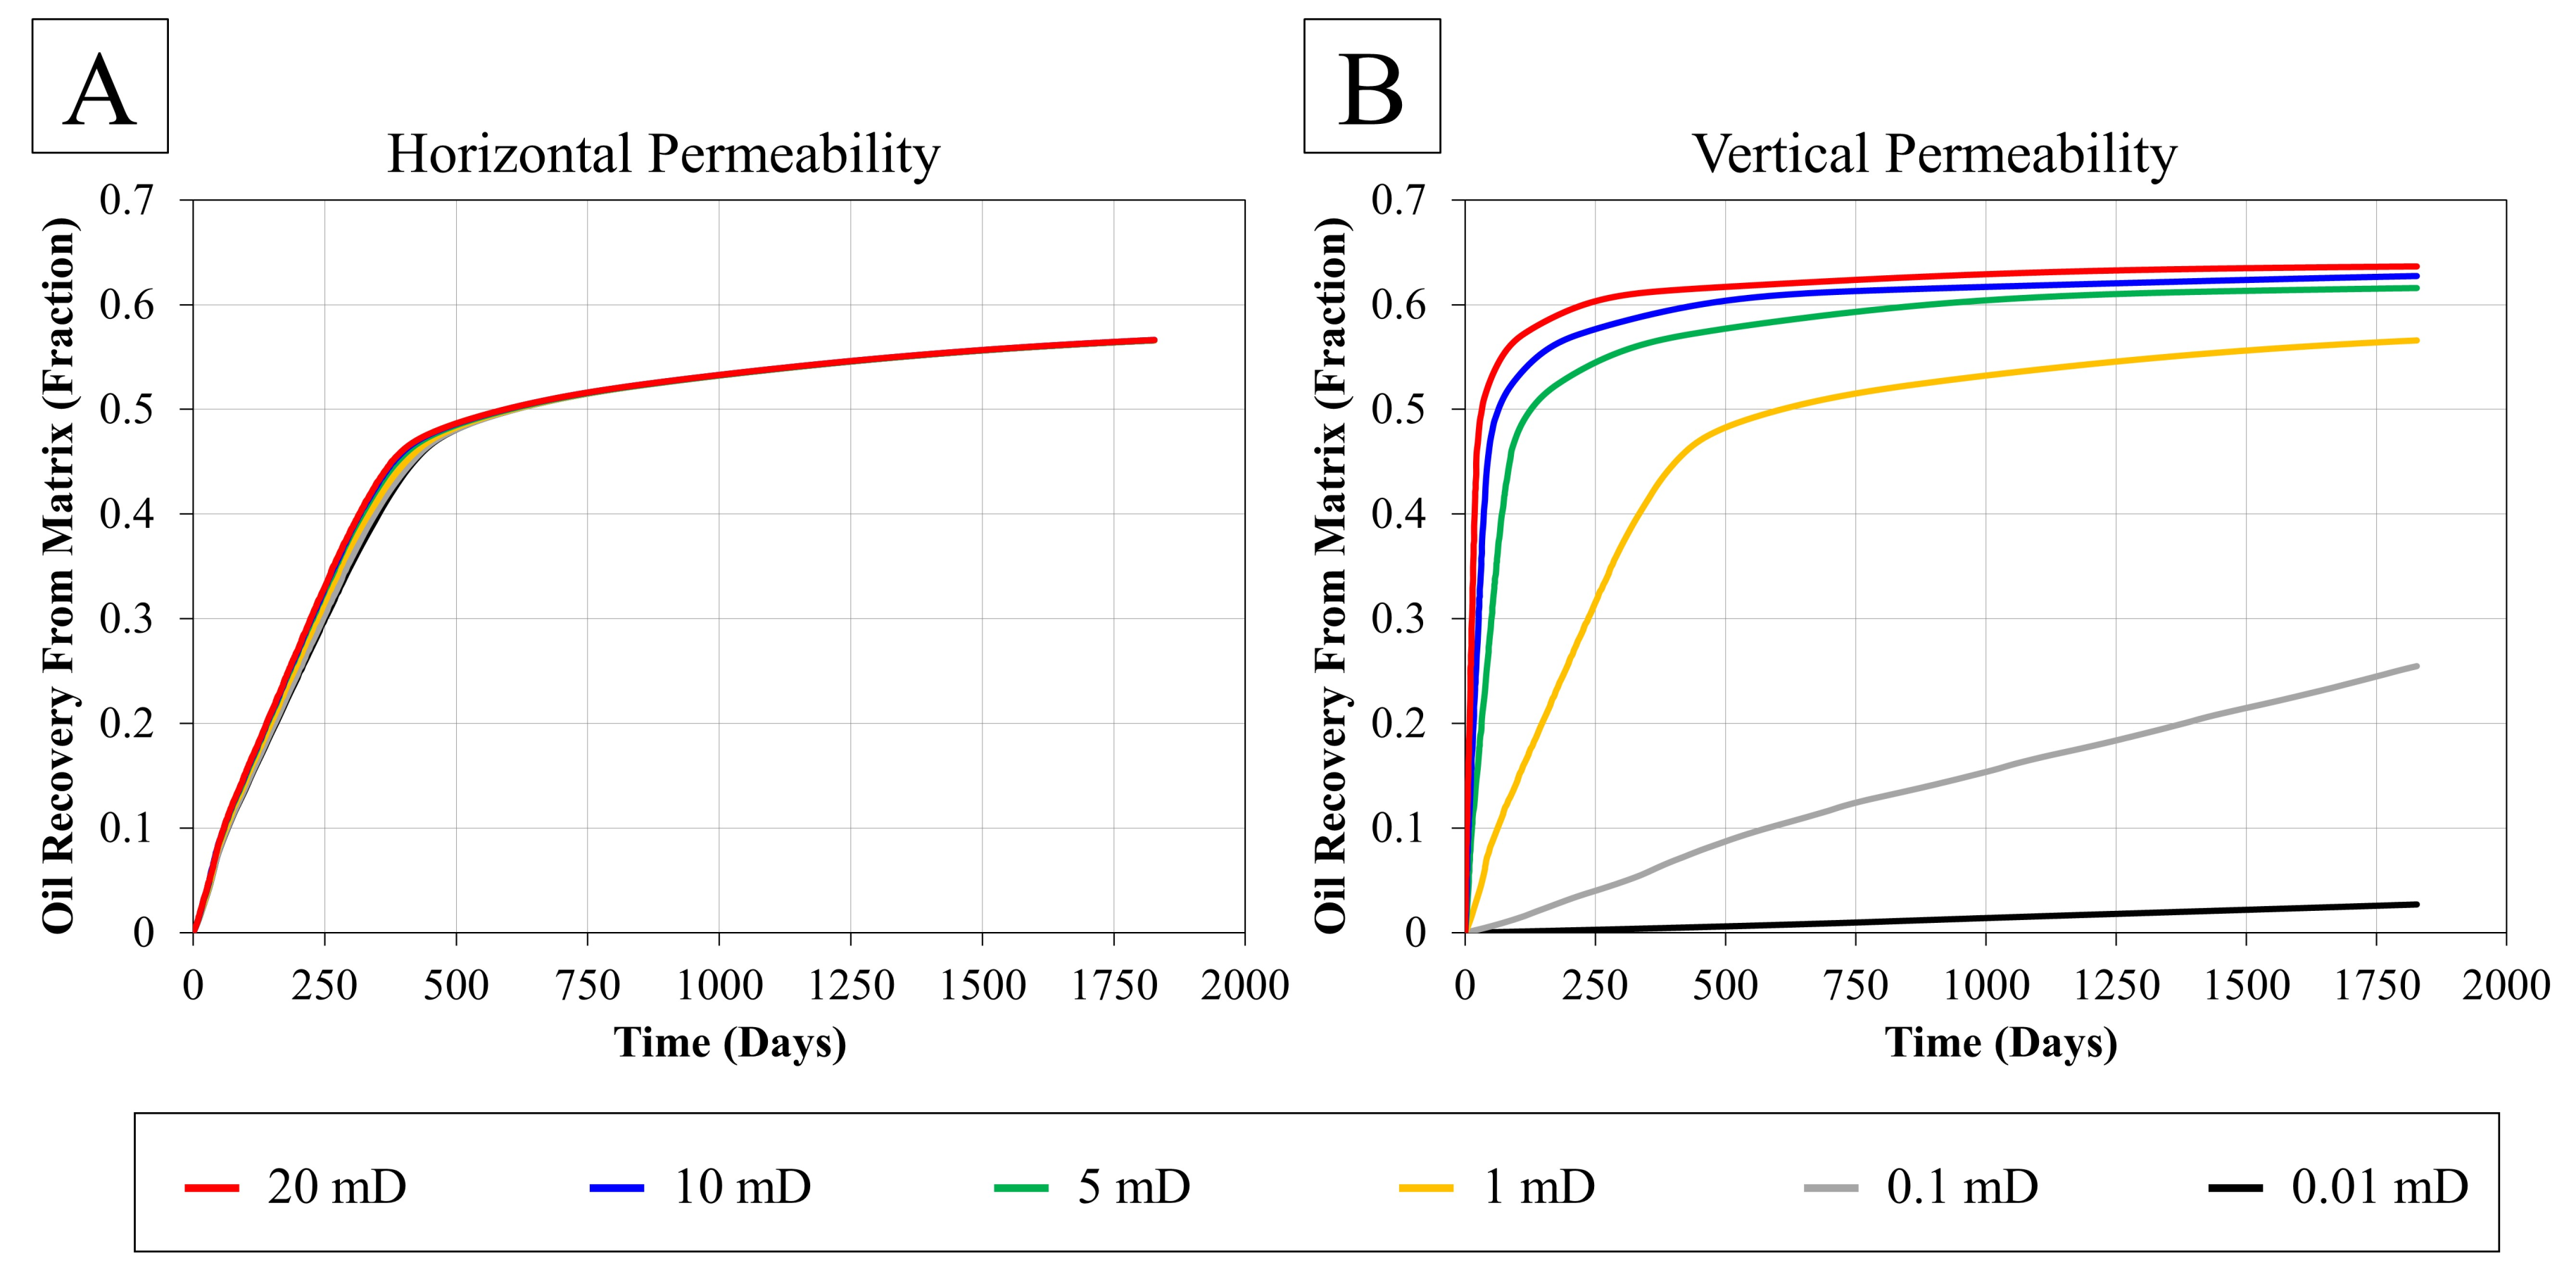
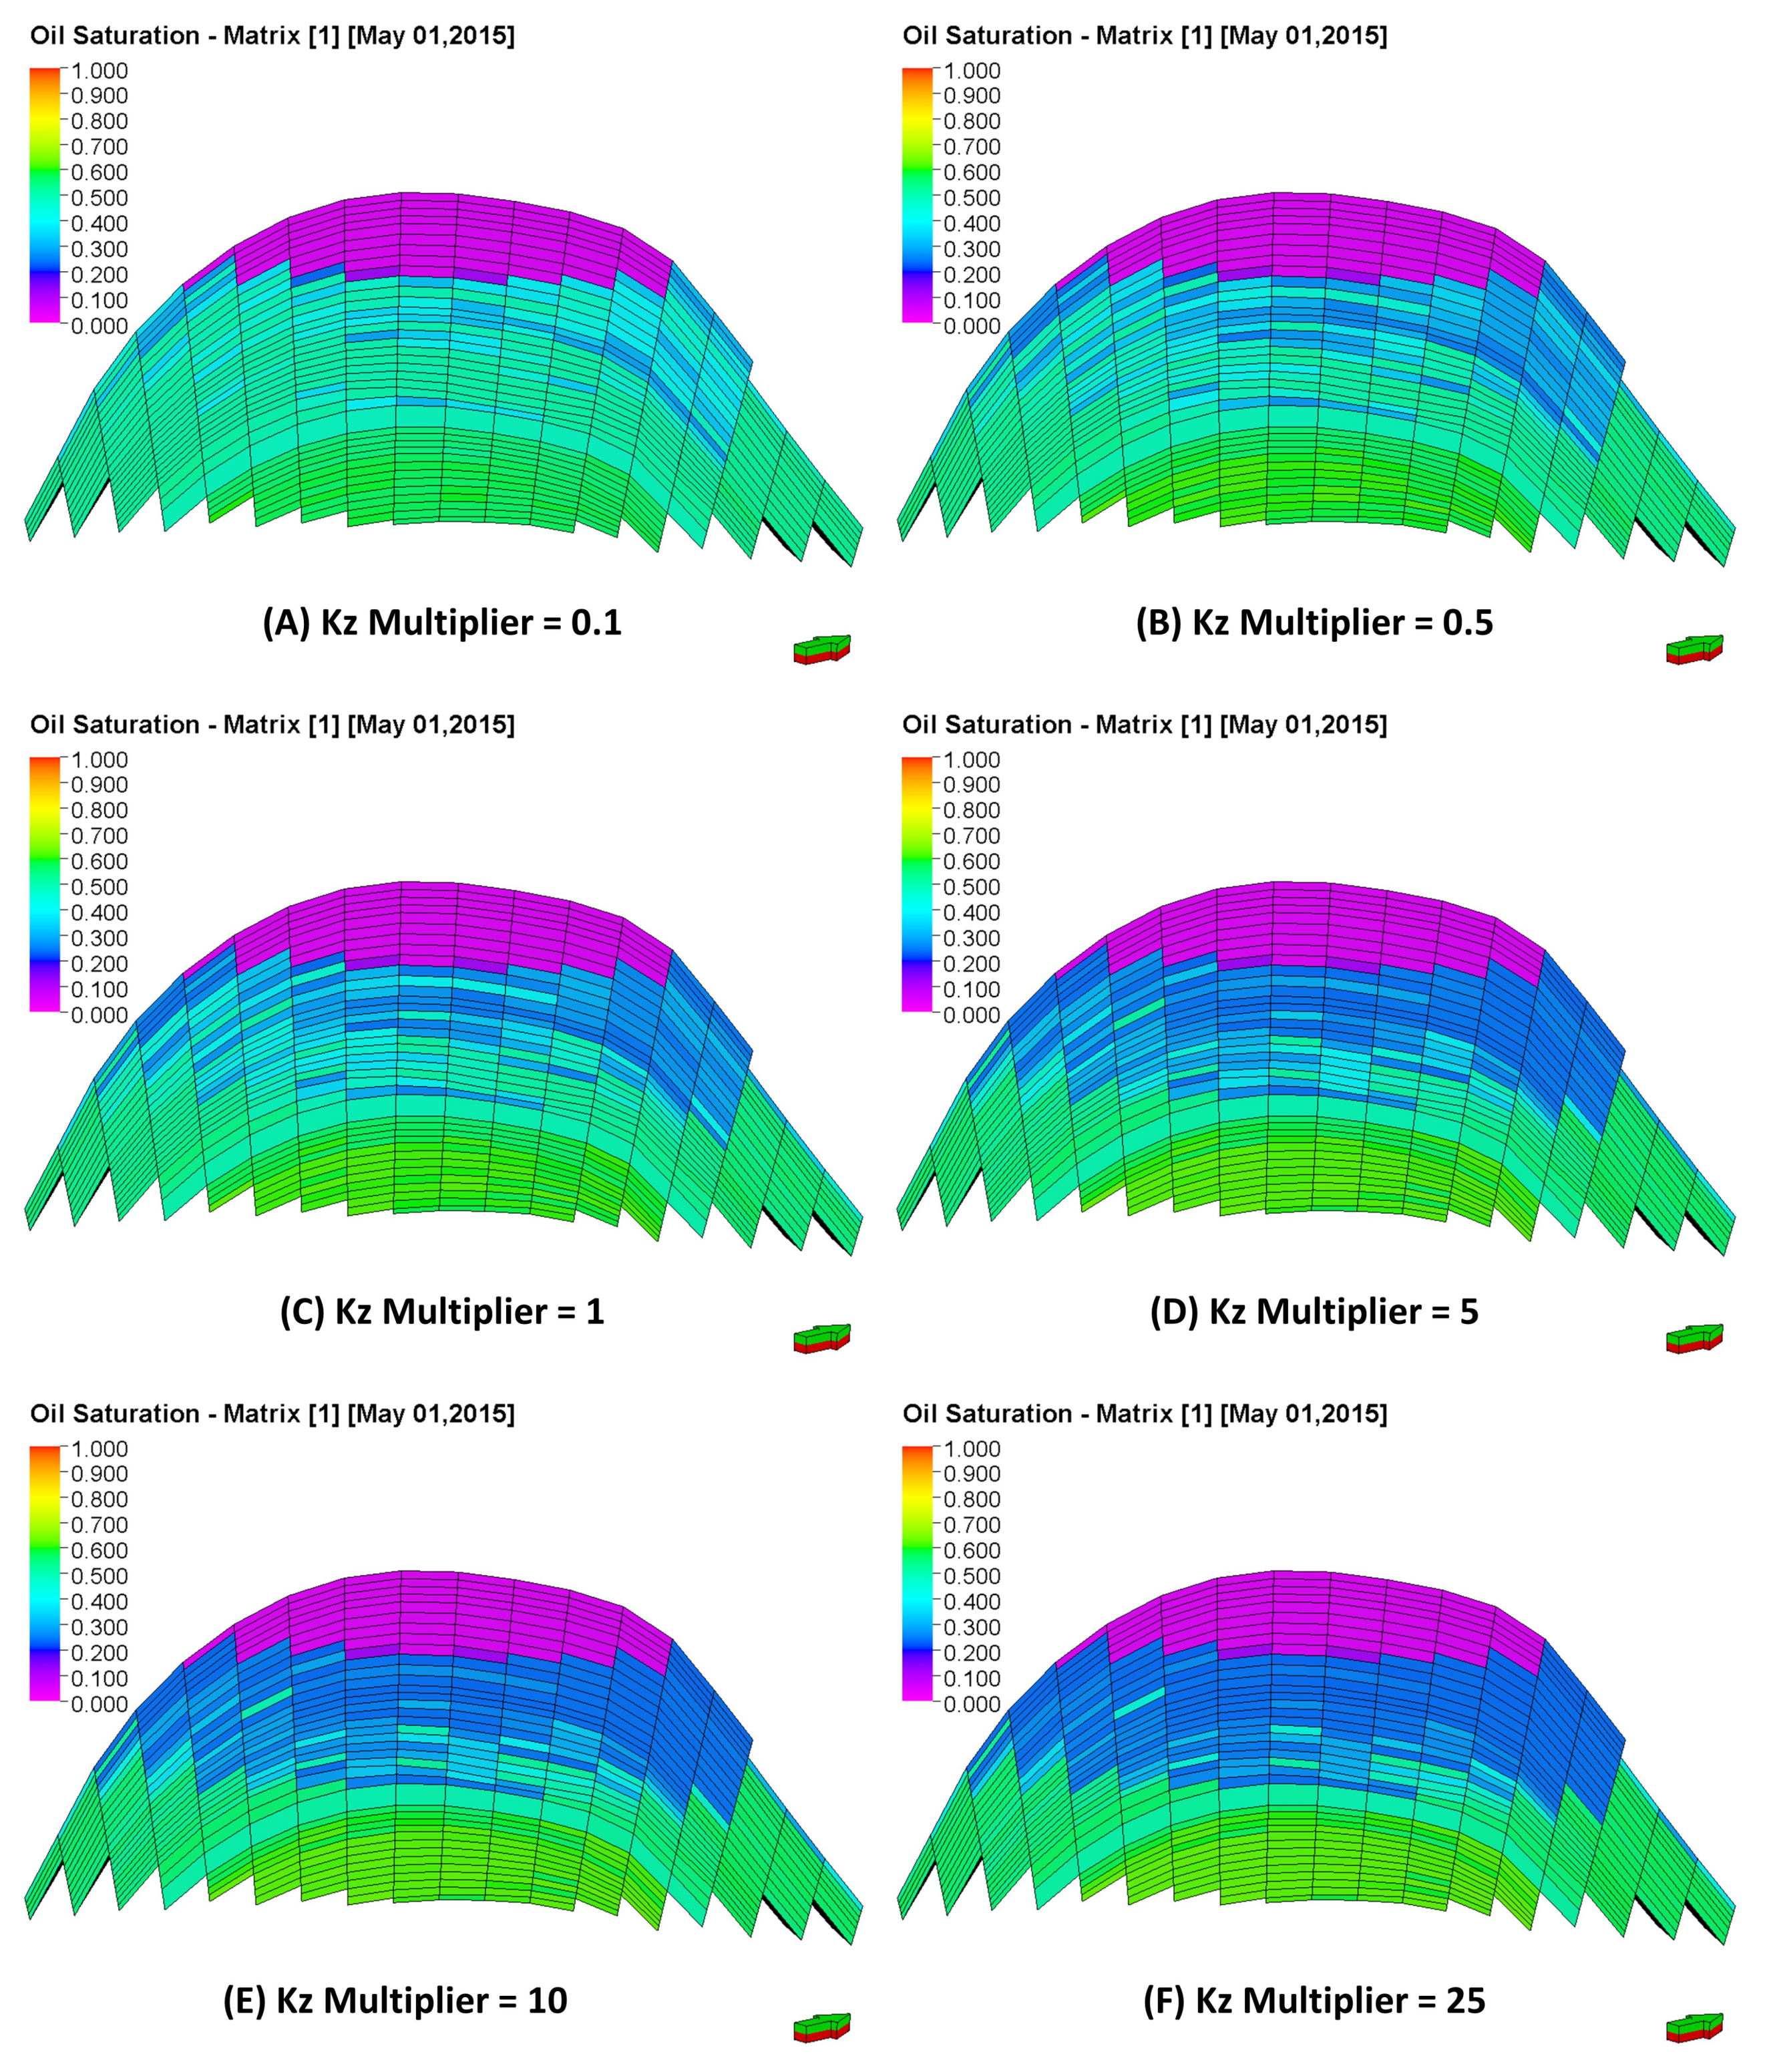
2.1.2. Vertical Permeability of the Matrix

As highlighted in Equations (8) and (9), Quandalle and Sabathier [17] have suggested division of the shape factor into two forms:
  • Vertical shape factor ( σ G D ): used in the fluid exchange between the matrix and fracture in the vertical direction that significantly affected by the gravity force.
  • Horizontal shape factor ( σ Q ): used in the fluid exchange in the horizontal direction.
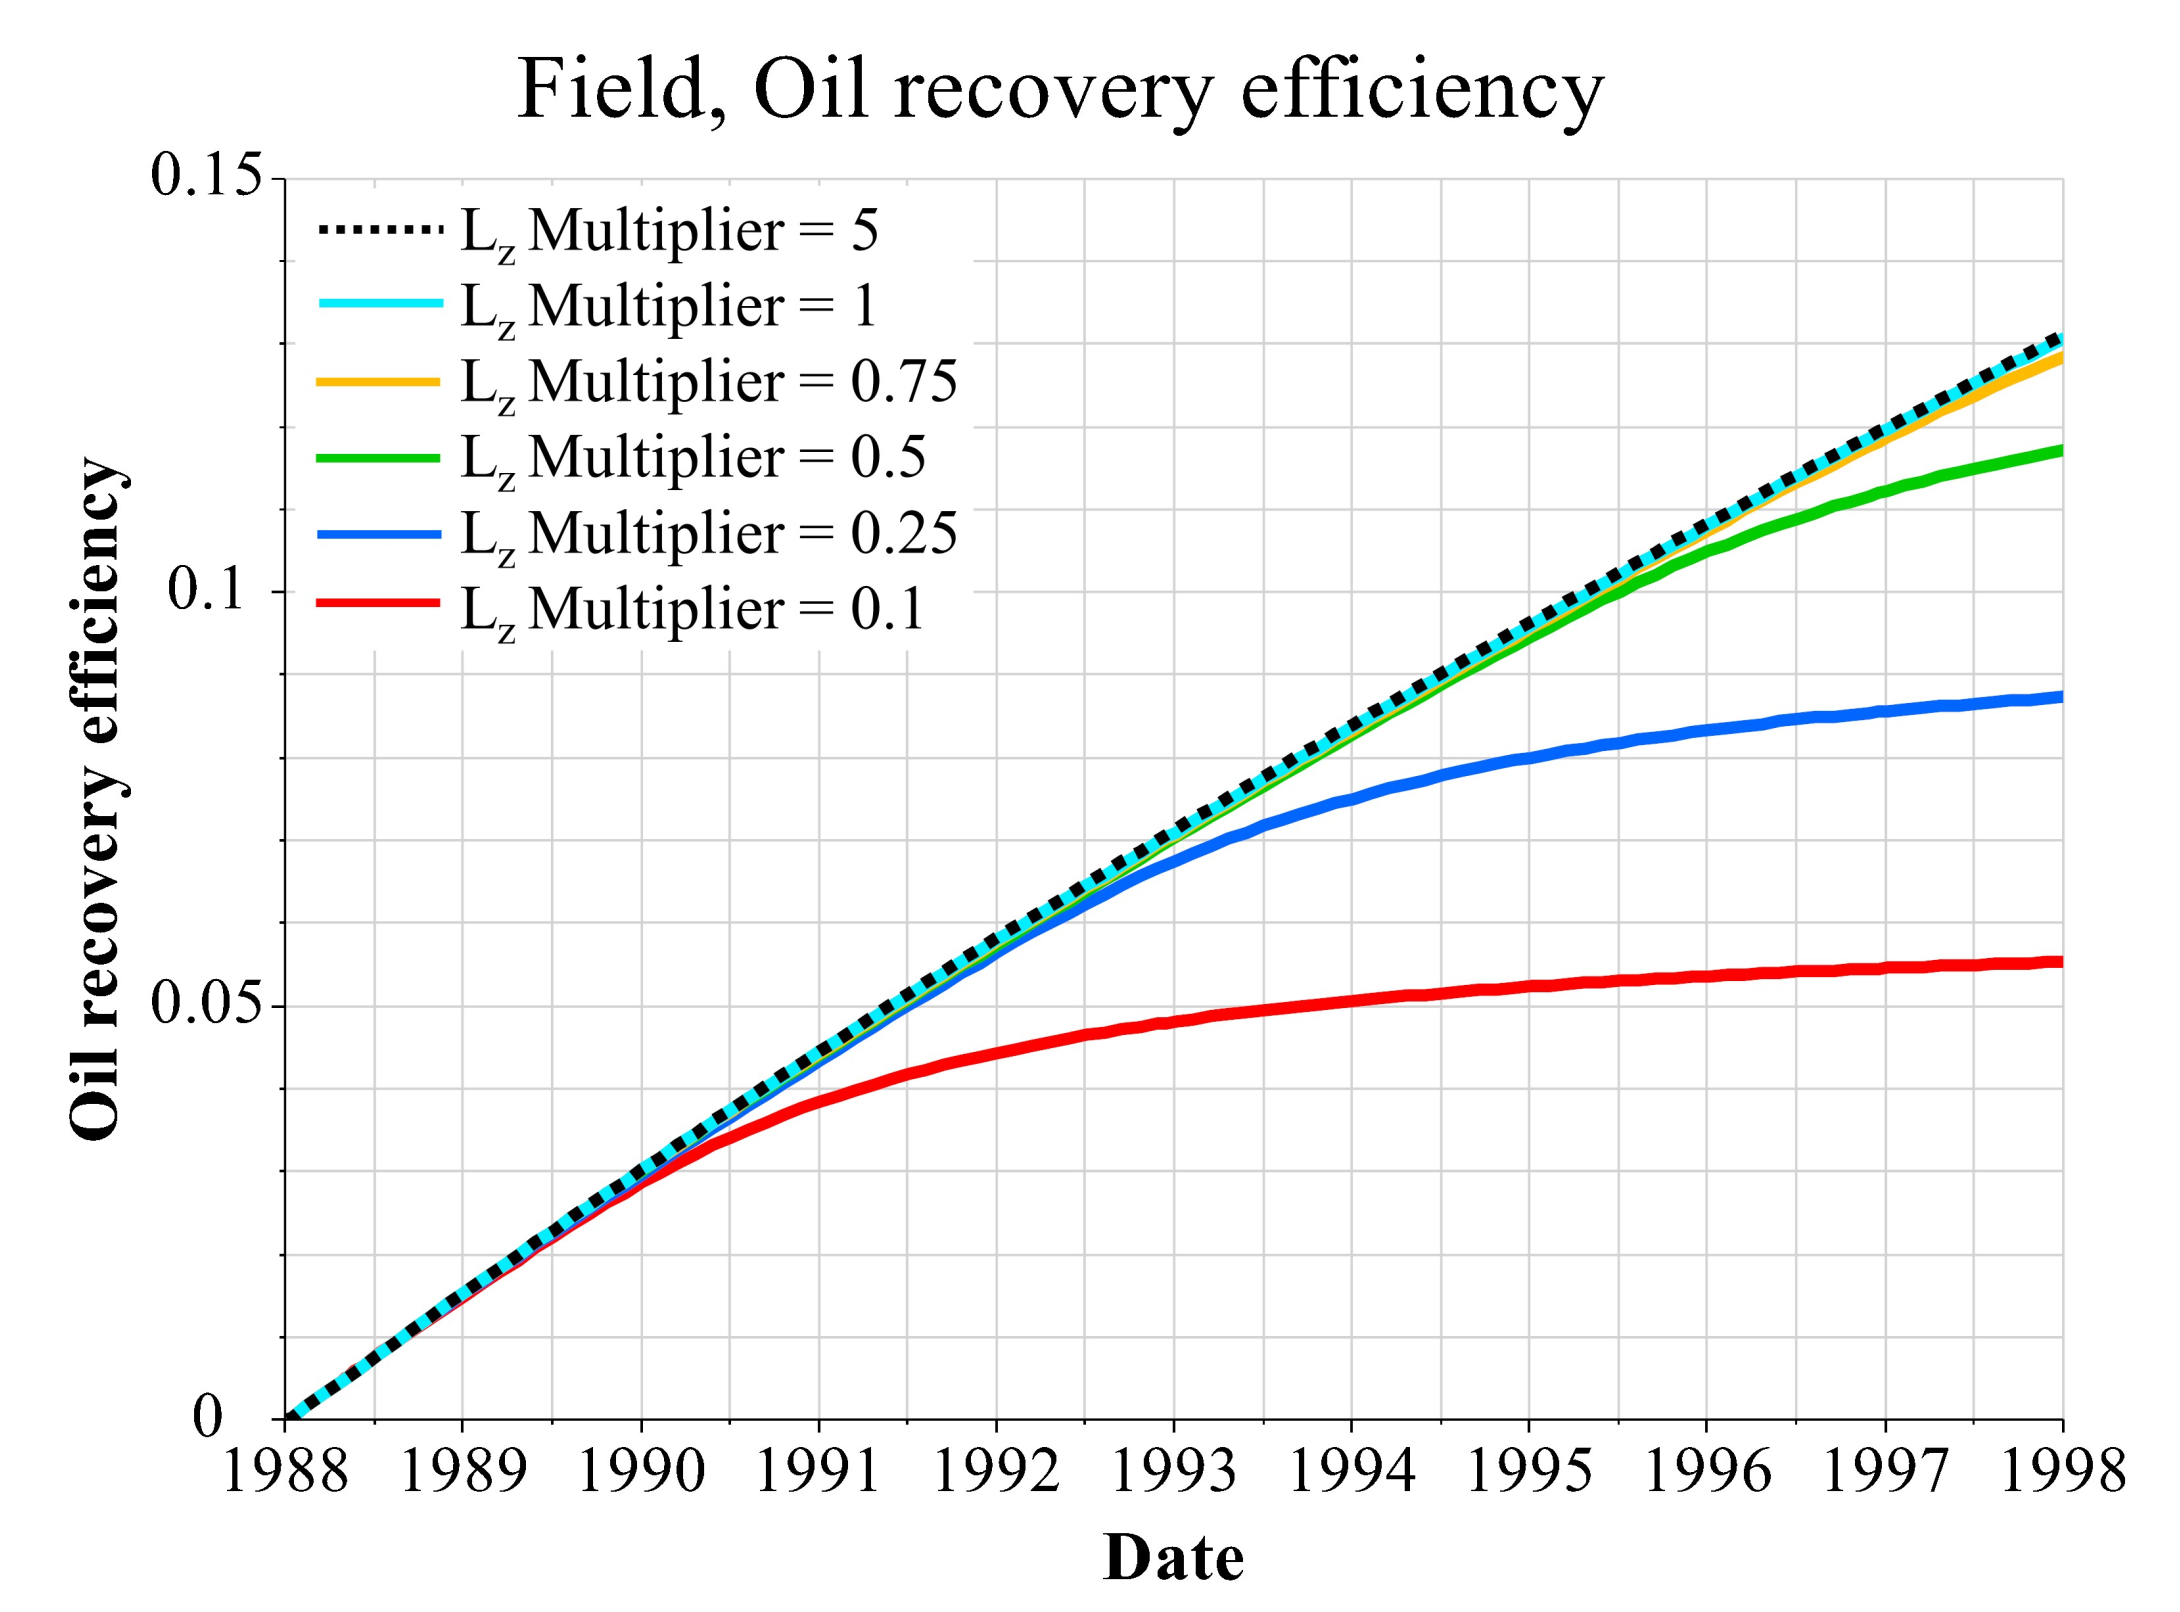
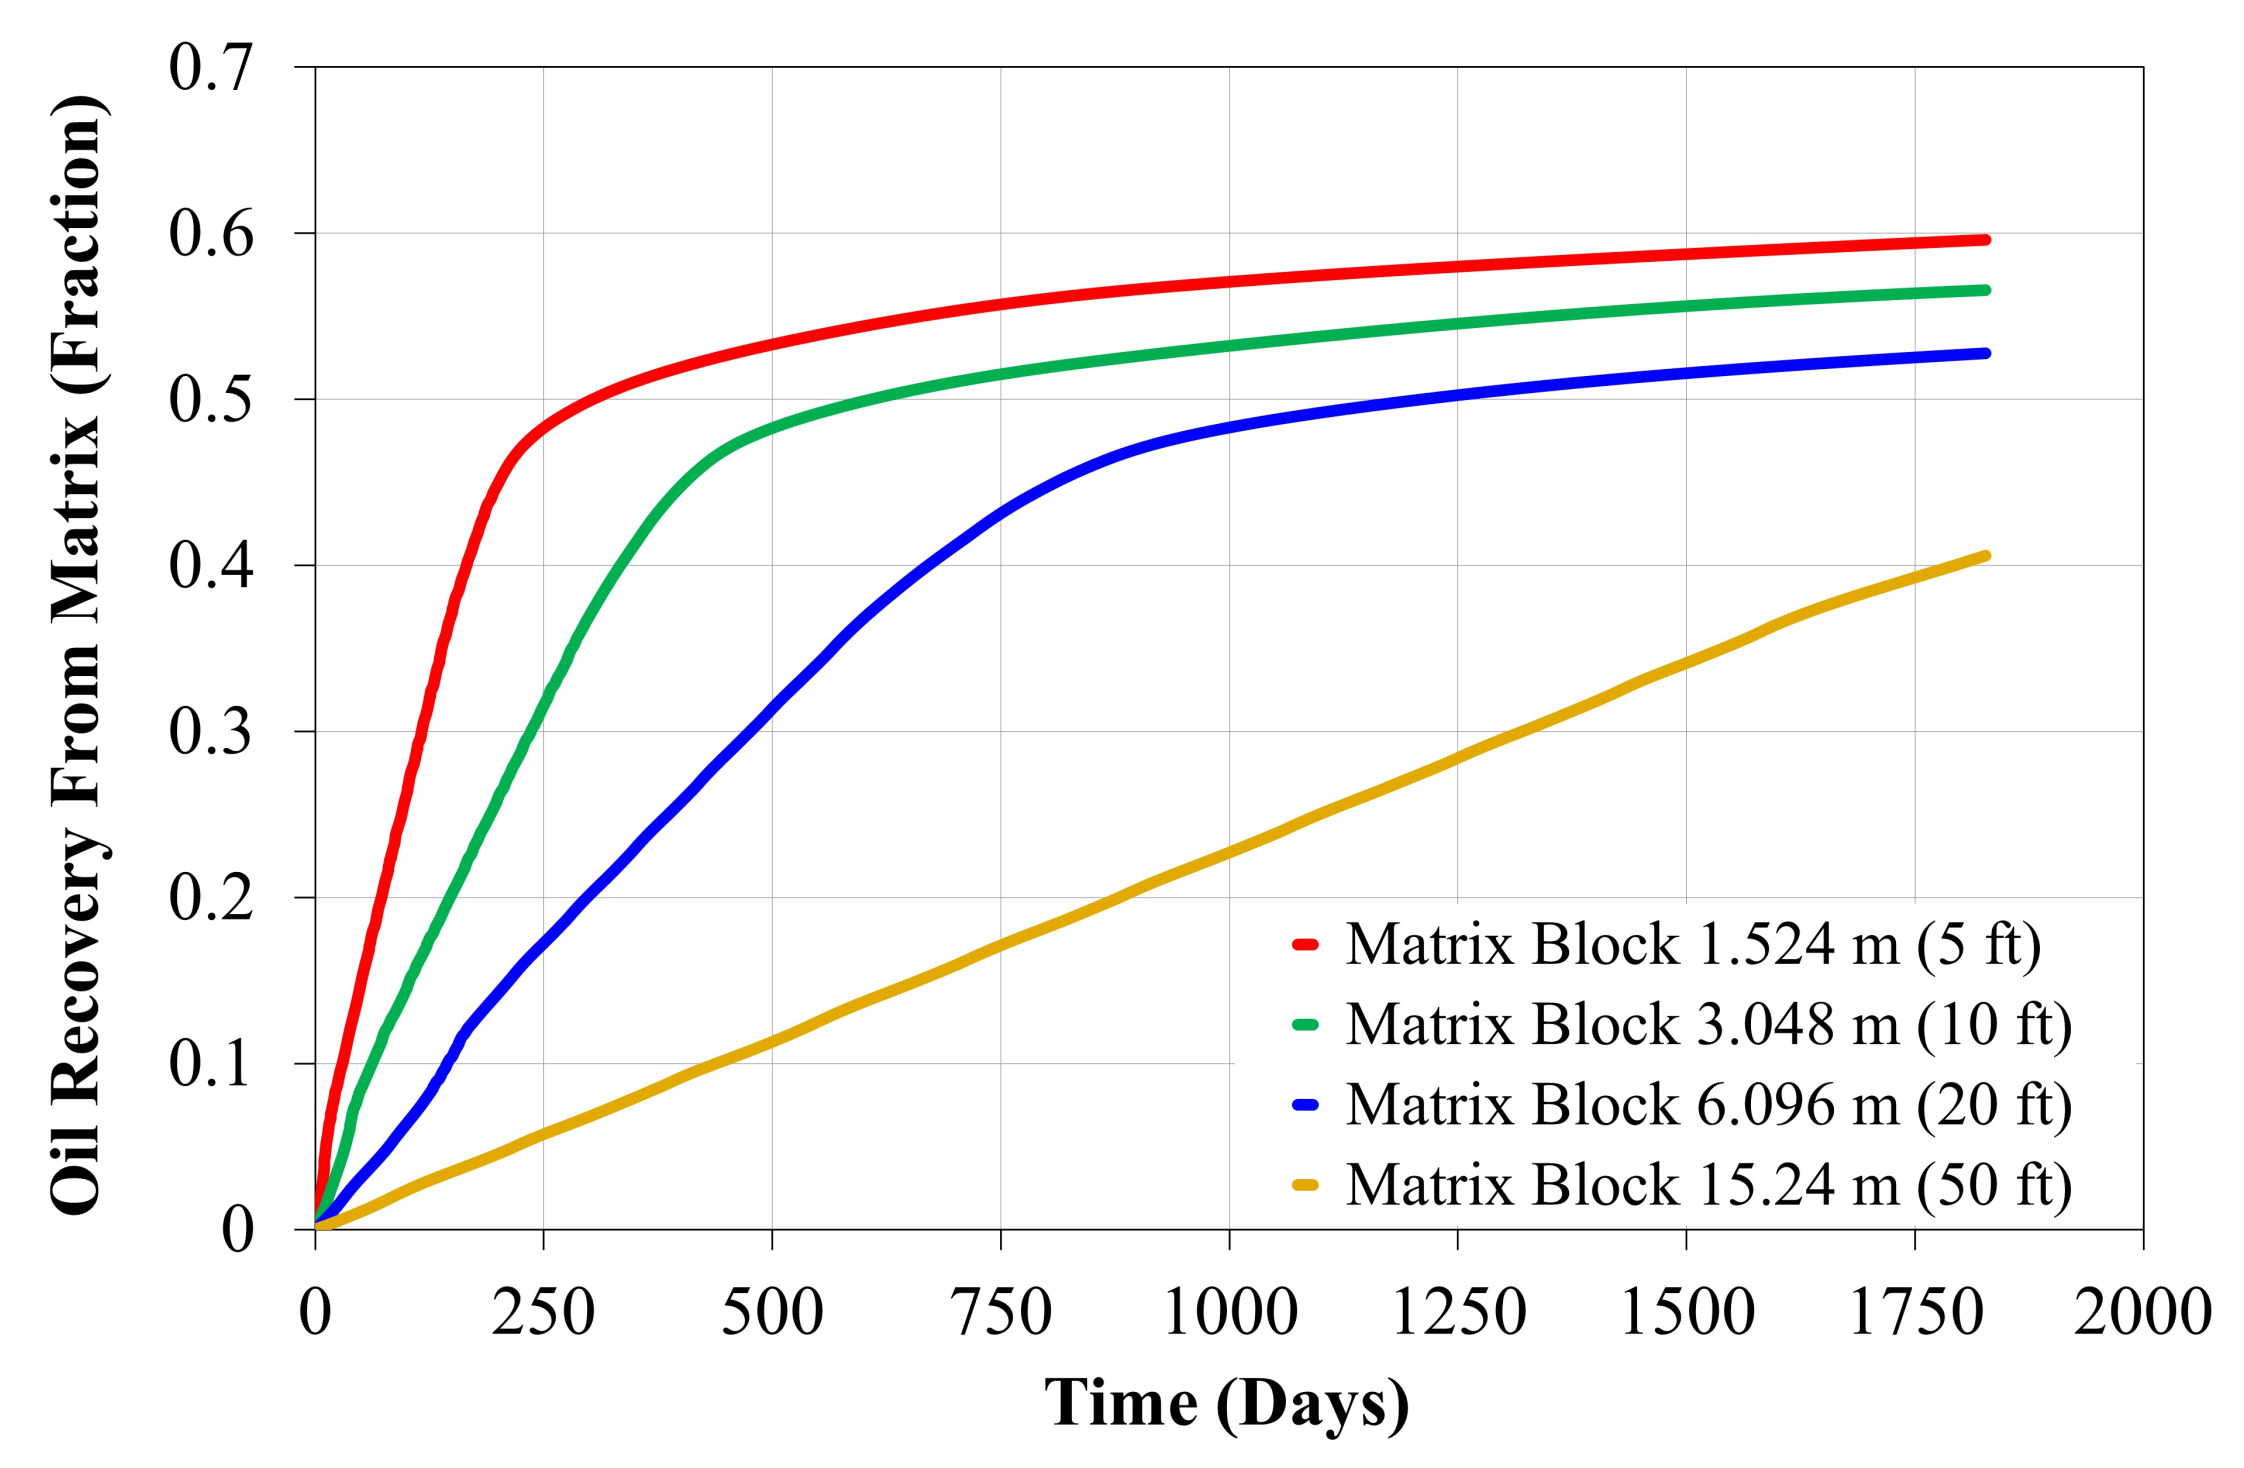
Therefore, the vertical permeability can be used in this formula to accurately represent the exchange rate in the top and bottom faces. However, other suggested formulas use the horizontal permeability only for all flow directions. The following results illustrate the effect of vertical matrix permeability on the ultimate oil recovery, where a range of vertical permeability of the matrix (0–10 mD) was tested to investigate its effect by selecting the option of Quandalle and Sabathier expression (Alternative Gravity Drainage—Figure 6A) and Gilman and Kazemi Expression (Gravity Drainage—Figure 6B). The obvious conclusion of the simulation outcomes is that the vertical permeability of the matrix has no effect on the oil recovery in the Gilman and Kazemi formula, which means an inappropriate representation of the fluid exchange in the vertical direction by using the horizontal matrix permeability instead of the vertical permeability for all gridblock faces.
Furthermore, Abushaikha and Gosselin [21] have compared several transfer function formulas in their work using single-cell models, and they have concluded that the Quandalle [17] formulas are the best representations of gravity drainage compared to the other available formulas (e.g., [15,20,28]).

2.1.3. Matrix Block Dimensions ( L x , L y , and, L z )

Actual matrix block dimensions (which are different from the grid dimensions as illustrated in Figure 7) have an impact on the values of both shape factor and gravity drainage term, hence on the transfer function. The matrix block dimensions are related to the fracture frequency or fracture intensity (i.e., number of fractures per line length, scanline measurements). The scanline measurements of the Fracture Intensity (FI) could be converted into average fracture spacing ( S m e a n ) by using the formula S m e a n = 1 / F I [31]. The average fracture spacing represents the average matrix block size in the measured direction. However, the matrix block height could be related to the mechanical layer thickness in strata-bound fractures, where the fractures develop independently of other geological units [32].
Natural fractures may occur at various spaces which create various sizes of matrix blocks, [6]. These sizes, which represent the actual dimensions of the matrix block, are preferably considered in dual-porosity and dual-permeability models. However, in the modelling workflow, the matrix block dimensions that resulted from the upscaled fracture network are typically used, which represents the local average of the fracture spacing. Moreover, the matrix block height ( L z ) is one of the essential parameters in gravity drainage terms in the previously mentioned formulas (e.g., Equations (8)–(11)). Therefore, various heights of the matrix blocks have investigated using Quandalle and Sabathier formula [17] and by using multipliers to maintain the variation of the originally distributed heights in the grid model as illustrated in Table 1, while the simulation results are shown in Figure 8:

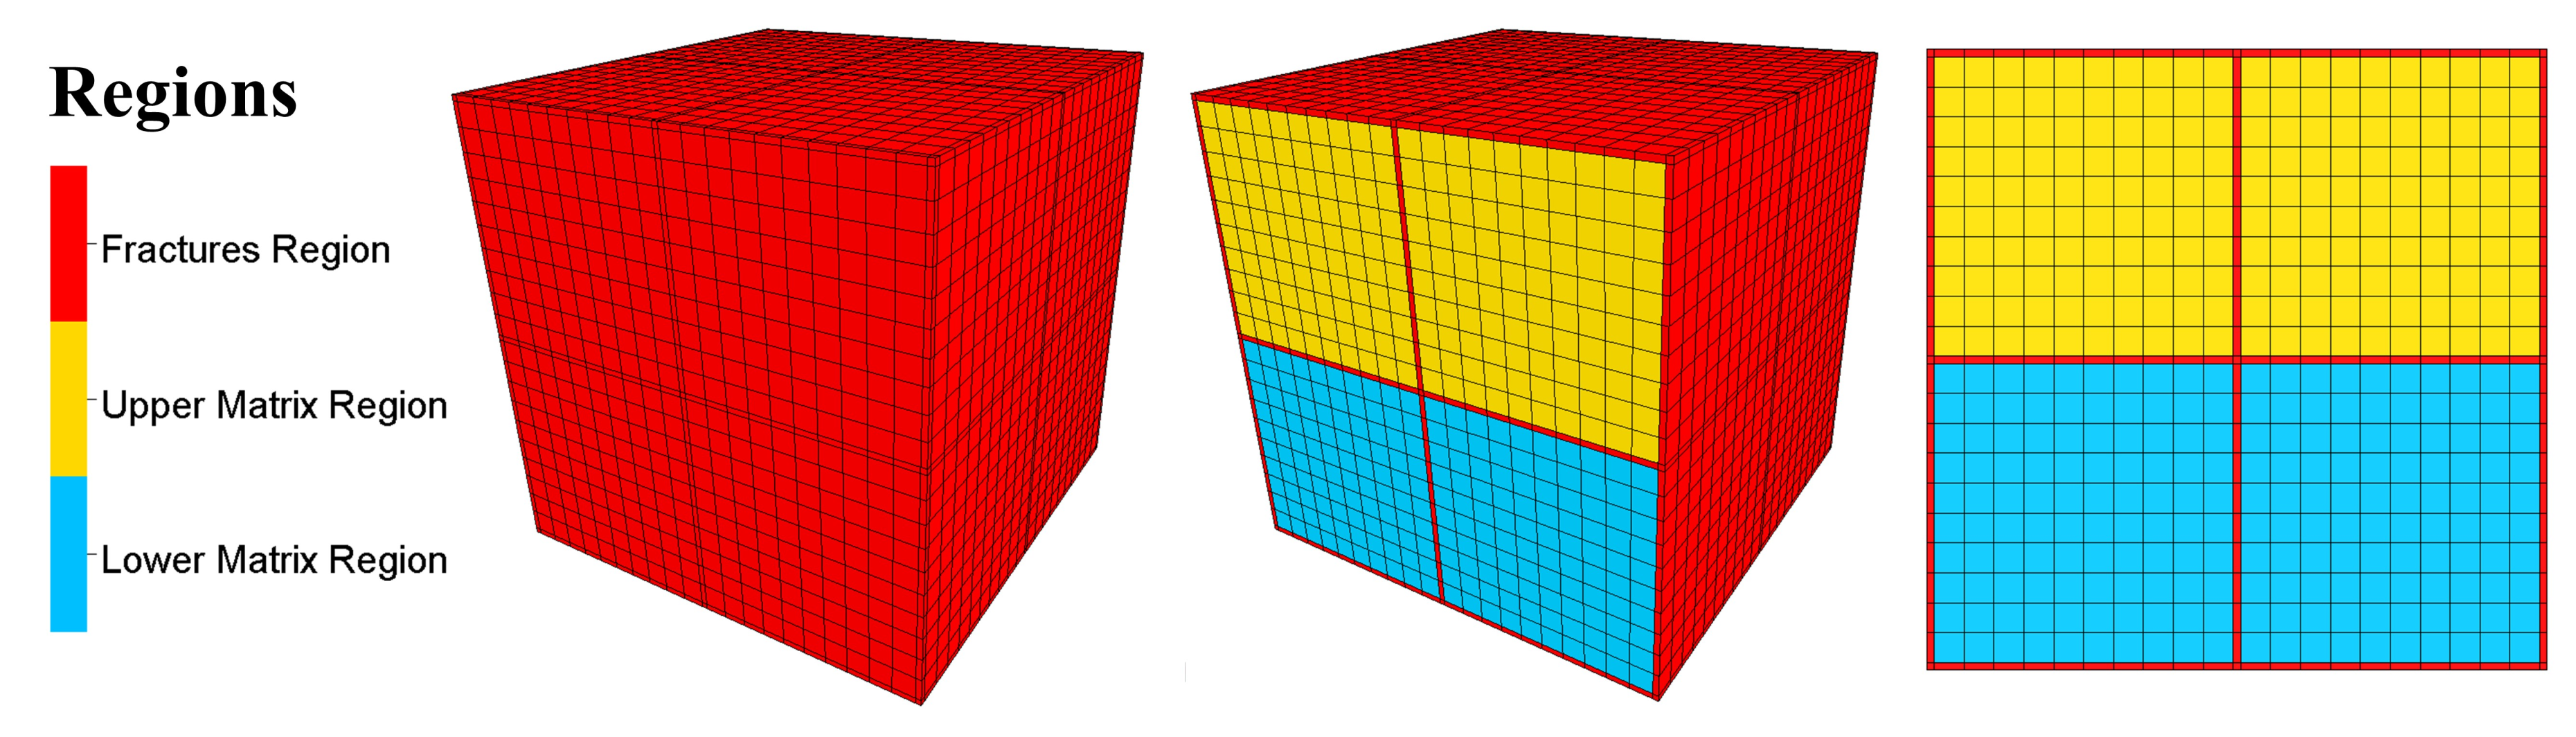
2.2. The Effect of the Gravity Drainage Fine-Scale Modelling

A small-scale model was constructed to simulate the gravity drainage process using ideal matrix blocks with the dimensions 3.048 × 3.048 × 3.048 m 3 ( 10 × 10 × 10 f t 3 ) surrounded by fractures with 0.0762 m (0.25 ft) width, as illustrated in Figure 9. Each matrix block was refined into ten cells in the I, J, and K directions. The total number of matrix cells is 8000 cells.
The simulation of the fine-grid model aims to illustrate the fluid exchanges between the matrix and fractures due to the gravity differences of the contained fluids that are solely attributed to the gravity forces. Furthermore, the effect of matrix block size on the ultimate oil recovery from the matrix by drainage process was investigated in addition to the effect of matrix permeability in (x, y) directions and (z) direction.
To simulate the oil recovery from matrix blocks under the gravity effect, the fractures have assumed to be fully saturated with gas while the matrix blocks contain oil saturation in addition to irreducible water saturation ( S w i r r = 0.22). These conditions were provided to mimic the gas advances in the fractures, leaving the oil trapped in the matrix cells. A unity slope of the relative permeability curves was used for the fractures besides zero capillary pressure. However, a relative permeability set of Qamchuqa formation (which is discussed later) was used for the matrix medium. Further rock and fluid properties are illustrated in Table 2 below:

2.3. Full-Field Application and Sensitivities

One of the Middle East’s naturally fractured carbonate reservoirs was used to evaluate the effect of different gravity drainage formulas on the transfer function at the field scale. The reservoir is known as the Cretaceous Qamchuqa reservoir and is one of the producing reservoirs in the Jambur field. Jambur field is in the foothill zone to the northeast of Iraq; see Figure 10A. It is represented by a simple structure of asymmetrical anticline with northwest–southeast axis direction. The field extends over 30 km length and 4.5 km width. The Cretaceous reservoir is the reservoir of interest in the current investigation, and it consists of two producing formations known as Upper Qamchuqa and Lower Qamchuqa, which are considered to be highly prolific formations in Iraq. The Qamchuqa terminology has often used in the north of Iraq. However, their equivalent formations in the south of Iraq and the Arabian Peninsula are known as Mauddud and Shauiba formations, respectively, [33,34,35]. Qamchuqa formations consist of thick-bedded limestone [34], deposited in a shallow marine setting. The two Qamchuqa formations are separated by Upper Sarmord formation, which is a non-reservoir shaly unit; see Figure 10B.
The reservoir thickness is estimated to be approximately 600 m in the main reservoir region, which represents the Neritic deposition environment, as illustrated in Figure 11. The thickness dramatically decreases toward the southern region to less than 160 m. However, the Cretaceous reservoir does not exist in the Basinal deposition environment where Qamchuqa facies (i.e., reservoir rocks) passes into the basinal non-reservoir facies of Balambo, [34], Figure 10B and Figure 11.
A history-matching scenario was implemented for the Cretaceous reservoir using the gravity model of Gilman and Kazemi [15]. Very good matching results were reported for several producers in the reservoir for oil production rate, bottom hole pressure (BHP), gas–oil ratio (GOR), and water cut. However, no evaluation was conducted regarding the oil recovery from the matrix cell that has been surrounded by the advanced gas in the fractures.
The current investigation aimed to compare the different gravity drainage formulas and to evaluate their performance in addition to highlighting the saturation profiles of both oil and gas in the matrix blocks. Furthermore, sensitivity scenarios were implemented to investigate the effect of matrix vertical permeability and matrix block height. This evaluation highlighted the significant uncertainty in estimating the remaining oil reserve behind the advanced gas–oil contact (GOC) level that could be a target for the secondary or tertiary recovery processes, and it helps to make a sound decision for such costly development options.

3. Results

3.1. Fine-Scale Modelling

A five-year scenario was applied by allowing the gravity segregation to occur between the gas and the oil due to the density differences between the gas and the oil. The gravity-driven flow allowed the fluid exchange between the matrix and the fractures. The gradual reduction in the oil saturation in the matrix represents the oil flow out of the matrix blocks toward the fractures and substituted by the counter flow of the gas as illustrated in Figure 12, which shows the time-lapse of oil saturation changes in the matrix blocks for five years.
The oil recovery from the matrix blocks depends on several factors such as matrix block dimensions, vertical permeability, and relative permeability curves that control the speed and recovery factor. Four different sizes of matrix blocks were investigated (1.524, 3.048, 6.096, and 15.24 m (5, 10, 20, and 50 ft)) where the matrix dimensions are assumed to be equal (lx = ly = lz). Significant differences in recovery speed were observed as well as ultimate recovery that results from use of various block dimensions, (e.g., 40 % of oil recovery from the matrix required 167 days for matrix dimensions ( 1.524 × 1.524 × 1.524 m 3 ), while it required 1795 days for the matrix dimensions ( 15.24 × 15.24 × 15.24 m 3 ). Therefore, inappropriate assumption of the matrix blocks during the fracture modelling workflow can accelerate or degrade the recovery speed and value as shown in Figure 13.
The matrix permeability, on the other hand, has demonstrated contrasting responses. Horizontal permeability in both directions (x and y) has tested for the values (0.01, 0.1, 1, 5, 10, and 20 mD), as illustrated in Figure 14. The observed results have shown negligible differences for the recovery speed where all the scenarios overlapped each other, and they have achieved the same ultimate recovery Figure 14A. However, the results of vertical permeability scenarios have shown remarkable differences in both oil recovery and recovery speed (e.g., the oil recovery from the matrix increased by 31 % when the vertical permeability increased from 0.1 mD to 1 mD).

3.2. Full-Field Modelling

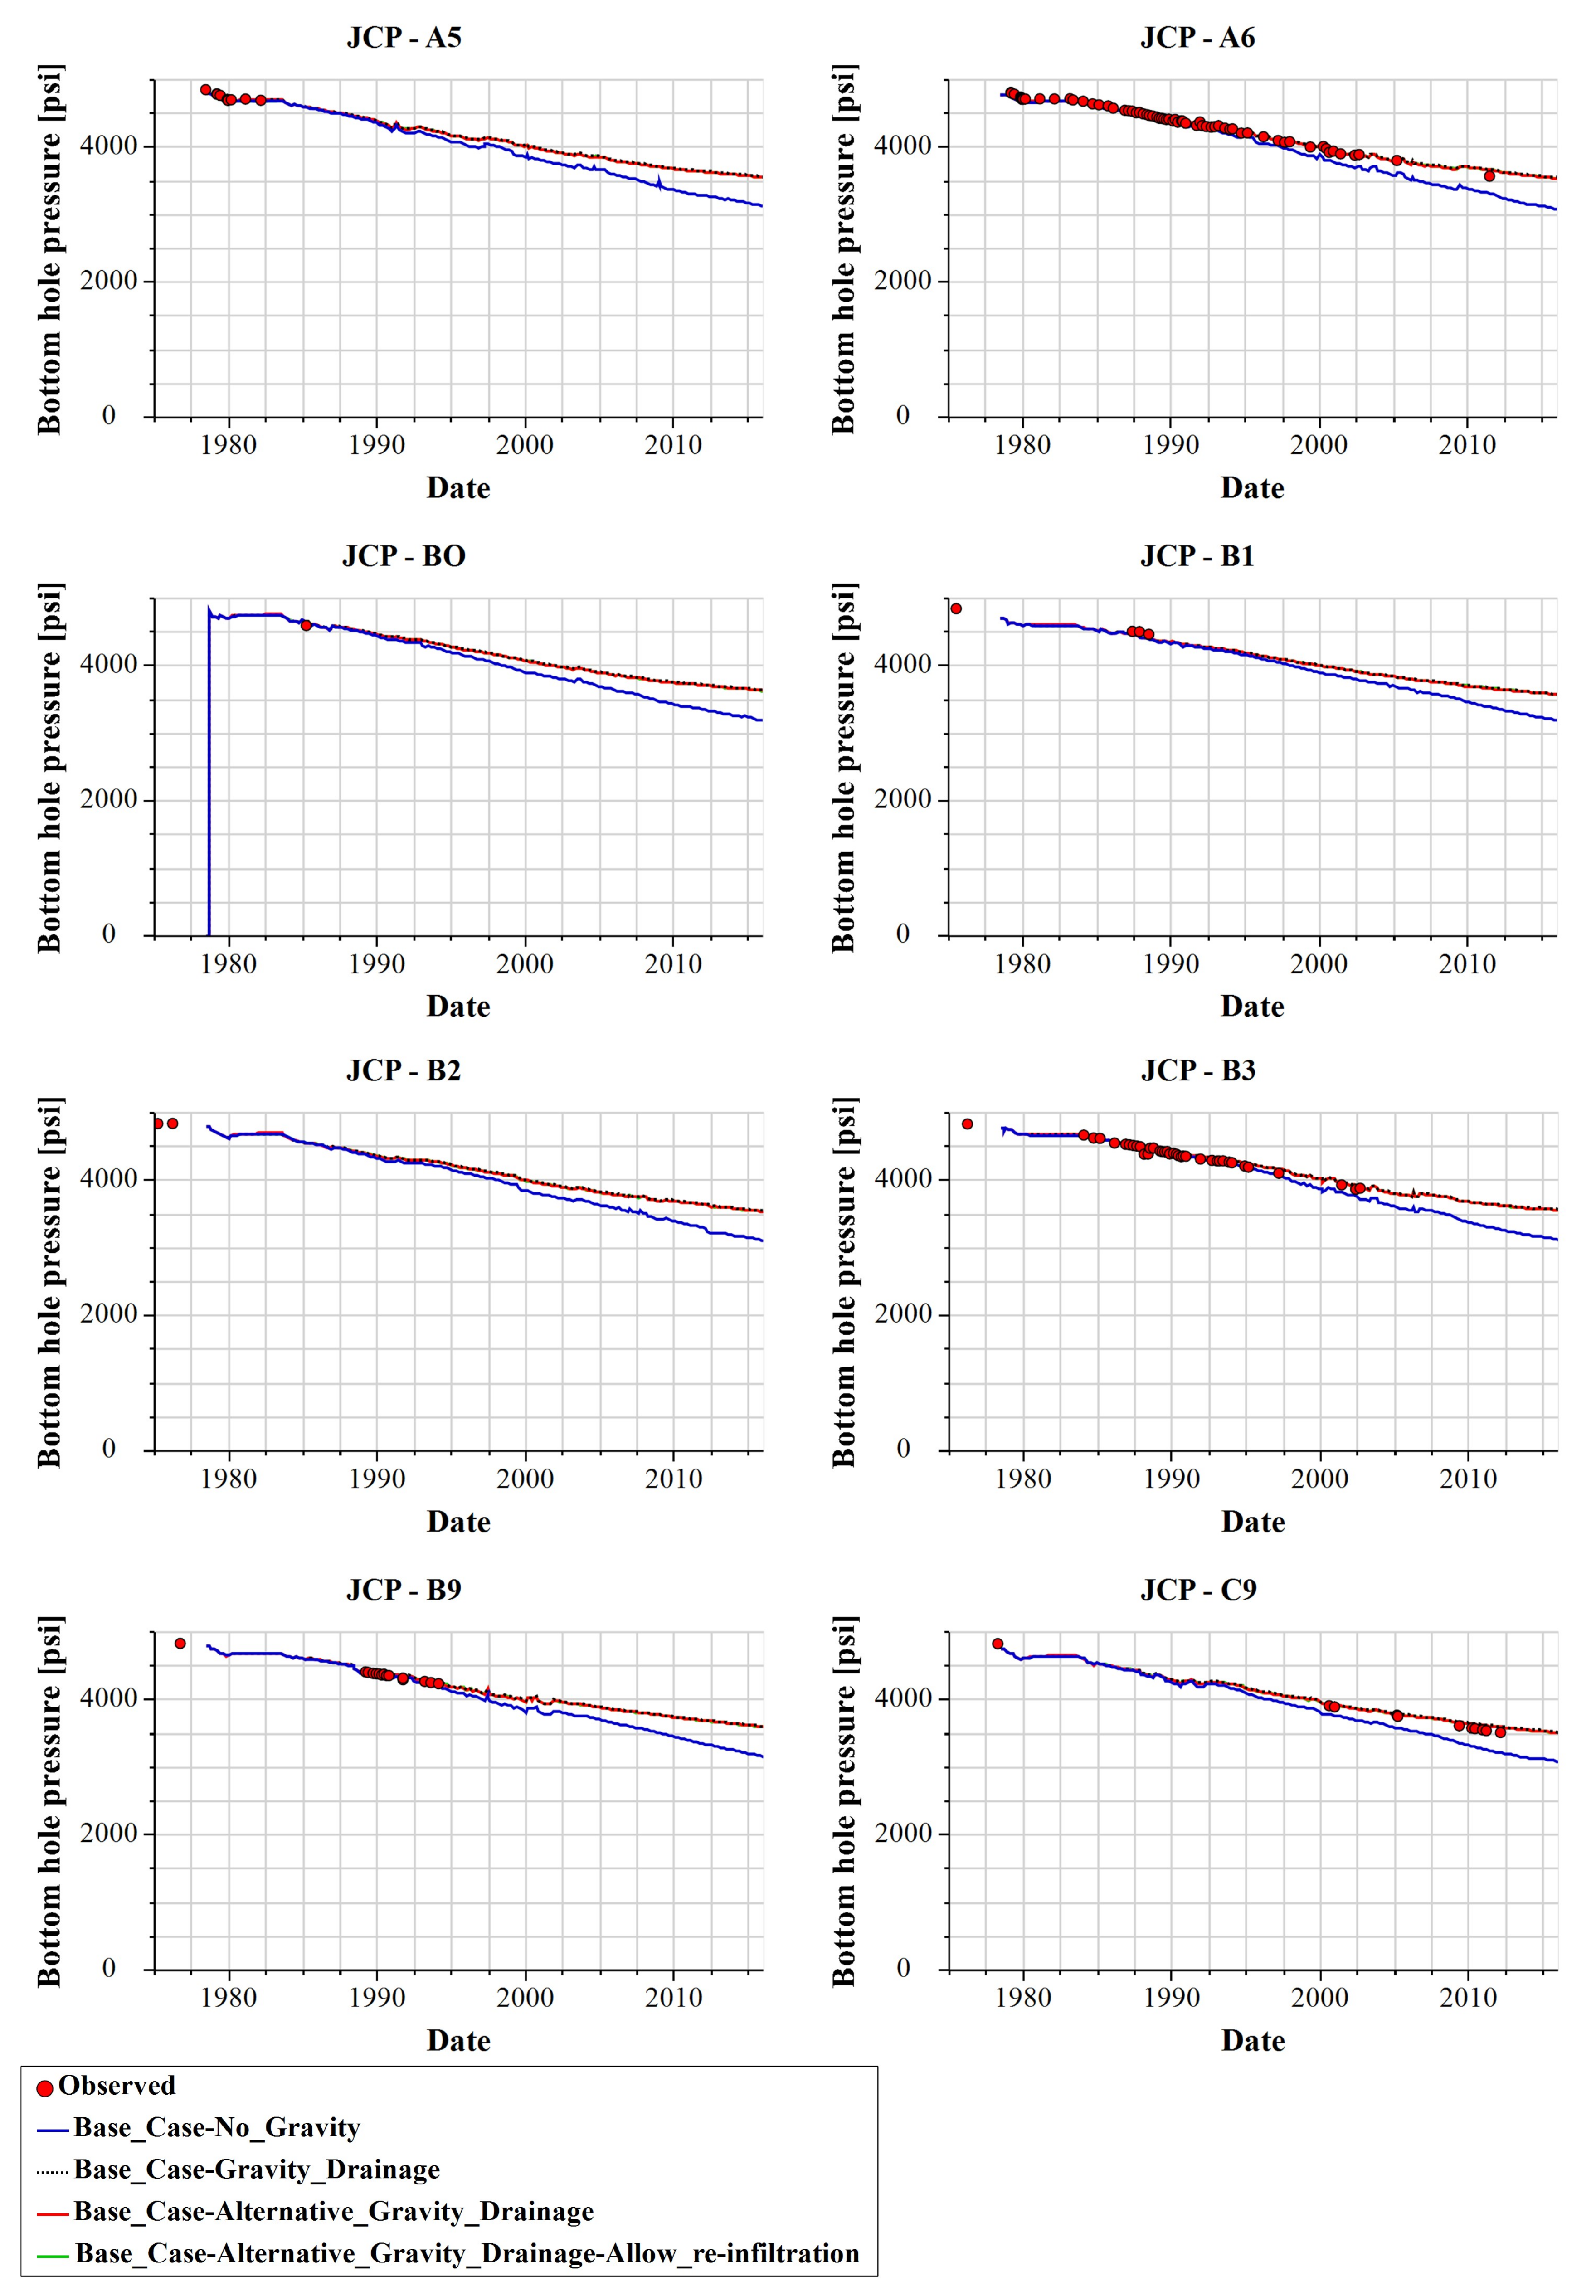
3.2.1. Comparison of the Gravity Formulas

The previously investigated formulas (gravity drainage, alternative gravity drainage, and alternative gravity drainage–allow re-infiltration) were applied to the Qamchuqa reservoir to evaluate their performance at the field scale. The traditional comparison of field performance was examined, as illustrated in Figure 15 for the BHP, where insignificant differences were observed for the three formula outcomes (the pressure curves overlapped above each other) except the scenario where no gravity effect was considered and a lower pressure response (the blue line in Figure 15) was obtained compared to the observed data.
As highlighted in the 6th SPE comparative solution project, the gravity drainage term in the Quandalle and Sabathier formula uses the vertical permeability in the vertical fluid exchange calculation for the upper face and lower face of the matrix gridblock coupled with vertical shape factor ( σ G D ), where the matrix recovery due to the gravity drainage is a function of the matrix vertical permeability and matrix block height ( L z ). A cross-section from the field model was used to compare the saturation profiles for both oil and gas using different gravity drainage models as its location is shown in Figure 16A, while the vertical permeability of the matrix is shown in Figure 16B to compare with the saturation profiles in the reservoir using Quandalle and Sabathier models.
Under the same conditions, the simulation results referred to notable differences in the oil recovery from the matrix blocks and in the gas saturation increases, as shown in Figure 17 and Figure 18. This dramatic variation in matrix recovery is related to the gravity model performance and how each model can accurately address the gravity drainage effect. The previous conclusion of [21], that the Gilman and Kazemi model [15] (i.e., gravity drainage option) is overestimating the speed of recovery, can be seen in the current evaluation at the field scale; see Figure 19.
In Gilman and Kazemi model, the oil saturation has depleted uniformly along the cross-section, while the gas saturation increases firmly; see Figure 17B and Figure 18B. However, the alternative gravity drainage models (i.e., Quandalle and Sabathier model [17]) have shown almost similar performance and the drainage variation of the fluid saturation in the matrix blocks. Figure 17C,D and Figure 18C,D have a strong relationship with the vertical permeability of the matrix; see Figure 16B. Meanwhile, the no-gravity-effect results were provided for comparison purposes; see Figure 17A and Figure 18A to illustrate the effect of the gravity drainage contribution in general.
Further illustration was made by quantitative evaluation of the oil saturation in the matrix blocks by comparing the formerly mentioned gravity drainage options. A single block (15 130 11) was selected from the cross-section of Qamchuqa reservoir to demonstrate the variations in the oil recovery from the matrix block as illustrated in Figure 19. Where the reduction in the oil saturation is related to both oil production and pressure depletion, that causes the liberation of the dissolved gas, and changes the relative fluid volumes within a gridblock.

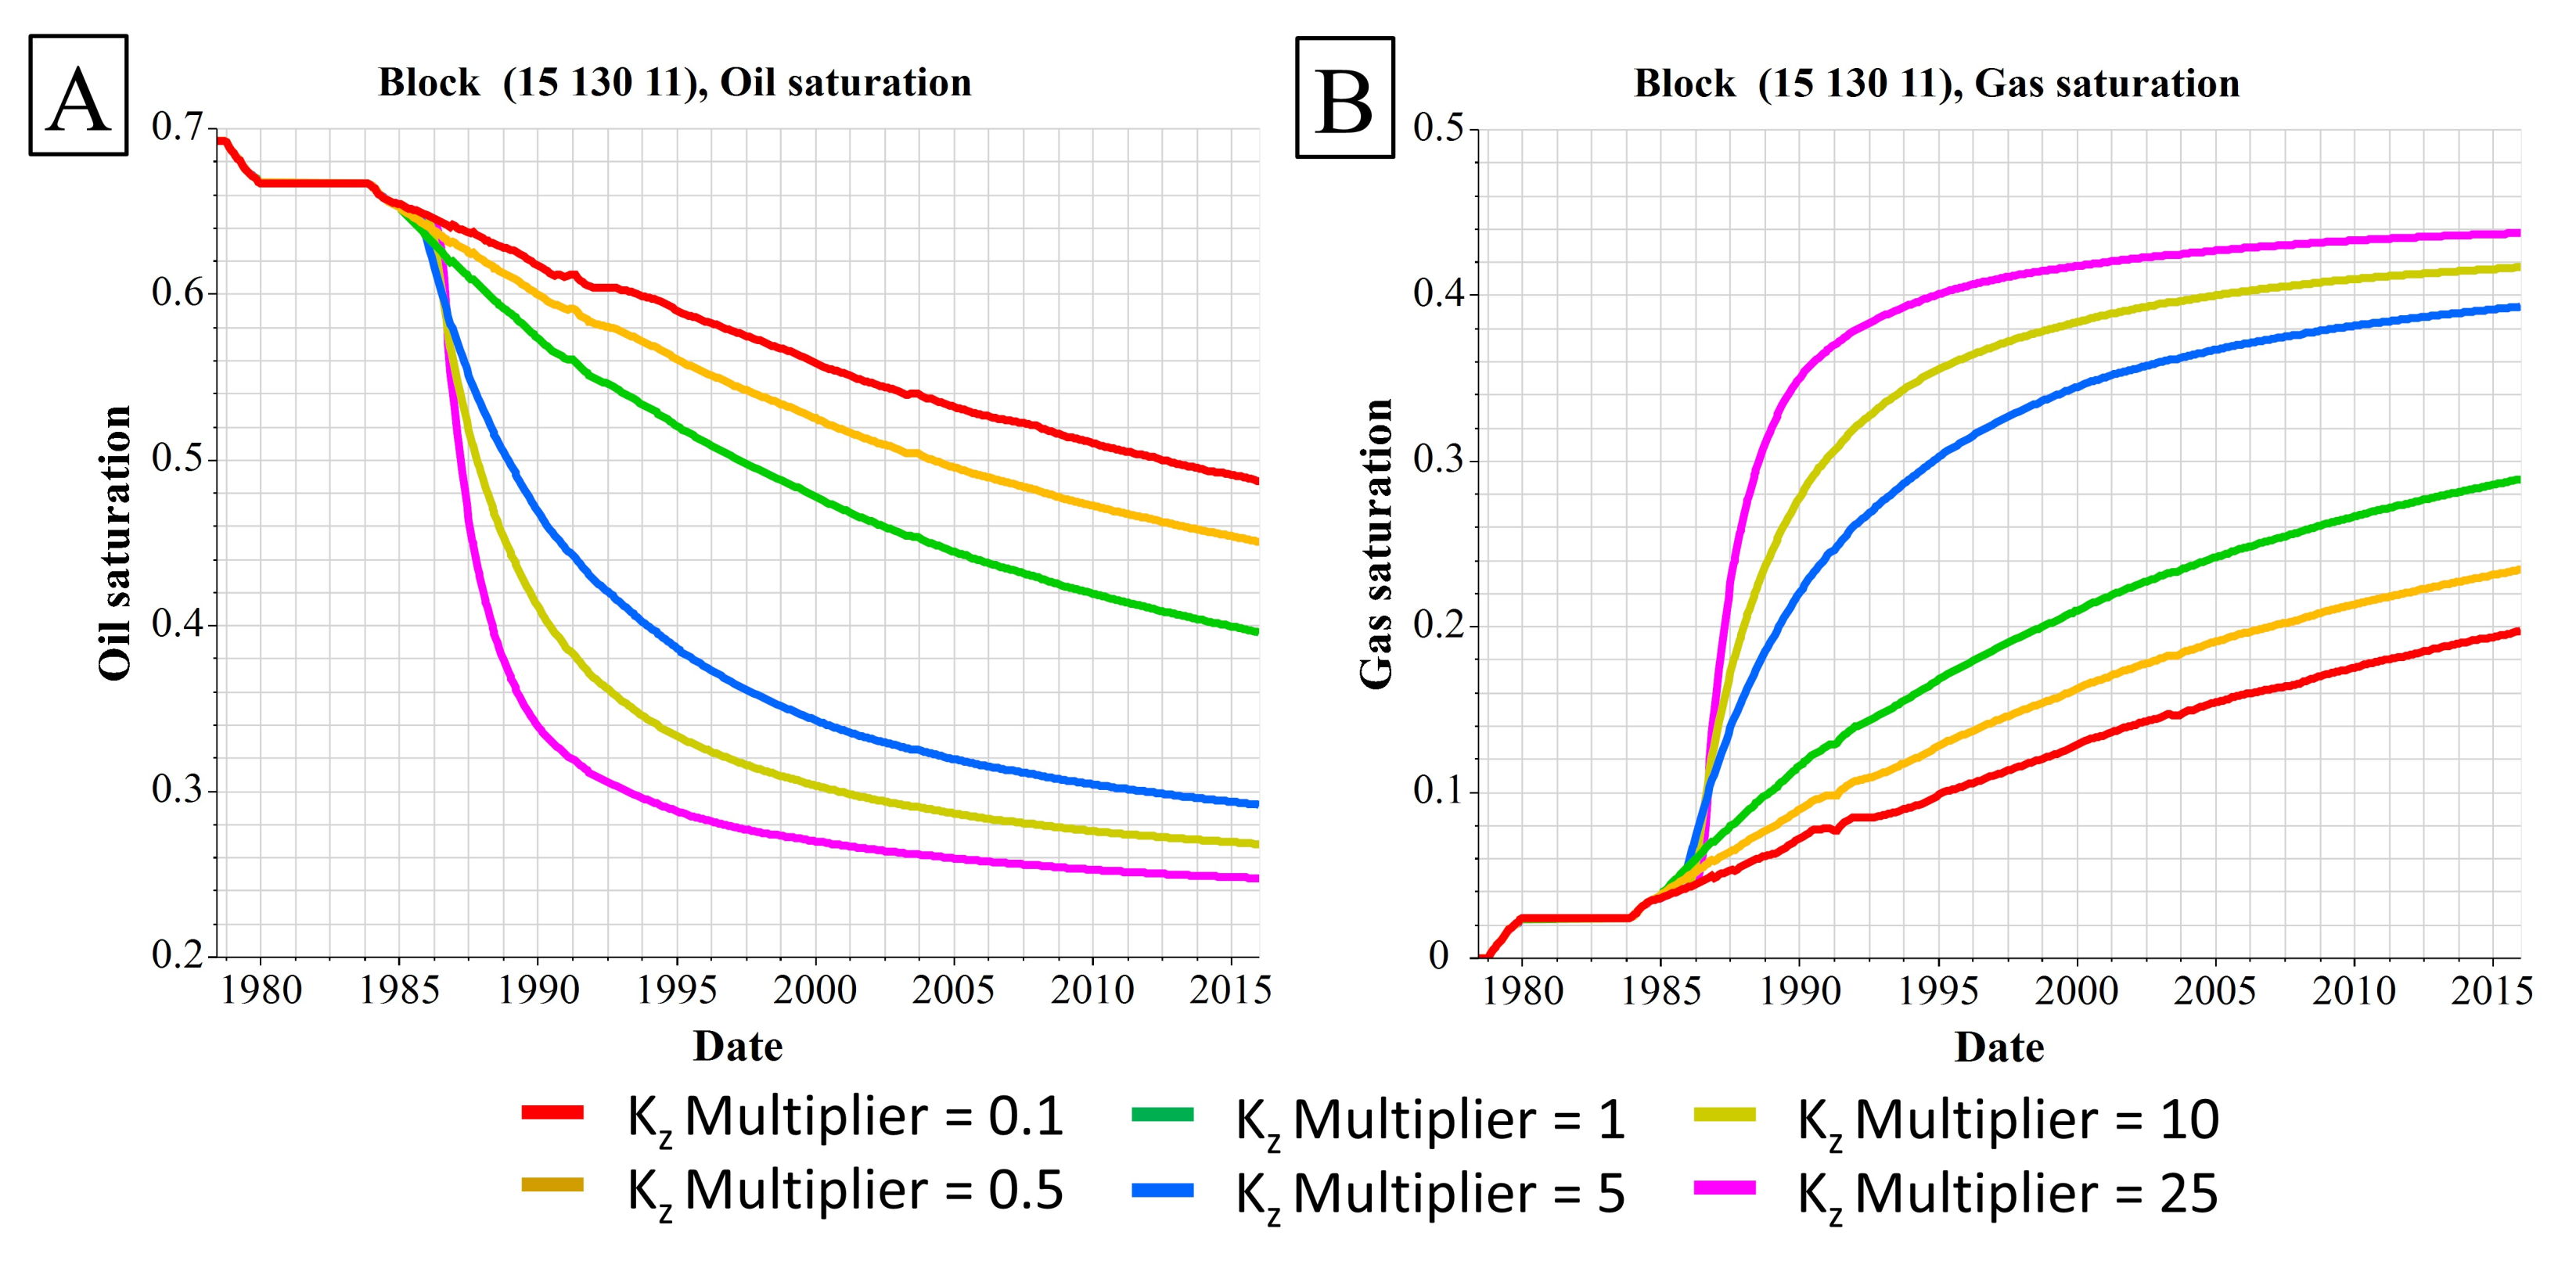
3.2.2. The Vertical Matrix Permeability ( K z )

Vertical permeability is one of the most important properties of the reservoir that should be characterized accurately especially when the reservoir heterogeneity cannot be neglected [36]. Furthermore, the diagenesis processes in the carbonate reservoirs alters the depositional properties of the rocks significantly and creates a faster path for the fluid flow, such as solution channels or flow baffles due to cement precipitations. Therefore, vertical permeability has a significant role in the fluid exchange between the matrix and fracture system in the naturally fractured carbonate reservoirs.
Sensitivity scenarios for the vertical permeability effect on the oil recovery from the matrix blocks using the alternative gravity drainage model [17] have investigated. A multiplier factor was used to examine the effect of different values of vertical permeability, and to maintain the variation in the distributed property, which is populated based on the geological characterization of the reservoir. The simulation results illustrate that the higher the vertical permeability, the higher the oil recovery from the matrix blocks, as shown in Figure 20 and Figure 21.

3.2.3. The Effect of the Matrix Block Height ( L z )

The alternative gravity drainage model of [17] was used to evaluate the effect of the matrix block height ( L z ) on the oil saturation in the matrix blocks hence the oil recovery. Modifying the matrix block height will change the vertical shape factor ( σ G D ) and affect the gravity mechanism. The simulation results indicate that for a smaller matrix block height, the oil saturation significantly decreases while the taller matrix blocks exhibited a slower oil recovery as shown in Figure 22. Furthermore, the matrix block height shows negligible differences when reaching a certain height where if ( L z ) is multiplied by 5 or by 10 in this particular reservoir. The results almost overlapped and no considerable increment in the recovery is observed (cf. [37]). Therefore, overestimating the matrix block height after this point will have no effect on the results due to the capillary pressure threshold between the matrix and fracture becoming negligible [37].

4. Discussion

The effect of the gravity drainage mechanism has been illustrated through different scenarios using different modelling scales—fine grid, medium grid, and in a real naturally fractured carbonate reservoir model. Various formulas exhibited different abilities to represent the effectiveness of the gravity drainage process accurately. The effect of the gravity term in the Gilman and Kazemi equations tend to overestimate the matrix recovery in the early time (see Figure 19), because they use the horizontal permeability for gravity drainage calculation compared to Quandalle and Sabathier equations, which use the vertical permeability. Furthermore, the Quandalle and Sabathier suggestion of using two different shape factors have improved the representation of the fluid exchanges across each face of the matrix blocks and better representation of the gravity drainage in the vertical direction.
Although the selected gravity drainage models using the dual-porosity model hugely affect the saturation profile in the matrix block, other parameters have also exhibited a comparable role. These parameters are vertical permeability of the matrix, when Quandalle and Sabathier formulas are activated, and matrix block heights which are among the matrix characteristics that can change the saturation profile tremendously. The sensitivity scenario results implemented by altering ( k z ) and ( L z ) demonstrated a wide range of changes of the fluid saturation distribution in the matrix blocks across the reservoir as shown in Figure 17 and Figure 18. Further confirmation was illustrated through the fine-scale modelling results, where similar results were concluded using the conventional single-porosity model. Therefore, it is essential to address and evaluate the impact of such parameters. The geological characterization of the reservoir can be used as a guidance to reduce the tested range of for ( k z ) and ( L z ) values and to narrow the uncertainty in the simulation outcome.
Tuning the history-matching results in the naturally fractured reservoirs can be quickly achieved by switching between the gravity drainage options or by altering the vertical permeability or the height of the matrix blocks. Nevertheless, the selected options or values should be justified and tested to prove their validity and to sustain the model reliability for future prediction, where the recovery value and recovery speed can be highly biased and unreliable as illustrated in the fine-model outcomes when inappropriate parameters used. Moreover, the success of any secondary or tertiary recovery methods requires simulation models with reliable prediction ability, where recovery speed using the dual-porosity model is very sensitive to the reservoir characterization that can substantially impact the ultimate recovery and nullify the efforts of increasing the recovery factor from such fields [38].
Although one example of a naturally fractured reservoir was used (i.e., Qamchuqa reservoir) the discussion applies to all the naturally fractured reservoirs where the contrast between fracture and matrix flow capacity make the gas advances in the fractures always ahead compared to the matrix. Gas advancement in the fractures leads to activating the gravity role and accelerating the fluid exchange between the fracture and matrix and to contribute remarkably to the recovery mechanism. Therefore, similar results are expected if other data sets of a fractured reservoir are used in the analysis.
In vuggy fractured reservoirs, the reservoir performance can be varied and depends on the characterization of the vugs. Separate vugs increase the reservoir porosity, but it does not enhance the matrix permeability [39,40]. The touching vugs in the matrix enhance the low matrix permeability up to ten times of that expected from the matrix [39], while improving the exchange rate between the matrix and the fractures; hence the gravity drainage mechanism. Moreover, the fractures could connect the vugs in the system and increase fracture storage and flow capacity [40,41,42]. Furthermore, higher touching vug density in the reservoir may behave equivalently to the fracture performance, which improves the matrix connectivity to the fracture system significantly.

5. Conclusions

The gravity drainage process is one of the significant drive mechanisms in naturally fractured reservoirs, especially in the gas–oil system as a natural depletion or as a gravity-assisted process [9,10,11]. The contribution of the process has been evaluated qualitatively through the saturation profiles and the recovery speed. However, a quantitative evaluation of the gravity drainage process can be achieved by evaluating both viscous and capillary forces contribution to obtaining a better understanding of the whole drive mechanism. Moreover, monitoring their contribution over time is recommended to identify how their impacts change, respectively. The following points can be concluded for the current stage of work:
  • The accurate modelling of the gravity drainage process is essential in naturally fractured reservoirs. Neglecting the gravity forces in the reservoir will underestimate the matrix contribution to the ultimate reservoir recovery.
  • Inappropriate use of gravity drainage formulas will change the saturation profiles across the reservoir, and they will overestimate the matrix recovery when Gilman and Kazemi’s formulas used, as their gravity term uses the horizontal permeability for the gravity drainage calculations [16,21]
  • Despite the difficulties in obtaining the vertical matrix permeability data, their accurate modelling is necessary for the gravity term of the Quandalle and Sabathier formula when the dual-porosity model is used, and for the fine-scale modelling when the single-porosity model is used.
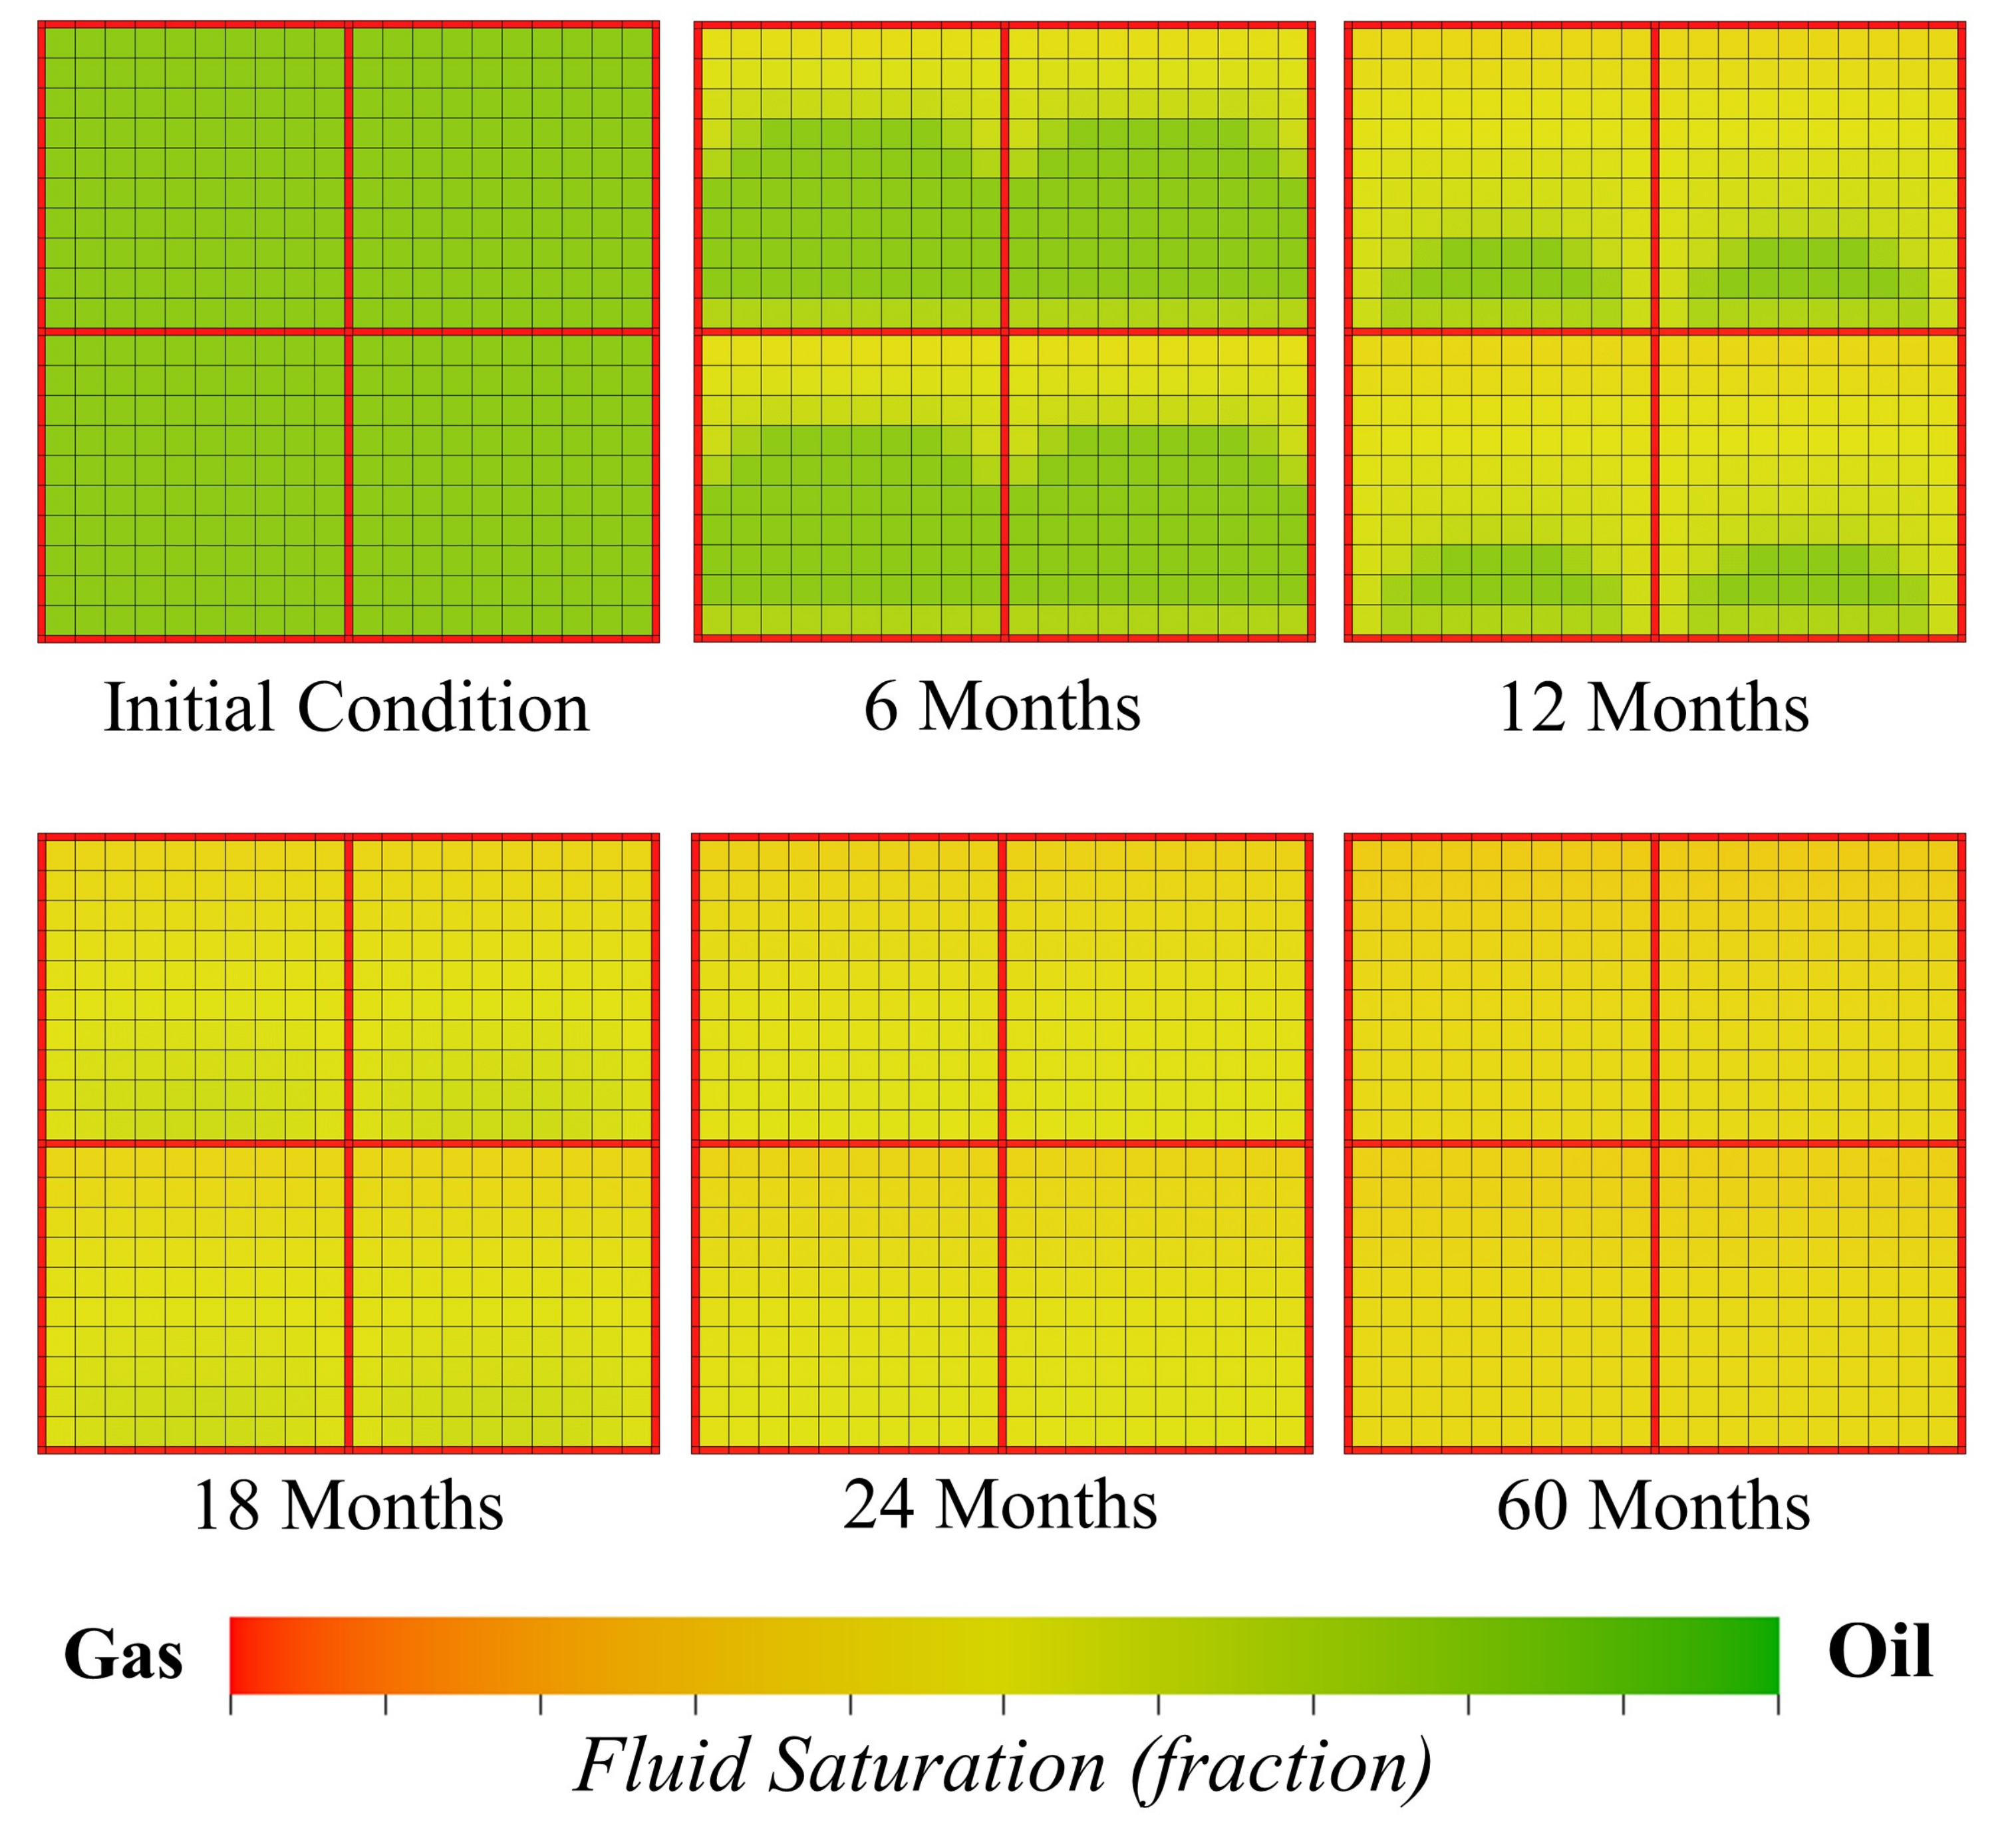
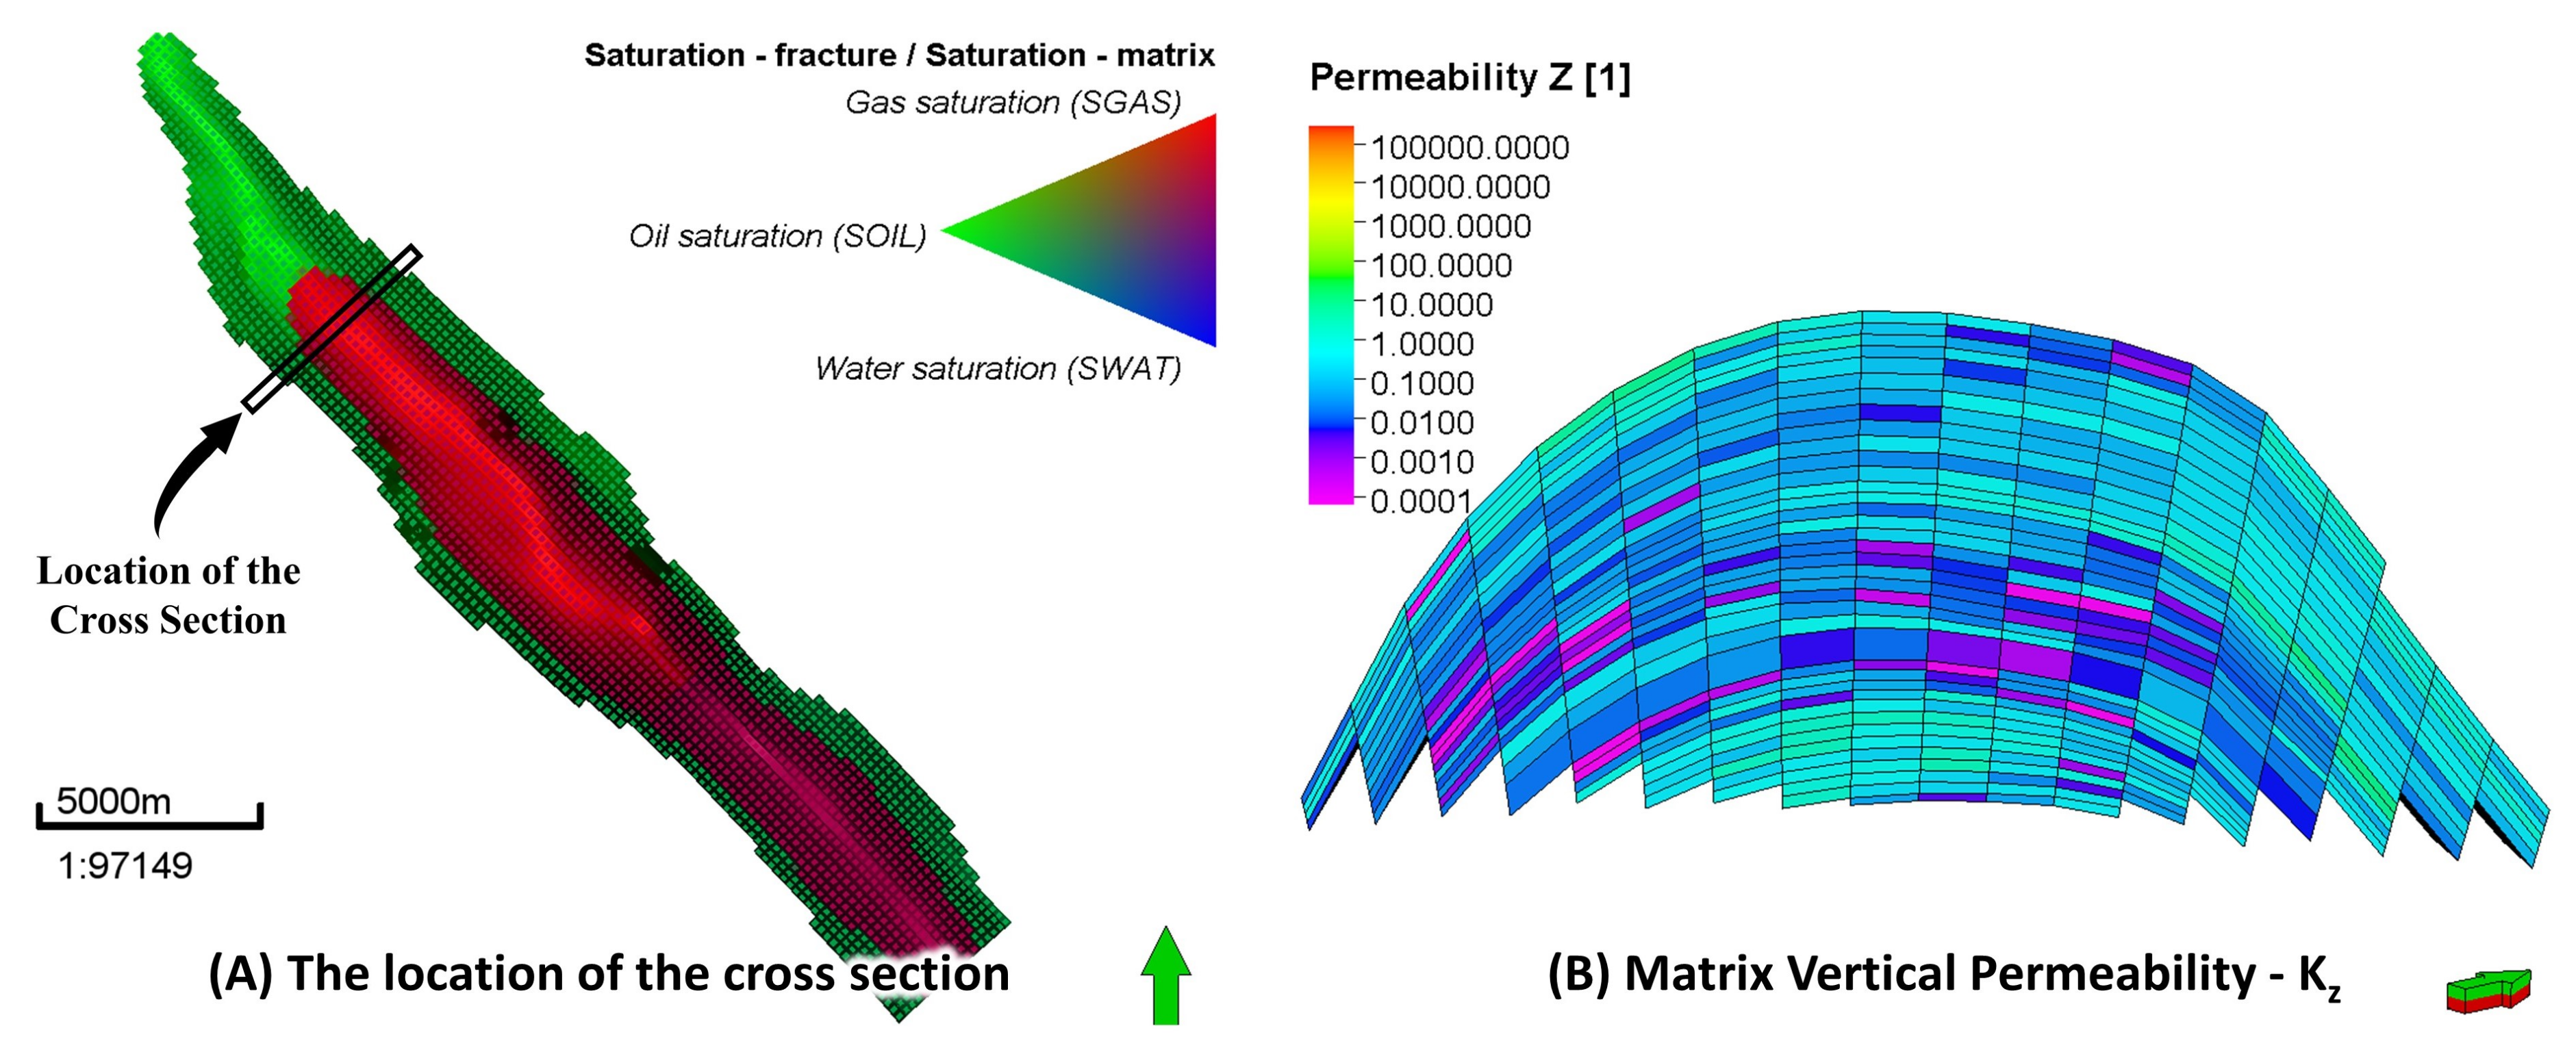
  • The differences between the gravity drainage formulas may not be easily observed in the simulation results of the reservoir behavior such as BHP or oil flow rate plots with time. However, in such cases, examining reservoir cross-sections of the oil and gas saturation of the matrix cells will demonstrate the differences.
  • The height of the matrix block has a tremendous impact on the saturation profile, and geological characterization can help to determine the possible range of the matrix block heights in each formation or flow zone [31,32].
  • The uncertain properties of the matrix, such as vertical permeability and matrix block height, can be selected as tuning parameters in the history-matching to improve the matching results when the dual-porosity model is used.
  • The currently used options of gravity drainage with parameters to achieve history-matching have a substantial impact on further development strategies such as miscible gas injection or any other enhanced oil recovery methods. Therefore, intensive sensitivity scenarios should be implemented for the effect of capillary pressure continuity, wettability, surface tension, and other reservoir characteristics to conclude a sound decision for the development option [38].
  • Comparison of the simulation results of the gravity drainage with the lab experiment results (e.g., published results of [43]) is recommended. Moreover, investigation of the gravity drainage effect in other scenarios rather than gas-coning scenario, such as Water Alternating Gas (WAG), C o 2 flooding, or carbonated water injection (CWI) is also recommended. Promising results of improving oil recovery were reported for the abovementioned scenarios with further reduction in the residual oil saturation (e.g., CWI experiment results as illustrated by [44]).

Author Contributions

Conceptualization, F.A.A. and J.H.L.; methodology, K.A.E. and K.D.S.; software, F.A.A. and J.H.L.; validation, F.A.A., J.H.L., K.A.E. and K.D.S.; formal analysis, F.A.A.; investigation, F.A.A. and J.H.L.; permission acquisition of using field data, F.A.A.; writing—original draft preparation, F.A.A.; writing—review and editing F.A.A., K.D.S., J.H.L. and K.A.E.; visualization, K.A.E.; supervision, J.H.L., K.A.E. and K.D.S.; APC funding acquisition, J.H.L.

Funding

The APC was funded by Universiti Teknologi PETRONAS, YUTP grant (015LC0-109).

Acknowledgments

The authors would like to express their deepest gratitude to Universiti Teknologi PETRONAS for providing the required software license and creating the necessary working environment. The authors would also like to thank the Ministry of Oil of Iraq and the management of North Oil Company for their permission to use their data in this work.

Conflicts of Interest

The authors declare no conflict of interest.

Abbreviations

τ Matrix–Fracture transfer rate, (rm 3 /sm 3 )
α * Dimensionless characteristics of the fractures
P m Fluid pressure in the matrix block, Pa
P f Fluid pressure in the fracture, Pa
μ Viscosity, Pa·s
σ Shape factor, 1/m 2
nNumber of natural fracture sets, 1, 2, 3
LMatrix block dimensions in x, y, and z, m
P f s Fluid pressure in the subdomain fracture, Pa
P α m s Fluid pressure in the subdomain matrix, Pa
D f s Depth of the subdomain fracture, m
D m s Depth of the subdomain matrix, m
ϕ Porosity, fraction
γ Fluid gradient, Pa/m
α Fluid phase, gas, oil, water
m , f Matrix, Fracture
Φ Potential, Pa
P f I Pressure at the fluid interface, Pa
Δ z Gridblock thickness, m
h w f Water height in the fractures, m
k r Relative permeability
P c Capillary pressure, Pa
σ Q Horizontal shape factor, 1/m 2
σ G D Vertical shape factor, 1/m 2
gGravity, m/s 2
v , h Vertical, horizontal
jPhase index
j * The second phase index
z + , z Flow in the vertical direction, up and down
L z Matrix block height, m
K v Adjustment parameter for viscosity force
K g Adjustment parameter for gravity force
K c Adjustment parameter for capillary force
BFormation factor, rm 3 /sm 3
SFluid saturation, fraction
S i r Irreducible saturation, fraction
S r Residual saturation, fraction
α * * , β Matching parameters

References

  1. IEA. World Energy Outlook, International Energy Agency. 2018. Available online: https://www.iea.org/weo2018/ (accessed on 24 September 2019).
  2. Nikkinen, J.; Rothovius, T. The EIA WPSR release, OVX and crude oil internet interest. Energy 2019, 166, 131–141. [Google Scholar] [CrossRef]
  3. Jiang, Y.; Jiang, C.; Nie, H.; Mo, B. The time-varying linkages between global oil market and China’s commodity sectors: Evidence from DCC-GJR-GARCH analyses. Energy 2019, 166, 577–586. [Google Scholar] [CrossRef]
  4. Schlumberger. Technical Challenges - Carbonate Reservoirs. 2019. Available online: https://www.slb.com/technical-challenges/carbonates (accessed on 24 September 2019).
  5. Elfeel, M.A.; Jamal, S.; Enemanna, C.; Arnold, D.; Geiger, S. Effect of DFN upscaling on history matching and prediction of naturally fractured reservoirs. In Proceedings of the 75th European Association of Geoscientists and Engineers Conference and Exhibition 2013 Incorporating SPE EUROPEC 2013: Changing Frontiers, London, UK, 10–13 June 2013. [Google Scholar] [CrossRef]
  6. Geiger, S.; Dentz, M.; Neuweiler, I. A Novel Multi-Rate Dual-Porosity Model for Improved Simulation of Fractured and Multiporosity Reservoirs. SPE-148130-PA 2013. [Google Scholar] [CrossRef]
  7. Chandra, V.S.; Geiger, S.; Corbett, P.; Steele, R.; Milroy, P.; Barnett, A.; Wright, P.V. Using Near Wellbore Upscaling to Improve Reservoir Characterisation and Simulation in Highly Heterogeneous Carbonate Reservoirs. In Proceedings of the SPE Reservoir Characterization and Simulation Conference and Exhibition, Abu Dhabi, UAE, 16–18 September 2013. [Google Scholar] [CrossRef]
  8. Sarma, P.; Aziz, K. New Transfer Functions for Simulation of Naturally Fractured Reservoirs with Dual Porosity Models. SPE J. 2006, 11, 328–340. [Google Scholar] [CrossRef]
  9. Alvarado, V.; Manrique, E. Enhanced Oil Recovery: Field Planning and Developement Strategies; Elsevier Incorporation: Amsterdam, The Netherlands, 2010. [Google Scholar]
  10. Jing, W.; Zemin, J.; Huiqing, L.; Huang, Y.; Yishuang, W.; Yulong, P. Experiments on nitrogen assisted gravity drainage in fractured-vuggy reservoirs. Petr. Explor. Dev. 2019, 46, 355–366. [Google Scholar]
  11. Elfeel, M.A.; Al-Dhahli, A.; Geiger, S.; van Dijke, M.I. Fracture-matrix interactions during immiscible three-phase flow. J. Petr. Sci. Eng. 2016, 143, 171–186. [Google Scholar] [CrossRef]
  12. Al-kobaisi, M.; Kazemi, H.; Ramirez, B.; Ozkan, E.; Atan, S.; Kazemi, H.; Ramirez, B.; Ozkan, E.; Atan, S. A Critical Review for Proper Use of Water/Oil/Gas Transfer Functions in Dual-Porosity Naturally Fractured Reservoirs: Part II. SPE-109821-PA 2009. [Google Scholar] [CrossRef]
  13. Ramirez, B.; Kazemi, H.; Al-kobaisi, M.; Ozkan, E.; Atan, S. A Critical Review for Proper Use of Water/Oil/Gas Transfer Functions in Dual-Porosity Naturally Fractured Reservoirs: Part I. SPE Reserv. Eval. Eng. 2009, 12, 200–210. [Google Scholar] [CrossRef]
  14. Heinemann, Z.E.; Mittermeir, G.M. Generally Applicable Method For Calculation Of The Matrix-fracture Fluid Transfer Rates. In Proceedings of the SPE Europec featured at 78th EAGE Conference and Exhibition, Vienna, Austria, 30 May–2 June 2016; p. 26. [Google Scholar] [CrossRef]
  15. Gilman, J.R.; Kazemi, H. Improvements in Simulation of Naturally Fractured Reservoirs. SPE-10511-PA 1983. [Google Scholar] [CrossRef]
  16. Gilman, J.R.; Kazemi, H. Improved Calculations for Viscous and Gravity Displacement in Matrix Blocks in Dual-Porosity Simulators. SPE-16010-PA 1988. [Google Scholar] [CrossRef]
  17. Quandalle, P.; Sabathier, J.C. Typical Features of a Multipurpose Reservoir Simulator. SPE Reserv. Eng. 1989, 4, 475–480. [Google Scholar] [CrossRef]
  18. Barenblatt, G.I.; Zheltov, I.P.; Kochina, I.N. Basic Concepts In The Theory Of Seepage Of Homogenous Liquids In Fissured Rocks [Strata]. PMM 1960, 24, 852–864. [Google Scholar]
  19. Warren, J.E.; Root, P.J. The Behavior of Naturally Fractured Reservoirs. SPE-426-PA 1963, 3. [Google Scholar] [CrossRef]
  20. Kazemi, H.; Merrill, L.S., Jr.; Porterfield, K.L.; Zeman, P.R. Numerical Simulation of Water-Oil Flow in Naturally Fractured Reservoirs. SPE-5719-PA 1976. [Google Scholar] [CrossRef]
  21. Ahmad, S.A.; Olivier, R.G. Matrix-Fracture Transfer Function in Dual-Medium Flow Simulation: Review, Comparison, and Validation. In Proceedings of the Europec/EAGE Conference and Exhibition, Rome, Italy, 9–12 June 2008. [Google Scholar]
  22. Kazemi, H.; Gilman, J.R. Multiphase flow in fractured petroleum reservoirs. In Flow and Contaminant Transport in Fractured Rock; Elsevier Incorporation: Amsterdam, The Netherlands, 1993; pp. 267–323. [Google Scholar]
  23. Sonier, F.; Souillard, P.; Blaskovich, F.T. Numerical Simulation of Naturally Fractured Reservoirs. SPE-15627-PA 1988. [Google Scholar] [CrossRef]
  24. Uleberg, K.; Kleppe, J. Dual porosity, dual permeability formulation for fractured reservoir simulation. Norwegian University of Science and Technology, Trondheim RUTH Seminar, Stavanger. 1996. Available online: http://www.ipt.ntnu.no/~kleppe/TPG4150/fracturedpaper.pdf (accessed on 24 September 2019).
  25. Alkandari, H.A. Numerical Simulation of Gas-Oil Gravity Drainage for Centrifuge Experiments and Scaled Reservoir Matrix Blocks. Ph.D. Thesis, Colorado School of Mines, Arthur Lakes Library, Golden, CO, USA, 2002. [Google Scholar]
  26. Balogun, A.S. Verification and Proper Use of Water-Oil Transfer Function for Dual-Porosity and Dual-Permeability Reservoirs. In Proceedings of the Society of Petroleum Engineers: SPE Middle East Oil and Gas Show and Conference, Manama, Bahrain, 11–14 March 2007. [Google Scholar] [CrossRef]
  27. Su, S. Dynamic Matrix-Fracture Transfer Behavior in Dual-Porosity Models; Society of Petroleum Engineers: London, UK, 2013. [Google Scholar] [CrossRef]
  28. Lu, H. General Transfer Function for Multiphase Flow; Society of Petroleum Engineers: San Antonio, TX, USA, 2006. [Google Scholar] [CrossRef]
  29. Lu, H.; Di Donato, G.; Blunt, M.J. General transfer functions for multiphase flow in fractured reservoirs. SPE J. 2008, 13, 289–297. [Google Scholar] [CrossRef]
  30. Firoozabadi, A.; Thomas, L.K. Sixth SPE Comparative Solution Project: Dual-Porosity Simulators. J. Petr. Echnol. 1990, 42, 710–763. [Google Scholar] [CrossRef]
  31. Wennberg, O.P.; Azizzadeh, M.; Aqrawi, A.A.M.; Blanc, E.; Brockbank, P.; Lyslo, K.B.; Pickard, N.; Salem, L.D.; Svana, T. The Khaviz Anticline: An outcrop analogue to giant fractured Asmari Formation reservoirs in SW Iran. In Fractured Reservoirs; The Geological Society: London, UK, 2007; pp. 23–42. [Google Scholar]
  32. Wennberg, O.P.; Svånå, T.; Azizzadeh, M.; Aqrawi, A.M.M.; Brockbank, P.; Lyslo, K.B.; Ogilvie, S. Fracture intensity vs. mechanical stratigraphy in platform top carbonates: The Aquitanian of the Asmari Formation, Khaviz Anticline, Zagros, SW Iran. Petr. Geosci. 2006, 12, 235–246. [Google Scholar] [CrossRef]
  33. Sadooni, F.N.; Alsharhan, A.S. Stratigraphy, Microfacies, and Petroleum Potential of The Mauddud Formation (Albian–Cenomanian) in the Arabian Gulf basin. Am. Assoc. Petr. Geol. AAPG Bull. 2003, 87, 1653–1680. [Google Scholar] [CrossRef]
  34. Jassim, S.Z.; Buday, T.; Goff, J.C. Geology of Iraq, 1st ed.; Dolin, Prague and Moravian Museum: Brno, Czech Republic, 2006. [Google Scholar]
  35. Al-Qayim, B.; Qadir, F.; Al-Biaty, F. Dolomitization and porosity evaluation of the Cretaceous Upper Qamchuqa (Mauddud) Formation, Khabbaz oil field, Kirkuk area, northern Iraq. GeoArabia 2010, 15, 49–76. [Google Scholar]
  36. Shedid, S.A. Vertical-horizontal permeability correlations using coring data. Egypt. J. Petr. 2019, 28, 97–101. [Google Scholar] [CrossRef]
  37. Zendehboudi, S. Investigation of Gravity Drainage in Fractured Porous Media. Ph.D. Thesis, University of Waterloo, Waterloo, ON, Canada, 2010. Available online: https://uwspace.uwaterloo.ca/handle/10012/5586?show=full (accessed on 24 September 2019).
  38. Elfeel, M.A.; Al-Dhahli, A.; Geiger, S.; van Dijke, M.I.J. Multi-Scale Simulation of WAG Flooding in Naturally Fractured Reservoirs. In Proceedings of the EAGE Annual Conference & Exhibition incorporating SPE Europec, London, UK, 10–13 June 2013. [Google Scholar] [CrossRef]
  39. Lucia, F.J. Carbonate Reservoir Characterization: An Integrated Approach; Springer: Berlin, Germany, 2007. [Google Scholar]
  40. Jia, B.; Tsau, J.S.; Barati, R. Experimental and numerical investigations of permeability in heterogeneous fractured tight porous media. J. Nat. Gas Sci. Eng. 2018, 58, 216–233. [Google Scholar] [CrossRef]
  41. Vik, B.; Djurhuus, K.; Spildo, K.; Skauge, A. Characterisation of vuggy carbonates. In Proceedings of the SPE/EAGE Reservoir Characterization and Simulation Conference, Abu Dhabi, UAE, 28–31 October 2007. [Google Scholar] [CrossRef]
  42. Zhang, F.; An, M.; Yan, B.; Wang, Y. Modeling the Depletion of Fractured Vuggy Carbonate Reservoir by Coupling Geomechanics with Reservoir Flow. In Proceedings of the SPE Reservoir Characterisation and Simulation Conference and Exhibition, Abu Dhabi, UAE, 8–10 May 2017. [Google Scholar] [CrossRef]
  43. Zobeidi, K.; Fassihi, M. Block to block interactions and their effects on miscibility gravity drainage in fractured carbonate reservoirs, experimental and analytical results. J. Petr. Sci. Eng. 2018, 164, 696–708. [Google Scholar] [CrossRef]
  44. Jia, B. Carbonated water injection (CWI) for improved oil recovery and carbon storage in high-salinity carbonate reservoir. J. Taiwan Inst. Chem. Eng. 2019. [Google Scholar] [CrossRef]
Figure 1. The subdomain approach suggested by Gilman and Kazemi to improve the gravity modelling which shown the matrix grid refinement in addition to the complete fluid segregation in the surrounding fractures when the capillary pressure is zero, after Gilman [16].
Energies 12 03699 g001
Figure 2. Cross-sectional model of the 6th SPE comparative solution project which illustrates the model layers with their properties.
Energies 12 03699 g002
Figure 3. The oil allowed to flow from the matrix to the fractures as illustrated by black arrows (e.g., [15,17] models), while the allowed re-infiltration option is demonstrated by red arrows.
Energies 12 03699 g003
Figure 4. Comparison of the model behavior using different gravity drainage options, remarkable differences were observed in the results which highlight the significant roles of the gravity mechanisms. The results of the gravity drainage scenario (blue line legend) represent the published results of [30] work, where the data file is available in the ECLIPSE package with the name S P E 6 _ F R A C .
Energies 12 03699 g004
Figure 5. Oil and gas saturation profile at the end of simulation time, which illustrates how different gravity drainage options change the saturation profile. Furthermore, the saturation profile also highlighted the underestimation of the exchange rate between the matrix and the fracture domain when the gravity effect was not accounted for, or when inappropriate representation of the gravity mechanisms was used.
Energies 12 03699 g005
Figure 6. The effect of vertical matrix permeability ( k z ) on the ultimate oil recovery of the model using (A) Alternative Gravity Drainage–Quandalle and Sabathier formulas, which obtained various field performances, compared to (B) Gravity Drainage–Gilman and Kazemi formulas, where oil recovery was not affected by vertical permeability, as illustrated by similar performance of various K z values.
Energies 12 03699 g006
Figure 7. Illustration of the differences between grid cell dimensions ( Δ X , Δ Y , Δ Z ) and matrix block dimensions ( L x , L y , L z ) , which are used in the shape factor calculations as explained in Equation (4).
Energies 12 03699 g007
Figure 8. Matrix block height sensitivity by using property multipliers to maintain the variation in the originally characterized values for each layer in the model. The evaluation was implemented using the Quandalle and Sabathier formula [17].
Energies 12 03699 g008
Figure 9. A small-scale model illustrating the configuration of the matrix blocks with their refinements surrounded by the fractures, based on Figure 7.
Energies 12 03699 g009
Figure 10. (A) Map of Iraq showing the location of Jambur field indicated by a blue star; (B) Sequence stratigraphy of the Cretaceous Age, highlighting the producing formation in Jambur field indicated by red dots within the foothill zone, modified after [34].
Energies 12 03699 g010
Figure 11. Depositional environment of the Cretaceous reservoir, Jambur field. The black dots refer to the wells.
Energies 12 03699 g011
Figure 12. Oil and gas saturation of the fine model for several intervals starting from the initial condition, 6, 12, 18, 24, and 60 months.
Energies 12 03699 g012
Figure 13. Comparison of the oil recovery from the matrix blocks using various matrix block dimensions of (1.524, 3.048, 6.096, and 15.24 m) by assuming (lx = ly = lz). The speed of recovery increased significantly when the matrix blocks are small, e.g., 40 % of oil recovery required 167 days when the matrix block dimensions are ( 1.524 × 1.524 × 1.524 m 3 ) compared to 1795 days that required for the same recovery when the dimensions are ( 15.24 × 15.24 × 15.24 m 3 )
Energies 12 03699 g013
Figure 14. Comparison of the matrix permeability effect on the recovery speed and oil recovery from matrix blocks (A) horizontal permeability in both x- and y-direction; (B) vertical permeability in the z-direction.
Energies 12 03699 g014
Figure 15. Comparison of different gravity drainage options in the history-matching results for the bottom hole pressure (BHP) in eight wells. The lower bottom hole pressure response (the blue line) represents the reservoir behavior when the gravity neglected while the other overlapped lines represent the different gravity drainage formulas.
Energies 12 03699 g015
Figure 16. (A) The initial fluid distribution in the Qamchuqa reservoir, with the illustration of the IK cross-section location. (B) Vertical permeability of the matrix medium for the IK cross-section.
Energies 12 03699 g016
Figure 17. Comparison of the oil saturation profile using different formulas of gravity drainage; (A) No gravity effect, (B) Gravity drainage, (C) Alternative gravity drainage, and (D) Alternative gravity drainage–allow re-infiltration.
Energies 12 03699 g017
Figure 18. Comparison of the oil saturation profile using different formulas of gravity drainage; (A) No gravity effect, (B) Gravity drainage, (C) Alternative gravity drainage, and (D) Alternative gravity drainage–allow re-infiltration.
Energies 12 03699 g018
Figure 19. Comparison of the oil saturation profile using different formulas of gravity drainage in the matrix block (15 130 11). Where the gravity drainage model (Gilman and Kazemi model) overestimate the matrix recovery and the recovery speed compared to both alternative gravity drainage models (Quandalle and Sabathier models) while ignoring the gravity drainage effect underestimate the oil recovery from the matrix.
Energies 12 03699 g019
Figure 20. The effect of various vertical permeability of the matrix on the oil saturation, hence the oil recovery from the matrix blocks. The oil saturation is illustrated by the legend where the purple color represents zero saturation percent while the red color represents 100% of oil saturation.
Energies 12 03699 g020
Figure 21. The effect of various vertical permeabilities of the matrix on the oil saturation in the block (15 130 11), hence the oil recovery from the matrix blocks.
Energies 12 03699 g021
Figure 22. The effect of various matrix block heights on the oil saturation in the block (15 130 11), hence the oil recovery from the matrix blocks.
Energies 12 03699 g022
Table 1. The tested range of the matrix block height.
LayersMatrix Block Height, L z Multipliers
1, 27.62 m (25 ft)Min(0.1), Max(5)
31.524 m (5 ft)Min(0.1), Max(5)
4, 53.048 m (10 ft)Min(0.1), Max(5)
Table 2. Rock and Fluid properties of the fine-scale model.
ParametersValue
Grid block dimension, Δ x × Δ y × Δ z 6.32 m × 6.32 m × 6.32 m (20.75 ft × 20.75 ft × 20.75 ft)
Matrix block dimension, l x × l y × l z 3.048 m × 3.048 m × 3.048 m (10 ft × 10 ft × 10 ft)
Matrix porosity0.20 (fraction)
Fracture porosity0.0002 (fraction)
Matrix permeability, k x , y , z 1 (mD)
Fracture permeability, k x , y , z 1000 (mD)
Irreducible water saturation, S w i r r 0.22 (fraction)
Oil formation volume factor, B o 1.205 rm 3 /sm 3 ( R B / S T B )
Gas formation volume factor, B g 9.92 × 10 3 rm 3 /sm 3 1.767 ( R B / M S C F )
Water formation volume factor, B w 1.015 rm 3 /sm 3 ( R B / S T B )
Oil viscosity, μ o 0.54 mPas·s ( c P )
Gas viscosity, μ g 0.0156 mPas·s ( c P )
Water viscosity, μ w 0.47 mPas·s ( c P )
Surface oil density, ρ o 0.833 gm/cc (52 lb/ft 3 )
Surface gas density, ρ g 8.01 × 10 4 gm/cc (0.05 lb/ft 3 )
Surface water density, ρ w 1.0732 gm/cc (67 lb/ft 3 )

