Article

Aerodynamic Performance and Wind-Induced Responses of Large Wind Turbine Systems with Meso-Scale Typhoon Effects

1
Department of Civil Engineering, Nanjing University of Aeronautics and Astronautics, 29 Yudao Road, Nanjing 210016, China
2
Jiangsu Key Laboratory of Hi-Tech Research for Wind Turbine Design, Nanjing University of Aeronautics and Astronautics, Nanjing 210016, China
3
China Energy Engineering Group Guangdong Electric Power Design Institute Co., Ltd., Guangzhou 510663, China
*
Author to whom correspondence should be addressed.
Energies 2019, 12(19), 3696; https://doi.org/10.3390/en12193696
Submission received: 27 August 2019 / Revised: 19 September 2019 / Accepted: 23 September 2019 / Published: 27 September 2019

Abstract

:
The theoretical system of existing civil engineering typhoon models is too simplified and the simulation accuracy is very low. Therefore, in this work a meso-scale weather forecast model (WRF) based on the non-static Euler equation model was introduced to simulate typhoon “Nuri” with high spatial and temporal resolution, focusing on the comparison of wind direction and wind intensity characteristics before, during and after the landing of the typhoon. Moreover, the effectiveness of the meso-scale typhoon “Nuri” simulation was verified by a comparison between the track of the typhoon center based on minimum sea level pressure and the measured track. In this paper, the aerodynamic performance of large wind turbines under typhoon loads is studied using WRF and CFD nesting technology. A 5 MW wind turbine located in a wind power plant on the southeast coast of China has been chosen as the research object. The average and fluctuating wind pressure distributions as well as airflow around the tower body and eddy distribution on blade and tower surface were compared. A dynamic and time-historical analysis of wind-induced responses under different stop positions was implemented by considering the finite element complete transient method. The influence of the stop position on the wind-induced responses and wind fluttering factor of the system were analyzed. Finally, under a typhoon process, the most unfavorable stop position of the large wind turbine was concluded. The results demonstrated that the internal force and wind fluttering factor of the tower body increased significantly under the typhoon effect. The wind-induced response of the blade closest to the tower body was affected mostly. The wind fluttering factor of this blade was increased by 35%. It was concluded from the analysis that the large wind turbine was stopped during the typhoon. The most unfavorable stop position was at the complete overlapping of the lower blade and the tower body (Condition 1). The safety redundancy reached the maximum when the upper blade overlapped with the tower body completely (Condition 5). Therefore, it is suggested that during typhoons the blade of the wind turbine be rotated to Condition 5.

1. Introduction

The microturbulence structure of meso-scale typhoons shows significant differences with that of normal winds. Therefore, it is difficult to simulate the wind field characteristics of typhoons near the ground directly through wind tunnel tests or micro-scale CFD. Wind load is the key load of large wind turbine tower-blade coupling system design, and wind-induced failure of the wind turbine system during violent typhoon occurs frequently [1]. For instance, 22 of 28 wind turbines at the wind power plant in Cangnan in Zhejiang Province (China) suffered local and overall wind-induced failures during the landing of typhoon “Saomai” in 2008 [2]. However, the existing design codes of wind turbines [3,4] are focused on normal winds, resulting in the poor performance when used directly in wind-resistance design of wind turbine structures under the effect of typhoons. In addition, when studying aerodynamic performance, the wind-induced responses and wind fluttering factor distribution of wind turbines at different stop positions under typhoon loads in China there is no data, so relevant studies have important engineering significance.
WRF mode and CFD technology are accepted as the new generations of meso-scale and micro-scale forecasting modes, respectively. They are the most used high-resolution refined wind field forecasting technologies at present [5,6]. Nevertheless, it is difficult to reflect the specific wind profile and landing attenuation effect of mesoscale typhoon wind fields based on micro-scale CFD technology [7]. Besides, the theoretical system of most existing civil engineering typhoon models is too simplified [8]. Based on fluid dynamics and thermodynamics, the meso-scale WRF model can effectively simulate typhoon wind speed fields, wind temperature fields and other information, and comprehensively consider the typhoon evolution process, strong variability and attenuation characteristics. Since typhoons have a large scale and cover a sphere of influence of hundreds of kilometers [9], the grid resolution of typhoon wind fields is usually on a kilometer scale. Nowadays, the overall dimensions of large wind turbine systems have a magnitude measured in hectometers, which represents a great scale difference with the typhoon wind field. To accurately predict aerodynamic loads at blade edges, it is necessary to go deep into the interior of the near-ground boundary layer. The minimum mesh size at the near-wall surface is usually 10−2 m or less [10]. The WRF meso-scale mode will be completely ineffective at this magnitude. Therefore, it is necessary to adopt WRF/CFD nested in the meso-/micro-scale models to realize high-precision simulation of the multi-scale flow field of large-scale wind turbines under typhoon conditions, and solve problems such as high-precision transmission of parameters and flow structure, multi-layer and multi-scale grid nesting, multi-time scale control, and cross-scale mutation.
For studies on meso-scale WRF and micro-scale CFD nesting, references [11,12] carried out a refined numerical simulation on the wind field at the bridge site of a mountain valley using a multi-scale nesting technique based on WRF mode. They found that the running results of WRF can be applied well to the CFD numerical simulated entrance boundary in the mountain valley after downscaling. This solved the determination of inlet mean wind speed during numerical simulation of wind fields in mountain valleys. Dimitrov et al. [13], Li et al. [14] and Papanastasiou et al. [15] discussed the applicability of WRF and CFD nesting technologies in refined simulations of local complicated wind fields. They demonstrated that the WRF/CFD nesting simulation results could better eliminate the mean deviation and root mean square error and reflect the atmospheric characteristics of actual micro-scale topological changes. For studies on the typhoon resistance of large wind turbines, Lian et al. [16] and Steele et al. [17] focused on the wind load distribution characteristics at different stop positions of the wind turbine when the feathering was in the down state under typhoon loads. They reported that the wind load size and distribution on wind wheel were approximately the same under different stop positions when the typhoon flew in along the feathering direction of the blades. Marjanovic et al. [18] and Wang et al. [19] simulated a wind field in a coastal region based on the fluctuating wind spectrum of a typhoon and compared wind speed time history of the typhoon with that of normal wind. They disclosed that there’s a sudden deflection of typhoon direction, which would significantly increase the wind load on the feathering blade. For studies about the aerodynamic performance of wind turbines under different stop positions, Ke et al. [20,21,22,23,24] carried out a series of studies based on large eddy simulation (LES) and finite element technology, mainly covering flow field effect, wind pressure distribution, wind-induced response and wind-induced stability under normal wind conditions.
In order to systematically study the aerodynamic performance and wind effect characteristics of large-scale wind turbine systems under the typhoon process, a meso-scale WRF model based on fluid dynamics and thermodynamics was introduced to simulate typhoon “Nuri” with high spatial and temporal resolution. The characteristics of the 3D near-ground wind field are analyzed emphatically. The validity of the meso-scale typhoon simulation was verified by comparing the simulated and measured paths of the typhoon center. In this paper, a 5 MW wind turbine located in a wind power plant on the southeast coast of China has been chosen as the study object. Near-ground wind field information throughout the landing of the typhoon was acquired and fitted by the nonlinear least squares method. The fitting results provide the initial conditions for the computational fluid mechanics (CFD) model. On this basis, the average and fluctuating wind pressure distributions as well as airflow around the tower body and eddy distribution on the wind turbine system under different stop positions were compared. The effects of stop position on the wind-induced response and wind fluttering factor of the system were discussed. The most unfavorable stop position for the large wind turbine during the typhoon was revealed.

2. Meso-Scale Typhoon Wind Field Simulation and Result Analysis

2.1. WRF Mode Meshing

The 12# Typhoon “Nuri” in 2008 was chosen as the simulation object. Typhoon “Nuri” brought heavy winds and rains to Hong Kong, Guangdong and Guangxi, and caused serious geological disasters and waterlogging. In order to carry out effective numerical simulation of the typhoon path, pressure field and wind speed field, the simulation includes the whole progress of the typhoon from Saigon, Hong Kong to Zhongshan, Guangdong.
Firstly, meshing shall be performed: the WRF mode was the completely compressible non-static mode. The Arakawa-C grid was used to divide the horizontal computing domain in (Figure 1a), while the vertical grids applied the Euler mass coordinate η along the topology (Figure 1b). Arakawa-C grid can represent both scalar and vector magnitudes [25,26], which is beneficial to improve accuracy in high-resolution simulations. However, the positions on the C-type grid were different. The u and v components of the horizontal wind speed were set on the orthogonal boundary of the quadrilateral cell point region. They were respectively perpendicular to the boundary of the vertical and longitudinal elements. In addition, scalars such as temperature, humidity and pressure were set in the center of the quadrilateral cell. The velocity of Arakawa-C grid and other variables were calculated on the single grid distance, which had good dispersion properties and conservation.
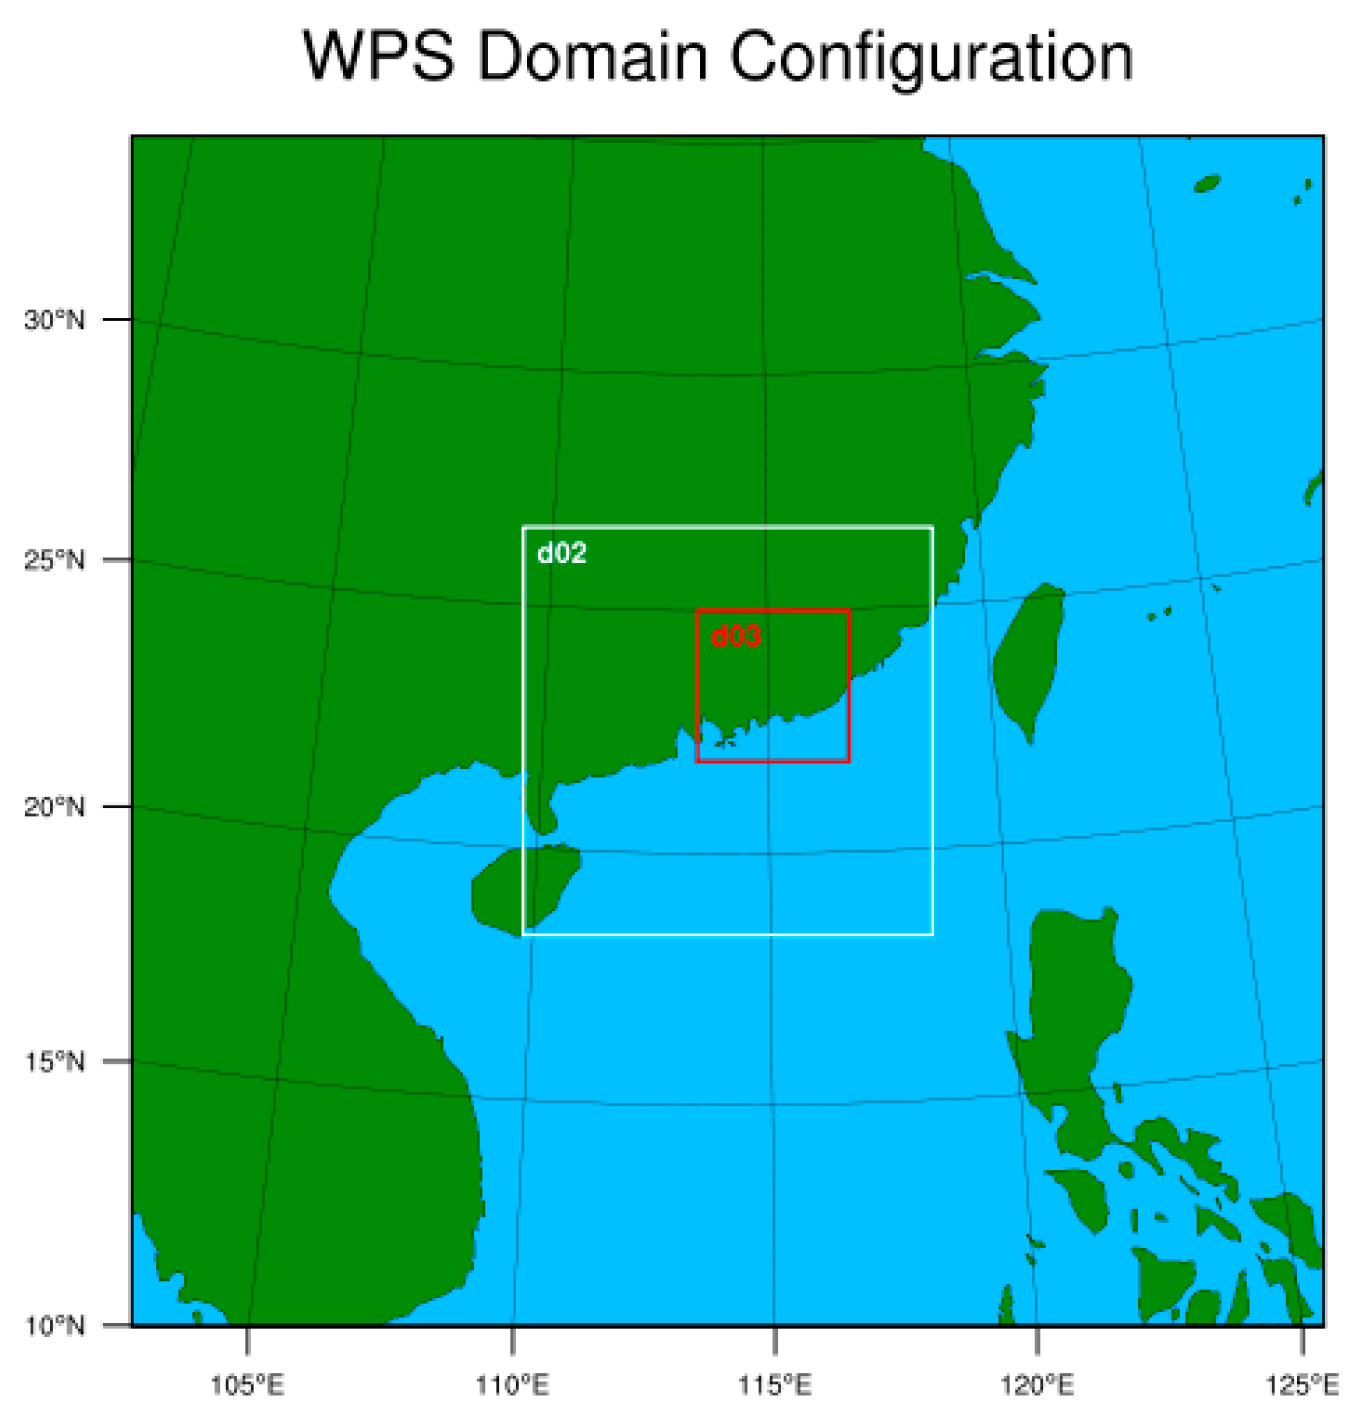
The triple nesting program was applied for computation of the typhoon wind field of WRF mode. The horizontal resolution was set 13.5 km, 4.5 km and 1.5 km, respectively. The latitude and longitude coordinates of the center of the simulation area were 114.1° E, 22.5° N. The spacing of the outermost grid D01 was 13.5 km and the number of grids was 211 × 211. The grid spacing of the second layer D02 was 4.5 km and the number of grids was 217 × 217. The third layer mesh spacing D03 in the inner layer was 1.5 km and the number of grids was 241 × 241. The map projection applied the Lambert program [5]. In the vertical direction, it is divided into 37 layers, with upper sparse layer and lower dense layer, among which the lower 1000 m is divided into 19 layers. The simulation domain is shown in Figure 2.

2.2. Selection of the Parameterization Scheme

Generally, the hub height of wind turbines is lower than 150 m and at the lower part of the boundary layer thickness, which is significantly affected by the flow quality, humidity, heat transfer and other parameters in the boundary layer [25,26,27]. Therefore, the setting of parametric physics scheme has a direct impact on the boundary layer simulation accuracy of typhoon fields. The parameter settings of each physical scheme of the WRF mode in this paper are shown in Table 1.

2.3. Validity Verification and Results Analysis

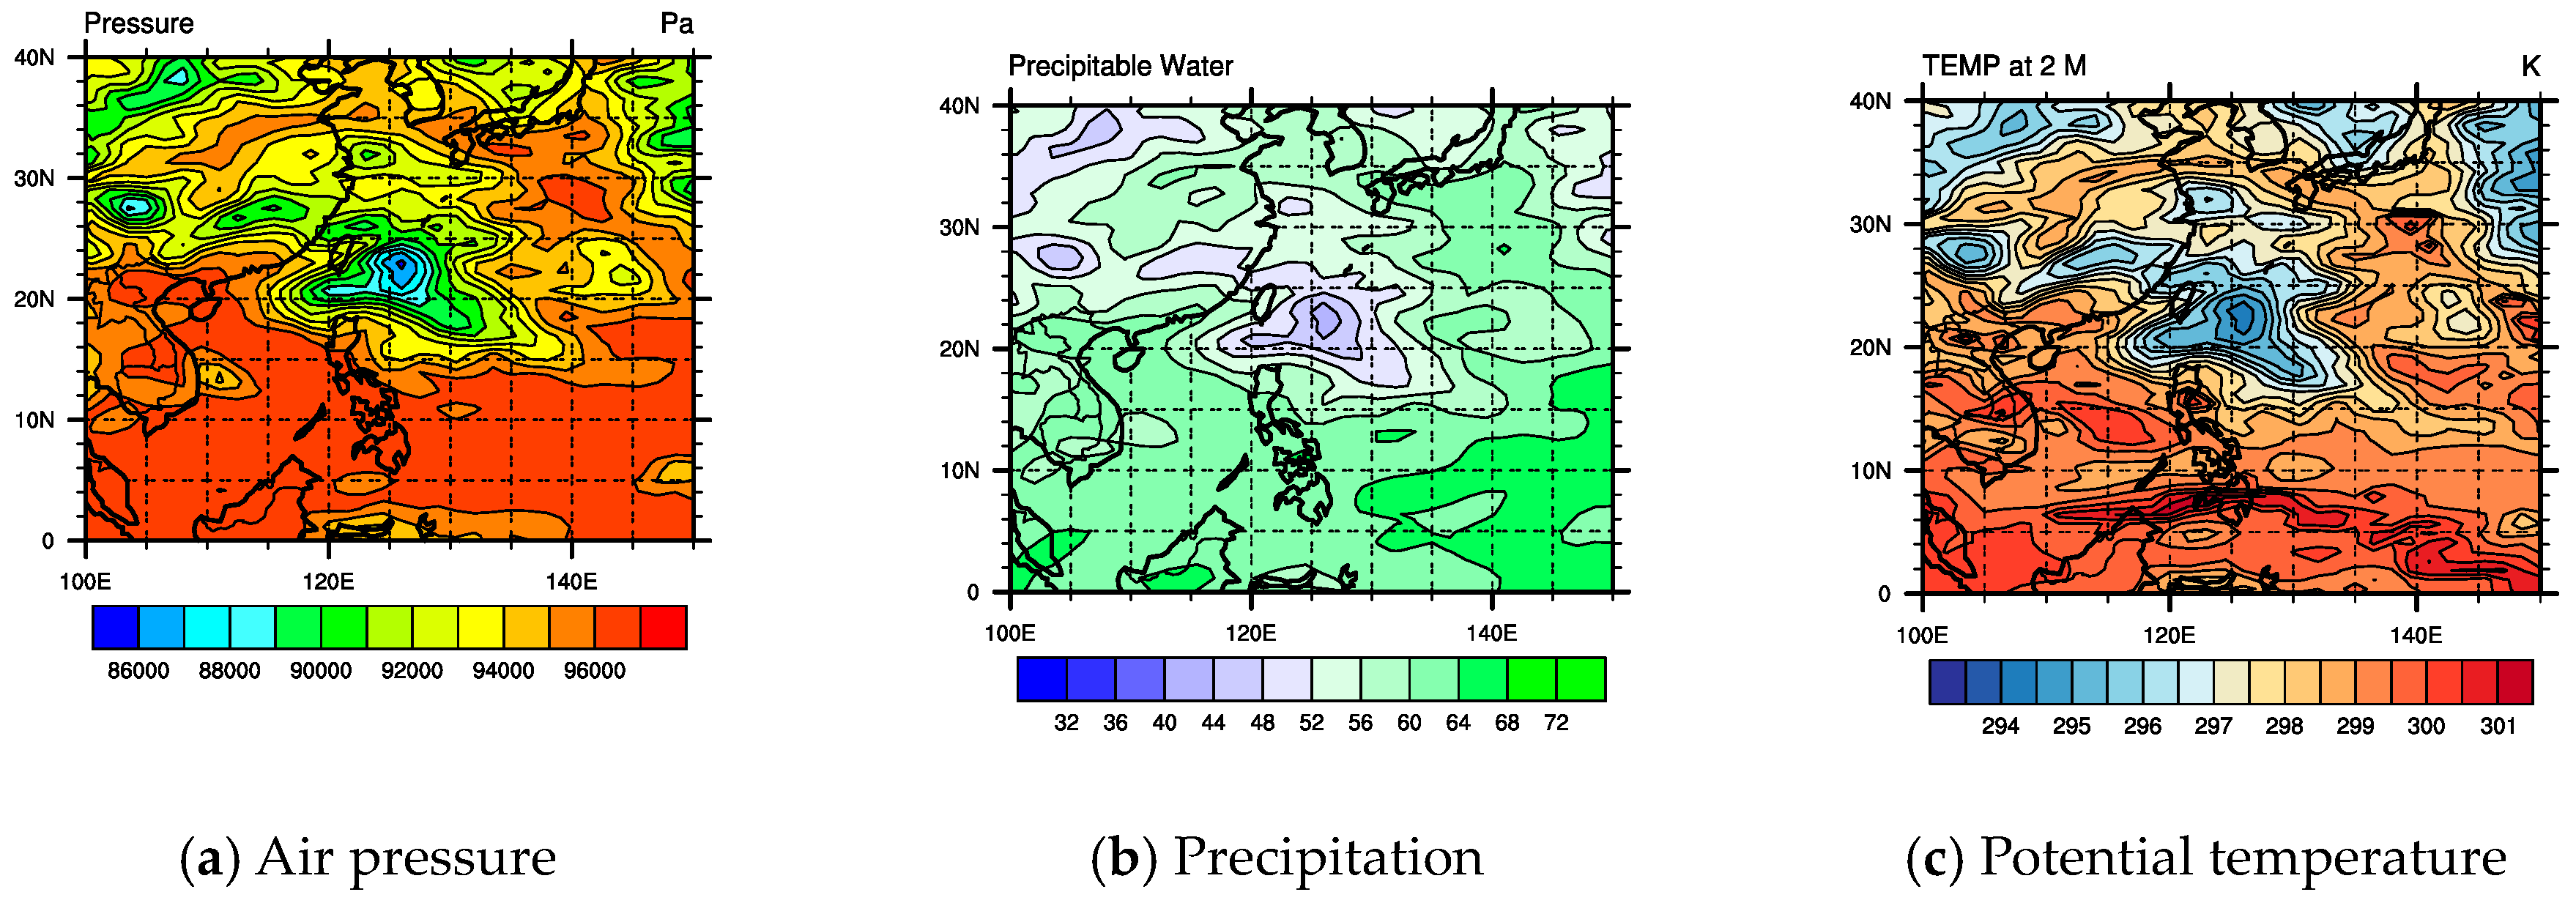
Air pressure, precipitation and temperature nephograms after the second landing of typhoon “Nuri” are shown in Figure 3. It can be seen from the figure that: (1) the typhoon center was a low-pressure center. After the landing of the typhoon, the underlying surface of the land was coarser than that of the ocean, which led to its heat source being cut off. The updraft was weakened and the surrounding airflow continued to converge towards the center of the typhoon. The simulation results were compared with measured results of the typhoon website of National Meteorological Center of CMA, finding a high agreement in the air pressure distribution. (2) Cloud system precipitation near the typhoon was long-term convective precipitation, and the rainfall in this region was large and related to typhoon intensity and center distance. The Noah road progress program could better simulate the surface flux and airflow convergence field. (3) Affected by the downward transfer of heat from the upper atmosphere, the MYJ boundary layer scheme was used to calculate the turbulent pulsation flux of heat and momentum in the boundary layer in this region with high accuracy.
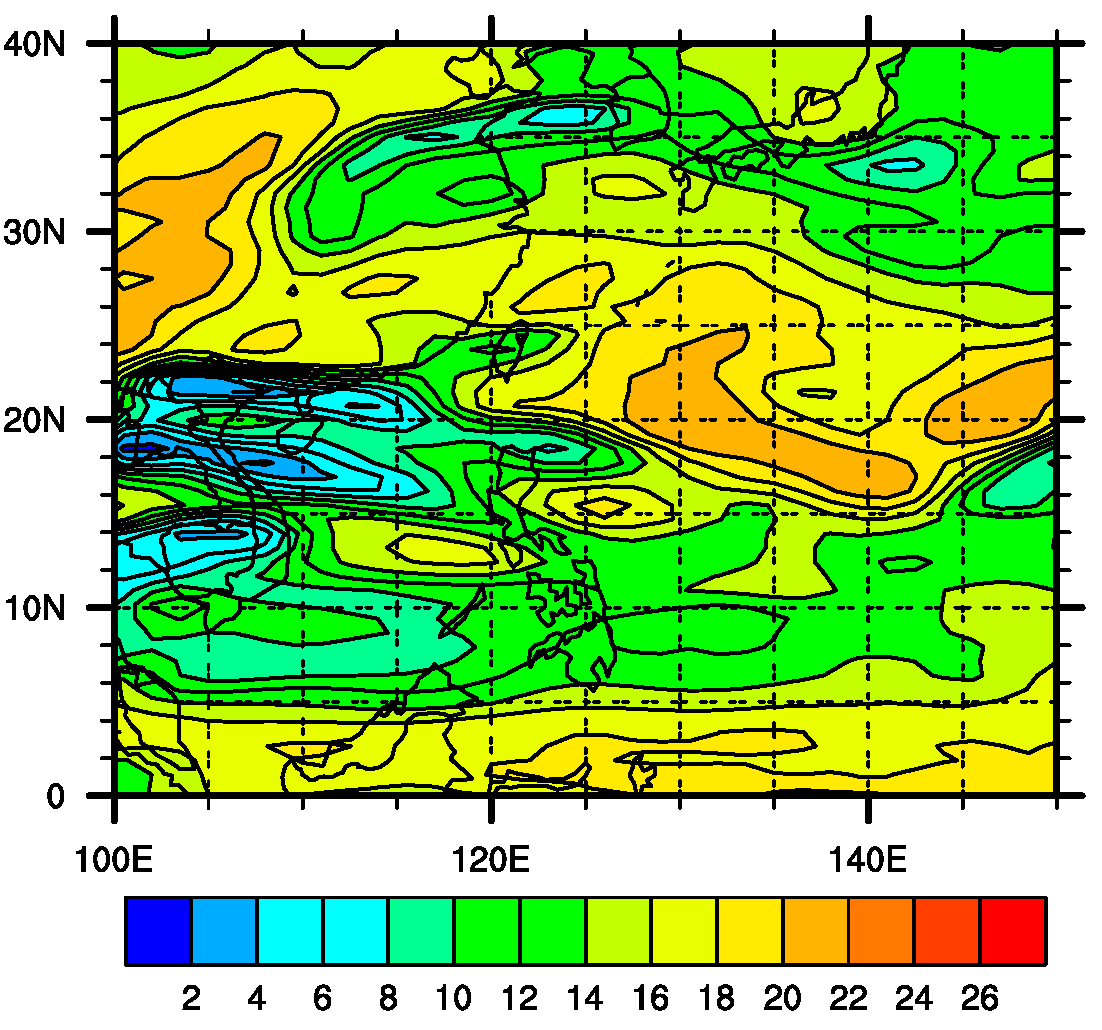
By comparison with Figure 4, we can see that there’s no strong convection and a partial northeaster before the landing of the typhoon. However, the wind direction of the typhoon turned into a southeaster gradually at the landing point of the typhoon. After landing, the airflow continues to converge towards the center of the typhoon, and the wind velocity streamlines do not show a regular trend. Nevertheless, it gradually turned into a partial northeaster. The abovementioned wind speed streamlines agreed highly with the actual development trend of the typhoon path.
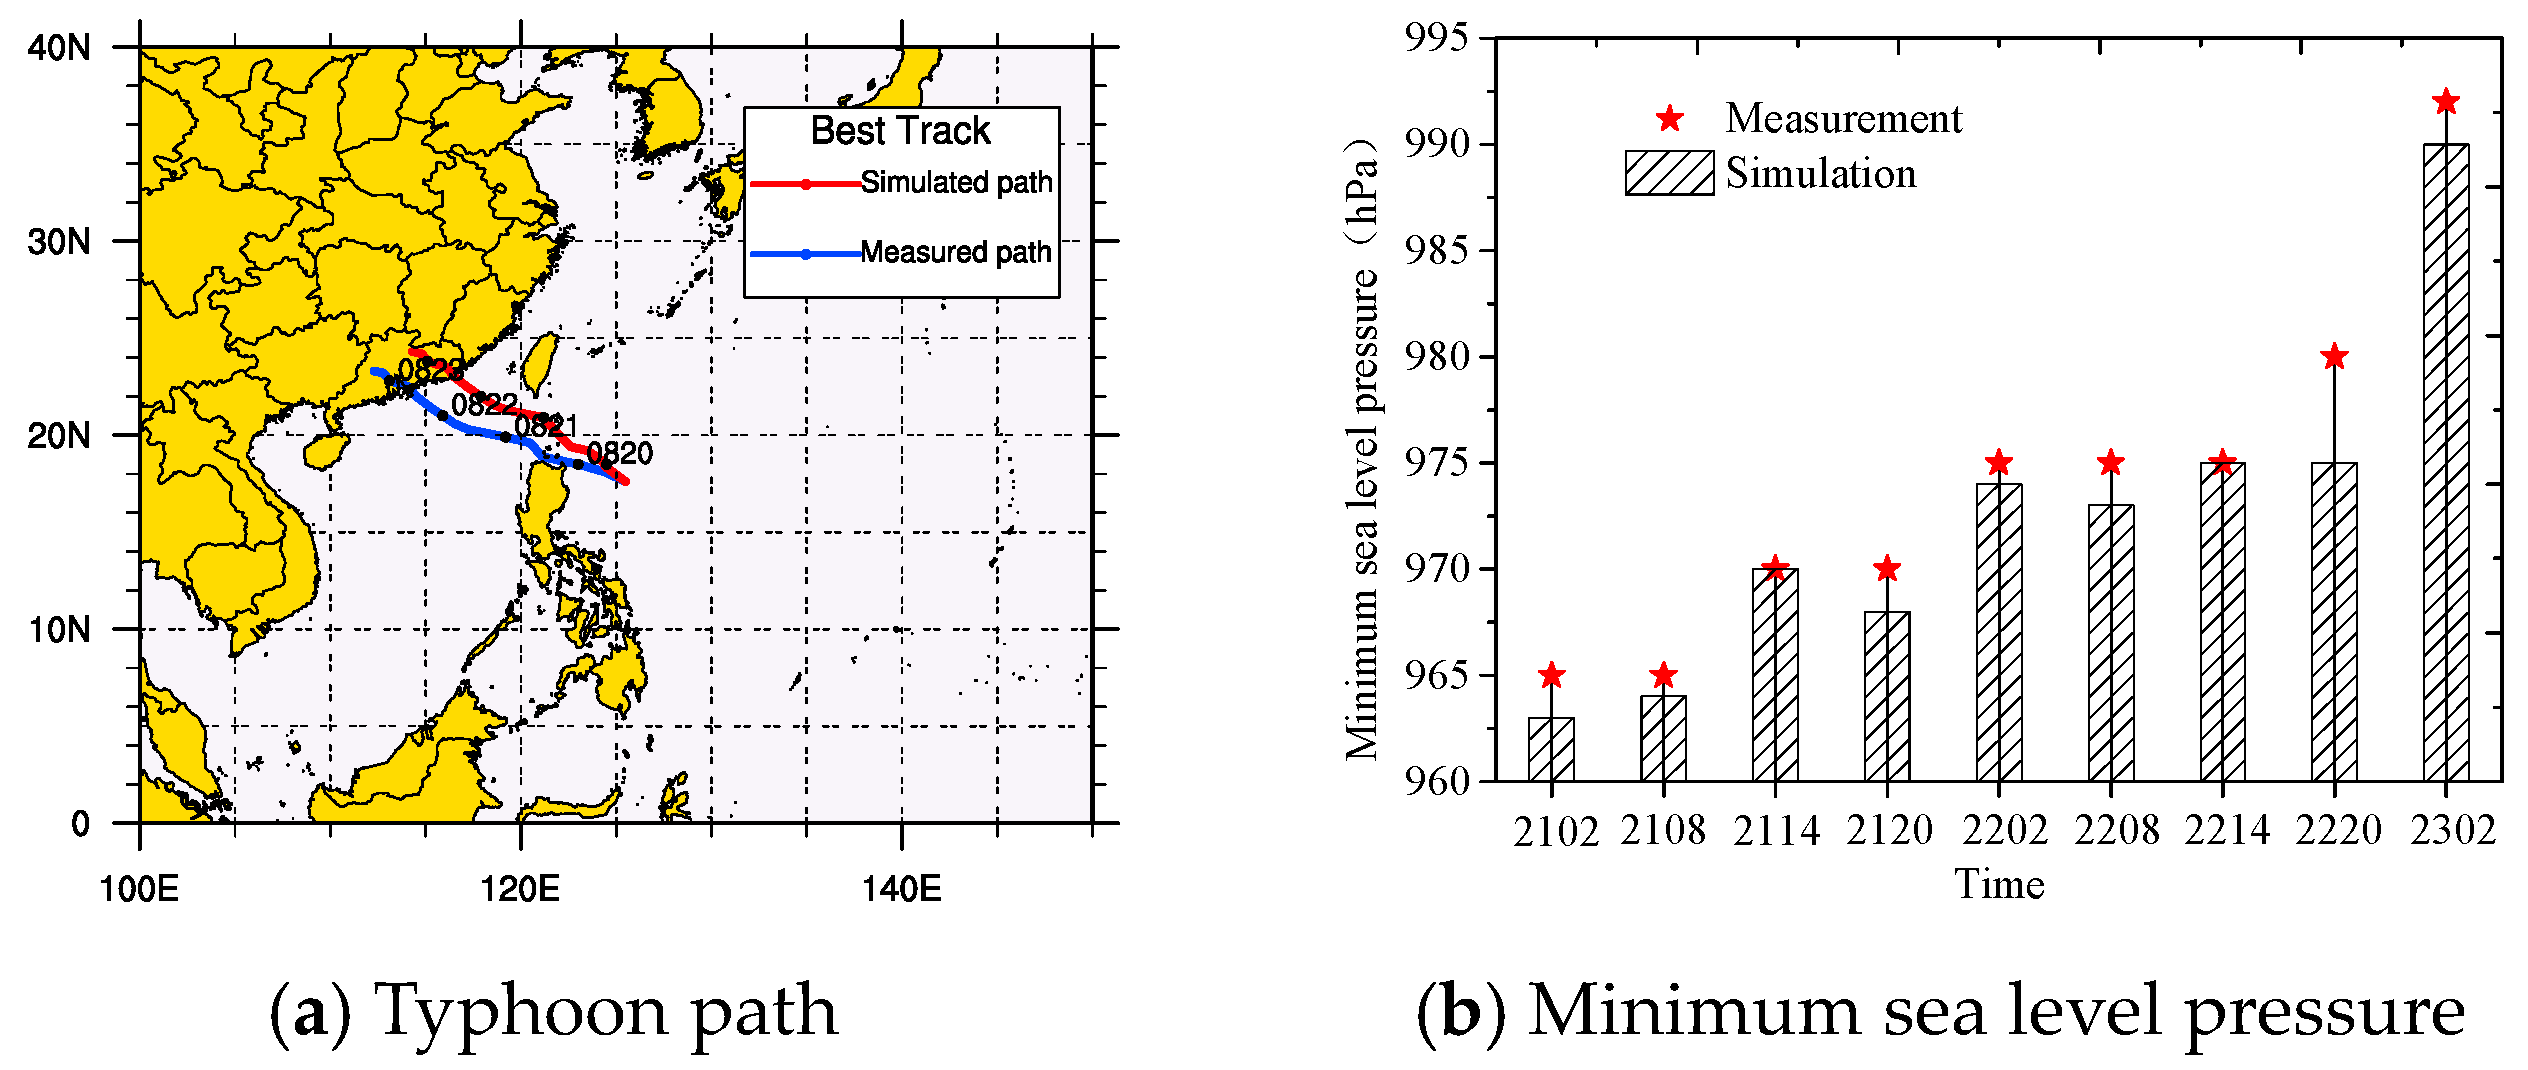
The simulated path was shown by the coordinates of the minimum sea level pressure which were output by the mode every 6 hours in Figure 5 and Figure 6. The blue line was the measured path and the red line was the simulated path. According to the observations: (1) the invasion of clouds around the typhoon increased the wind speed, which increased continuously as the typhoon closed. The the wind speed was higher closer to the center of the typhoon. (2) Typhoon “Nuri” generally moved toward the northwest. There’s a certain deviation between the simulated path and measured path, but the simulated typhoon path was consistent with the measured one. (3) The evolution of the typhoon intensity was mainly characterized by the lowest sea level pressure. In the simulation period, typhoon “Nuri” was still in a very mature stage and the minimum sea level pressure was mainly maintained at about 970 hPa. It was slightly lower than the measured result in the late simulation stage. Moreover, the simulated typhoon intensity and variation trend were similar to the measured results.

3. Micro-Scale CFD Numerical Simulation

3.1. Brief Introduction to the Wind Turbine Model

This paper mainly studies the aerodynamic performance and wind-induced response of a wind turbine system under eight different shutdown positions after the wind turbine stops during atyphoon. In addition, in order to exclude the influence of other interferences and ensure that there is only one variable, the influence of yaw angle and pitch angle under typhoon conditions will not be considered. The chosen 5 MW wind turbine tower was 124 m high, with an upper diameter of 3.0 m and a bottom diameter of 3.5 m. The tower body was a structure of varying length and thickness. The upper wall thickness was 0.06 m and the bottom wall thickness was 0.15 m. The nacelle dimension was 18 m (length) × 6 m (width) × 6 m (height). The cut-out wind speed of the wind wheel was 25 m/s. The blades were distributed uniformly along the circumferential direction at an angle of 120°. The main design parameters of blade and the whole machine are listed in Table 2. Tower, cabin and blade models were built successively, and then the 3D solid model of the large-scale wind turbine was formed through Boolean operations.
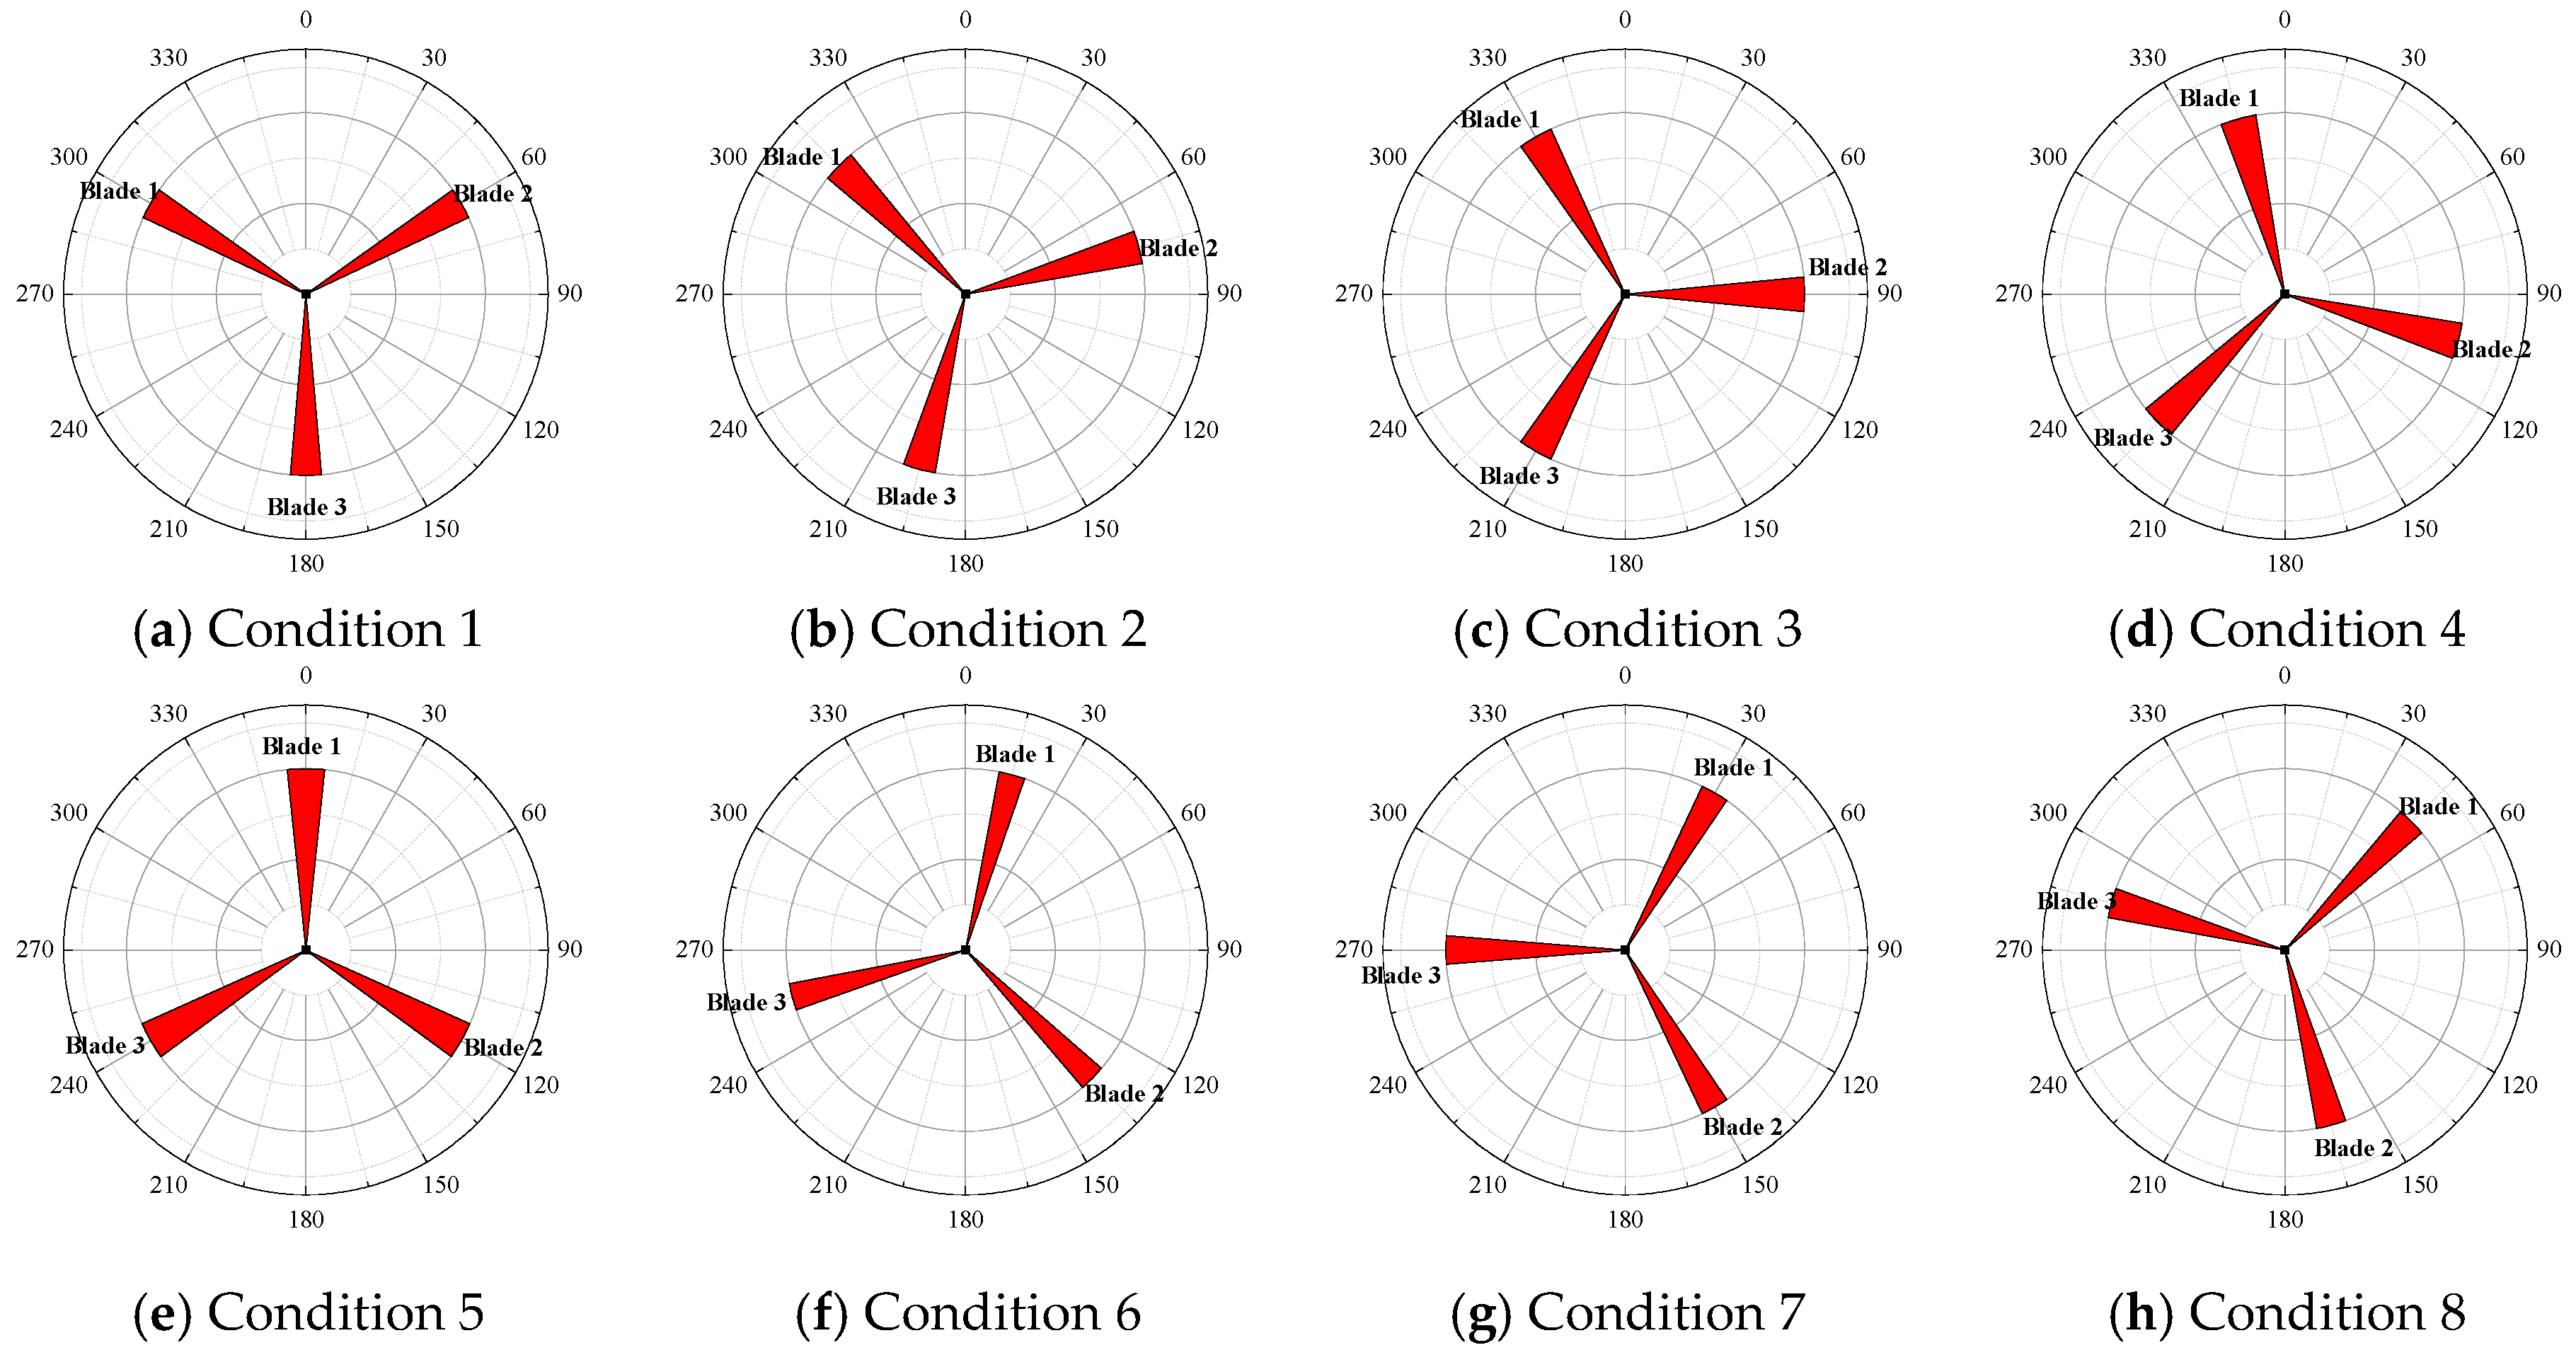
According to the relative position between blade and tower body, considering the rotation periodicity of the 3-blade system, the situation of complete overlapping between blade and the tower body was defined as Condition 1 and the remaining conditions were defined every 15° of clockwise rotation, forming eight conditions. In addition, the blade which was overlapped with the tower body in Condition 1 was denoted as Blade 3, and the remaining blades making a clockwise rotation were Blade 1 and Blade 2. The single-period rotation directions of the wind turbine blades under different conditions are shown in Figure 7.

3.2. Computational Domain and Meshing

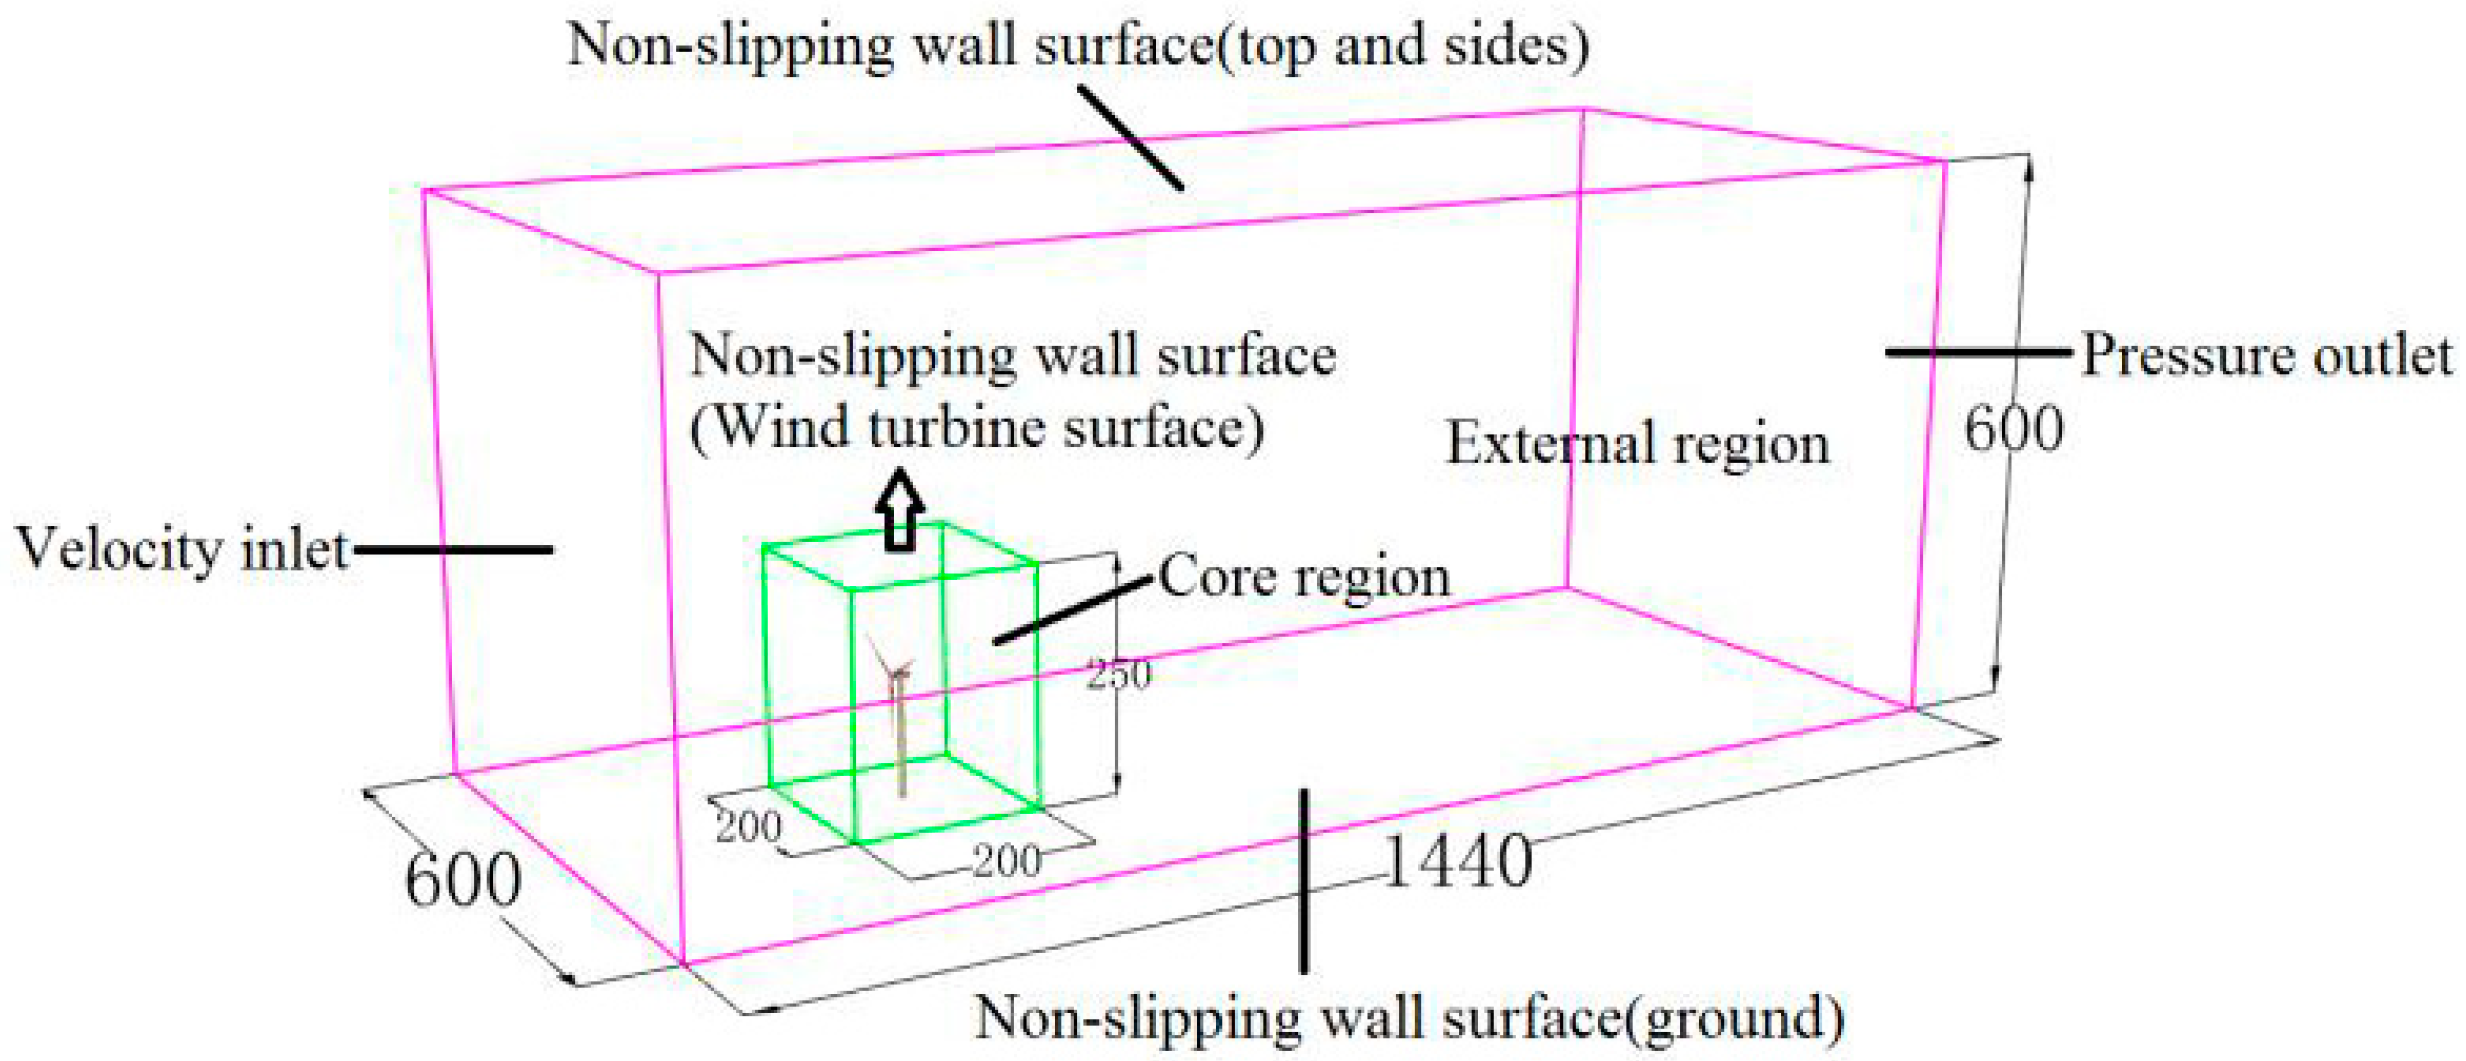
In order to ensure the full development of flows, the calculation domain was set as 12D × 5D × 5D (flow direction X × spanwise Y × vertical Z, and D is the diameter of wind wheel). The wind turbine was located 3D away from the entrance of the computing domain. Because the blade surface is twisted and complex, the mixed mesh was adopted. In addition, the whole computing domain was divided into internal and external parts: the core area adopted tetrahedral grid, and the local grid around the wind turbine was encrypted; the peripheral area adopted high-quality hexahedral grid, with a total number of 13.4 million. The specific division of the computing domain and grid are shown in Figure 8.

3.3. Micro-Scale Typhoon Simulation Technology

3.3.1. Micro-Scale Typhoon Simulation

According to the analysis, the typhoon wind speed distribution close to the near-ground surface was relatively smooth at different moments, while the wind speed distribution at high altitude was relatively disordered. The typhoon wind speed at 20:00 on 22nd August was significantly lower than other moments. The reason was that the typhoon had landed at this moment and the underlying surface changed from the ocean surface to land surface, thus dissipating the energy gradually.
According Figure 9, where the near surface wind speed in the simulated central area and the typhoon near surface wind speed fitting curve obtained by fitting according to the nonlinear least square principle are shown, it can be observed that the near ground typhoon field is well fitted (simulation accuracy was 94.78%). The typhoon wind speed at the height of 10 m was relatively high and it increased slowly with the altitude. At the same time, in order to qualitatively and quantitatively compare the difference between the benign wind and the typhoon wind field, the typhoon field and the normal wind field have the same wind speed when the Class A geomorphologic gradient height is 300 m in the definition specification (GB50009-2012) [28], and the near-ground typhoon profile is used as the wind speed boundary conditions in the subsequent micro-scale wind field numerical simulation.

3.3.2. Large Eddy Simulation (LES) Governing Equation

In the study of structural wind resistance, fluid was considered as viscous incompressible and the transient N-S equation was processed by space averaging, thus getting the LES governing equation [29,30]:
μ i ¯ x i = 0
μ i ¯ t + ( μ i ¯ μ j ¯ ) x j = 1 ρ p ¯ x i + v 2 μ i ¯ x j x j τ i j x j
where ρ is the air density. t is time. v is the kinematic coefficient of air viscosity. μ i ¯ and μ j ¯ are speeds along three directions after smoothing (i = 1, 2, 3 and j = 1, 2, 3). x i and x j are coordinate vectors along three directions in the space. p ¯ is the pressure after filtering. τ i j is the open term in the N-S equation after space averaging, that is, the subgrid-scale stress:
τ i j = μ i μ i ¯ μ i ¯ μ j ¯
According to the subgrid model based on eddy viscosity hypothesis proposed by Smagorinsky and Boussinesq hypothesis, the subgrid stress can be expressed as:
τ i j 1 3 τ i j δ i j = 2 μ t S i j ¯ = μ t ( μ i ¯ x j + μ j ¯ x i )
where S i j ¯ was the solvable scale strain rate tensor. τ k k was the isotropic part of subgrid-scale stress, including the stress term after smoothing. δ i j was the Kronecker delta function. μ t was the subgrid-scale turbulence eddy viscosity, which generally applied the Smagorinsky hypothesis:
μ t = ( C s Δ ) 2 | S ¯ |
where CS is the Smagorinsky constant. It generally ranges from 0.1~0.23 and it is determined as 0.1 in this paper. The strain rate tensor is | S ¯ | = 2 S i j S i j . Δ is the spatial grid scale, Δ = ( Δ x Δ y Δ z ) 1 / 3 , where Δ x , Δ y and Δ z are grid sizes along the x, y and z directions. This is the standard Smagorinsky subgrid-scale model which can simulate micro-turbulence flow accurately. Considering the high-rise special structure (wind turbine system) with high accuracy of simulation, it is necessary to use the above model to carry out ultra-high precision numerical simulation in order to achieve better results. Based on the abovementioned subgrid-scale model and fitted typhoon profile, the User Defined Function file was used to integrate the model into the Fluent software (Figure 10) to realize LES of the wind turbine system under meso- and micro-scale nesting conditions and different stop positions.

3.4. Boundary Conditions and Parameter Setting

The inlet and outlet of the calculation domain were the velocity inlet and pressure boundary outlet, respectively. The top and side surfaces applied the symmetry boundaries of free slip wall, while the ground and structural surface used the non-slip wall. The fluctuating wind field was defined by UDF. Meanwhile, the exponential wind profile and turbulence profile of class A geomorphic atmospheric boundary layer were set. The ground roughness in the wind profile was set 0.076. The theoretical formula of the fluctuating wind load generation based on Fluent [31] was:
E ( k ) = m = k 0 k m a x E m ( k ) = m = 1 k m a x E m ( k ) δ ( k k m ) = m = 1 k m a x ( 3 2 v 2 m ) δ ( k k m )
u m , i = n = 1 N [ p 1 m , n c o s ( k m , n j x j + ω m , n t ) + q 1 m , n s i n ( k m , n j x j + ω m , n t ) ]
u ( x , t ) = m = k 0 k m a x n = 1 N [ p m , n c o s ( k m , n j ˜ x ˜ + ω m , n t ) + q m . n s i n ( k m , n j ˜ x ˜ + ω m , n t ) ]
where: p m , n = ξ × k m , n | ξ × k m , n | a 4 E ( k m ) N ; q m , n = ξ × k m , n | ξ × k m , n | ( 1 a ) 4 E ( k m ) N ; x ˜ = x L s ; k ˜ m , n = k m , n k 0 ; | k m , n | = k m ; ξ N ( 0 , 1 ) ; f m = k m U a v g . x is the coordinate vector, t is time and km is the wave number. ξ N ( 0 , 1 ) . Is is the turbulence integral scale, used to adjust spatial correlation. a is evenly distributed between 0 and 1. In this calculation case, kmax = 500 and N = 100.
3D single-precision and a separate solver was adopted for numerical calculation, and incompressible flow field was used for air and the wind field. The boundary conditions of calculation domain were set as shown in Figure 11. Based on the SIMPLEC algorithm of Large Eddy Simulation, the pressure velocity nesting method had good convergence and was suitable for large eddy simulation calculation with small time step. Grid tilt correction was set in the calculation process to improve the mixed grid calculation effect, and the computational residual of the N-S equation was set as 1 × 10⁻⁶.

4. Aerodynamic Performance Analysis

4.1. Average Wind Pressure Coefficient

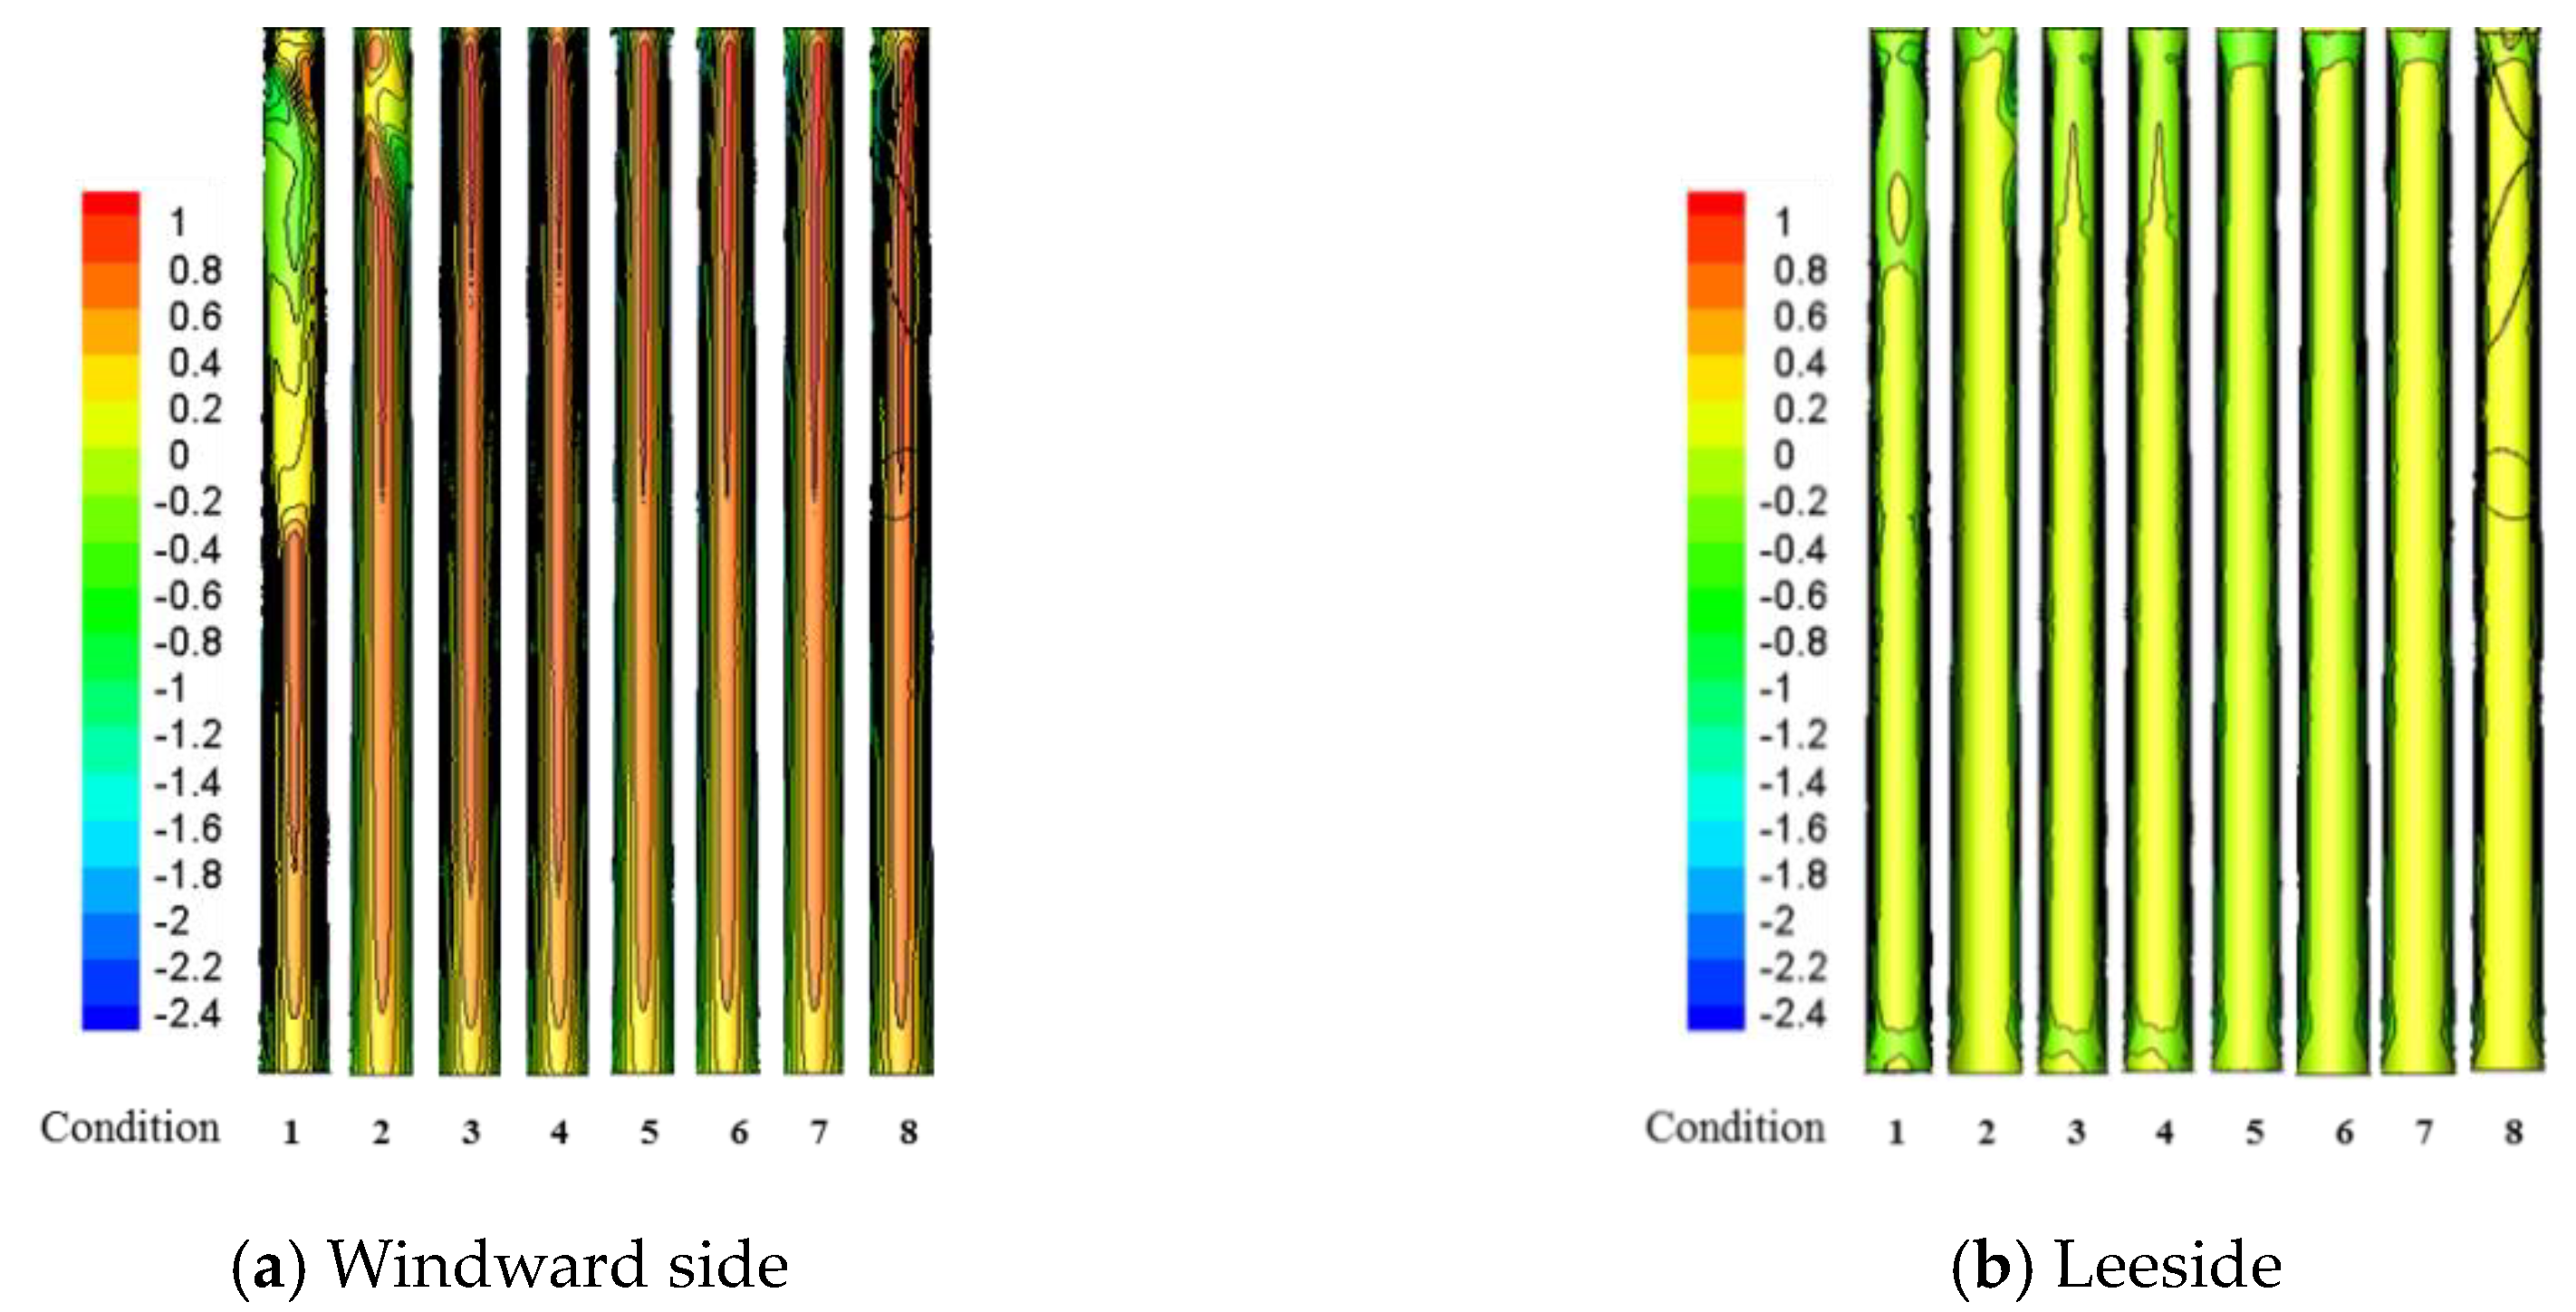
In Figure 12, it is shown that: (1) the blade disturbance to the tower body was dominated by the proximity effect. When the incoming blade overlapped with the tower body completely (Condition 1), a narrow long negative wind pressure coefficient zone was developed on the windward side, which covered an area of 0.5S (S = windward/leeside area of the tower body). The maximum negative pressure was -0.8. With the reduction of shielding area, the negative pressure zone shrank gradually. (2) Besides, a large negative pressure zone occurred on the leeside of tower body under Condition 1. This region shrank gradually with the weakening of the shielding effect.
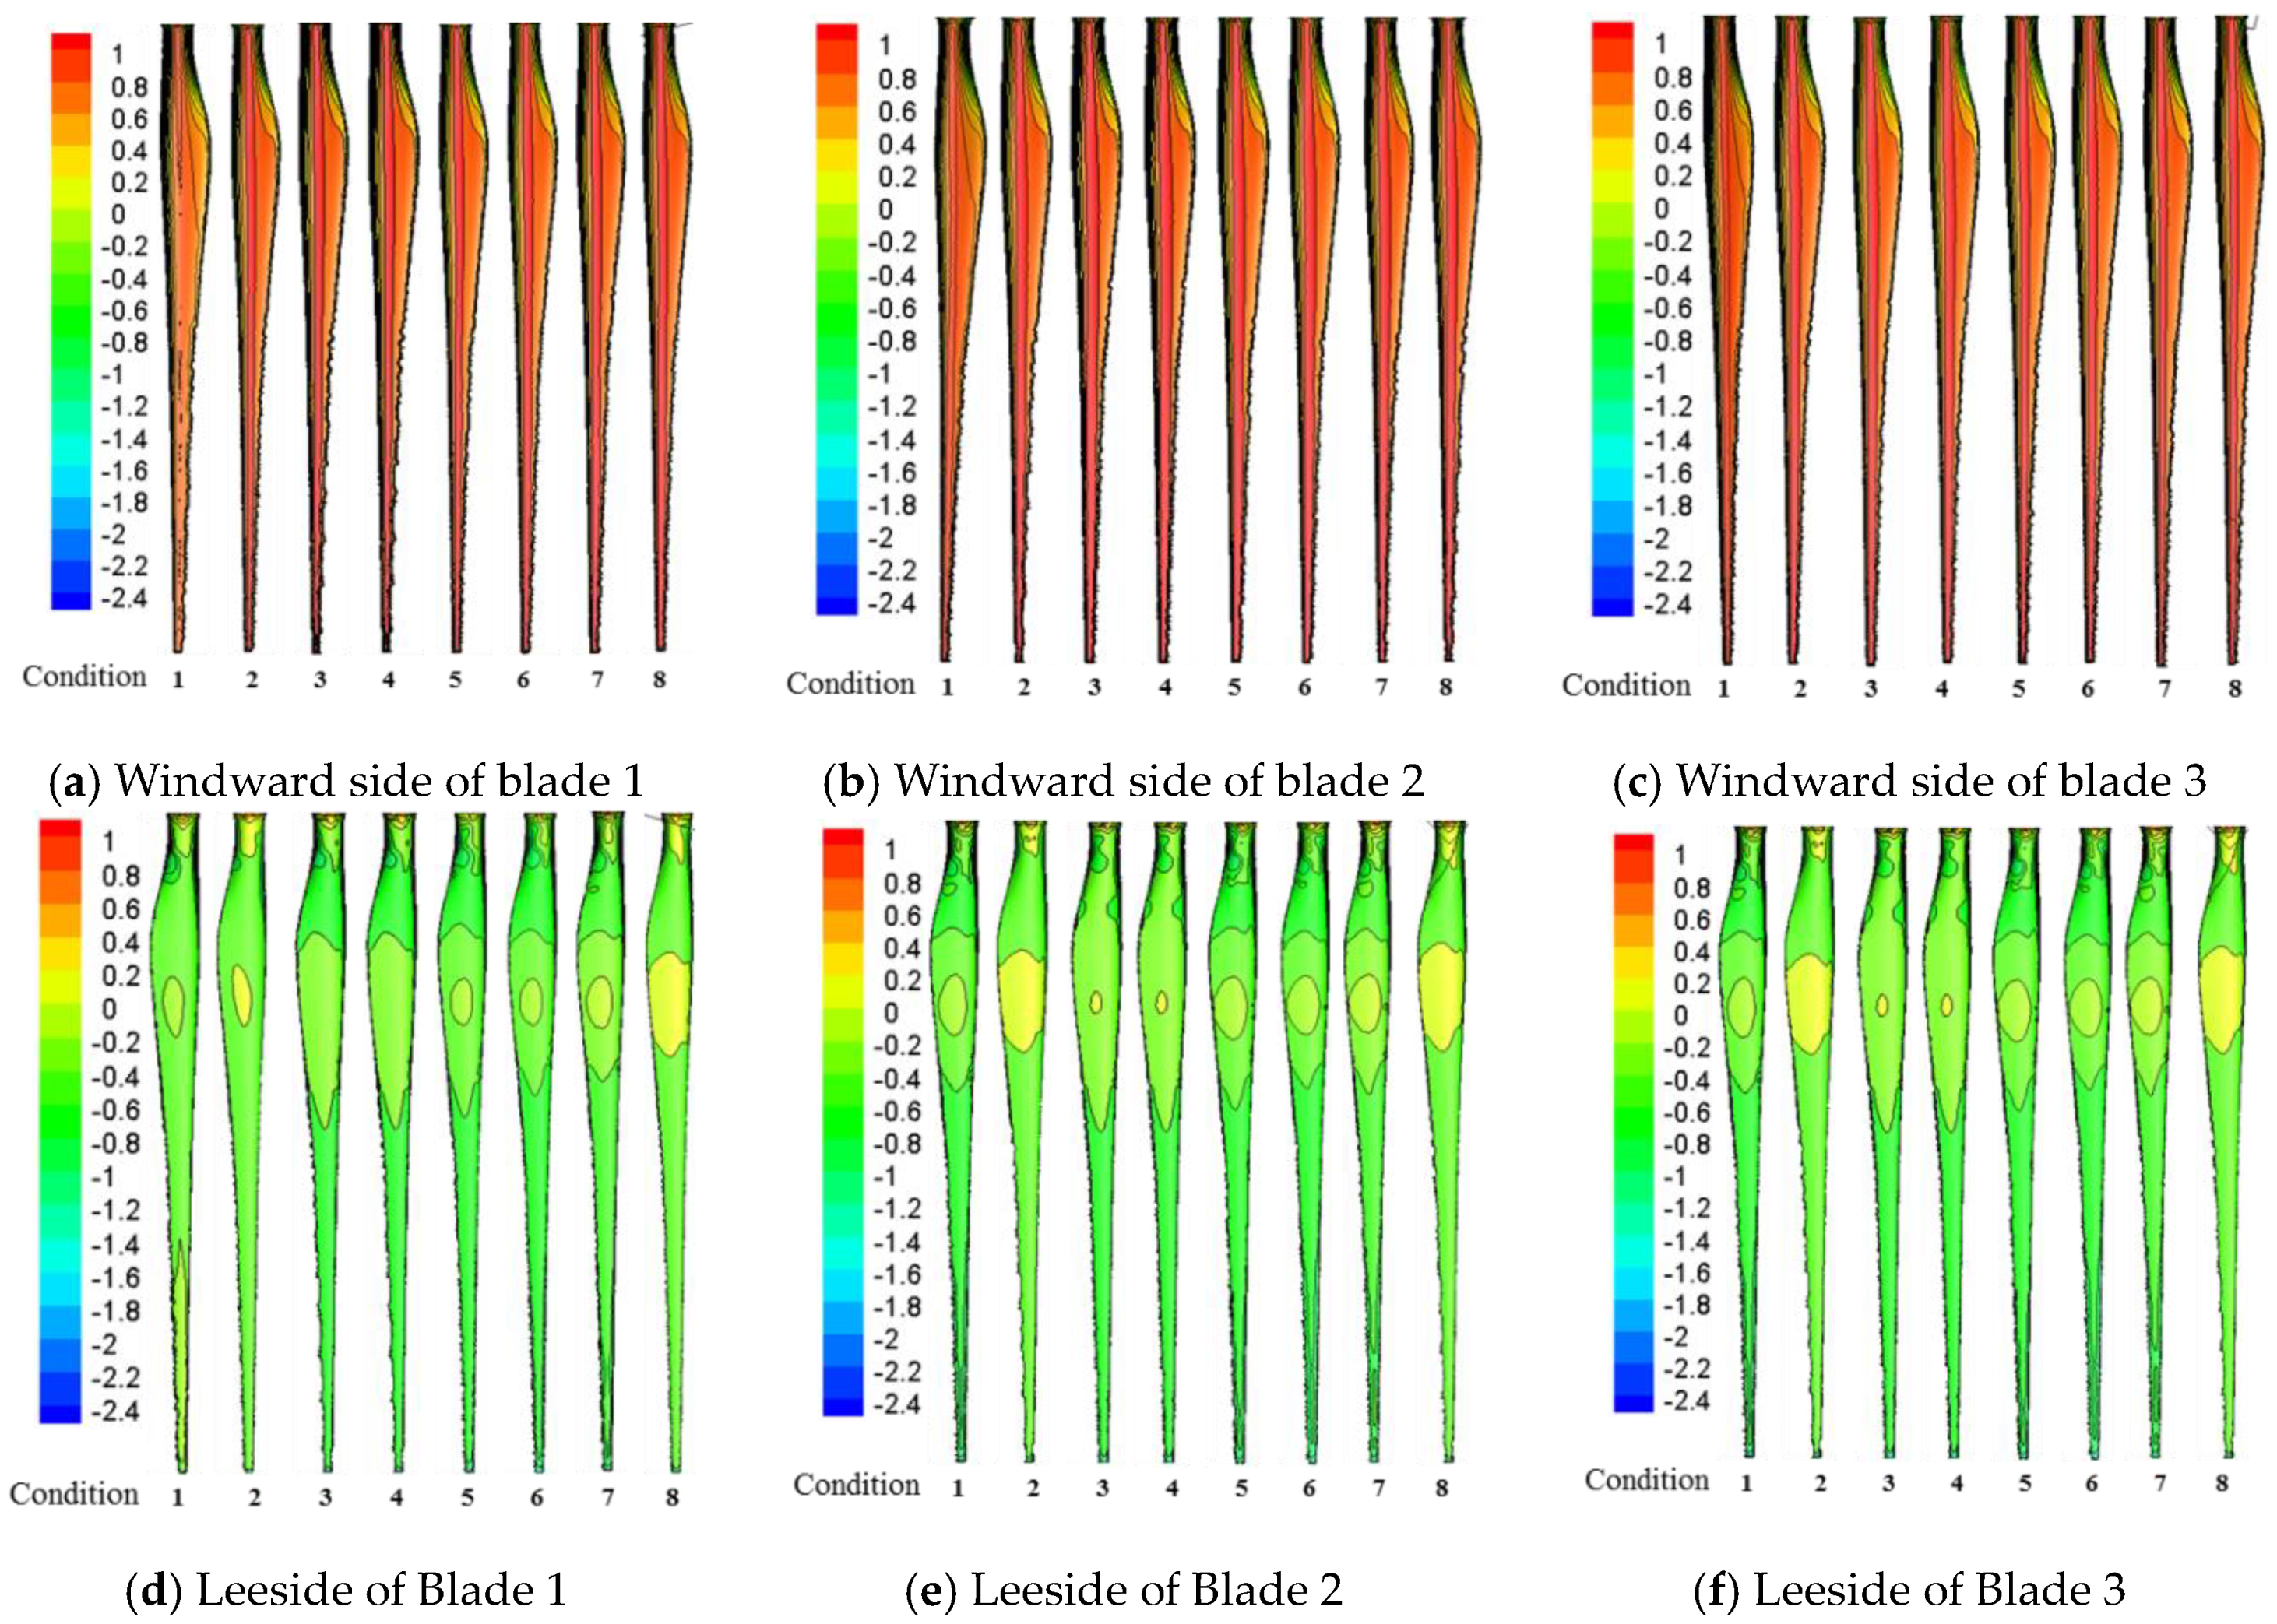
The contour map of wind pressure coefficients of three blades under eight conditions under typhoon loads is shown in Figure 13.
It shows that: (1) the height of Blade 3 increased gradually in the clockwise rotation, accompanied with gradual increase of positive pressure on the windward side of blade. This was because the wind speed underwent an exponential increase with the height and the wind pressure coefficient was relatively small at a relatively low position. A similar trend was observed in Blade 1 and Blade 2. (2) Regions with different reduction amplitudes of negative pressure were developed on the leeside of blades. Blade 3 which was close to the tower structure presented tendency changes. The negative pressure reduction region was expanded gradually with the increase of relative distance. (3) Under Condition 1, the absolute value of the wind pressure coefficient at root the Blade 3 on the windward side and at about 1/3 on the leeside along the span direction were 0.45 and 0.4, respectively. The wind pressure coefficients at these two positions were significantly higher than those under the remaining conditions. In addition, the absolute value of wind pressure coefficient decreased gradually with the narrowing of the shielding area. However, the wind pressure coefficients of Blade 1 and Blade 2 presented exponential changes with height. Blades shielded the tower body, and the tower blade also would disturb the blades.

4.2. Coefficient of Fluctuating Wind Pressure

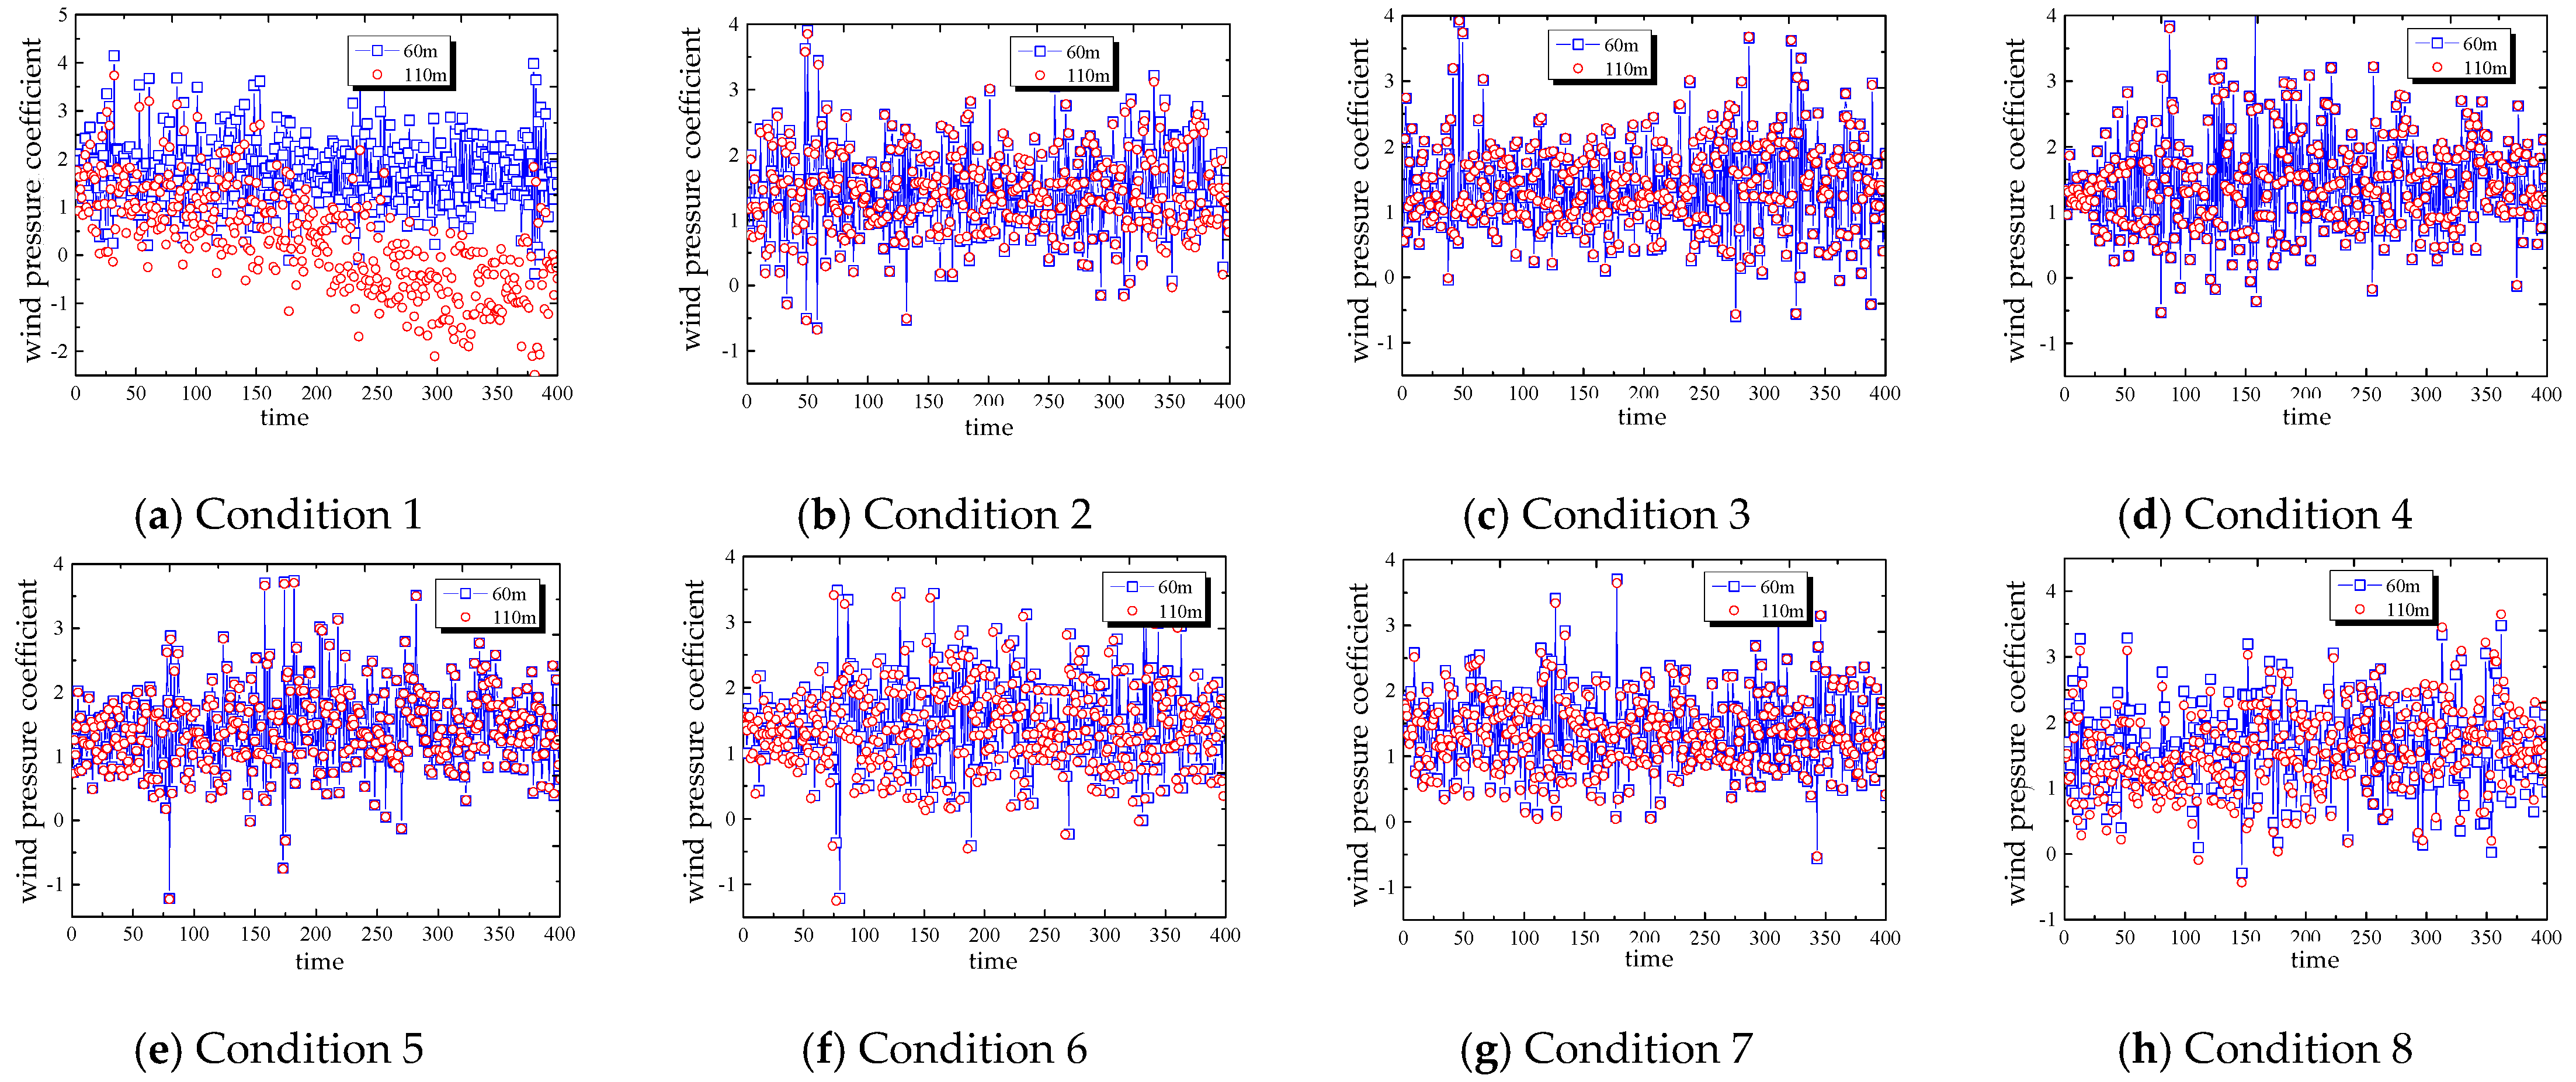
According to the relative position of tower body and blades, the tower body was divided into a non-disturbed zone (0–64 m) and a disturbed zone (64–124 m). The time-history curves of the wind pressure coefficient on the leeside at 60 m and 110 m height of the tower body are shown. Figure 14 shows that when the tower body was not shielded by blades, there’s a small disparity between the wind pressure coefficients at 60 m and 110 m. However, such difference increased when the blades began to shield the two zones of the tower body, reaching the peak under Condition 1. Later, the difference was narrowed with the reduction of shielding area.
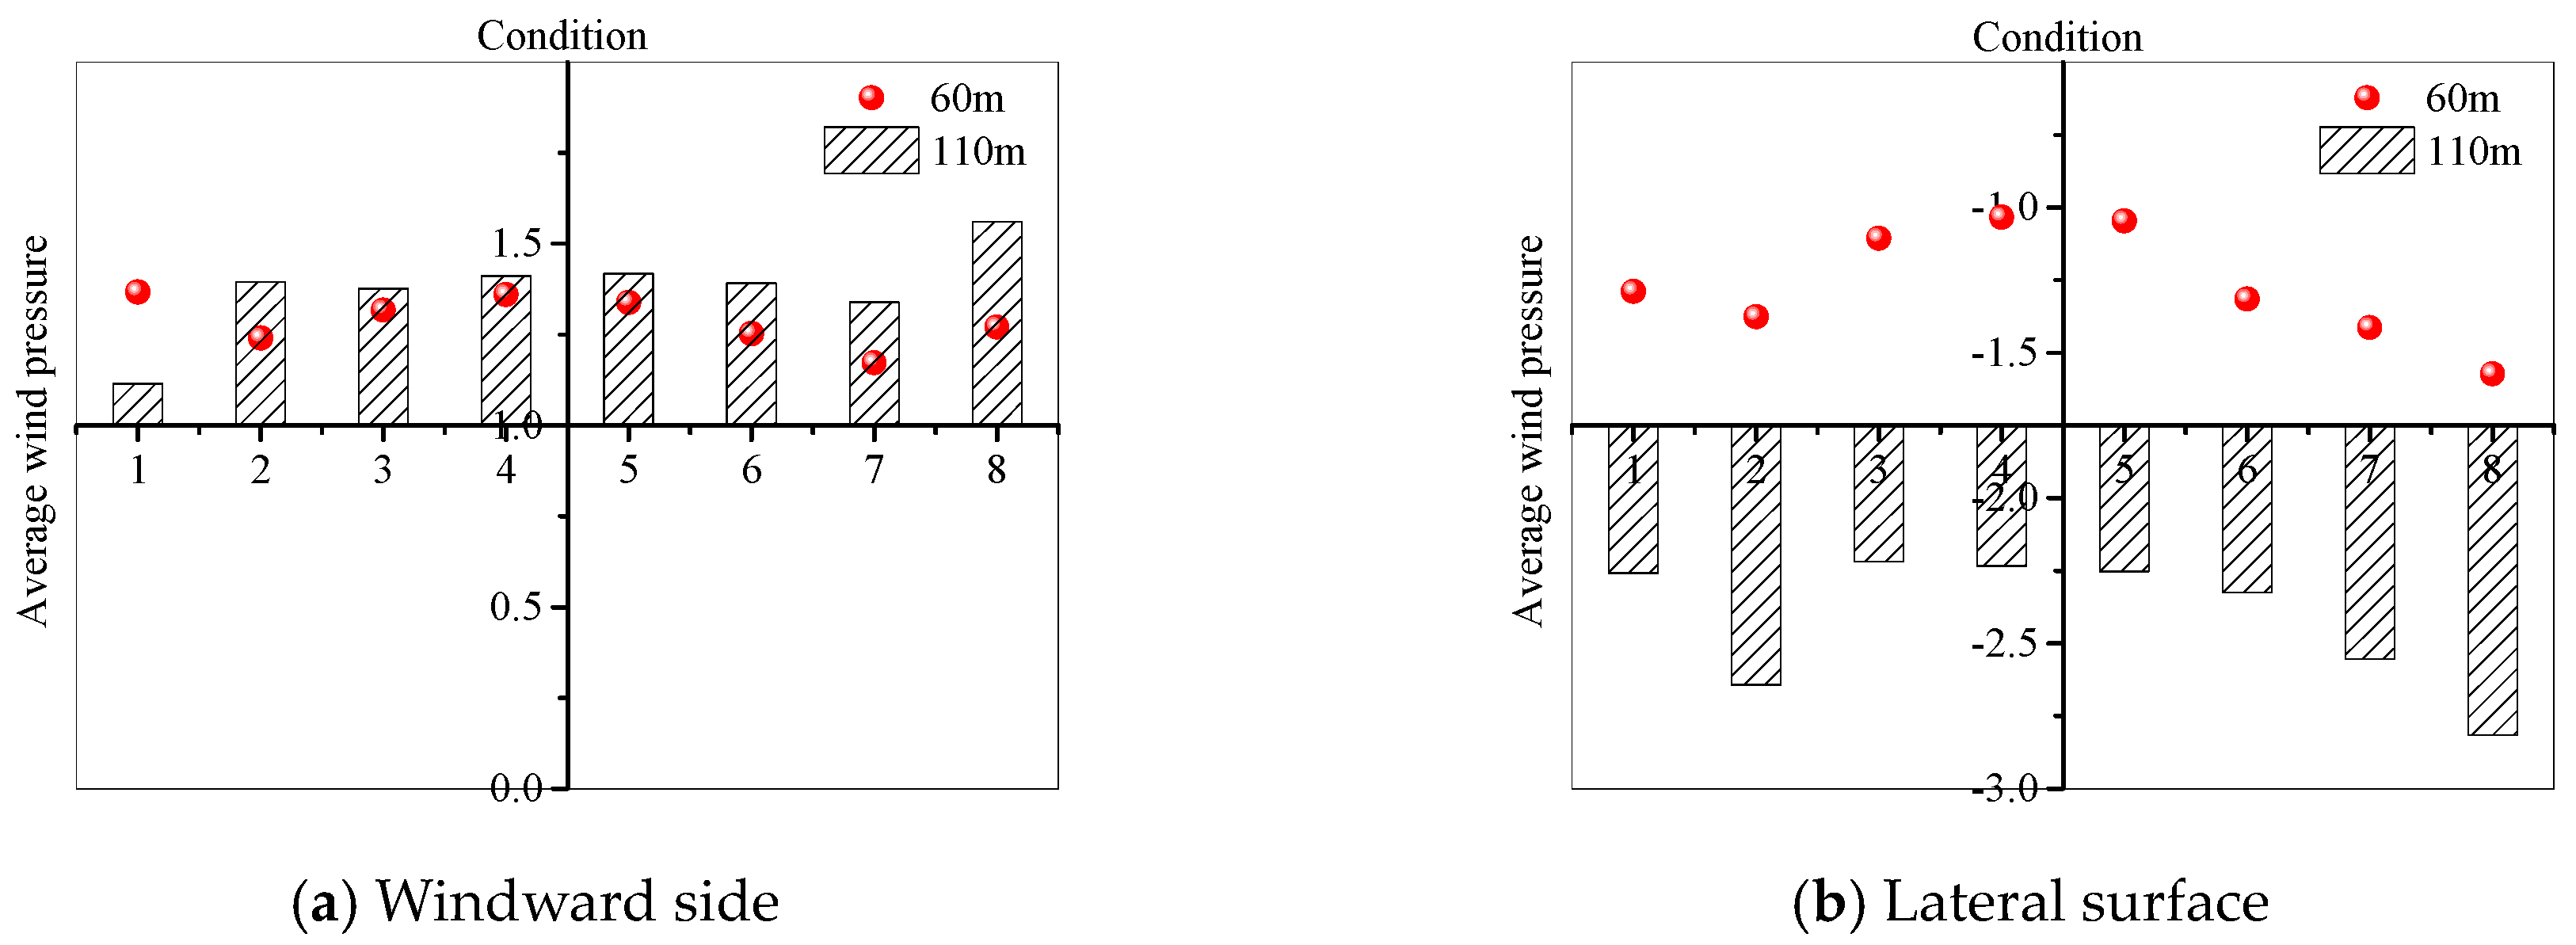
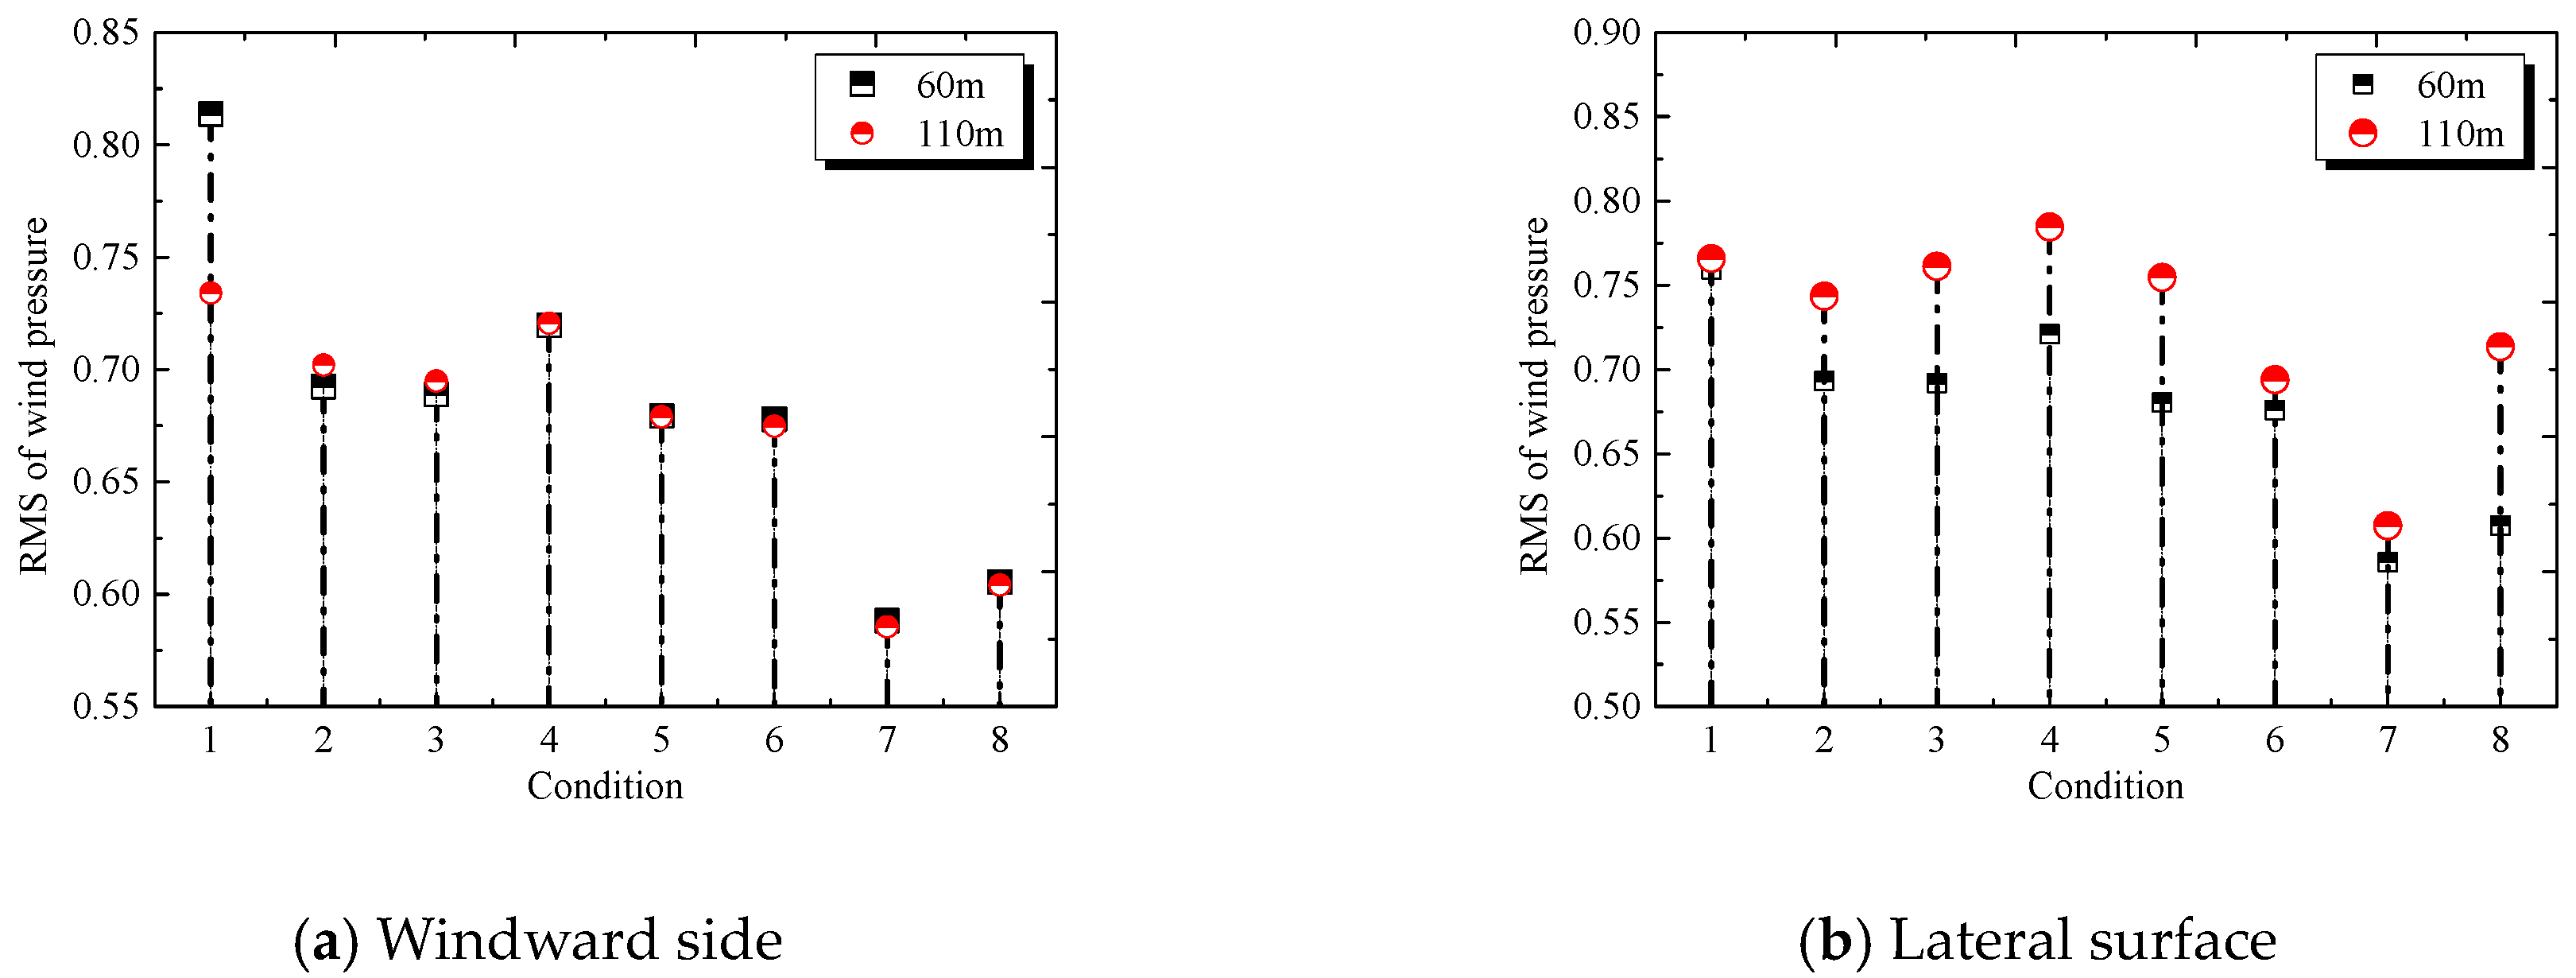
From the Figure 15 and Figure 16, It can be seen that:
(1)
The absolute value of the wind pressure coefficient in the disturbed zone of the windward side and lateral surface is significantly greater than the non-disturbed section. The mean wind pressure coefficient at 60 m height of the windward side in Condition 1 was higher than the numerical value at 110 m, indicating that blade shielding could influence the wind pressure coefficient of the tower body markedly. Additionally, the RMS of wind pressure on the windward side and lateral surface in the disturbed zone under no blade shielding effect was higher than that on the undisturbed zone.
(2)
The wind pressure coefficients on the windward side were similar at different zones of the tower body. However, there’s a great difference on the lateral surfaces. The difference when the lateral surface was not shielded by blades was significantly large than that under Condition 1. The average wind pressure coefficient and RMS of wind pressure under Condition 4 presented significant differences, with values of 1.20 and 0.06, respectively.
Extreme wind pressure is crucial to study the mechanical performance of the tower body and blade in the wind turbine system. The calculation formula (GB50009-2012) was:
C ^ p i = C ¯ p i ± g σ p i
where C ^ p i , C ¯ p i and σ p i are extreme, mean and RMS of wind pressure coefficient at the measuring point i. g is the peak factor at the measuring point i, which is determined 2.5 (GB50009-2012) in this paper.
Distributions of extreme wind pressures on the tower body and blade under different conditions are shown in Figure 17. The results demonstrate that: (1) the extreme wind pressure on the windward side was similar at different heights, but it was significantly different on the lateral surface. The split inflow at the blade disturbed stresses on the tower body during the falling process, thus influencing extreme wind pressure distribution in the disturbed zone significantly. This phenomenon was weakened gradually with the narrowing of the shielded area. (2) In the single rotation period of blades, the extreme wind pressure was positively correlated with height. The extreme wind pressure of Blade 1 and Blade 3 increased firstly and then decreased, whereas the extreme wind pressure of Blade 2 presented the opposite variation law. The extreme wind pressure of Blade 3 reached the maximum (−3.94) under Condition 1. To sum up, the stop position of blades could affect the extreme wind load significantly. It is thus suggested to take the most unfavorable stop position into account during the design of typhoon resistant wind towers.
By comparing previous research results under normal wind [22,23], the maximum absolute value (2.82) of average wind pressure under typhoon conditions was achieved at the lateral surface at the tower top, which was 0.27 lower than that under normal wind. The maximum RMS of wind pressure (0.82) was on the windward side at the tower top, which was 0.238 higher than that under normal wind.

4.3. Characteristics of Airflow around the Tower Body

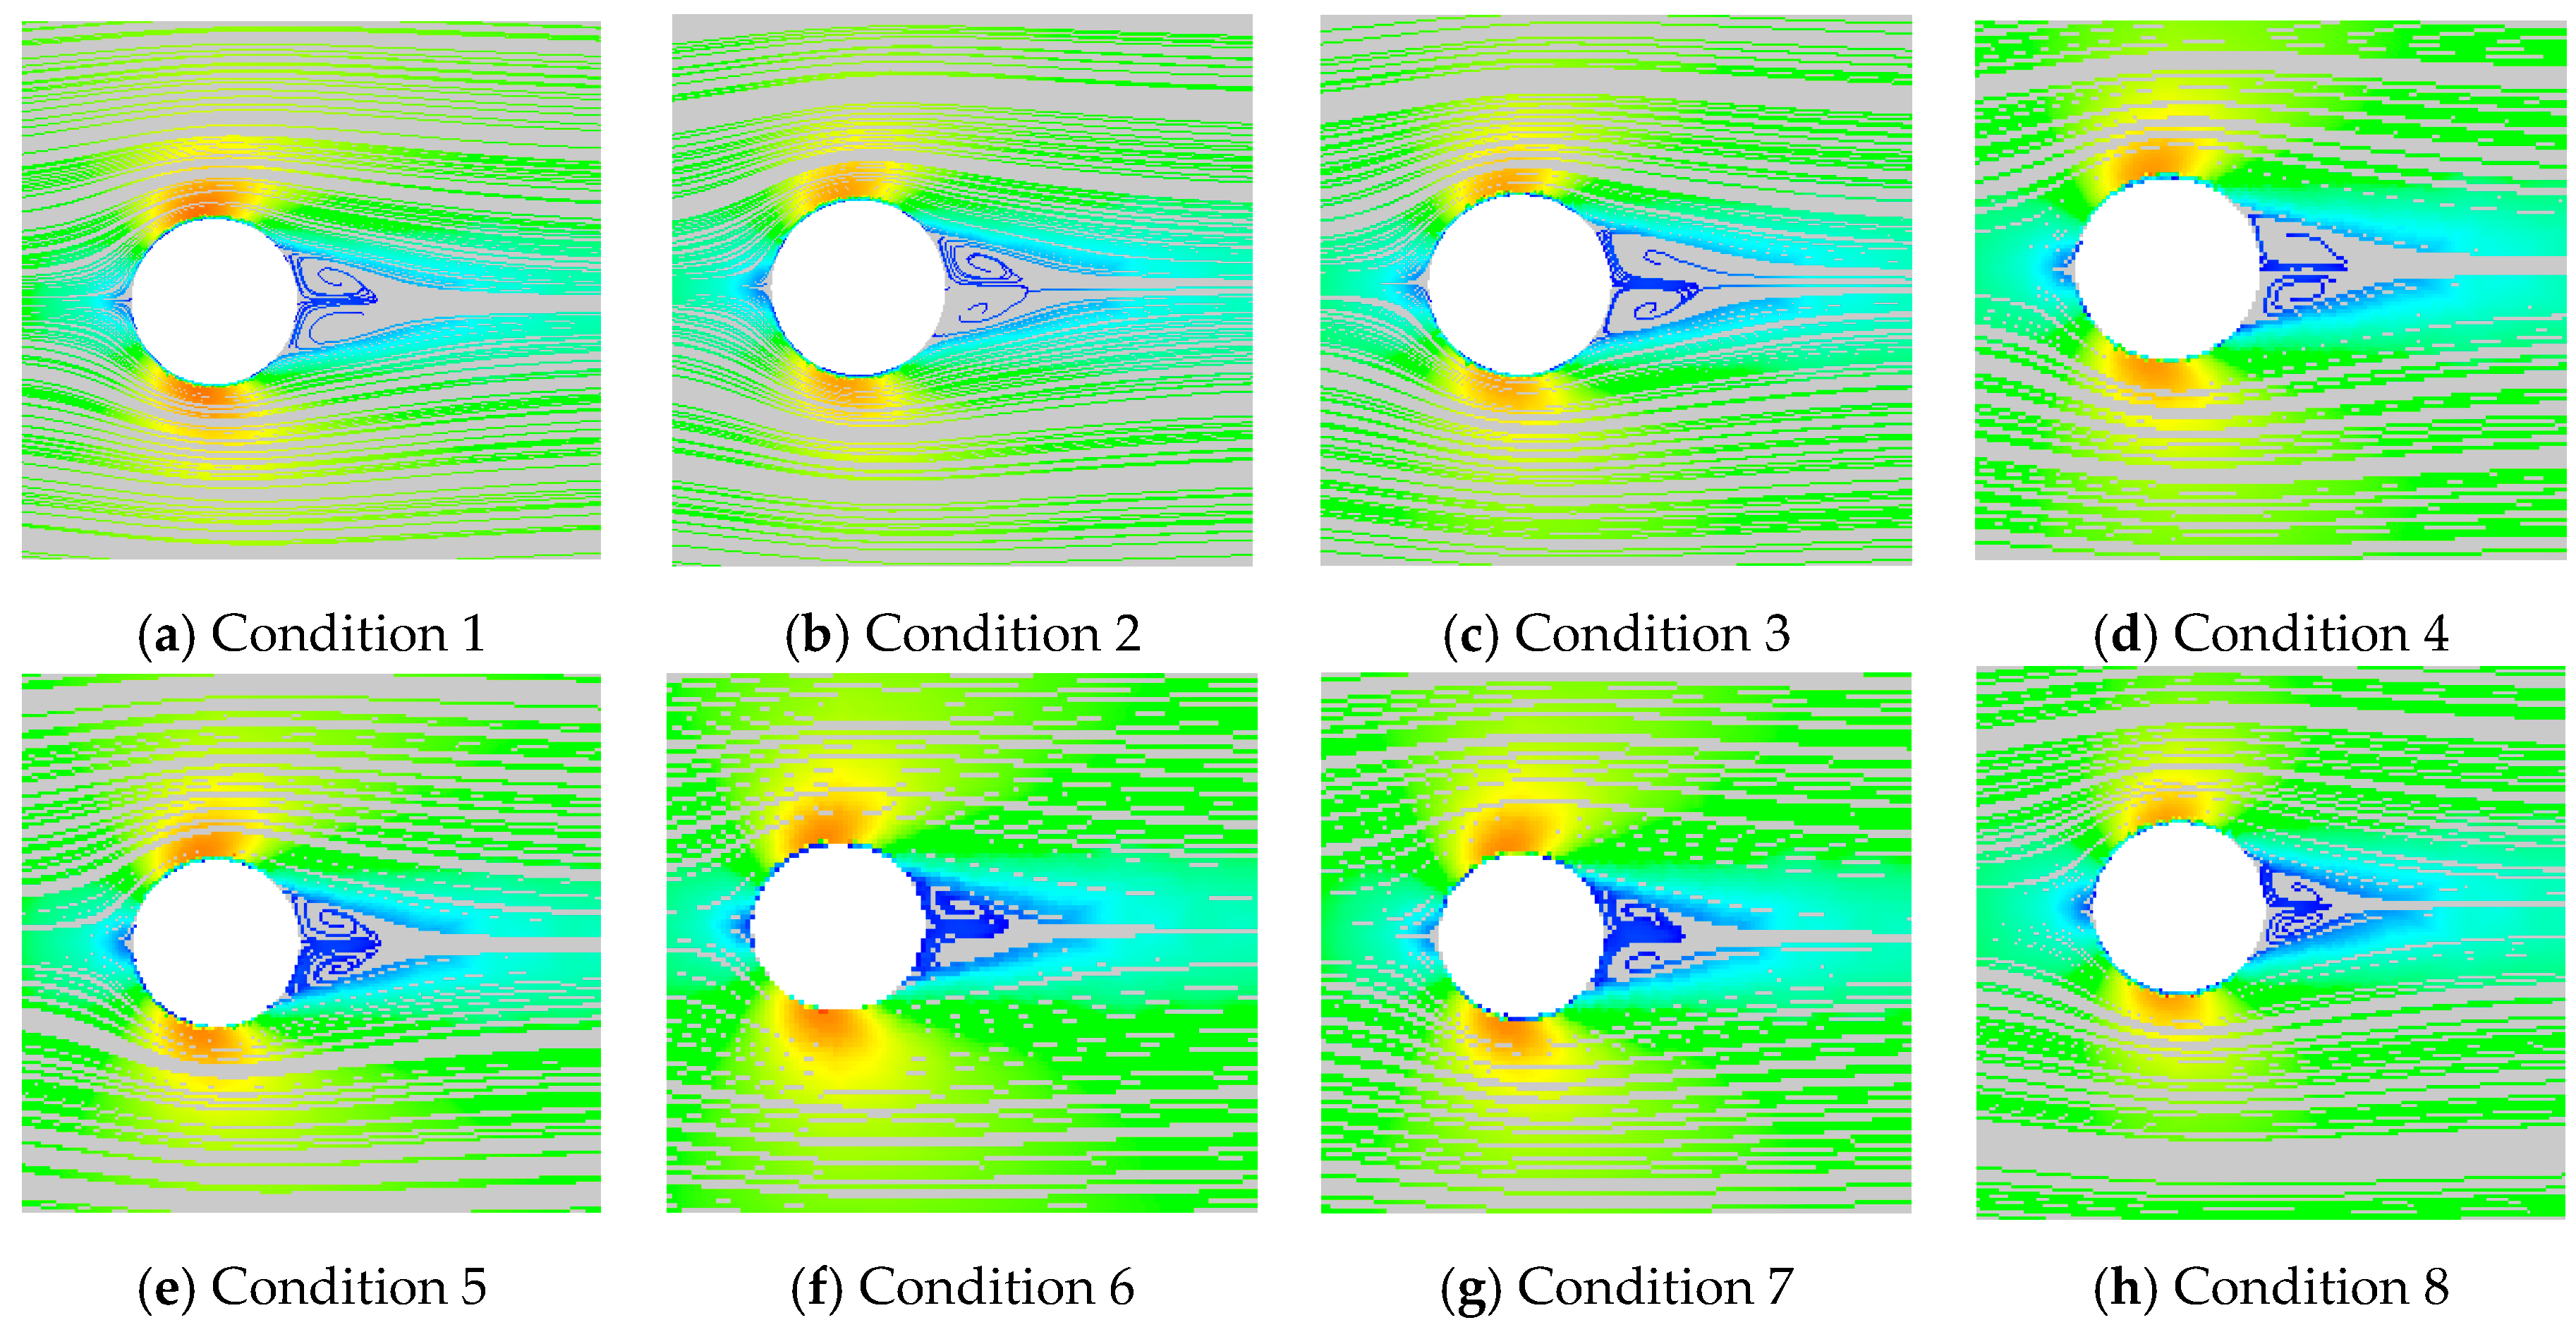
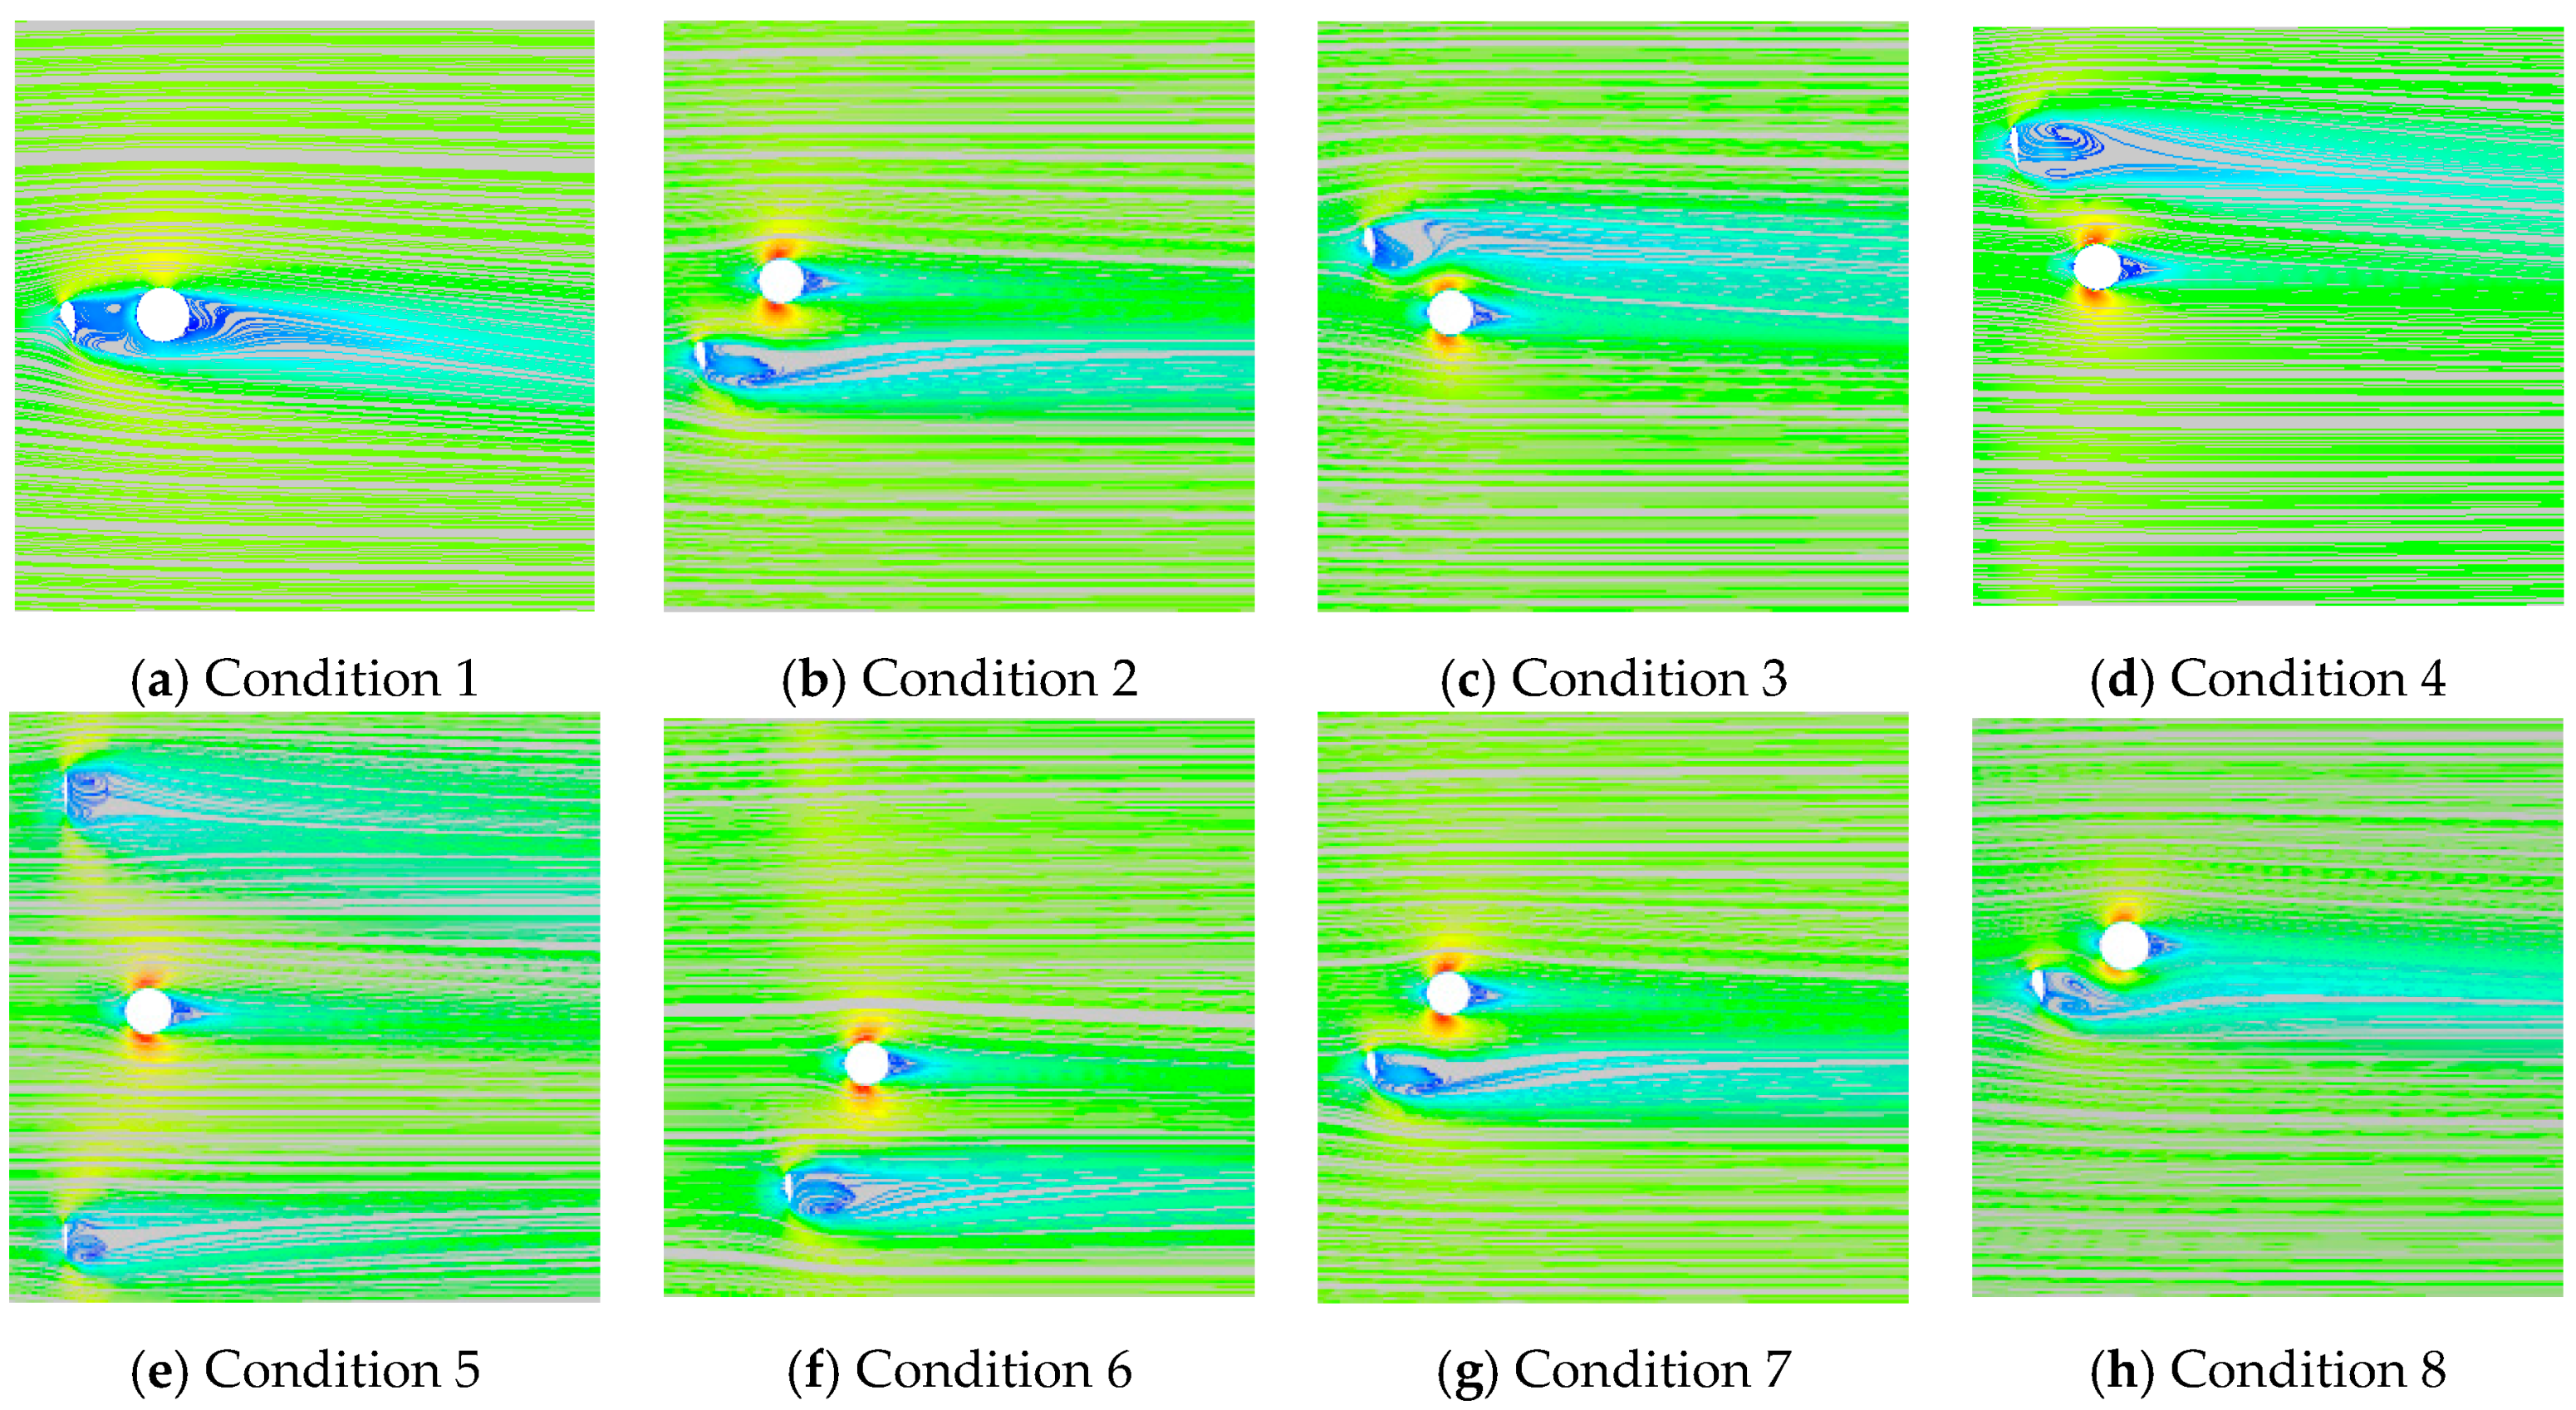
Wind speed streamlines in the undisturbed zone and disturbed zone under different conditions under typhoon loads are shown in Figure 18 and Figure 19. Clearly, the inflow at 60 m was not hindered by the upstream blade. It was split at 0° under different conditions and the inflow split point was basically consistent. Backflow and different scales of eddies were generated on the leeside of the tower body. Since the disturbed zone was shielded by the upstream blade to different extents, the airflow around the tower body was significantly different. Airflow around the tower body was affected the most under Condition 1. Later, such influences were weakened gradually with the narrowing of shielding area and disappeared completely when the Blade 2 and Blade 3 were symmetrically placed around the tower body (Condition 5).

4.4. Vorticity Distribution

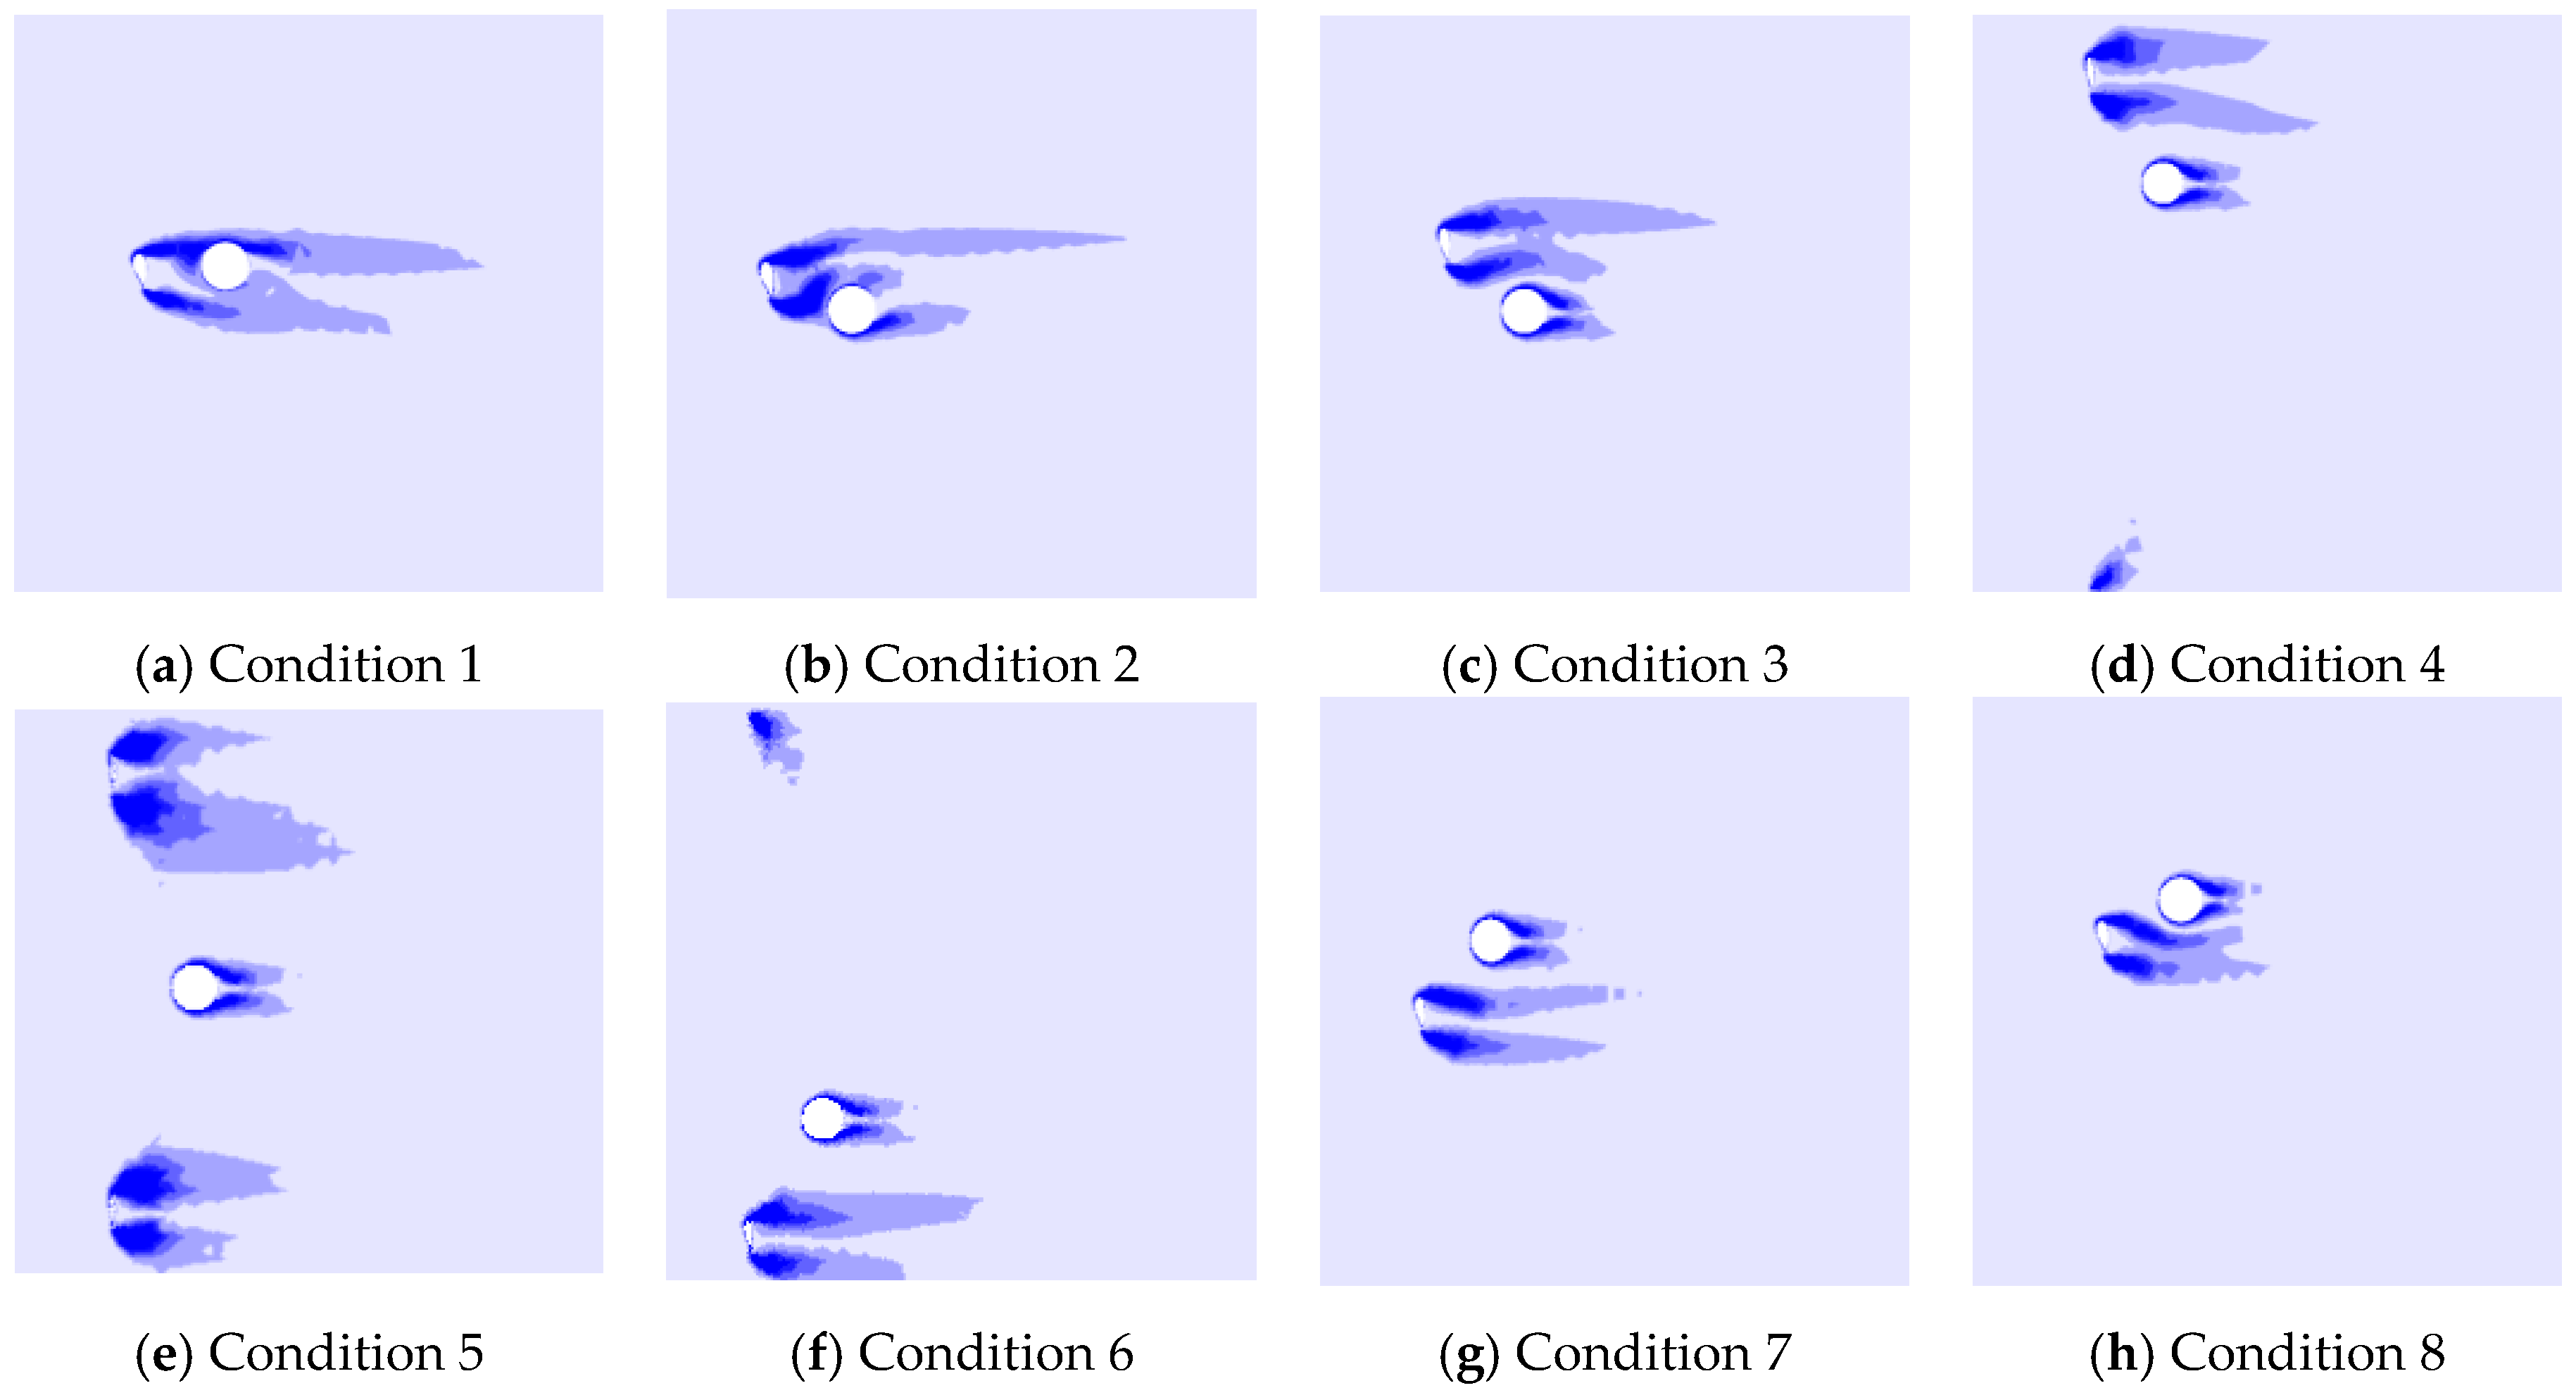
Vorticity reflects the strength and direction of eddy. Vorticity distributions at the disturbed zone under different conditions are shown in Figure 20. The vorticity distribution differed significantly under different stop positions. The existence of the tower body changed the trailing vortex development at the blades and the trailing vortex of the blades destroyed the separated flow of eddy. The tower body and blades influenced each other mutually. The vorticity distribution between the blades and tower body was dominated by the proximity effect. The existence of the blade wake caused a large-scaled vorticity increment zone. The vorticity increment zone expands with the decrease of relative distance between the blade and tower body. The disturbance redundancy between the tower body and blades under Conditions 4–6 was the most significant, so the interaction could be overlooked.
By comparing previous research results under normal wind conditions [22,23], the shielding effect of blades to the tower body played the amplification effect under typhoon loads. The shielding effect of blades to the tower body became more significant and the vorticity increment zone decreased with the weakening of shielding effect.

5. Wind-Induced Response Analysis

5.1. Finite Element Modeling and Dynamic Characteristics

The wind turbine tower-blade integrated finite element model under different conditions was established based on ANSYS. The tower body and blade was simulated by Shell63 units and the cabin was simulated by Beam188 units. The internal structure was neglected. The round raft basis unit was Solid65 with a diameter of 30 m and a height of 3 m. The foundation bottom was solidified. The foundation and basis were simulated by Combin14 spring unit.
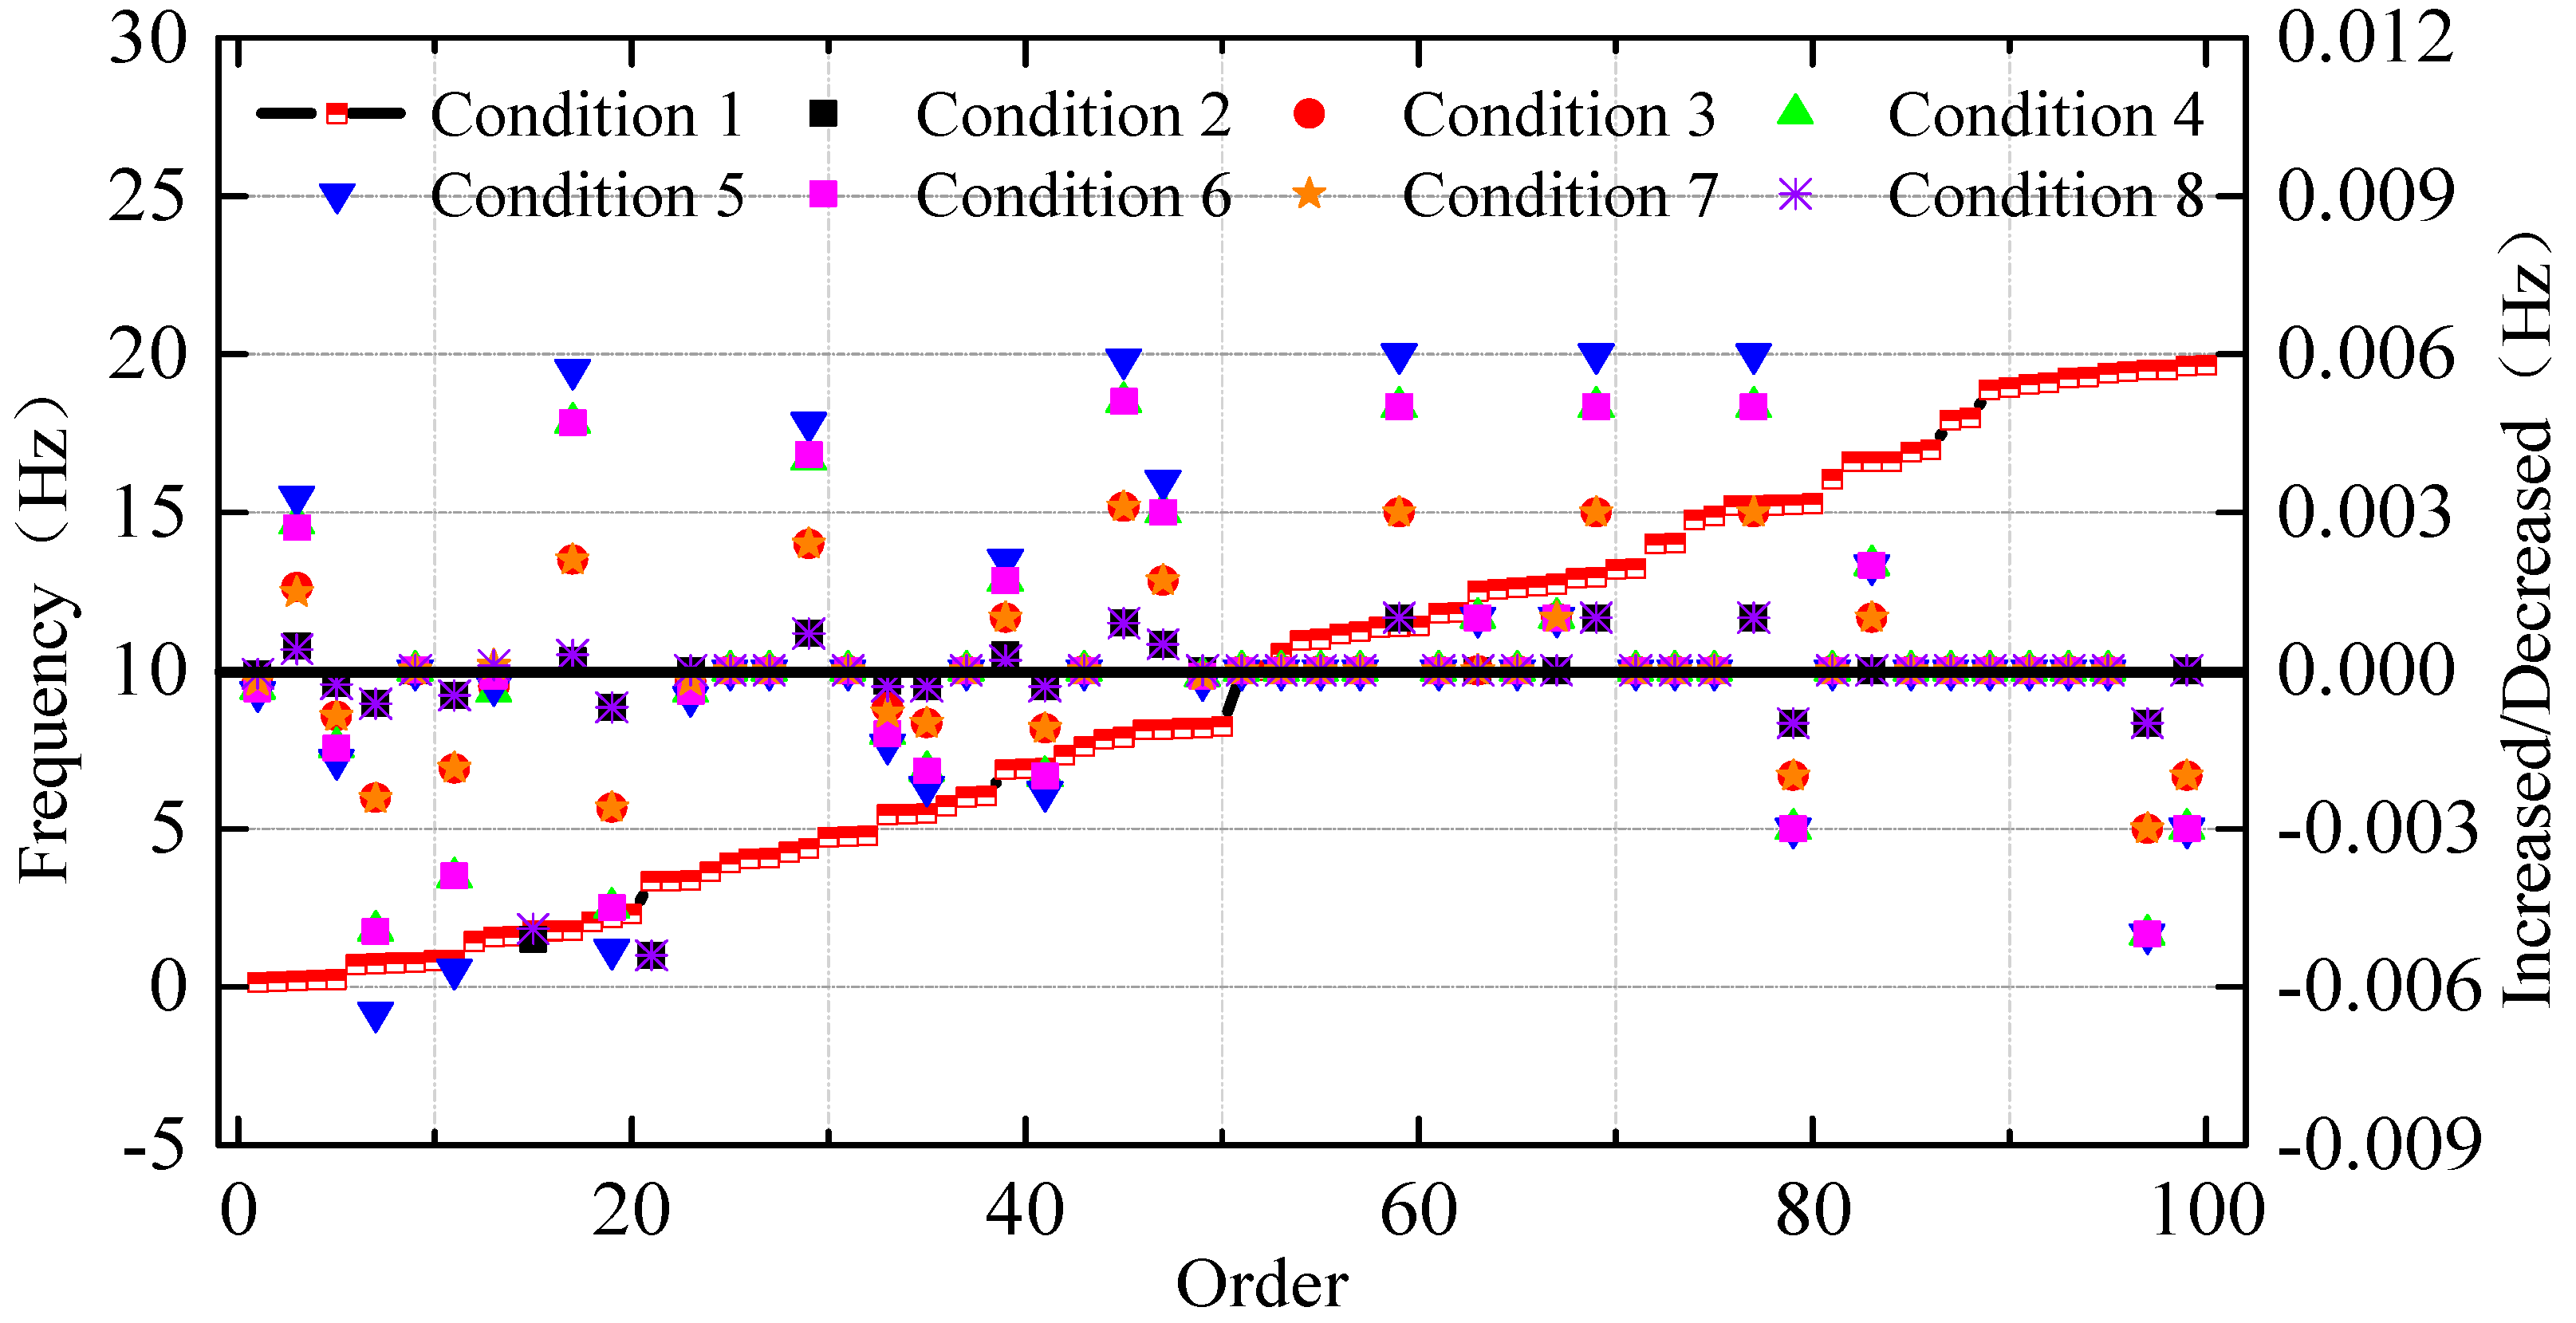
The first 100 orders of inherent frequency distribution are shown in Figure 21. It shows the numerical value of the inherent frequency under Condition 1, but only expressed increase/decrease amplitudes under the remaining conditions relative to the value under Condition 1. By comparison we know that: (1) the frequency distribution of the wind turbine was similar under different conditions. The low-order frequency of the structure under Condition 1 was significantly higher than those under the remaining conditions. However, the high-order frequency was slightly lower than those under conditions 2~8. The blade rotation influenced the low-order frequency of the wind turbine system significantly, but influenced the high-order frequency slightly. (2) Under different conditions, there’s a small frequency difference among some orders and the frequency increase/decrease of the structure concentrated on the horizontal level of 0 Hz. The fundamental frequency of the structure under the Condition 1 was 0.14 Hz. It decreased gradually with the increase of relative distance between the blade and tower body.
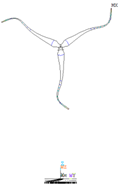
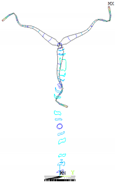
To sum up, the stop position of blades wouldn’t influence the frequency of the wind turbine significantly. Therefore, the list of typical vibration modes of wind turbines was given by taking working condition 1 as an example. It can be seen from Table 3 that the low-order mode of vibration was mainly manifested by blade driving front-to-rear swing and left-to-right swing of the cabin and tower body. The swing became more violent with the increase of fundamental frequency. The structural deformation and instability of the tower and the blade appeared in the higher mode.

5.2. Wind-Induced Responses

5.2.1. Responses of the Tower Body

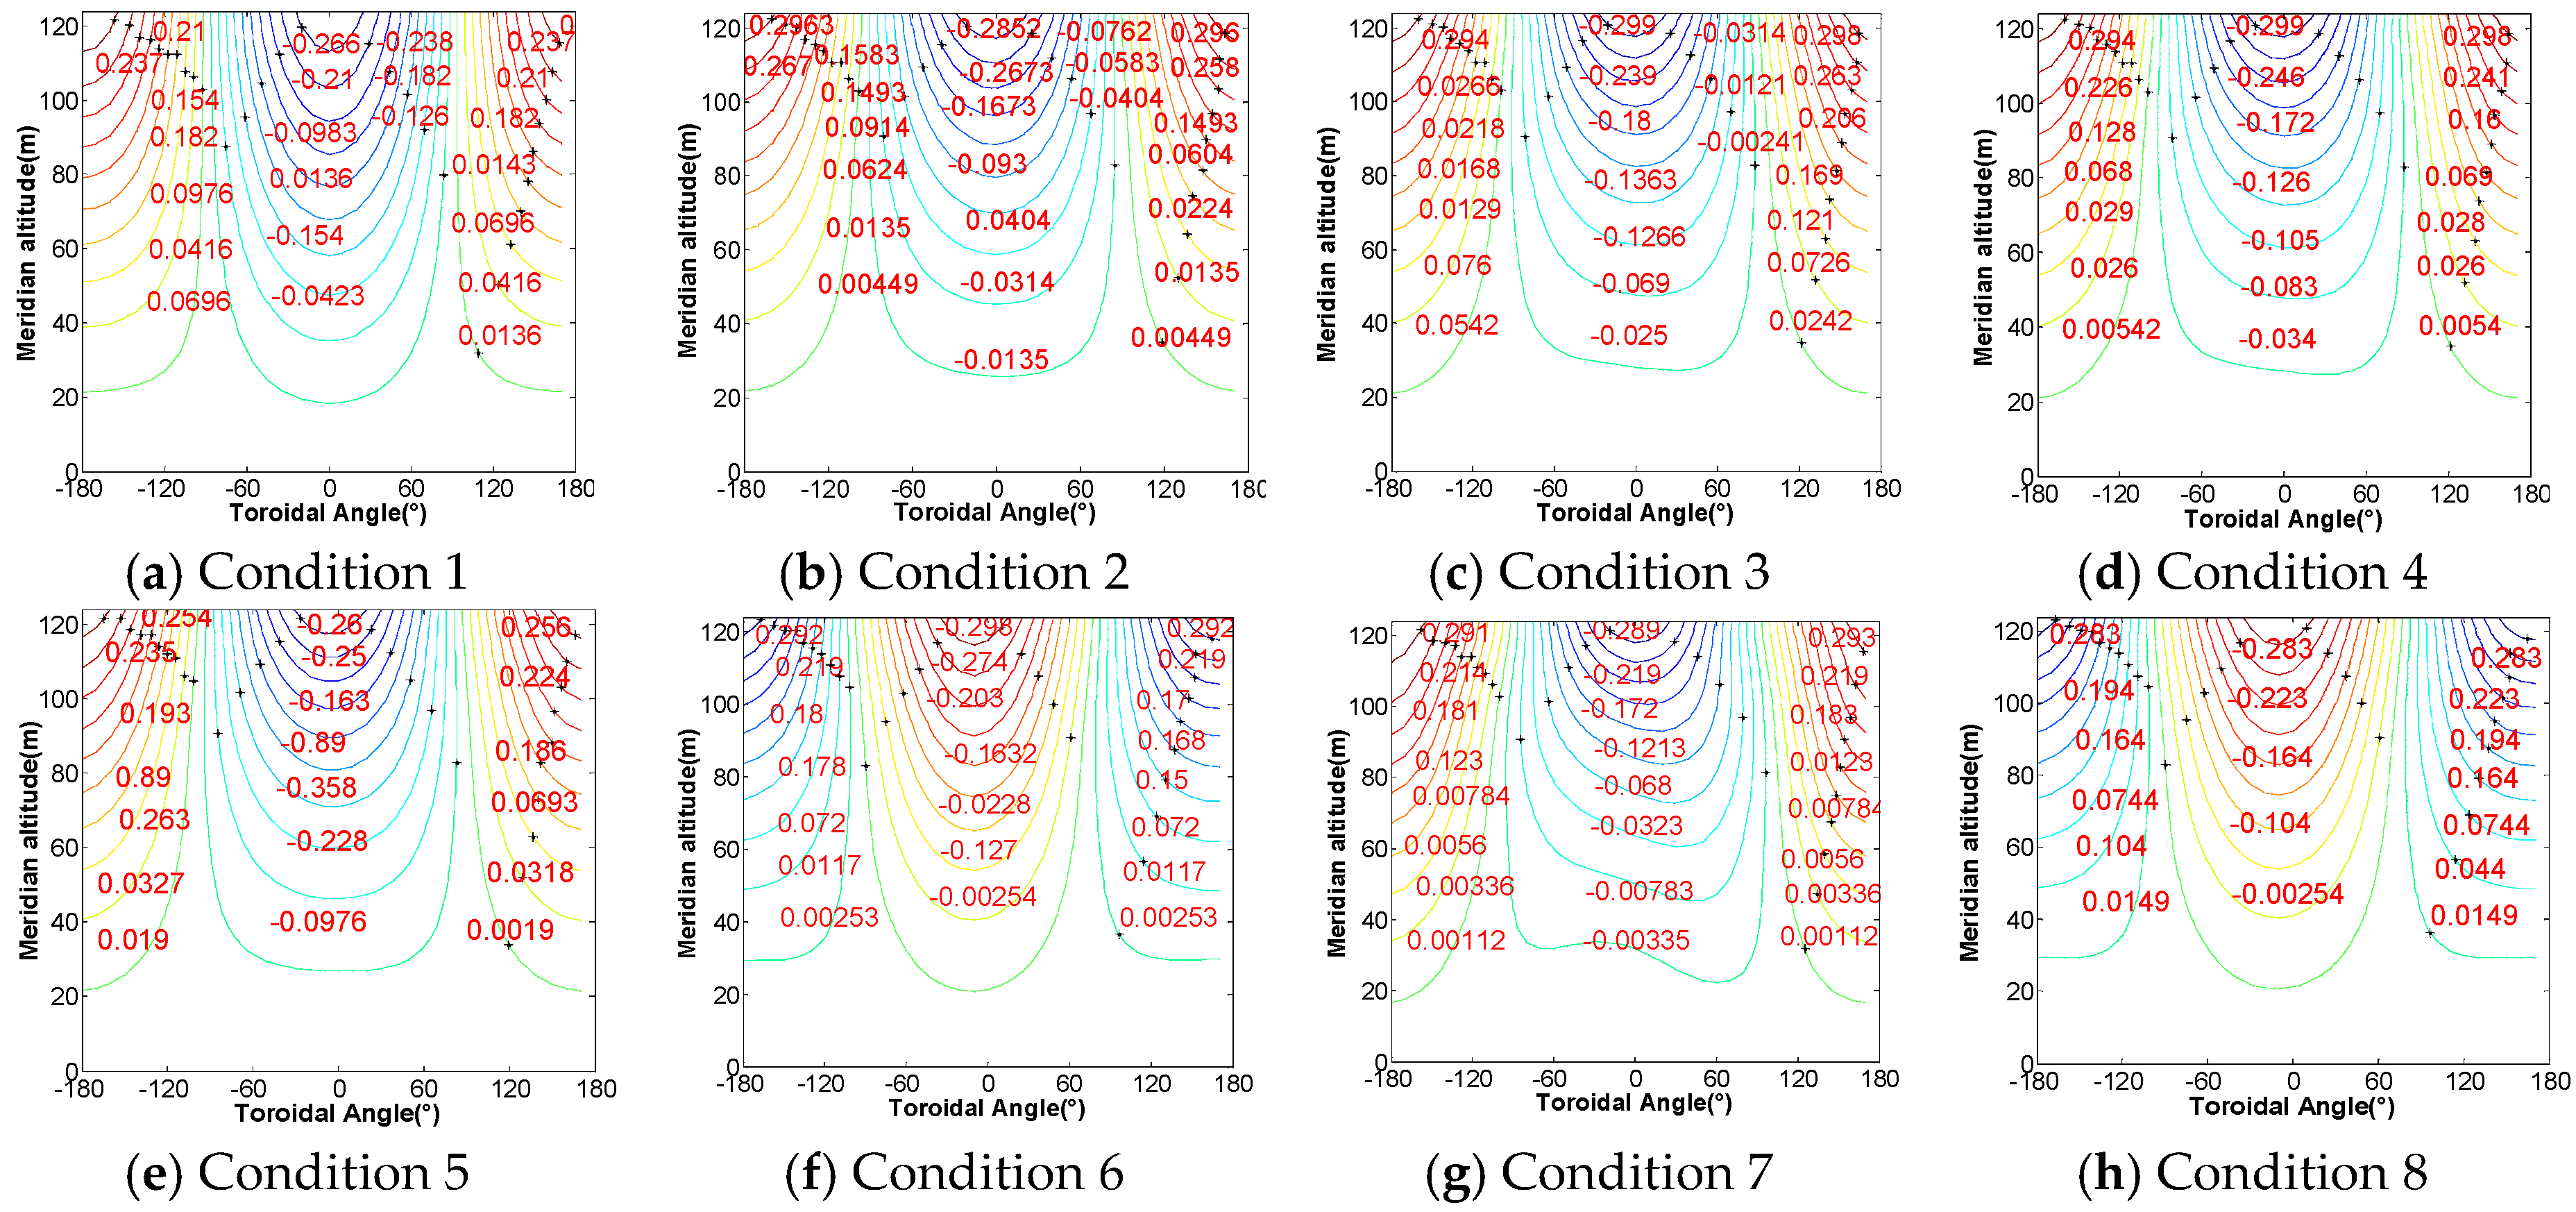
The negative value means downwind pointing with respect to the tower body and the positive value means pointing out from the tower against the wind direction in Figure 22. It can be known from the comparison that: (1) under different conditions, the radial displacement distribution of pylons at different heights was consistent. Influenced by the blade shielding effect, the numerical values of radial displacement at the tower top were significantly different. Radial displacement increased gradually with the increase of height and maximum displacement was at achieved at the ±10° position on the leeside of the tower top. The maximum displacement (0.294 m) was achieved under Condition 4 and the minimum displacement (0.21 m) was achieved under Condition 1. (2) The maximum value of radial displacement on windward surface of tower increased with the decrease of shielding effect. The minimum numerical value was 0.26 m under Condition 1 and the blade shielding effect would decrease radial displacement on the tower top.
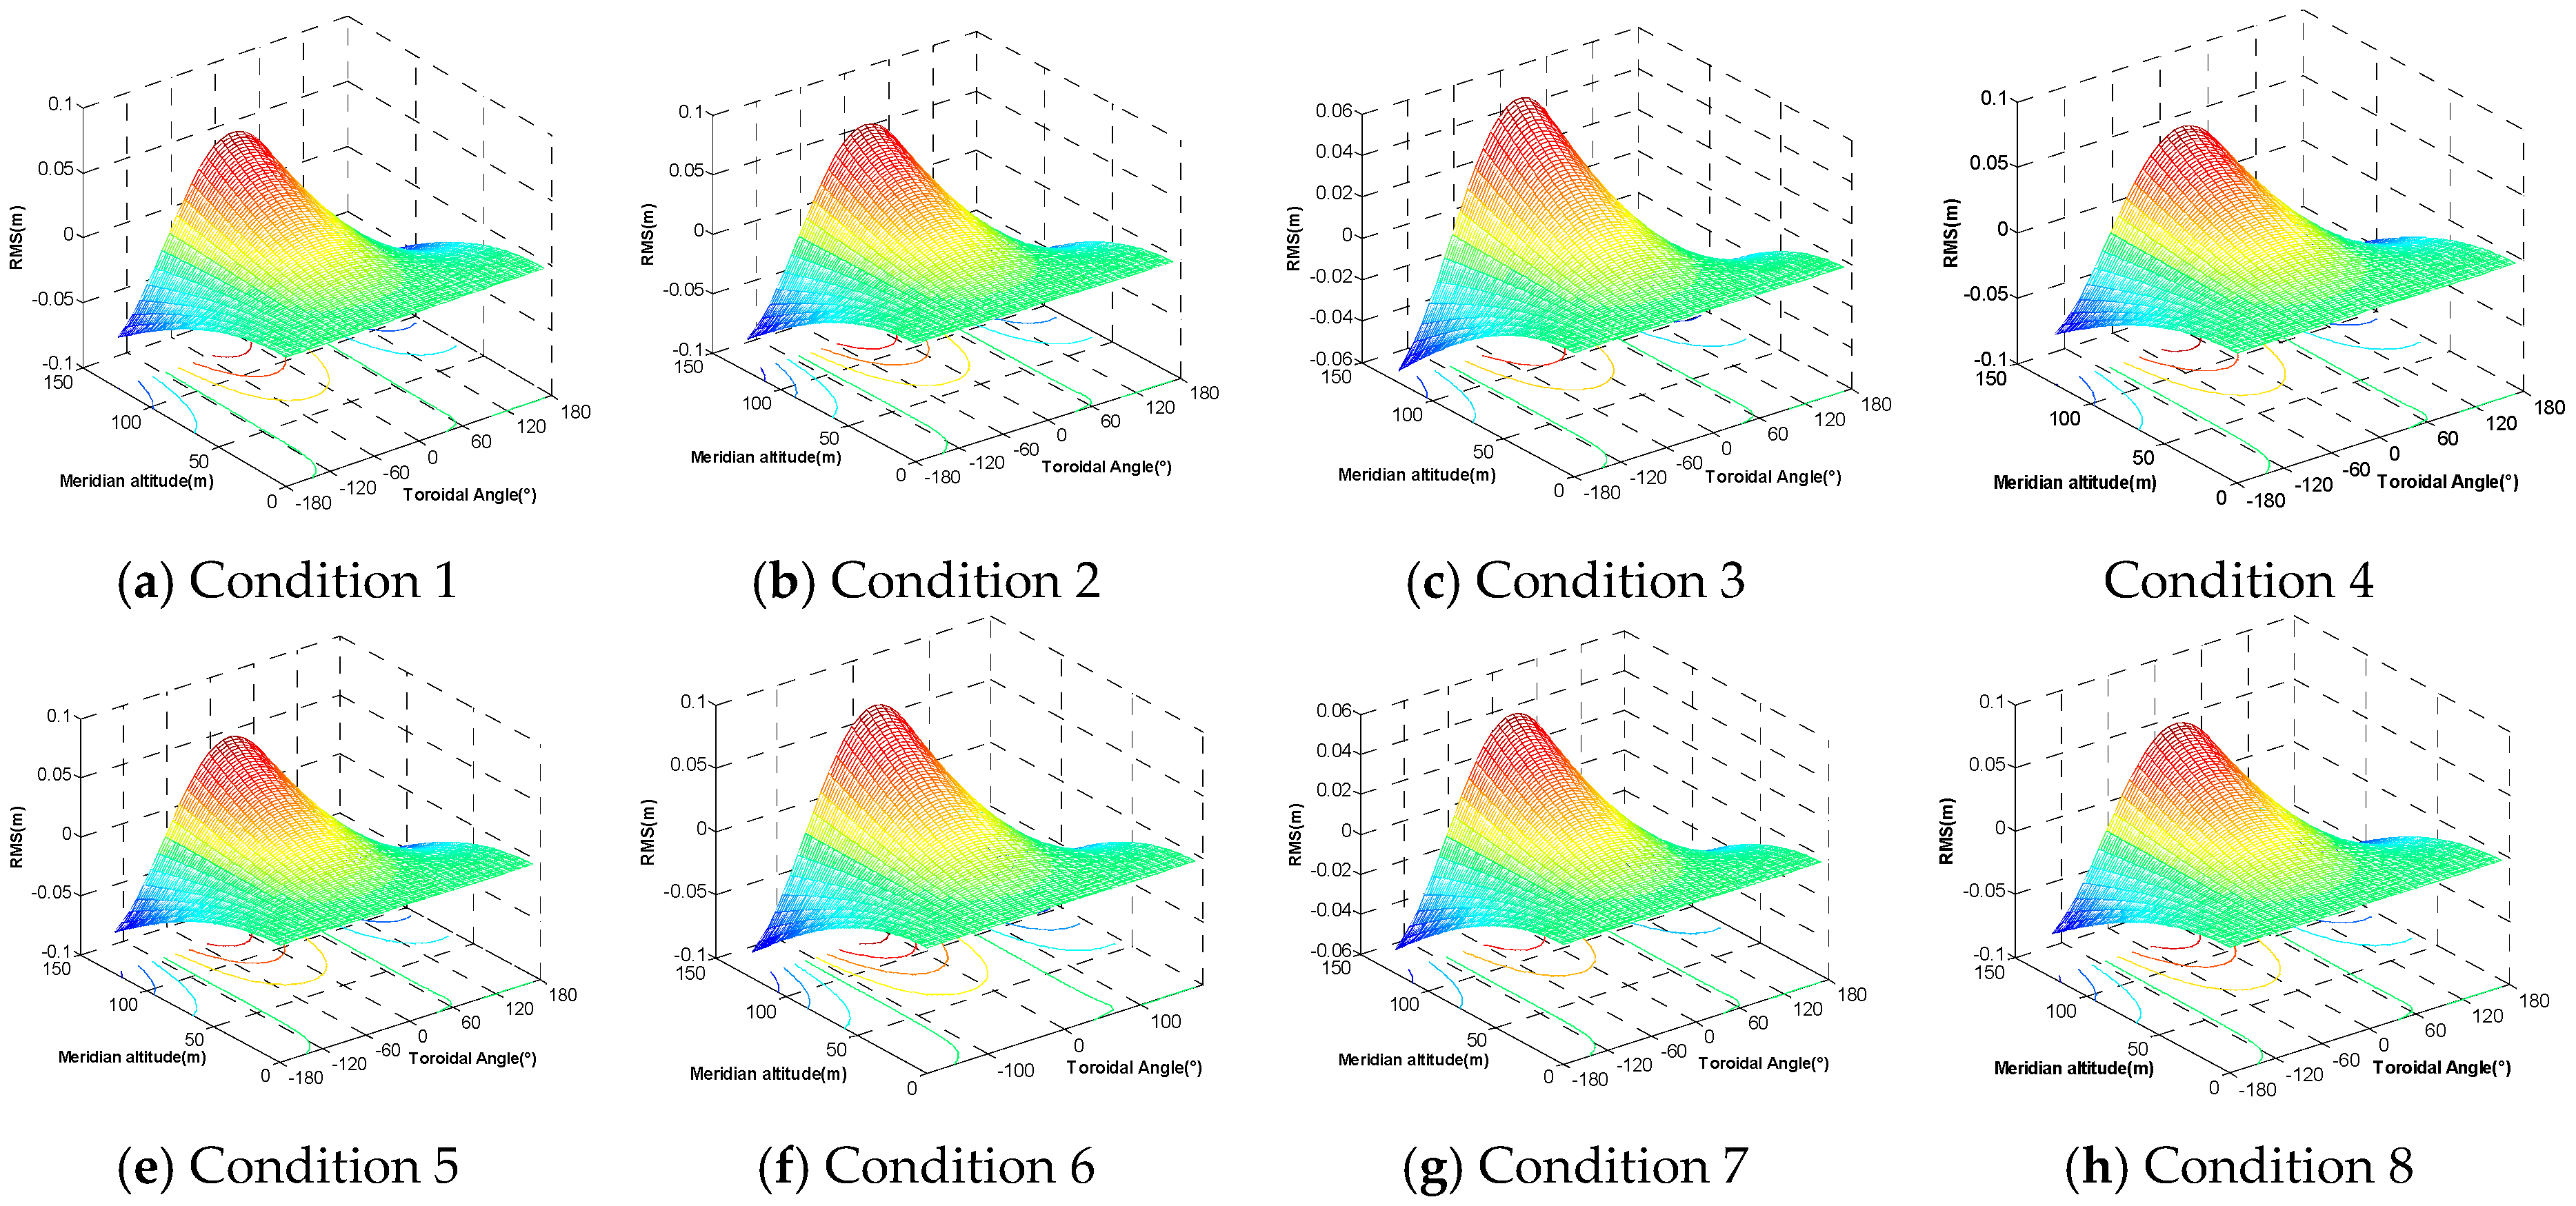
Distributions of RMS of radial displacement under different conditions are shown in Figure 23. The RMS on windward and leeward of the tower are large. RMS of radial displacement on leeside of the tower body was high when the inflow split and fell at blades. Besides, the relative position between blade root and tower body would influence RMS of leeside significantly. With the reduction of relative distance, the RMS increased gradually and reached the significance level under Condition 6. The maximum value was close to −0.1.
Changes of mean and RMS of internal stresses on the tower body with height under different conditions are shown in Figure 24 and Figure 25. The results demonstrated that: (1) the mean and RMS of meridian axial force and the primary principle stress decreased gradually with height. The mean of the Von Mises stress increased firstly and then decreased. Under different conditions, the primary principal stress and Von Mises stress at the tower top were concentrated, which shall be considered carefully in design of the connection between the tower body and cabin. (2) The mean and RMS of stresses on the tower body were influenced significantly by the blade shielding effect. The mean and RMS of stresses under blade shielding effect, especially Condition 1 and Condition 2, were significantly higher than those under no blade shielding effect.

5.2.2. Responses of Blades

The distributions of mean and RMS of downwind displacements of three blades under different conditions are shown in Figure 26 and Figure 27. They demonstrated that: (1) under different conditions, mean and RMS of downwind displacements increased gradually with the increase of span length, reaching the maximum at the blade tip. The maximum mean displacement (2.38 m) was achieved at the tip of Blade 2 under Condition 1. The maximum RMS was achieved by Blade 2 under the Condition 6. (2) In a single rotation period, height of Blade 1 increased firstly and then decreased, whereas the height of Blade 2 showed the opposite. (3) The mean radial displacement of Blade 3 reached the maximum under Condition 1 and Condition 2. This indicated that blade could disturb the tower body, and the tower body can affect the blade in return. Under equal conditions, the downwind displacement decreased gradually with the increase of relative distance between blade and tower body.
Distributions of mean and RMS of shearing force of blades under different conditions are shown in Figure 28 and Figure 29. The results demonstrated that: (1) at the roots of the three blades, the mean shearing force increased sharply in the beginning and then dropped suddenly. It tended to be stable with the increase of span length. The RMS of shearing force increased sharply at first, then became stable and finally increased dramatically with the increase span length. RMS at three blade tips was significantly higher than those at blade roots. (2) Under Condition 5 and Condition 6, the mean of shearing force at root of Blade 1 increased dramatically. Under Condition 1 and Condition 2, the mean of shearing force of Blade 2 increased dramatically, indicating that shearing force at blade roots was positively related with blade height. Strengthening the blade roots in the structural design is suggested. (3) The variation trend of Blade 3 was not observed in Blade 1 and Blade 2. Under Condition 1 and Condition 2, shearing force increased significantly. This was closely related with the tower-blade interaction.
According to previous research results under normal wind conditions [22,23] the typhoon intensified the wind-induced responses of the tower body. The maximum mean radial displacement was increased by about 35%. Mean and RMS of blade responses were influenced slightly. It was suggested to strengthen the tower body in regions with frequent occurrences of typhoons.

5.3. Wind Fluttering Factor

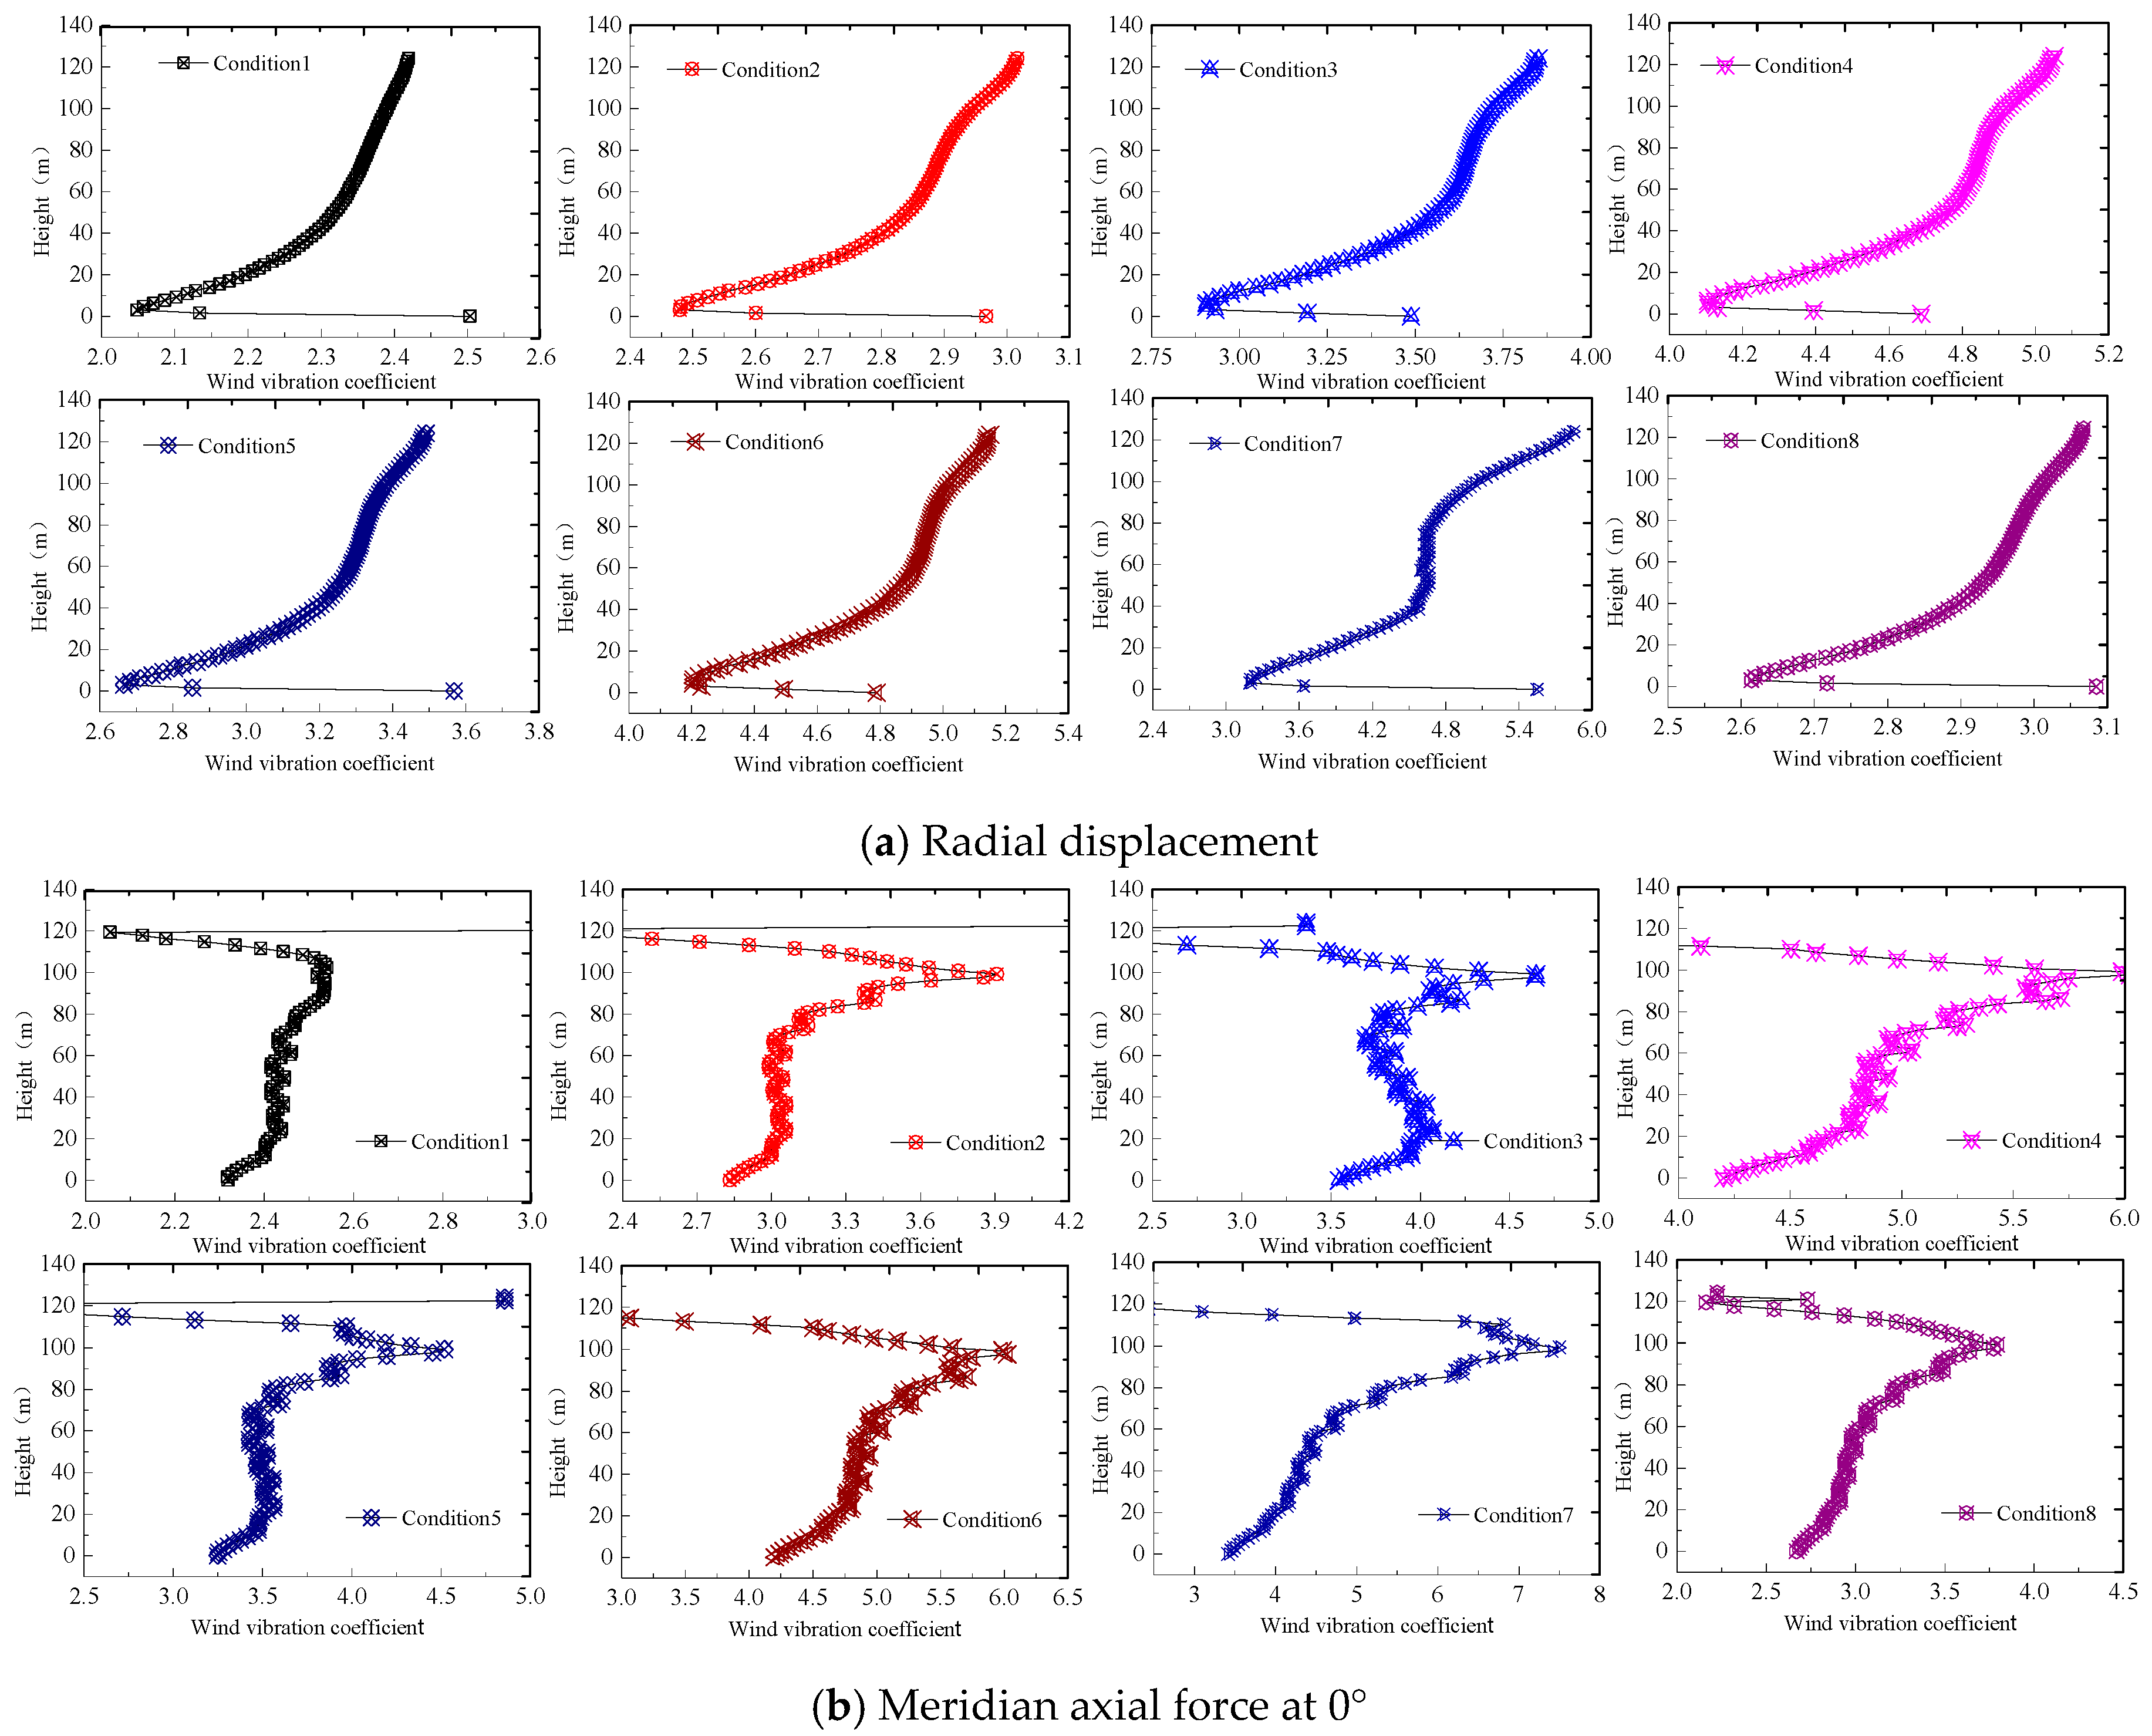
The wind fluttering factor distributions of the tower body under different conditions when using internal stresses and displacement as the equivalent goals are shown in Figure 30. It was found that: (1) the wind fluttering factor of tower body under typhoon loads was positively related with height. Under different conditions, the wind fluttering factor when using radial displacement and the meridian axial force at 0° as the equivalent goal was mainly in the range of 2.0–4.0. The wind fluttering factor when using the meridian axial force at 0° as the equivalent goal was slightly larger than that when using the radial displacement as the equivalent goal. Distortion was developed at the tower top. (2) The wind fluttering factor was similar between Condition 2 and Conditions 8, as well as between the Condition 2 and Condition 8. Given two equivalent goals, the wind fluttering factor increased as the shielding effect weakened. The wind fluttering factor under Condition 4 and Condition 6 was significantly higher than those under rest conditions. (3) The wind fluttering factor distribution was gentle under the Condition 1, mainly concentrated in the 2.0–2.5 range.
Distributions of wind fluttering factor of blades under different conditions are shown in Figure 31 and Figure 32. Downwind displacement and shearing force as equivalent goals were used as the equivalent goal. It can be known by comparison that: (1) the wind fluttering factor of blade was significantly higher than that of the tower body. Given different equivalent goals, the wind fluttering factor mainly distributed in the range of 2.0–5.0. The wind fluttering factor when using downwind displacement as the equivalent factor was slightly larger than that when using shearing force as the equivalent factor. (2) By using the shearing force as the equivalent goal, the wind fluttering factor when there’s a sharp increase of shearing force peak at blade root was relatively high. When the shearing force peak was relatively weak, the wind fluttering factor at blade tip was larger than that at blade root. (3) The wind fluttering factor when using downwind displacement as the equivalent goal developed serious distortion, especially under blade shielding effects. In conditions without blade shielding effect, the distribution of wind fluttering factor was relatively gentle and the numerical value was in the range of 2.2–3.8.

6. Conclusions

In this paper, the aerodynamic performance of a large wind turbine under typhoon loads wasstudied by WRF and CFD nesting technology. The dynamic characteristics and wind-induced responses of the structural system under different stop positions of blades are discussed by combining the finite element method. A series of conclusions were drawn:
(1)
By comparing typhoon wind speed, wind intensity, wind direction and wind profile, it is concluded that the meso-scale WRF model can effectively simulate the near surface typhoon wind field. Based on the minimum least square method, the profile index of typhoon “Nuri” was fitted at 0.076. In this paper, the downscaling method can effectively simulate the 3D typhoon field of this kind of large-scale wind turbine system, which verifies the validity of the meso- and micro-scale nested simulation method, and provides the load input for the subsequent random wind pressure characteristics and wind vibration dynamic analysis.
(2)
The simulation results show that the wake zone is expanded gradually and the vorticity increment zone increases significantly under typhoon loads. Such a phenomenon is weakened with the reduction of the shielding area. The fluctuating and extreme wind pressures on blades and tower body are increase dramatically under typhoon loads. The maximum increase reaches 29%, which is appeared on the tower top of windward side. The fluctuating wind pressure is increased gradually as the blade shielding effect weakens.
(3)
Internal stresses and wind fluttering factor of blades and tower body are increased significantly under typhoon loads. When the tower body is not shielded by blades, the wind fluttering factor is decreased significantly. When the tower body is shielded by blades, the wind fluttering factor is increased significantly. The increase of radial displacement of the tower body is intensified as the shielding effect weakens. The maximum increase reaches 35%.
(4)
Based on our comprehensive analysis, when the large wind turbine is stopped under typhoon loads, the most unfavorable condition is when blade overlaps with the tower body completely (Condition 1). The safety redundancy reaches the maximum when the upper blade overlaps with the tower body completely (Condition 5).

Author Contributions

Conceptualization, S.K.; Data curation, S.K.; Formal analysis, L.X.; Funding acquisition, S.K.; Investigation, L.X.; Methodology, T.W.; Software, L.X.; Writing—original draft, S.K.; Writing—Review&Editing, S.K.

Funding

This paper was supported by the National Natural Science Foundation of China (U1733129, 51878351, 51761165022), National key research and development project (2017YFE0132000), Postdoctoral Scientific Fund (2015T80551), Jiangsu “Qinglan Engineering” of Universities and Hih-level Talents Planning Program of Jiangsu Six Types of Talent Summit (JZ-026).

Conflicts of Interest

The authors declare no conflicts of interest.

References

  1. Chen, B.; Wang, K.; Liu, J.; Gao, F. The impact of super typhoon Saomai(0608) on the offshore environment near the Yangtze estuary. Earth Sci. 2016, 41, 1402–1412. (In Chinese) [Google Scholar]
  2. Xiao, Y.F.; Duan, Z.D.; Xiao, Y.Q.; Ou, J.P.; Chang, L.; Li, Q.S. Typhoon wind hazard analysis for southeast China coastal regions. Struct. Saf. 2011, 33, 286–295. [Google Scholar] [CrossRef]
  3. GB/T 25383-2010. Wind Turbine Generator System-Rotor Blades; China Standards Press: Beijing, China, 2010. [Google Scholar]
  4. CCS-2008. China Classification Siciety-Specification for Wind Turbines; China Communication Press: Beijing, China, 2008. [Google Scholar]
  5. Carvalho, D.; Rocha, A.; Gómez-Gesteira, M.; Santos, C.S. WRF wind simulation and wind energy production estimates forced by different reanalyses: Comparison with observed data for Portugal. Appl. Energy 2014, 117, 116–126. [Google Scholar] [CrossRef]
  6. Maruyama, T.; Tomokiyo, E.; Maeda, J. Simulation ofstrong wind field by non-hydrostatic mesoscale modeland its applicability for wind hazard assessment ofbuildings and houses. Hydrol. Res. Lett. 2010, 4, 40–44. [Google Scholar] [CrossRef]
  7. Kim, S.Y.; Chun, H.Y. Stratospheric Gravity Waves Generated by Typhoon Saomai (2006): Numerical Modeling in a Moving Frame Following the Typhoon. J. Atmos. Sci. 2010, 67, 3617–3636. [Google Scholar] [CrossRef]
  8. Li, J.; Song, X.P.; Cheng, X.L.; Hu, F. Dynamical simulation of wind flow from synoptic scale to turbine scale. ACTA Energ. Sol. Sin. 2015, 36, 806–811. (In Chinese) [Google Scholar]
  9. Xu, Y.; He, H.; Song, J.; Hou, Y.; Li, F. Observations and Modeling of Typhoon Waves in the South China Sea. J. Phys. Oceanogr. 2017, 47, 1307–1324. [Google Scholar] [CrossRef]
  10. O’Brien, J.M.; Young, T.M.; O’Mahoney, D.C.; Griffin, P.C. Horizontal axis wind turbine research: A review of commercial CFD, FE codes and experimental practices. Prog. Aerosp. Sci. 2017, 92, 1–24. [Google Scholar] [CrossRef]
  11. Shen, L.; Han, Y.; Dong, G.C.; Cai, C.S. Numerical simulation of wind field on bridge site located in mountainous area and gorge based on WRF. China J. Highw. Transp. 2017, 30, 104–113. (In Chinese) [Google Scholar]
  12. Lundquist, J.K.; Mirocha, J.D.; Chow, F.K.; Kosovic, B.; Lundquist, K.A. Simulating atmosphere flow for wind energy applications with WRF-LES. Univ. North Tex. 2008, 7, 281–295. [Google Scholar]
  13. Dimitrov, N.; Natarajan, A.; Mann, J. Effects of normal and extreme turbulence spectral parameters on wind turbine loads. Renew. Energy 2017, 10, 1180–1193. [Google Scholar] [CrossRef]
  14. Li, Z.X.; Chan, T.H.T.; Ko, J.M. Evaluation of typhoon induced fatigue damage for Tsing Ma Bridge. Eng. Struct. 2002, 24, 1035–1047. [Google Scholar] [CrossRef]
  15. Papanastasiou, D.K.; Melas, D.; Lissaridis, I. Study of wind field under sea breeze conditions; an application of WRF model. Atmos. Res. 2010, 98, 102–117. [Google Scholar] [CrossRef]
  16. Lian, J.J.; Jia, Y.Y.; Wang, H.J. Numerical simulation for characteristics of wind loads of 2.5MW wind turbine under Typhoon. ACTA Energ. Sol. Sin. 2018, 39, 611–618. (In Chinese) [Google Scholar]
  17. Steele, C.J.; Dorling, S.R.; Glasow, R.V.; Bacon, J. Idealized WRF model sensitivity simulations of sea breeze types and their effects on offshore windfields. Atmos. Chem. Phys. 2013, 13, 443–461. [Google Scholar] [CrossRef] [Green Version]
  18. Marjanovic, N.; Mirocha, J.D.; Chow, F.K. Generalized Wind Turbine Actuator Disk Parameterization in the Weather Research and Forecasting (WRF) Model for Real-World Simulations. Am. Geophys. Union 2013, 12, 3–19. [Google Scholar]
  19. Wang, Z.Y.; Zhang, B.; Zhao, Y.; Liu, G. Dynamic response of wind turbine under Typhoon. ACTA Energ. Sol. Sin. 2013, 34, 1434–1442. (In Chinese) [Google Scholar]
  20. Ke, S.T.; Xu, L.; Ge, Y.J. The aerostatic response and stability performance of a wind turbine tower-blade coupled system considering blade shutdown position. Wind Struct. Int. J. 2017, 25, 507–535. [Google Scholar]
  21. Ke, S.T.; Wang, T.G.; Ge, Y.J.; Wang, H. Wind-induced fatigue of large HAWT coupled tower-blade structures considering aeroelastic and yaw effects. Struct. Des. Tall Spec. Build. 2017, 11, e1467. [Google Scholar] [CrossRef]
  22. Ke, S.T.; Yu, W.; Wang, T.G.; Zhao, L.; Ge, Y.J. Wind loads and load-effects of large scale wind turbine tower with different halt positions of blade. Wind Struct. Int. J. 2016, 23, 559–575. [Google Scholar] [CrossRef]
  23. Ke, S.T.; Yu, W.; Wang, T.G.; Ge, Y.J.; Tamura, Y. The effect of blade positions on the aerodynamic performances of wind turbine system. Wind Struct. Int. J. 2016, 24, 205–221. [Google Scholar] [CrossRef]
  24. Ke, S.T.; Wang, T.G.; Ge, Y.J.; Wang, H.; Tamura, Y. Aerodynamic loads and aeroelastic responses of WT tower-blade system in yaw condition. Struct. Eng. Mech. Int. J. 2015, 56, 1021–1040. [Google Scholar] [CrossRef]
  25. Basso, J.L.M.; Macedo, L.R.; Yamasaki, Y. Evaluation of time range forecasting of surface wind of WRF. Ciênc. E Nat. 2014, 36, 491–496. [Google Scholar]
  26. Miglietta, M.M.; Zecchetto, S.; Biasio, F.D. A comparison of WRF model simulations with SAR wind data in two case studies of orographic lee waves over the Eastern Mediterranean Sea. Atmos. Res. 2013, 120, 127–146. [Google Scholar] [CrossRef]
  27. Takeyama, Y.; Ohsawa, T.; Kozai, K.; Hasager, C.B.; Badger, M. Effectiveness of WRF wind direction for retrieving coastal sea surface wind from synthetic aperture radar. Wind Energy 2013, 16, 865–878. [Google Scholar] [CrossRef]
  28. GB50009-2012. Load Code for the Design of Building Structures; China Building Industry Press: Beijing, China, 2012. [Google Scholar]
  29. Vreman, B.; Geurts, B.; Kuerten, H. Large-eddy simulation of the turbulent mixing layer. J. Fluid Mech. 2017, 339, 357–390. [Google Scholar] [CrossRef]
  30. Shamsoddin, S.; Porté-Agel, F. Large-Eddy Simulation of Atmospheric Boundary-Layer Flow through a Wind Farm Sited on Topography. Bound.-Layer Meteorol. 2016, 163, 1–17. [Google Scholar] [CrossRef]
  31. Lu, C.; Li, Q.; Huang, S.; Chen, F.; Fu, X.; Guo, M. Simulation of large eddy of wind load on a long-span complex roof structure. China Civ. Eng. J. 2011, 44, 1–9. (In Chinese) [Google Scholar]
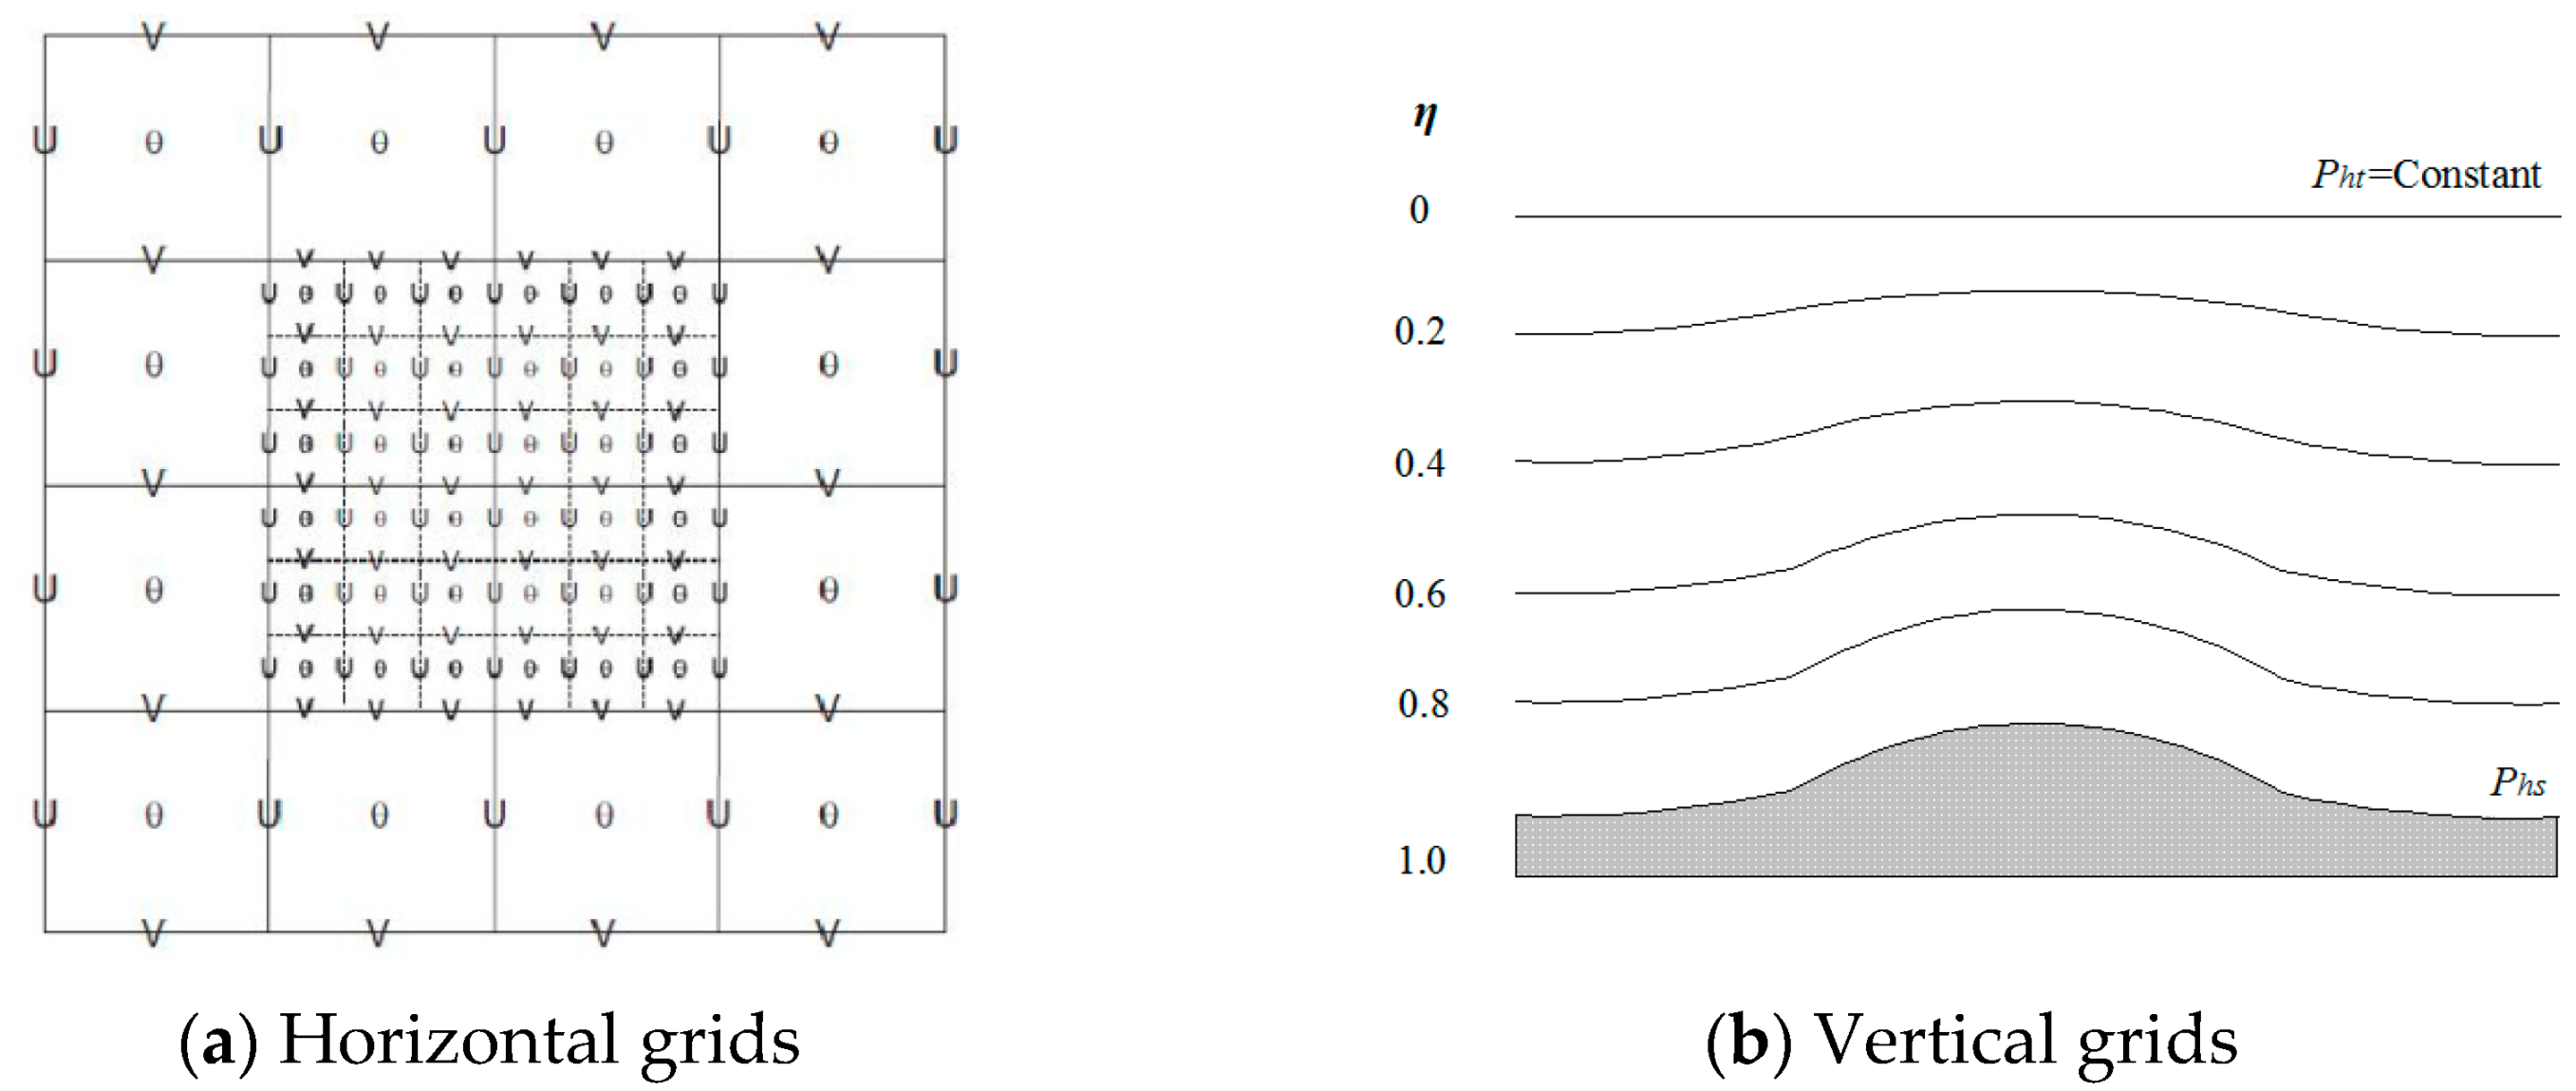
Figure 1. Meshing sketch of WRF mode.
Energies 12 03696 g001
Figure 2. Division of WRF grid for “Nuri”.
Energies 12 03696 g002
Figure 3. Air pressure, precipitation and potential temperature nephograms at landing.
Energies 12 03696 g003
Figure 4. Wind speed streamline before, at and after the landing of the typhoon.
Energies 12 03696 g004
Figure 5. Wind speed nephogram at the landing of the typhoon.
Energies 12 03696 g005
Figure 6. Typhoon path and minimum sea level pressure in the simulation process.
Energies 12 03696 g006
Figure 7. Single-period rotation of the blades.
Energies 12 03696 g007
Figure 8. Computational domain and meshing schemes.
Energies 12 03696 g008
Figure 9. Wind speed profiles close to the typhoon center at different moments and near-ground wind speed and fitting curves in the simulation center.
Energies 12 03696 g009
Figure 10. Procedures of WRF/CFD computation and nesting.
Energies 12 03696 g010
Figure 11. Boundary conditions of the computational domain (unit: m).
Energies 12 03696 g011
Figure 12. Contour map of wind pressure coefficient on the tower body under eight conditions.
Energies 12 03696 g012
Figure 13. Pressure factor distribution on blade under different conditions.
Energies 12 03696 g013
Figure 14. Time-history curve of wind pressure coefficient on the windward side of tower under different condition.
Energies 12 03696 g014
Figure 15. Distribution of average pressure coefficient in the undisturbed zone and disturbed zone under different conditions.
Energies 12 03696 g015
Figure 16. Distribution of RMS of wind pressure in the undisturbed zone and the disturbed zone under different conditions.
Energies 12 03696 g016
Figure 17. Extreme wind pressure distributions on the tower body and blades under different conditions.
Energies 12 03696 g017
Figure 18. Wind speed streamlines of the undisturbed zone.
Energies 12 03696 g018
Figure 19. Wind speed streamlines of the disturbed zone.
Energies 12 03696 g019
Figure 20. Vorticity distribution in the disturbed zone.
Energies 12 03696 g020
Figure 21. First 100 orders of inherent frequency of wind turbine under different conditions.
Energies 12 03696 g021
Figure 22. Distributions of mean radial displacement of the tower body under different conditions.
Energies 12 03696 g022
Figure 23. Distributions of RMS of mean radial displacement of the tower body under different conditions.
Energies 12 03696 g023
Figure 24. Changes of internal stresses on the tower body with heights under different conditions.
Energies 12 03696 g024
Figure 25. Changes of RMS of internal stresses on the tower body with heights under different conditions.
Energies 12 03696 g025
Figure 26. Distributions of mean downwind displacement of blades under different conditions.
Energies 12 03696 g026
Figure 27. Distributions of RMS of downwind displacement of blade under different conditions.
Energies 12 03696 g027
Figure 28. Distributions of mean shearing force on blades under different conditions.
Energies 12 03696 g028
Figure 29. Distributions of RMS of shearing force on blades under different conditions.
Energies 12 03696 g029
Figure 30. Distributions of wind fluttering factor of the tower body under equivalent goals.
Energies 12 03696 g030
Figure 31. Wind fluttering factor distribution of blades under different conditions when the shearing force was used as the equivalent goal.
Energies 12 03696 g031
Figure 32. Wind fluttering factor distribution of blades under different conditions when the downwind displacement was used as the equivalent goal.
Energies 12 03696 g032
Table 1. Parameter settings of WRF mode.
WRF ParametersMain Zone (D01)Nesting Zone (D02)Nesting Zone (D03)
Horizontal resolution13.5 km4.5 km1.5 km
Integral time step180 s180 s180 s
Microphysical process schemeLinLinLin
Long-wave radiationRRTMRRTMRRTM
Short-wave radiationDudhaiDudhaiDudhai
Near-ground layer schemeMonin-ObukhovMonin-ObukhovMonin-Obukhov
Land surface process schemeNoahNoahNoah
Boundary layer schemeMYJMYJMYJ
Cumulus convection parameter schemeKain-FritschKain-FritschKain-Fritsch
Table 2. Blade parameters of the wind turbine.
Position P/%Blade Span R/mChord Length C/mInflow Angle φ/(º)Blade Pitch Angle β/(º)Position P/%Blade Span R/mChord Length C/mInflow Angle φ/(º)Blade Pitch Angle β/(º)
532.90.82337.1455331.950.169−0.293
1063.660.6426.67260361.750.156−1.072
1594.410.50719.06965391.580.144−1.736
20124.560.41413.69270421.420.134−2.310
25154.250.3469.8375451.270.125−2.810
30183.910.2966.97680481.120.118−3.250
35213.590.2584.80285510.980.111−3.640
40243.050.2293.10390540.830.105−3.987
45272.630.2051.74295570.690.099−4.299
50302.290.1860.63100600.540.095−4.580
Table 3. Typical modes of vibrations of the wind turbine.
Orders 125538593
Inherent frequency0.14 Hz3.91 Hz10.53 Hz16.90 Hz19.25 Hz
Mode of vibration Energies 12 03696 i001 Energies 12 03696 i002 Energies 12 03696 i003 Energies 12 03696 i004 Energies 12 03696 i005