Microclimate Thermal Management Using Thermoelectric Air-Cooling Duct System Operated at Five Incremental Powers and its Effect on Sleep Adaptation of the Occupants

 ,
,
Abstract

1. Introduction
2. Methodology
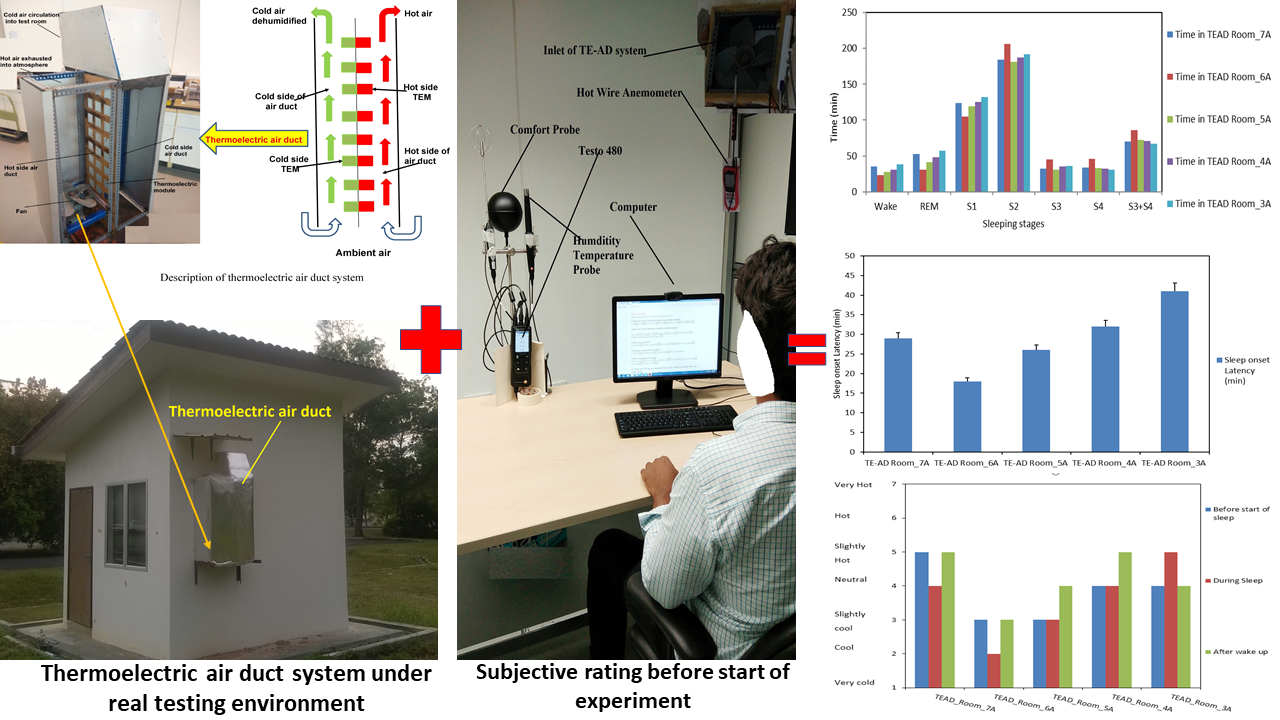
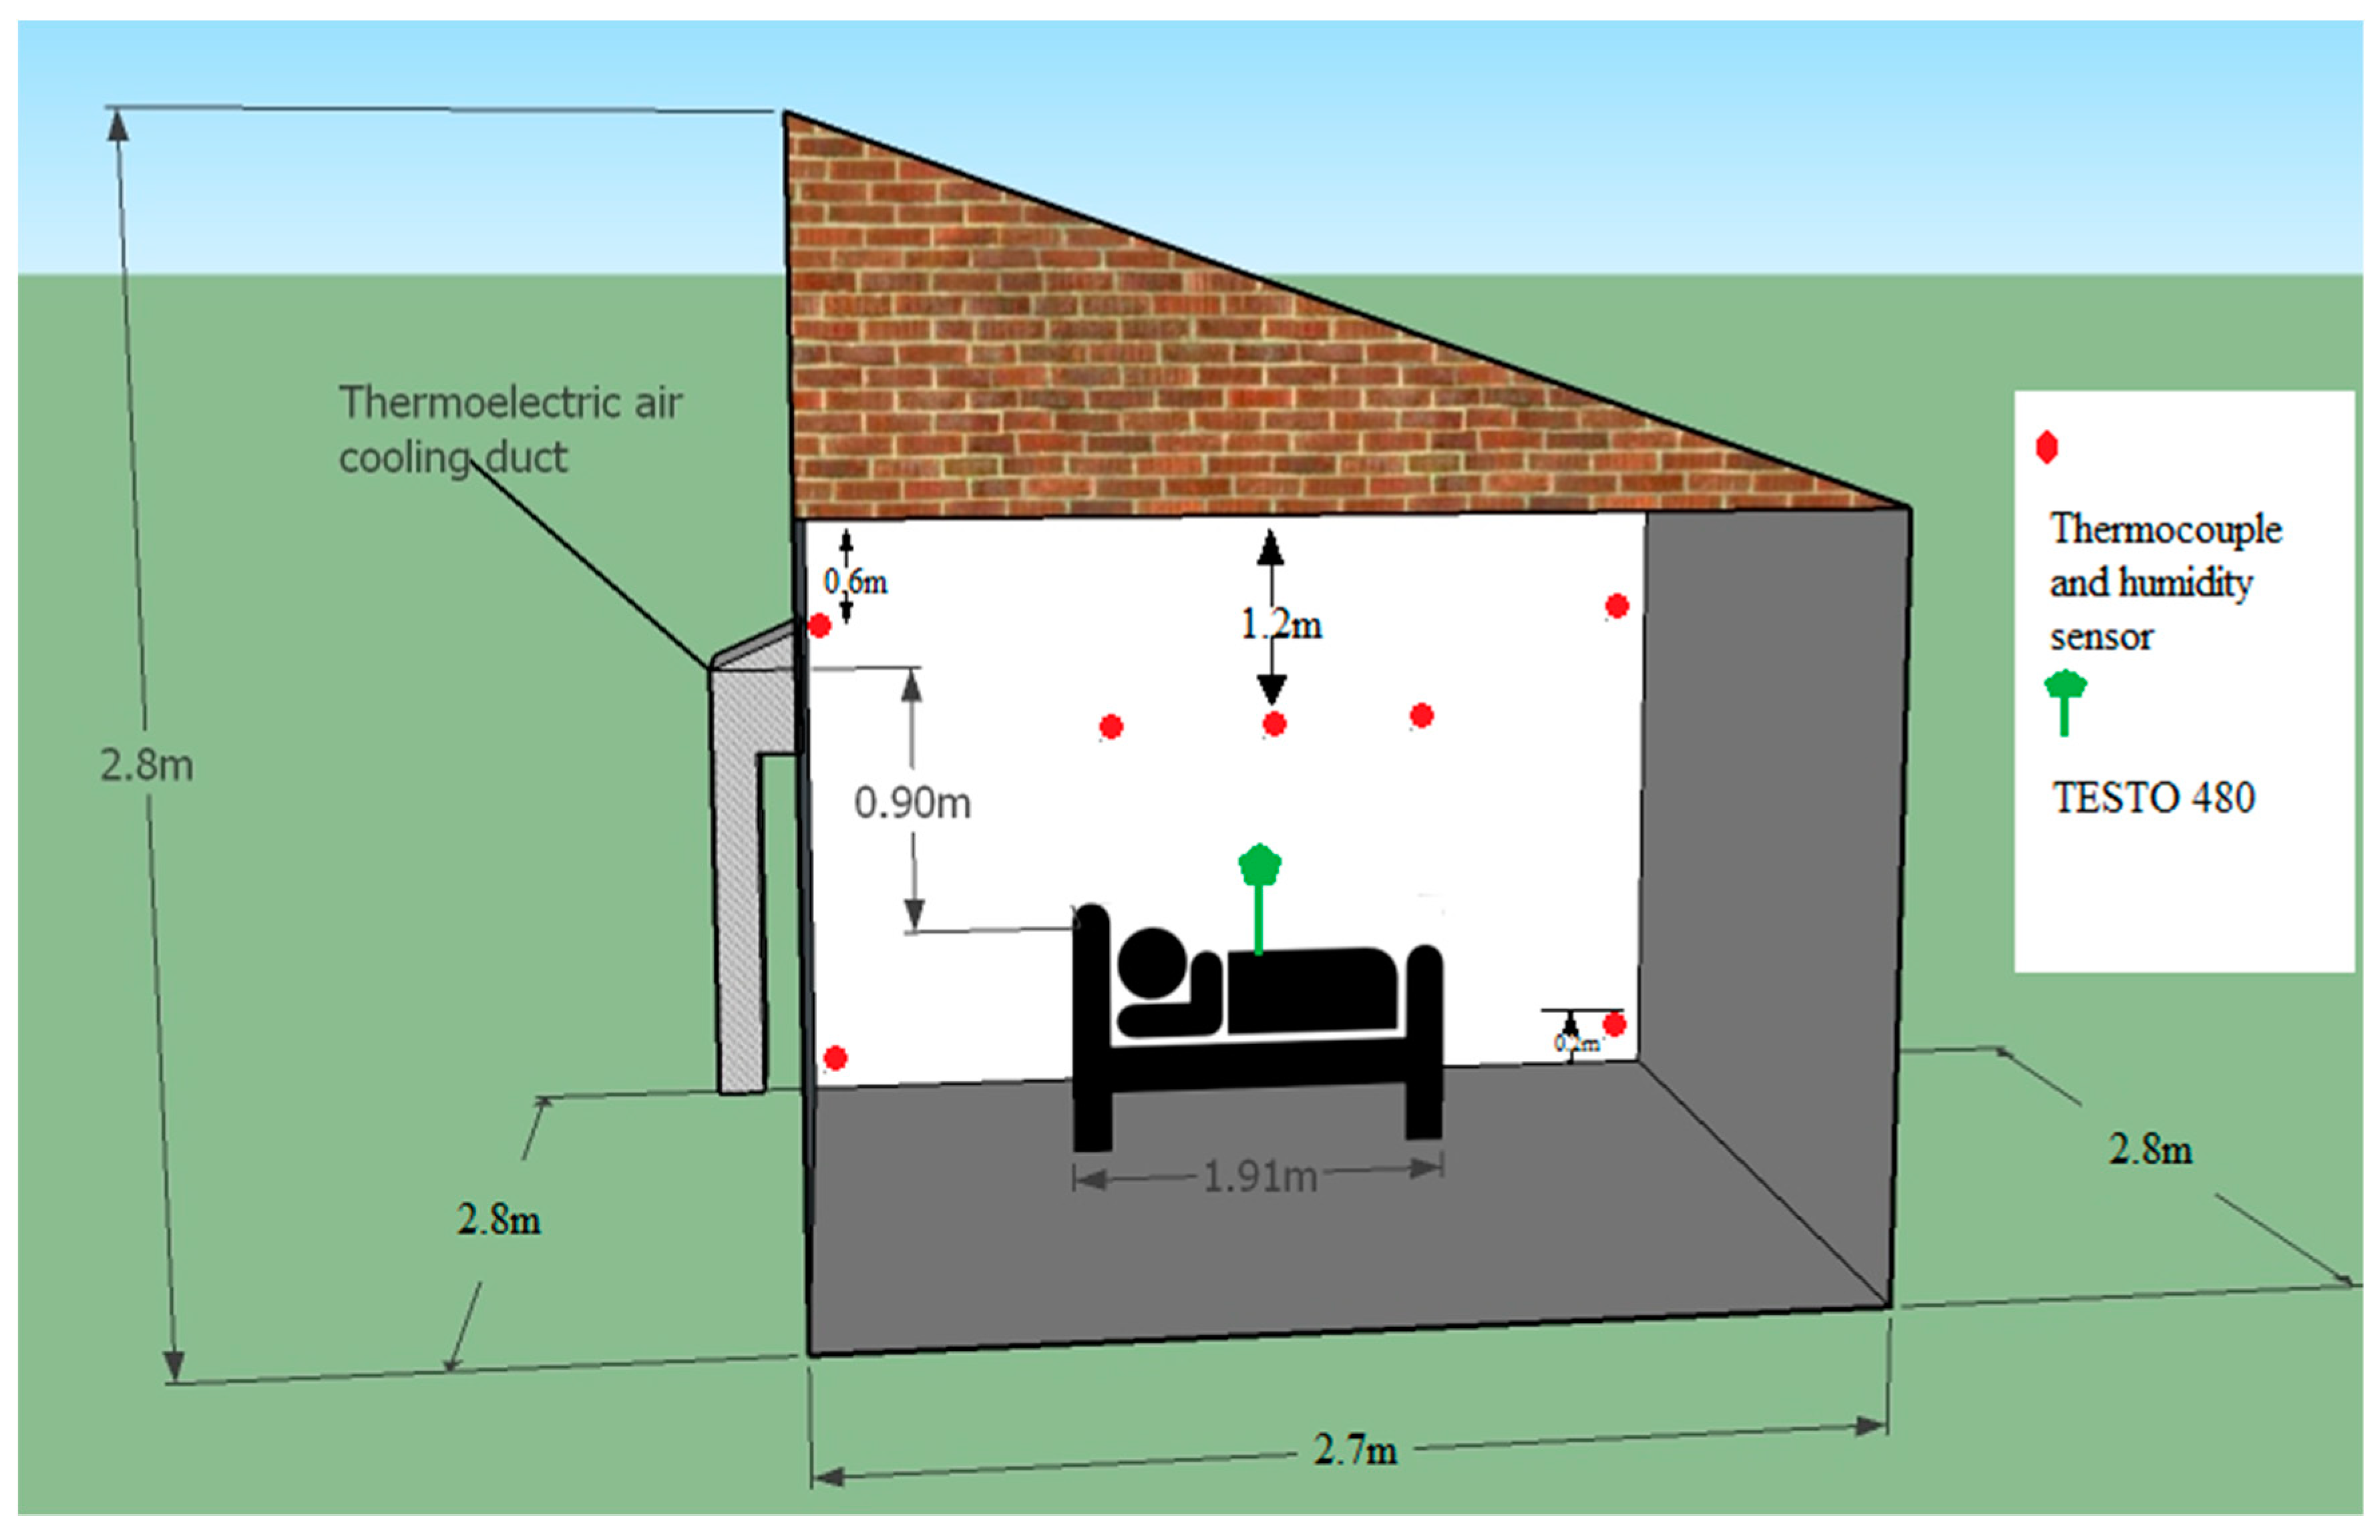
2.1. Test Chamber
2.2. Description of Occupants
2.3. Description of Occupants
2.4. Sleep Assessment
2.4.1. Sleeping Quality
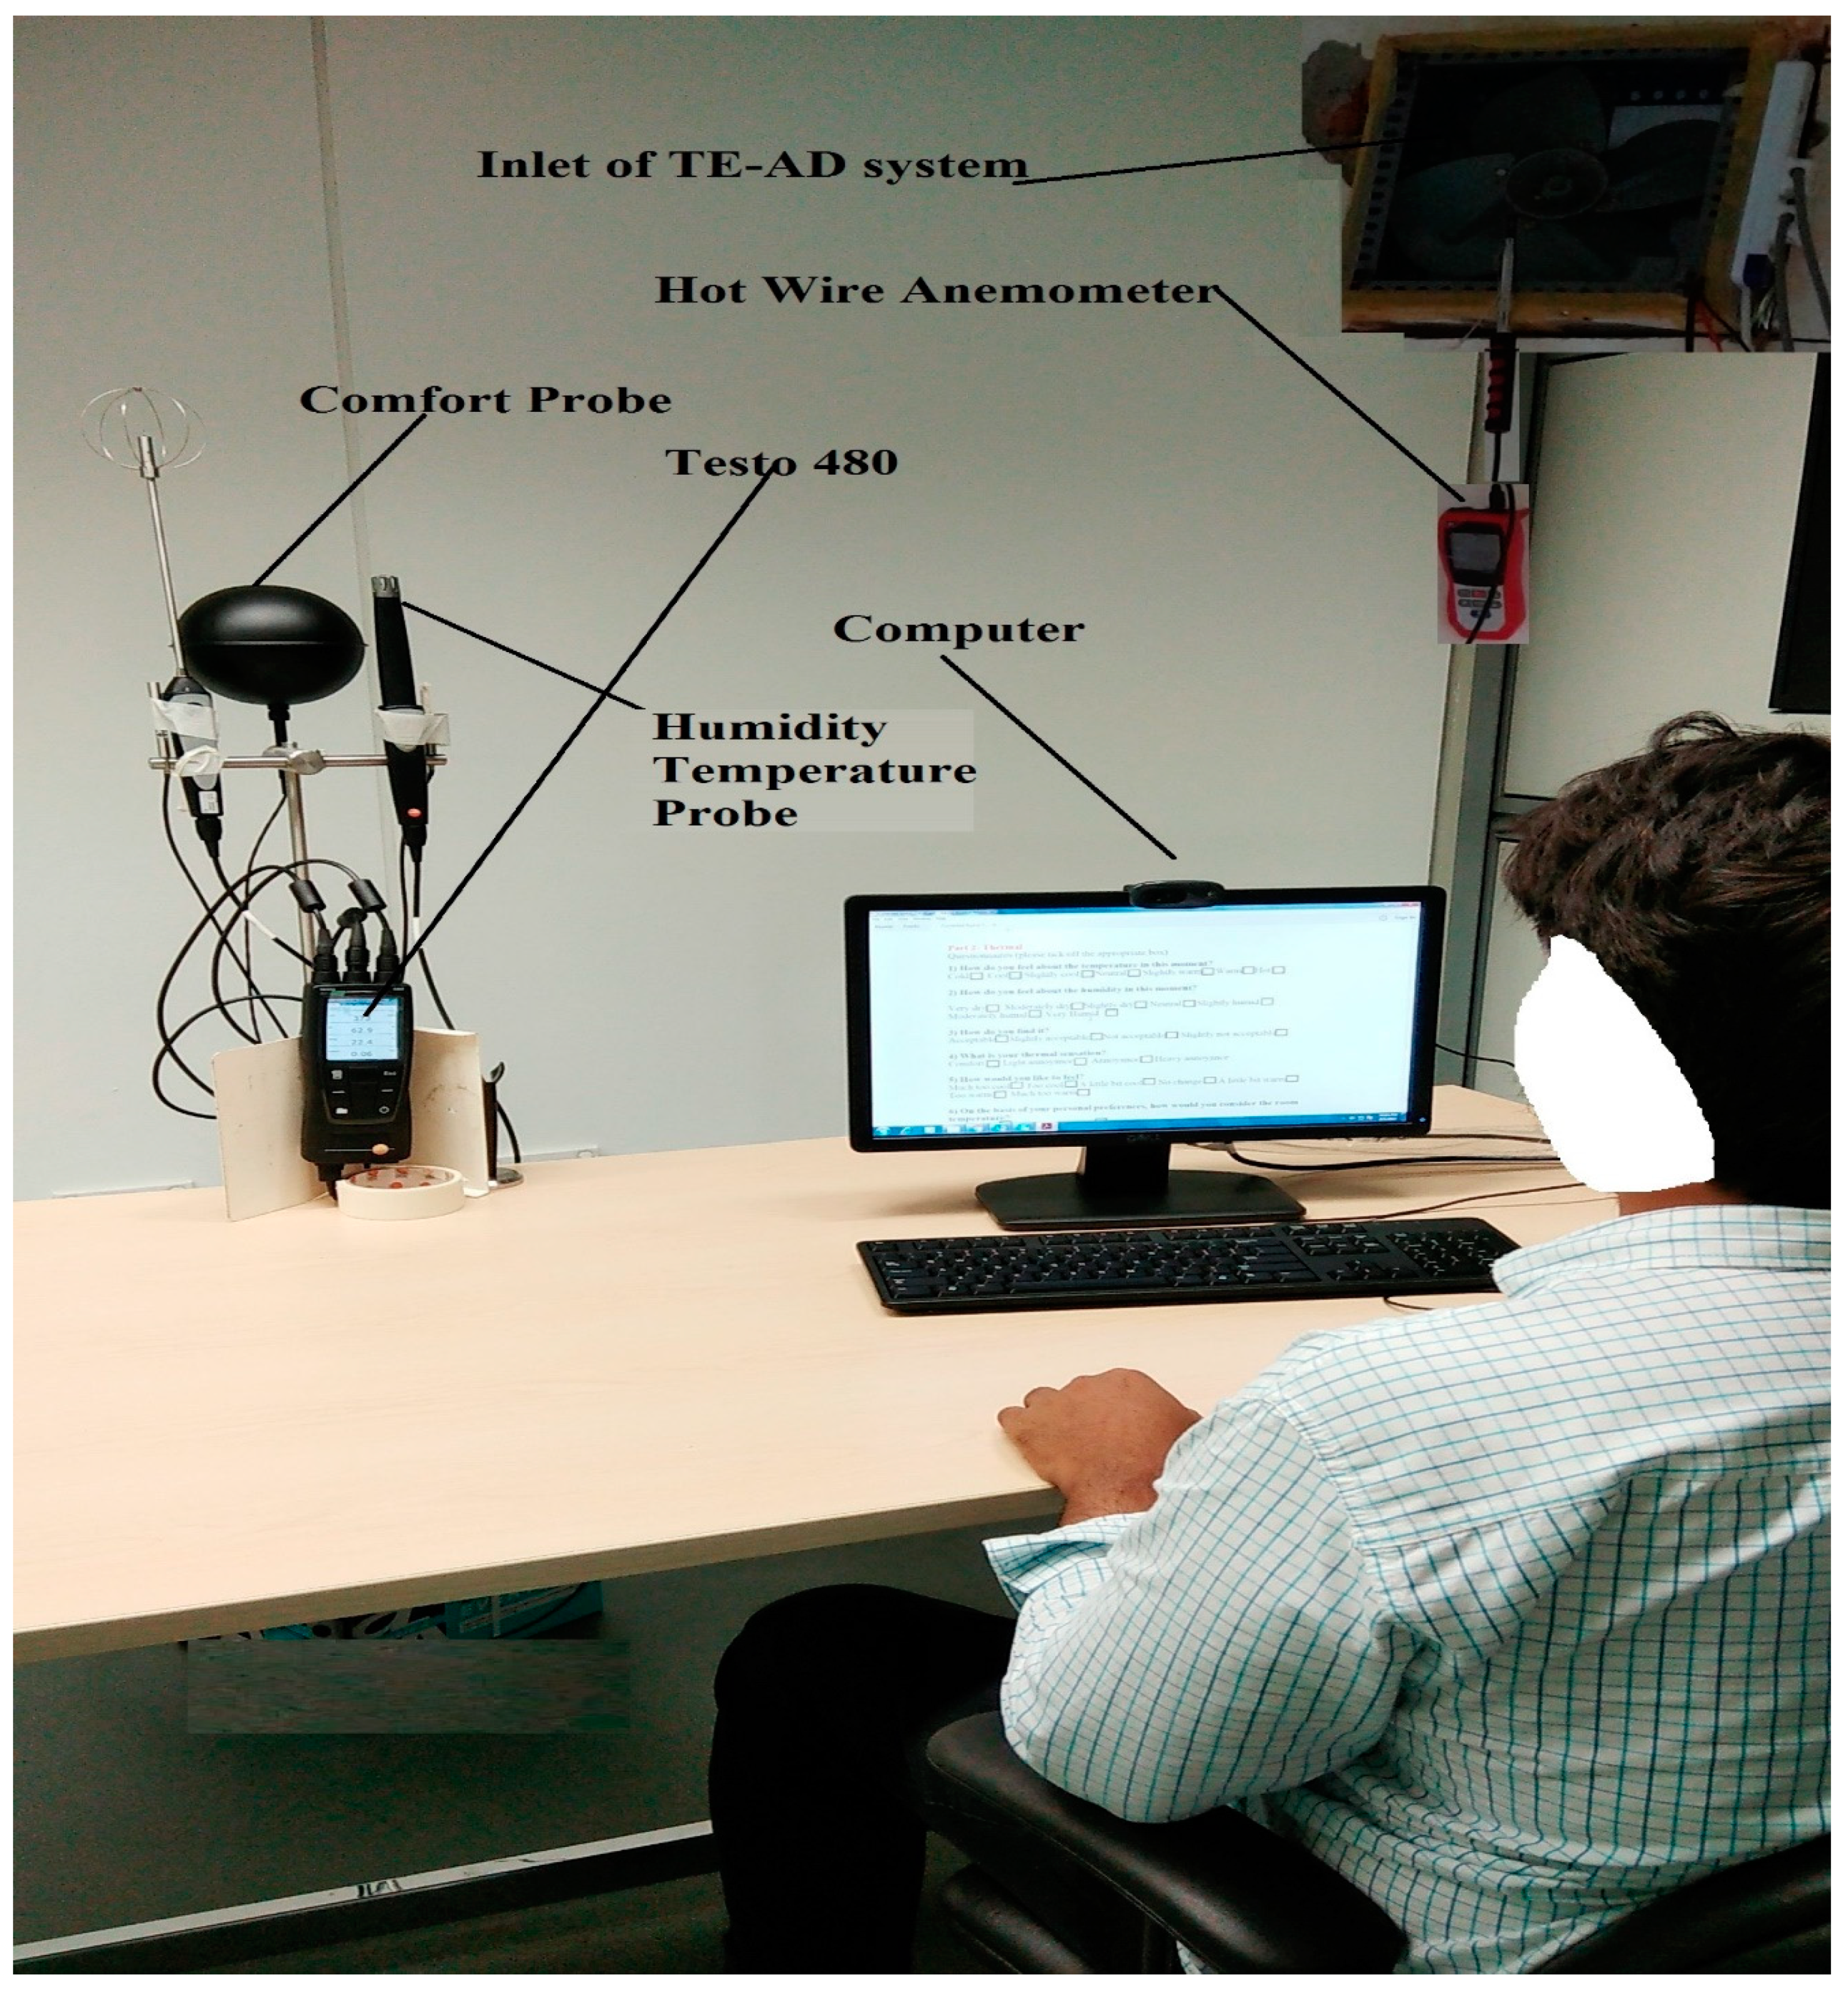
2.4.2. Thermal Environment During Sleeping
2.5. Adaptive Model
2.6. Data Analysis
2.7. Experimental Procedure
3. Results
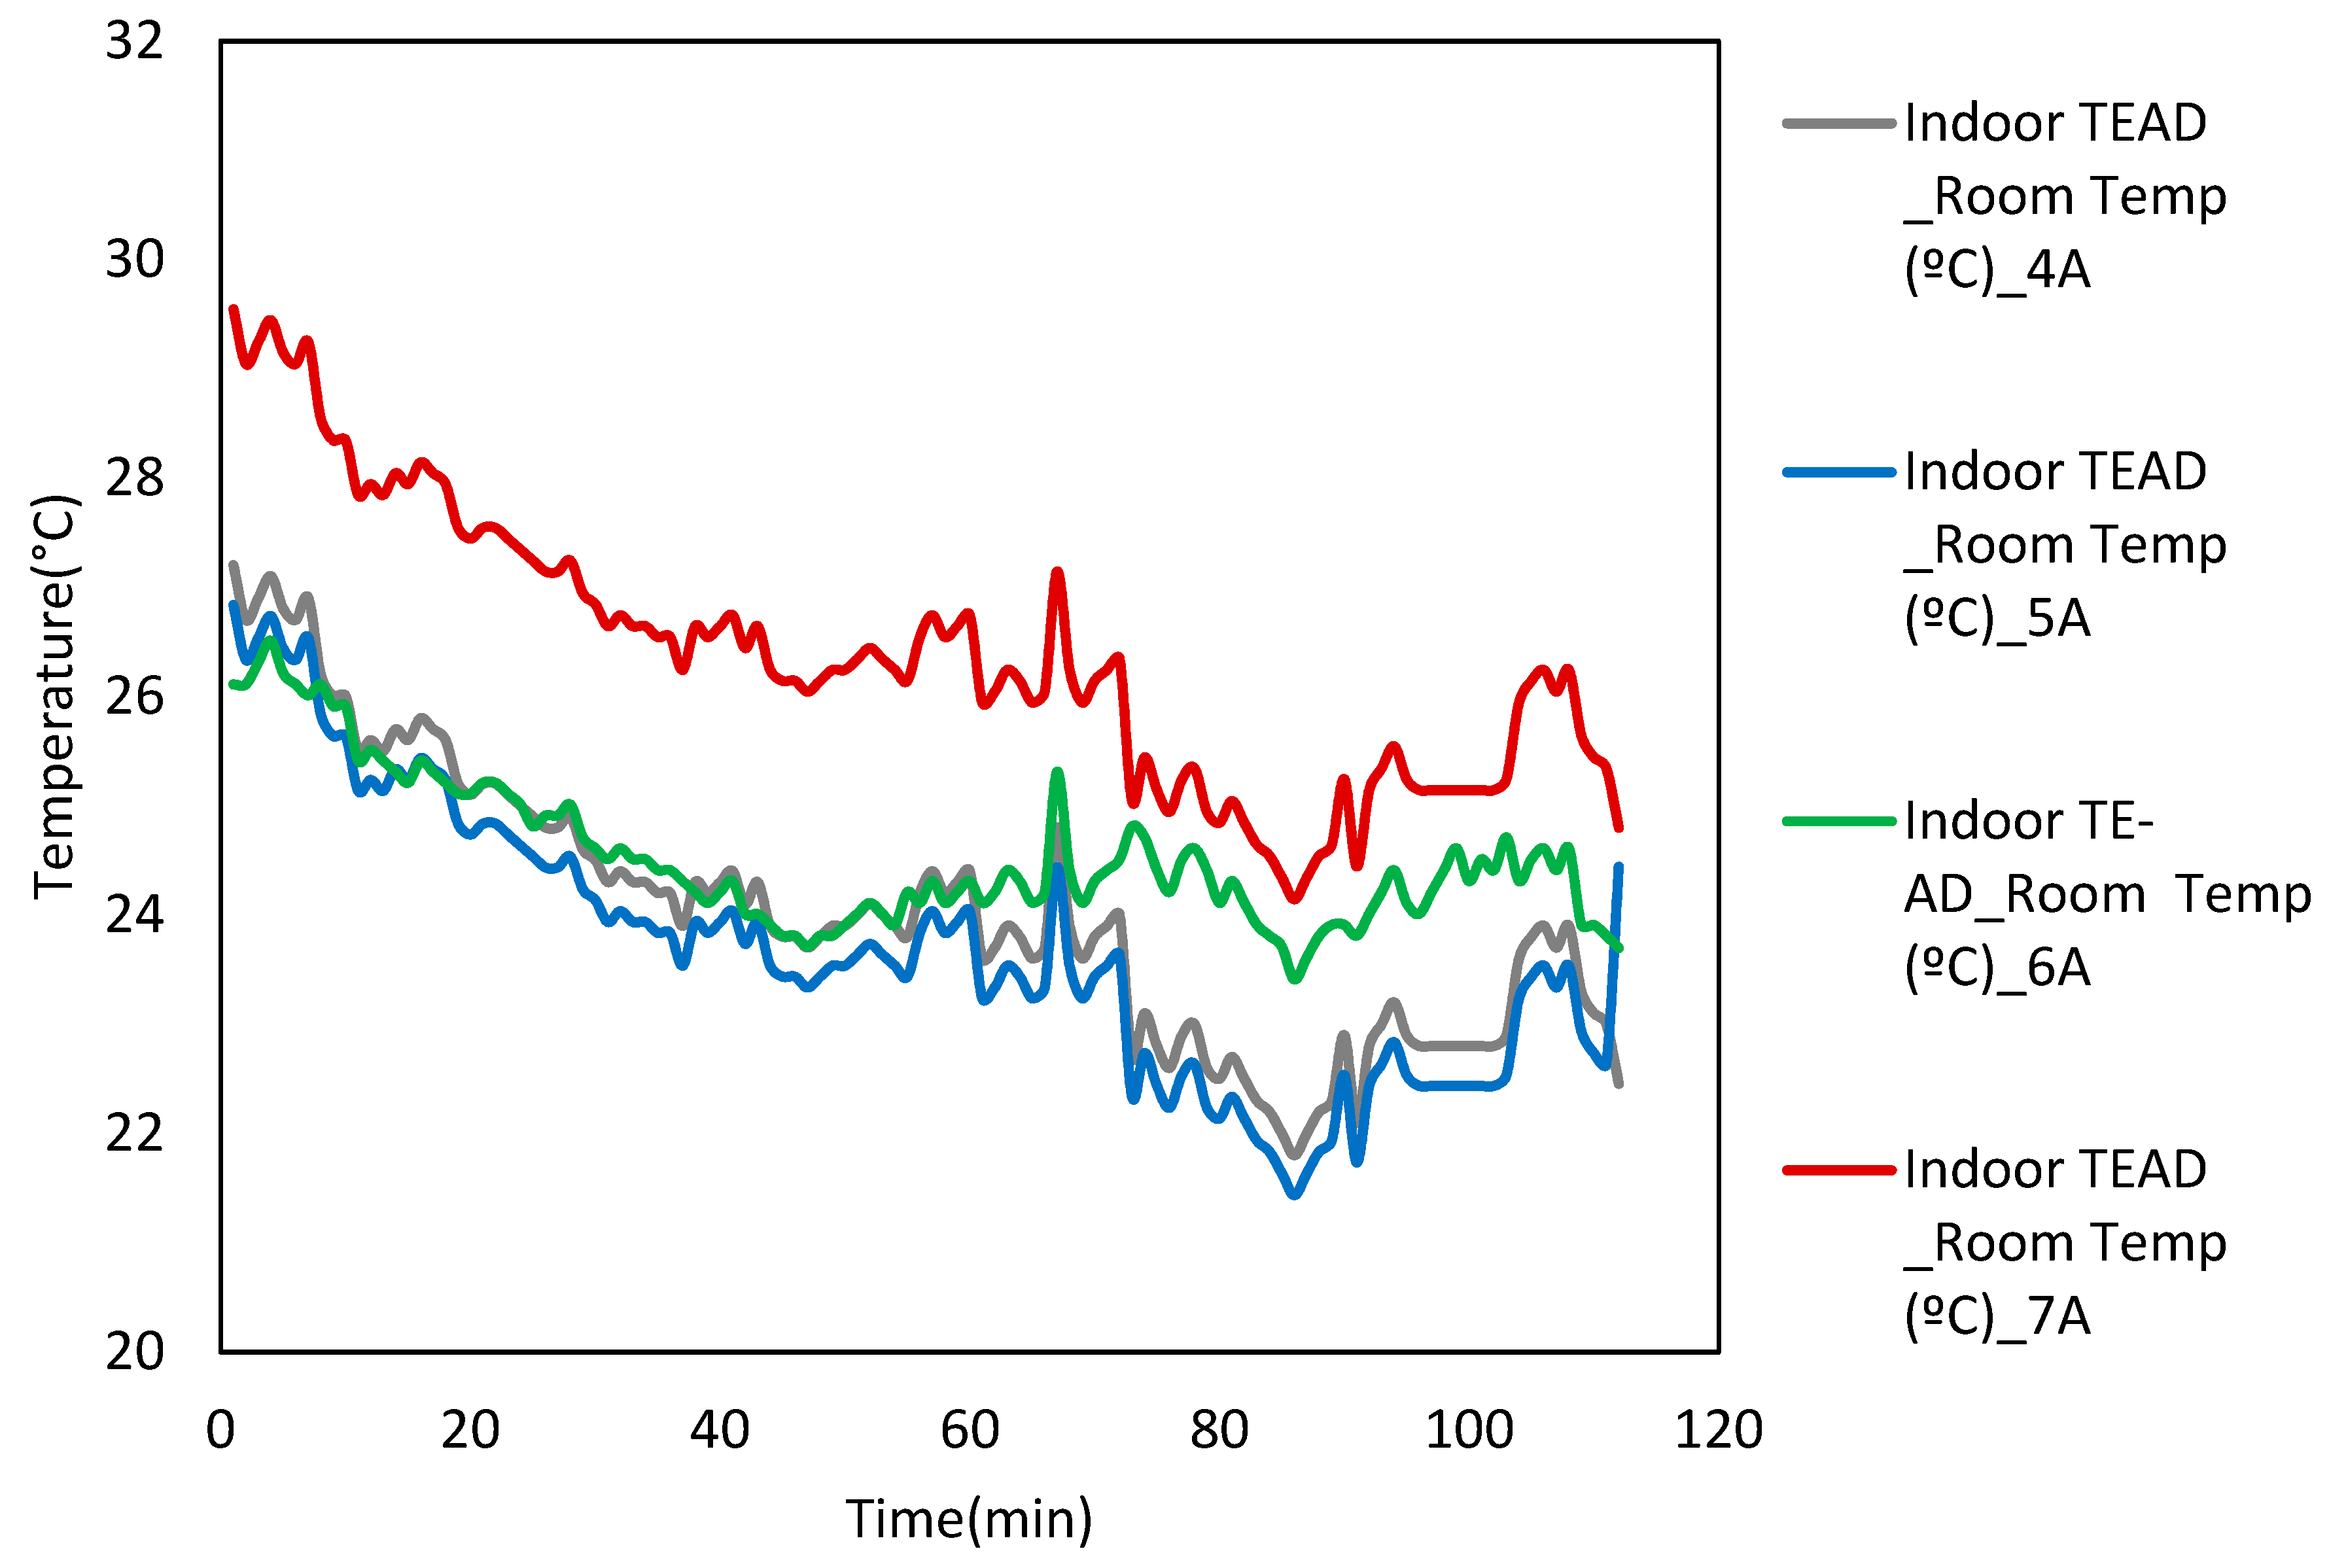
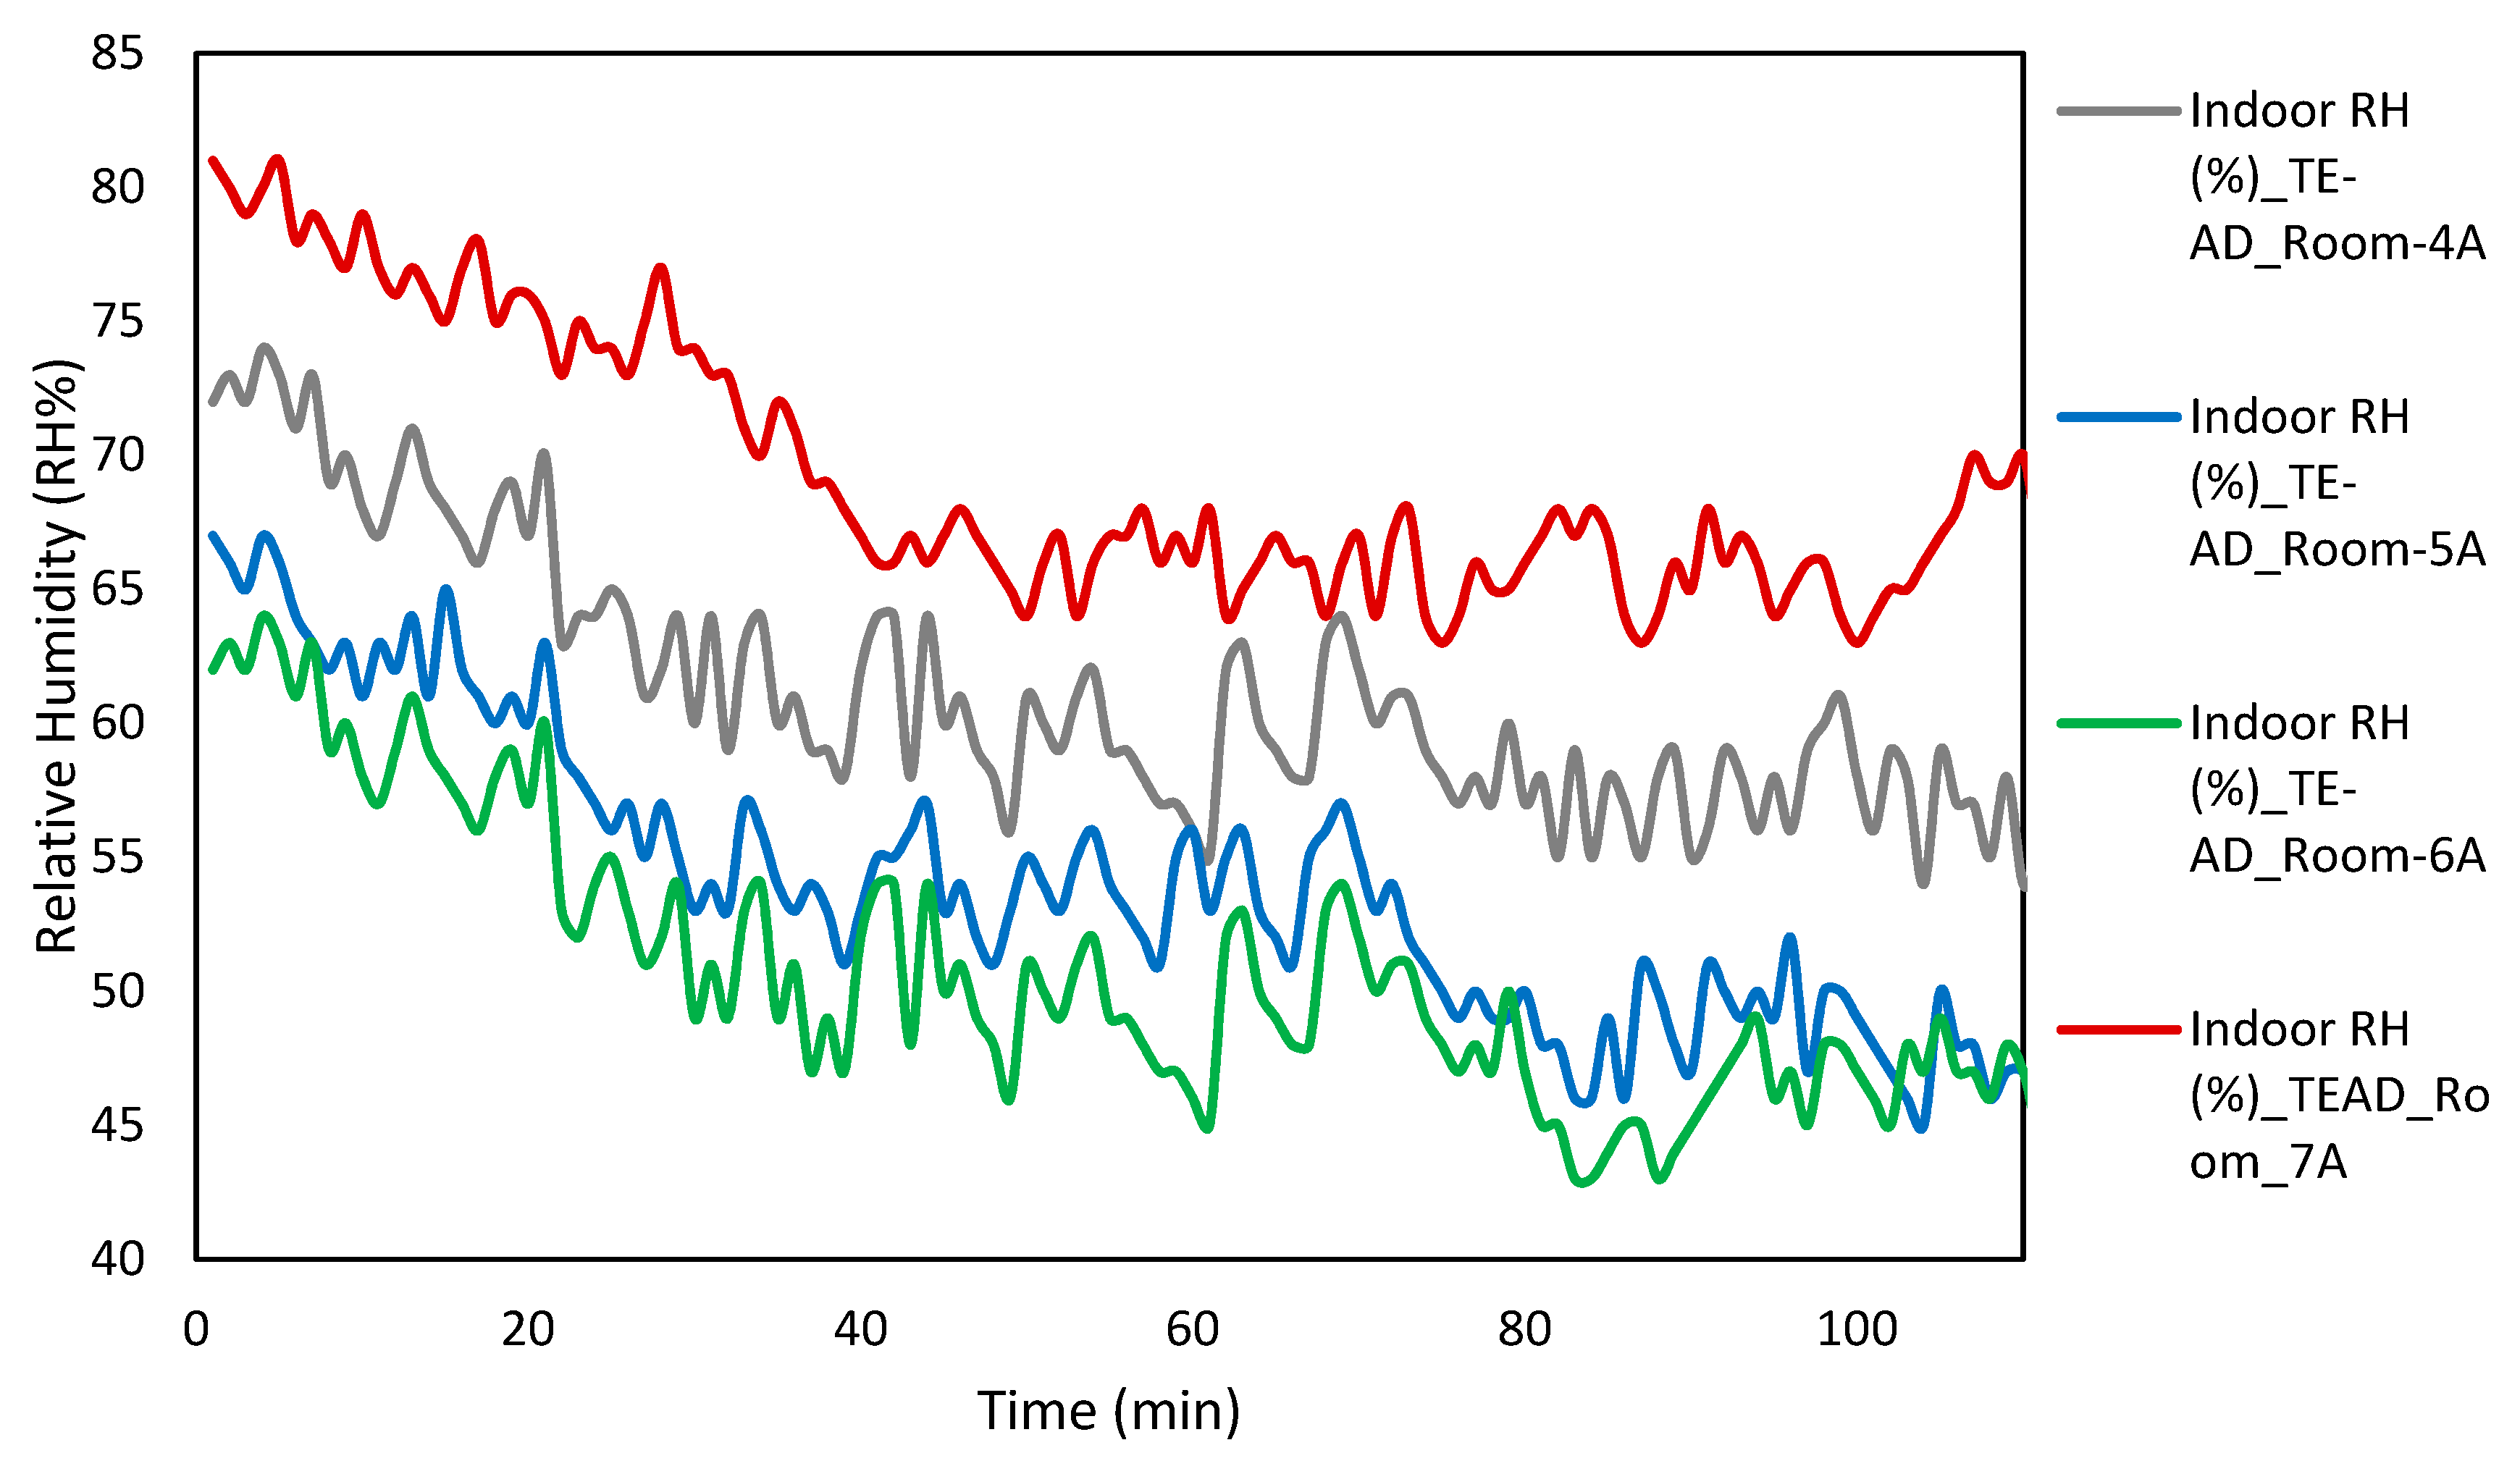
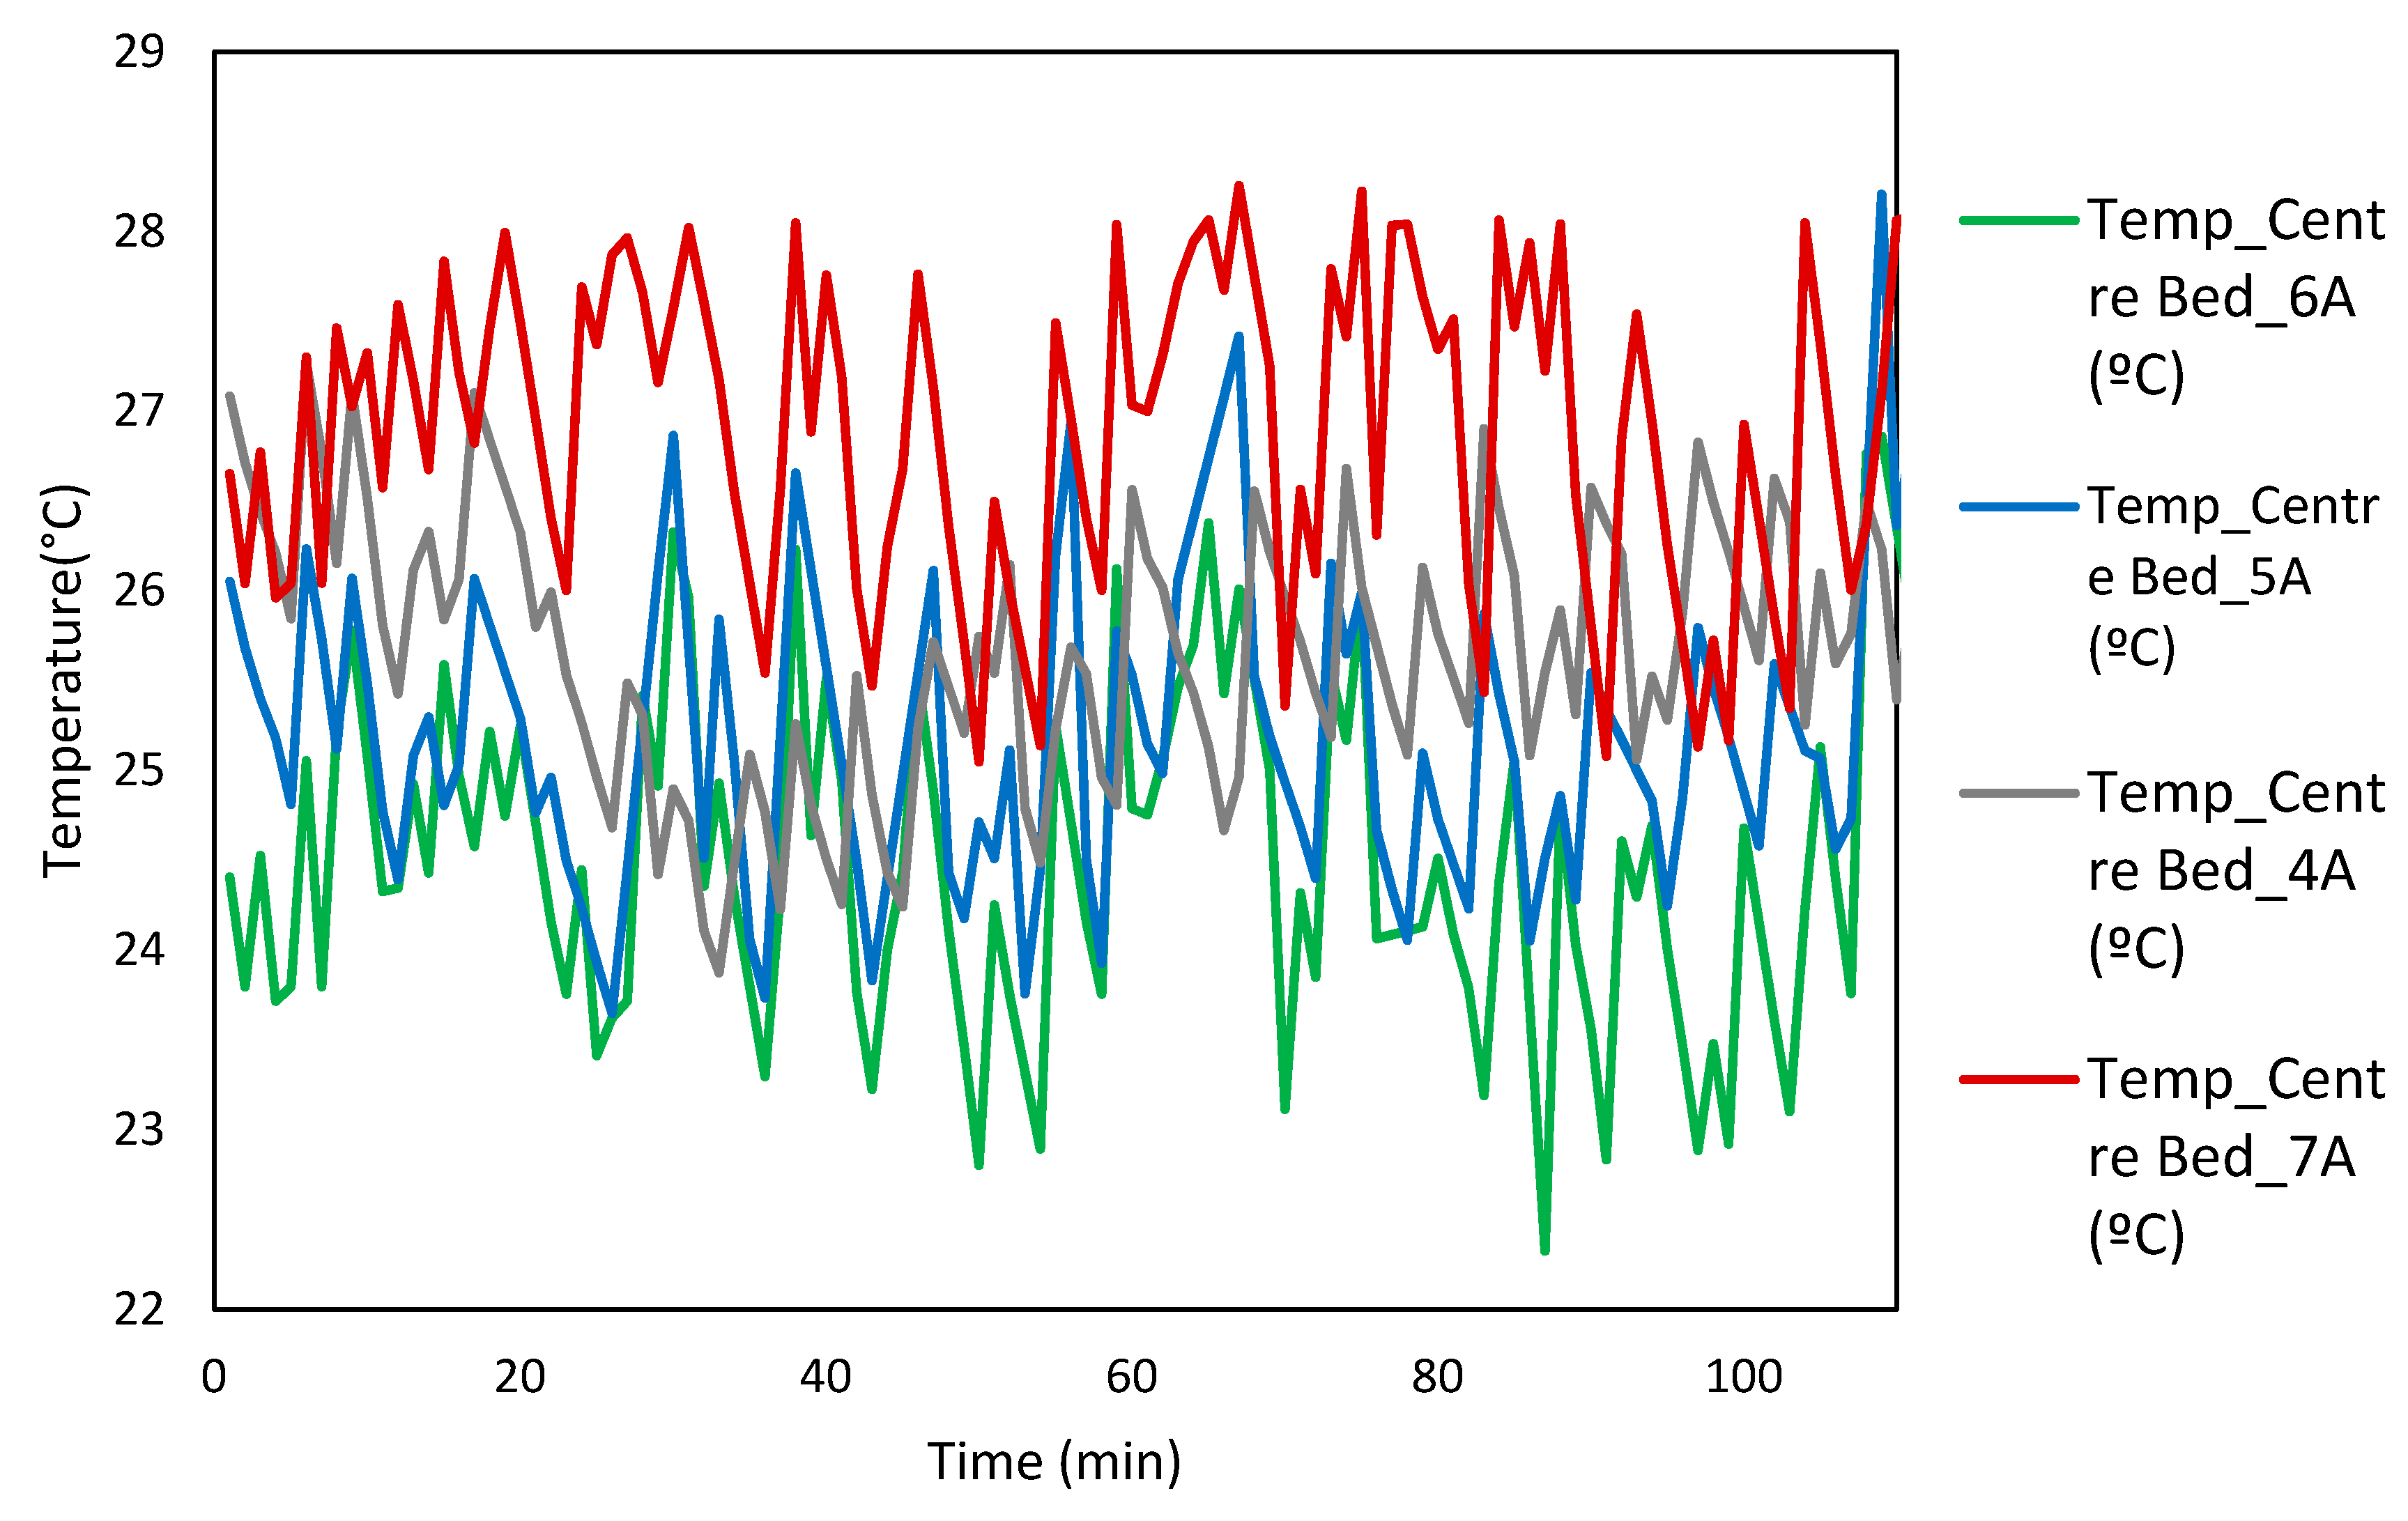
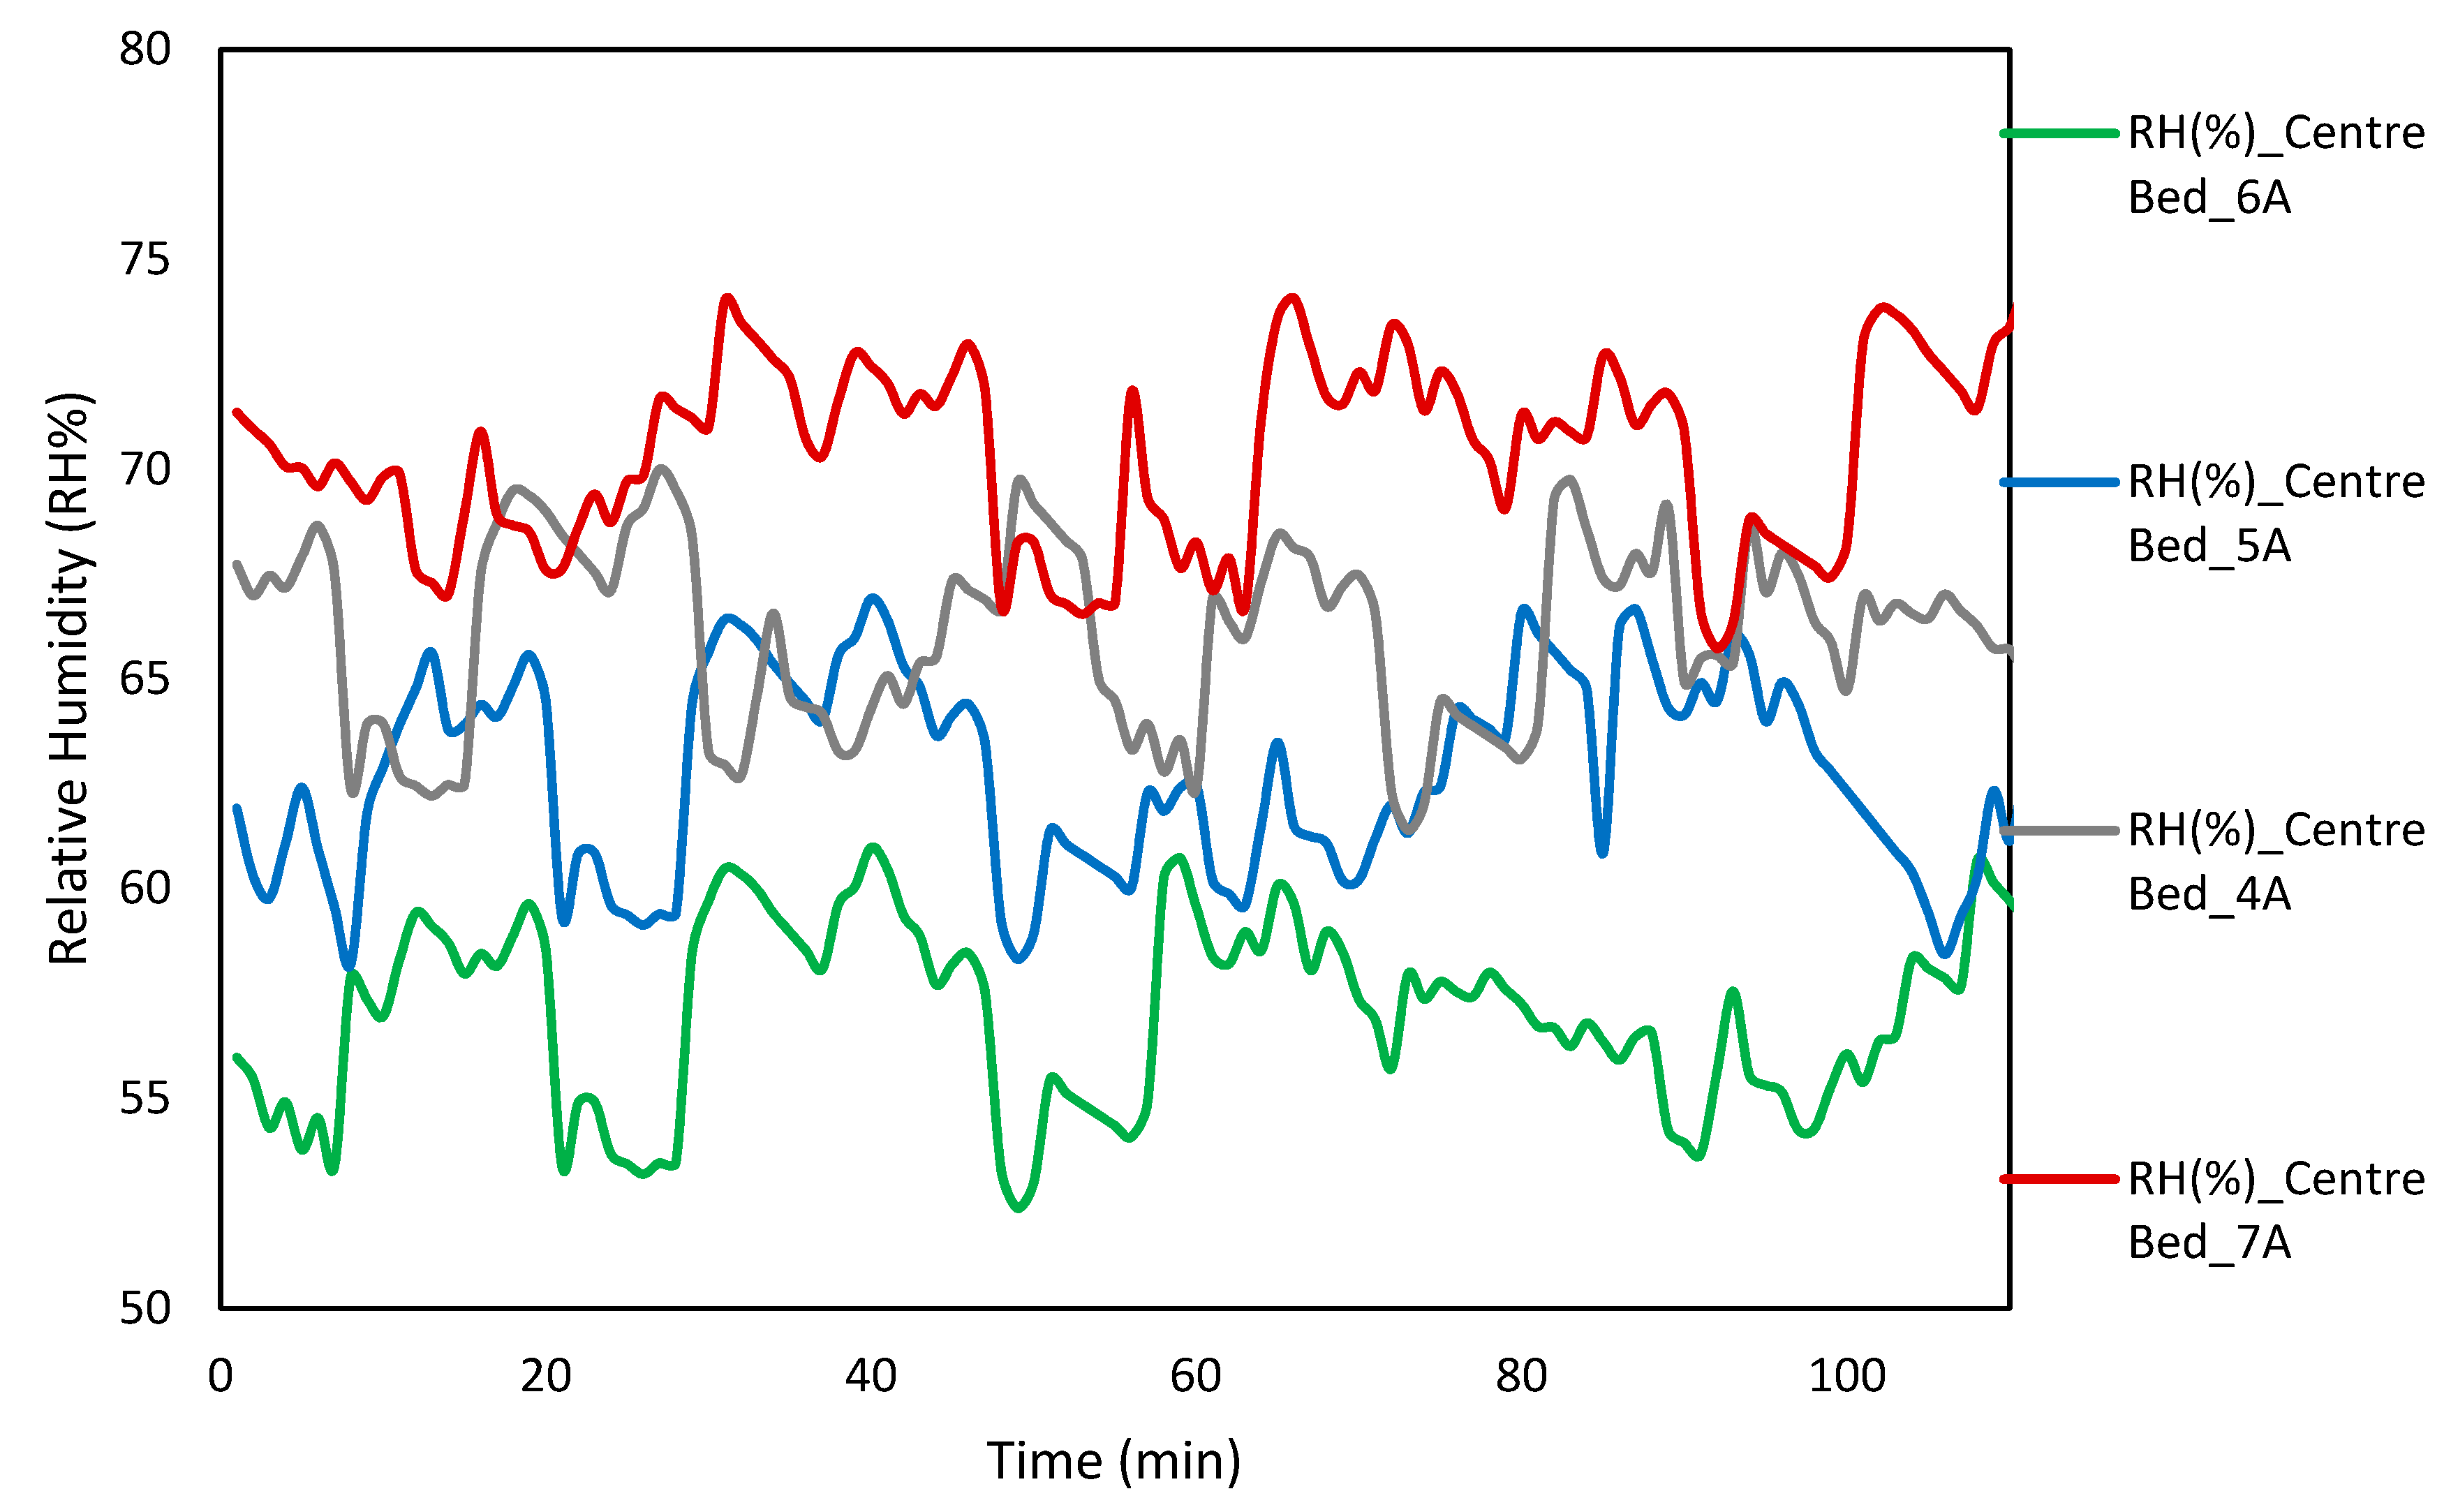
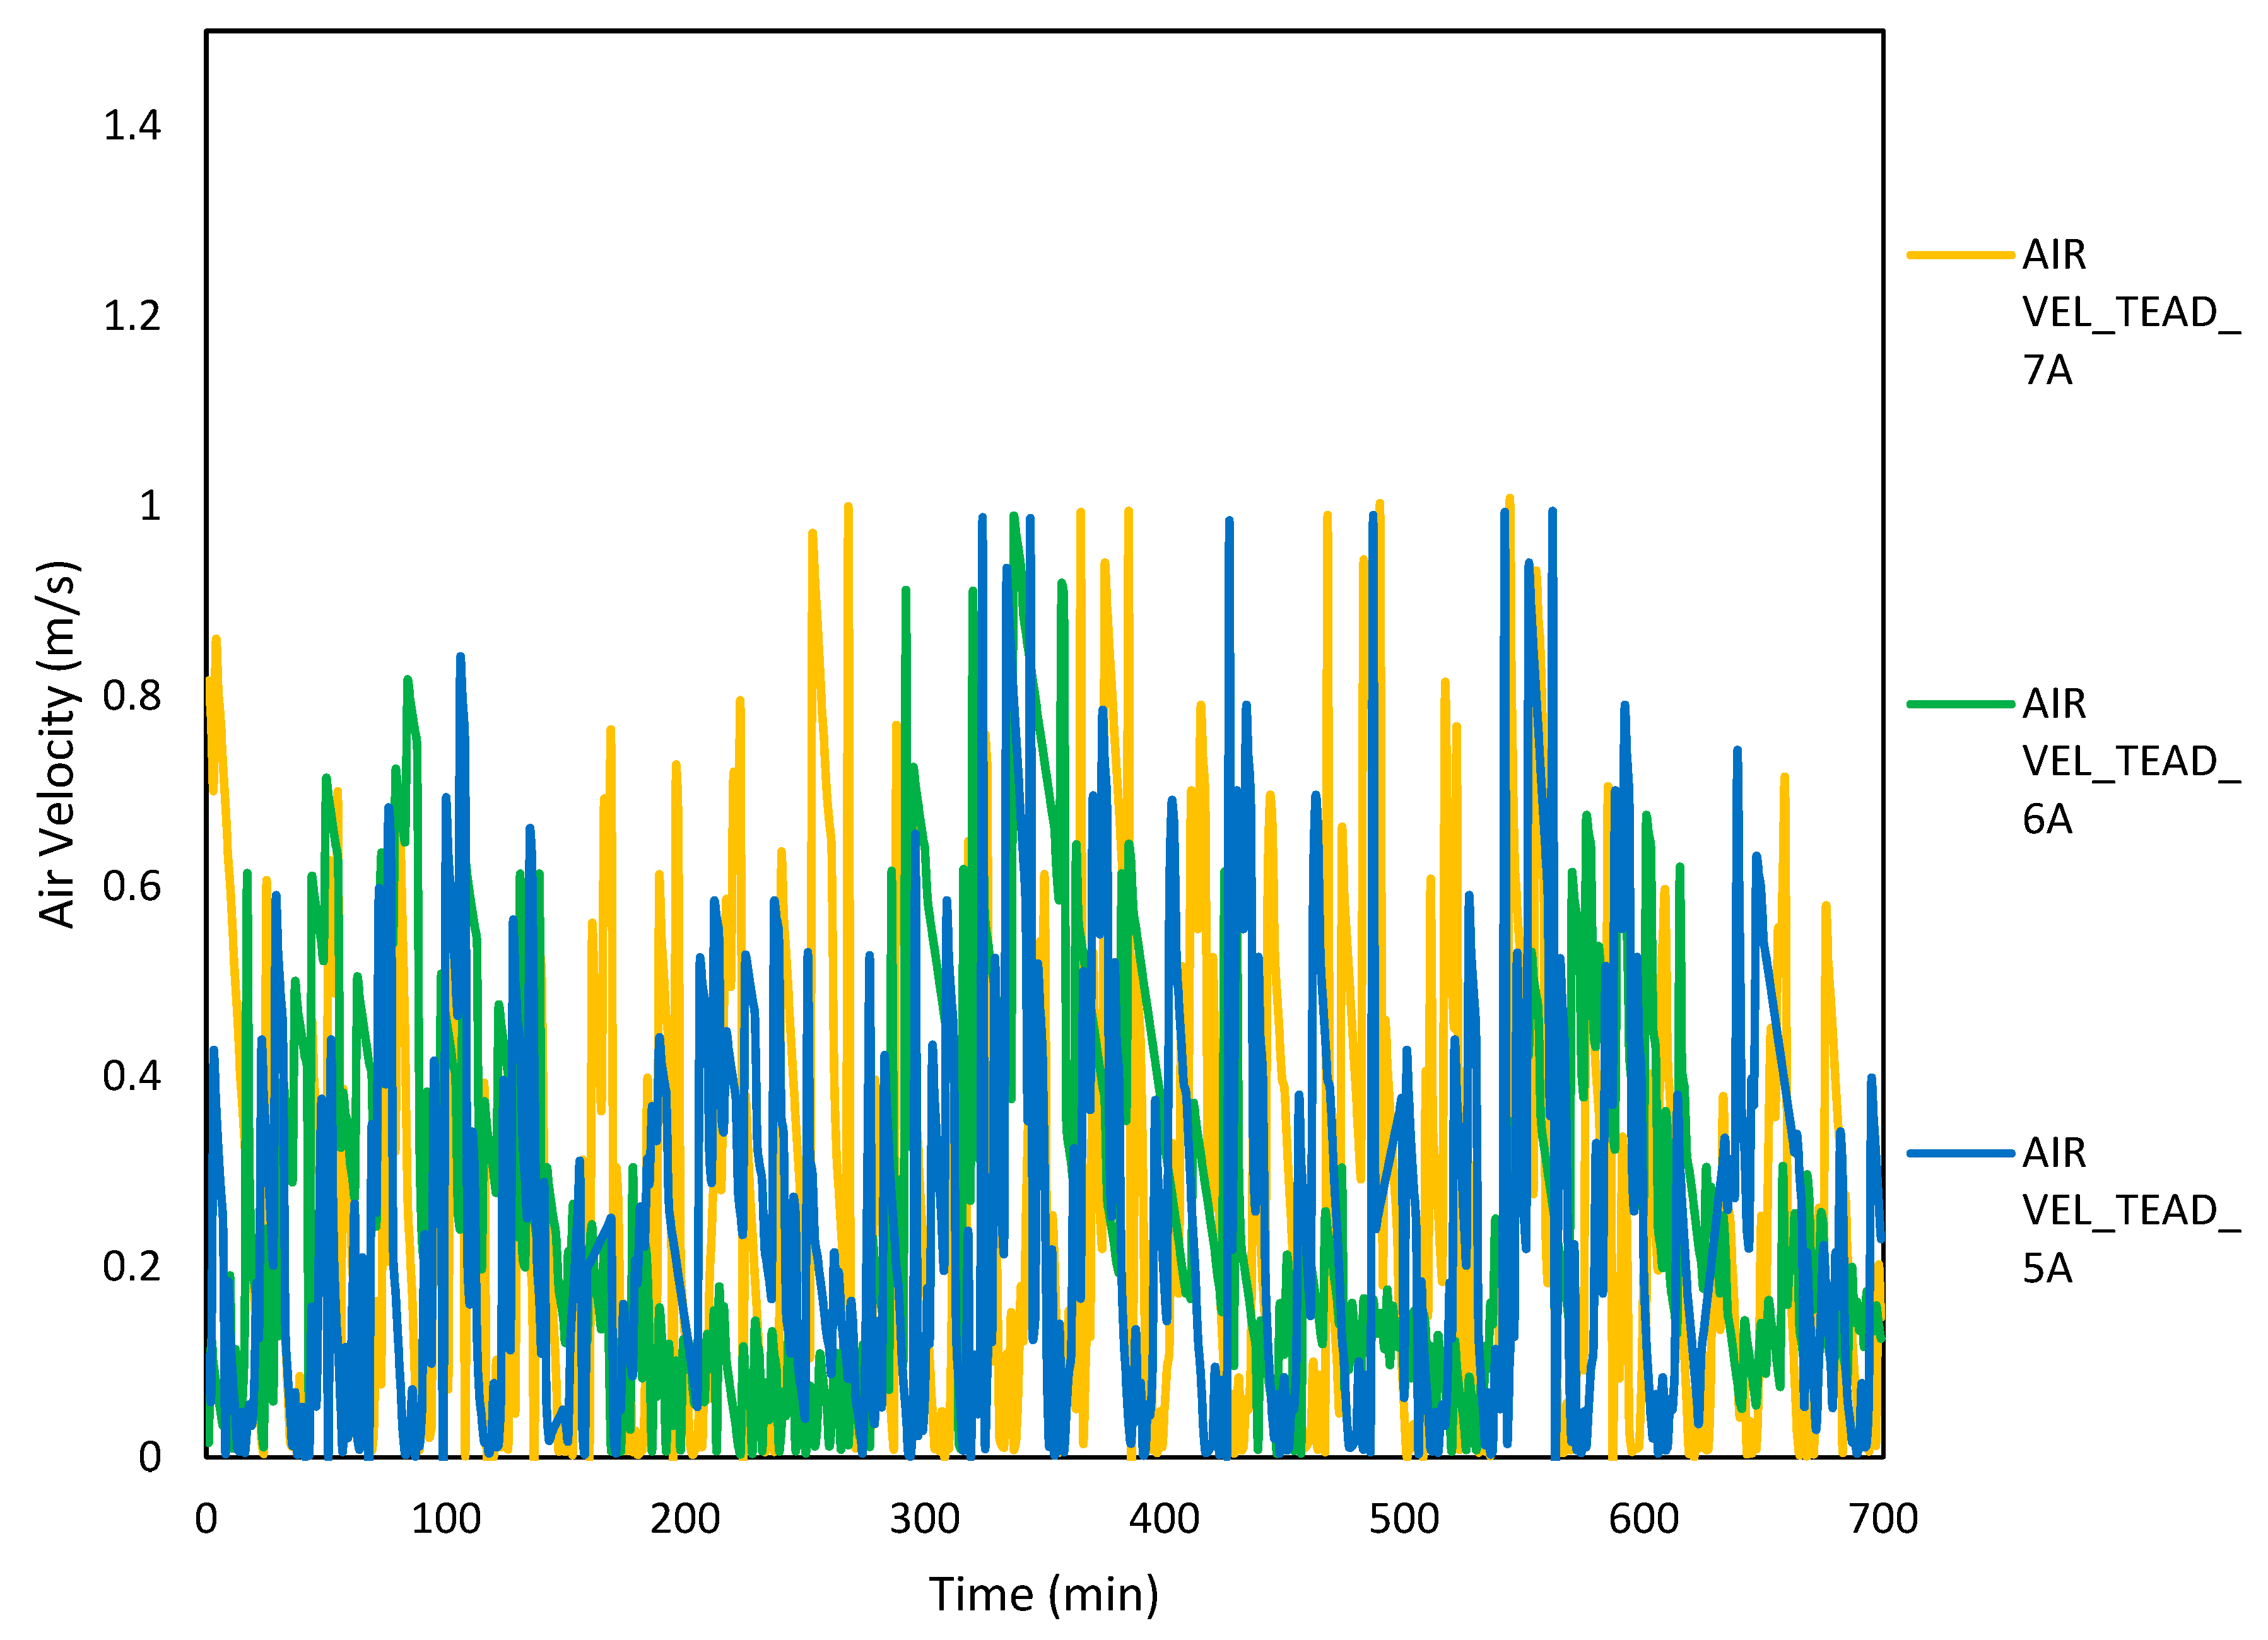
3.1. Effect on Indoor Climatic Conditions
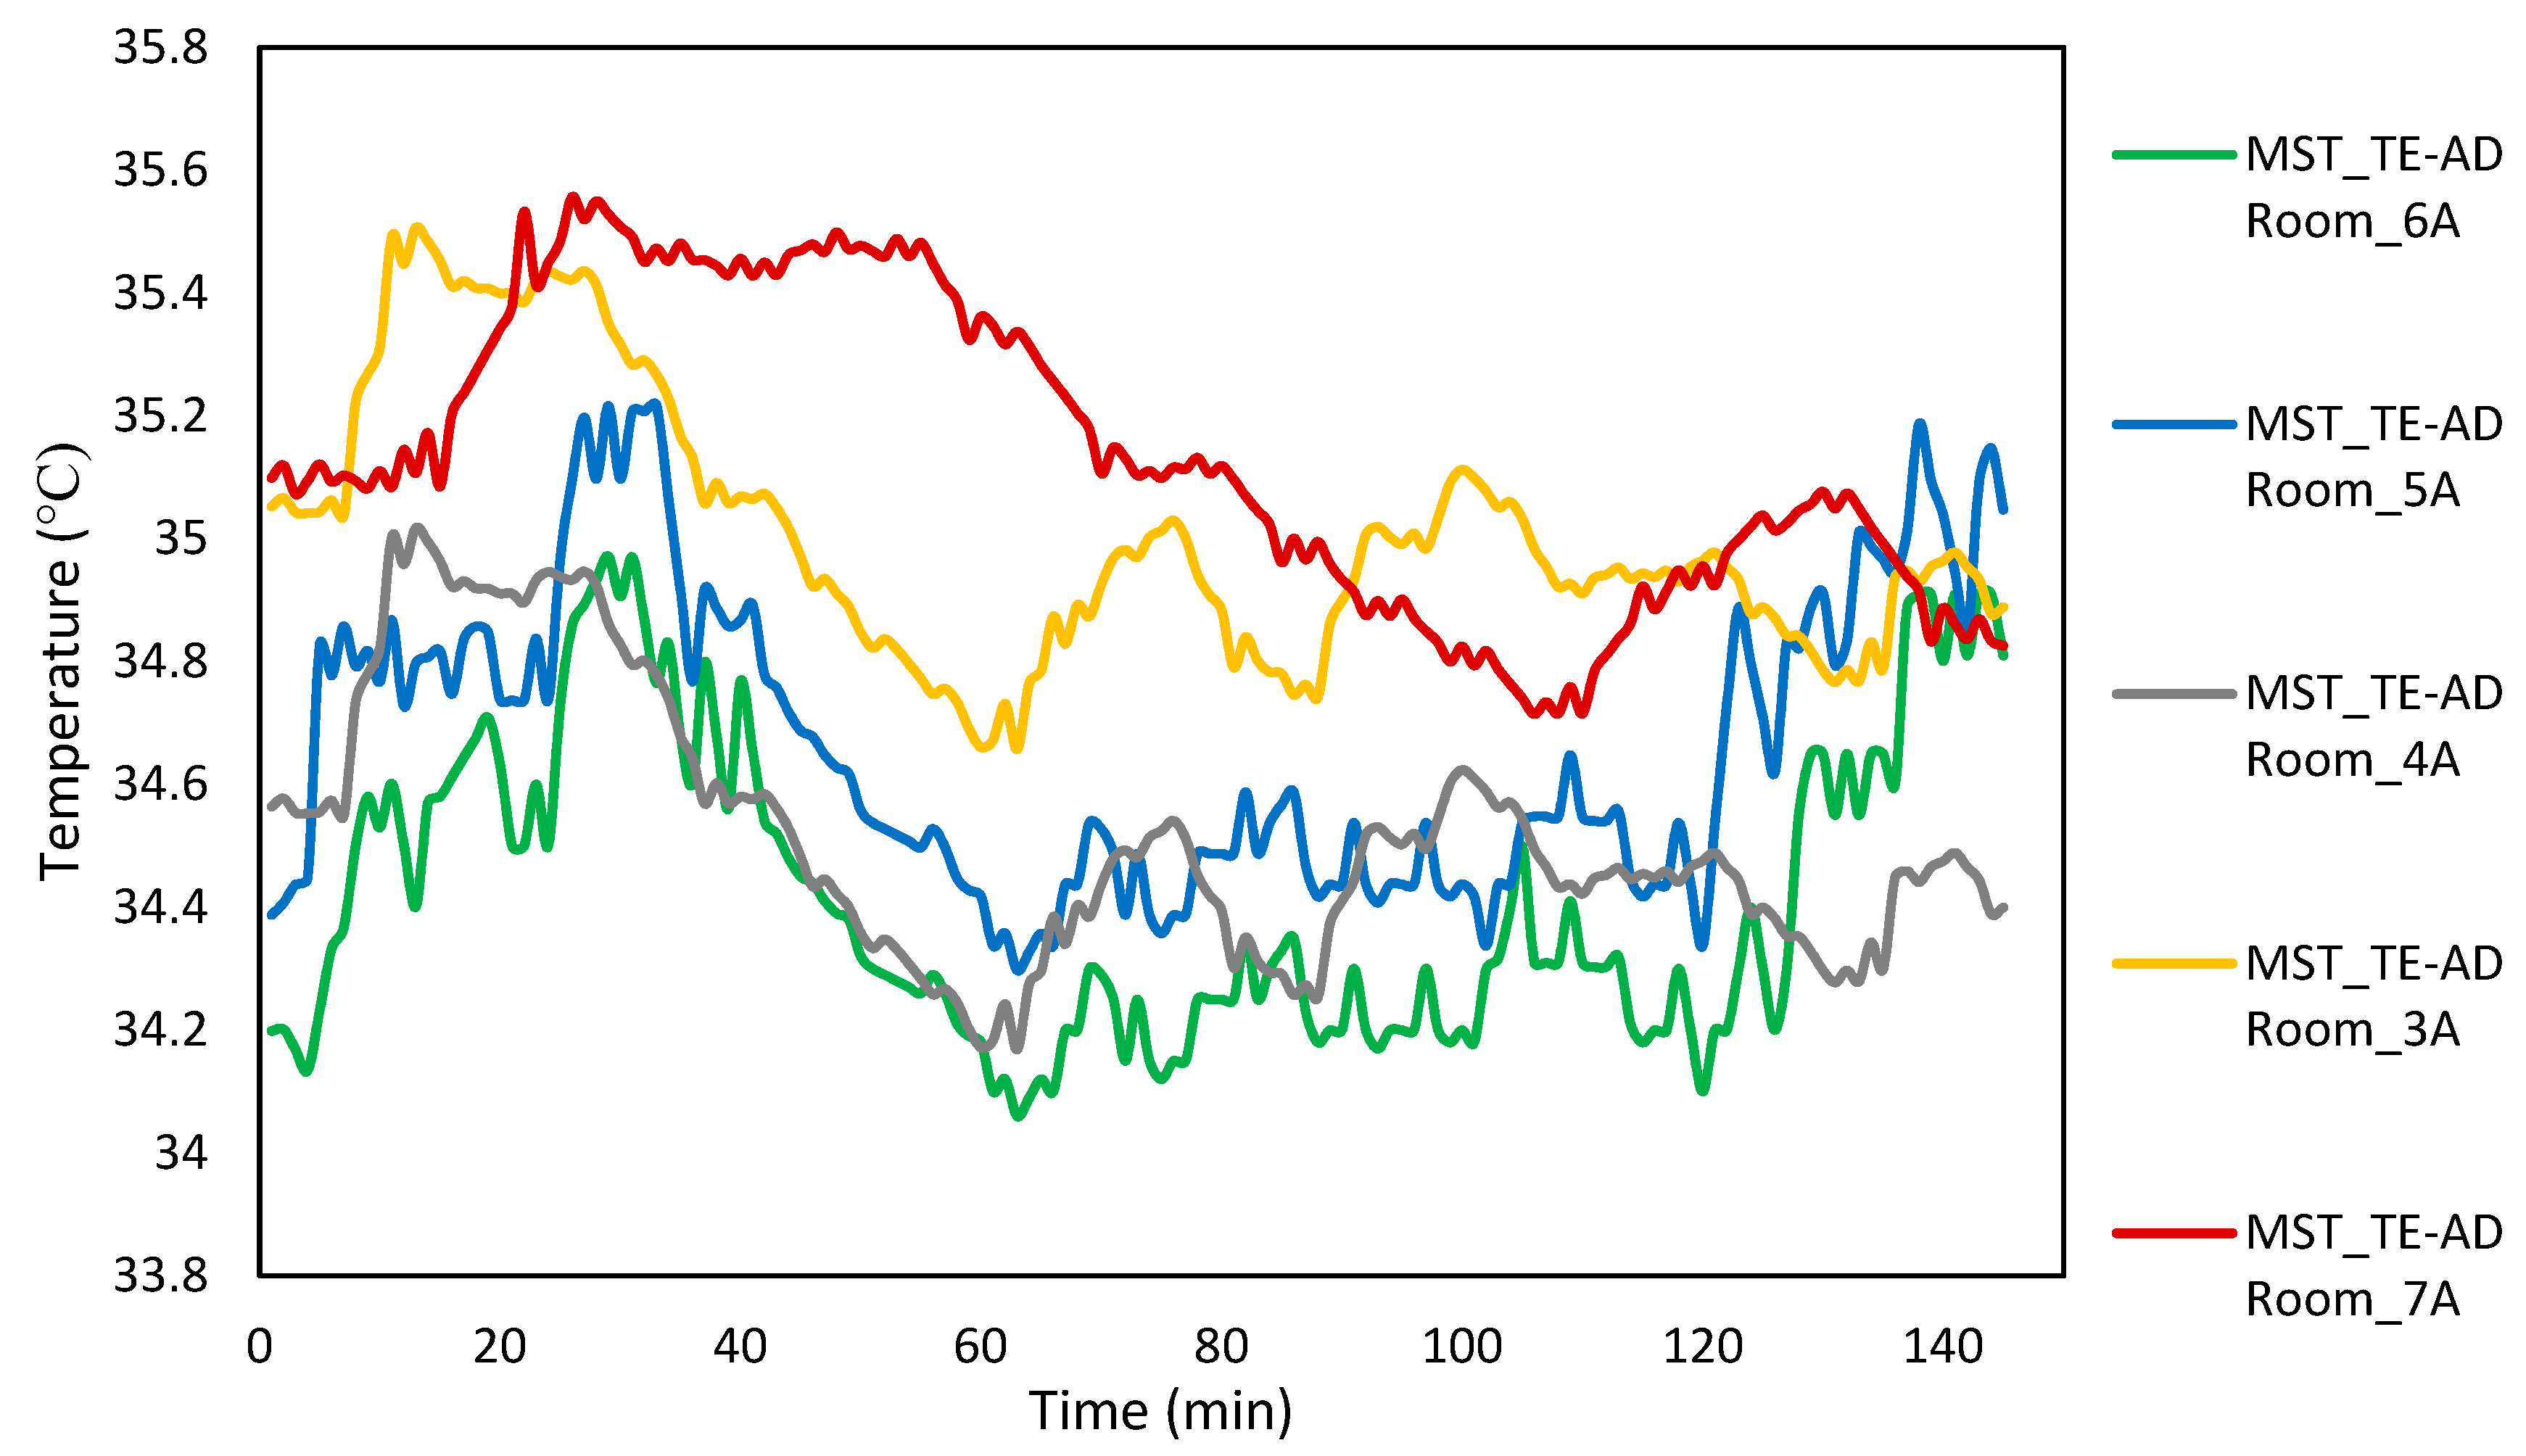
3.2. Mean Skin Temperature
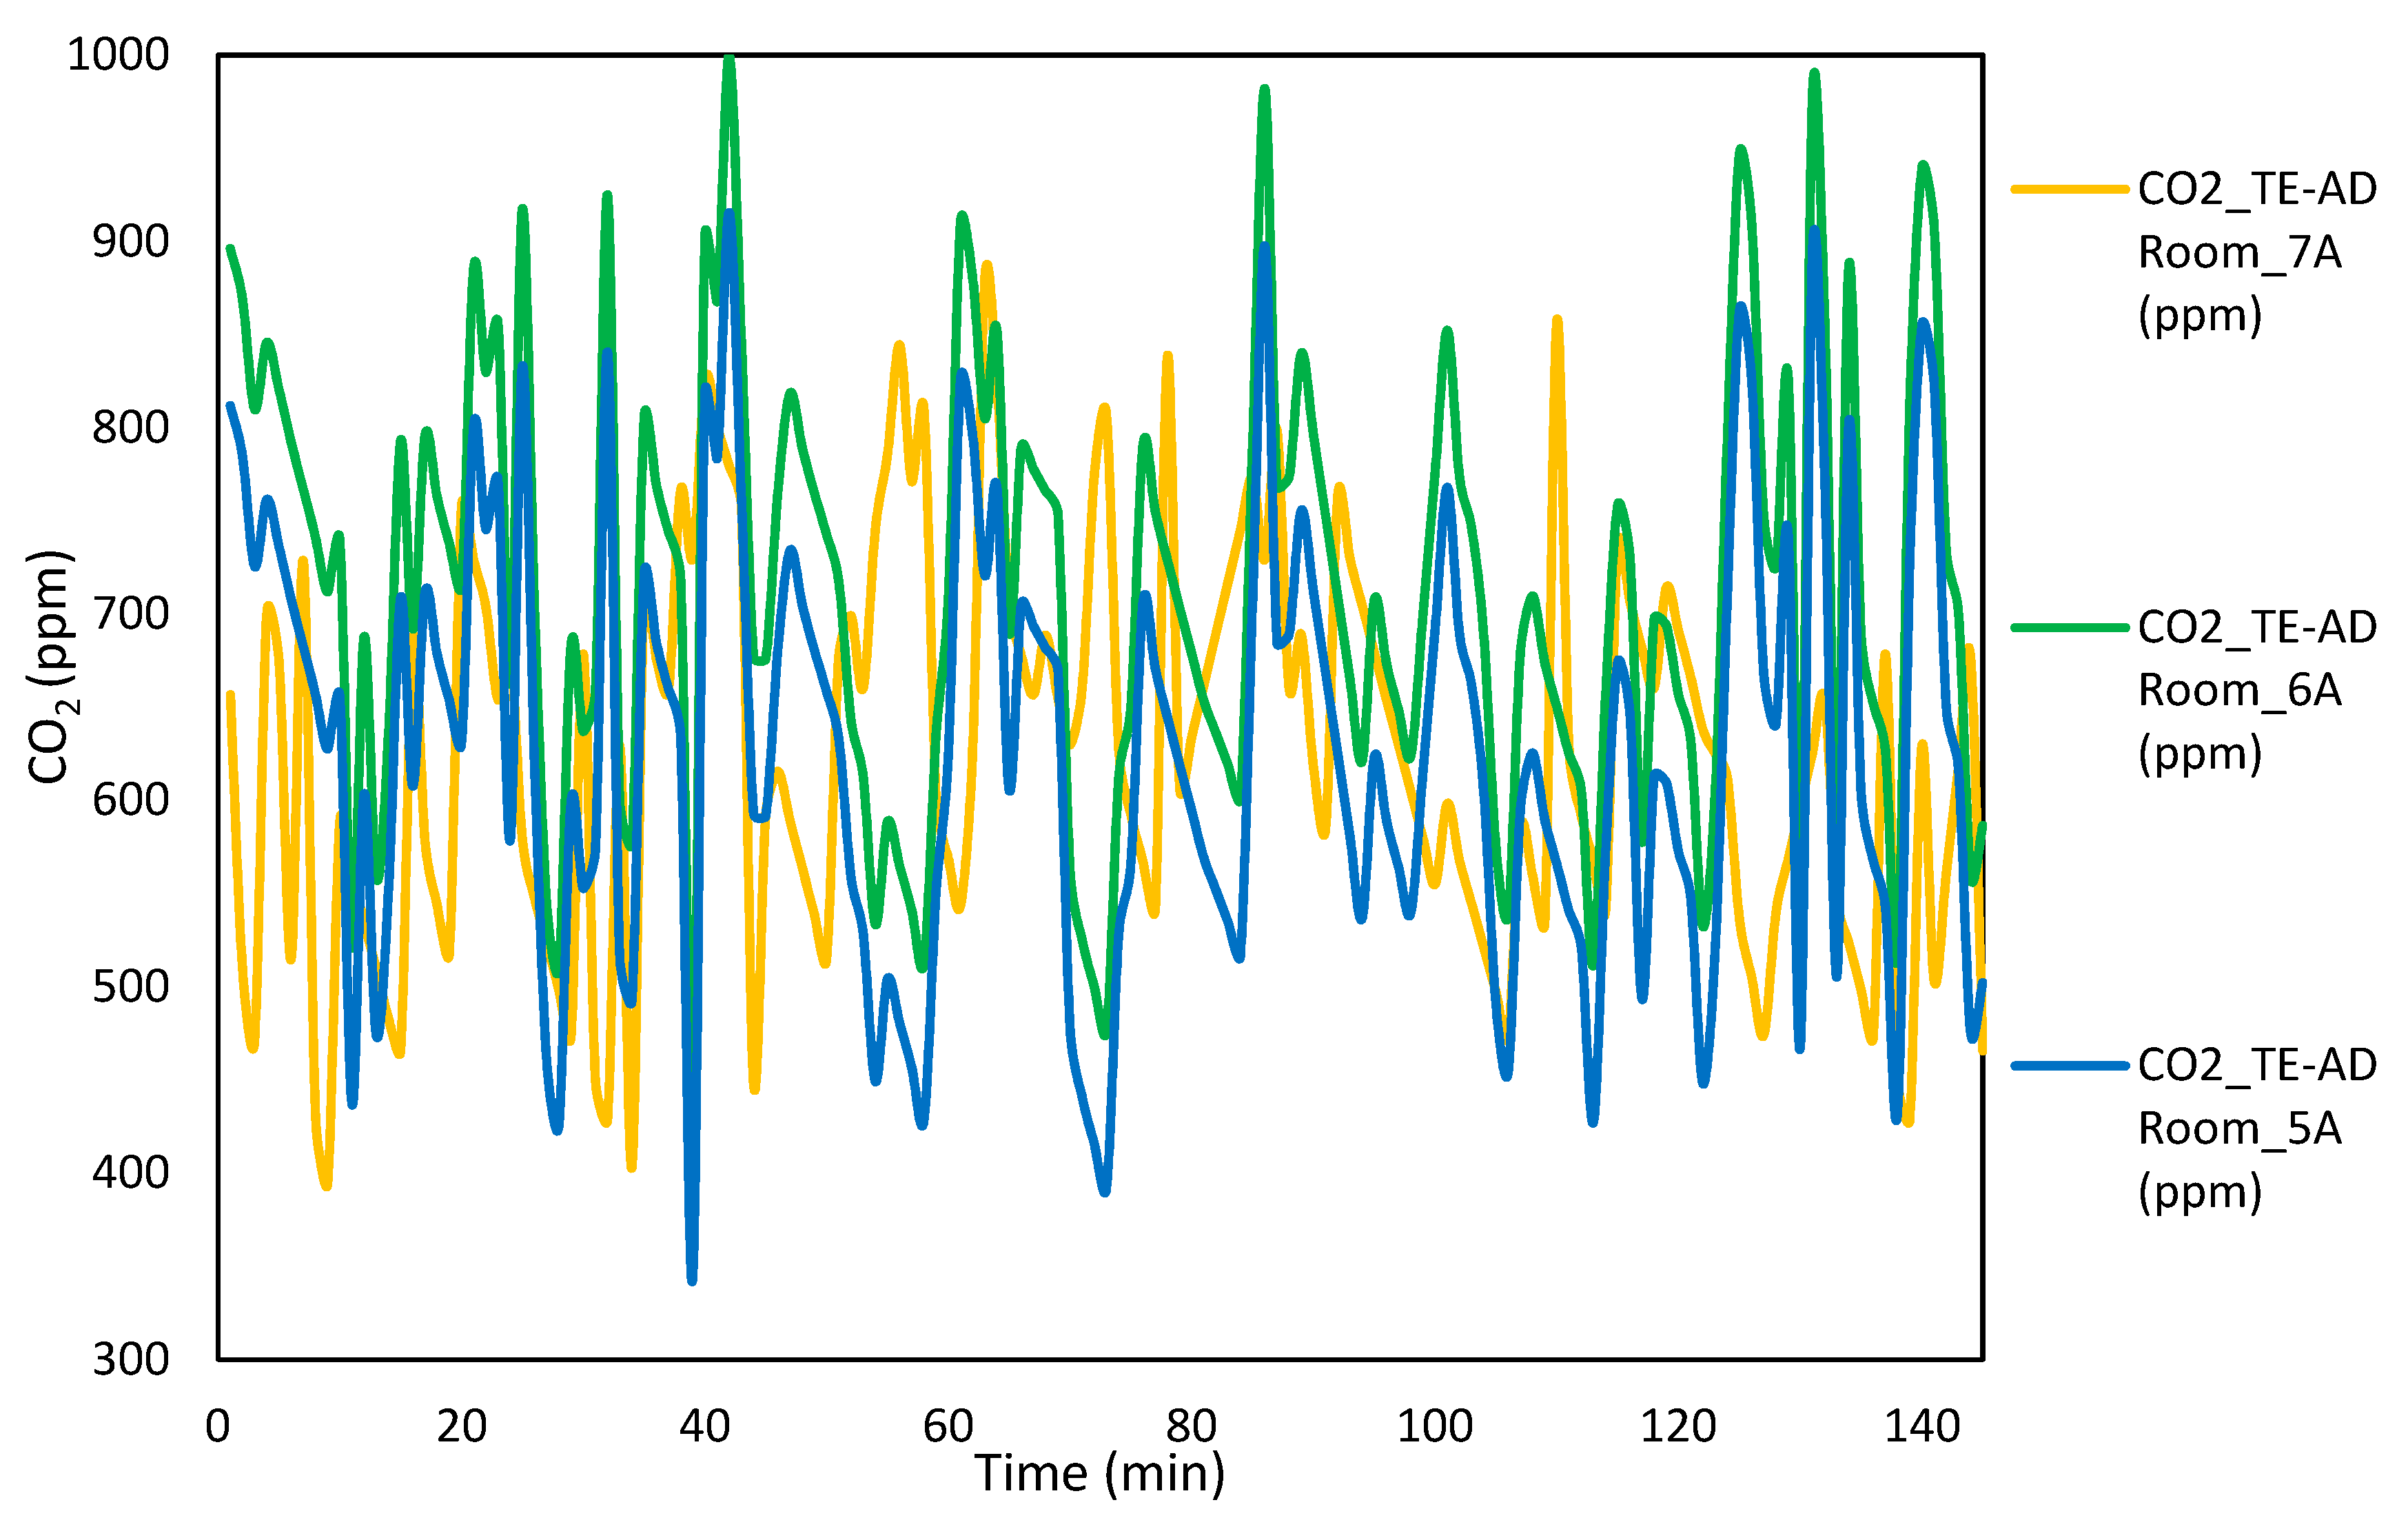
3.3. Effects on Carbon Ddioxide Generation
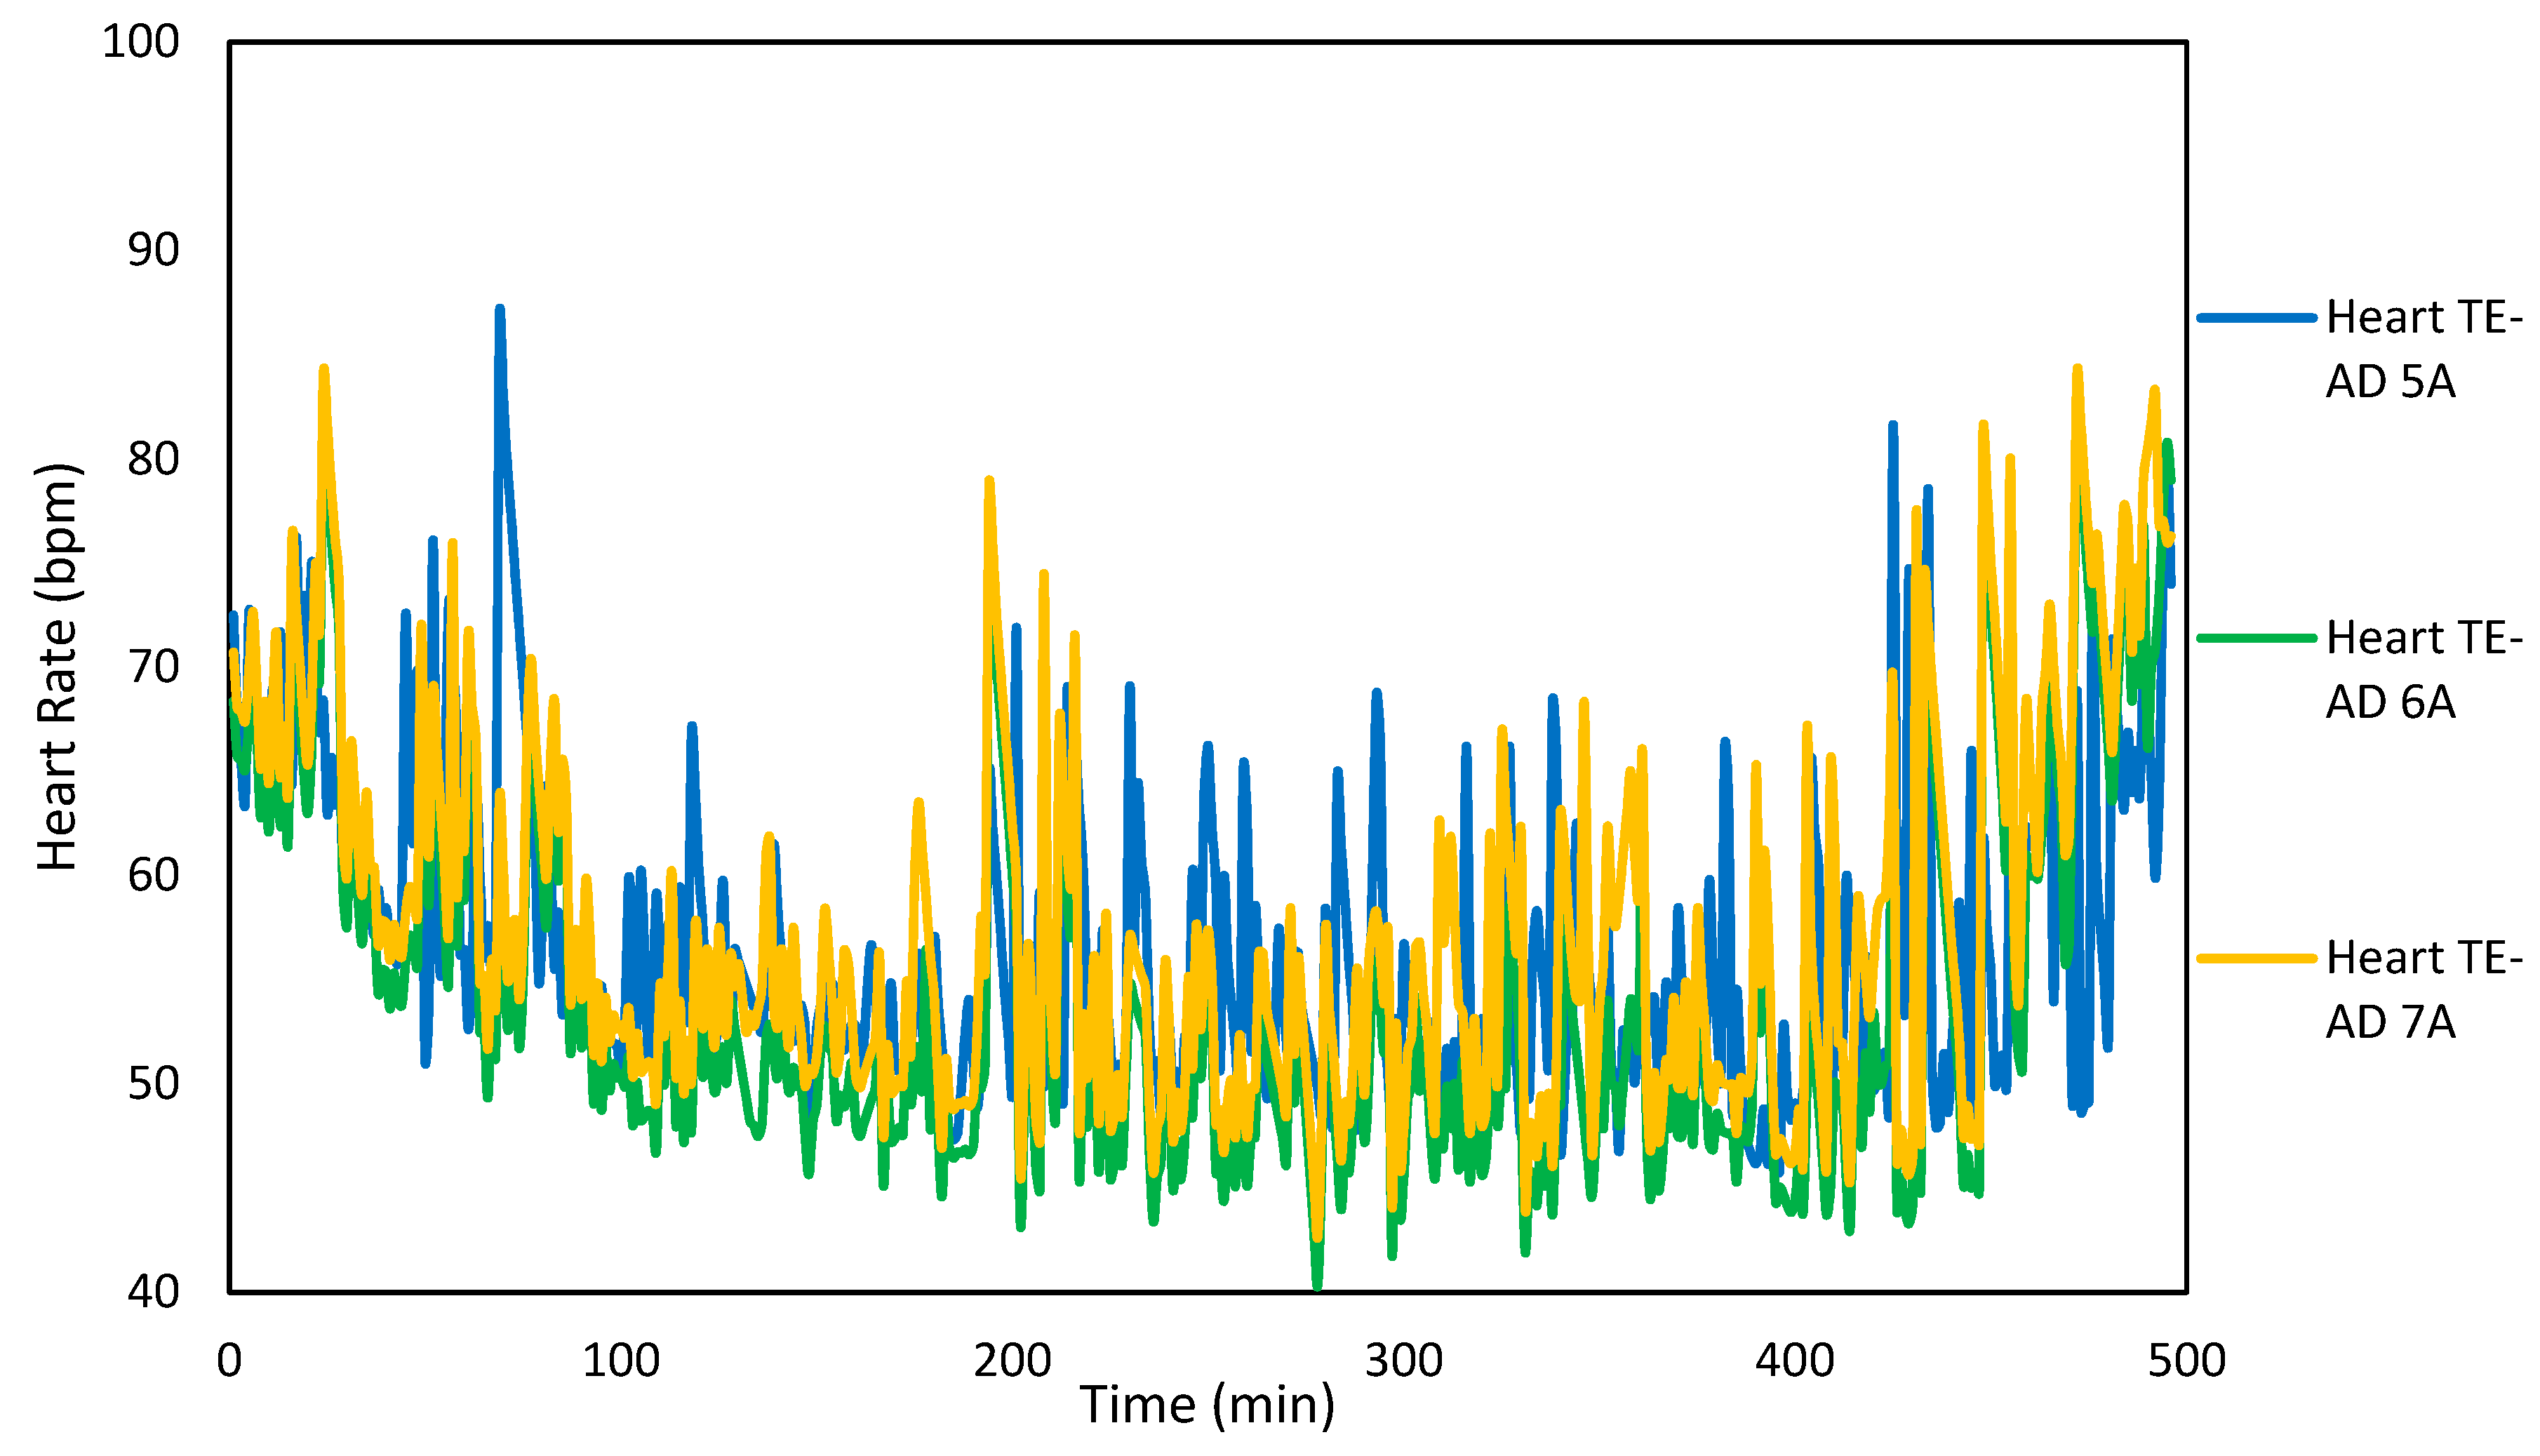
3.4. Effect on Heart Rate
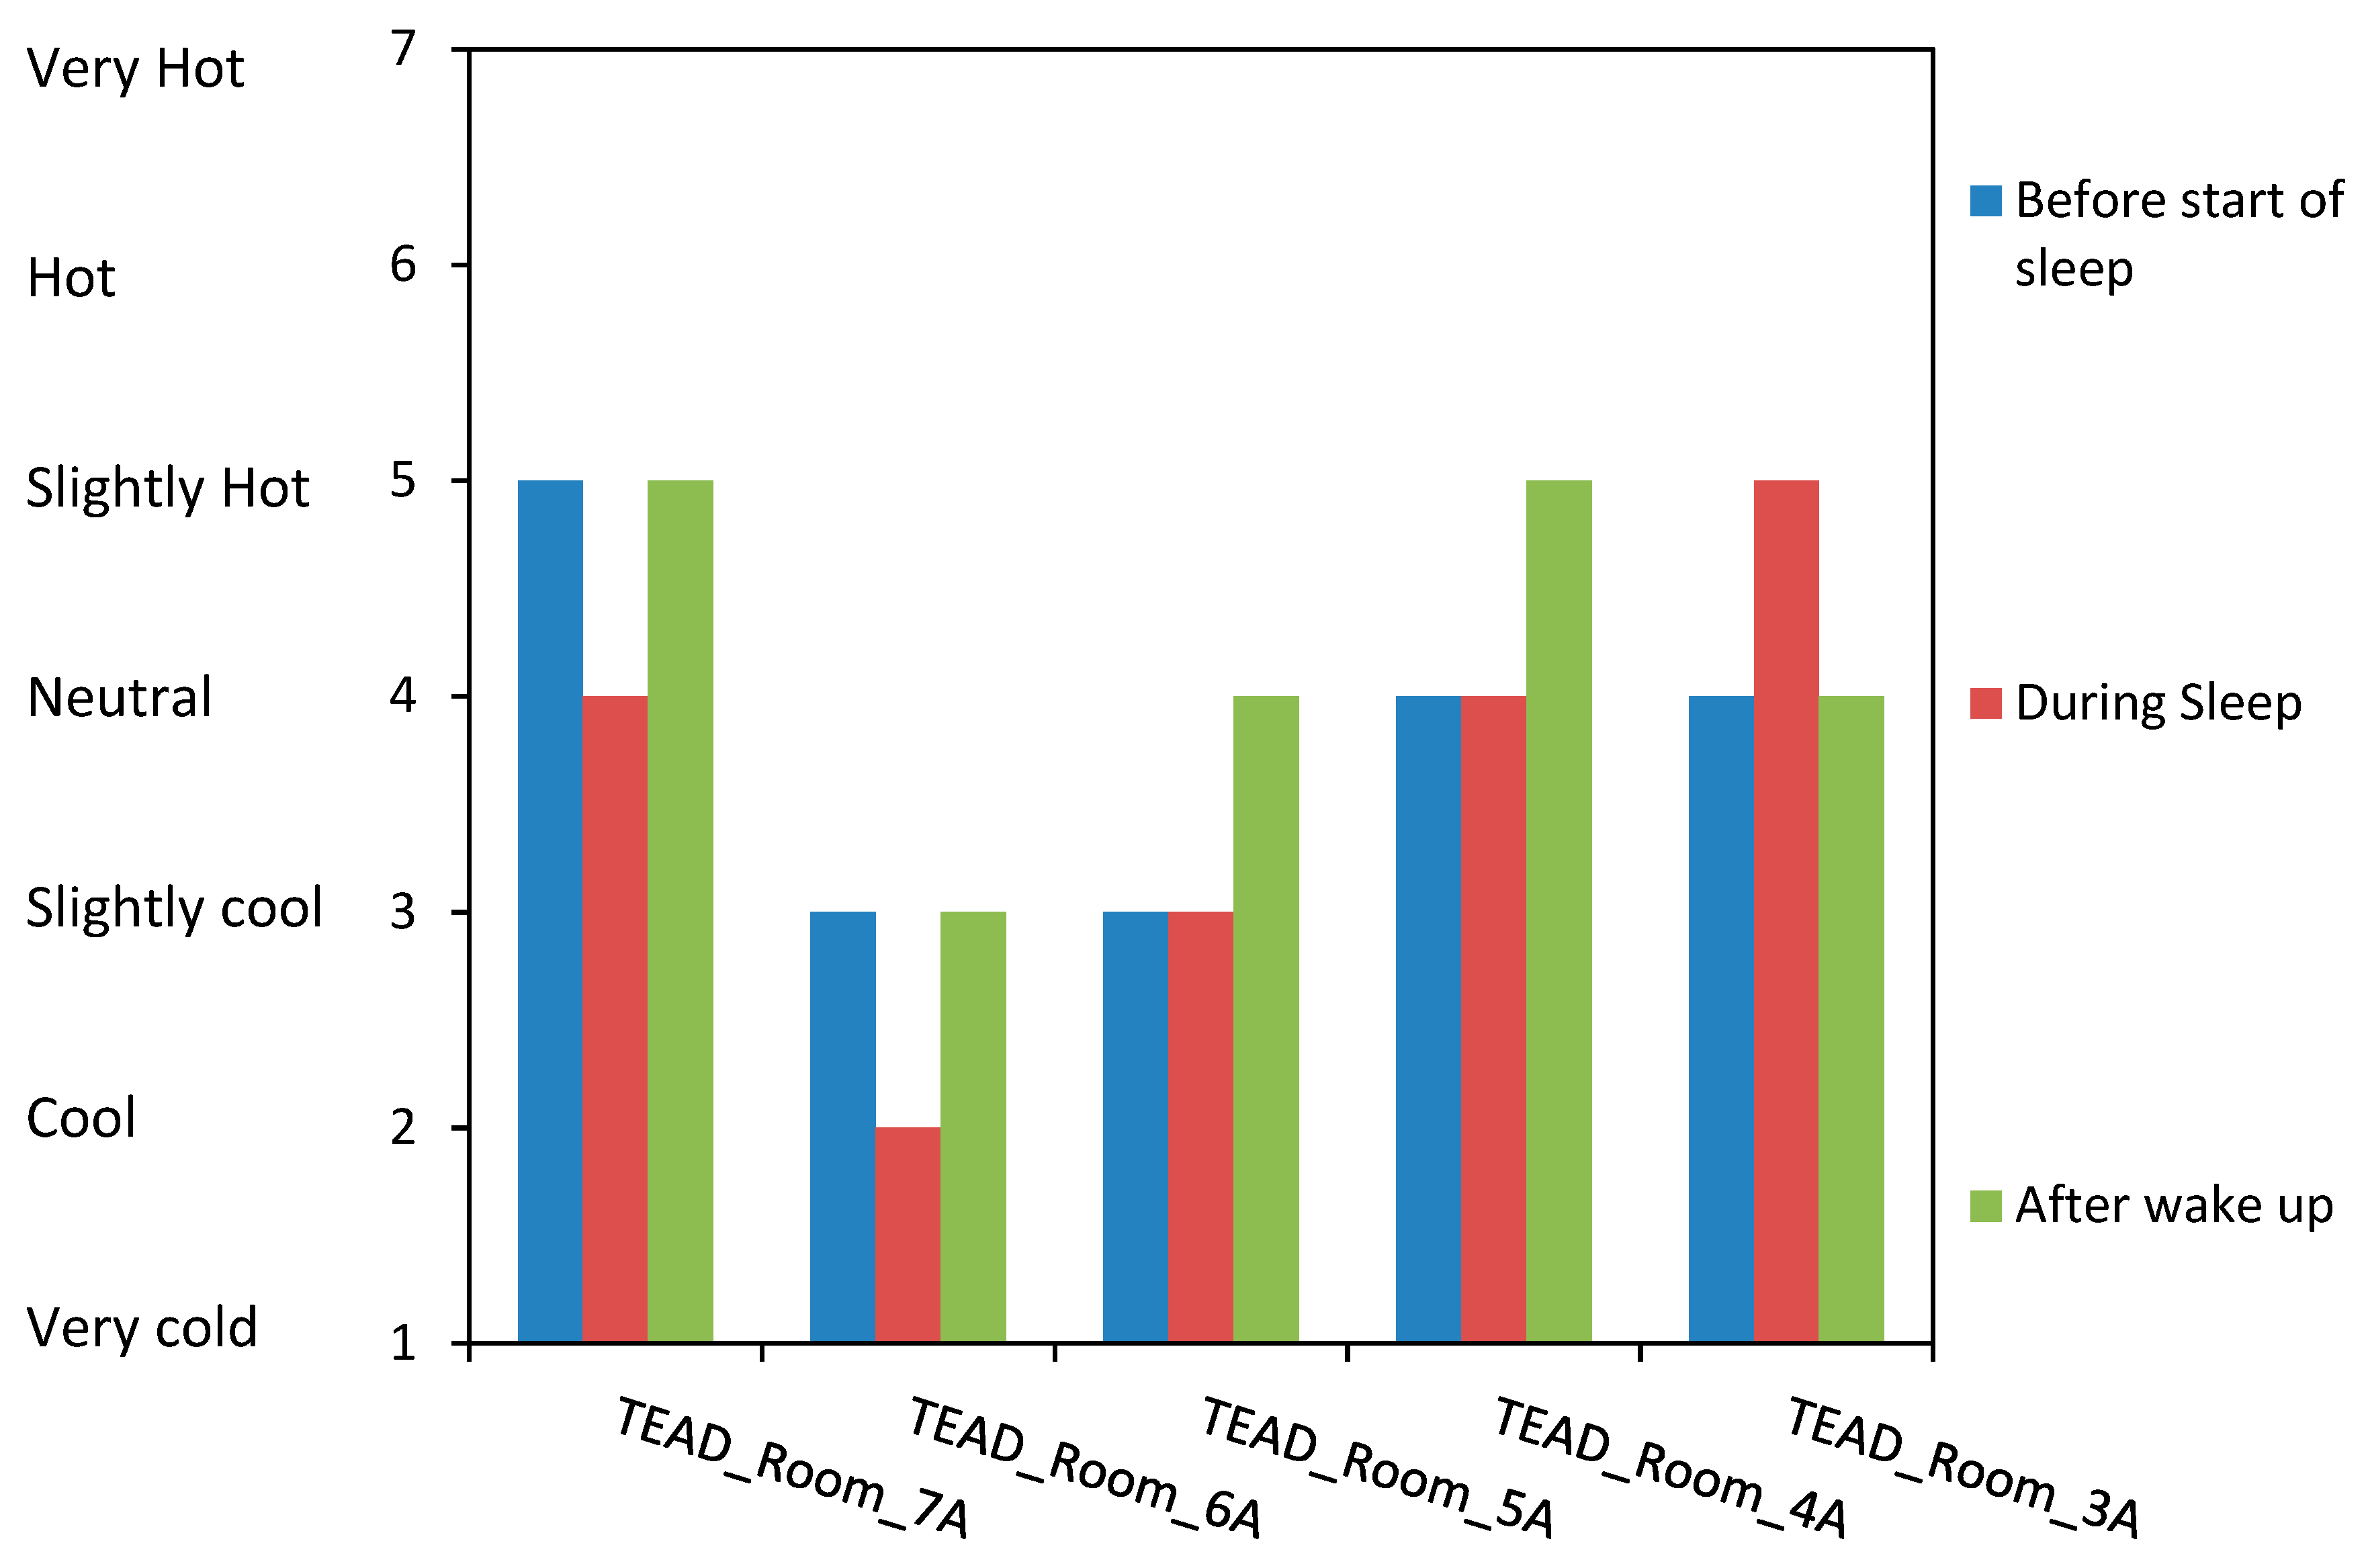
3.5. Effect on Sleep Comfort Rating
3.6. Effect on Sleep Onset Latency, Sleeping Stage, and Comfort Sensation
3.7. Comfort Temperature
3.8. Adaptive Thermal Comfort Model
4. Discussion
5. Conclusions
- When the operating power to the TE-AD framework was raised from 240 W to 720 W, the cooling capacity of the framework increases, causing a decrease in room temperature as well as relative humidity.
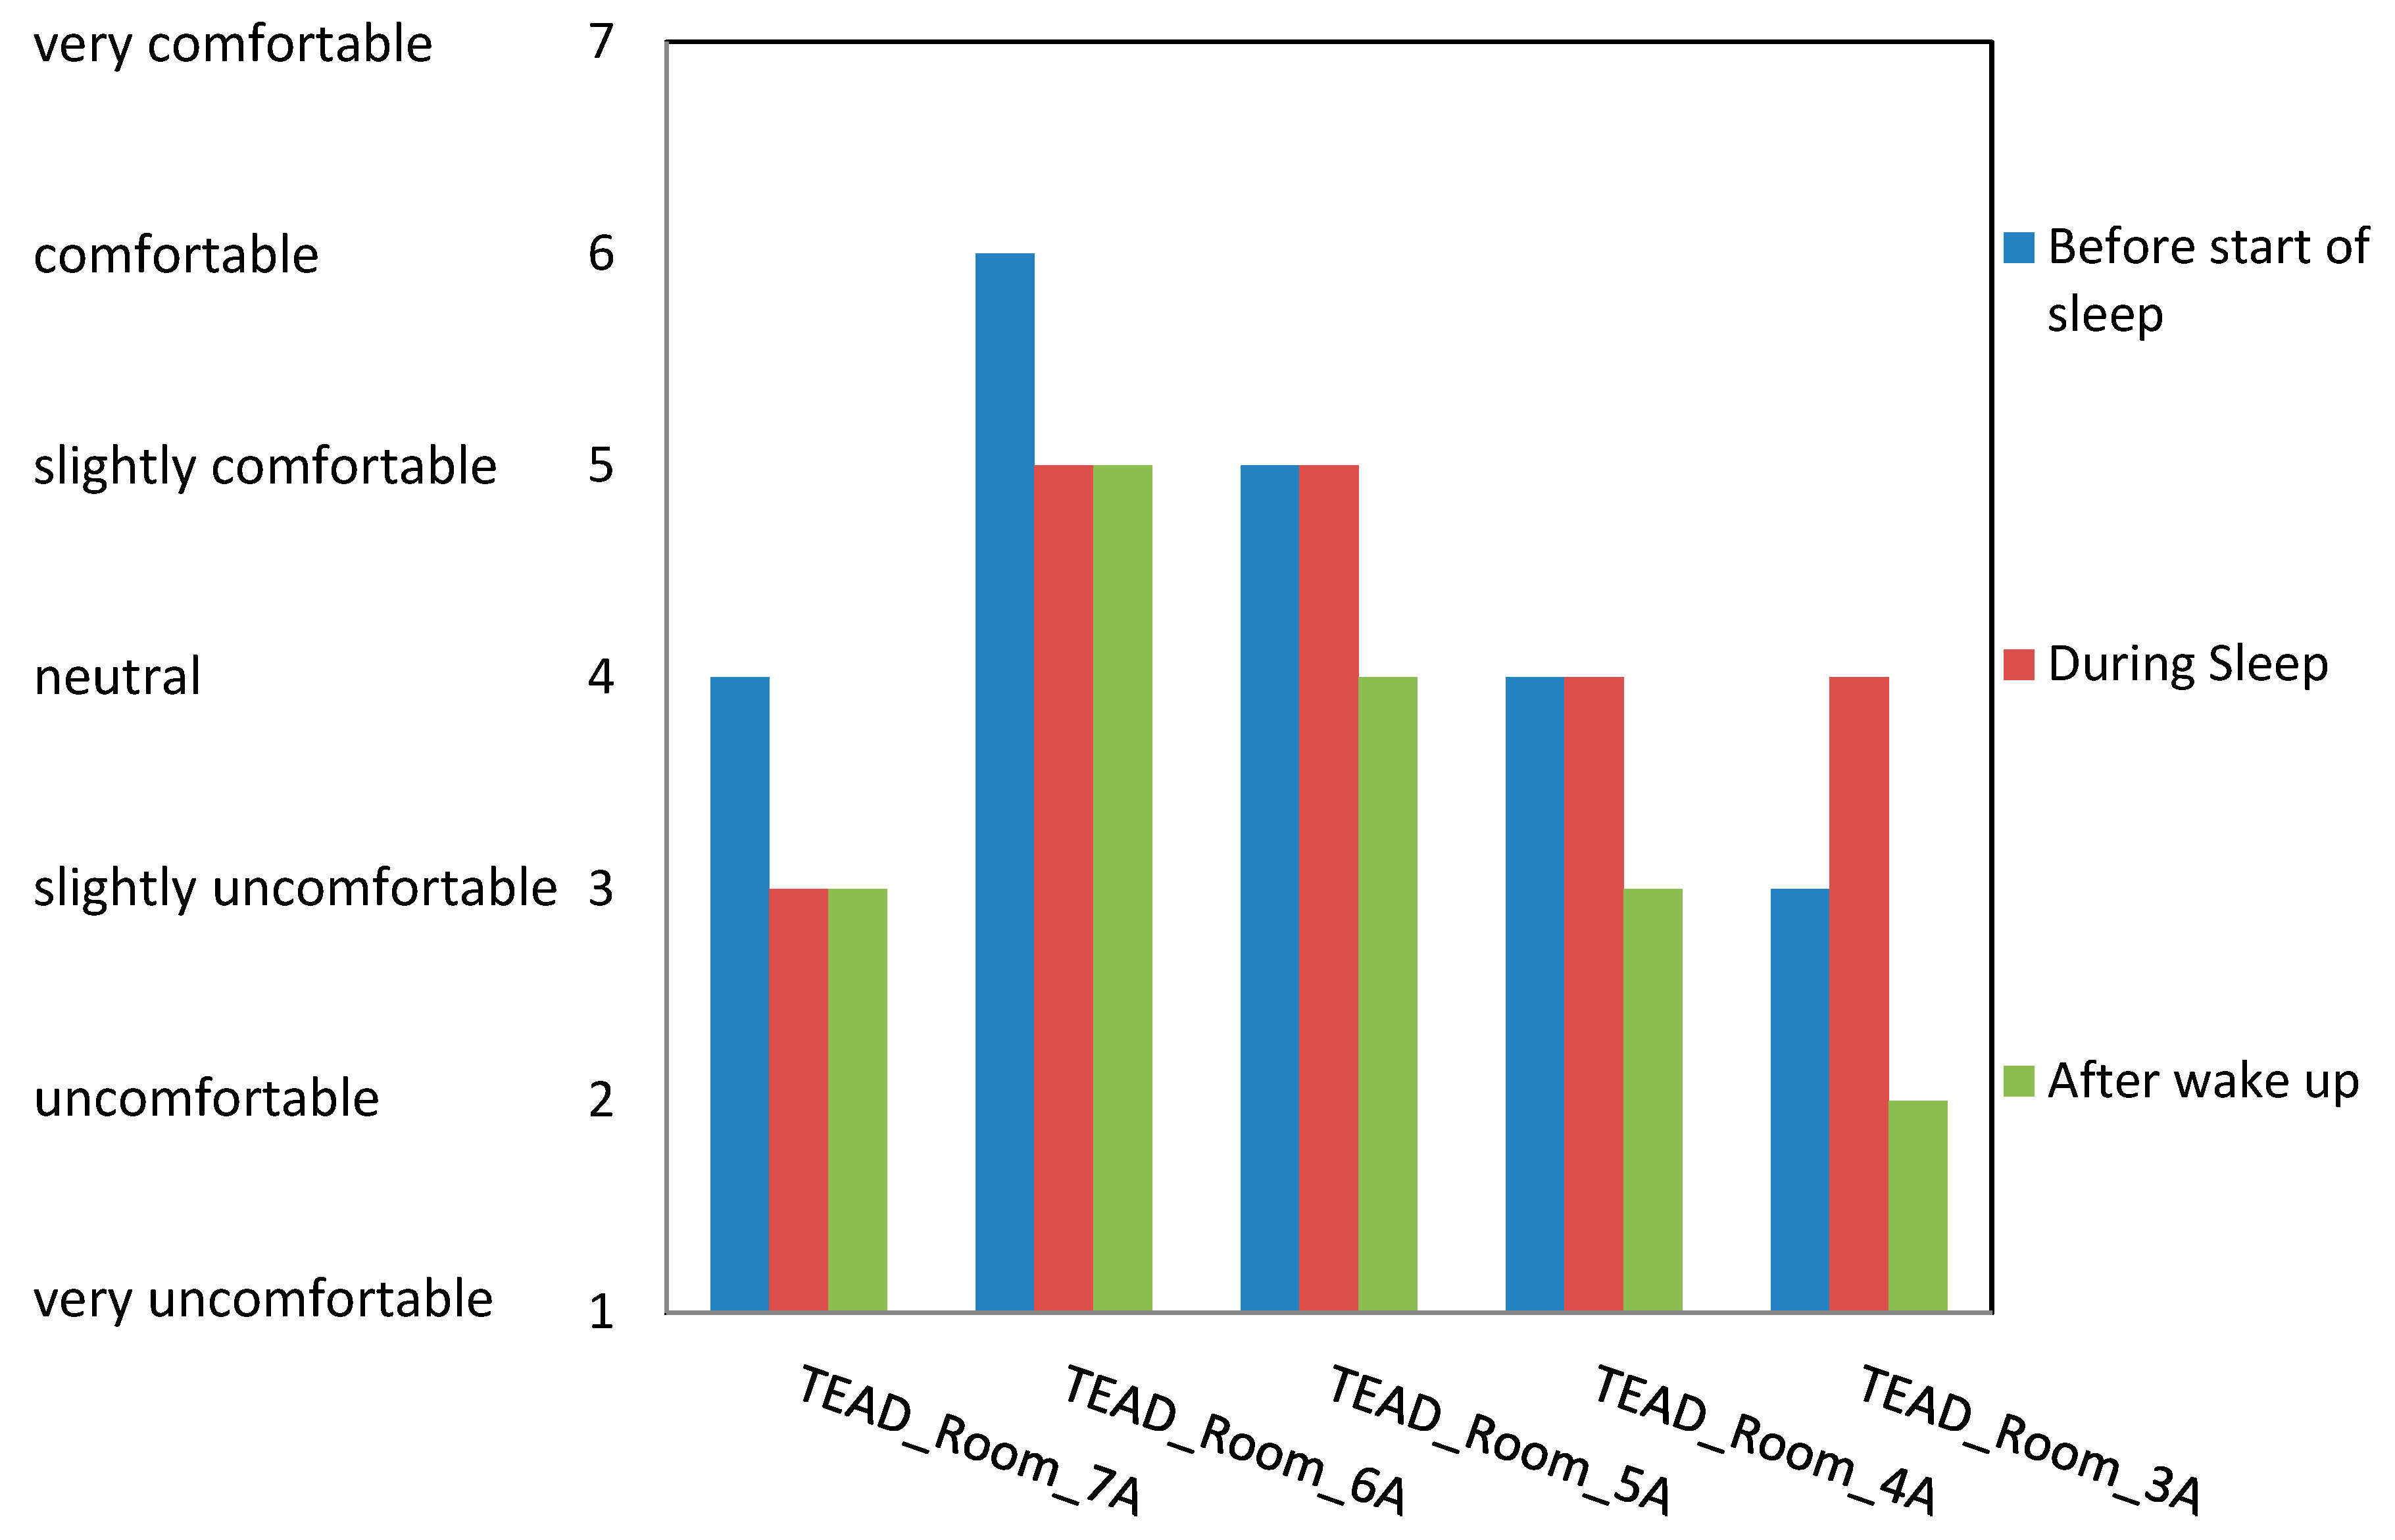
- The sleep satisfaction level of the subjects was increased by raising the power input to the TE-AD framework. Shifts in sleeping stages and heart-rate variability were at a minimum when the TE-AD framework was functioned at 720 W. The 720 W input power supply provided optimum sleeping comfort as compared to other levels of the input power.
- Increasing the power supply beyond 720 W reduced the cooling function of the system drastically resulting in a lowering of the sleep quality and overall thermal sensation; increase in sleep onset latency time, increased sleep stages shifting frequency, increased heart rate, and a decrease in PMV and PPD ratings.
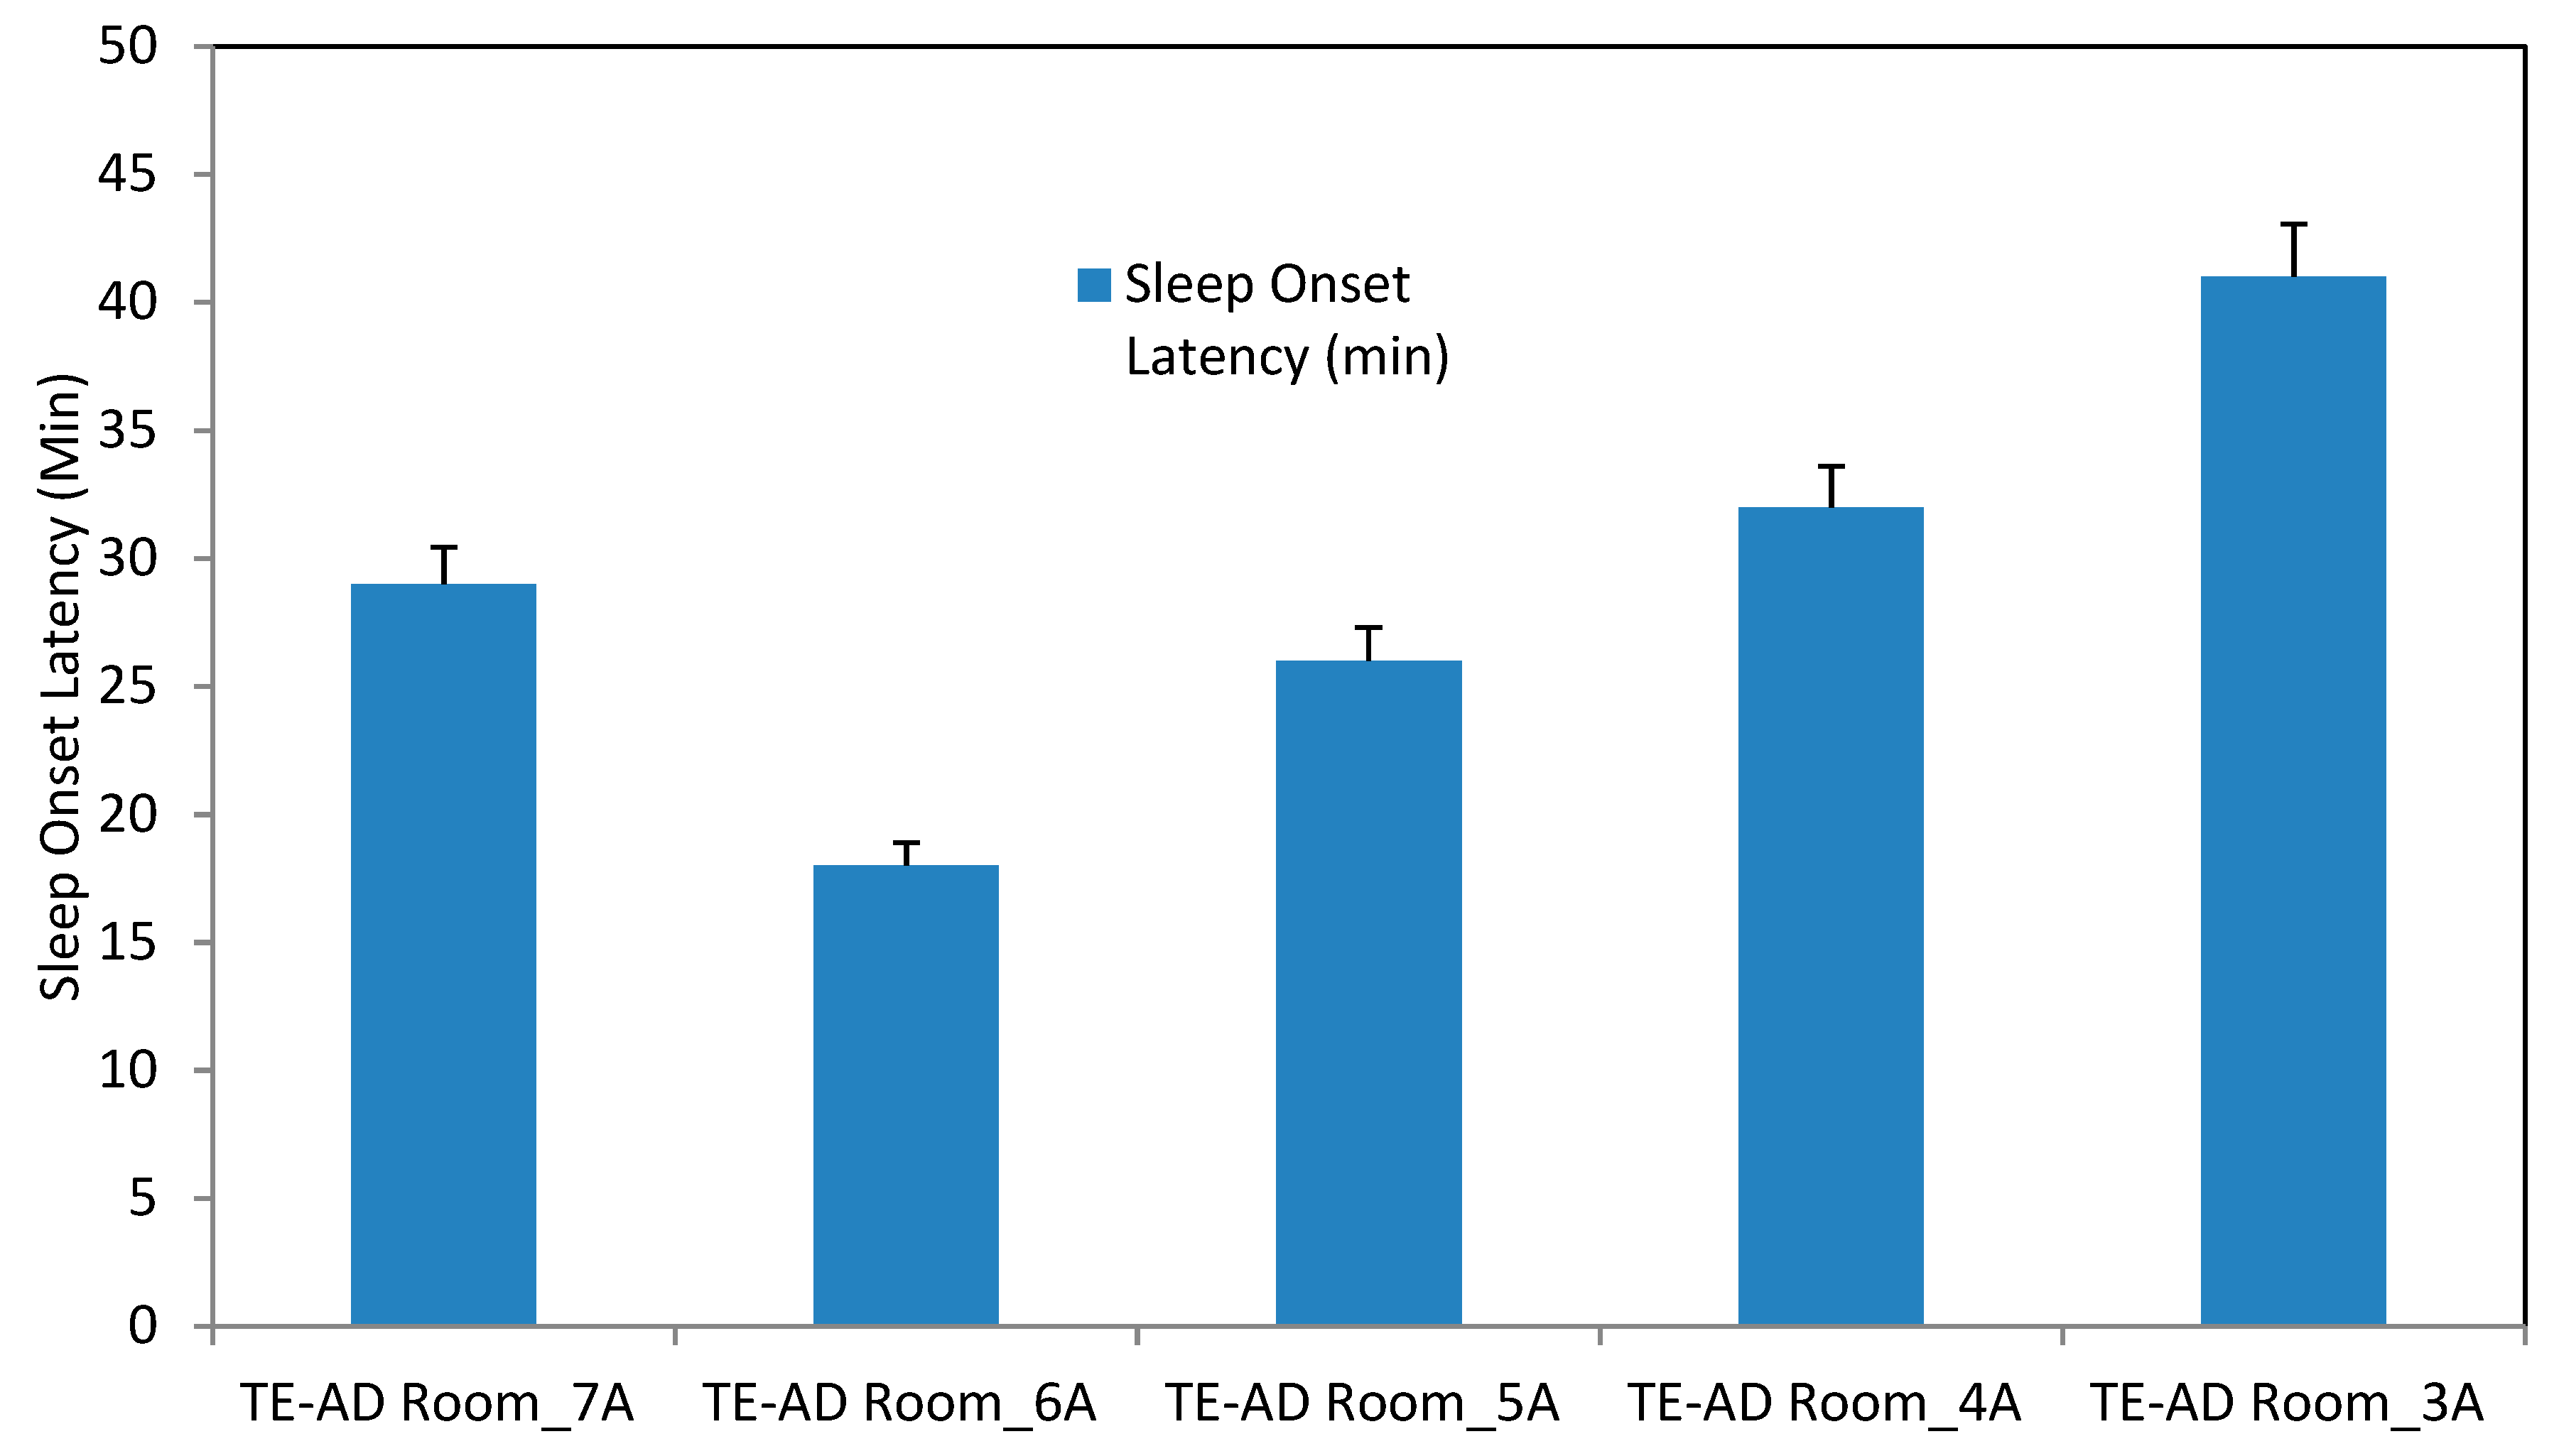
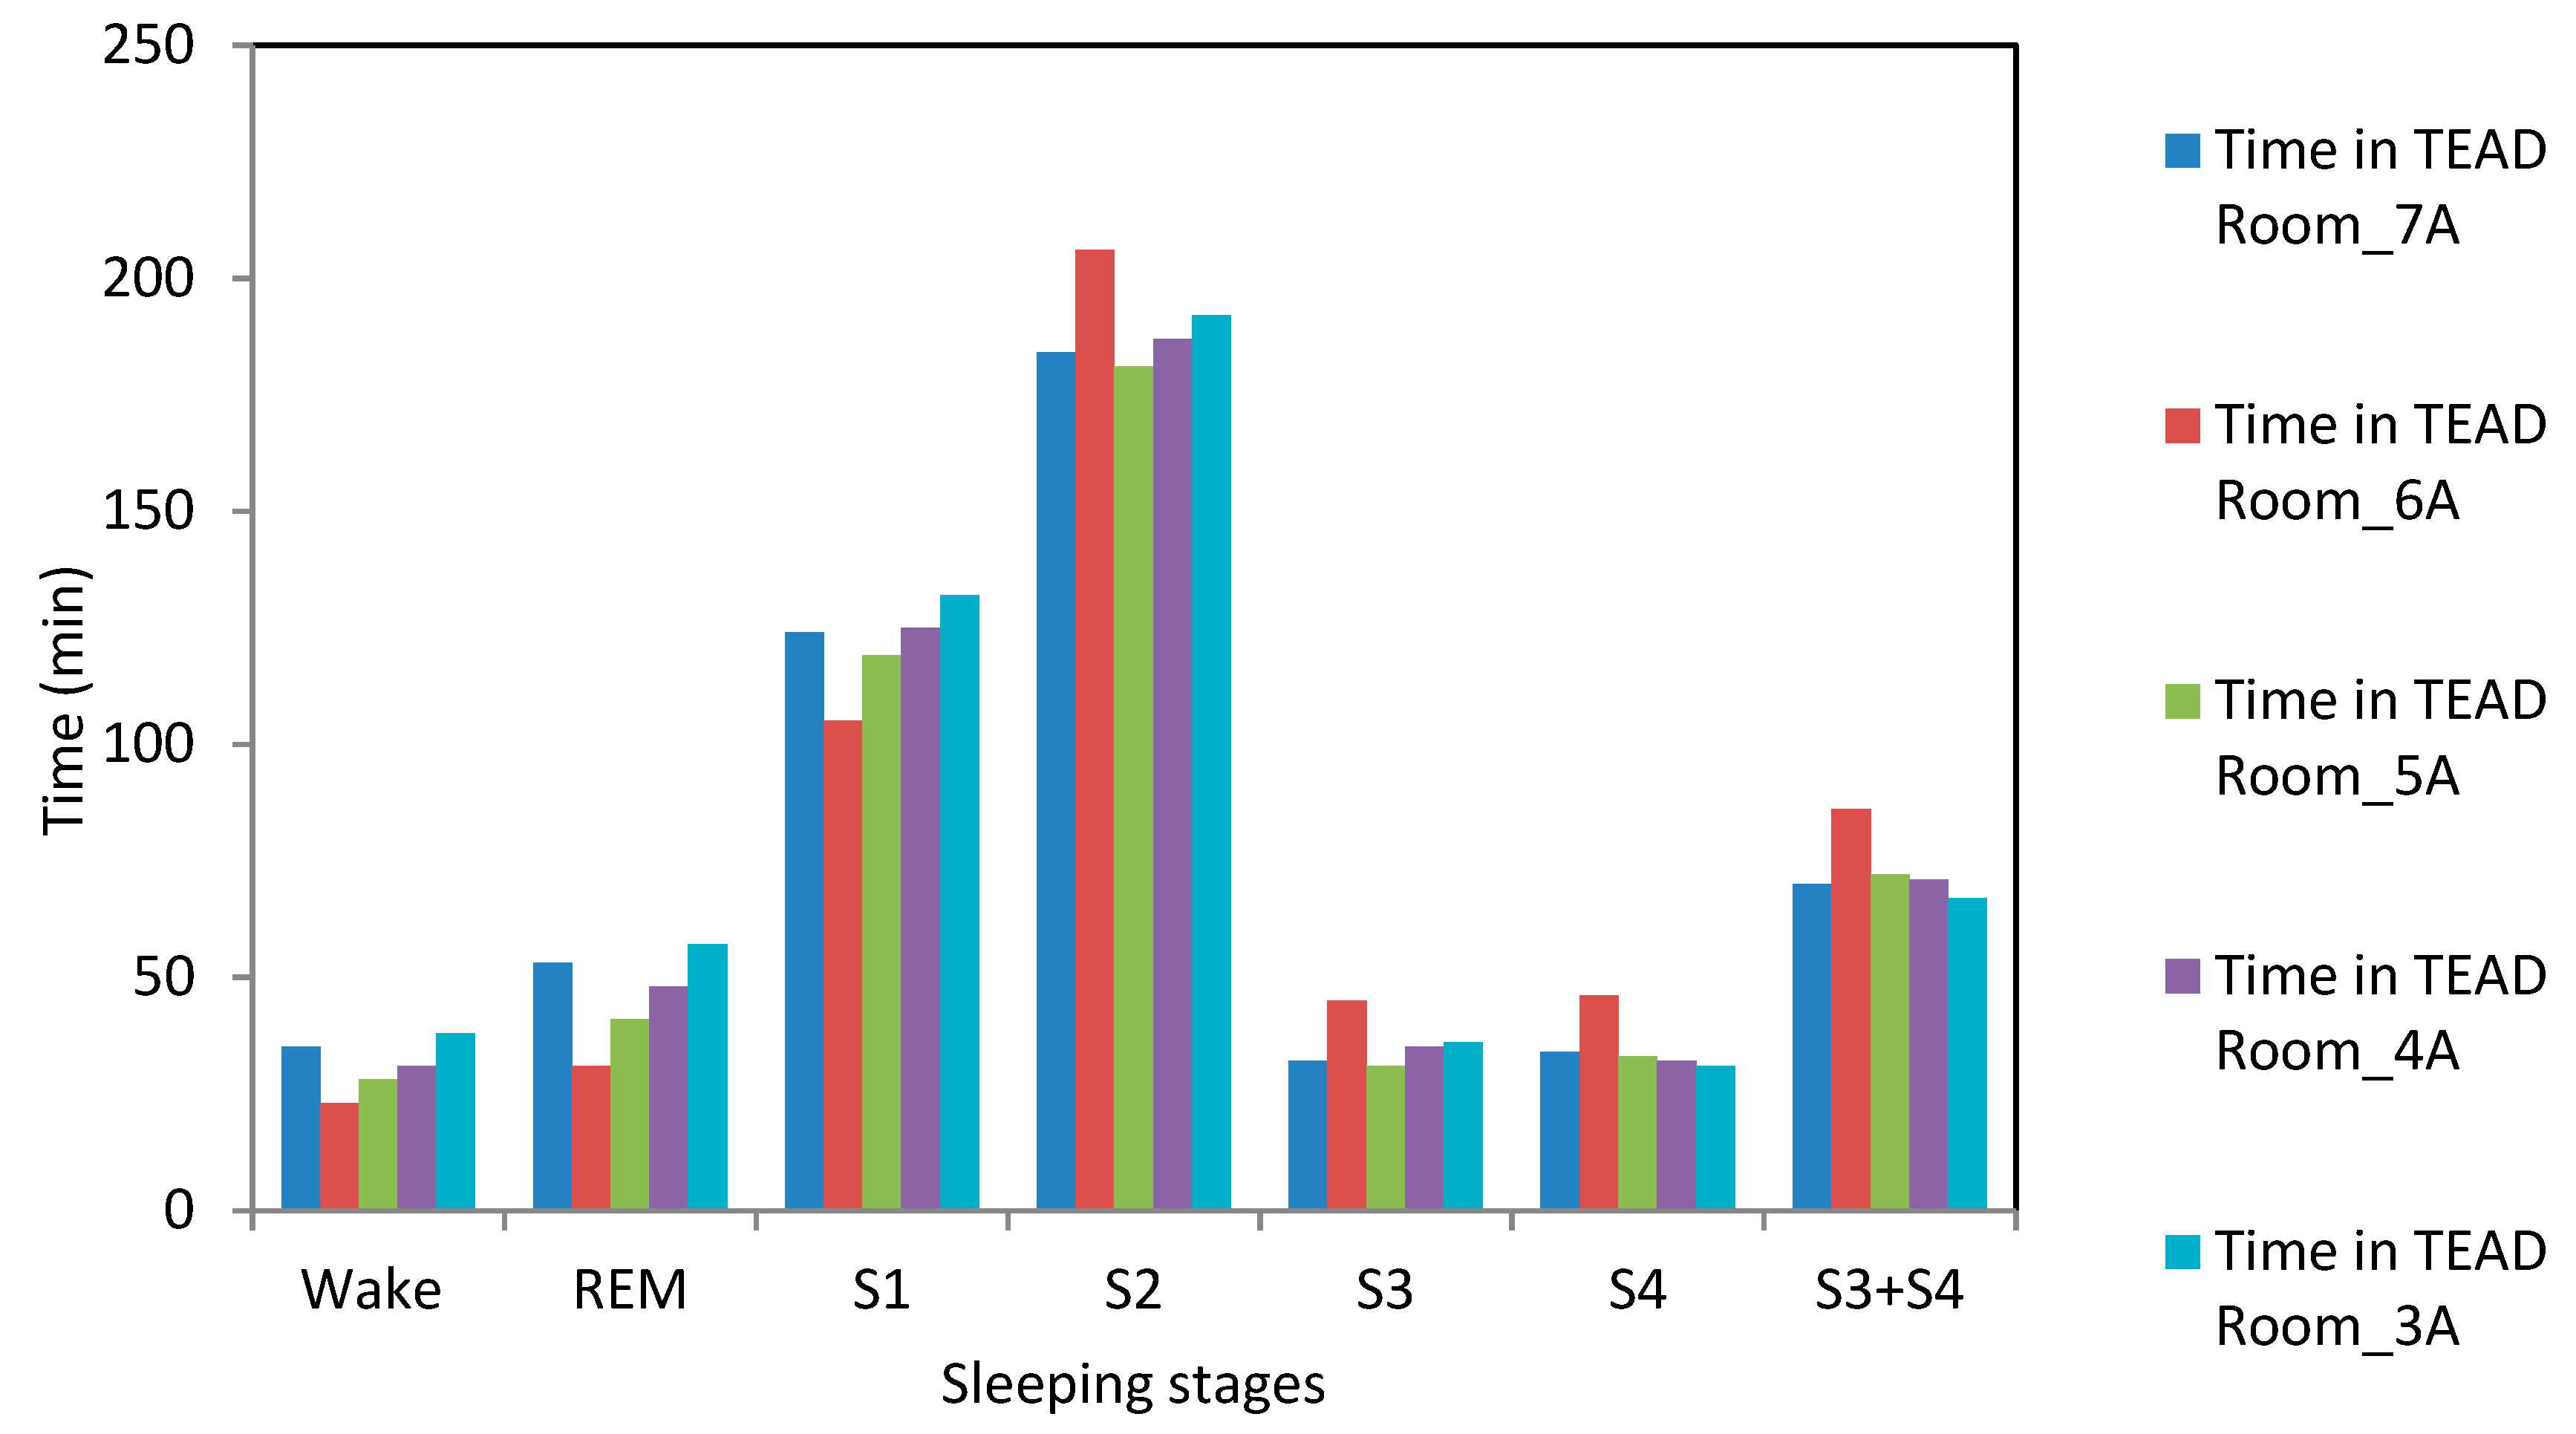
- Of the six operating powers, it was at 360 W as well as 840 W operation of TE-AD, that the SOL of the test-room occupants was greatest and it was at a minimum when it was functioned at 600 W and at 720 W. At 720 W of input power, the occupants spent lengthier time in the NREM sleeping stage in contrast to operating inputs of 360 W or 840 W.
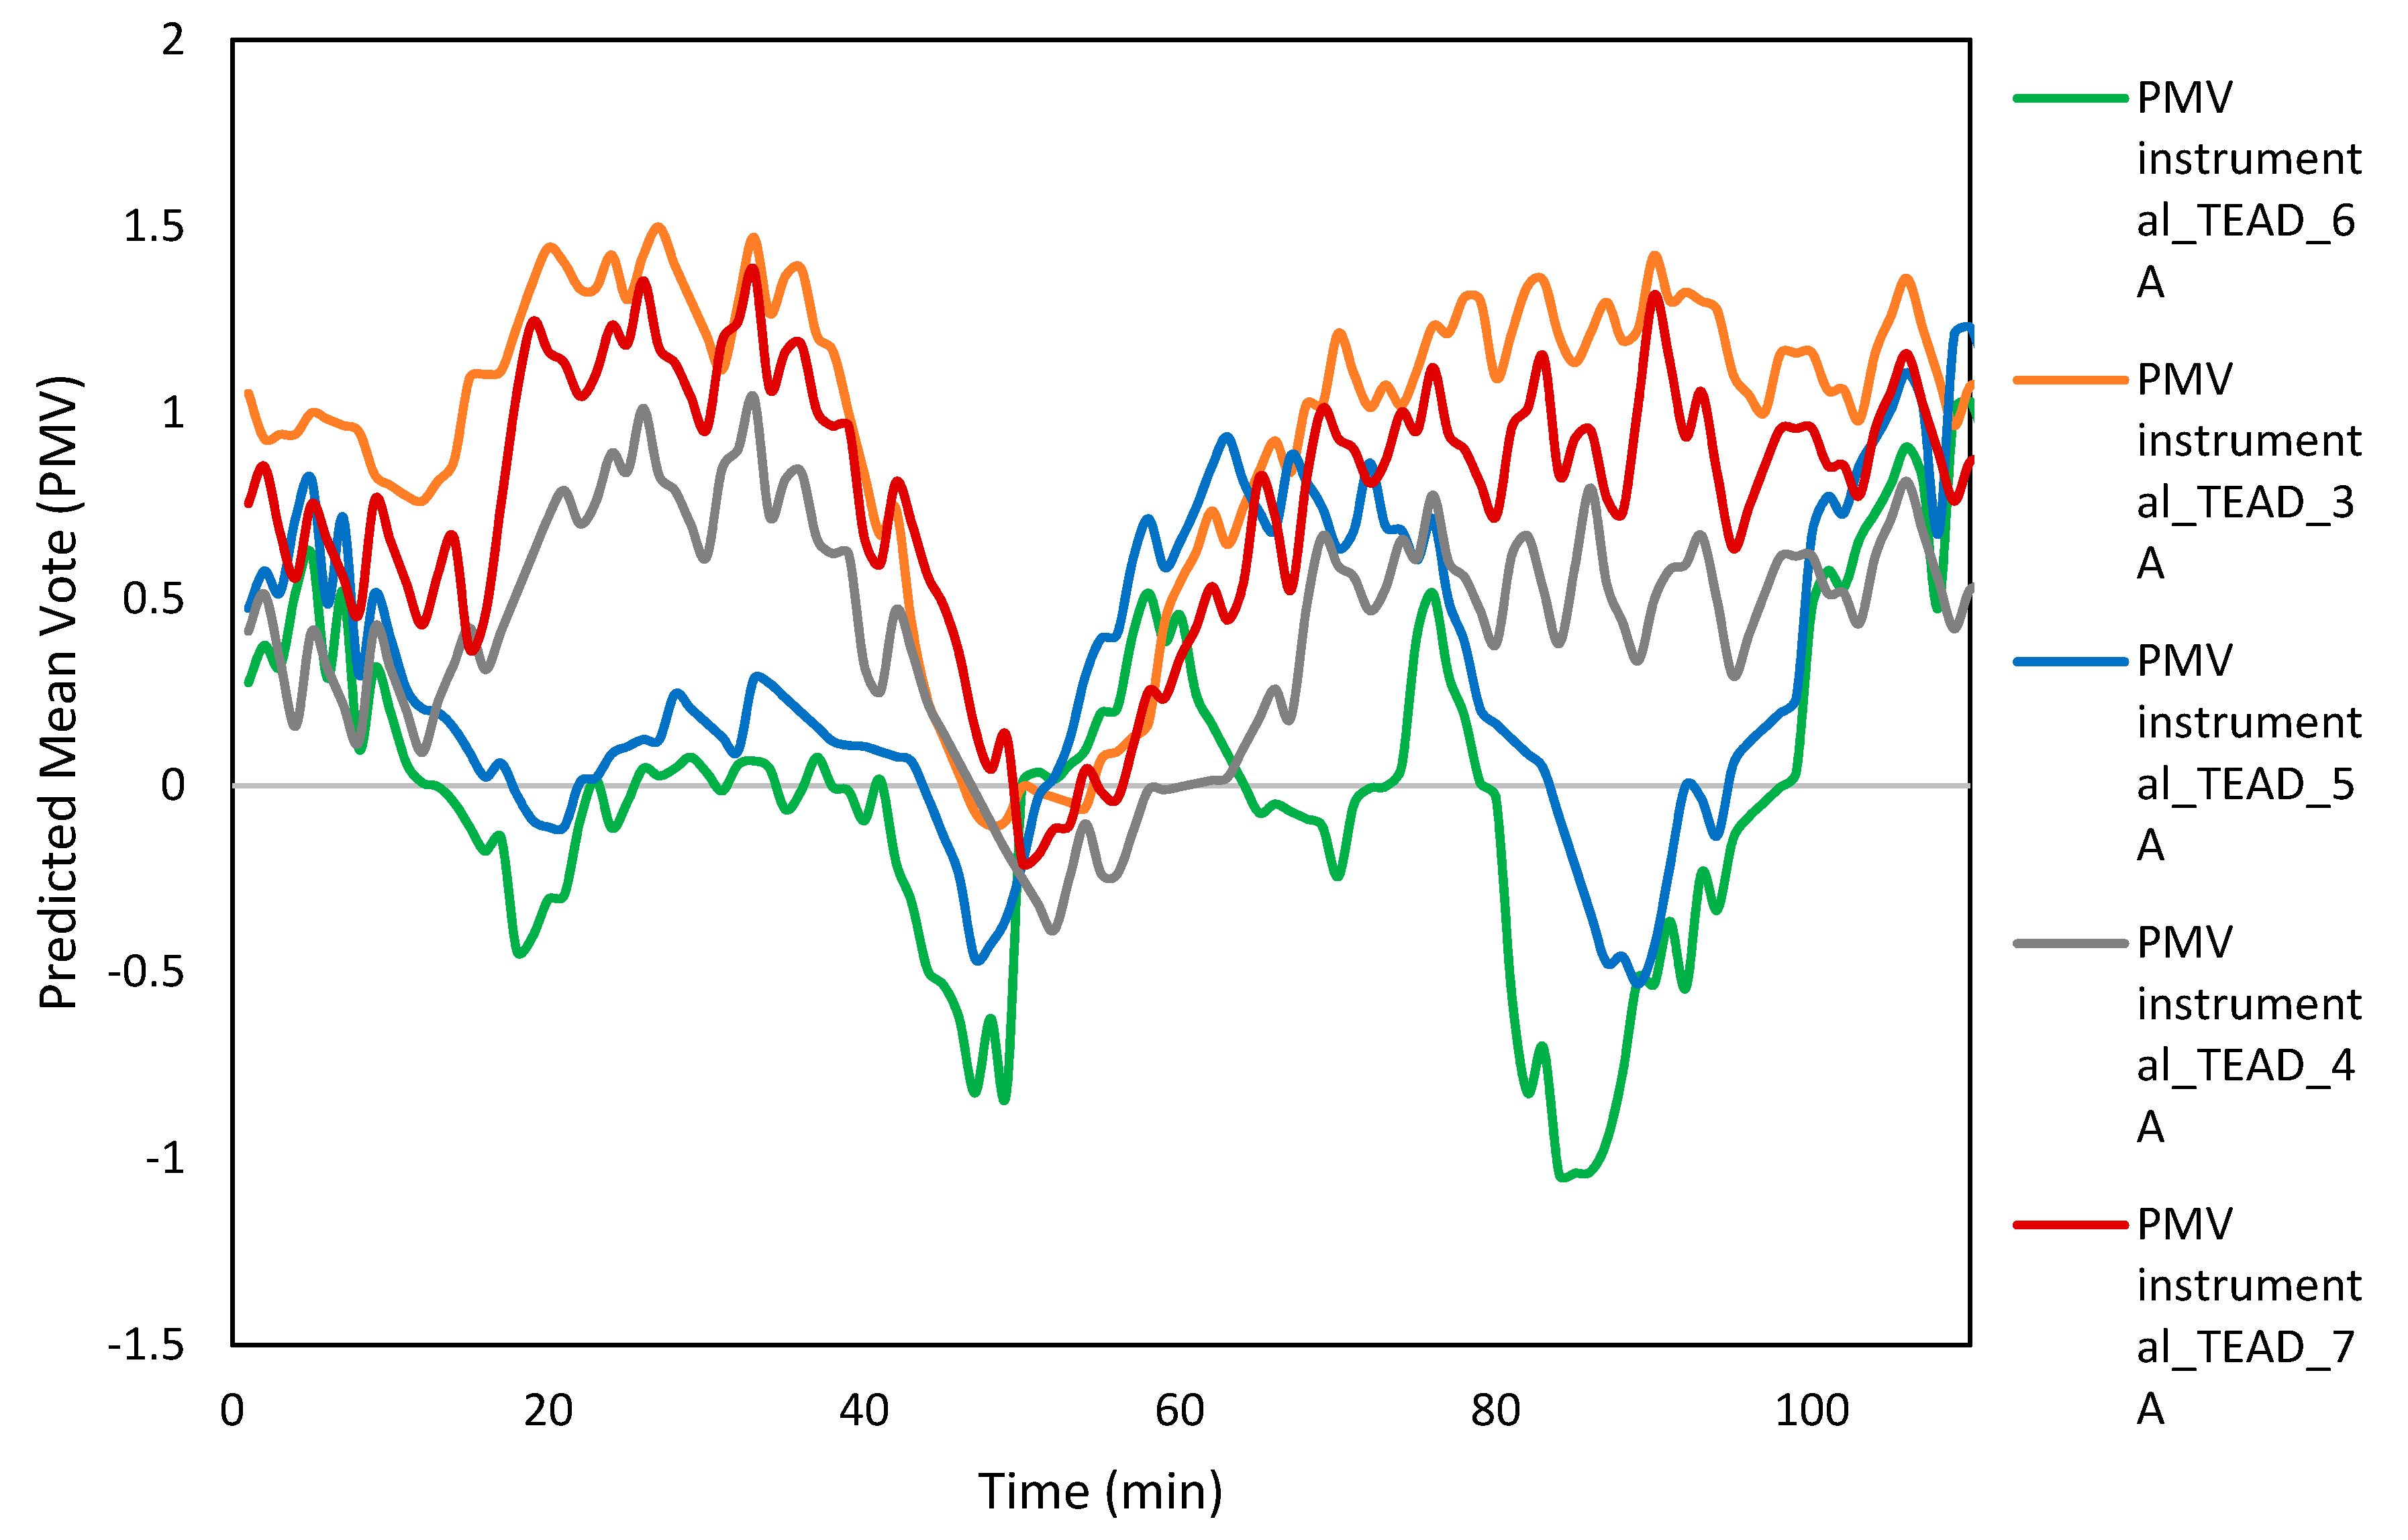
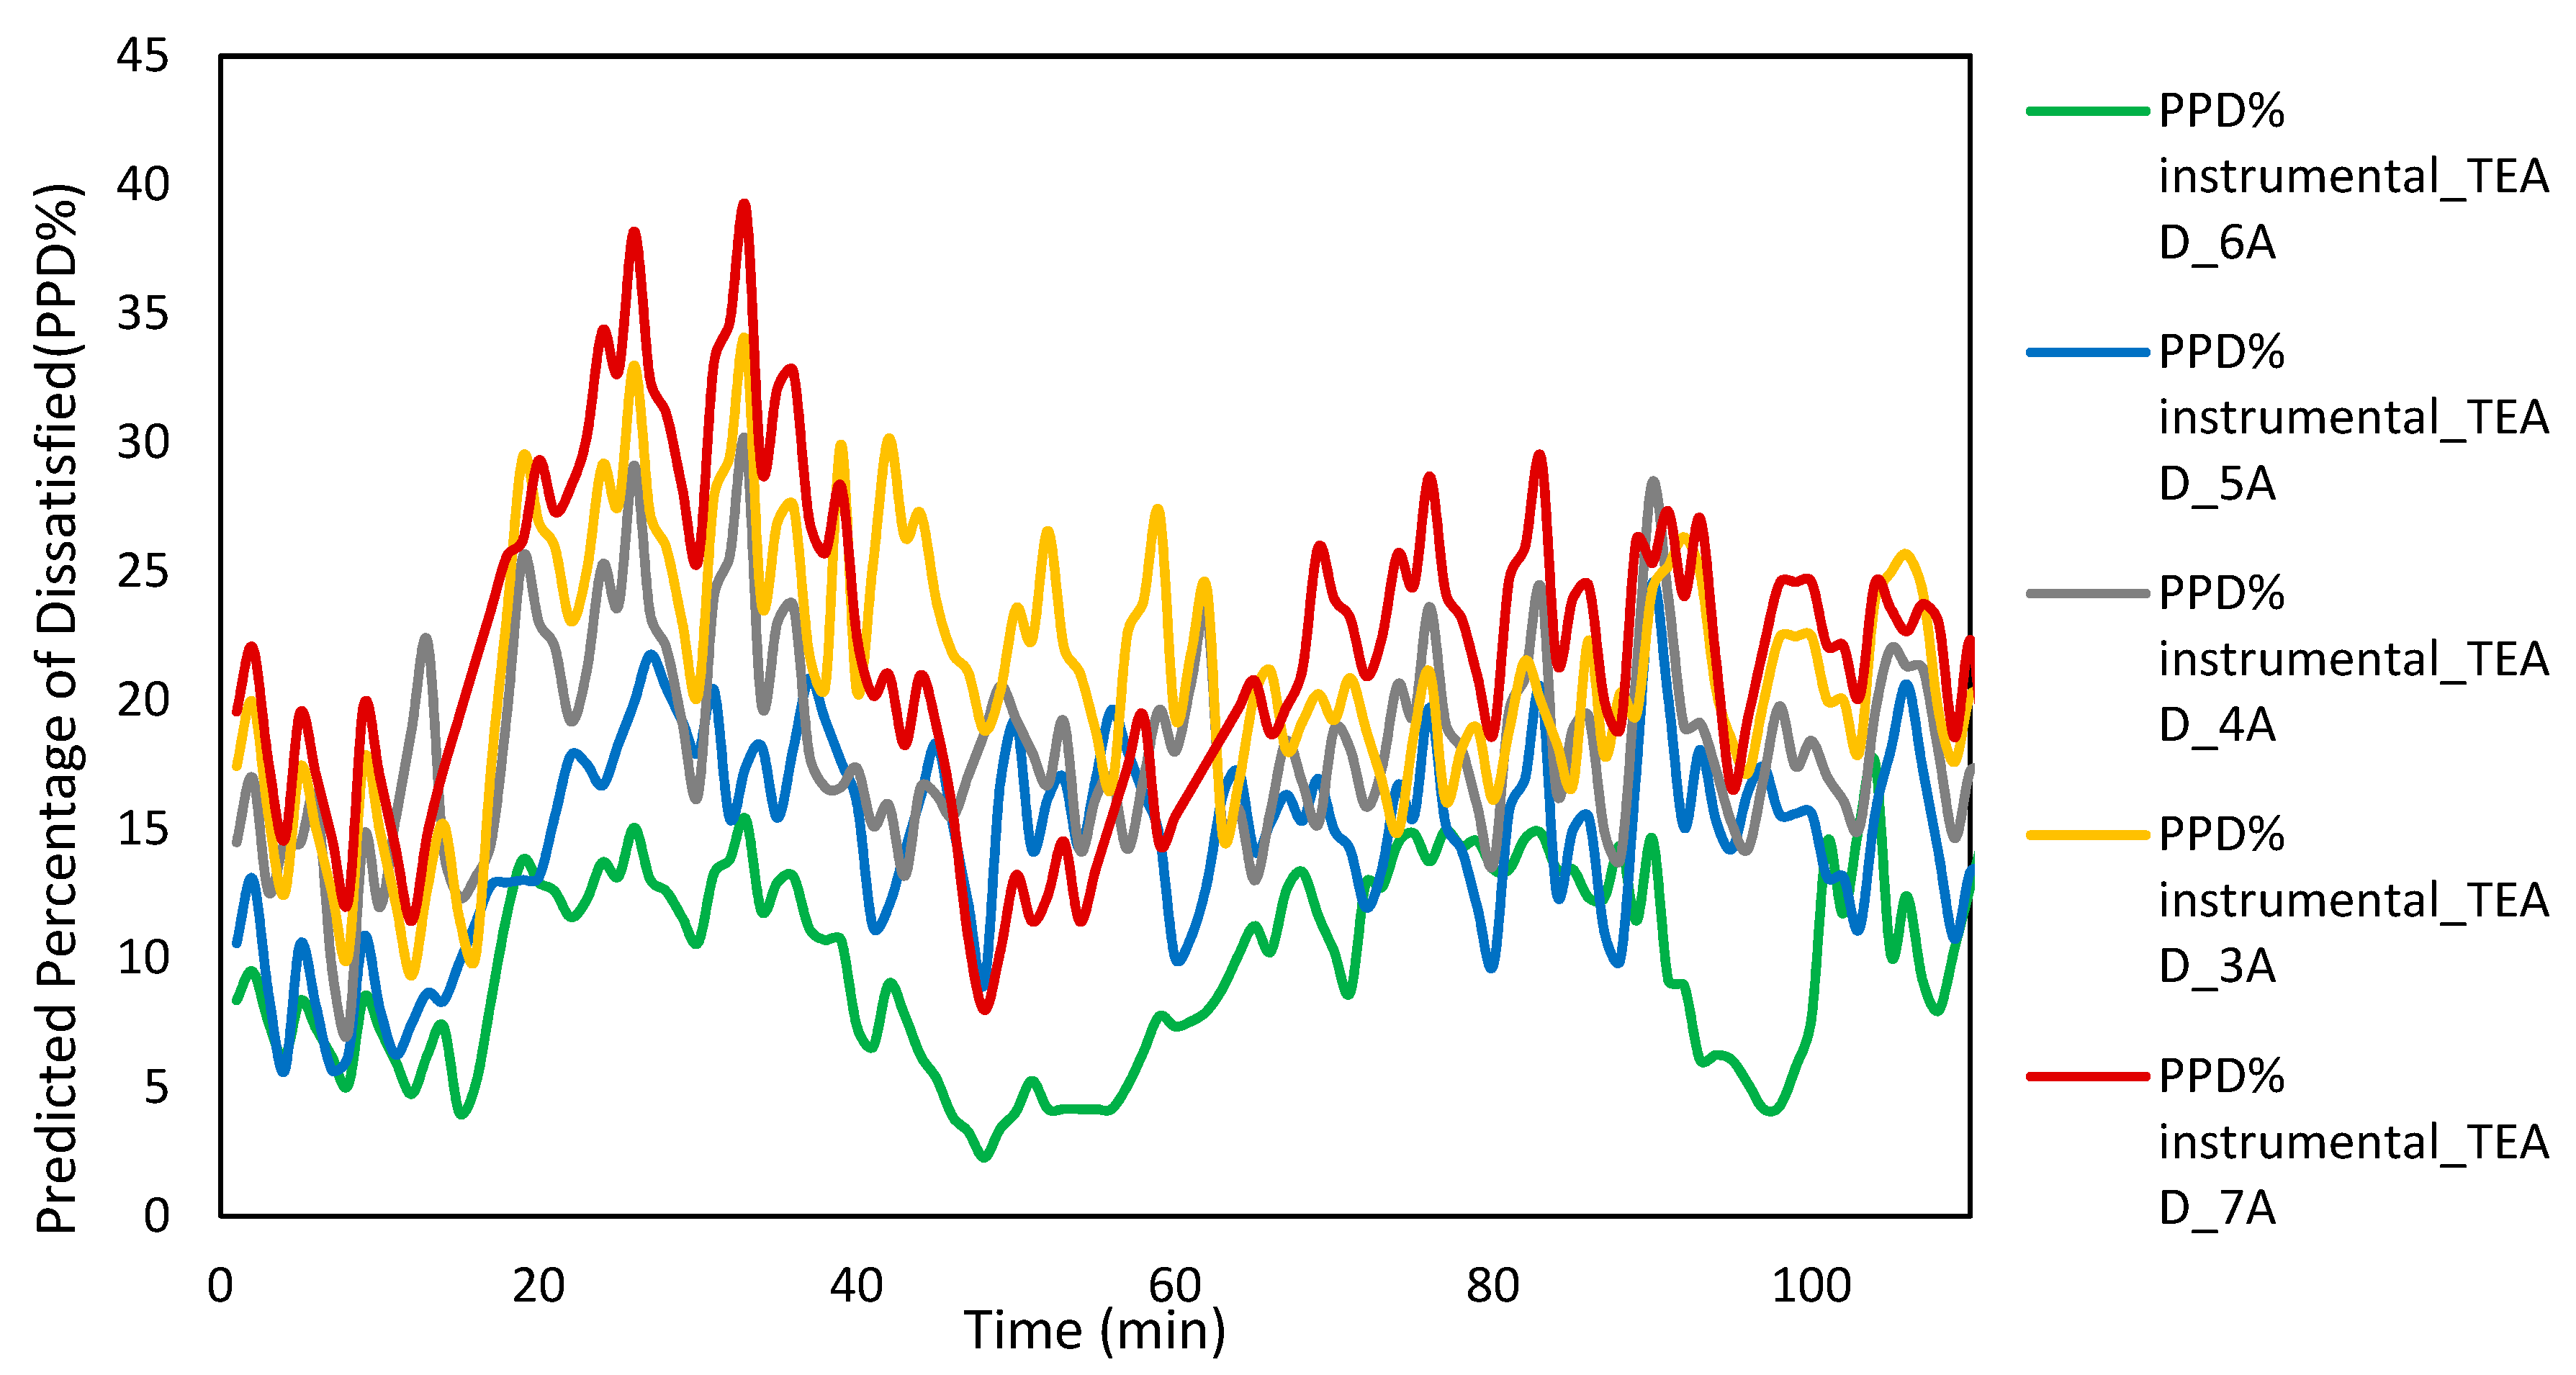
- Both the PMV and PPD ratings revealed that most of the tenants were thermally satisfied with the test-chamber microclimate when the TE-AD framework was operated at 720 W. At this power input, the PMV rating was in the range of ± 0.5, and PPD was in the range of 9%, thus meeting ASHRAE Standard 55.
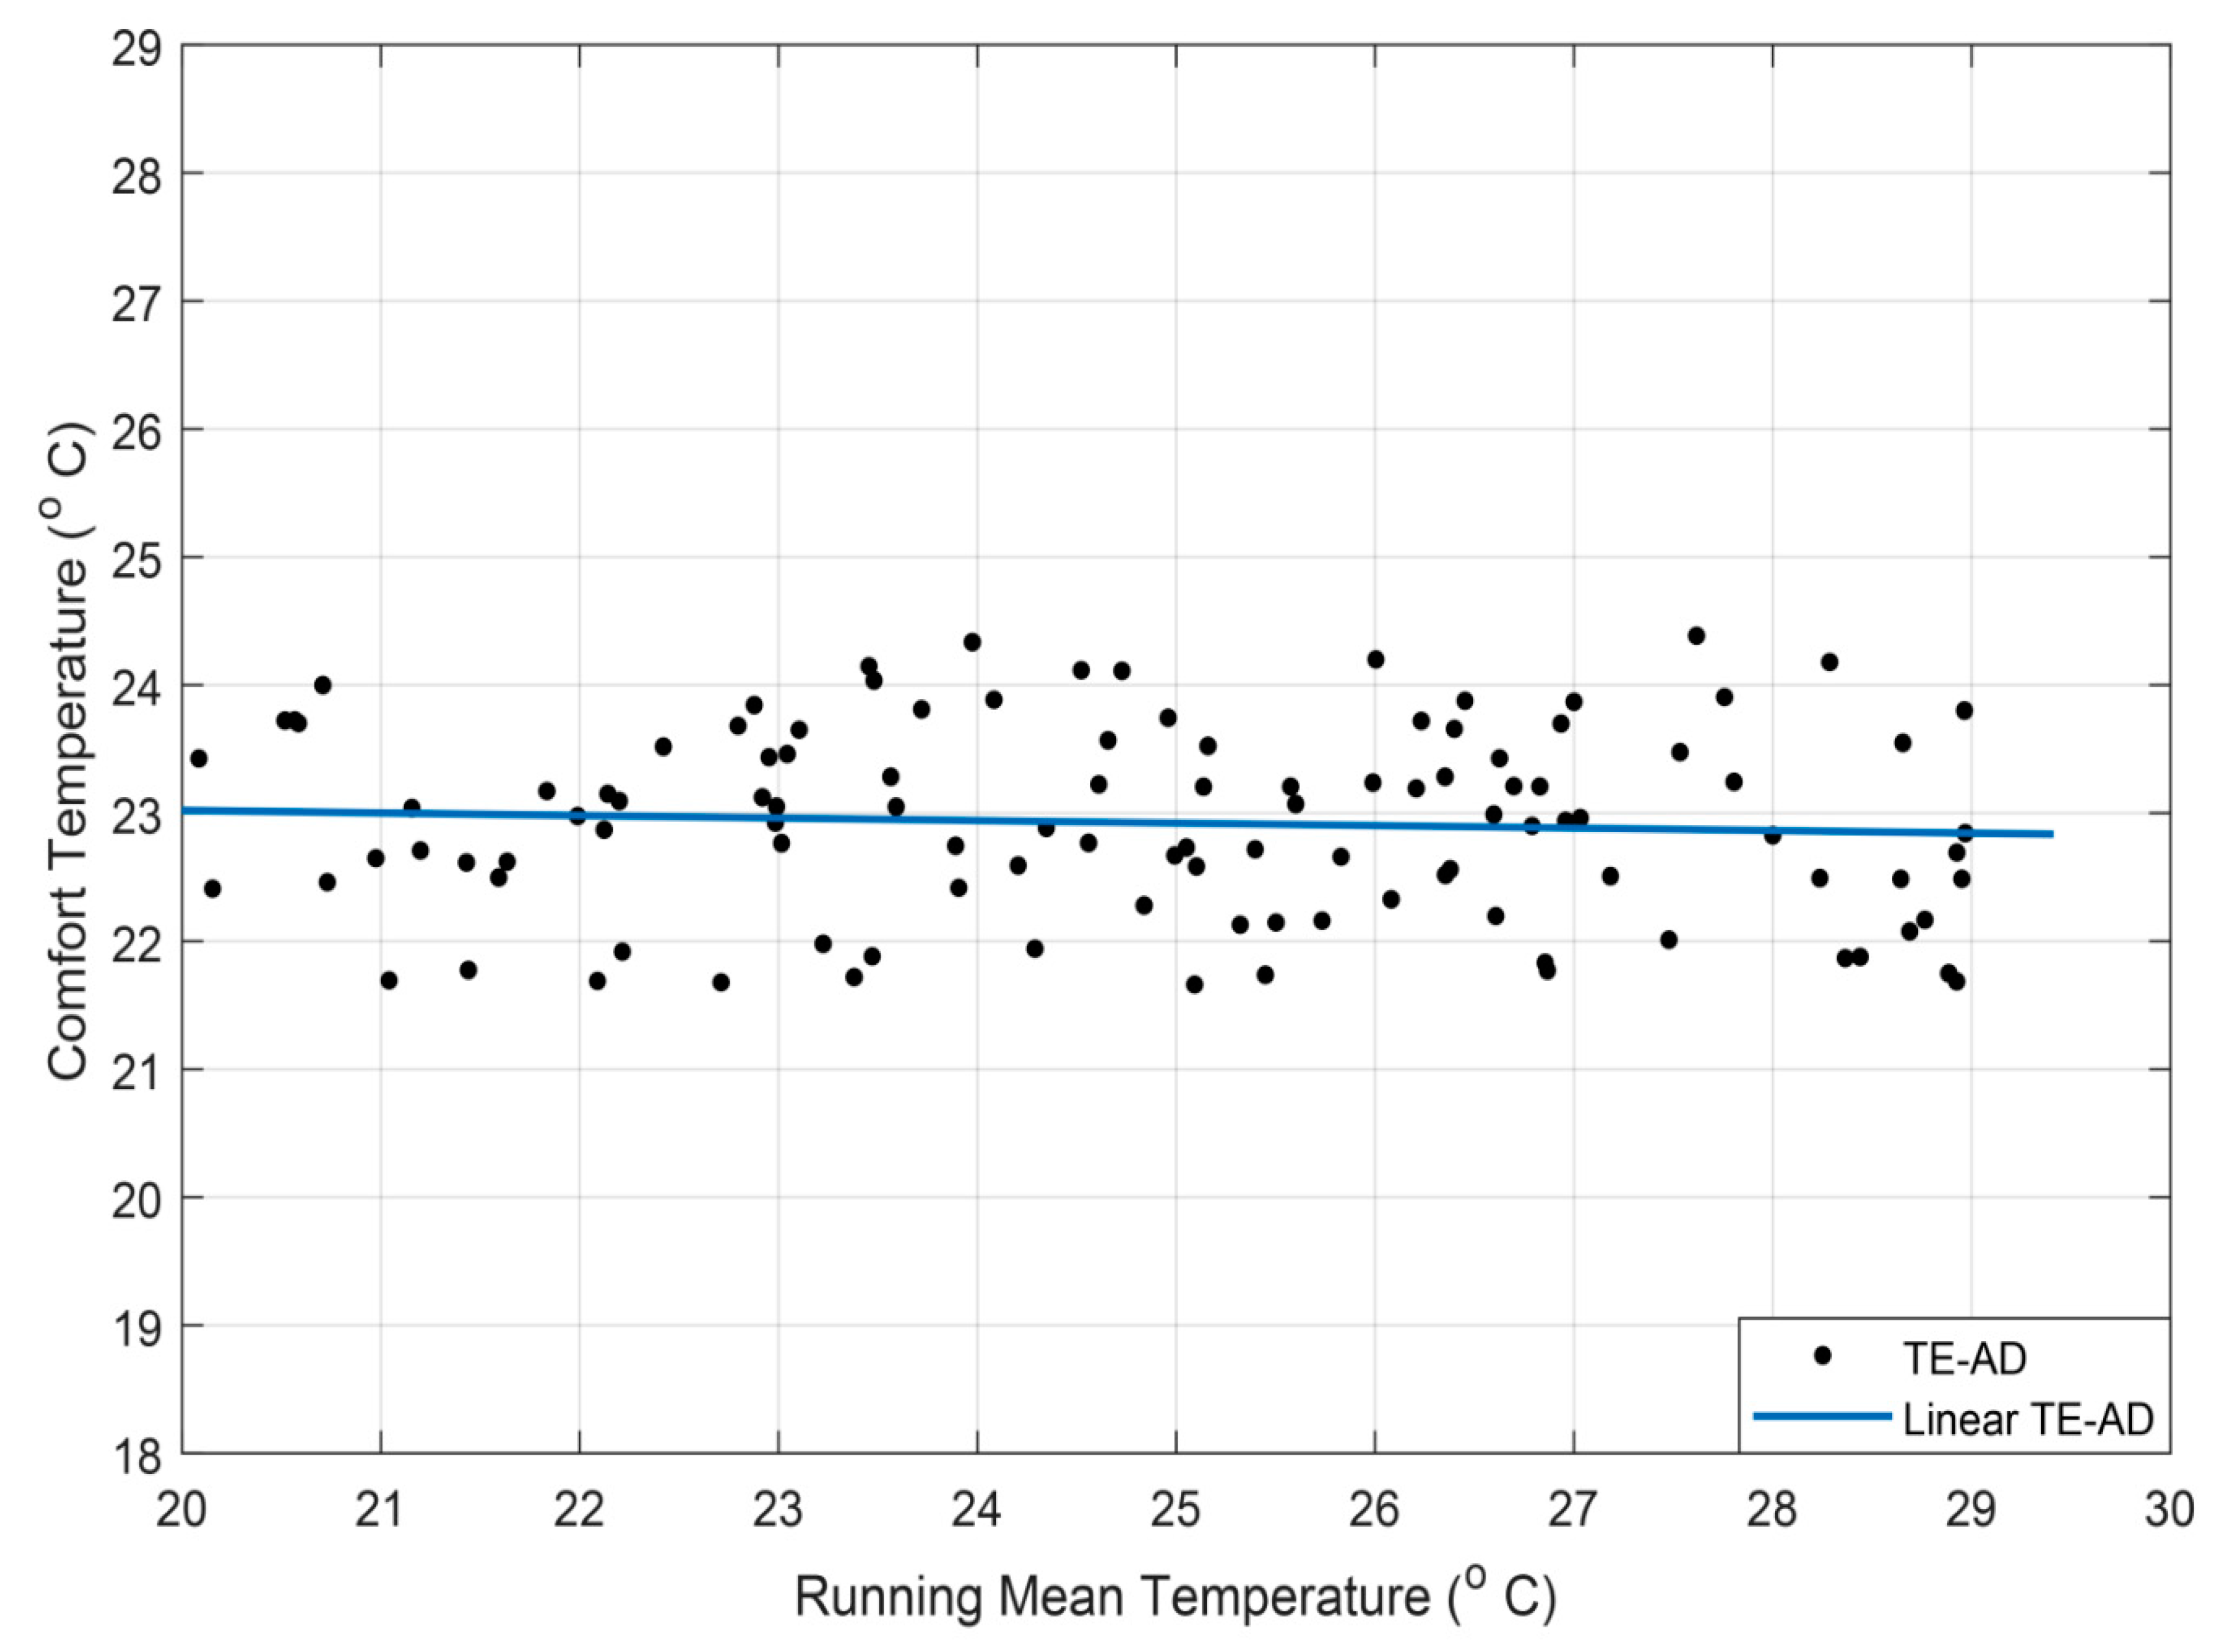
- The adaptive comfort temperature predicted Tcomfort was 23.7 ± 0.8 °C, at maximum and minimum values of 24.8 and 21.7 °C, respectively.
- Optimizing power of operation of the TE-AD is environmentally sustainable. Estimated reduction in CO2 emission was calculated to be around 38% as compared to the conventional air-conditioning.
Author Contributions
Funding
Acknowledgments
Conflicts of Interest
Nomenclature
| sample mean; | |
| CO2 | carbon dioxide; |
| COP | coefficient of performance; |
| CI | confidence interval; |
| D | globe diameter (m); |
| df | degree of freedom |
| E | energy (kWh/year) |
| hc | heat transfer coefficient by convection, W/(m2K); |
| hr | heat transfer coefficient by radiation, W/(m2K); |
| MST | mean skin temperature; |
| n | years; |
| N | number of participants; |
| n | sample size; |
| NREM | non-rapid eye movement; |
| p | significance level of the regression coefficient; |
| PMV | predictive mean vote; |
| PPD | predicted percentage dissatisfied; |
| PSQI | Pittsburgh sleep quality index; |
| R2 | coefficient of determination; |
| REM | rapid eye movement; |
| s | sample standard deviation; |
| SOL | sleep onset latency; |
| Ta | air temperature (°C); |
| Tcomfort | temperature of comfort (°C); |
| TE-AD | thermoelectric air duct system; |
| TEM | thermoelectric module; |
| Tg | globe bulb temperature (°C); |
| Tm(today) | the daily mean outdoor temperature of the day (°C); |
| Tmrt | radiant mean temperature (°C); |
| Topt | operative temperature (°C); |
| TRM | mean running temperature (°C); |
| Trm(today) | the mean running temperature for today (°C); |
| Tmrt | radiant mean temperature (°C); |
| TSV | thermal sensation vote; |
| va | velocity of air, m/s; |
| α | Griffiths constant; |
| ε | the globe sensor surface temperature emissivity; |
| μ | hypothesized population mean |
References
- He, M.; Lian, Z.; Chen, P. Evaluation on the performance of quilts based on young people’s sleep quality and thermal comfort in winter. Energy Build. 2019, 183, 174–183. [Google Scholar] [CrossRef]
- Lan, L.; Tsuzuki, K.; Liu, Y.F.; Lian, Z.W. Thermal environment and sleep quality: A review. Energy Build. 2017, 149, 101–113. [Google Scholar] [CrossRef]
- Joshi, S.S.; Lesser, T.J.; Olsen, J.W.; O’Hara, B.F. The importance of temperature and thermoregulation for optimal human sleep. Energy Build. 2016, 131, 153–157. [Google Scholar] [CrossRef]
- Zhu, M.L.; Ouyang, Q.; Shen, H.G.; Zhu, Y.X. Field study on the objective evaluation of sleep quality and sleeping thermal environment in summer. Energy Build. 2016, 133, 843–852. [Google Scholar] [CrossRef]
- Lan, L.; Lian, Z.W.; Qian, X.L.; Dai, C.Z. The effects of programmed air temperature changes on sleep quality and energy saving in bedroom. Energy Build. 2016, 129, 207–214. [Google Scholar] [CrossRef]
- Bruelisauer, M.; Chen, K.W.; Iyengar, R.; Leibundgut, H.; Li, C.; Li, M.; Mast, M.; Meggers, F.; Miller, C.; Rossi, D.; et al. BubbleZERO-design, construction and operation of a transportable research laboratory for low exergy building system evaluation in the tropics. Energies 2013, 6, 4551–4571. [Google Scholar] [CrossRef]
- Widiatmojo, A.; Chokchai, S.; Takashima, I.; Uchida, Y.; Yasukawa, K.; Chotpantarat, S.; Charusiri, P. Ground-source heat pumps with horizontal heat exchangers for space cooling in the hot tropical climate of Thailand. Energies 2019, 12, 1274. [Google Scholar] [CrossRef]
- Lim, J.; Yoon, M.S.; Al-Qahtani, T.; Nam, Y. Feasibility study on variable-speed air conditioner under hot climate based on real-scale experiment and energy simulation. Energies 2019, 12, 1489. [Google Scholar] [CrossRef]
- Escandón, R.; Suárez, R.; Sendra, J.J.; Ascione, F.; Bianco, N.; Mauro, G.M. Predicting the impact of climate change on thermal comfort in a building category: The Case of Linear-type Social Housing Stock in Southern Spain. Energies 2019, 12, 2238. [Google Scholar] [CrossRef]
- Pan, L.; Lian, Z.; Lan, L. Investigation of Gender Differences in Sleeping Comfort at Different Environmental Temperatures. Indoor Built Environ. 2012, 21, 811–820. [Google Scholar] [CrossRef]
- Harding, K.; Feldman, M. Sleep Disorders and Sleep Deprivation: An Unmet Public Health Problem. J. Am. Acad. Child Adolesc. Psychiatry 2008, 47, 473–474. [Google Scholar] [CrossRef]
- Olesen, J.; Gustavsson, A.; Svensson, M.; Wittchen, H.U.; Jönsson, B. The economic cost of brain disorders in Europe. Eur. J. Neurol. 2012, 19, 155–162. [Google Scholar] [CrossRef] [PubMed]
- Okamoto-Mizuno, K.; Mizuno, K. Effects of thermal environment on sleep and circadian rhythm. J. Physiol. Anthropol. 2012, 31, 1–9. [Google Scholar] [CrossRef] [PubMed]
- Morito, N.; Tsuzuki, K.; Mori, I.; Nishimiya, H. Effects of two kinds of air conditioner airflow on human sleep and thermoregulation. Energy Build. 2017, 138, 490–498. [Google Scholar] [CrossRef]
- Yang, B.; Olofsson, T. A questionnaire survey on sleep environment conditioned by different cooling modes in multistorey residential buildings of Singapore. Indoor Built Environ. 2015, 26, 21–31. [Google Scholar] [CrossRef]
- Pan, L.; Lian, Z.; Lan, L. Investigation of sleep quality under different temperatures based on subjective and physiological measurements. HVAC R Res. 2012, 18, 1030–1043. [Google Scholar]
- Irshad, K.; Habib, K.; Saidur, R.; Kareem, M.W.; Saha, B.B. Study of thermoelectric and photovoltaic facade system for energy efficient building development: A review. J. Clean. Prod. 2019, 209, 1376–1395. [Google Scholar] [CrossRef]
- Liu, D.; Cai, Y.; Zhao, F.Y. Optimal design of thermoelectric cooling system integrated heat pipes for electric devices. Energy 2017, 128, 403–413. [Google Scholar] [CrossRef]
- Irshad, K.; Khan, A.I.; Algarni, S.; Habib, K.; Saha, B.B. Objective and subjective evaluation of a sleeping environment test chamber with a thermoelectric air cooling system. Build. Environ. 2018, 141, 155–165. [Google Scholar] [CrossRef]
- Lertsatitthanakorn, C.; Wiset, L.; Atthajariyakul, S. Evaluation of the thermal comfort of a thermoelectric ceiling cooling panel (TE-CCP) system. J. Electron. Mater. 2009, 38, 1472–1477. [Google Scholar] [CrossRef]
- Maneewan, S.; Tipsaenprom, W.; Lertsatitthanakorn, C. Thermal comfort study of a compact thermoelectric air conditioner. J. Electron. Mater. 2010, 39, 1659–1664. [Google Scholar] [CrossRef]
- ASHRAE Handbook—HVAC Applications; ASHRAE: Atlanta, GA, USA, 2007; Available online: https://app.knovel.com/web/toc.v/cid:kpASHRAE12/viewerType:toc/ (accessed on 27 May 2018).
- Lertsatitthanakorn, C.; Tipsaenprom, T.; Srisuwan, W.; Atthajariyakul, S. Study on the cooling performance and thermal comfort of a thermoelectric ceiling cooling panel system. Indoor Built Environ. 2008, 17, 525–534. [Google Scholar] [CrossRef]
- Irshad, K.; Habib, K.; Basrawi, F.; Thirumalaiswamy, N.; Saidur, R.; Saha, B.B. Thermal comfort study of a building equipped with thermoelectric air duct system for tropical climate. Appl. Therm. Eng. 2015, 91, 1141–1151. [Google Scholar] [CrossRef]
- Irshad, K.; Habib, K.; Kareem, M.W.; Basrawi, F.; Saha, B.B. Evaluation of thermal comfort in a test room equipped with a photovoltaic assisted thermo-electric air duct cooling system. Int. J. Hydrogen Energy 2017, 42, 26956–26972. [Google Scholar] [CrossRef]
- Kimmling, M.; Hoffmann, S. Preliminary study of thermal comfort in buildings with PV-powered thermoelectric surfaces for radiative cooling. Energy Procedia 2017, 121, 87–94. [Google Scholar] [CrossRef]
- Irshad, K.; Habib, K.; Thirumalaiswamy, N.; Saha, B.B. Performance analysis of a thermoelectric air duct system for energy-efficient buildings. Energy 2015, 91, 1009–1017. [Google Scholar] [CrossRef]
- Doi, Y.; Minowa, M.; Uchiyama, M.; Okawa, M.; Kim, K.; Shibui, K.; Kamei, Y. Psychometric assessment of subjective sleep quality using the Japanese version of the Pittsburgh Sleep Quality Index (PSQI-J) in psychiatric disordered and control subjects. Psychiatry Res. 2000, 97, 165–172. [Google Scholar] [CrossRef]
- Irshad, K.; Algarni, S.; Jamil, B.; Ahmad, M.T.; Khan, M.A. Effect of gender difference on sleeping comfort and building energy utilization: Field study on test chamber with thermoelectric air-cooling system. Build Environ. 2019, 152, 214–227. [Google Scholar] [CrossRef]
- De Zambotti, M.; Goldstone, A.; Claudatos, S.; Colrain, I.M.; Baker, F.C. A validation study of Fitbit Charge 2TM compared with polysomnography in adults. Chronobiol. Int. 2018, 35, 465–476. [Google Scholar] [CrossRef] [PubMed]
- Lee, H.A.; Lee, H.J.; Moon, J.H.; Lee, T.; Kim, M.G.; In, H.; Cho, C.H.; Kim, L. Comparison of wearable activity tracker with actigraphy for sleep evaluation and circadian rest-activity rhythm measurement in healthy young adults. Psychiatry Investig. 2017, 14, 179–185. [Google Scholar] [CrossRef]
- ISO 15251. Indoor Environmental Input Parameters for Design and Assessment of Energy Performance of Buildings Addressing Indoor Air Quality, Thermal Environment, Lighting and Acoustics; ISO: Geneva, Switzerland, 2007. [Google Scholar]
- Nicole, F.; Humphreys, M. Derivation of the adaptive equations for thermal comfort in free-running buildings in European standard EN15251. Build. Environ. 2010, 45, 11–17. [Google Scholar] [CrossRef]
- Humphreys, M.A.; Rijal, H.B.; Nicol, J.F. Updating the adaptive relation between climate and comfort indoors; new insights and an extended database. Build. Environ. 2013, 63, 40–55. [Google Scholar] [CrossRef]
- Shafie, S.M.; Masjuki, H.H.; Mahlia, T.M.I. Life cycle assessment of rice straw-based power generation in Malaysia. Energy 2014, 70, 401–410. [Google Scholar] [CrossRef]
- Saidur, R. Energy consumption, energy savings, and emission analysis in Malaysian office buildings. Energy Policy 2009, 37, 4104–4113. [Google Scholar] [CrossRef]
- Rupp, R.F.; De Dear, R.; Ghisi, E. Field study of mixed-mode office buildings in Southern Brazil using an adaptive thermal comfort framework. Energy Build. 2018, 158, 1475–1486. [Google Scholar] [CrossRef]
- De Dear, R.; Kim, J.; Parkinson, T. Residential adaptive comfort in a humid subtropical climate—Sydney Australia. Energy Build. 2018, 158, 1296–1305. [Google Scholar] [CrossRef]
- Mustapa, M.S.; Zaki, S.A.; Rijal, H.B.; Hagishima, A.; Ali, M.S.M. Thermal comfort and occupant adaptive behaviour in Japanese university buildings with free running and cooling mode offices during summer. Build. Environ. 2016, 105, 332–342. [Google Scholar] [CrossRef]
- Albatayneh, A.; Alterman, D.; Page, A.; Moghtaderi, B. The impact of the thermal comfort models on the prediction of building energy consumption. Sustainability 2018, 10, 3609. [Google Scholar] [CrossRef]
- Dijk, D.J. Regulation and functional correlates of slow wave sleep. J. Clin. Sleep Med. 2009, 5, S6. [Google Scholar] [PubMed]
- Allan Hobson, J. A manual of standardized terminology, techniques and scoring system for sleep stages of human subjects. Electroencephalogr. Clin. Neurophysiol. 1969, 26, 644. [Google Scholar] [CrossRef]
- Vallières, A.; Ivers, H.; Beaulieu-Bonneau, S.; Morin, C.M. Predictability of sleep in patients with insomnia. Sleep 2011, 34, 609–617. [Google Scholar] [CrossRef]
- Alam, N.; Szymusiak, R.; McGinty, D. Local preoptic/anterior hypothalamic warming alters spontaneous and evoked neuronal activity in the magno-cellular basal forebrain. Brain Res. 1995, 696, 221–230. [Google Scholar] [CrossRef]
- Heath, M.; Johnston, A.; Dohnt, H.; Short, M.; Gradisar, M. The role of pre-sleep cognitions in adolescent sleep-onset problems. Sleep Med. 2018, 46, 117–121. [Google Scholar] [CrossRef] [PubMed]
- Irshad, K.; Habib, K.; Algarni, S.; Saha, B.B.; Jamil, B. Sizing and life-cycle assessment of building integrated thermoelectric air cooling and photovoltaic wall system. Appl. Therm. Eng. 2019, 154, 302–314. [Google Scholar] [CrossRef]
- Reinikainen, L.M.; Jaakkola, J.J.K. Significance of humidity and temperature on skin and upper airway symptoms. Indoor Air 2003, 13, 344–352. [Google Scholar] [CrossRef] [PubMed]
- Schneider, A.; Schuh, A.; Maetzel, F.K.; Rückerl, R.; Breitner, S.; Peters, A. Weather-induced ischemia and arrhythmia in patients undergoing cardiac rehabilitation: Another difference between men and women. Int. J. Biometeorol. 2008, 52, 535–547. [Google Scholar] [CrossRef] [PubMed]
- Höppe, P.; Martinac, I. Indoor climate and air quality. Review of current and future topics in the field of ISB study group 10. Int. J. Biometeorol. 1998, 42, 1–7. [Google Scholar]
- Okamoto-Mizuno, K.; Mizuno, K.; Michie, S.; Maeda, A.; Iizuka, S. Effects of humid heat exposure on human sleep stages and body temperature. Sleep 1999, 22, 767–773. [Google Scholar]
- Tsuzuki, K.; Okamoto-Mizuno, K.; Mizuno, K. Effects of humid heat exposure on sleep, thermoregulation, melatonin, and microclimate. J. Therm. Biol. 2004, 29, 31–36. [Google Scholar] [CrossRef]
- Lan, L.; Pan, L.; Lian, Z.; Huang, H.; Lin, Y. Experimental study on thermal comfort of sleeping people at different air temperatures. Build. Environ. 2014, 73, 24–31. [Google Scholar] [CrossRef]
- Strøm-tejsen, P.; Mathiasen, S.; Bach, M.; Petersen, S. The effects of increased bedroom air temperature on sleep and next-day mental performance. In Proceedings of the Proceeding Indoor Air, Ghent, Belgium, 3–8 July 2016. [Google Scholar]
- Czeisler, C.A.; Buxton, O.M.; Khalsa, S.B.S. The Human Circadian Timing System and Sleep-Wake Regulation. In Principles and Practice of Sleep Medicine; Elsevier, Inc.: Philadelphia, PA, USA, 2005; pp. 375–394. ISBN 9780721607979. [Google Scholar]
- Kräuchi, K.; Cajochen, C.; Werth, E.; Wirz-Justice, A. Functional link between distal vasodilation and sleep-onset latency? Am. J. Physiol. Regul. Integr. Comp. Physiol. 2000, 278, R741–R748. [Google Scholar] [CrossRef]
- Lack, L.; Gradisar, M. Acute finger temperature changes preceding sleep onsets over a 45-h period. J. Sleep Res. 2002, 11, 275–282. [Google Scholar] [CrossRef] [PubMed]
- ASHARE. ASHRAE Standard 55-2010: Thermal Environmental Conditions for Human Occupancy; Amercian Society of Heating, Refrigerating and Air Conditioning Engineers, Inc.: Atlanta, GA, USA, 2013; p. 58. [Google Scholar]
- Somers, V.K.; Dyken, M.E.; Mark, A.L.; Abboud, F.M. Sympathetic-Nerve Activity during Sleep in Normal Subjects. N. Engl. J. Med. 1993, 328, 303–307. [Google Scholar] [CrossRef]


| Sex | Sample Size | Age | Height (m) | Mass (kg) | BMI (kg/m2) |
|---|---|---|---|---|---|
| Male | 15 | 28.3 ± 4.8 * | 1.69 ± 0.07 | 70.2 ± 0.7 | 24.3 ± 1.7 |
| Ta:Topt | Tg:Ta | ||||||
|---|---|---|---|---|---|---|---|
| Equation | R2 | RMSE | p | Equation | R2 | RMSE | p |
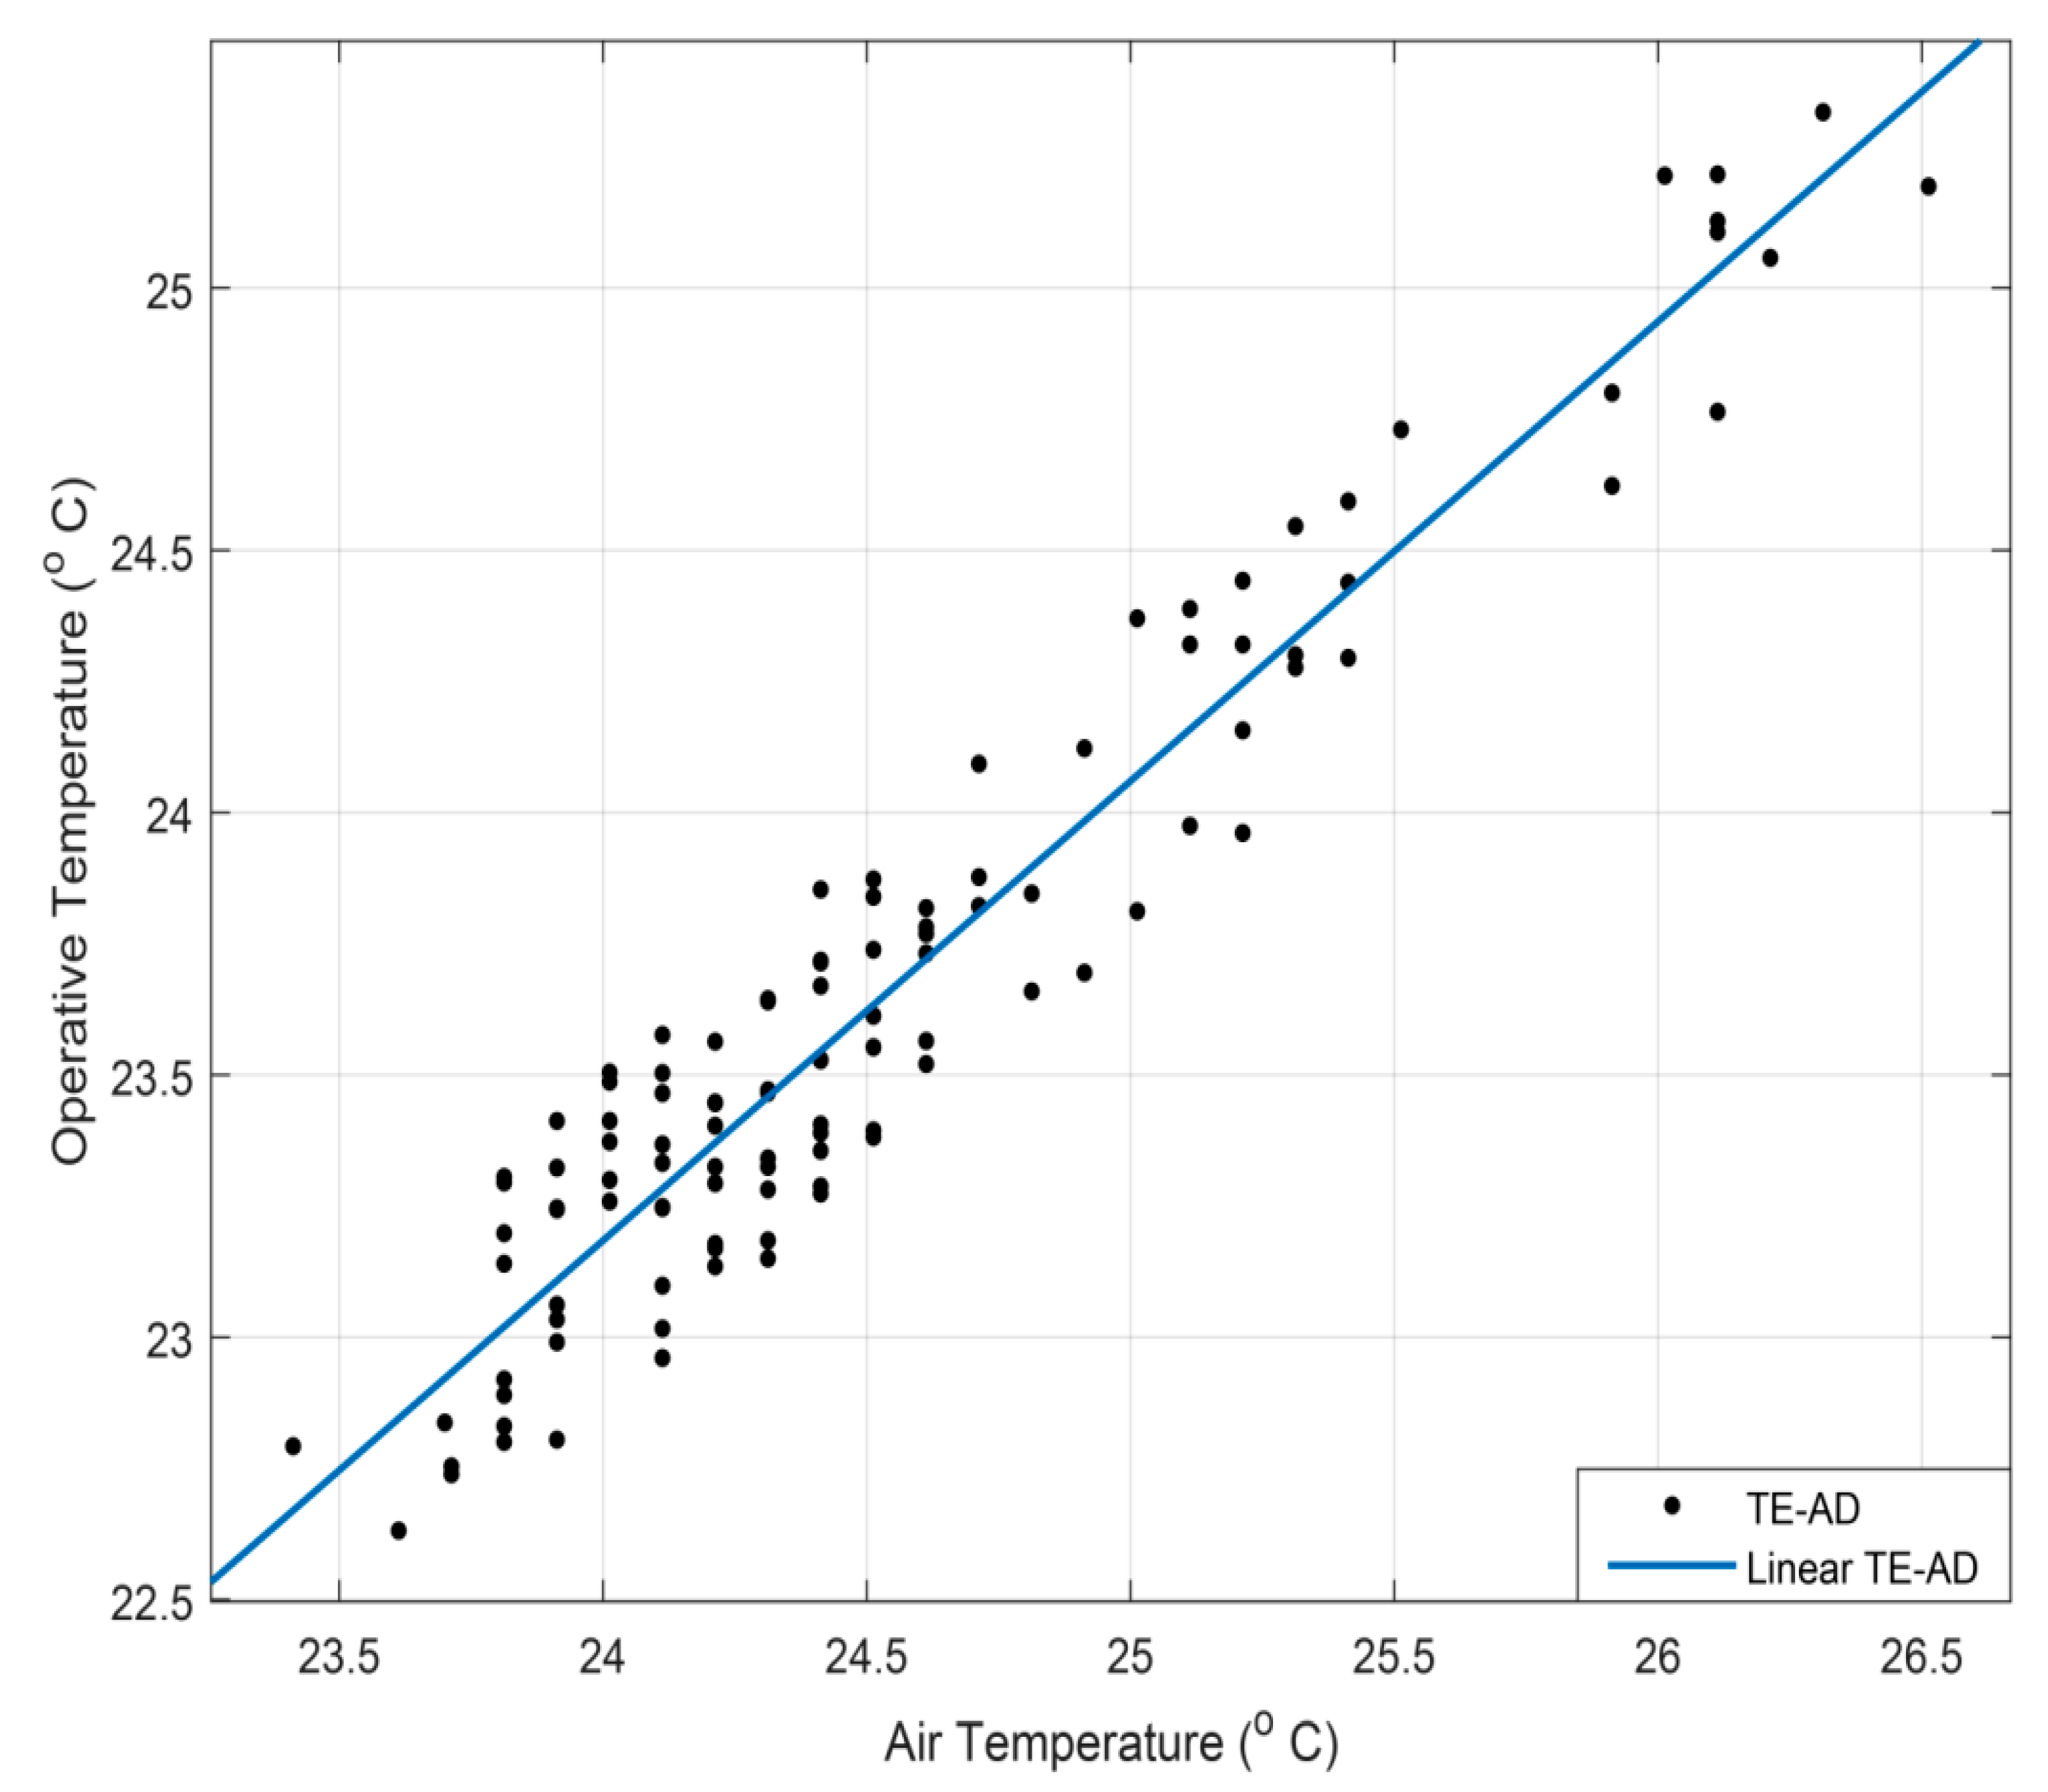
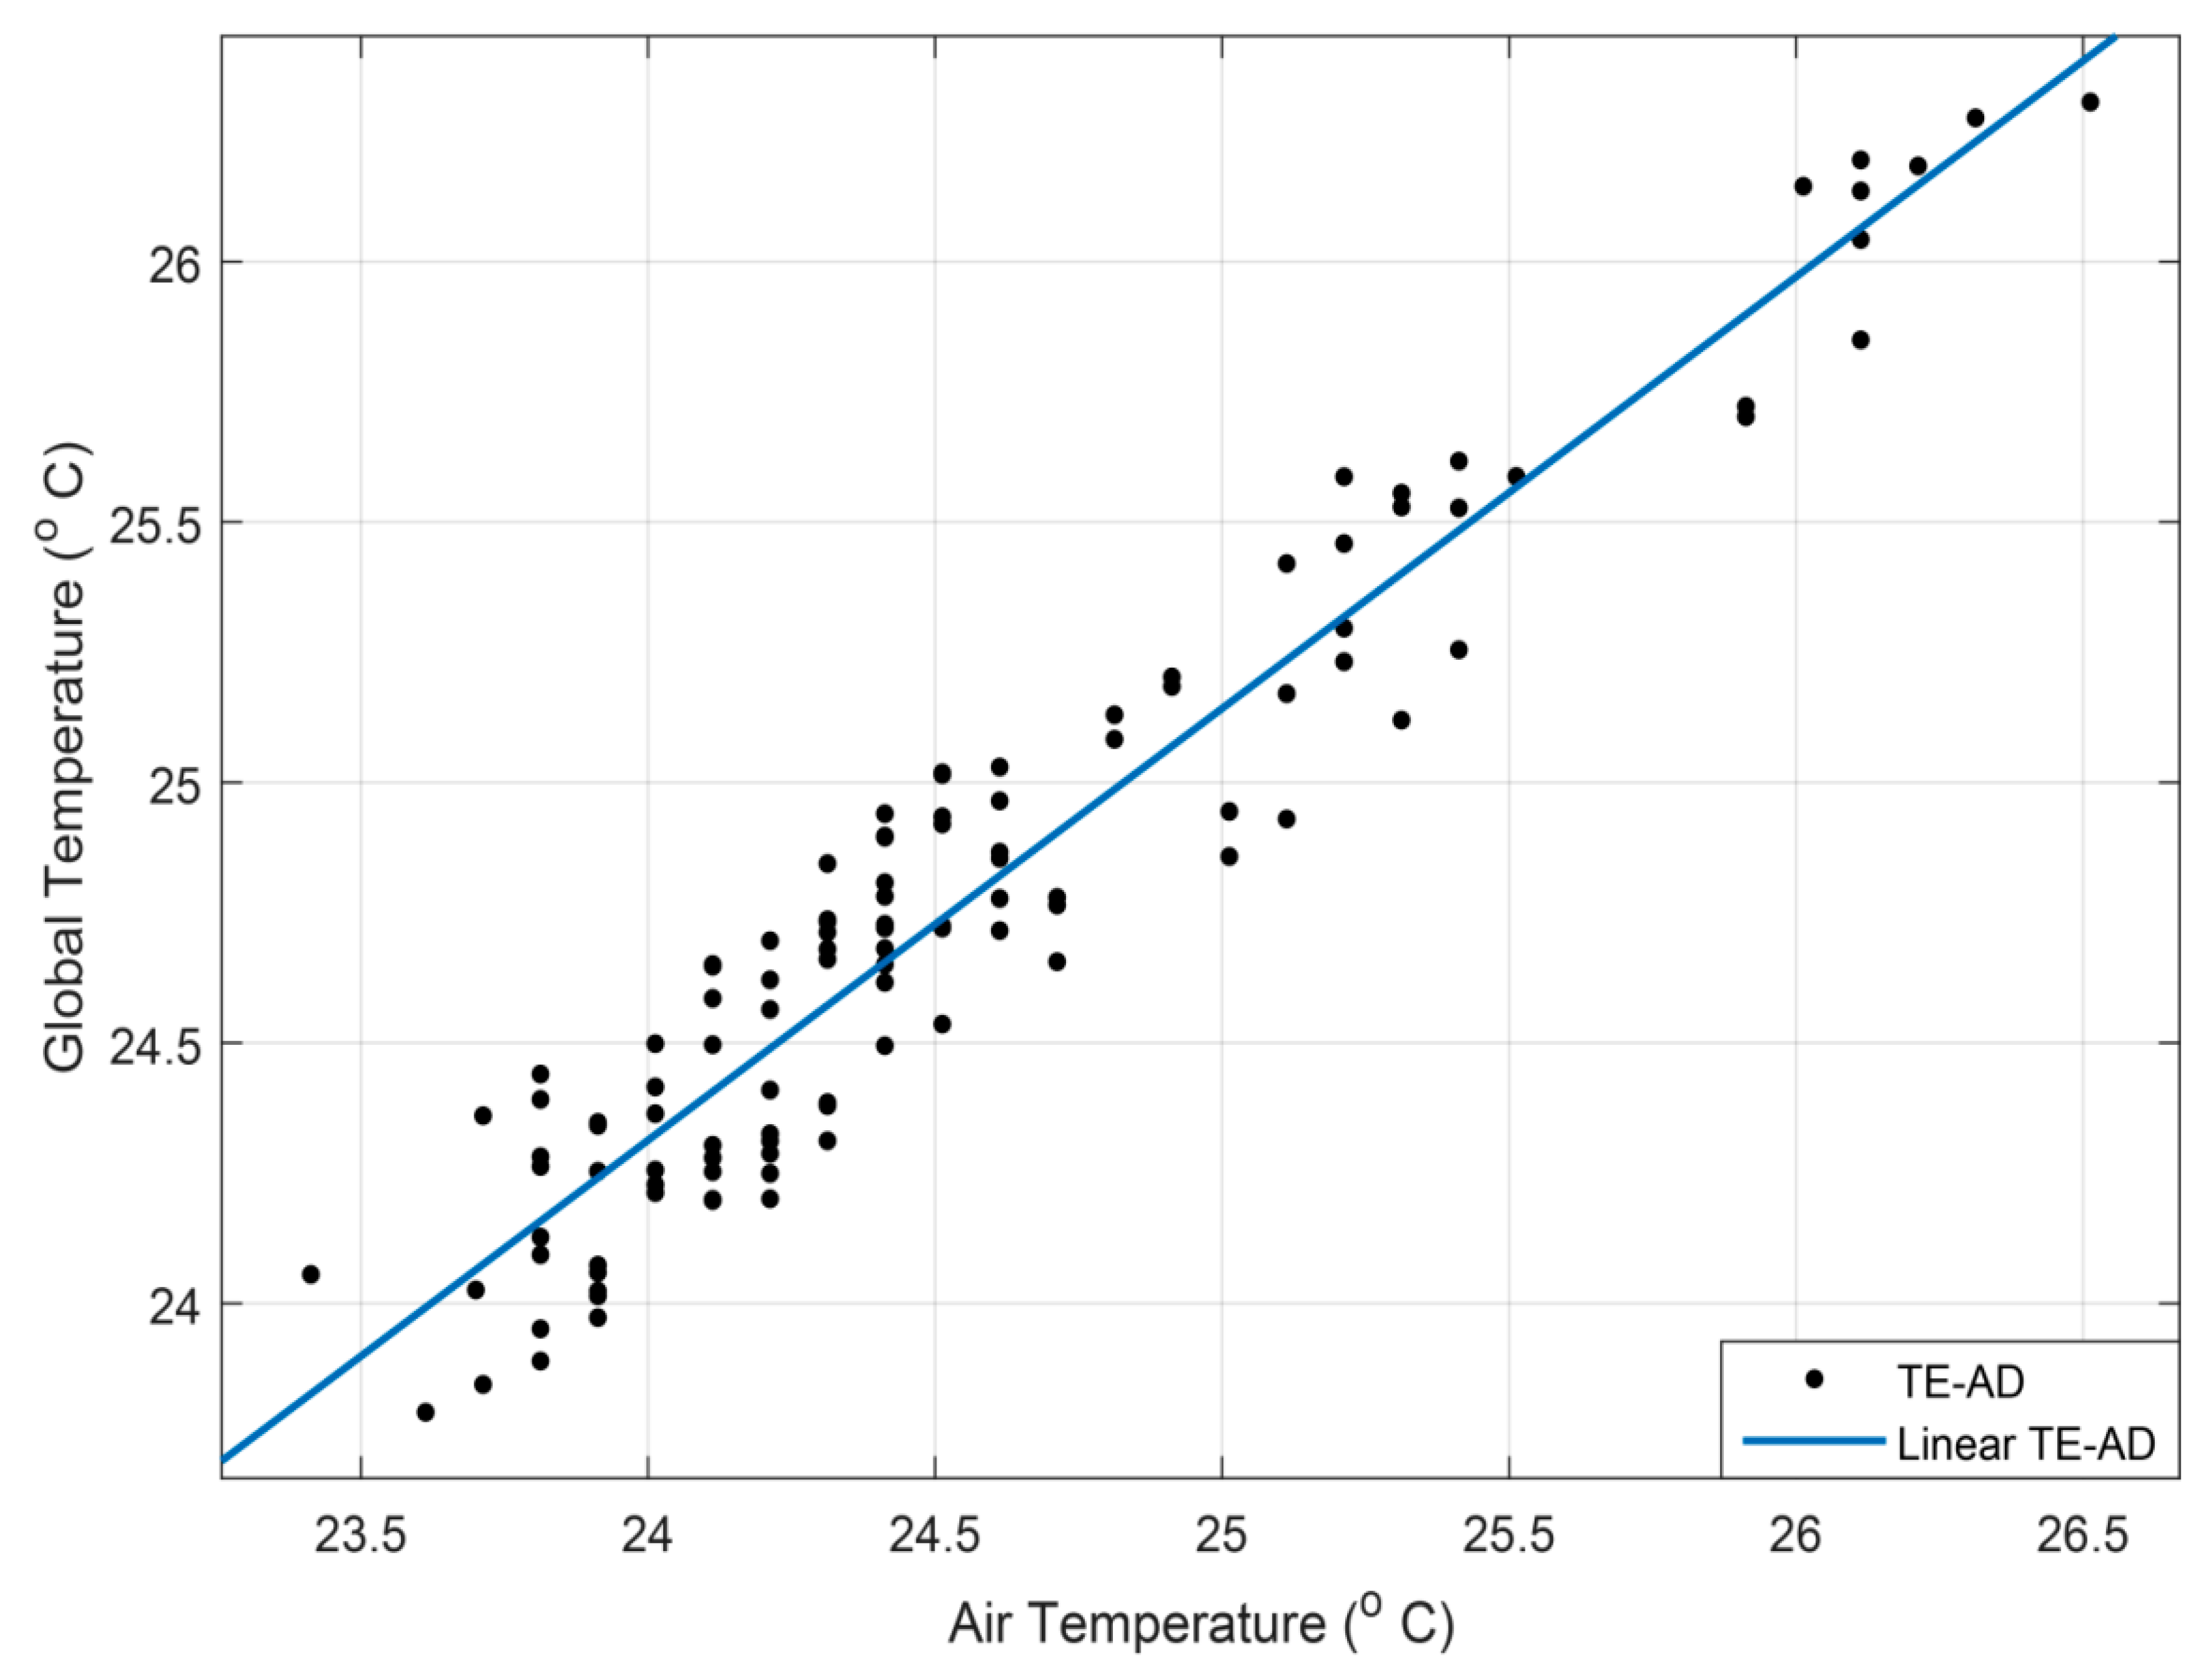
| Topt = 0.876 × Ta + 2.162 | 0.9138 | 0.1835 | <0.001 | Tg = 0.8289 × Ta + 4.419 | 0.9043 | 0.1731 | <0.001 |
| Condition | Sample Size (N) | Mean Tcomfort (SD) | ||
|---|---|---|---|---|
| α = 0.25 | α = 0.33 | α = 0.50 | ||
| TSV (4) | 15 | 24.1(2.1) | 24.1(1.9) | 24.1(1.5) |
| TSV (1–3) | 15 | 23.4(3.2) | 22.8(3.8) | 23.1(2.6) |
| TSV (5–7) | 15 | 25.4(4.5) | 26.2(3.7) | 24.8(2.1) |
© 2019 by the authors. Licensee MDPI, Basel, Switzerland. This article is an open access article distributed under the terms and conditions of the Creative Commons Attribution (CC BY) license (http://creativecommons.org/licenses/by/4.0/).
Share and Cite
Irshad, K.; Algarni, S.; Ahmad, M.T.; Irfan, S.A.; Habib, K.; Abdelmohimen, M.A.H.; Zahir, M.H.; Ahmed, G.M.S. Microclimate Thermal Management Using Thermoelectric Air-Cooling Duct System Operated at Five Incremental Powers and its Effect on Sleep Adaptation of the Occupants. Energies 2019, 12, 3695. https://doi.org/10.3390/en12193695
Irshad K, Algarni S, Ahmad MT, Irfan SA, Habib K, Abdelmohimen MAH, Zahir MH, Ahmed GMS. Microclimate Thermal Management Using Thermoelectric Air-Cooling Duct System Operated at Five Incremental Powers and its Effect on Sleep Adaptation of the Occupants. Energies. 2019; 12(19):3695. https://doi.org/10.3390/en12193695
Chicago/Turabian StyleIrshad, Kashif, Salem Algarni, Mohammad Tauheed Ahmad, Sayed Ameenuddin Irfan, Khairul Habib, Mostafa A.H. Abdelmohimen, Md. Hasan Zahir, and Gulam Mohammed Sayeed Ahmed. 2019. "Microclimate Thermal Management Using Thermoelectric Air-Cooling Duct System Operated at Five Incremental Powers and its Effect on Sleep Adaptation of the Occupants" Energies 12, no. 19: 3695. https://doi.org/10.3390/en12193695
APA StyleIrshad, K., Algarni, S., Ahmad, M. T., Irfan, S. A., Habib, K., Abdelmohimen, M. A. H., Zahir, M. H., & Ahmed, G. M. S. (2019). Microclimate Thermal Management Using Thermoelectric Air-Cooling Duct System Operated at Five Incremental Powers and its Effect on Sleep Adaptation of the Occupants. Energies, 12(19), 3695. https://doi.org/10.3390/en12193695