Article

Modeling of a PCM TES Tank Used as an Alternative Heat Sink for a Water Chiller. Analysis of Performance and Energy Savings

1
Department of Mathematics, Universidad Cardenal Herrera-CEU, CEU Universities, Physics and Technological Sciences. C/San Bartolomé, 55, 46115 Alfara del Patriarca, Valencia, Spain
2
ISTENER Research Group, Department of Mechanical Engineering and Construction, Universitat Jaume I, Campus de Riu Sec s/n, E12071 Castelló de la Plana, Spain
3
Department of Industrial Engineering, University of Salerno, Via Giovanni Paolo II 132, 84084 Fisciano (SA), Italy
*
Author to whom correspondence should be addressed.
Energies 2019, 12(19), 3652; https://doi.org/10.3390/en12193652
Submission received: 30 July 2019 / Revised: 14 September 2019 / Accepted: 19 September 2019 / Published: 24 September 2019
(This article belongs to the Special Issue Refrigeration Systems and Applications 2019)

Abstract

:
Phase change materials (PCMs) can be used in refrigeration systems to redistribute the thermal load. The main advantages of the overall system are a more stable energy performance, energy savings, and the use of the off-peak electric tariff. This paper proposes, models, tests, and analyzes an experimental water vapor compression chiller connected to a PCM thermal energy storage (TES) tank that acts as an alternative heat sink. First, the transient model of the chiller-PCM system is proposed and validated through experimental data directly measured from a test bench where the PCM TES tank is connected to a vapor compression-based chiller. A maximum deviation of 1.2 °C has been obtained between the numerical and experimental values of the PCM tank water outlet temperature. Then, the validated chiller-PCM system model is used to quantify (using the coefficient of performance, COP) and to analyze its energy performance and its dependence on the ambient temperature. Moreover, electrical energy saving curves are calculated for different ambient temperature profiles, reaching values between 5% and 15% taking the experimental system without PCM as a baseline. Finally, the COP of the chiller-PCM system is calculated for different temperatures and use scenarios, and it is compared with the COP of a conventional aerothermal chiller to determine the switch ambient temperature values for which the former provides energy savings over the latter.

Graphical Abstract

1. Introduction

In 1997 the existence of global warming was recognized worldwide through the Kyoto Protocol [1], resulting in a global commitment to reduce greenhouse gas emissions in which the anthropogenic CO2 emissions were pointed out as the main cause. Later, in December 2015, the Paris Agreement [2] established measures to hold the increase in the global average temperature by 2100 to well below 2 °C above pre-industrial levels.
The International Institute of Refrigeration estimates that the total number of refrigeration, air-conditioning, and heat pump systems in operation worldwide is roughly 3 billion. This sector consumes about 17% of the overall used electricity worldwide [3] and accounts for 7.8% of global greenhouse gas emissions [4]. According to the International Energy Agency, the residential and commercial sectors were responsible for 43% of natural gas and 49% of world electricity final consumption in 2015 [5].
Phase change materials (PCMs) are widely used to reduce energy consumption in buildings. They can be incorporated as a passive element in buildings to increase the thermal inertia of its components. Applying PCM to the building envelope can reduce indoor temperature peaks and heating, ventilation and air-conditioning (HVAC) cooling load [6]. PCMs can also be utilized to save energy in radiant floor heating systems [7] or included in the roof to reduce the through roof heat gain in buildings [8].
Another application of PCM to enhance energy efficiency is its use in thermal energy storage (TES) systems to provide a greater energy storage capacity in a narrower temperature range. In this way, Anisur et al. [9] highlighted that TES, in general and particularly PCMs, could provide energy savings and, hence, reductions in CO2 emissions. PCM TES systems can be included in solar water heating systems to provide higher heat storage and thermal efficiency [10]. They can also be included in an air-PCM heat exchanger for passive cooling of buildings where a cooling storage unit is cooled during the night to reduce the indoor air temperature during the day [11]. Ventilation systems with PCM can also be applied to air-conditioned buildings granting electricity energy savings [12].
Vapor compression systems (VCS) with aerothermal dissipation are an extended solution for HVAC systems in residential and commercial buildings [13]. PCM based TES systems can improve their efficiency with a load shift from on-peak to off-peak periods to take advantage of a lower electricity tariff and a lower condensing air temperature [14]. Ruddell et al. [15] concluded that, in a city with high air-conditioning peak demand (Phoenix, Arizona, USA), the distributed cold TES technology could reduce the peak air-conditioning electrical power demand by 23% and the peak total electrical power demand, by 13%.
However, as a disadvantage, energy storage for cooling purposes must be done at temperatures widely below ambient temperature, typically between 0 and 10 °C [16]. Therefore, all PCM TES systems experience tank thermal losses that typically range between 1% and 5% per day [17]. These losses make cold storage strategies inefficient when the energy is stored for long periods.
A less extended application of TES systems consists in using PCMs as an alternative heat sink to improve the performance of the system. During the day, when the outside temperature rises and lowers the energy performance of the chiller, the PCM tank provides a lower temperature heat sink. Then, the heat accumulated in the tank is released at night when the temperature falls. These applications use PCMs with melting temperatures around the average outdoor temperature, which reduces the ambient thermal losses. Until today, few publications have assessed this topic. Zhao and Tan analysed the use of a finned shell-and-tube PCM thermal storage system to dissipate the heat of a prototype thermoelectric cooling system [18] and an air-conditioning application [19]. The authors focused on the design parameters of the PCM TES and how they affected the heat exchange on it.
There is a lack of research on the parameters that affect the energy performance of vapor compression chillers when a PCM TES is used as a heat sink. Making a direct COP comparison between them and a conventional chiller can be considered difficult. The electrical consumption of the first system is divided into two stages, differed in time (day and night), and the temperatures of the TES system and the ambient air influence its energy performance. Therefore, this work models and studies the use of an experimental PCM TES system as an alternative dissipation sink for a chiller. It focuses on the system energy performance and savings and analyses how different ambient temperature profiles affect it. The model is defined and appropriately validated using experimental data from a test rig assembled and tested at different operating conditions. It is complemented by a methodology that evaluates the energy savings provided by this kind of chiller-PCM system. After that, this model is used to perform simulations of each functioning mode of the system that represent different ambient temperature conditions using energy performance curves, which are included in this paper. Finally, the energy performance of the chiller-PCM mode is compared with that of a conventional aerothermal mode to determine the best temperature to switch between them.

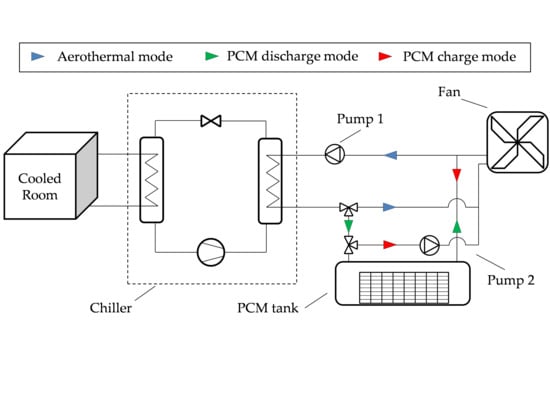
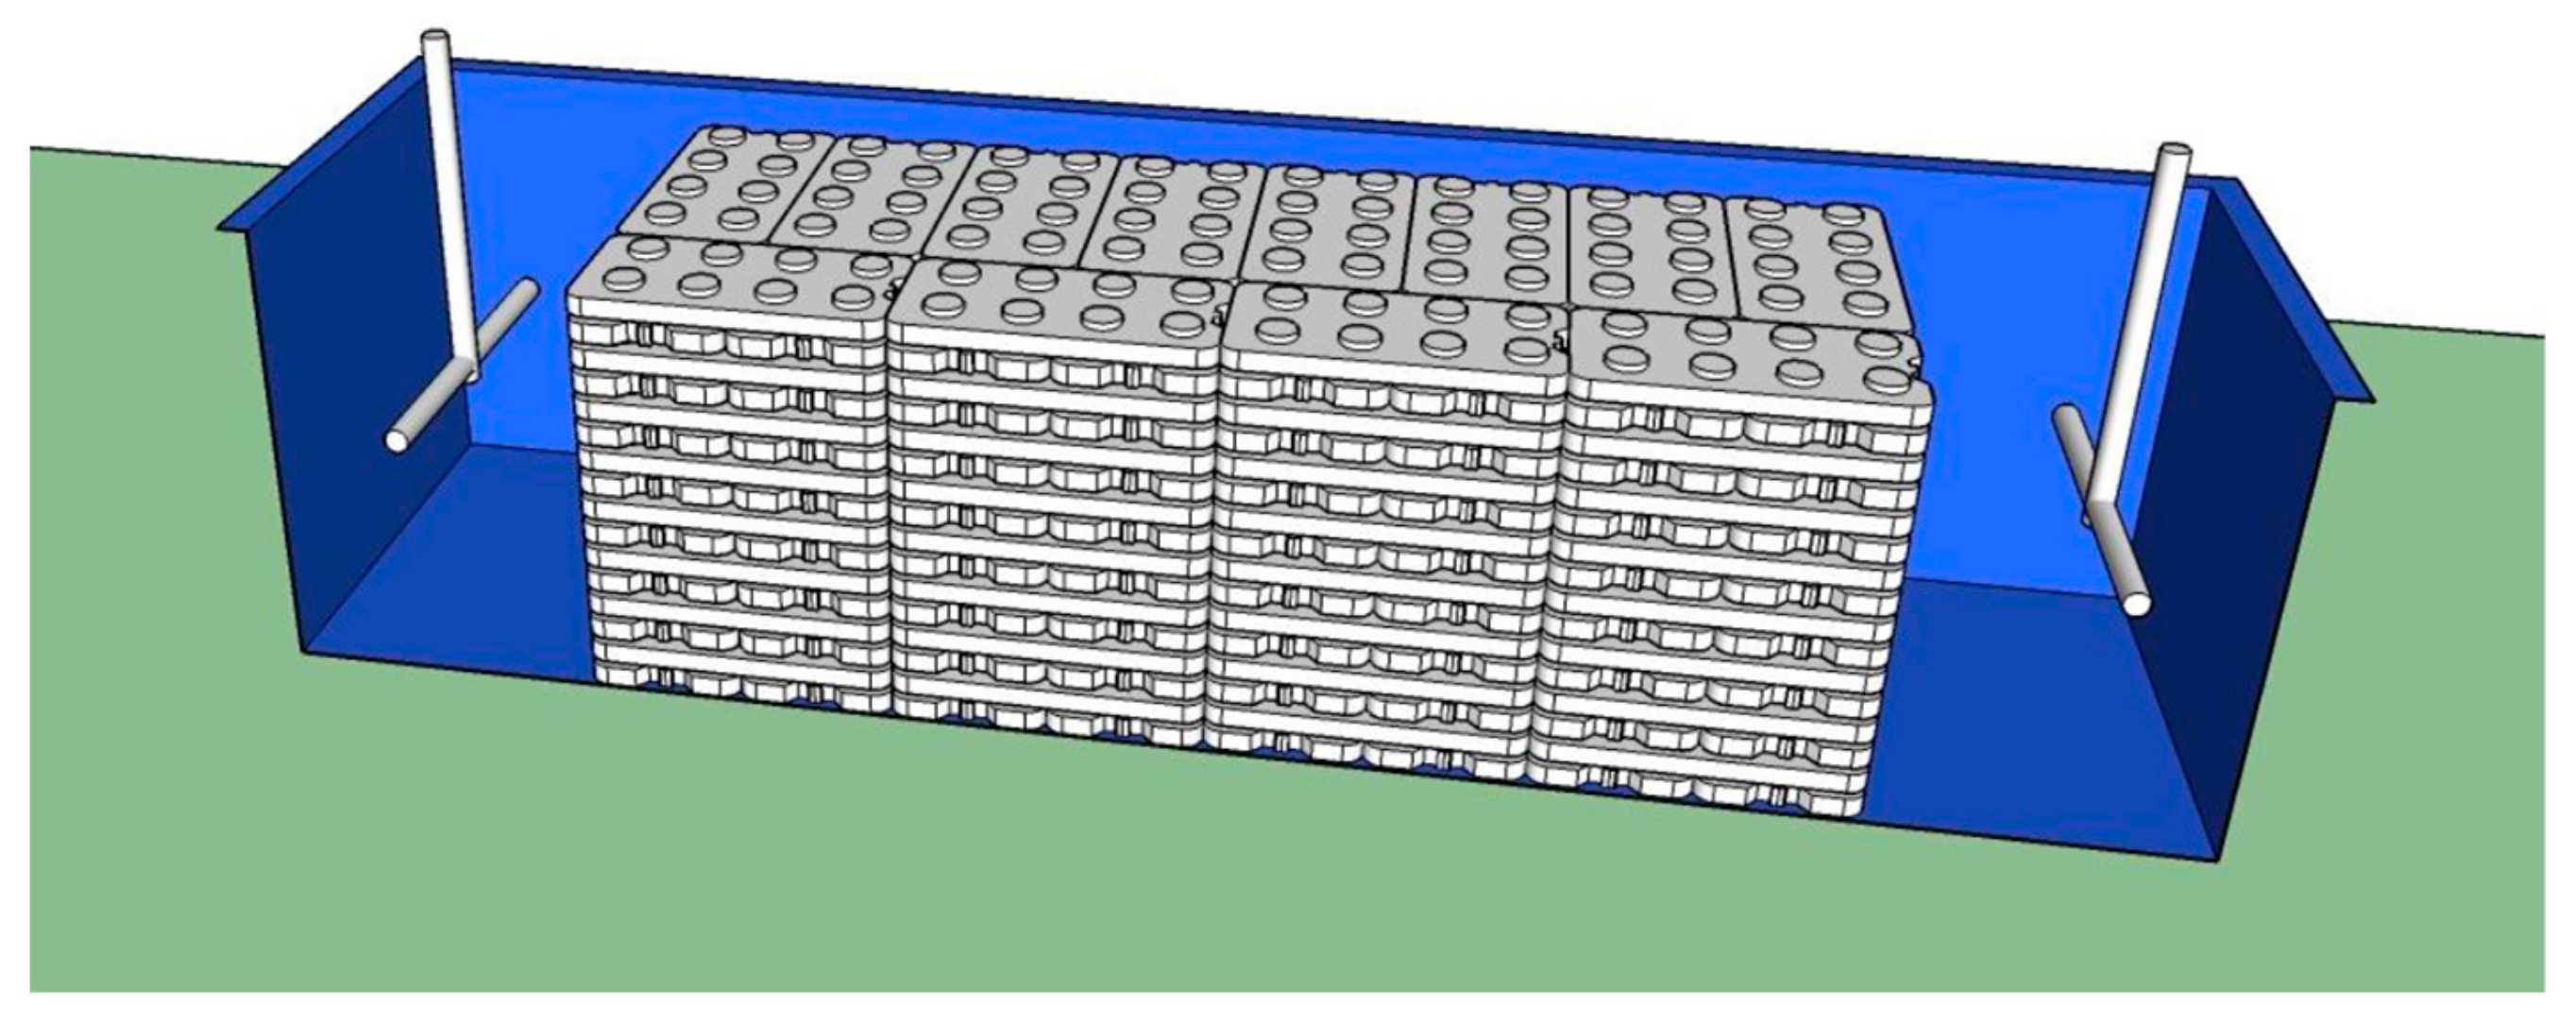
2. Chiller-PCM System Description

A schematic diagram of the proposed chiller-PCM system is presented in Figure 1. The chiller is connected to the cooled room (cold sink) through the evaporator and to the two alternative heat sinks, a fan, and the PCM tank, through the condenser. During the daytime, at low ambient temperatures, the chiller uses the fan as a sink (aerothermal mode). When the ambient temperature rises and lowers the COP of the chiller, the heat sink is switched to the PCM tank obtaining a lower condensing temperature (PCM discharge mode). During the nighttime, when the ambient temperature falls, the heat stored in the PCM tank is released using the fan (PCM charge mode). The PCM charge and discharge modes (PCM mode) used instead of the aerothermal mode can imply a reduction in the electrical consumption of the overall system.
A monitored test bench has been adapted to characterize the performance of the described chiller-PCM system. This experimental facility consisted of a PCM tank connected to a VCS with a proportional integral derivative (PID) controlled thermal load circuit on the evaporator side and to an aerothermal dissipation system.
The PCM tank was made of polymeric material, and its dimensions were 3 × 0.75 × 0.75 meters. Inside it, 192 PCM containers were arranged in 16 layers of 12 containers each (Figure 2). The PCM containers were placed in the center of the tank, leaving 0.5 meters free on each side for a proper water flow homogenization. Furthermore, water was driven to and from the tank using PVC T-shaped pipes with multiple holes for proper water distribution.
The overall latent heat of the PCM containers set was 1674 MJ, sized to dissipate a 6-kW thermal load over more than 7 hours. The PCM used was the commercially available salt hydrate S27 from PCM Products Ltd [20], and its main properties are shown in Table 1, where latent heat was obtained from the study carried out by Barreneche et al. [21]. Moreover, S27 was encapsulated in high-density polyethylene 0.5 × 0.25 × 0.032 m containers.
The main components of the VCS were a shell (refrigerant) and tube (water) condenser, an R134a thermostatic expansion valve, a flat plate evaporator (glycol based secondary fluid), and an open alternative compressor driven by a 7.5 kW electric motor. The working fluid was the hydrofluorocarbon R134a, typically used in water chillers. The main temperatures and pressures of the system were registered as well as the refrigerant mass flow rate, secondary fluids volumetric flow rate and compressor electricity consumption. In the thermal load circuit, 15 kW resistances controlled by a PID set the temperature of a thermally insulated deposit. The aerothermal dissipation system consisted of a 190 W fan and a 7.9 kW chiller.

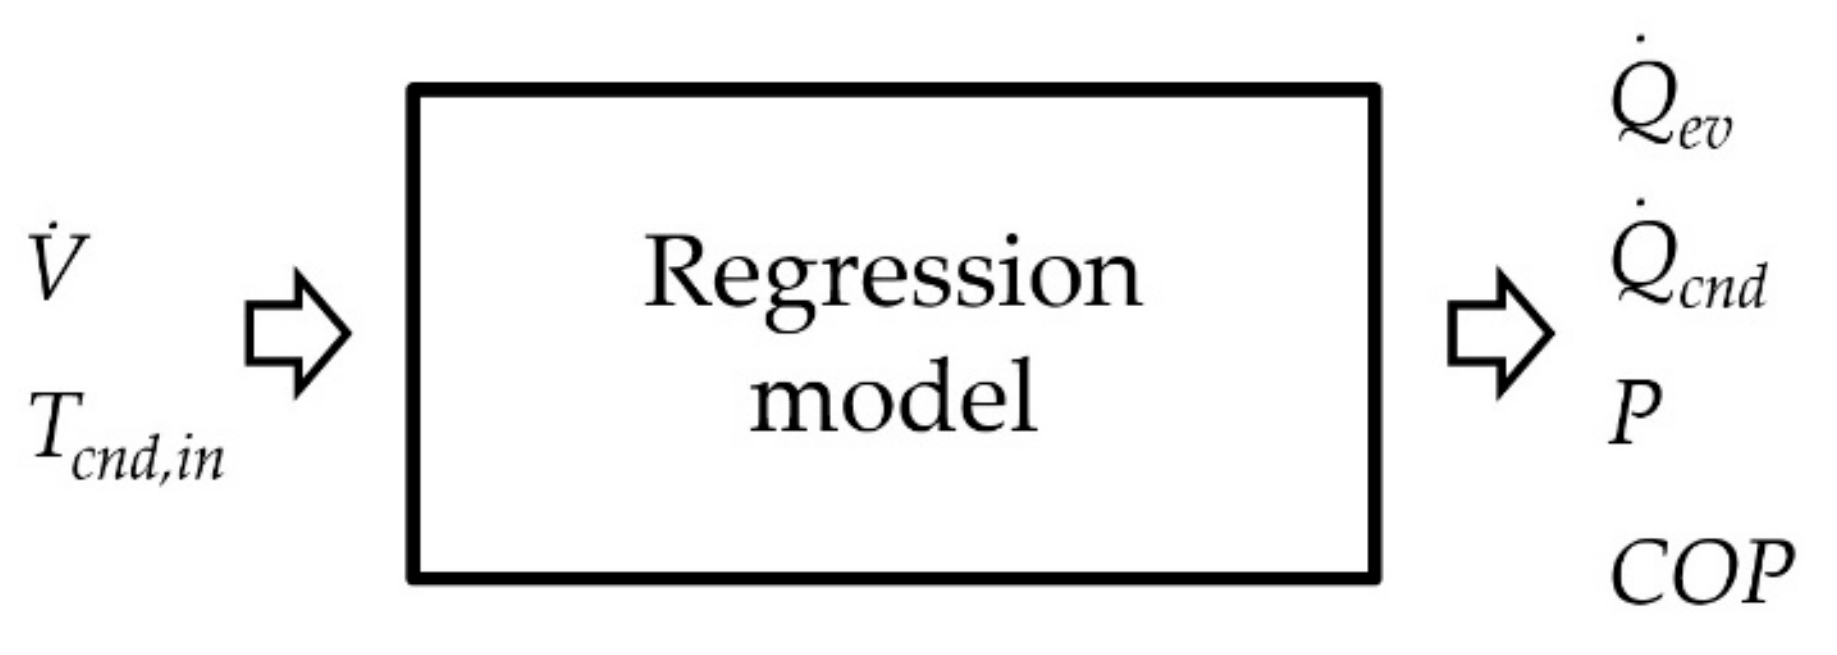
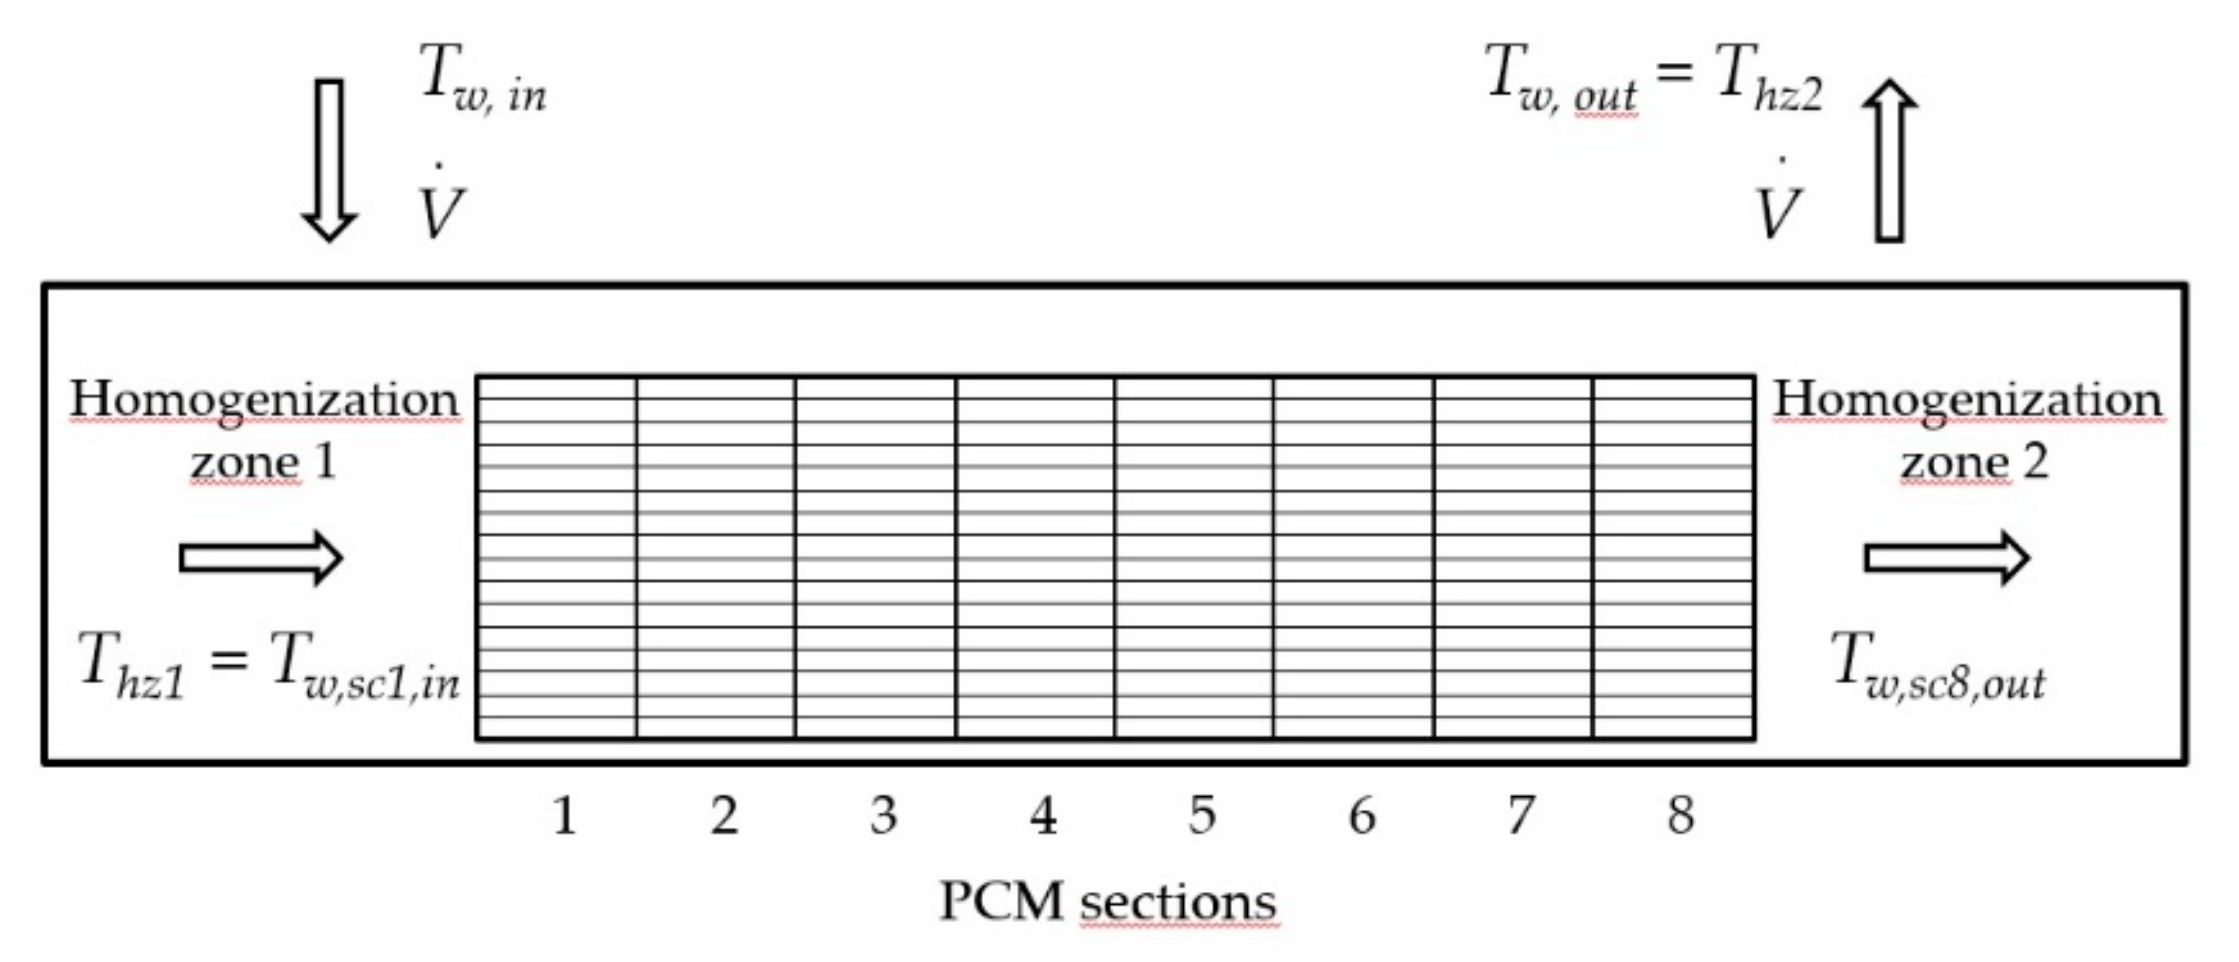
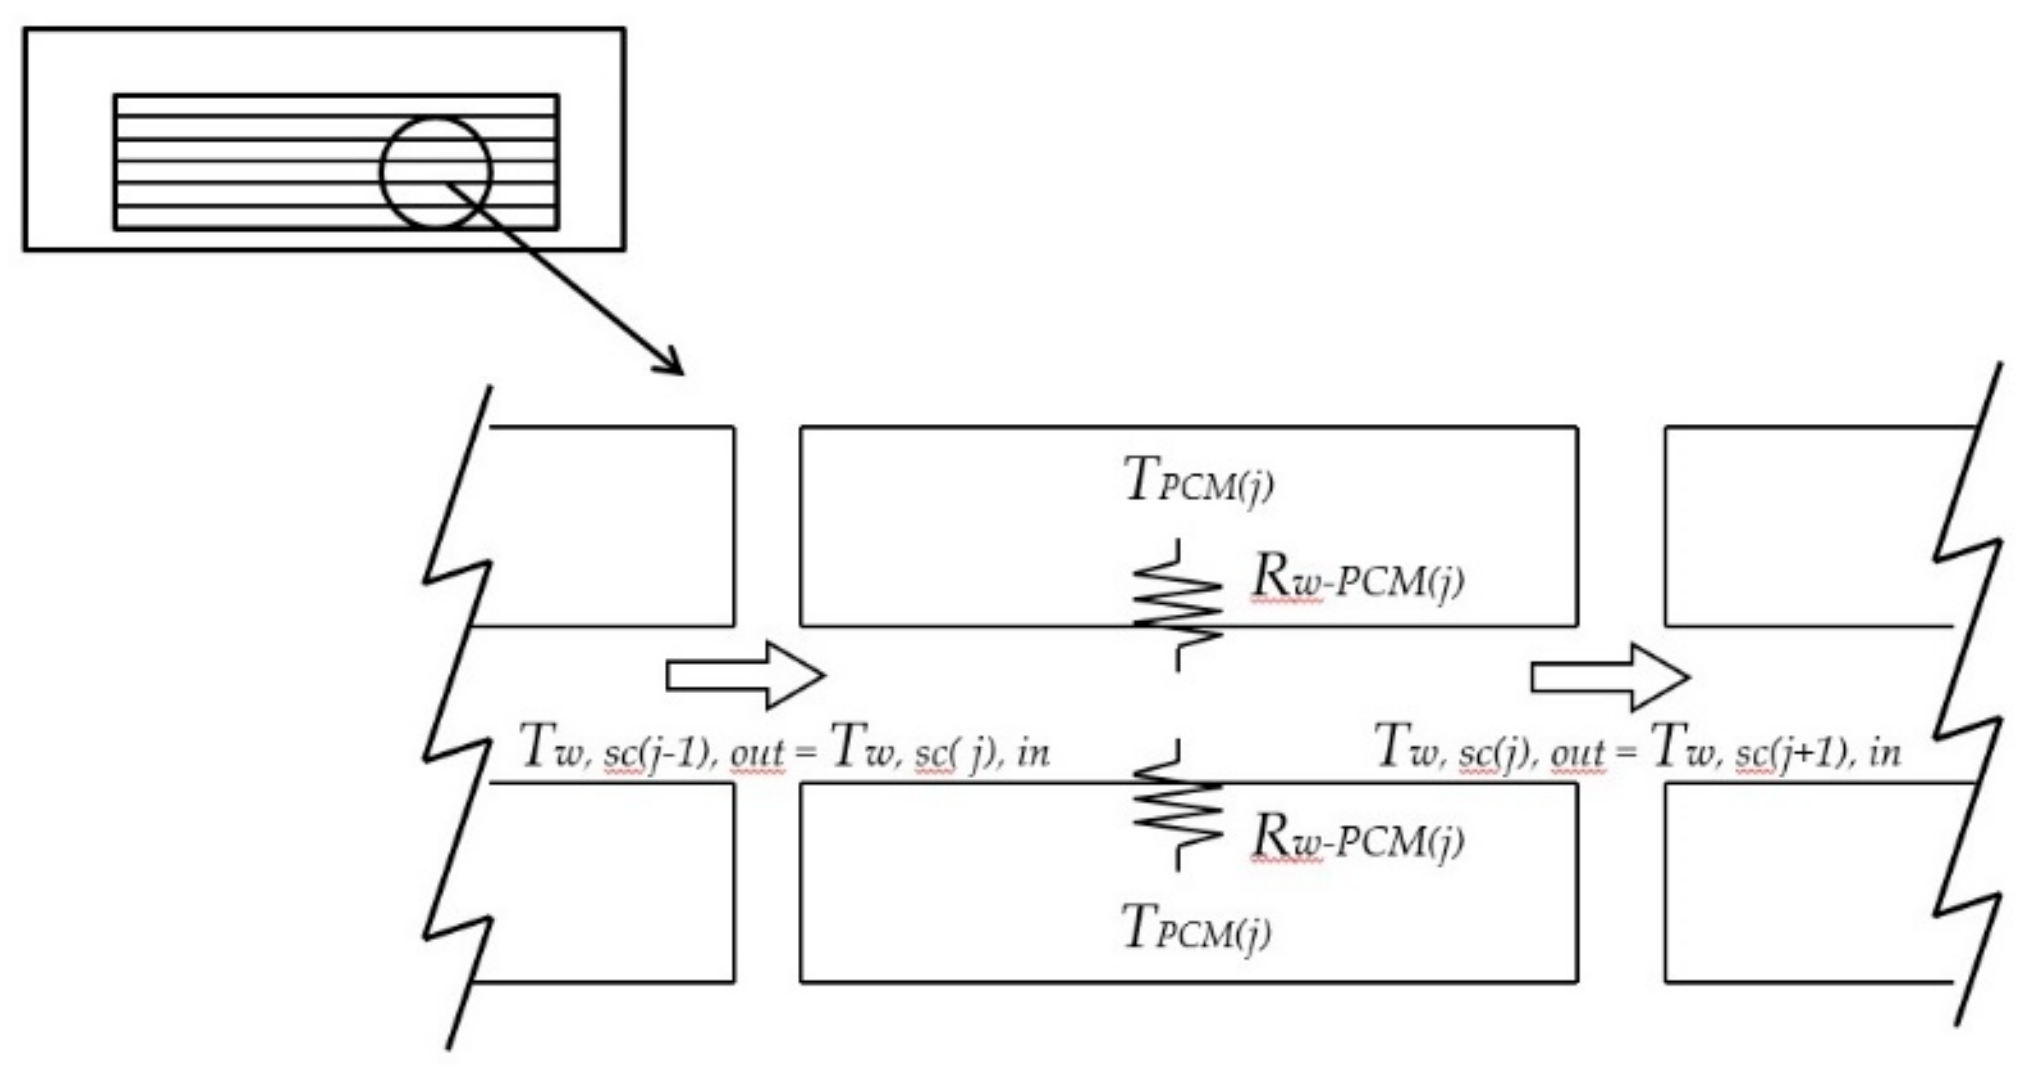
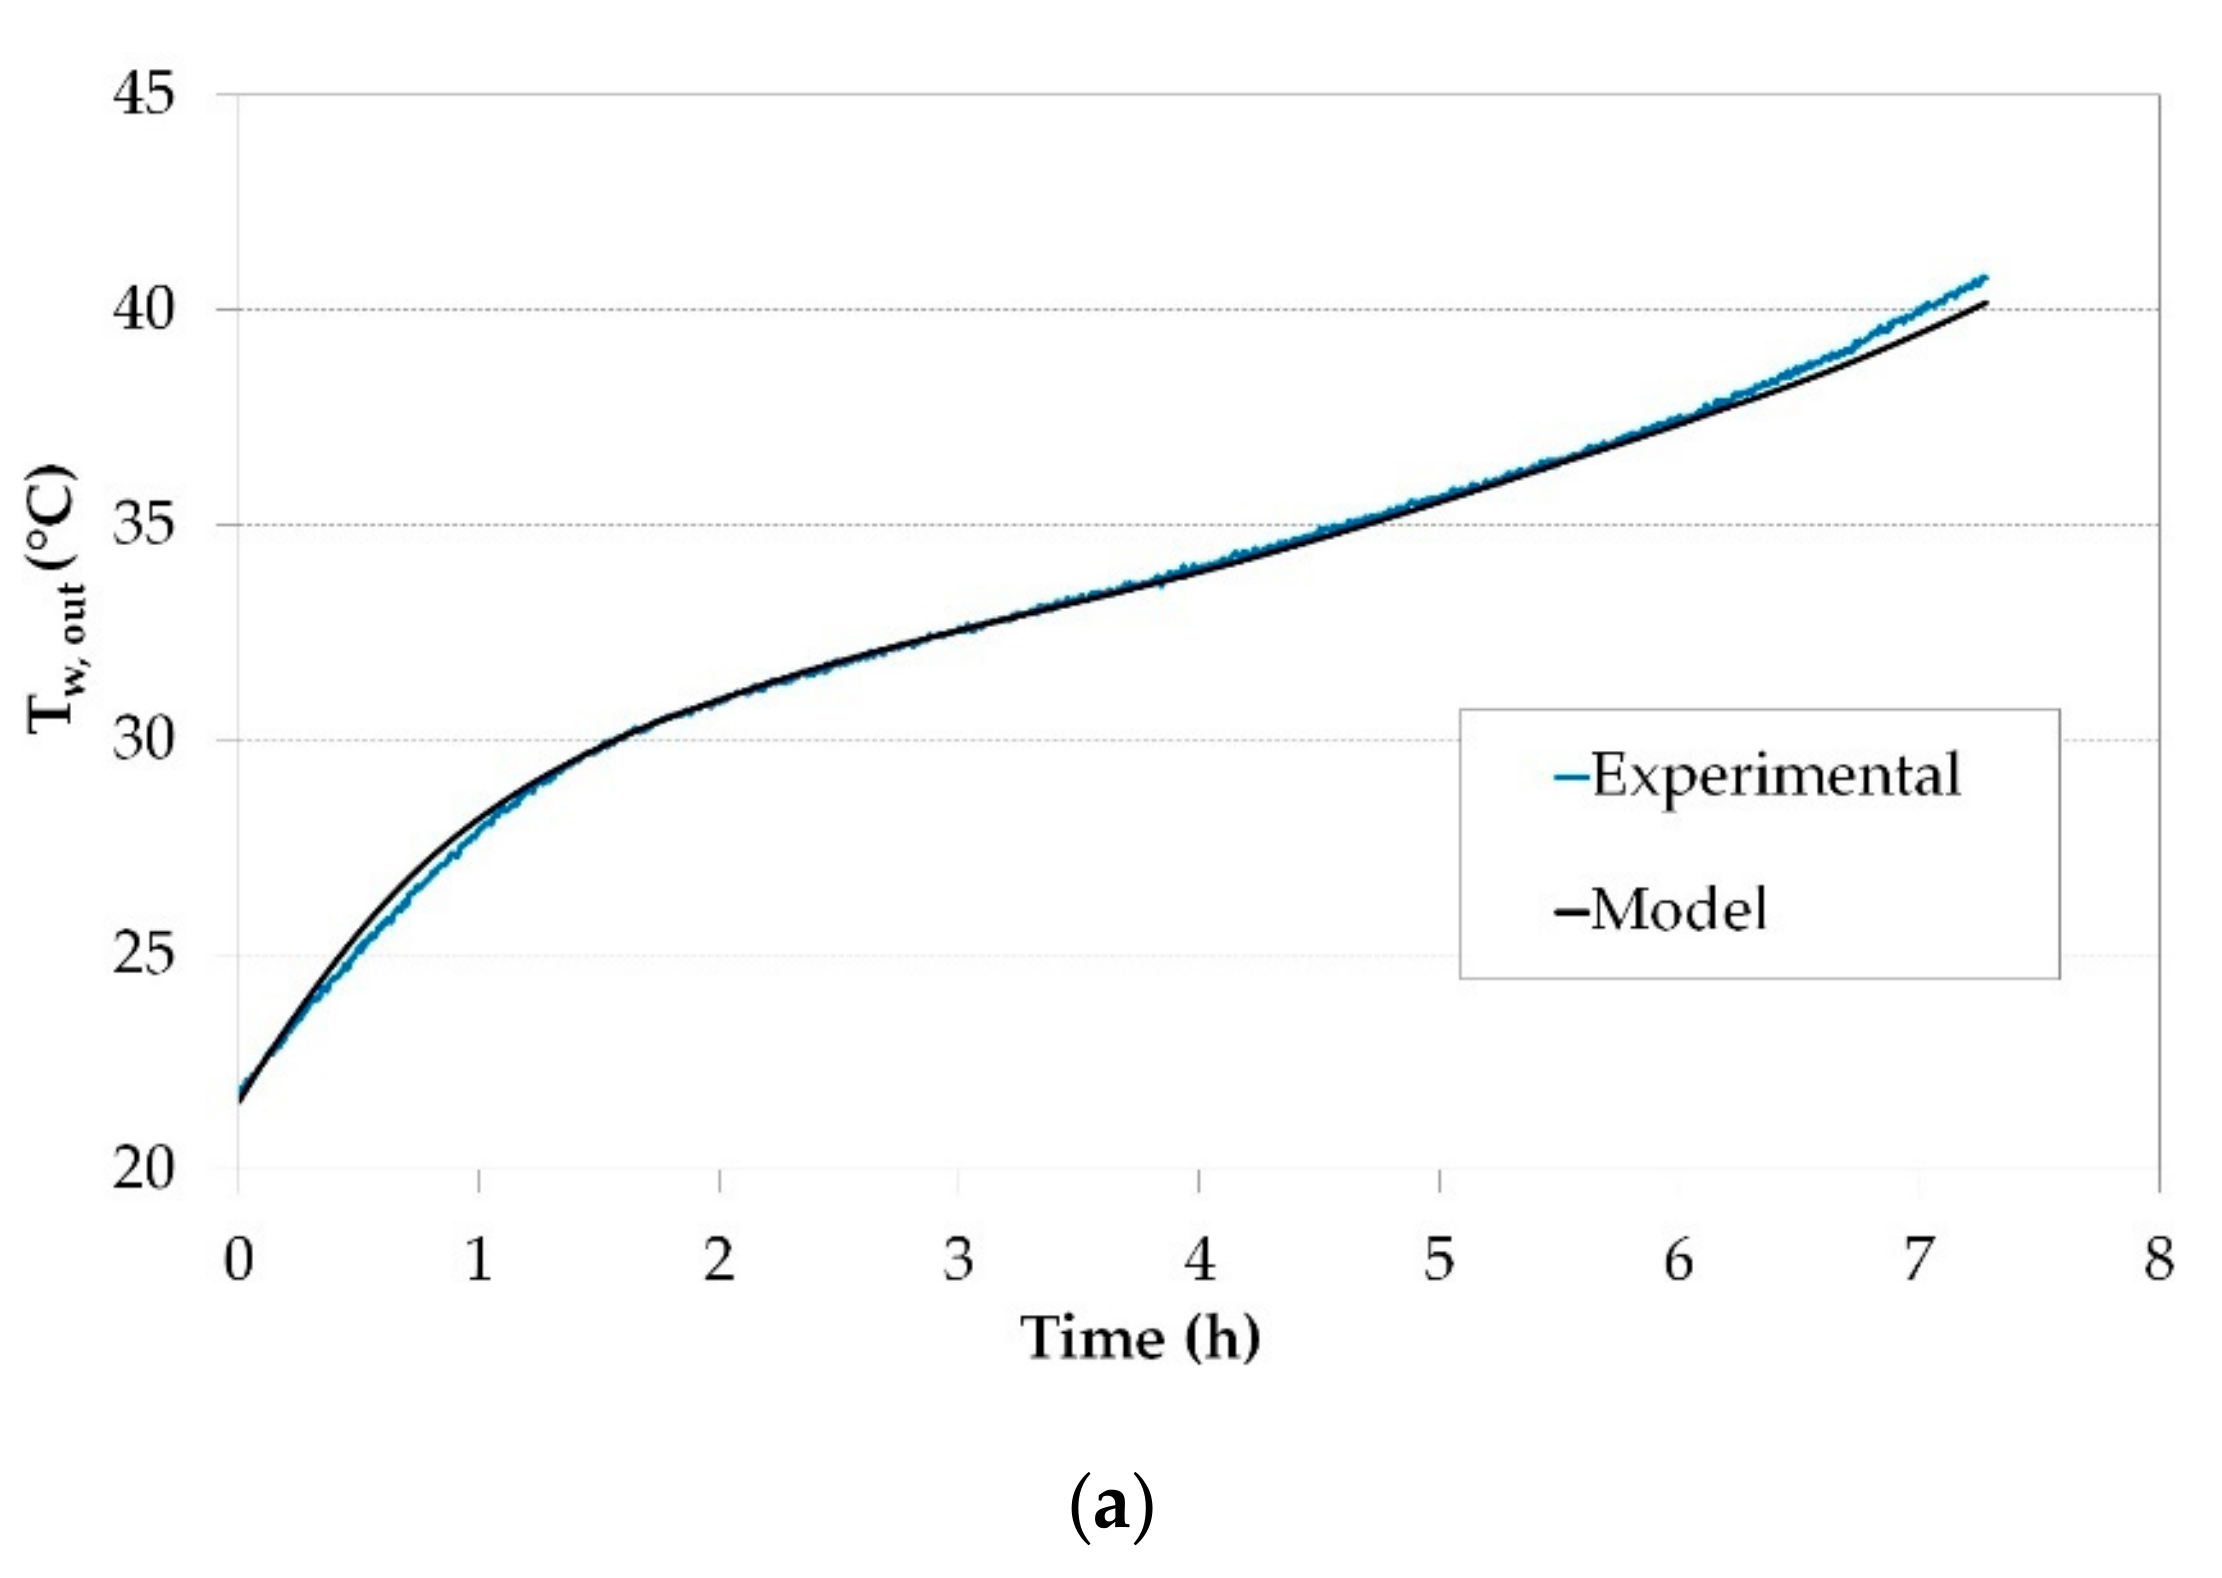
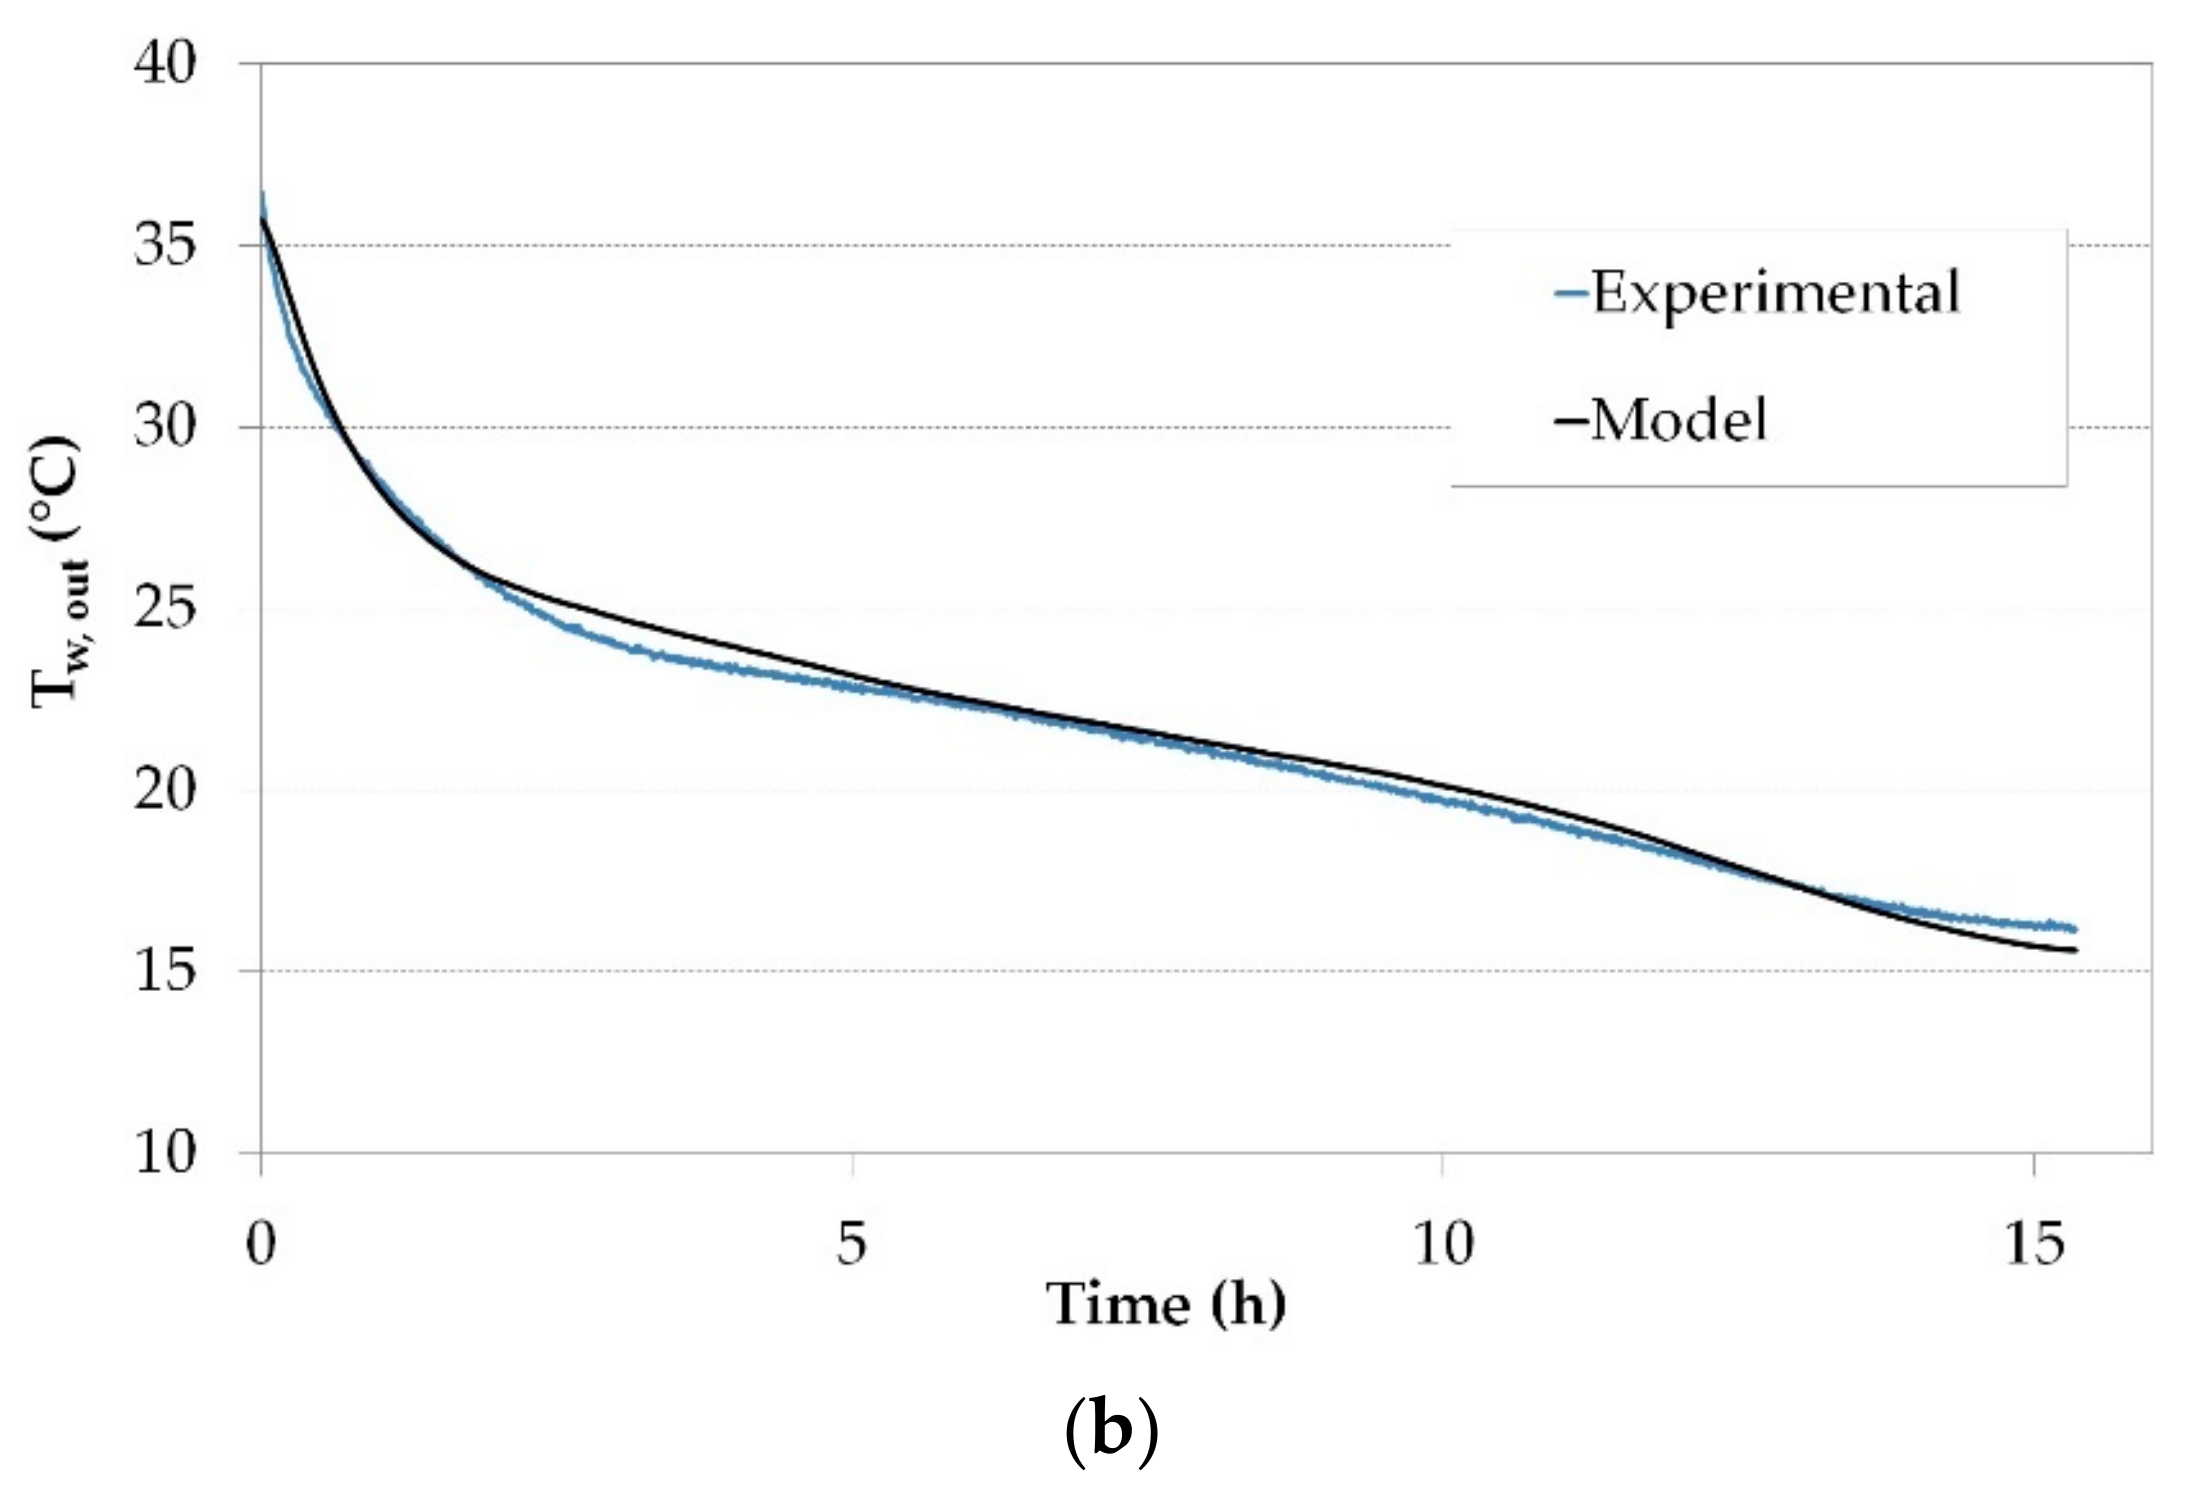
3. Model Description and Validation

The model of the chiller-PCM system has been designed as a model of the PCM tank coupled to a model of the VCS, while the water pumps and the fan have been modeled using datasheet characteristics. Both models have been programmed using MATLAB 8.
A model of the VCS has been designed to calculate its main energy parameters from the condensing conditions. Therefore, the evaporator conditions have been set constant to obtain chilled water operating temperature of 7/12 °C. The configuration of the compressor and the expansion valve have been set constant too. Thereby, the only parameters defining the performance of the VCS are the condenser conditions, namely the condenser water inlet temperature (Tcnd,in) and its volumetric flow rate ( V . ) (Figure 3). A regression model has been obtained through a set of measurements on the experimental facility. The adjusted R2 coefficients are shown in Table 2.
The model of the PCM tank has been designed to provide the water outlet temperature (Tw,out) given the water volumetric flow rate ( V . ), the heat transfer rate in the condenser ( Q . c n d ), the state of the PCM in a specific instant (i) and the water outlet temperature obtained in the previous instant. The state of the PCM in a specific instant is expressed through its temperature (TPCM,i). Finally, the model should provide the state of the PCM for the next iteration (i+1) (Figure 4).
The water inlet temperature (Tw,in) is calculated using the input parameters Q . c n d and V . and the outlet temperature obtained in the previous iteration:
T w , i n , i + 1 = T w , o u t , i + Q ˙ c n d V ˙   ρ w   C p w
The tank is divided into two homogenization zones at the inlet and the outlet of the water flow, being PCM containers stacked in the geometrical center of it. For calculation purposes, in the model, the PCM has been discretized. It is considered divided into eight sections with the width of the container (Figure 5). First, a perfect mixture is considered between the water inlet and the first homogenization zone. Then, the water enters the first PCM section at the temperature of the first homogenization zone (Thz1), successively exchanging heat with each section. After that, the water, at the outlet temperature of the last PCM section (Tw,sc8,out), enters the second homogenization zone where again a perfect mixture is considered. Finally, the water leaves the tank at the temperature of the second homogenization zone (Thz2).
Each PCM section can be considered as a heat exchanger with a thermal resistance between the water and the PCM (Figure 6). The inlet temperature of each section is the outlet temperature of the previous one. The thermal resistance between the water and the PCM (Rw-PCM) consists of a convection resistance between the water and the container and a conduction resistance in the container itself as expressed in Equation (2). Furthermore, when the PCM begins to melt, the liquid phase creates an additional natural convection resistance between the container and the solid PCM as formulated in Equation (3).
R w P C M = R w c o n t + R c o n t
  R w P C M = R w c o n t + R c o n t + R c o n t P C M
The convection thermal resistance between the water and the container (Rw-cont) is calculated from the film coefficient (h) and the contact surface (S) which is obtained from the Nusselt number (Nu):
R = 1 h   S ,
  h = N u   k d h
The Nusselt number is calculated using the Dittus Boelter correlation [22], where k is equal to 0.4 when heating the fluid and to 0.3 when cooling it.
N u = 0.023   R e 0.8   P r k
The container resistance (Rcont) is a conventional conduction one, and that of the melted PCM between the container and the solid PCM (Rcont-PCM) is calculated considering the generic natural convection equation:
N u = c R a n
where the parameters c and n depend on the geometry of the container and have been adjusted using the experimental measurements obtaining a value of 0.45 and 0.105, respectively.
The heat transfer rate of each PCM section is calculated applying the NTU-effectiveness method to the thermal resistance, and then, the outlet water temperature of the considered section can be obtained.
T w , s c j , o u t = T w , s c j , i n Q ˙ j V ˙   ρ w   C p w
The latent heat of the PCM is modeled as a Dirac delta function (δ) overlapping the specific heat as proposed by J. Ning-Wei [23].
δ T = e T T m b 2 π b
  C p T = H T m e l t T   C p s o l + δ T   L + H T T m e l t   C p l i q
where b is a parameter that defines the width of the Dirac delta function, and the function H(x) takes the following values:
H x = 0 x < 0 1 x > 0
The PCM temperature for the next iteration (i+1) for the section j can be calculated with the heat transfer rate and the specific heat of the PCM.
T P C M j , i + 1 = T P C M j , i + i i + 1 Q ˙ j m P C M j   C p P C M j
Finally, the liquid fraction of the PCM can be calculated as the integral of the Dirac delta function.
f = T δ T d T
To validate the model of the PCM TES tank a set of experimental measurements have been carried out using the facility described in Section 2. These measurements have also been simulated using the model. The output parameters of both experimental and model results have been compared. Four different discharge mode measurements have been arranged at four different volumetric flow rates (0.70, 0.95, 1.20, and 1.45 m3·h−1). For the charge mode, two measurements have been arranged at two different water flow rates (0.95 and 1.45 m3·h−1).
Figure 7 shows the performance of the tank water outlet temperature during a typical discharge (a) and charge (b) test. As can be observed, the model brings a good representation of the PCM tank thermal performance, especially during the phase change of the PCM. In the discharge mode, the maximum deviation obtained between the numerical and experimental values of the PCM TES tank water outlet temperature was of 1.2 °C. In the charge mode, a maximum deviation of 1.1 °C was obtained between numerical and experimental values of Tw,out. The maximum deviation was observed usually at the beginning and the end of the simulation, being the difference during the phase change smaller.
It must be remarked that, although the PCM melts at 27 °C, the values of Tw,out during the discharge test rise over this value with an ascending slope. This temperature difference depends on the thermal conductivity between the PCM and the water in the tank for the selected products and configuration.

4. Consumption Analysis

To evaluate the performance of the proposed chiller-PCM system, first, the consumption of the three different operating modes was studied separately. Then the consumption of the PCM charge and discharge modes were added to compare the PCM mode with the aerothermal mode.

4.1. Operating Modes and Associated Consumptions

In the aerothermal mode, the chiller cools the conditioned space rejecting the heat to the air using the fan. The three components that consume electrical energy during the operation in this mode are the compressor of the chiller, the pump 1, and the fan.
W a e r o = 0 t 1 ( P c o m p + P f a n + P p 1 ) d t = W c o m p + W f a n + W p 1
The two remaining operating modes correspond to the use of the PCM tank. First, in the PCM discharge mode, the chiller cools the conditioned space storing the condenser’s heat in the PCM tank. The two components that consume electrical energy in this mode are the compressor of the chiller and the pump 1.
W P C M d c h = 0 t 1 ( P c o m p + P p 1 ) d t = W c o m p + W p 1
Then, in the PCM charge mode, the heat stored in the PCM tank is rejected to the air using the fan. The two components that consume electrical energy in this mode are the fan and the pump 2.
W P C M c h = 0 t 2 ( P f a n + P p 2 ) d t = W f a n + W p 2
The total energy consumed in the PCM mode to extract an amount of heat Qev from the cold sink is the sum of the energy consumed during the PCM charge and discharge modes.
W P C M = W P C M d c h + W P C M c h = W c o m p + W p 1 + W f a n + W p 2
It is important to remark that the charging process is differed in time from the cold generation and has a different duration from the discharge process. As the electrical consumption during the charge and discharge processes depends on the temperature of the tank, it is important to assign the corresponding charge electrical consumption to each use of the chiller. Thus, for a Qev generated that causes an increase in the liquid fraction of the PCM from f1 to f2, the charge electrical consumption associated to this Qev is the one necessary to reduce the liquid fraction of the PCM from f2 to f1.

4.2. Consumption Analysis of The Different Operating Modes

The most commonly used parameter to evaluate the performance of a chiller is the COP. However, it presents two limitations to be used in the performance of the PCM charge and discharge modes. First, the COP of the charge and discharge modes would not provide a real approximation, as it would only include a fraction of the PCM mode electrical consumption. Second, the COP of both charge and discharge modes cannot be added to the calculation of the global COP of the PCM mode. Therefore, the consumption ratio (CR) was used to evaluate the performance of the PCM charge and discharge modes. It is defined as the ratio of the electrical consumption (input work) to the heat removed from the cold sink as expressed in Equation (18). The total CR of the PCM mode can be obtained as the addition of the PCM charge and discharge CRs, as given in Equation (19), and finally, the COP of the PCM mode is obtained with the Equation (20) as the inverse of RPCM.
C R = W Q e v
  C R P C M = C R P C M d c h + C R P C M c h
  C O P P C M = 1 C R P C M

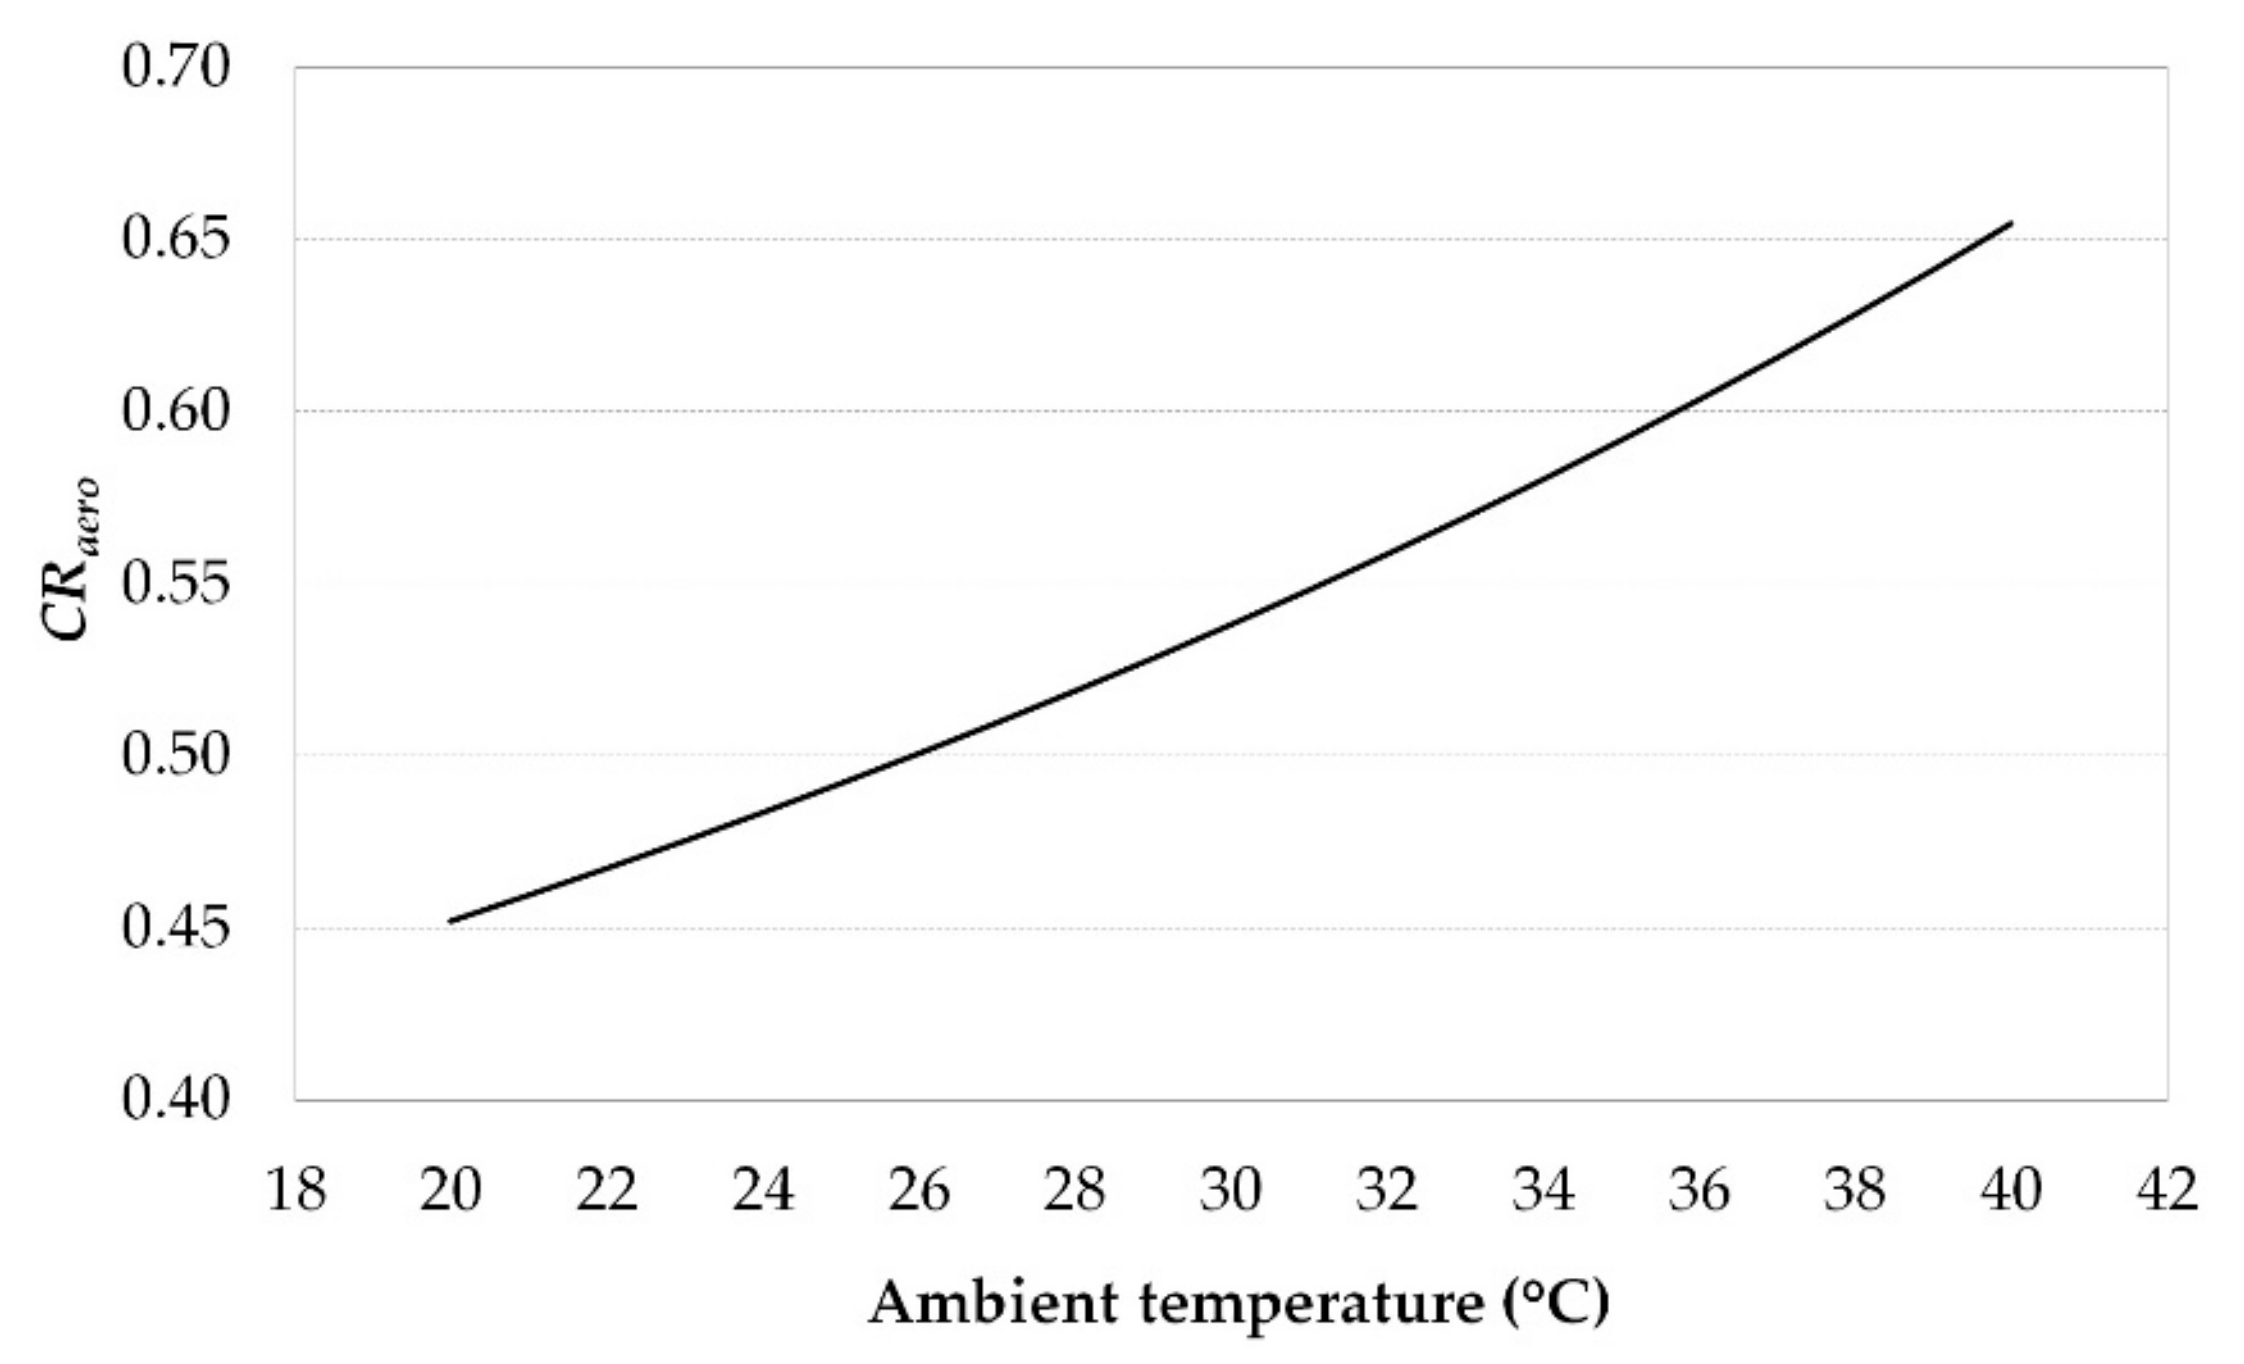
4.2.1. Consumption Analysis of The Aerothermal Mode

In the aerothermal mode, CR depends on the ambient temperature where the fan dissipates the heat. The higher the ambient temperature, the higher the value of CR (Figure 8). The values of CRaero were used later to calculate the energy savings provided by the PCM mode. At higher ambient temperatures, the electric consumption increased, and the energy savings provided by the PCM mode increased likewise.

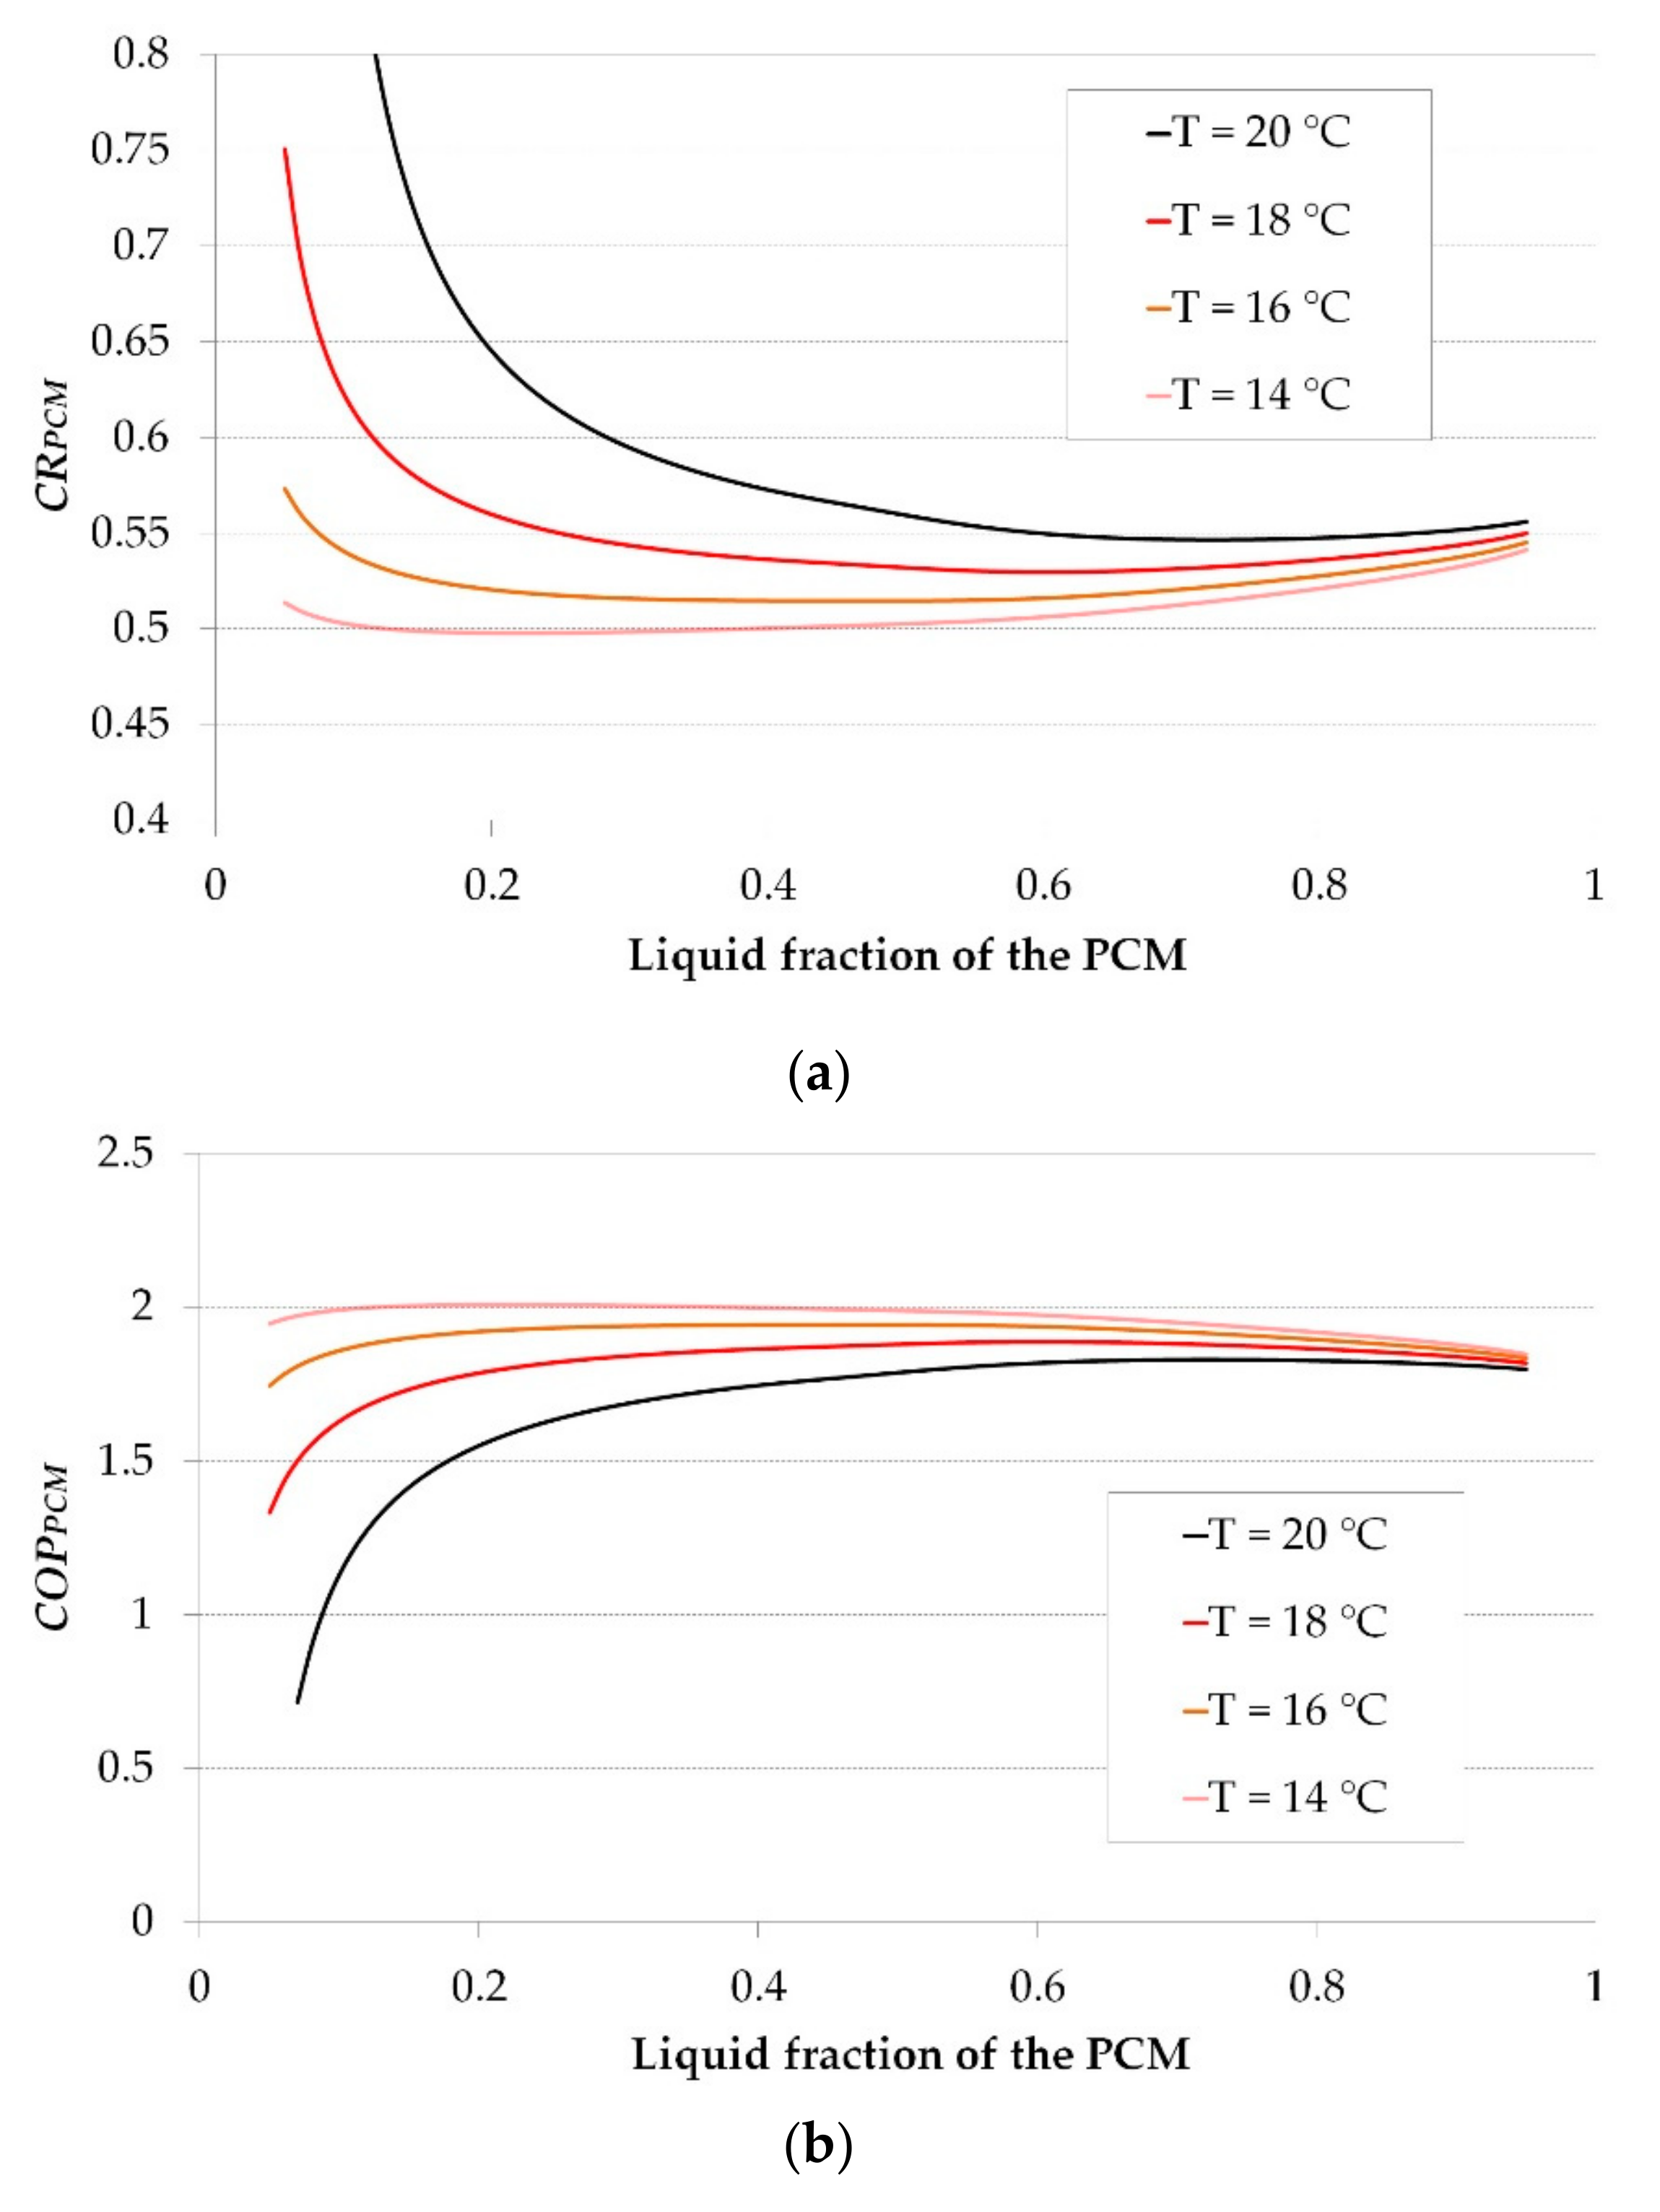
4.2.2. Consumption Analysis of The PCM Discharge Mode

In the PCM discharge mode, the performance of the chiller was independent of the ambient temperature but becomes dependent on the PCM tank temperature, which determined the condensing temperature of the chiller. To evaluate the CR of this mode, a simulation was carried out with the initial temperature of the PCM tank at 18 °C. The chiller dissipated the condenser heat in the PCM tank, increasing its temperature and thus, the value of CR, as shown in Figure 9a. Figure 9b shows the evaluation of this consumption ratio against the liquid fraction of the PCM, which is useful to link the electrical consumption of the PCM charge and discharge modes. Both figures show that, as the PCM melted, the temperature of the PCM tank increased and raised the value of CR. In addition, they highlight that for values of f close to the unity, the value of CR sharply increased.

4.2.3. Consumption Analysis of The PCM Charge Mode

During the PCM charge mode, the fan dissipated the heat stored in the PCM tank to the ambient air. Consequently, the efficiency of this process depends on the ambient temperature. Additionally, as the tank lowers its temperature and the temperature difference between the air and the tank narrows the value of CR increased as represented in Figure 10a. Figure 10b shows how at higher ambient temperatures, the energy cost of solidifying the PCM to low values of f increased and, in some cases, it could be inefficient to completely solidify the PCM.

4.2.4. Consumption Analysis of The PCM Mode

The total electric consumption of the PCM mode is the sum of the charge and discharge modes. As the charge electric consumption depends on the f of the PCM, it must be evaluated at the same f than the discharge that caused it. Therefore, the charge and discharge values of CR are linked by the f of the PCM as the sum of Figure 9b and Figure 10b. Figure 11a represents the CR of the PCM mode, which depends on the liquid fraction of the PCM and the temperature of the air during the charge of the PCM tank.
Although the discharge electric consumption was lower for low values of f, the higher electric consumption that required a complete solidification of the PCM increased the CR of the PCM mode, especially at higher night temperatures. At higher values of f, the charge electric consumption was low, but the higher discharge electric consumption slightly increased the CRPCM. The lowest values of the consumption ratio take place for the central values of f.
Once the charge and discharge consumption ratios are unified, the COP of the system can be calculated using Equation (20). Again, the COP was maximized in the central values of f, where the lowest values of the consumption ratio were observed, as shown in Figure 11b.

4.3. Consumption Comparison Between Aerothermal and PCM Modes

The CR of the PCM operating mode was compared with the CR of the aerothermal mode to evaluate the convenience of connecting the PCM tank to the condenser of the chiller. The percentage of energy savings was the parameter selected for this comparison, and it is calculated as
S a v i n g s % = C R a e r o C R P C M C R a e r o · 100
CRaero depends on the ambient temperature during the cold generation, whereas CRPCM depends on the ambient temperature during the charge mode and the f of the PCM during both, the charge and discharge modes. Therefore, the energy savings must be evaluated given the ambient temperature conditions. Daily temperature can be represented as a sinusoidal curve with good accuracy [24] given a mean temperature Tm and an amplitude A defined as the difference between the maximum or minimum temperature and Tm.
First, an evaluation of the energy savings provided by the PCM mode was carried out considering different values of Tm and A. This analysis can guide for the sizing of the chiller-PCM system and the selection of the melting temperature of the PCM. Then the performance of the PCM mode was compared with the aerothermal mode for different use and temperature conditions. This analysis can determine the switch temperature above which the first mode provides energy savings over the second one.

4.3.1. Analysis of Energy Savings for Different Values of Tm

The relation between the Tm and the melting temperature of the PCM will determine the energy savings provided by the chiller-PCM system. A high value of Tm entails a high ambient temperature during the cold generation and the charge of the PCM tank and vice versa. For high values of Tm, the consumption ratio of the aerothermal mode will rise, whereas the cost of the PCM discharge mode remains constant, increasing the energy savings provided by the chiller-PCM system during the cold generation. However, a high Tm also entails a high ambient temperature during the PCM charge mode, increasing its consumption ratio and that of the overall PCM mode. However, for low values of Tm, the energy savings during the cold generation decrease, but the cost of the PCM charge mode will decrease as well.
To evaluate the effect of Tm on energy savings, a simulation was performed with four different values of Tm. Additionally, an arbitrary value of 8 °C was set for A. The resulting day and night temperatures are shown in Table 3. Day temperature was considered constant during the aerothermal mode and night temperature was considered constant during the PCM charge mode.
The energy savings obtained for each Tm are represented in Figure 12. For high values of Tm concerning the melting temperature of the PCM high energy savings were obtained for values of f close to 1. However, the high cost of charging the PCM with a high night temperature makes the complete solidification of the PCM inefficient and part of its latent heat would remain unused. For low values of Tm, the charge mode had a lower consumption and energy savings were obtained for low values of f, but the energy savings were reduced for values of f close to 1. Considering the PCM and the chiller analyzed in this work, the best energy savings profile was obtained for a Tm of 25 °C, two degrees Celsius below the melting point of the PCM.

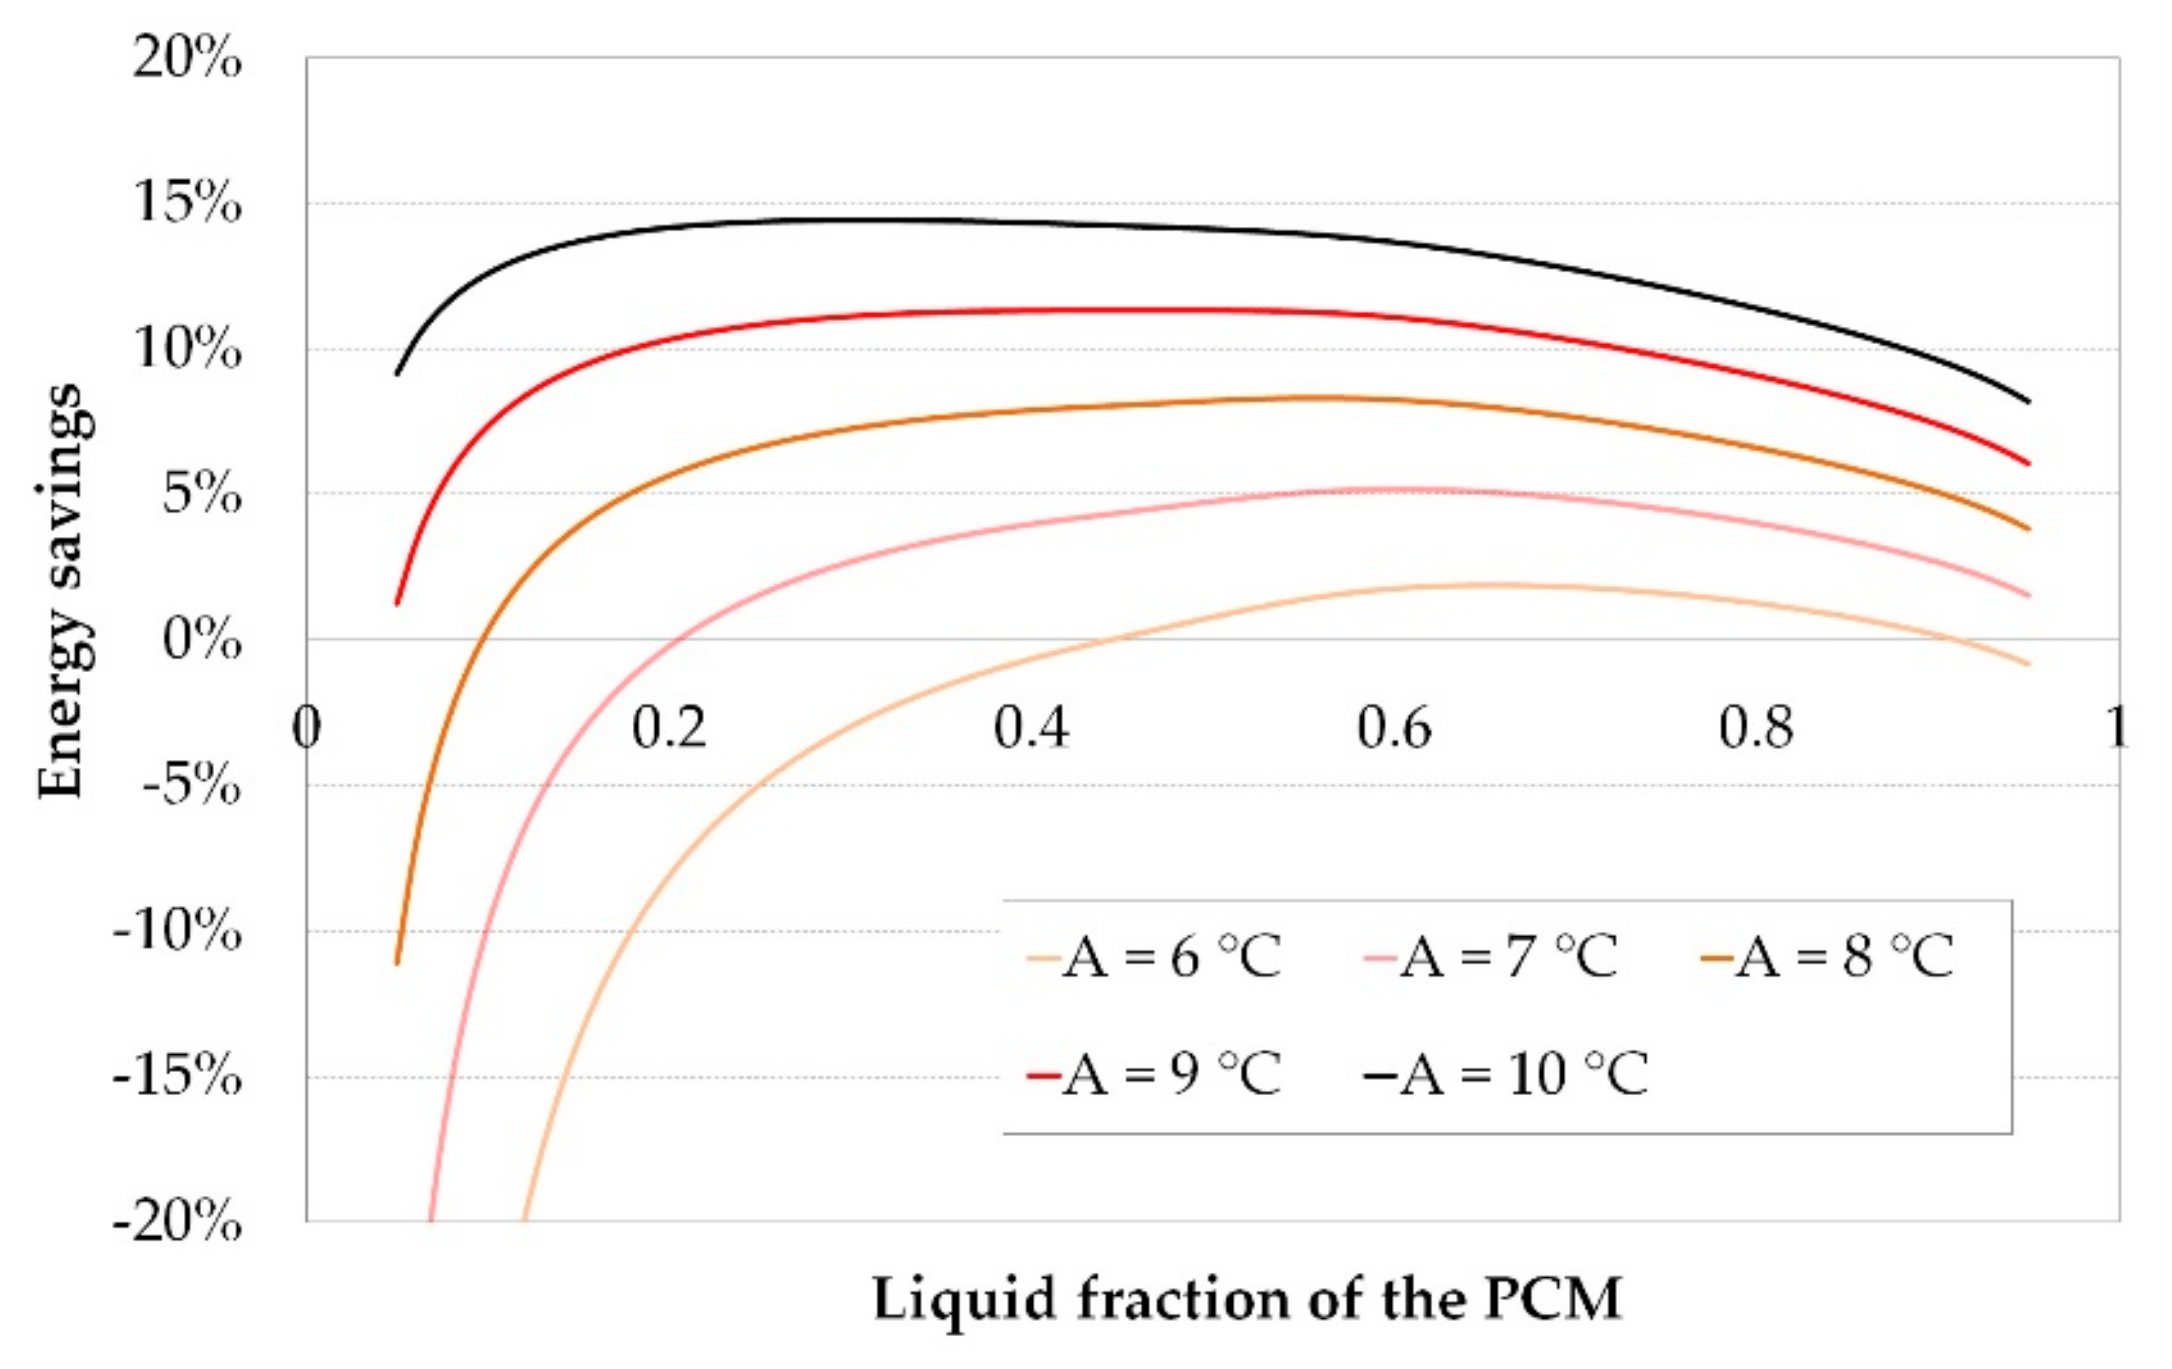
4.3.2. Analysis of Energy Savings for Different Values of A

A high amplitude in the ambient temperature profile entails a high day temperature and a low night temperature, and both result in higher energy savings. It is evident that the higher the A, the higher the energy savings. However, there is worth in determining the profile of energy savings for different values of A and the threshold for this parameter below which the energy savings disappear. Therefore, a simulation was designed for five different values of A. A constant value of 25 °C was chosen for Tm as it showed the best performance for the system. Table 4 shows the night and day temperatures for this simulation. Day temperature was considered constant during the aerothermal mode and night temperature was considered constant during the PCM charge mode.
Simulation results show the expected increase in energy savings when A is increased (Figure 13). For a value of A equal to 6 °C and below the energy savings were negligible for the PCM, and the chiller analyzed in this work. A configuration with a lower thermal resistance between the PCM and the water would provide lower water temperatures at the outlet of the PCM tank and, thus, higher energy savings lowering the threshold value of A obtained in this simulation.

4.3.3. Performance Analysis for Different Use and Temperature Conditions

The energy savings obtained when replacing a conventional aerothermal chiller with the proposed chiller-PCM system depend on the ambient temperature during the cold generation (day) and the PCM charge mode (night) and on the liquid fraction of the PCM. As seen in the previous sections, there was a decrease in the energy savings provided by the PCM mode when completely melting or solidifying the PCM, whereas they reached their maximum value when f was near 0.5.
If the PCM discharge mode is used for a short period, the most energy convenient point of functioning can be selected, with an f value near 0.5. However, for longer periods, a larger range of f must be used, extending it to values with lower energy savings.
A simulation was performed comparing the COP of the aerothermal mode with that of the PCM mode, depending on the day ambient temperature. Three different values of the night ambient temperature (16, 18, and 20 °C) and three different use periods (1, 3, and 5 hours) were considered resulting in nine different scenarios. For periods of 1 hour, the most convenient fraction of f was selected, resulting in a high COP. For periods of 3 and 5 hours, the f fraction was extended to less convenient fractions reducing the global COP of the whole period.
Figure 14 shows the results of the simulation, where the intersection between the aerothermal COP and each of the nine PCM scenarios determined the switch day ambient temperature above which the PCM mode grants energy savings over the aerothermal mode. As can be observed, the scenario with the highest COP (use period of 1 hour and night temperature of 16 °C) provided energy savings for day temperatures above 22 °C while the scenario with the lowest COP (use period of 5 hours and night temperature of 20 °C) provided energy savings only for day temperatures above 32 °C.

5. Conclusions

PCM TES systems can provide energy savings when used as a heat sink for a chiller, and there is worth in analyzing the parameters that affect their performance. In the present work, an experimental PCM TES system used as a heat sink for a chiller has been modeled and analyzed under different temperature and use conditions for a better understanding of the behavior of its energy performance.
First, a model of the chiller-PCM components was developed and validated using data from an experimental setup adapted for this purpose. The model showed good accuracy with a maximum deviation between the modeled and the experimental temperatures of 1.2 °C, and it can be used in systems of similar purpose.
Then, this model was used to carry out simulations of the different operating modes of the system providing consumption and COP curves and analyzing the effect of the ambient temperature and the liquid fraction of the PCM. Moreover, the energy savings provided by the system was evaluated for different temperature profiles.
Energy savings between 5% and 15% were observed in the simulations. Furthermore, the system showed the best energy savings profile for a value of Tm around 2 °C below the melting point of the PCM. Simulation results also showed that a minimum difference of 12 °C was necessary between day and night temperature to obtain energy savings with the components used in this study. Although the system showed moderate savings, there is a potential improvement of these results if a higher thermal conductivity between the water and the PCM is achieved. This increase in thermal conductivity, which is the focus of recent studies [25,26,27], would reduce the water outlet temperature during the discharge mode shown in Figure 7a, and this would increase the COP of the chiller.
Finally, the COP of the aerothermal mode was compared with that of the PCM mode for different use and temperature conditions obtaining, for each case, the switch day ambient temperature over which PCM mode provided energy savings. Considering the model assumptions, for the most profitable conditions, the chiller-PCM system provided savings for day temperatures over 22 °C, whereas under worse conditions, switch temperatures of up to 32 °C were obtained.

Author Contributions

Conceptualization, A.R.F. and J.N.E.; methodology, A.R.F., Á.B.C., and L.D.; validation, A.R.F., J.N.E., A.M.B., and L.D.; formal analysis, A.R.F., J.N.E., A.M.B., and L.D.; investigation, A.R.F., J.N.E., A.M.B., Á.B.C., L.D., F.S., A.M., and C.A.; resources, A.R.F., J.N.E., Á.B.C., and F.S.; data curation, A.R.F. and A.M.B.; writing—original draft preparation, A.R.F., J.N.E., and A.M.B.; writing—review and editing, A.M. and C.A.; visualization, A.M. and C.A.; supervision, J.N.E. and F.S.; project administration, A.R.F., J.N.E., and F.S.; funding acquisition, A.R.F., J.N.E., and F.S.

Funding

A.M.B. acknowledges the funding received from the Spanish State Research Agency through the “Juan de la Cierva - Formación 2016” postdoctoral grant (FJCI-2016-28324).

Acknowledgments

The authors would like to thank the ISTENER research group from Universitat Jaume I and the TEC-ENER research group from Universidad Cardenal Herrera-CEU for providing the equipment required to perform this study.

Conflicts of Interest

The authors declare no conflict of interest.

Nomenclature

ADaily temperature amplitude (°C)
CRConsumption ratio (-)
CpSpecific heat (kJ·kg−1·K−1)
dhHydraulic diameter (m)
fLiquid fraction (-)
hFilm coefficient (W·m−2·K−1)
kThermal conductivity (W·m−1·K−1)
LLatent heat (kJ·kg−1)
mMass (kg)
NuNusselt number (-)
PPower (W)
PrPrandtl number (-)
QHeat (J)
Q . Heat transfer rate (W)
RThermal resistance (K·W−1)
RaRayleigh number (-)
ReReynolds number (-)
SSurface (m2)
TTemperature (°C)
TmDaily mean temperature (°C)
TmeltMelting temperature (°C)
V . Volumetric flow rate (m3·s−1)
WWork (J)
Greek symbols
δDirac delta function
ρDensity (kg·m−3)
Subscripts
aeroAerothermal mode
cndCondenser
chCharge mode
compCompressor
contContainer
dchDischarge mode
evEvaporator
hzHomogenization zone
inInlet
liqLiquid
outOutlet
pPump
scPCM section
solSolid
wWater
Abbreviatures
COPCoefficient of Performance
HVACHeating, Ventilation and Air-Conditioning
PCMPhase Change Material
PIDProportional Integral Derivative
TESThermal Energy Storage
VCSVapor Compression System

References

  1. UNFCCC. Kyoto Protocol to the United Nations Framework Convention on Climate Change. In Proceedings of the Third Session of the Conference of the Parties (COP3), Kyoto, Japan, 11 December 1997. [Google Scholar]
  2. UNFCCC. Adoption of the Paris Agreement; UNFCCC: Bonn, Germany, 2015. [Google Scholar]
  3. Couloumb, D.; Dupont, J.L.; Pichard, A. 29th Informatory Note on Refrigeration Technologies. The Role of Refrigeration in the Global Economy; International Institute of Refrigeration: Paris, France, 2015. [Google Scholar]
  4. Couloumb, D.; Dupont, J.L.; Morlet, V. 35th Informatory Note on Refrigeration Technologies. The Impact of the Refrigeration Sector on Climate Change; International Institute of Refrigeration: Paris, France, 2017. [Google Scholar]
  5. International Energy Agency. Key World Energy Statistics; International Energy Agency: Paris, France, 2017; Available online: https://www.iea.org/publications/freepublications/publication/KeyWorld2017.pdf.
  6. Seong, Y.B.; Lim, J.H. Energy saving potentials of phase change materials applied to lightweight building envelopes. Energies 2013, 6, 5219–5230. [Google Scholar] [CrossRef]
  7. Baek, S.; Kim, S. Analysis of thermal performance and energy saving potential by PCM radiant floor heating system based on wet construction method and hot water. Energies 2019, 12, 828. [Google Scholar] [CrossRef]
  8. Roman, K.K.; O’Brien, T.; Alvey, J.B.; Woo, O.J. Simulating the effects of cool roof and PCM (phase change materials) based roof to mitigate UHI (urban heat island) in prominent US cities. Energy 2016, 96, 103–117. [Google Scholar] [CrossRef]
  9. Anisur, M.R.; Mahfuz, M.H.; Kibria, M.A.; Saidur, R.; Metselaar, I.H.S.C.; Mahlia, T.M.I. Curbing global warming with phase change materials for energy storage. Renew. Sustain. Energy Rev. 2013, 18, 23–30. [Google Scholar] [CrossRef]
  10. Canbazoglu, S.; Sahinaslan, A.; Ekmekyapar, A.; Aksoya, Y.; Akarsu, F. Enhancement of solar thermal energy storage performance using sodium thiosulfate pentahydrate of a conventional solar water-heating system. Energy Build. 2005, 37, 235–242. [Google Scholar] [CrossRef]
  11. Charvát, P.; Klimeš, L.; Zálešák, M. Utilization of an air-PCM heat exchanger in passive cooling of buildings: A simulation study on the energy saving potential in different European climates. Energies 2019, 12, 1133. [Google Scholar] [CrossRef]
  12. Chen, X.; Zhang, Q.; Zhai, Z.J.; Ma, X. Potential of ventilation systems with thermal energy storage using PCMs applied to air conditioned buildings. Renew. Energy 2019, 39–53. [Google Scholar] [CrossRef]
  13. García, J.P.; Miguez, C.; Monedero, C.; Rico, I. Síntesis del Estudio Parques de Bombas de Calor de España; IDEA: Madrid, Spain, 2014. [Google Scholar]
  14. Sun, Y.; Wang, S.; Xiao, F.; Gao, D. Peak load shifting control using different cold thermal energy storage facilities in commercial buildings: A review. Energy Convers. Manag. 2013, 71, 101–114. [Google Scholar] [CrossRef]
  15. Ruddell, B.L.; Salamanca, F.; Mahalov, A. Reducing a semiarid city’s peak electrical demand using distributed cold thermal energy storage. Appl. Energy 2014, 134, 35–44. [Google Scholar] [CrossRef]
  16. Bruno, F.; Tay, N.H.S.; Belusko, M. Minimising energy usage for domestic cooling with off-peak PCM storage. Energy Build. 2014, 76, 347–353. [Google Scholar] [CrossRef]
  17. Roth, K.W.; Zogg, R.; Brodrick, J. Emerging technologies: Cool thermal energy storage. ASHRAE J. 2006, 48, 94–96. [Google Scholar]
  18. Zhao, D.; Tan, G. Experimental evaluation of a prototype thermoelectric system integrated with PCM (phase change material) for space cooling. Energy 2014, 68, 658–666. [Google Scholar] [CrossRef]
  19. Zhao, D.; Tan, G. Numerical analysis of a shell-and-tube latent heat storage unit with fins for air-conditioning application. Appl. Energy 2015, 138, 381–392. [Google Scholar] [CrossRef]
  20. PCMProducts Ltd. Available online: http://www.pcmproducts.net/Encapsulated_PCMs.htm (accessed on 9 September 2019).
  21. Barreneche, C.; Solé, A.; Miró, L.; Martorell, I.; Fernández, A.I.; Cabeza, L.F. Study on differential scanning calorimetry analysis with two operation modes and organic and inorganic phase change material (PCM). Thermochim. Acta 2013, 553, 23–26. [Google Scholar] [CrossRef]
  22. Dittus, F.; Boelter, L. Heat Transfer in Automobile Radiators of the Tubular Type; University of California Publications in Engineering; University of California Press: Berkeley, CA, USA, 1930; Volume 2, pp. 443–461. [Google Scholar]
  23. Chiu, J.N.W. Latent Heat Thermal Energy Storage for Indoor Comfort Control. Ph.D. Thesis, KTH School of Industrial Engineering and Management, Stockholm, Sweden, 2013. [Google Scholar]
  24. Kuznik, F.; Virgone, J.; Johannes, K. Development and validation of a new TRNSYS type for the simulation of external building walls containing PCM. Energy Build. 2010, 42, 1004–1009. [Google Scholar] [CrossRef] [Green Version]
  25. Mat, S.; Al-Abidi, A.A.; Sopian, K.; Sulaiman, M.Y.; Mohammad, A.T. Enhance heat transfer for PCM melting in triplex tube with internal-external fins. Energy Convers. Manag. 2013, 74, 223–236. [Google Scholar] [CrossRef]
  26. Righetti, G.; Lazzarin, R.; Noro, M.; Mancin, S. Phase Change Materials embedded in porous matrices for hybrid thermal energy storages: experimental results and modelling. Int. J. Refrig. 2019. [Google Scholar] [CrossRef]
  27. Lazzarin, R.; Noro, M.; Righetti, G.; Mancin, S. Application of hybrid PCM thermal energy storages with and without al foams in solar heating/cooling and ground source absorption heat pump plant: An energy and economic analysis. Appl. Sci. 2019, 9, 1007. [Google Scholar] [CrossRef]
Figure 1. Schematic diagram of the chiller-phase change materials (PCM) system.
Energies 12 03652 g001
Figure 2. PCM storage tank 3D representation.
Energies 12 03652 g002
Figure 3. Vapor compression systems (VCS) model structure.
Energies 12 03652 g003
Figure 4. PCM storage tank model structure.
Energies 12 03652 g004
Figure 5. Distribution of the PCM storage tank as considered in the model.
Energies 12 03652 g005
Figure 6. Distribution of the PCM storage tank as considered in the model.
Energies 12 03652 g006
Figure 7. Example of the tank model validation for (a) a discharge test ( V . = 1.20 m3·h−1) and for (b) a charge test ( V . = 0.95 m3·h−1).
Energies 12 03652 g007aEnergies 12 03652 g007b
Figure 8. Value of the consumption ratio (CR) in the aerothermal mode for different ambient temperatures.
Energies 12 03652 g008
Figure 9. Value of CR in the PCM discharge mode against (a) heat stored in the tank and (b) liquid fraction of the PCM.
Energies 12 03652 g009
Figure 10. Value of CR in the PCM charge mode against (a) heat released from the tank and (b) liquid fraction of the PCM.
Energies 12 03652 g010
Figure 11. (a) CR and (b) coefficient of performance (COP) against liquid fraction of the PCM in the PCM mode.
Energies 12 03652 g011
Figure 12. Energy savings obtained with the PCM mode for different values of daily mean temperature (Tm).
Energies 12 03652 g012
Figure 13. Energy savings obtained with the PCM mode for different values of daily temperature amplitude (A).
Energies 12 03652 g013
Figure 14. COP of the PCM mode and the aerothermal mode for different use and temperature scenarios.
Energies 12 03652 g014
Table 1. Salt hydrate S27 main properties.
ParameterValue
Melting temperature (°C)27
Density (kg·m−3)1530
Specific latent heat (kJ·kg−1)150
Specific heat (kJ·kg−1·K−1)2.20
Thermal conductivity (W·m−1·K−1)0.54
Table 2. Adjusted R2 coefficients for the Vapor compression systems (VCS) regression model.
ParameterRangeR2 Coefficient
Q . c n d (kW)[7.37–9.28]0.9558
Q . e v (kW)[5.70–7.71]0.9738
P (kW)[2.33–3.00]0.9912
COP [1.91–3.31]0.9958
Table 3. Day and night temperatures for different values of daily mean temperature (Tm) and a daily temperature amplitude (A) of 8 °C.
Tm (°C).Day Temperature
(Tm+8) (°C)
Night Temperature
(Tm−8) (°C)
233115
253317
273519
293721
Table 4. Day and night temperatures for different values of A and a Tm of 25 °C.
A (°C)Day Temperature
(25+A) (°C)
Night Temperature
(25−A) (°C)
63119
73218
83317
93416
103515

