Research on Carbon Emissions of Electric Vehicles throughout the Life Cycle Assessment Taking into Vehicle Weight and Grid Mix Composition


Abstract
1. Introduction
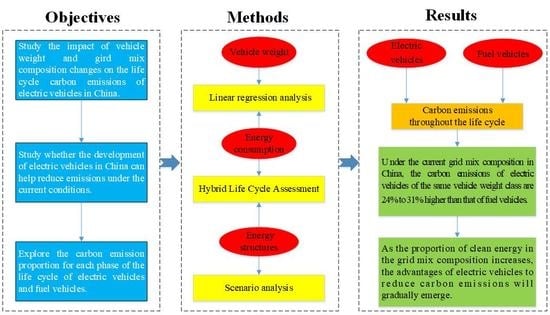
2. Research Methods
2.1. Linear Regression Analysis
2.2. Hybrid Life Cycle Assessment
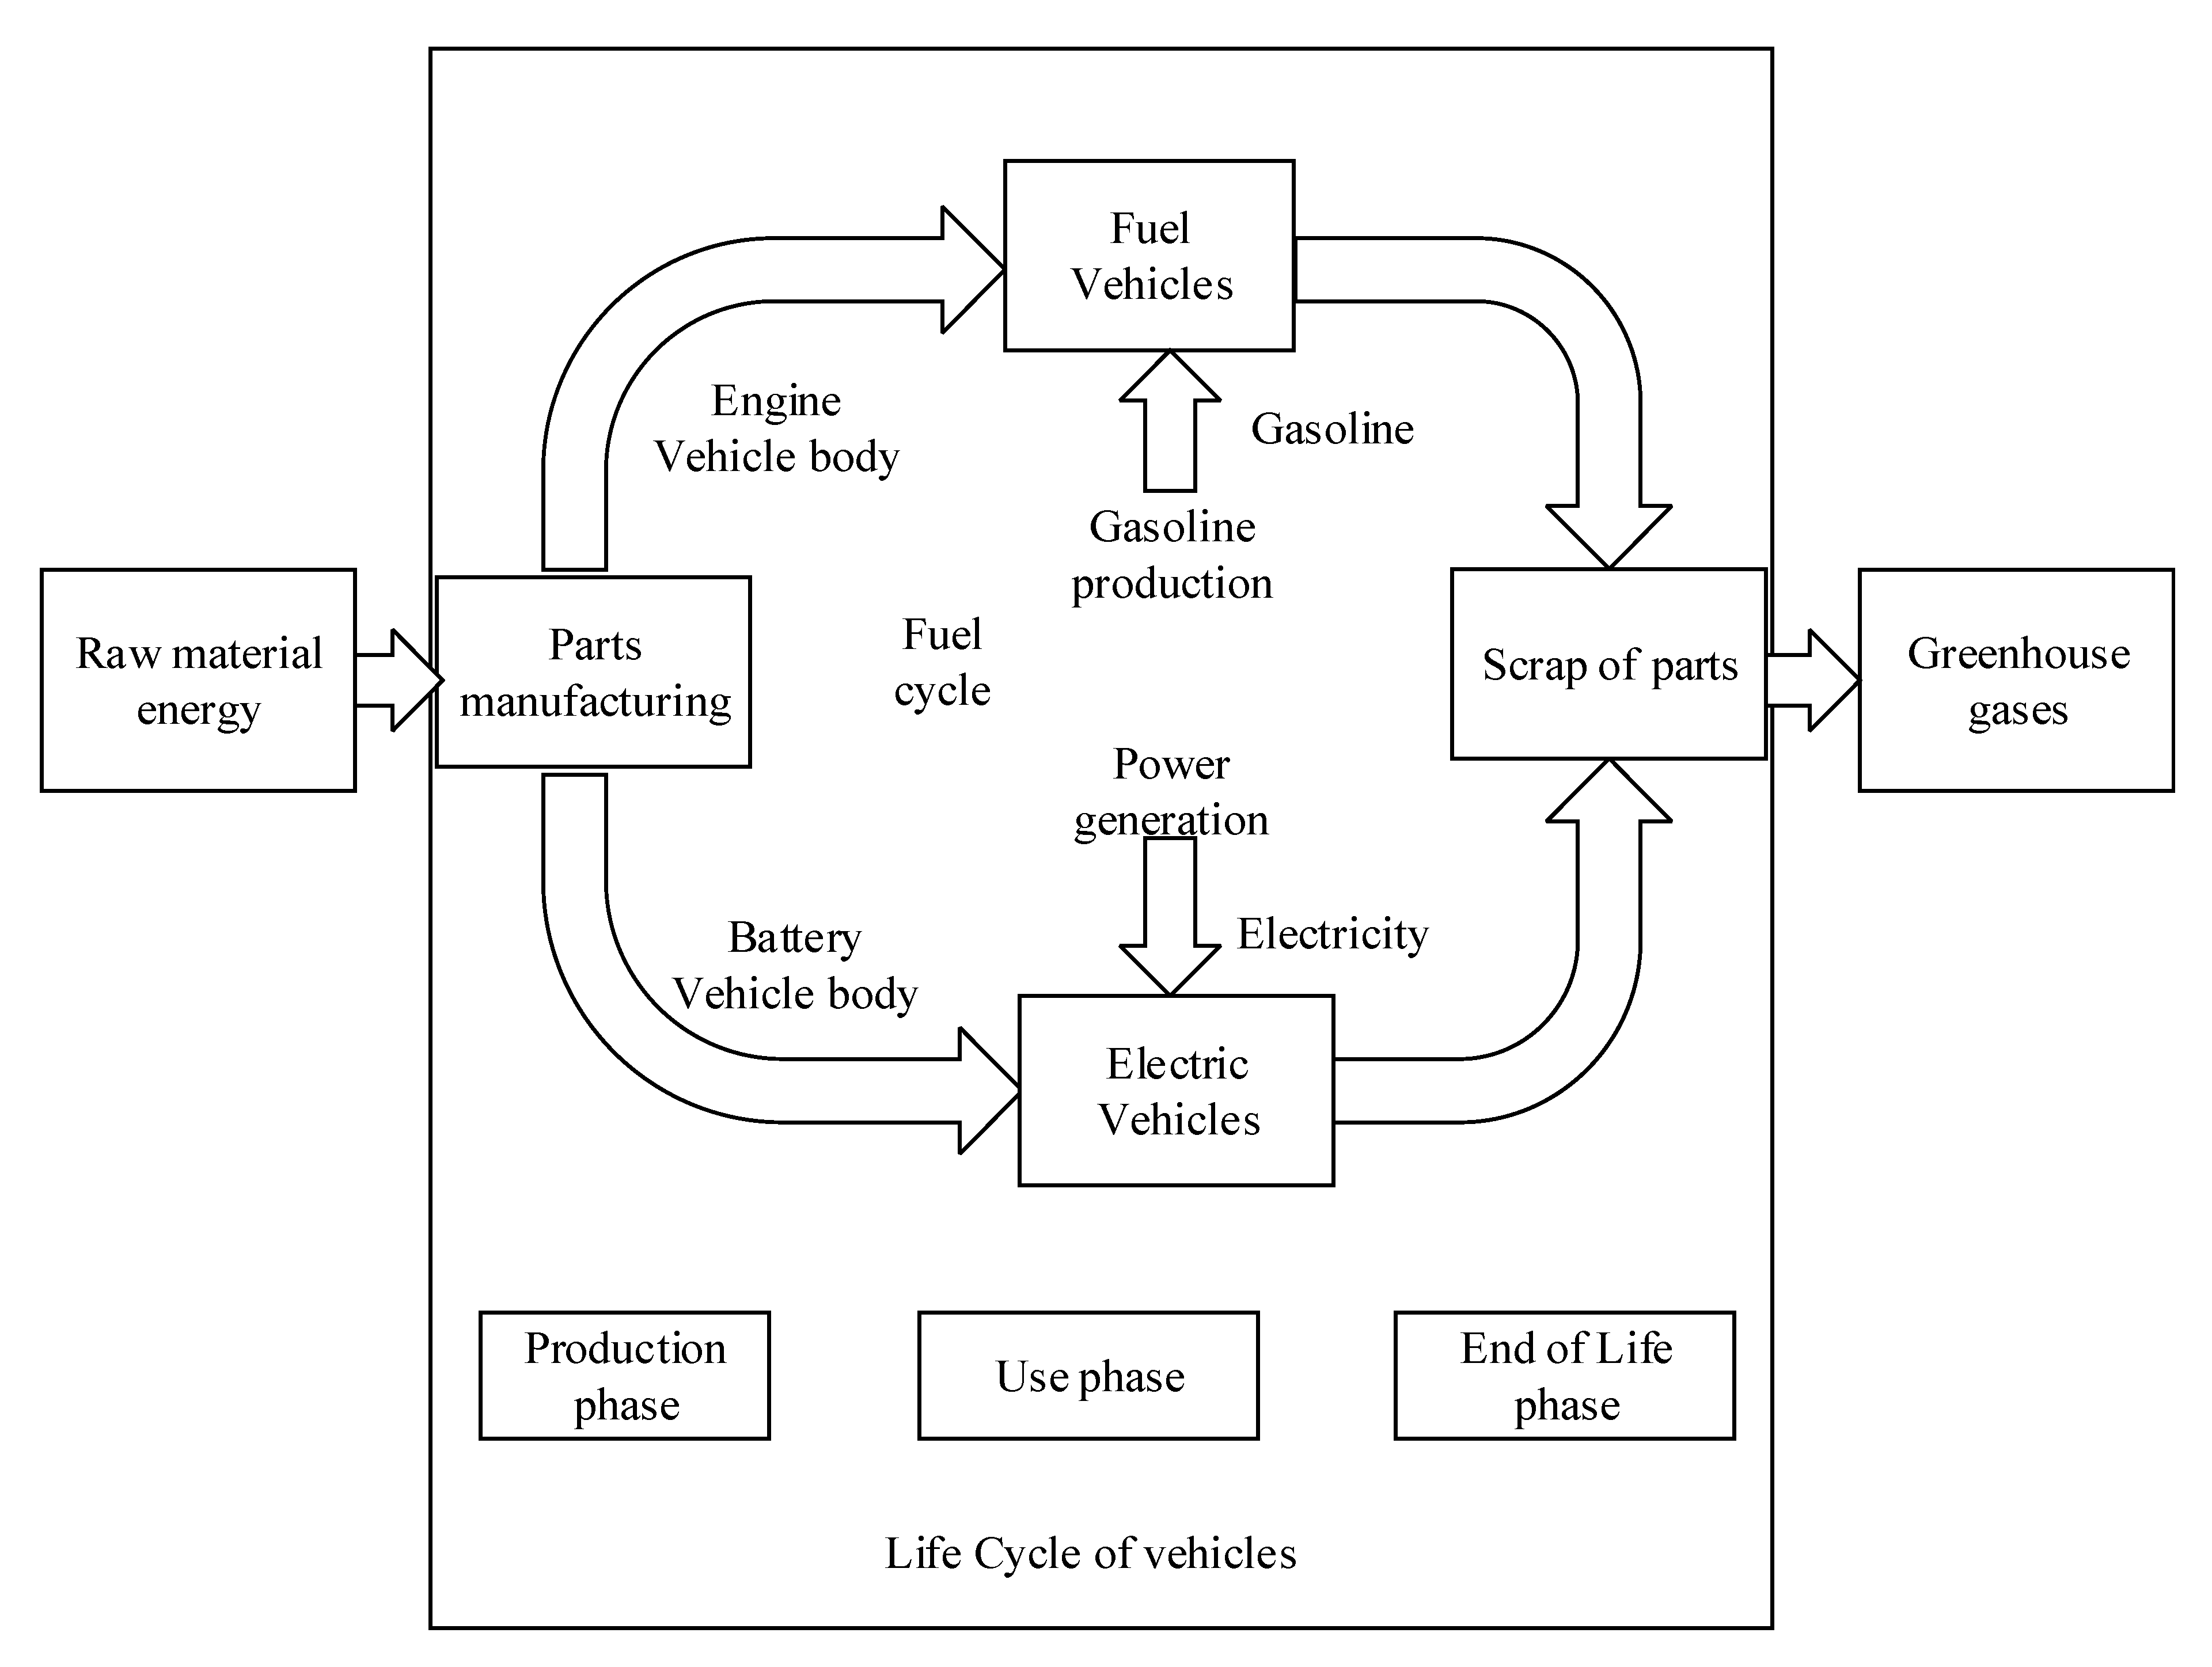
2.3. Evaluation Objectives and System Boundaries
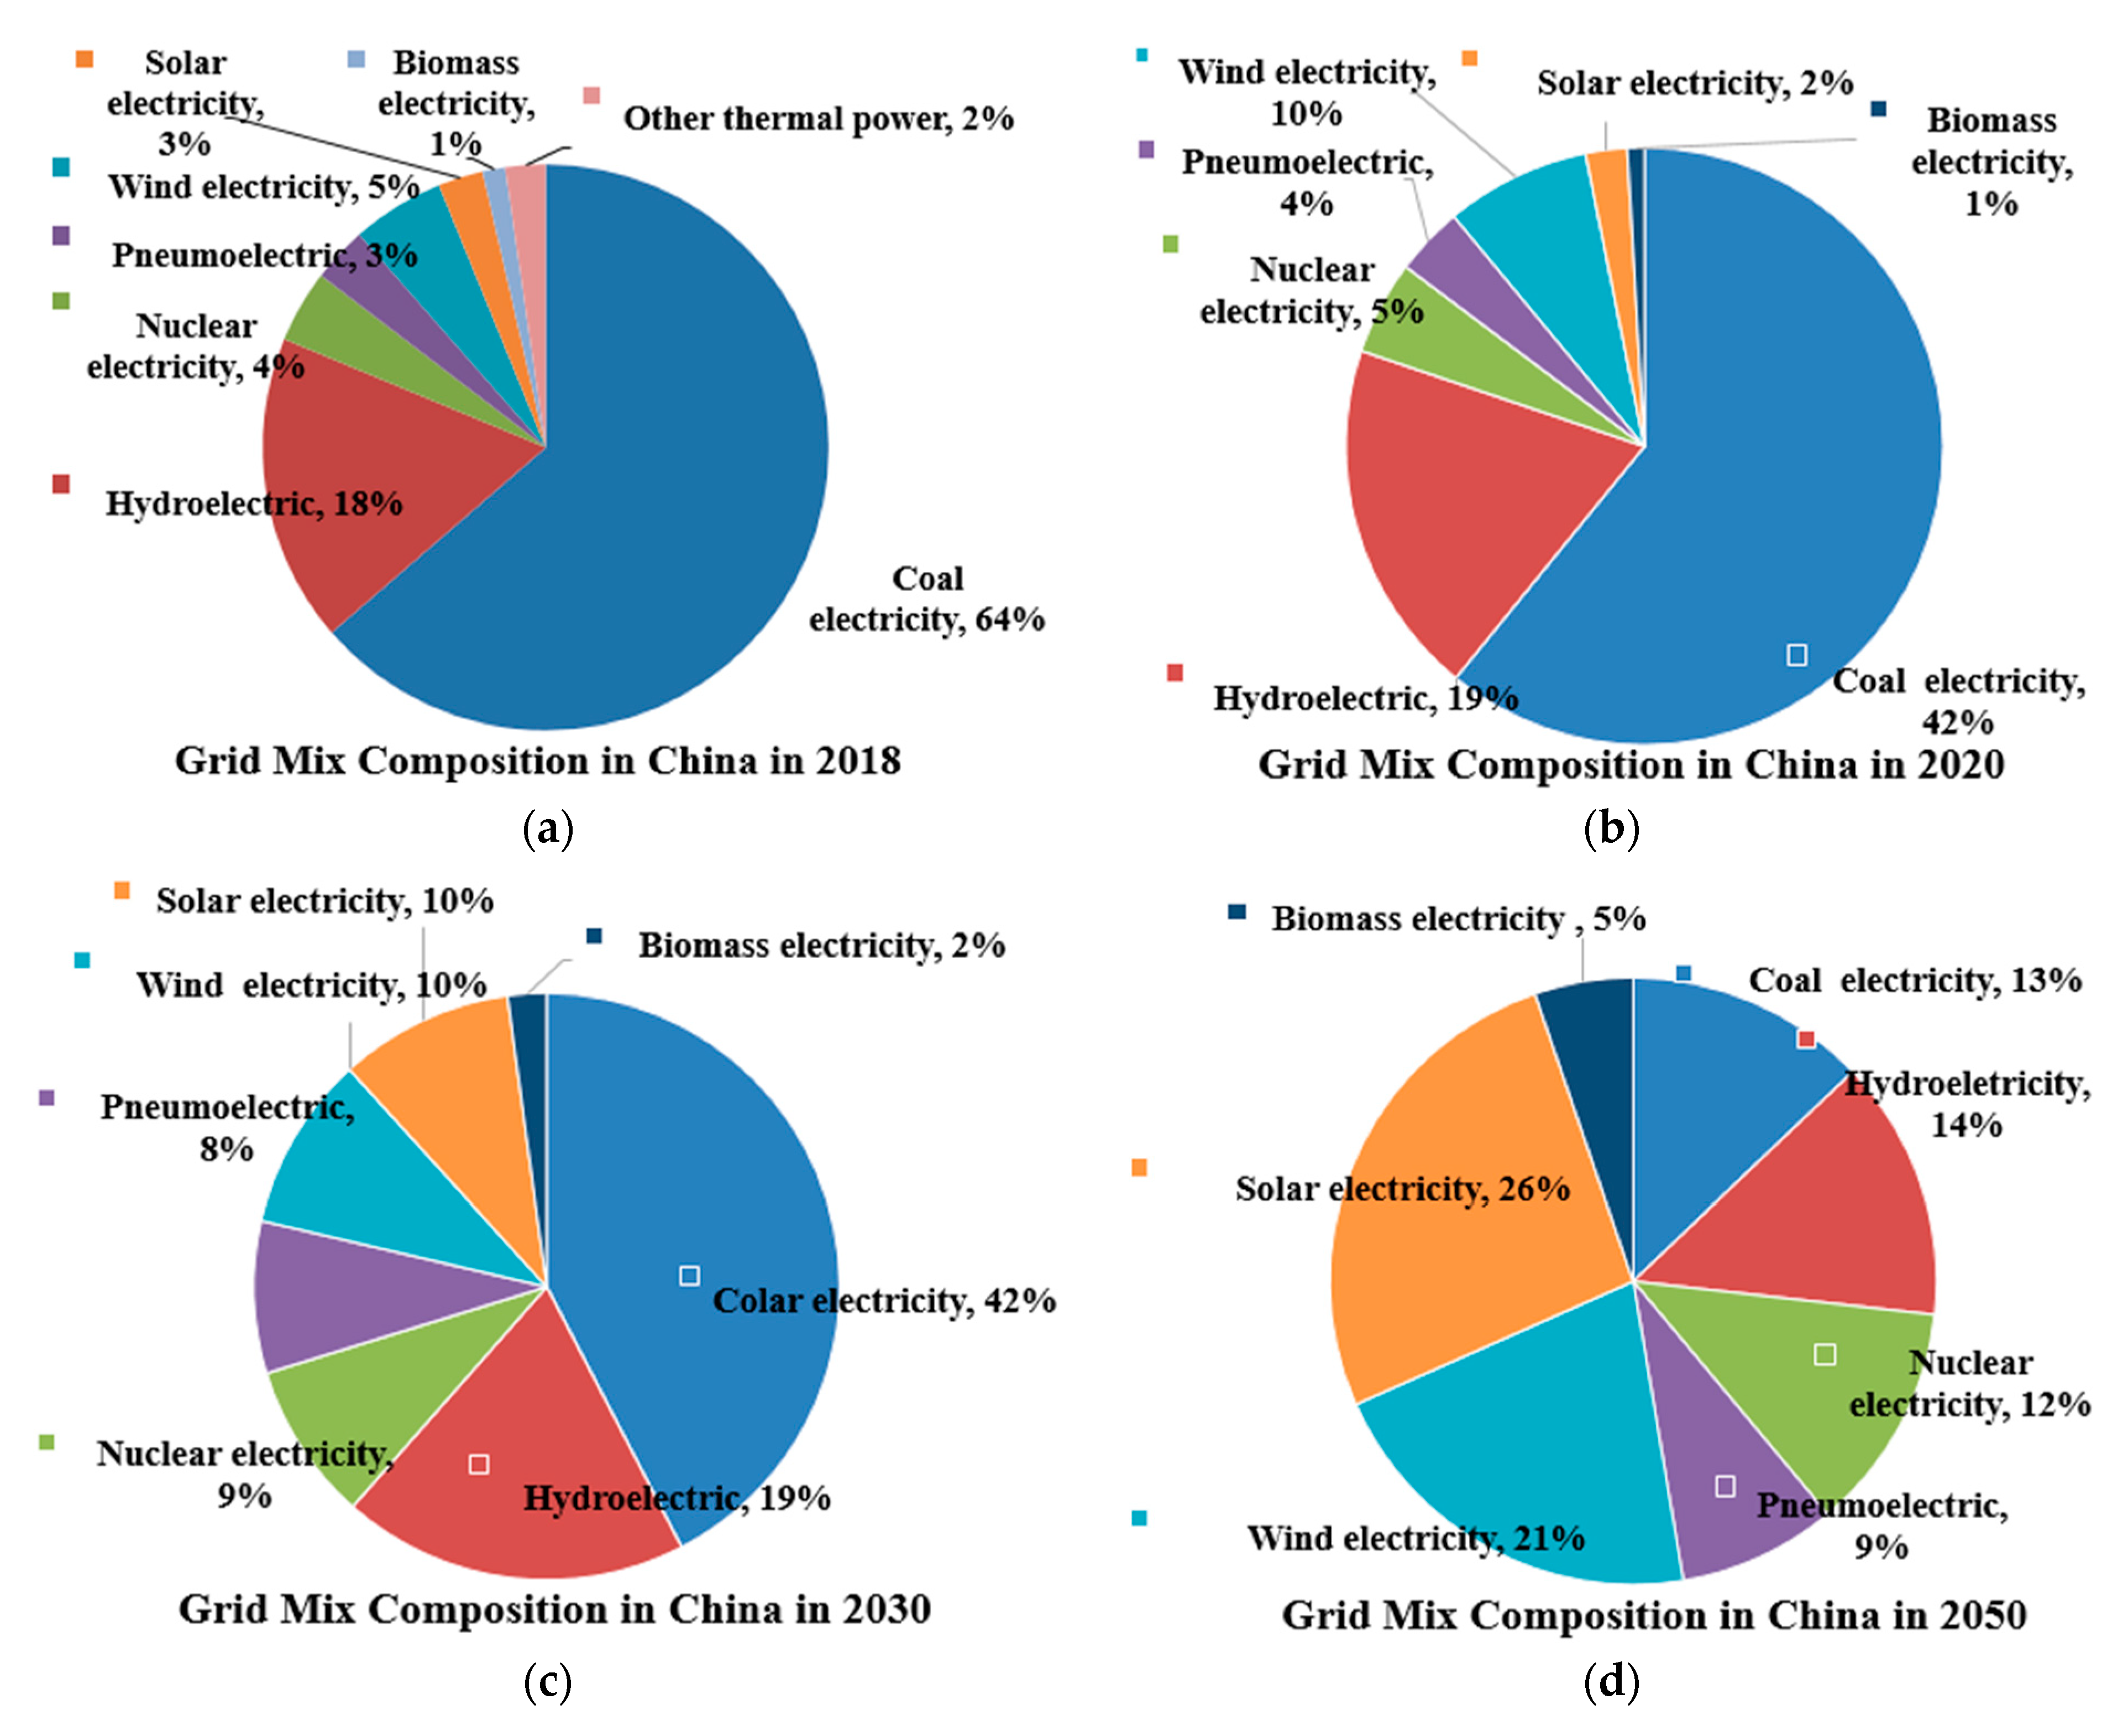
- Fuel cycle: The analysis is based on the full grid mix, which includes coal-fired power generation and other power generation forms. The system boundary includes the production and transportation of electricity. For example, the coal-fired power generation include the processes from coal mining and transportation to power plants, power generation processes and power transmission processes to charging piles and the consumption process of vehicles. Because our country electric grid mix composition including other power generation methods except coal, water power, wind power, solar power, nuclear power, etc. They generate electricity with different carbon emissions and environmental impacts; therefore, this article will fully consider these power generation methods, according to the proportion of 2017 years of Chinese electric grid mix composition energy (source: China statistical yearbook, 2018). In contrast, the fuel cycle of a fuel truck includes the extraction, transportation to a chemical plant, refining, transportation to a gas station and consumption of fuel truck.
- Vehicle cycle: vehicle cycle includes the mining of raw materials, production and assembly of parts, use and scrap of electric vehicles. As there are many similar processes in the process of production, maintenance in the process of use, parts replacement and final scrapping, the vehicle maintenance parts with small energy consumption and emission are ignored in this paper for the whole life cycle.
2.4. Greenhouse Gas Emission Calculation Model
3. Data Collection
4. Research Results
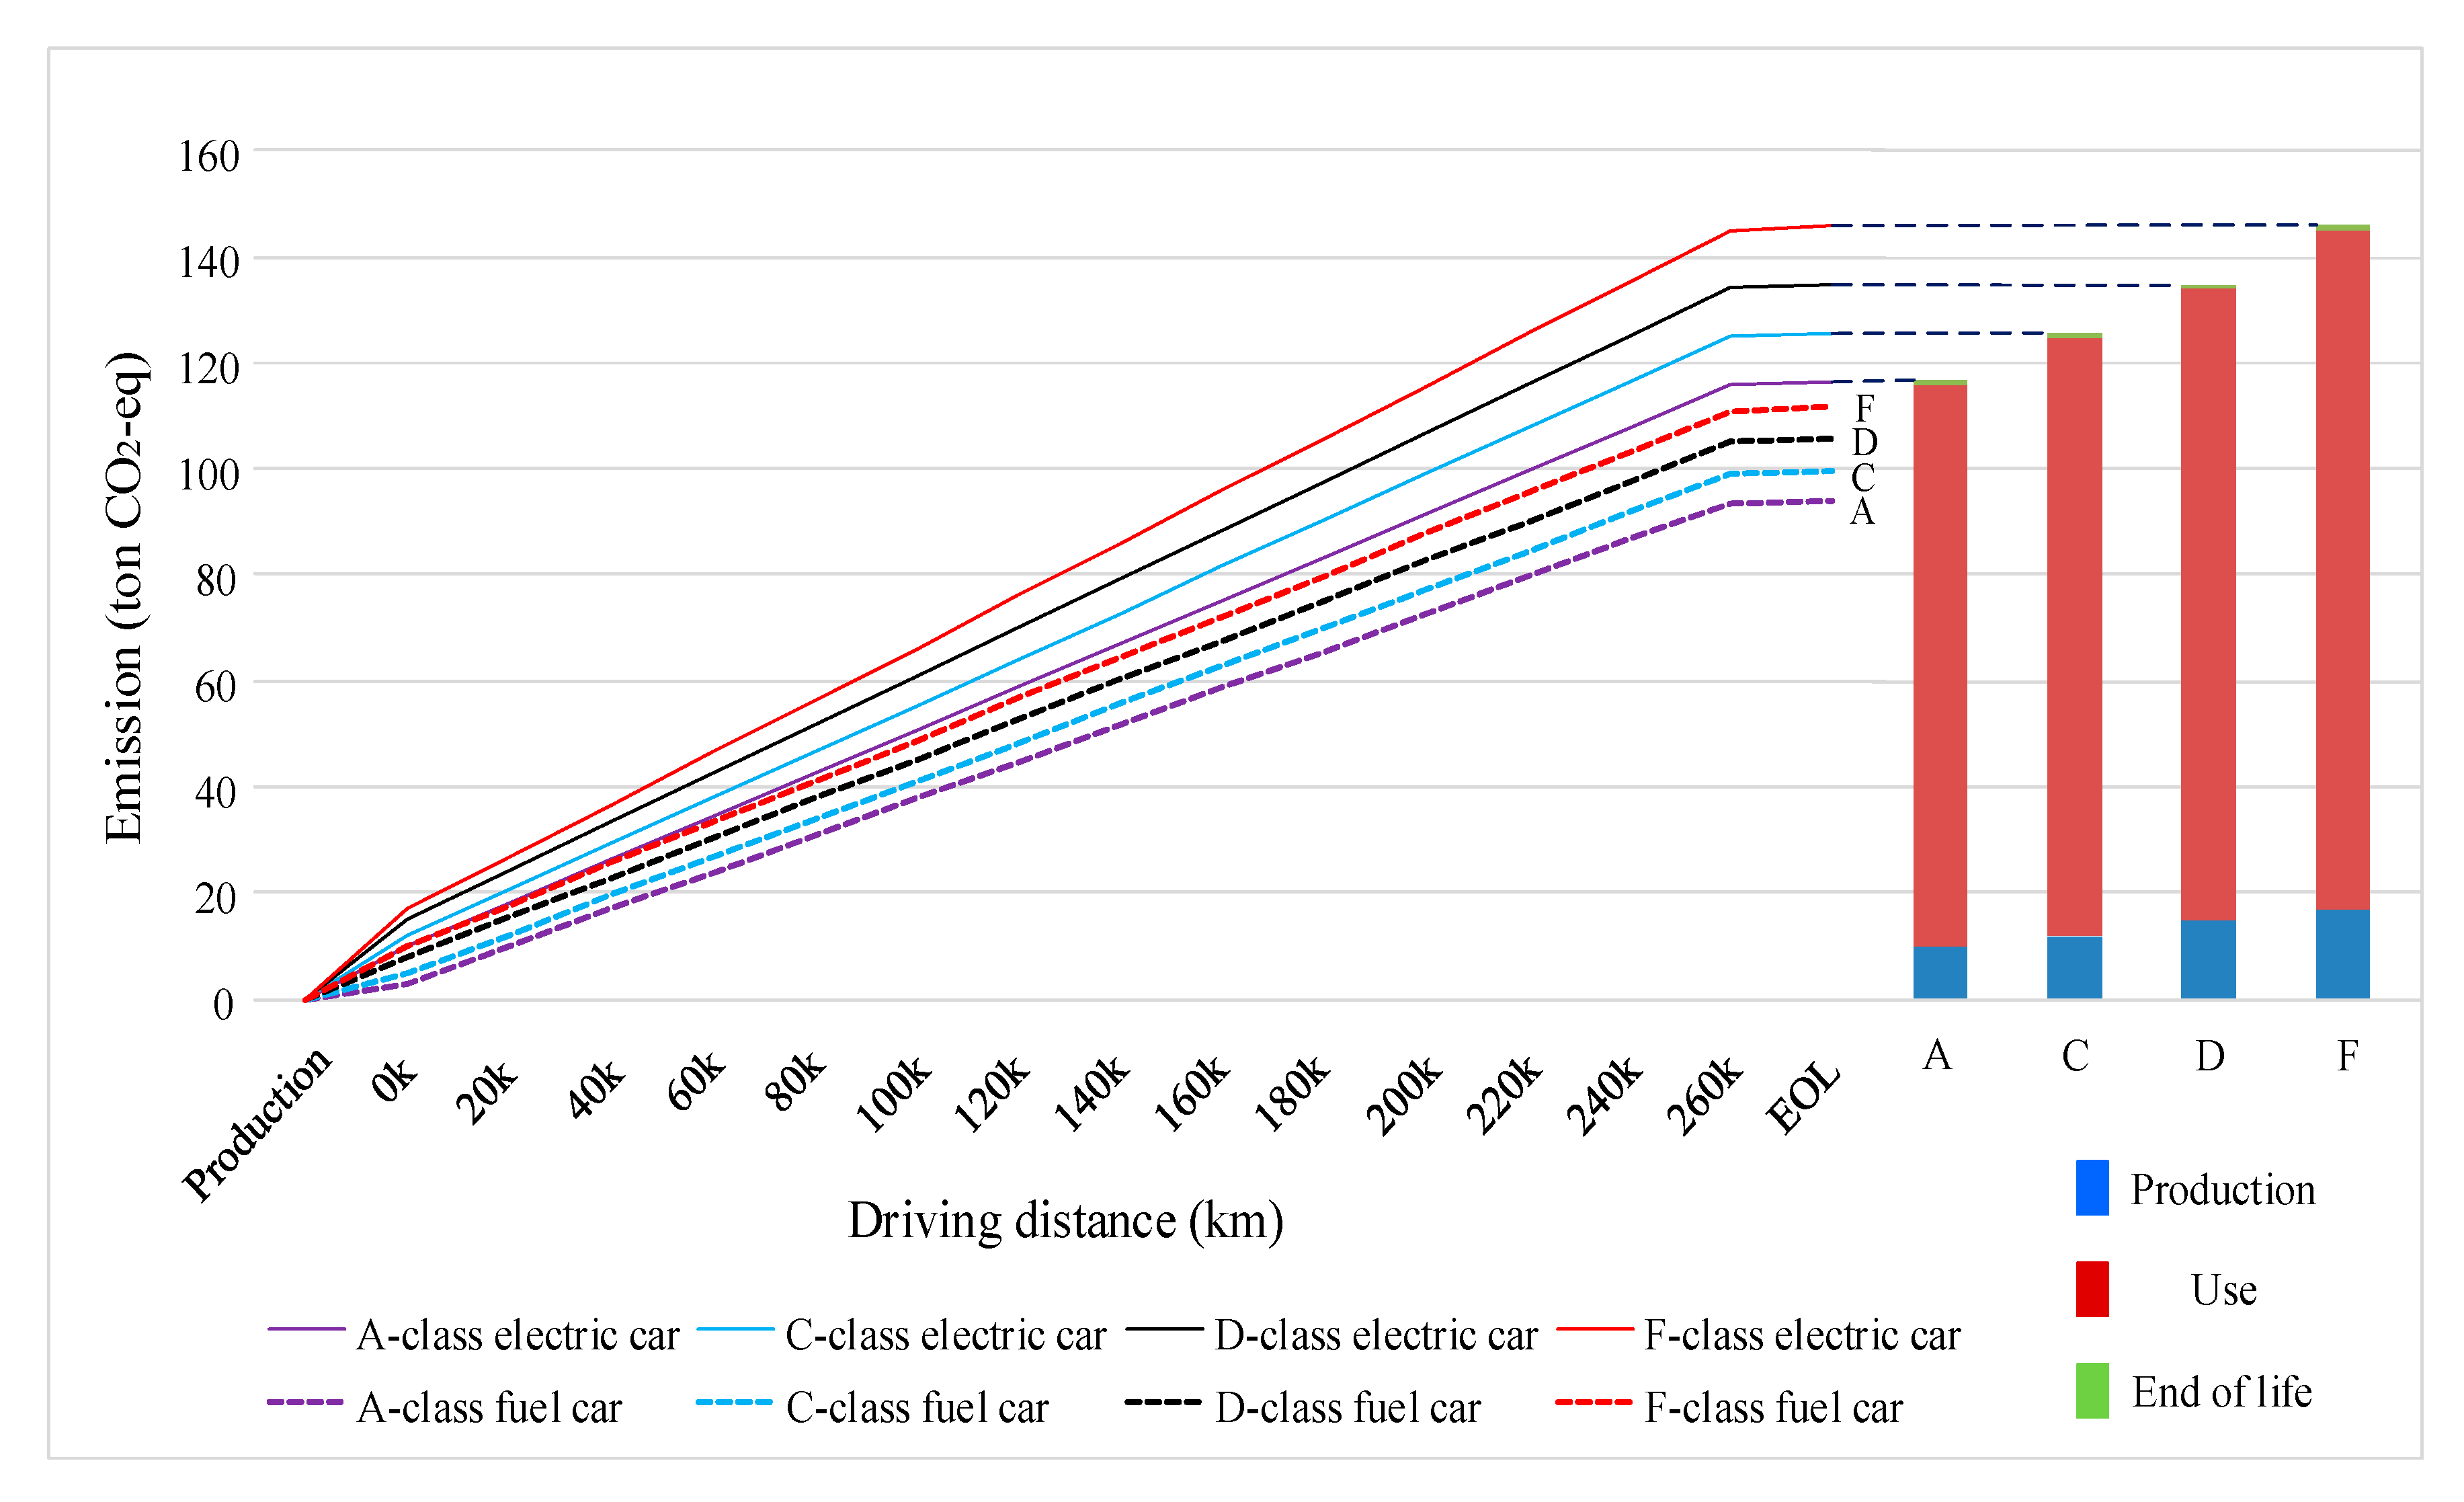
4.1. Carbon Emission Comparison between Electric Vehicles and Fuel Vehicles under the Current Electric Energy Structure
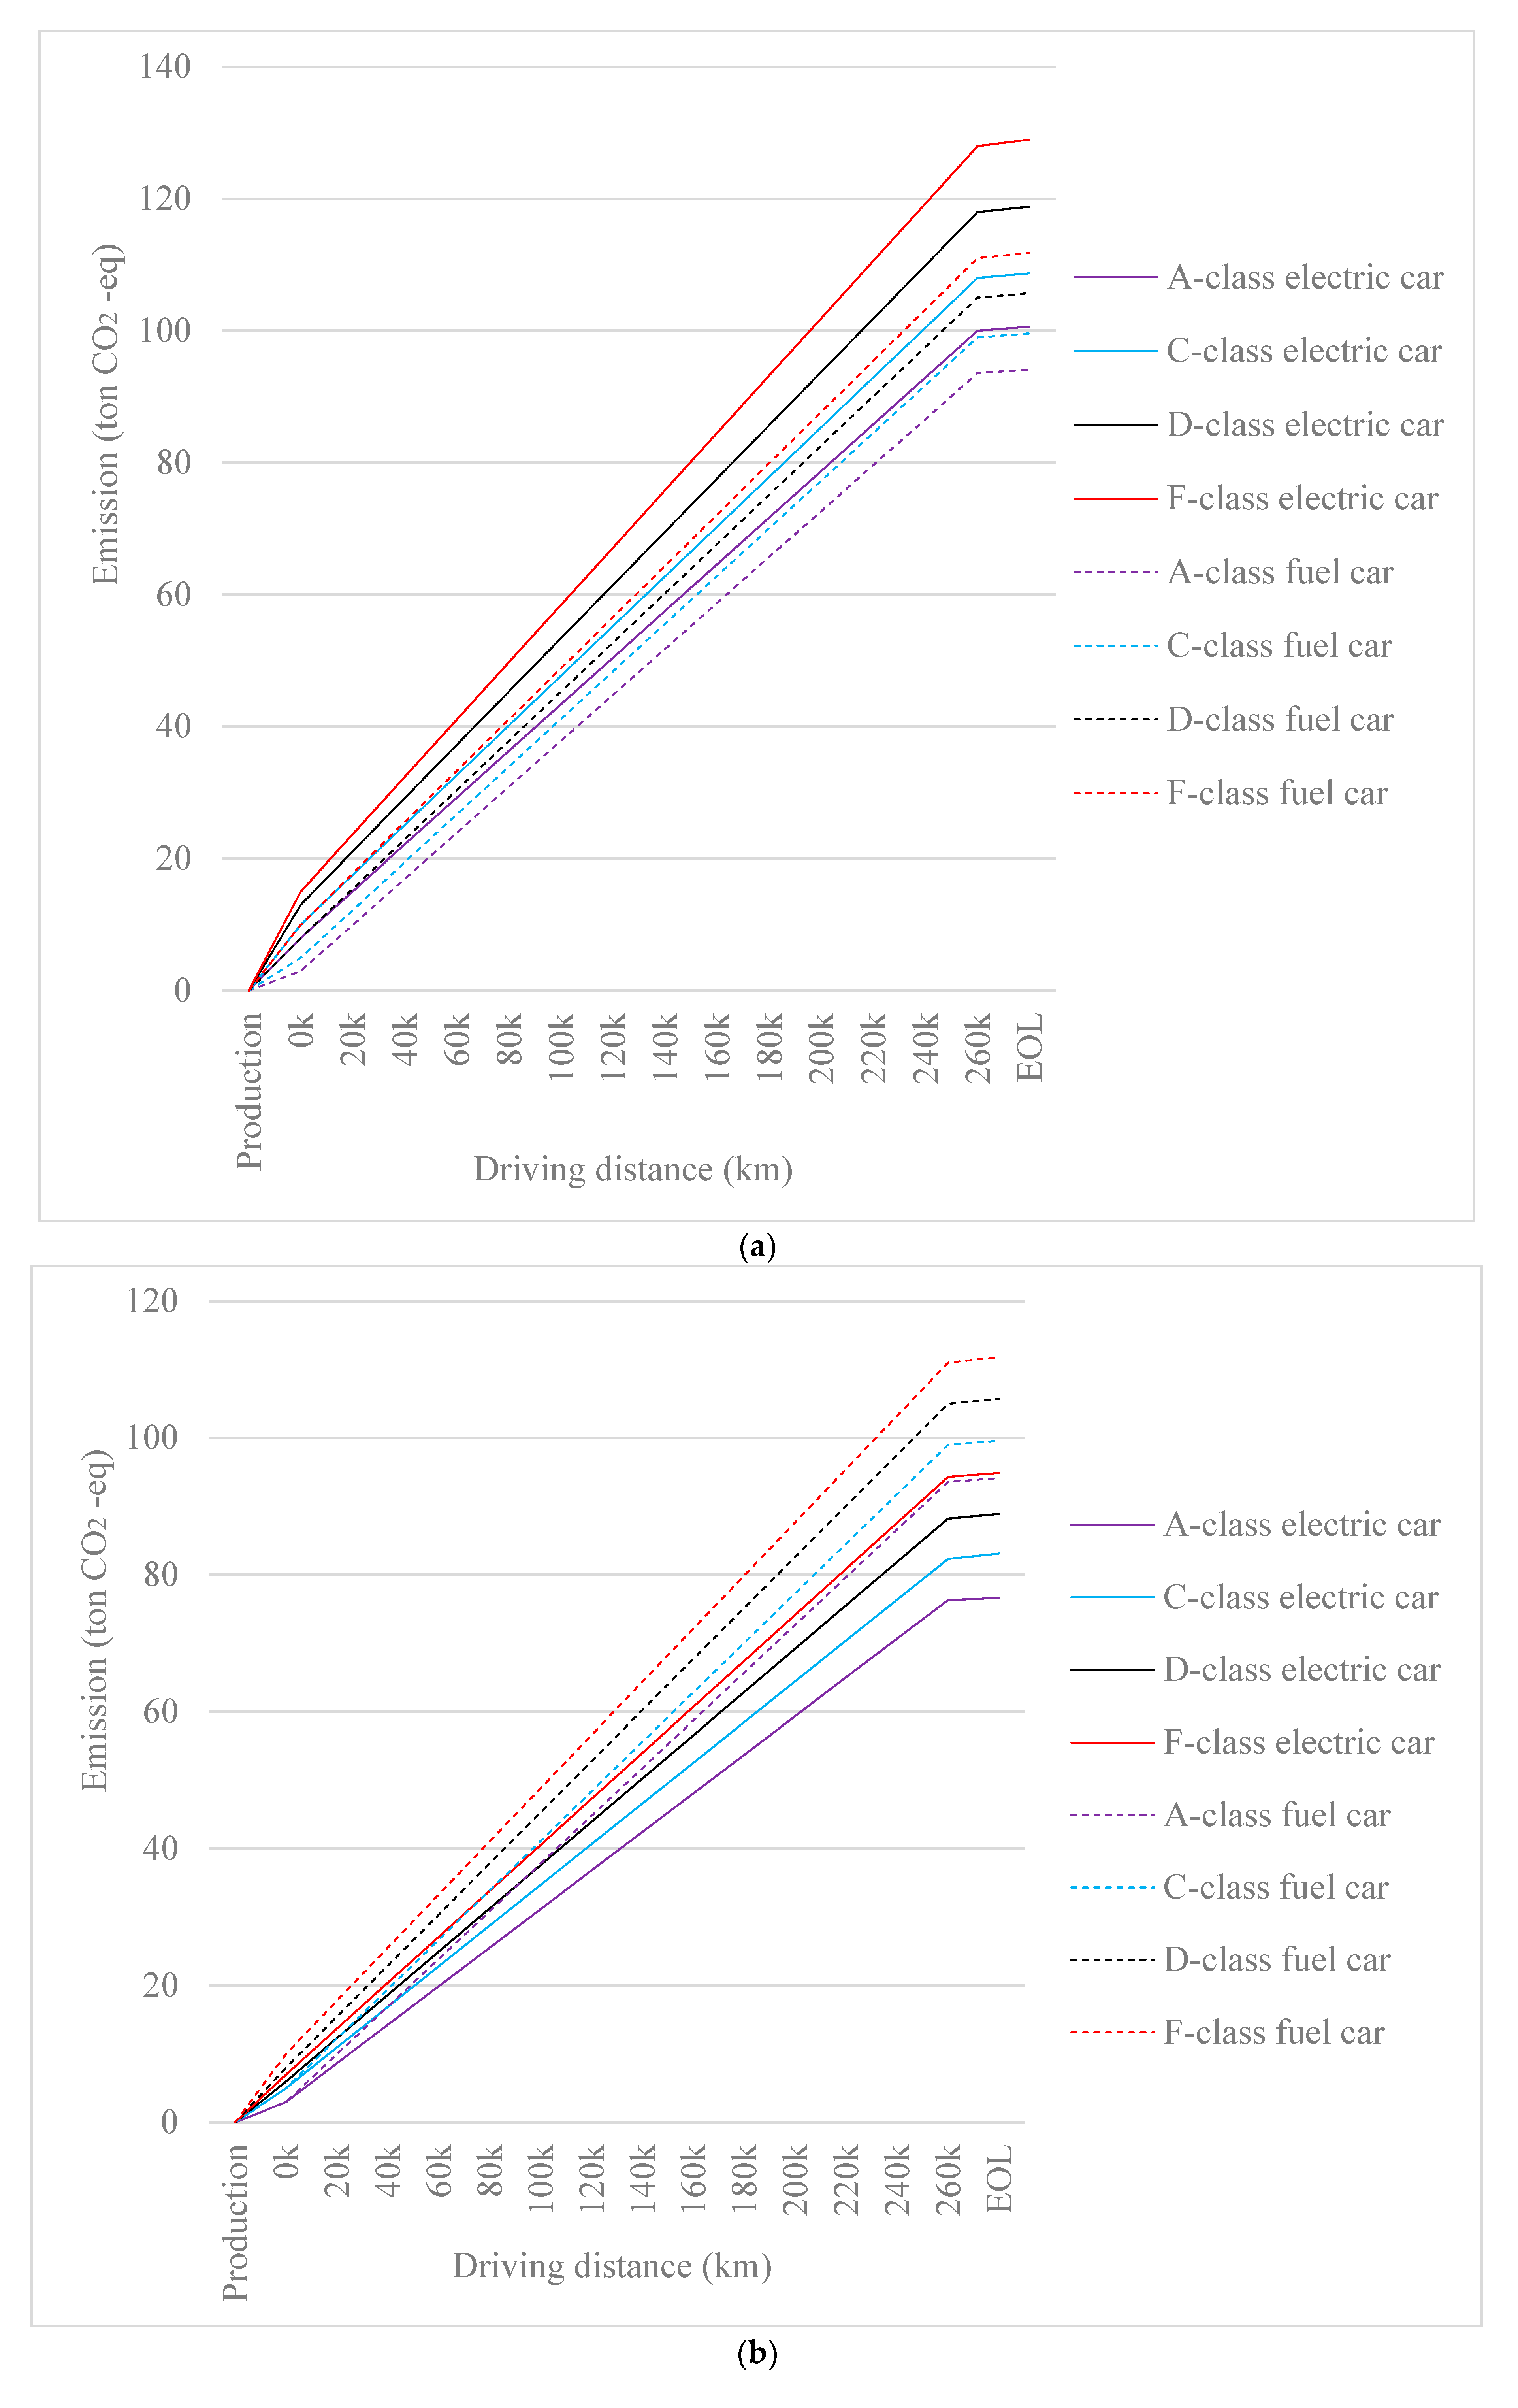
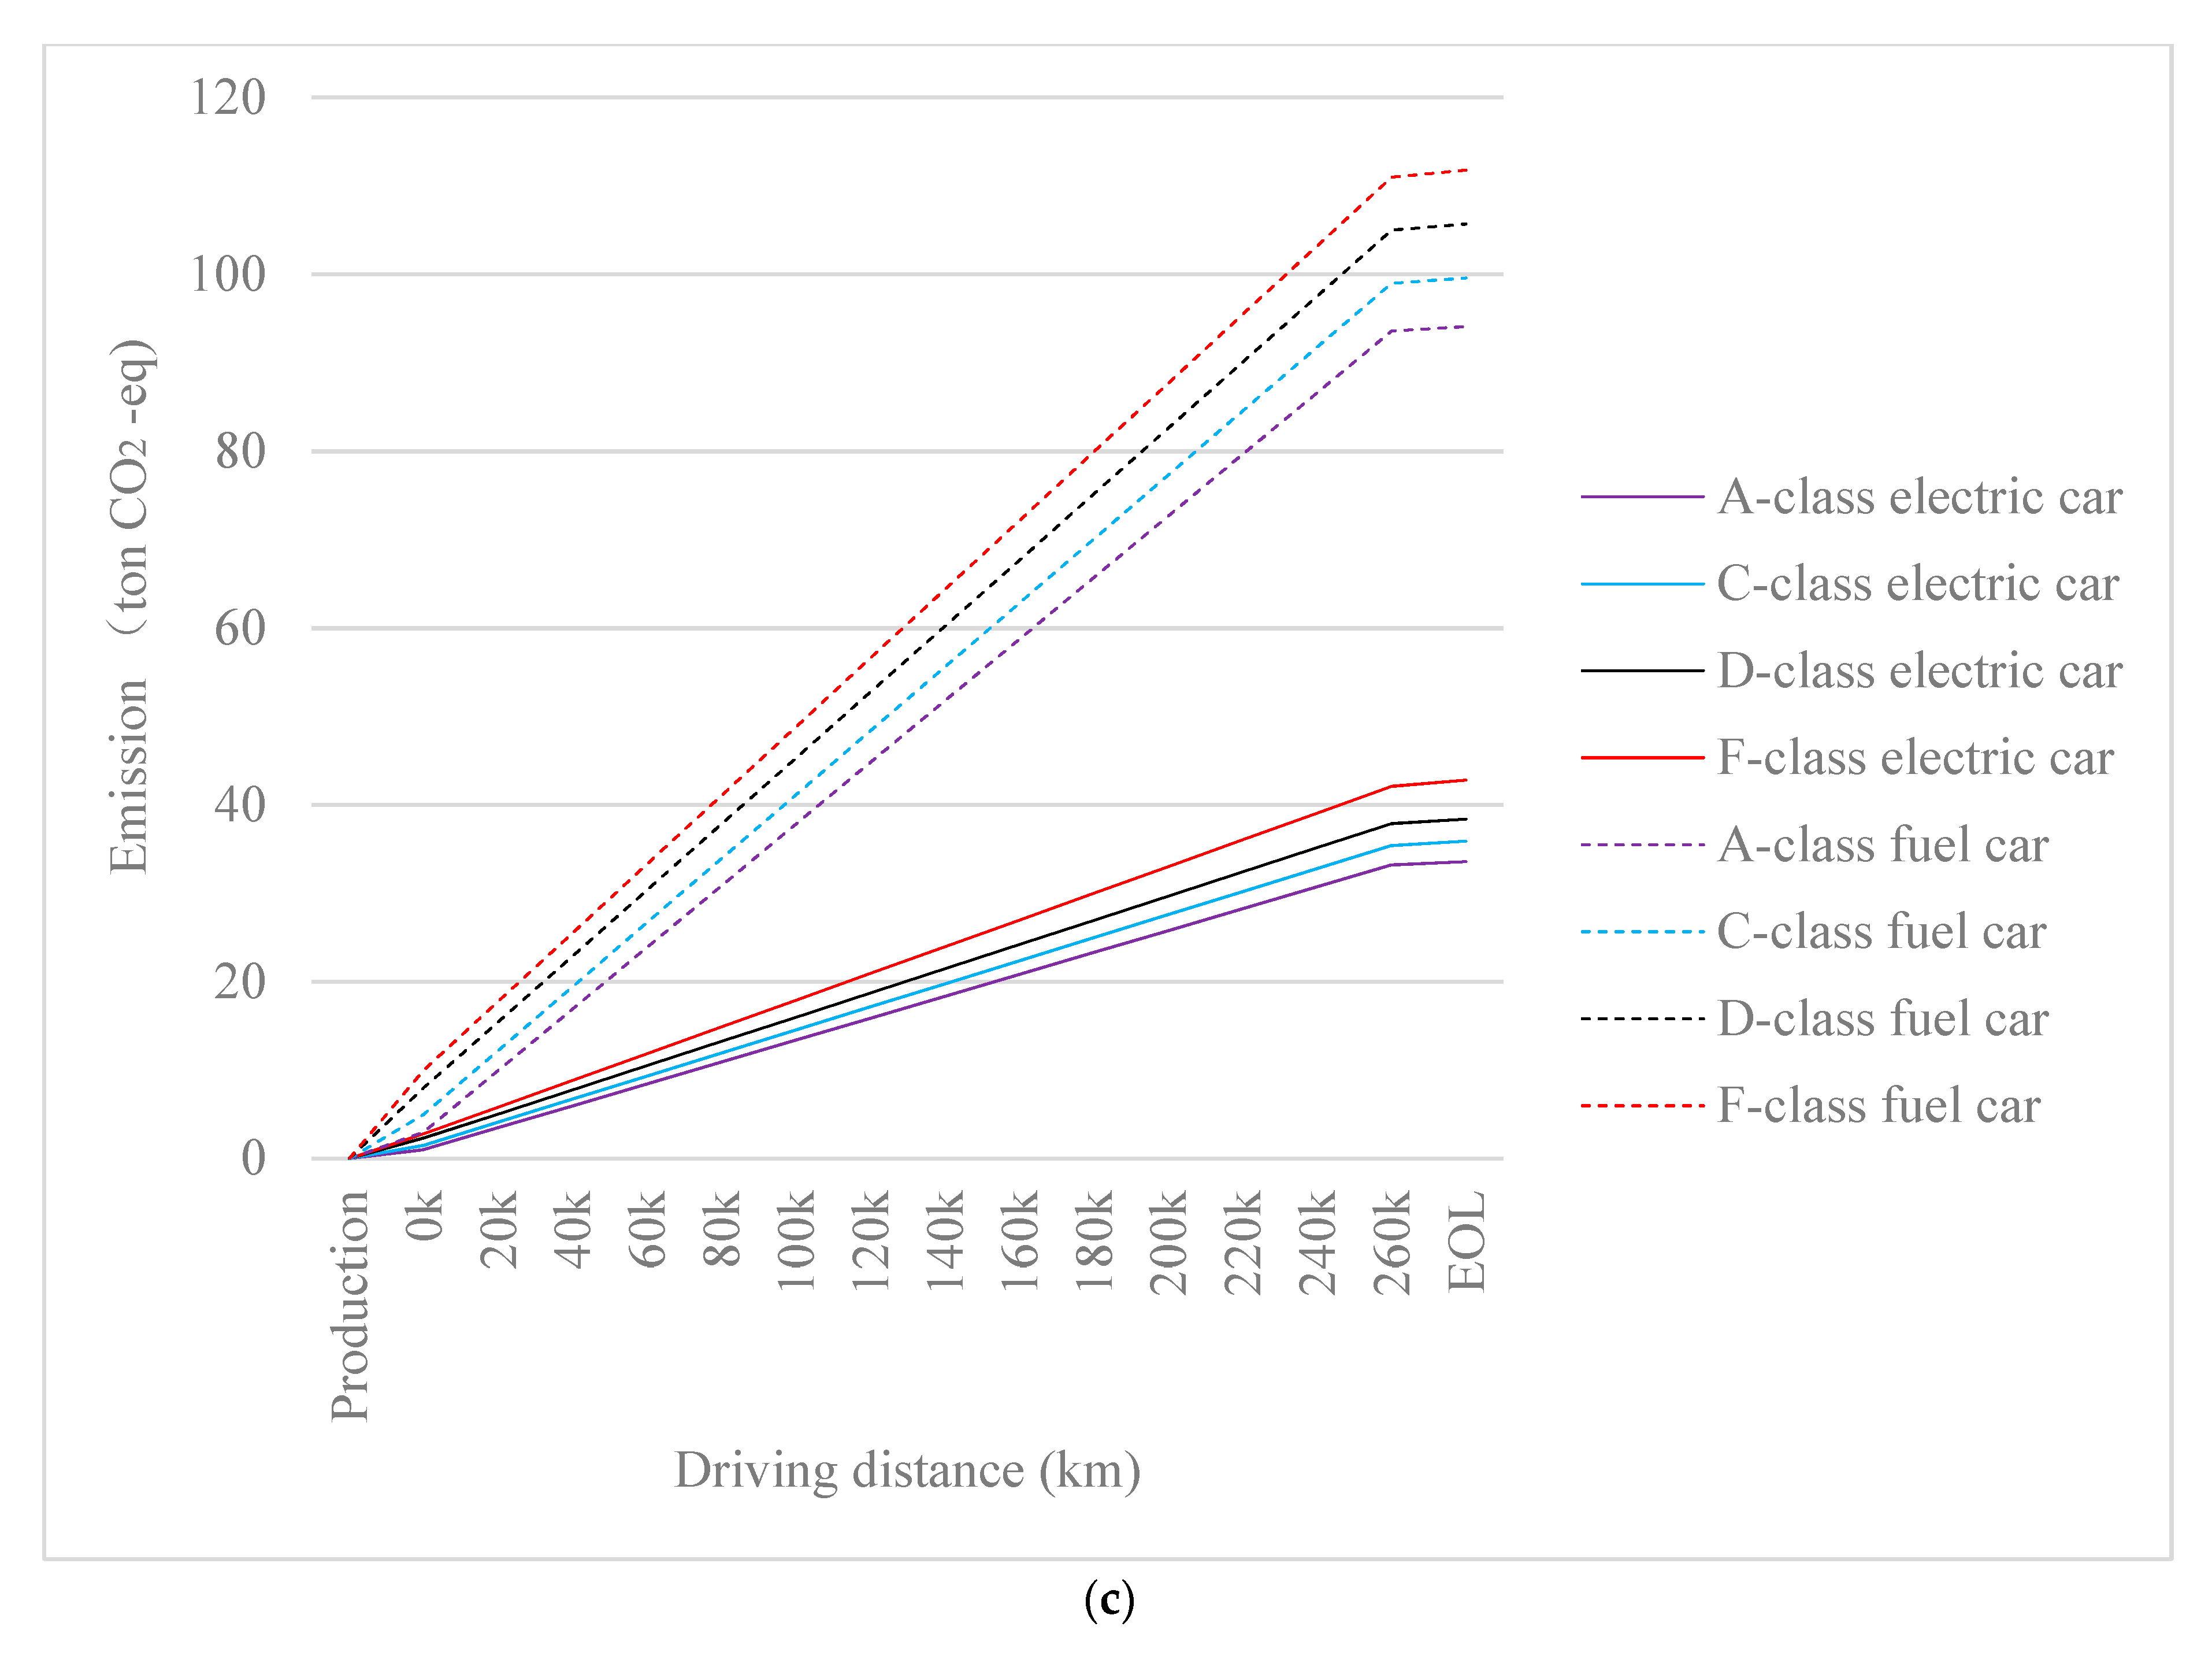
4.2. Carbon Emission Comparison between Electric Vehicles and Fuel Vehicles under Different Grid Mix Compositions
5. Conclusions
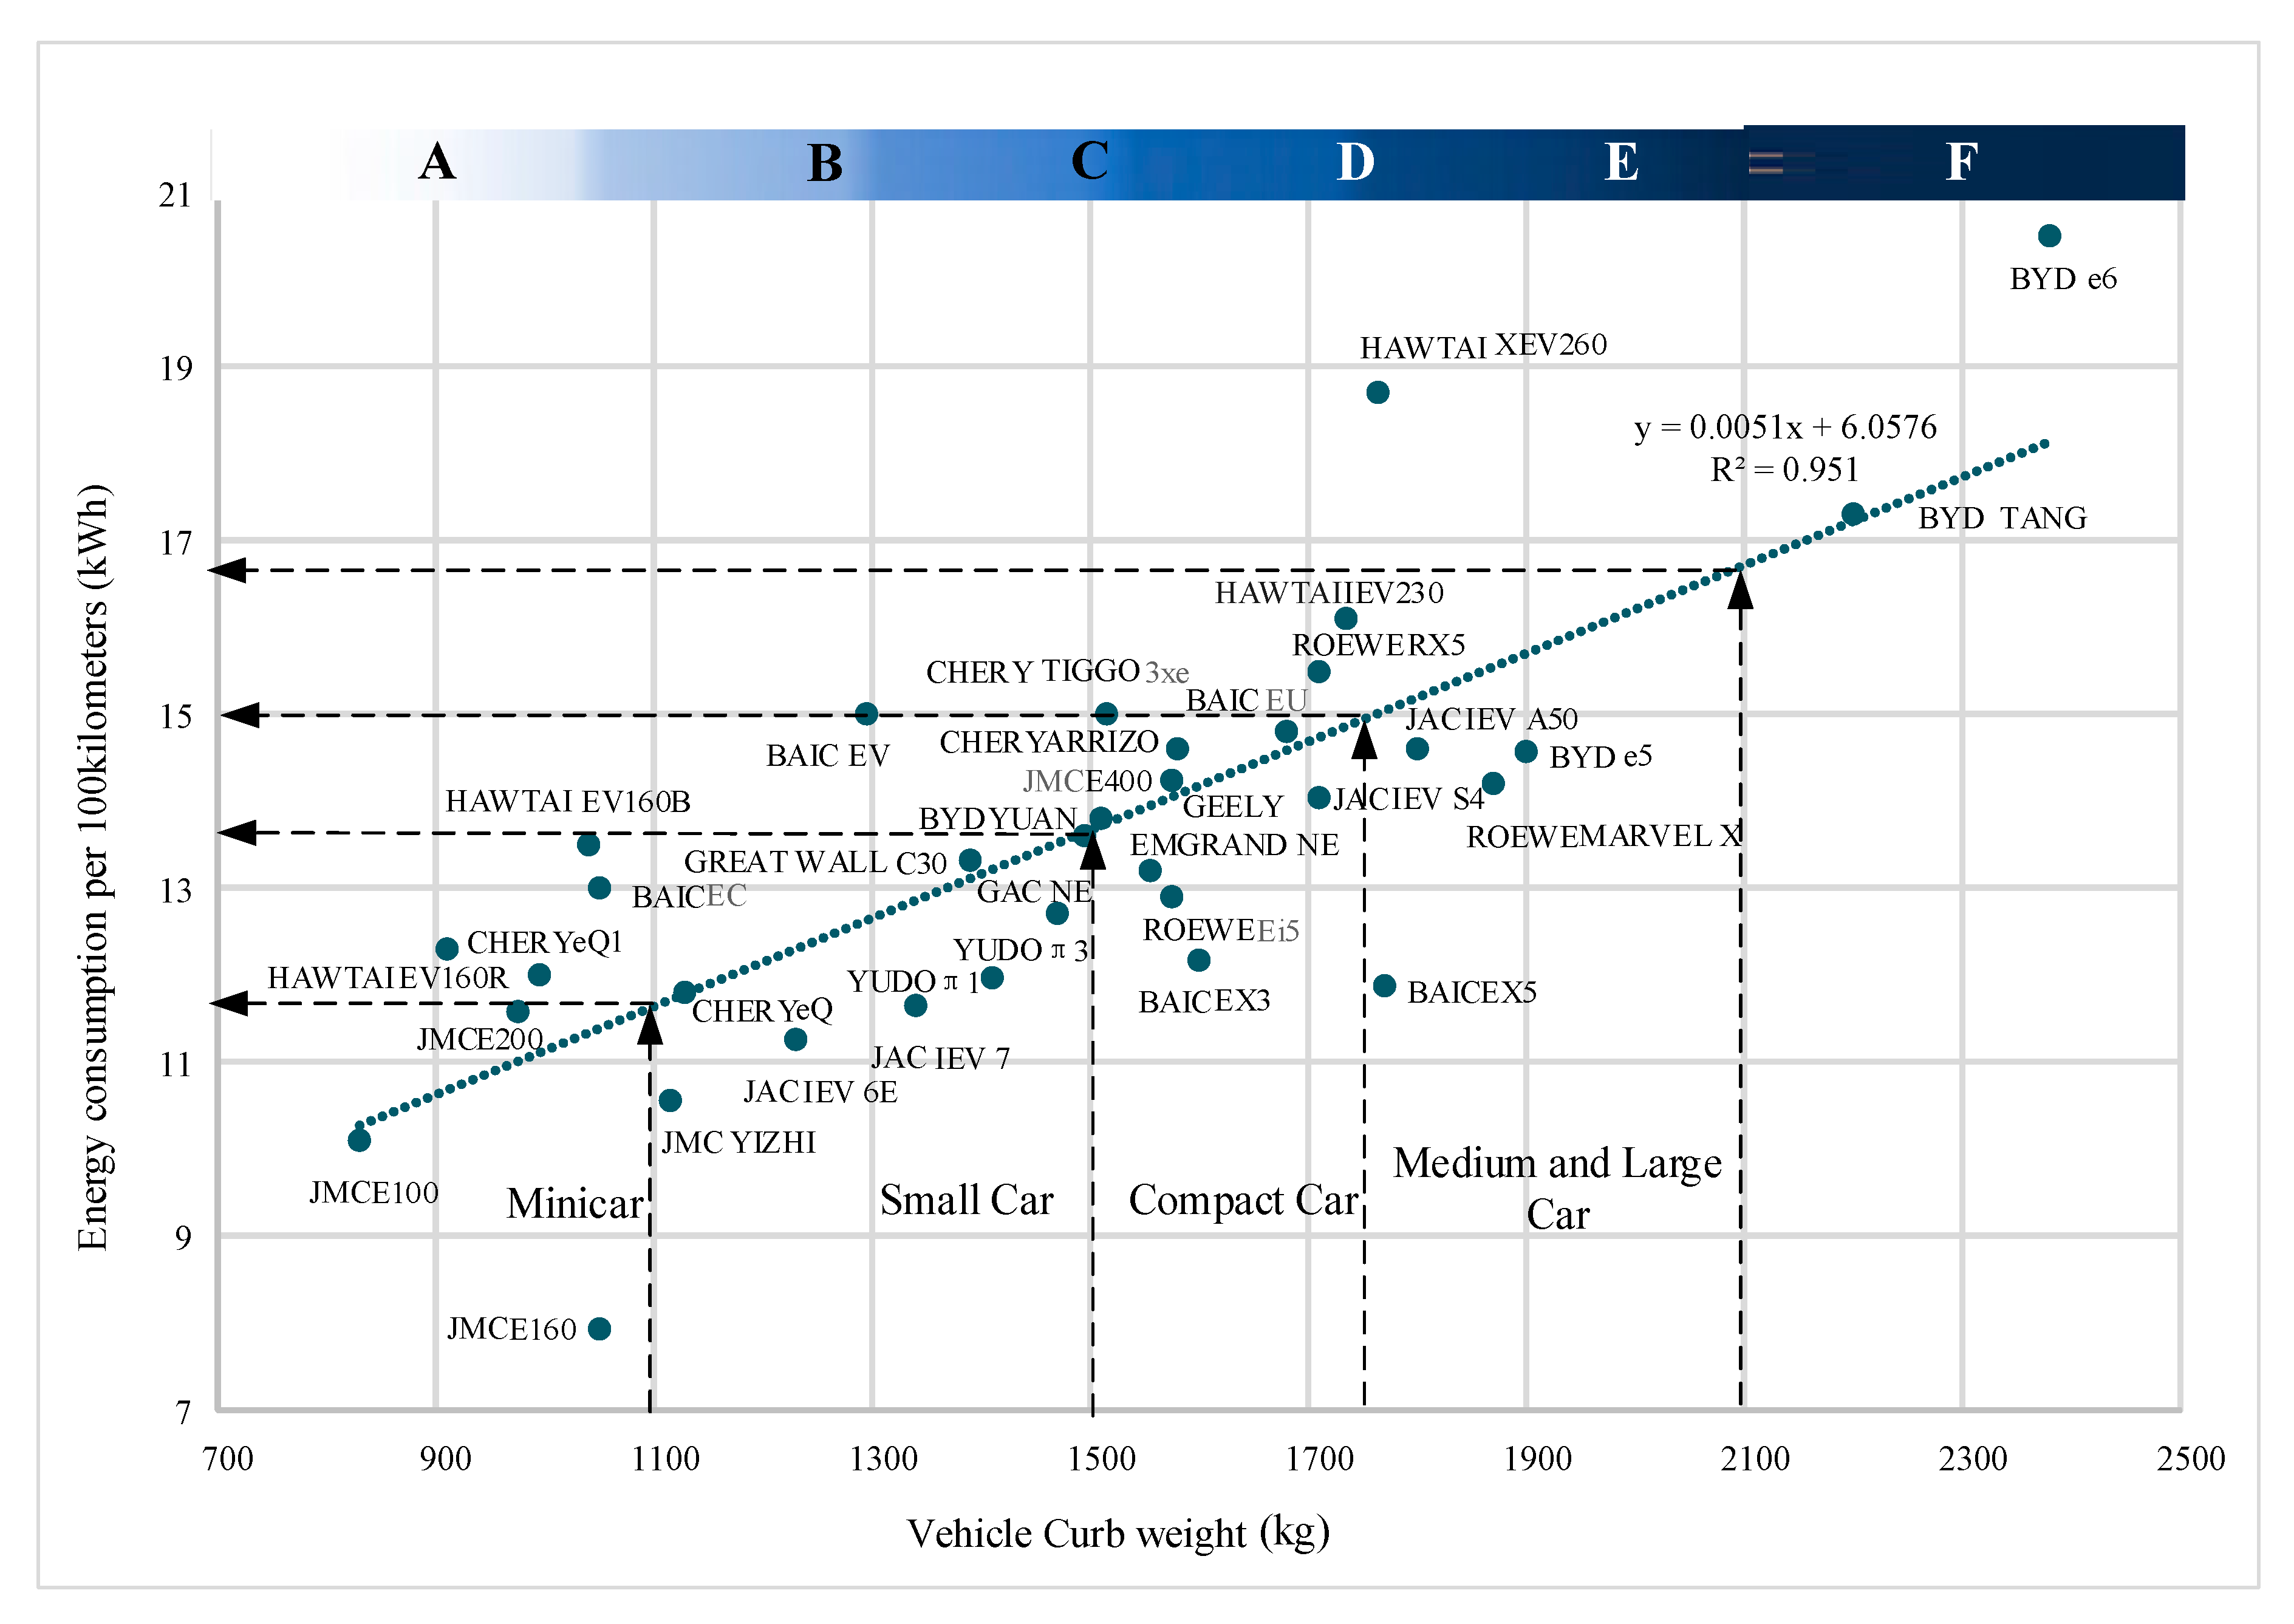
- Through the data collection and analysis of 34 electric models in China, it is found that there is a linear relationship between the whole weight of electric vehicles and the energy consumption of 100 km. The larger the vehicle weight, the greater the energy consumption for 100 km, and the greater the corresponding battery capacity and range. In the same life cycle, electric vehicles with large vehicle weight will consume more electricity and generate more carbon emissions than electric vehicles with small vehicle weight. The comparison of the carbon emission of electric vehicles and fuel vehicles shows that the full life cycle carbon emission of electric vehicles of any level is higher than that of fuel vehicles of the same level under the current energy structure. In addition, the lifetime carbon emissions of electric vehicles increase with the increase of vehicle weight.
- It can be seen from the calculations that the energy consumption and pollutant emissions of the whole life cycle of the automobile mainly come from the use stage. Due to China’s current grid mix composition still being dominated by coal, the electricity consumed during the electric vehicle use phase contains a large amount of carbon emissions, so the electric car relative to the fuel vehicle emission reduction effect is not obvious, and may even result in lifecycle carbon emissions that are more than those of fuel vehicles, which is consistent with the conclusions of Feng Chao [14] and Global Electric Vehicle Prospect 2018 [3]. There is some difference between the research results and those of Ou Xunmin et al. [9], who believe that the carbon emission of electric vehicles is less than that of fuel vehicles in their whole life cycle. The main reason is that the PLCA method selected by Ou Xunmin et al. may have truncation errors when selecting system boundaries.
- Under the current grid mix composition, the carbon emissions of electric vehicles of the same level are higher than those of fuel vehicles over the whole life cycle. As clean energy increasingly replaces coal power, the relative carbon intensity of electric vehicles will be reduced. In the predicted electricity structure of 2020, the carbon emission of electric vehicles of the same level is higher than that of fuel cars, while in the electricity structure of 2030 and 2050, the carbon emission of electric vehicles of the same level is lower than that of fuel cars. This is mainly due to the lower production carbon emissions of the electricity consumed during the use of electric vehicles.
Author Contributions
Funding
Conflicts of Interest
Appendix A

| Parameter | Energy Consumption (kWh/100km) | Vehicle Weight (kg) | Drive Type | Vehicle Model | |
|---|---|---|---|---|---|
| Vehicle | |||||
| Beiqi EC | 13 | 1050 | Pure electric | Mini car | |
| Beiqi EX3 | 12.17 | 1600 | Pure electric | SUV | |
| Beiqi EX5 | 11.88 | 1770 | Pure electric | SUV | |
| Beiqi EV | 15 | 1295 | Pure electric | Small car | |
| Beiqi EU | 14.8 | 1680 | Pure electric | Compact car | |
| BYD Yuan | 13.6 | 1495 | Pure electric | SUV | |
| BYD Tang | 17.3 | 2200 | Pure electric | SUV | |
| BYD e5 | 14.57 | 1900 | Pure electric | Compact car | |
| BYD e6 | 20.5 | 2380 | Pure electric | MPV | |
| Jianghuai IEV 6E | 11.26 | 1230 | Pure electric | Mini car | |
| Jianghuai IEV 7 | 11.65 | 1340 | Pure electric | Small car | |
| Jianghuai IEV S4 | 14.04 | 1710 | Pure electric | SUV | |
| Jianghuai IEV A50 | 14.6 | 1800 | Pure electric | Compact car | |
| Jiangling E100 | 10.1 | 830 | Pure electric | Mini car | |
| Jiangling E200 | 11.58 | 975 | Pure electric | Mini car | |
| Jiangling E160 | 7.93 | 1050 | Pure electric | Small car | |
| Jiangling E400 | 13.8 | 1510 | Pure electric | SUV | |
| Jiangling Yizhi | 10.56 | 1115 | Pure electric | Small car | |
| Chery Ayers5e | 14.6 | 1580 | Pure electric | Compact car | |
| Chery eQ | 11.8 | 1128 | Pure electric | Mini car | |
| Chery eQ1 | 12 | 995 | Pure electric | Mini car | |
| Chery Tiggo3xe | 15 | 1515 | Pure electric | SUV | |
| Roewe Ei5 | 13.2 | 1555 | Pure electric | Compact car | |
| Roewe RX5 | 15.49 | 1710 | Pure electric | SUV | |
| Roewe MARVEL X | 14.2 | 1870 | Pure electric | SUV | |
| Huatai EV160B | 13.5 | 1040 | Pure electric | Mini car | |
| Huatai EV160R | 12.3 | 910 | Pure electric | Mini car | |
| Huatai XEV260 | 18.7 | 1764 | Pure electric | SUV | |
| Huatai IEV230 | 16.1 | 1735 | Pure electric | Compact car | |
| Geely New Energy | 14.24 | 1575 | Pure electric | Compact car | |
| Changcheng C30 | 13.32 | 1390 | Pure electric | Compact car | |
| Guangqi New energy | 12.9 | 1575 | Pure electric | Compact car | |
| Yundu π3 | 12.71 | 1470 | Pure electric | SUV | |
| Yundu π1 | 11.97 | 1410 | Pure electric | SUV | |
| Year | 2018 | 2020 | 2030 | 2050 | |
|---|---|---|---|---|---|
| Power Generation Type | |||||
| Coal power (trillion kWh) | 4.45 | 4.506 | 3.789 | 1.59 | |
| Hydropower (trillion kWh) | 1.23 | 1.428 | 1.71 | 1.71 | |
| Nuclear power (trillion kWh) | 0.29 | 0.377 | 0.78 | 1.5 | |
| Gas power generation (trillion kWh) | 0.22 | 0.275 | 0.749 | 1.04 | |
| Wind power (trillion kWh) | 0.37 | 0.581 | 0.86 | 2.589 | |
| Solar power (trillion kWh) | 0.18 | 0.166 | 0.86 | 3.256 | |
| Biomass power (trillion kWh) | 0.0906 | 0.068 | 0.191 | 0.647 | |
| Other thermal power (trillion kWh) | 0.16 | - | - | - | |
| Total (trillion kWh) | 6.994 | 7.401 | 8.939 | 12.332 | |
References
- Xu, X.P. Spring of new energy automobile industry. Ecol. Econ. 2014, 30, 10–13. [Google Scholar] [CrossRef]
- Lin, Z.F. Why does China attach so much importance to the development of new energy automobile industry? Econ. Obs. Available online: https://www.d1ev.com/news/shichang/65018 (accessed on 19 March 2018).
- Turk, D. Global Electric Vehicle Vision 2018; International Energy Agency: Paris, France, 2018. [Google Scholar]
- Palencia, J.C.G.; Otsuka, Y.; Araki, M.; Shiga, S. Scenario analysis of lightweight and electric-drive vehicle market penetration in the long-term and impact on the light-duty vehicle fleet. Appl. Energy 2017, 204, 1444–1462. [Google Scholar] [CrossRef]
- Zhou, B.Y. Research on Energy Consumption, Carbon Emission and Cost Benefit of Electric Vehicle Life Cycle; Tsinghua University: Beijing, China, 2016. [Google Scholar]
- Shen, W.; Zhang, A.L.; Han, W.J. Comparative study on energy consumption and greenhouse gas emission of alternative fuels for vehicles. Nat. Gas Ind. 2006, 11, 148–152. [Google Scholar]
- Shen, W.; Zhang, A.L.; Han, W.J. Comparative analysis of vehicle synthetic fuel energy consumption and greenhouse gas emission. J. Tsinghua Univ. 2007, 3, 441–444. [Google Scholar]
- Ou, X.M.; Zhang, X.L.; Qin, Y.N.; Qi, T.Y. Life cycle analysis of future coal-driven electric vehicles. J. Coal 2010, 35, 169–172. [Google Scholar]
- Ou, X.; Yan, X.; Zhang, X. Using coal for transportation in China: Life cycle GHG of coal-based fuel and electric vehicle, and policy implications. Int. J. Greenh. Gas Control. 2010, 4, 878–887. [Google Scholar] [CrossRef]
- Shi, X.; Wang, X.; Yang, J.; Sun, Z. Electric vehicle transformation in Beijing and the comparative eco-environmental impacts: A case study of electric and gasoline powered taxis. J. Clean. Prod. 2016, 137, 449–460. [Google Scholar] [CrossRef]
- Shi, X.Q.; Sun, Z.X.; Li, X.N.; Li, J.Y.; Yang, J.X. Comparative study on the environmental impact of life cycle of electric taxi and fuel taxi in Beijing. Environ. Sci. 2015, 3, 1105–1116. [Google Scholar]
- Song, Y.H.; Li, B.W.; Hu, Z.C. Analysis of carbon emission regional characteristics of electric vehicles in China. China Energy 2013, 35, 12–16. [Google Scholar]
- Zhang, L.; Liu, Z.F.; Wang, J.J. Comparative analysis of life cycle environmental impact of electric and internal combustion engine vehicles. J. Environ. Sci. 2013, 3, 931–940. [Google Scholar]
- Feng, C.; Wang, K.; Xu, Z.Q.; Gong, P.Q. Research on greenhouse gas emission of private electric vehicles based on hybrid life cycle method. Chin. Popul. Resour. Environ. 2017, 27, 178–187. [Google Scholar]
- Ellingsen, L.A.W.; Singh, B.; Strømman, A.H. The size and range effect: Lifecycle greenhouse gas emissions of electric vehicles. Environ. Res. Lett. 2016, 11, 54010. [Google Scholar] [CrossRef]
- Ellingsen, L.W.A. Life cycle assessment. In Proceedings of the 12th Concawe Symposium, Antwerp, Belgium, 20–21 March 2017. [Google Scholar]
- Lu, J.F. Many countries announce that they will ban the sale of fuel cars in the future. Ecol. Econ. 2017, 57–63. [Google Scholar]
- Du, G.; Cao, W.; Hu, S.; Lin, Z.Y.; Yang, J.; Yuan, T.J. Assessment of an Electric Vehicle Powertrain Model Based on Real-World Driving and Charging Cycles. IEEE Trans. Veh. Technol. 2018, 11–17. [Google Scholar] [CrossRef]
- Pazheri, F.R.; Othman, M.F.; Malik, N.H.; Khan, Y. Emission constrained economic dispatch for hybrid energy system in the presence of distributed generation and energy storage. J. Renew. Sustain. Energy 2015, 7, 013125. [Google Scholar] [CrossRef]
- Modaresi, R.; Pauliuk, S.; Løvik, A.N.; Muller, D.B. Global Carbon Benefits of Material Substitution in Passenger Cars until 2050 and the Impact on the Steel and Aluminum Industries. Environ. Sci. Technol. 2014, 48, 10776–10784. [Google Scholar] [CrossRef] [PubMed]
- Kim, H.C.; Wallington, T.J. Life-cycle Energy and Greenhouse Gas Emission Benefits of lightweighing in Automobiles: Review and Harmonization. J. Environ. Sci. Technol. 2013, 47, 6089–6097. [Google Scholar] [CrossRef]
- Wang, C.B.; Zahng, X.; Pang, M.Y. Review of life cycle evaluation methods—Development and application of hybrid life cycle evaluation. J. Nat. Resour. 2015, 30, 1232–1242. [Google Scholar]
- Li, X.H.; Ji, J.P.; Ma, X.M.; Wang, J.T. Research on greenhouse gas emission of fuel ethanol life cycle based on EIO-LCA. J. Peking Univ. 2011, 47, 1081–1088. [Google Scholar]
- Joshi, S. Product Environmental Life-Cycle Assessment Using Input-Output Techniques. J. Ind. Ecol. 1999, 3, 95–120. [Google Scholar] [CrossRef]
- Suh, S.; Lenzen, M.; Treloar, G.J.; Hiroki, H. The System Boundary Selection in Life—Cycle Inventories Using Hybrid Approaches. J. Environ. Sci. Technol. 2004, 38, 657–664. [Google Scholar] [CrossRef] [PubMed]
- De Souza, L.L.P.; Lora, E.E.S.; Palacio, J.C.E.; Rocha, M.H.; Renó, M.L.G.; Venturini, O.J. Comparative environmental life cycle assessment of conventional vehicles with different fuel options, Plug-in hybrid and electric vehicles for a sustainable transportation system in Brazil. J. Clean. Prod. 2018, 203, 444–468. [Google Scholar] [CrossRef]
- IPCC. Climate Change 2013: The Physical Science Basis, Contribution to the Fifth Assessment Report of the Intergovernmental Panel on Climate Change; Cambridge University: London, UK, 2013. [Google Scholar]
- Van Sark, W.G.; Schepers, J.G.; van Wees, J.D.A. The Growing Role of Photovoltaic Solar, Wind and Geothermal Energy as Renewables for Electricity Generation. Sustainability Assessment of Renewables-Based Products; John Wiley & Sons, Ltd.: Hoboken, NJ, USA, 2015. [Google Scholar]
- IPCC. 2006 IPCC Guidelines for National Greenhouse Gas Inventories; Institute of Global Environmental Strategy: Kanagawa, Japan, 2006. [Google Scholar]
- National Development and Reform Commission. Provincial GHG Inventory Preparation Guide; National Development and Reform Commission: Beijing, China, 2011. [Google Scholar]
- National Bureau of Statistic. China Statistical Yearbook 2018. Available online: http://www.stats.gov.cn/tjsj/ndsj/ (accessed on 30 December 2018).
- Zhang, L.; Liu, Z.F.; Wang, J.J. Comparative analysis of the environmental impact of the power system life cycle of electric and fuel vehicles. J. Environ. Sci. 2013, 17, 53–64. [Google Scholar]
- China National Coal Association. The Research Report of China Coal Industry Development in 2014; China Economic Publishing House: Beijing, China, 2014. [Google Scholar]
- Ministry of Transport of the People’s Republic of China. China Transport Statistical Yearbook 2015; China Communications Press: Beijing, China, 2015.
- National Bureau of Statistics of China. China Energy Statistical Yearbook 2015; China Statistics Press: Beijing, China, 2016.
- China Chemical Energy Saving Technology Association. China Petroleum and Chemical Industry Energy Conservation Report 2014; Chemical Industry Press: Beijing, China, 2015. [Google Scholar]
- CNPC Economics and Technology Research Institute. Domestic and Foreign Oil and Gas Industry Development Report 2014; Petroleum Industry Press: Beijing, China, 2015. [Google Scholar]
- Shen, W.; Han, W.; Chock, D.; Chai, Q.; Zhang, A. Well—To-wheels life-cycle analysis of alternative fuels and vehicle technologies in China. Energy Policy 2012, 49, 296–307. [Google Scholar] [CrossRef]
- Pacific Auto Network. Available online: https://www.pcauto.com.cn/ (accessed on 10 May 2019).
- National Energy Administration of China. Introduction to the Operation of Renewable Energy Grid-Connected in 2018; National Energy Administration Official Website. Available online: http://www.nea.gov.cn/ (accessed on 14 February 2018).
- China Electricity Council. National Electric Power Process Statistics Express List; China Electricity Council Press: Beijing, China, 2018. [Google Scholar]
- National Bureau of Statistic. National People’s Republic of China 2018 National Economic and Social Development Gazette; China Statistics Press: Beijing, China, 2018.
- Gao, Y.B.; Mao, X.Q.; Yang, S.Q. Analysis and evaluation of energy-saving and emission reduction effects of new-energy cars based on LCA. J. Environ. Sci. 2013, 33, 1504–1512. [Google Scholar]
- Maj, G. Diversification and environmental impact assessment of plant biomass energy use. Pol. J. Environ. Stud. 2015, 24, 2055–2061. [Google Scholar] [CrossRef]
- Cholewiński, M. The reduction of atmospheric emissions after the implementation of first Polish nuclear power plant//European Physical Journal Web of Conferences. Eur. Phys. J. Web Conf. 2018, 177, 01001. [Google Scholar] [CrossRef][Green Version]
- Jasiulewicz, M.; Jordan, A. Possibility of liquid bio-fuels, electric and heat energy production from biomass in Polish agriculture. Pol. J. Environ. Stud. 2010, 19, 479–483. [Google Scholar]
- Brodzinski, Z.; Kryszk, H.; Kurowska, K. Market of Producers and Processors of Agricultural Biomass for Energy Purposes. Pol. J. Environ. Stud. 2014, 23, 619–627. [Google Scholar]
- Gumula, S.; Pytel, K.; Piaskowska-Silarska, M. Environmental and Economic Benefits of Using Kinetic Wind Energy to Generate Electricity. Pol. J. Environ. Stud. 2014, 23, 2315–2320. [Google Scholar]
- Daniel, S.; Piwowarski, M. Analyzing Selection of Low-Temperature Medium for Cogeneration Micro Power Plant. Pol. J. Environ. Stud. 2014, 23, 1417–1421. [Google Scholar]
- Liu, Q.; Miao, Q.; Liu, J.J.; Yang, W. Solar and wind energy resources and prediction. J. Renew. Sustain. Energy 2009, 1, 043105. [Google Scholar] [CrossRef]


| Classification | The Vehicle Weight (kg) | Battery Capacity (kWh) | Range (km) | Energy Consumption per 100 km (kWh/100 km) |
|---|---|---|---|---|
| Segment A—mini car | 1100 | 17.7 | 151 | 11.67 |
| Segment C—small car | 1500 | 24.4 | 177 | 13.71 |
| Segment D—compact car | 1750 | 42.1 | 281 | 14.98 |
| Segment F—medium and large car | 2100 | 59.9 | 357 | 16.77 |
| Data Name | Source |
|---|---|
| Green House Gas (GHG) emission factor | IPCC [29], Guidelines for Compiling Provincial GHG Inventory [30] |
| Total energy consumption coefficient | China statistical yearbook 2018 [31] |
| Automobile production process data | Comparative analysis of dynamic system life cycle environmental impact of electric and fuel vehicles [32] |
| Fuel upstream raw material mining, fuel processing, transportation | Statistical data, professional internal reports, literature and expert consultation of national bureau of statistics, transportation, coal, petroleum and petrochemical, electric power and other departments [33,34,35,36,37,38] |
| Data related to the driving process of the car | Pacific automotive network [39] |
| Year | 2020 | 2030 | 2050 | |||||||
|---|---|---|---|---|---|---|---|---|---|---|
| Phase | PP (%) | UP (%) | EOLP (%) | PP (%) | UP (%) | EOLP (%) | PP (%) | UP (%) | EOLP (%) | |
| Vehicle Type | ||||||||||
| A segment EV | 7.95 | 92.05 | 0.62 | 3.92 | 96.08 | 0.39 | 2.98 | 97.02 | 1.19 | |
| C segment EV | 9.20 | 90.80 | 0.66 | 6.02 | 93.98 | 0.96 | 4.18 | 95.82 | 1.39 | |
| D segment EV | 10.94 | 89.06 | 0.69 | 6.75 | 93.25 | 0.79 | 5.99 | 94.01 | 1.30 | |
| F segment EV | 11.63 | 88.37 | 0.78 | 7.38 | 92.62 | 0.63 | 6.54 | 93.46 | 1.64 | |
| A segment ICEV | 3.19 | 96.81 | 0.54 | 3.19 | 96.81 | 0.54 | 3.19 | 96.81 | 0.54 | |
| C segment ICEV | 5.02 | 94.98 | 0.60 | 5.02 | 94.98 | 0.60 | 5.02 | 94.98 | 0.60 | |
| D segment ICEV | 7.57 | 92.43 | 0.66 | 7.57 | 92.43 | 0.66 | 7.57 | 92.43 | 0.66 | |
| F segment ICEV | 8.94 | 91.06 | 0.72 | 8.94 | 91.06 | 0.72 | 8.94 | 91.06 | 0.72 | |
© 2019 by the authors. Licensee MDPI, Basel, Switzerland. This article is an open access article distributed under the terms and conditions of the Creative Commons Attribution (CC BY) license (http://creativecommons.org/licenses/by/4.0/).
Share and Cite
Li, Y.; Ha, N.; Li, T. Research on Carbon Emissions of Electric Vehicles throughout the Life Cycle Assessment Taking into Vehicle Weight and Grid Mix Composition. Energies 2019, 12, 3612. https://doi.org/10.3390/en12193612
Li Y, Ha N, Li T. Research on Carbon Emissions of Electric Vehicles throughout the Life Cycle Assessment Taking into Vehicle Weight and Grid Mix Composition. Energies. 2019; 12(19):3612. https://doi.org/10.3390/en12193612
Chicago/Turabian StyleLi, Yanmei, Ningning Ha, and Tingting Li. 2019. "Research on Carbon Emissions of Electric Vehicles throughout the Life Cycle Assessment Taking into Vehicle Weight and Grid Mix Composition" Energies 12, no. 19: 3612. https://doi.org/10.3390/en12193612
APA StyleLi, Y., Ha, N., & Li, T. (2019). Research on Carbon Emissions of Electric Vehicles throughout the Life Cycle Assessment Taking into Vehicle Weight and Grid Mix Composition. Energies, 12(19), 3612. https://doi.org/10.3390/en12193612