Article

Minimizing the Impact of Intermittent Wind Power on Multiperiod Power System Operation with Pumped Hydro Generation

1
Department of Electrical Engineering, Faculty of Engineering and the Built Environment, Tshwane University of Technology, Pretoria 0001, South Africa
2
ESIEE Paris, 2 Boulevard Blaise Pascal, Cité Descartes, BP 99, 93162 Noisy-le-Grand CEDEX, France
*
Author to whom correspondence should be addressed.
Energies 2019, 12(18), 3583; https://doi.org/10.3390/en12183583
Submission received: 6 August 2019 / Revised: 29 August 2019 / Accepted: 31 August 2019 / Published: 19 September 2019
(This article belongs to the Section F: Electrical Engineering)

Abstract

:
In power system operations, unforeseen energy imbalances commonly occur, resulting in unexpected constraints on the system. This leads to a disturbance in normal operation. In systems with integration of large intermittent wind power resources, additional complications are imposed on the system, especially under heavy winds that require immediate measures to minimize possible impact of abrupt wind power fallout. Effective power system fortifications have to be put in place to address the challenges. Wind varies more on the sub-hourly time scales; therefore, sub-hourly dispatch is bound to address more of these issues than commonly used hourly methods. Hybrid power system operation with wind necessitates the use of fast start-up generation and storage to improve quality of power. In this work, the impact of intermittent wind power curtailment on power system operation is addressed to prevent system instability. A modified wind turbine power curve is used to restrict the onset of the normal cut-off point, thereby allowing sufficient time for effective power switchover with pumped hydro generation. This improves the voltage stability of the power system during curtailment. Singular value decomposition matrix of the power system network is employed to evaluate the performance of the proposed method.

Graphical Abstract

1. Introduction

In conventional power system operation, power dispatch is implemented using the hour-ahead methods to take advanced decisions on available resources. A power operation taking into consideration sub-hourly variations in renewable power resources may perform better, in terms of reducing stress on the system, early problem detection, and maximizing power security. It is, therefore, necessary to use short-term power dispatch with lead time in minutes incorporated into the normal hourly methods to effectively manage intermittence from wind resources during hybrid power system operation. The power system, therefore, runs more effectively on a multiple period platform to adequately accommodate both fast and slow generations.
In recent times, the US government requires power system operators to use sub-hourly scheduling for all power operations, and intermittent power generation vendors are required to provide sub-hourly generation data. Some system operators have already considered or are in the process of considering ten minutes interval in their operations [1]. It is therefore necessary to develop more effective power dispatch methods based on the sub-hourly framework. Techniques employed based only on the single hourly methods may not perform effectively as those incorporating the sub-hourly [2]. Sub-hourly dispatch may not necessarily be more cost-effective, but has the tendency to improve power system quality and reliability.
On the normal hourly power system dispatch operations, generators are dispatched on hourly basis, within-hour disturbances are catered for by means of power reserves only. Therefore, in a combined power system operation with wind, excessive power reserves above normal requirements for conventional thermal generations are required to handle within-hour intermittence that may occur due to wind stochastic characteristics. Therefore, this type of dispatch operation imposes heavy financial burden on the power system due to the excessive power reserve requirements.
In this paper, a power dispatch method is proposed based on the sub-hourly framework to address within-hour disturbances that could occur in hybrid power system operation with large wind power resources. The intermittence needs to be handled promptly to minimize the impact on the power system. The proposed method is therefore a preventive measure against power system instability in a hybrid operation with wind generation.
This paper proposes a model to address wind power intermittence using the extended wind turbine curve to switchover between wind generation and Pumped Hydro Generation (PHG) on a power system operation incorporating sub-hourly dispatch.
During normal power system operation, the wind speed can exceed the maximum set limit (cut-off point) of the turbine resulting in abrupt power fallout from the power system. The wind power withdrawal procedure has to properly replace the outgoing wind generation with the incoming PHG within the shortest possible time to avoid system overloading. It also minimizes the excessive power reserves that would have been required to accommodate unforeseen wind generation fallout on the normal hourly dispatch and improves wind power harvest due to the wind turbine curve modifications.
PHG has gained a lot of acceptance in power system operation, as the turbines are mostly operated in reversible modes, for effective energy storage and power generation. It offers supports for load balancing and stability of a power system operation, with the capability for quick response to demand compared to thermal generation. PHG also has high round trip efficiency: 80%.
The use of a storage system as a support has become necessary during power system operation with integration of intermittent renewable energy, as presented in works by the authors of [3,4]. In hybrid power system operation with intermittent resources, optimal sizing of storage systems is also necessary as given in works by the authors of [5,6], by properly taking into consideration the energy requirement strategy for the system to match generations with the loads.
Hybrid power system operation with intermittent resources like photovoltaic (PV) and wind, along with conventional fossil fuel-based generation and PHG, is regarded as the most environmentally friendly compared to other hybrid systems as presented in the work by the authors of [7]. A method has been proposed in the work by the authors of [8] on a wind–storage hybrid system to deal with wind power intermittence. Similar works on minimizing wind power intermittence by storing the energy using heat transfer fluid (HTF) were proposed by the authors of [9,10]. In these techniques, the stored wind energy on the HTF was used to generate intermittent-free power by means of steam turbine generators. Also, in the work by the authors of [11], a method based on wind–thermal–storage system was developed using chance-constrained dispatch model to address this issue. Power system networks are, in general, vulnerable to failure and attack. This issue was addressed in the work by the authors of [12] using fractional percolation. Therefore, incorporating phase warnings in power systems operation aid in timely dealing with system failures in a related way to the sub-hourly method proposed in this work.
In the proposed method, a modified wind turbine power curve is used to postpone the onset of the cut-off point during high wind speeds, so as to effectively switchover power between the wind generation and the PHG when curtailment is inevitable. This minimizes the impact of sudden wind power withdrawal on the power system, which may lead to system disturbances outside acceptable stability limits if not properly dealt with.
This paper proposes a novel concept to address wind power intermittence using the extended wind turbine curve to switchover power between wind generation and the PHG on a power system operation incorporating sub-hourly dispatch. The dispatch optimization problem and its associated constraints on all the generating systems are discussed. Section 2 considers the general aspects of the economic power dispatch operations with intermittent wind generation and storage. Section 3 presents the formulation of the economic power dispatch. Section 4 further describes power operation with both wind generation and storage during high wind curtailment. Section 5 presents the operational sequence of the system under high wind speed, while Section 6 discusses the simulations and the results. Section 7 highlights the conclusions on the results.

2. Economic Power Dispatch with Wind Generation

Wind power has recently attracted more attention worldwide compared to other renewable sources. This is mainly associated with the change in government policies towards keying into the campaign for a reduction in global warming or due to the relative advancement of technology. This power resource is, however, highly variable, intermittent, and requires special attention in its integration and power system operation.
Economic power dispatch may generally be categorized into two types [13]: long-term economic dispatch (ED) and short-term ED. In long-term ED, formulation of the objective functions incorporates costs, risks, types of wind farm, and ecological costs or some combinations; while, on the short-term ED, the objective functions consist of energy use, system security, storage, and spinning reserve or some combination of these factors. Short-term ED is employed in this work.
Recently, in the work by the authors of [14], a model for a stochastic optimization for sub-hourly economic power operation with wind generation was developed using two-stage stochastic decomposition (2-SD). The evaluations were conducted on the modified IEEE-RTS96 and Illinois systems. The capability of the 2-SD framework to handle multiple period operations was tested. In the paper, the power dispatch was carried out on both hourly and sub-hourly generation resources. The results show that some significant improvements can be achieved by incorporating the sub-hourly dispatch in the power system operation.

3. Economic Power Dispatch Formulation

In this section, equations defining various normal operations on the conventional thermal and wind generations are created. The objective functions are formulated for the power system operation, and the incremental cost function is presented. The PHG is then included and the overall system analyzed.

3.1. Conventional Thermal Generation

The analysis starts with the conventional thermal power generation and later integrated with other methods. The total power and cost contribution of each unit to the power system operation are presented.
In running the power system operation with thermal generation, the cost minimization is realized as modified from equations presented in works by the authors of [15,16] as follows,
Minimize , C = t = 1 N i = 1 K C i P i , t
where,
C = Total cost of generation for thermal generators over a given horizon.
N = Number of operating periods.
K = Number of thermal generator units.
C i P i , t = Generation cost function of thermal unit i at time t.
P i , t = Power output of thermal generator unit i at time t.
The generation cost for a thermal unit is usually approximated by a quadratic function of power output, given by the authors of [17], as follows.
C i P i , t = a i P i , t 2 2 + b i P i , t + c ; i = 1 , 2 , 3 , , K
The power generation constraints in this case are given as follows,
  • Load constraint:
    i = 1 K P i , t P d , t + P L , t = 0 ; i = 1 , 2 , 3 , , K
  • Thermal generation power output constraint:
    P i m i n P i , t P i m a x ; i = 1 , 2 , 3 , , K
where,
a = Generator efficiency dependent cost factor (performance-dependent).
b = Cost factor proportional to the generator power production (fuel consumption-dependent).
c = Fixed generator operating cost factor relating to capital investment (independent of power production).
P d , t = Power demand at time t.
P i m i n = Thermal generator minimum power output.
P i m a x = Thermal generator maximum power output.
The cost of fuel for every increment in energy output by the thermal generator is accounted for using the Incremental Cost of Fuel (ICF). This gives the cost of energy input increment. Hence, the total cost of the increment in energy is achieved by multiplying ICF with increment in energy output of the generators (kWh). ICF is realized using the cost function from Equation (2). It is given (using linear approximation) as in the work by the authors of [18], thus
( I C F ) i = d C i ( P i , t ) d P i , t = a i P i , t + b i ; i = 1 , 2 , 3 , , K
In this context, ICF is the cost of change in fuel energy input with respect to change in energy output (kWh) by the thermal generators.
Using the load balance equation and the cost of generation in Equation (2), a Lagrangian multiplier ( λ ) is introduced and applying the optimal condition of operation, the ICF for every generator unit (transmission losses excluded) are constrained to be the same as follows,
C 1 ( P 1 ) P 1 = C 2 ( P 2 ) P 2 = = C K ( P K ) P K = λ
Each of the derivatives in Equation (6) indicates a separate incremental generation cost for every unit. Therefore, constraining generators to run with same incremental cost results in optimally low operating cost, as shown in Equation (6).
Inserting, λ in Equation (5) for any generating unit, yields
I C F = a i P i , t + b i = λ
and,
P i , t = λ b i a i
If the power output constraint given in Equation (4) is violated by any generating unit in the course of operation, the power output of the respective unit is set accordingly as follows,
C i ( P i , t ) P i , t = λ ; set output of the unit to within power limits λ ; set output of the unit to P i m a x λ ; set output of the unit to P i m i n
The remaining generators now have to share the the load demand balance on the basis of equal ICF.

3.2. Constraints on Power System with Integration of Wind and Pumped Hydro Generations

This section introduces additional constraints of the thermal, wind generations and PHG.
In the Dynamic Economic Dispatch (DED) power operation schemes, the following constraints are usually considered [15].
  • The power balance constraint; this is the capacity of the power generations to satisfy demand. It is given as follows.
    i = 1 K P i , t + j = 1 M P w j , t + δ = 1 Y P d i s δ , t P d , t + P L , t = 0 ; i j
    The equation indicates that the sum of power output from generating units (thermal, wind and PHG) running at a given time, equals the sum of load demand and the transmission losses.
  • Constraints on power generations; thermal, wind, and PHG are given as follows,
    • Thermal generator output power constraints:
      P i , t = 0 ; if unit is OFF P i m i n P i , t P i m a x ; if unit is running
    • Wind generator output power constraints:
      P w j , t = 0 ; if unit is OFF P w j m i n P w j , t P w j m a x ; if unit is running
      where,
      P w j , t = Wind generation by unit i at time t
      P w j m i n = Wind generator output power at cut-in speed
      P w j m a x = Wind generator output power at rated speed
    • The PHG power output constraint has two parts:
      Power generation constraint:
      P d i s δ , t = 0 ; if PHG is not discharging power P d i s δ m i n P d i s δ , t P d i s δ m a x ; if PHG is discharging power
      Water pumping power consumption constraint:
      P p p δ , t = 0 ; if PHG pump is not running P p p δ m i n P p p δ , t P p p δ m a x ; if PHG pump is running
      where,
      P d i s δ , t = Pumped hydro generator, δ , output power generation at time t
      P p p δ , t = Pumped hydro generator, δ , pumping power consumption at time t
      P d i s δ m i n = Pumped hydro generator, δ , minimum output power generation
      P d i s δ m a x = Pumped hydro generator, δ , maximum output power generation
      P p p δ m i n = Pumped hydro generator, δ , minimum pumping power consumption
      P p p δ m a x = Pumped hydro generator, δ , maximum pumping power consumption
  • Ramp rate constraint for all the thermal generators:
    This is the restriction on the output power of thermal generators online to dispatch power between two limits in response to changing load demand on the power system.
    The dispatch output is tuned accordingly as follows,
    R i , L N ( P i , t P i , t 1 ) R i , u N ; i = 1 , 2 , 3 , , K
    where,
    P i , t 1 = Power output of thermal generator, i, at previous time slot, ( t 1 )
    R i , L = Lower ramp rate limit of thermal generator, i
    R i , u = Upper ramp rate limit of thermal generator, i
    N = Period of operation
  • Spinning reserve power constraints:
    The spinning reserve is the total power output of the synchronized generators online when load and losses are removed. The generation surplus power capacity at this time is referred to as the spinning reserve. It is used to support power deficiency due to changing demand or generator failures or variation in wind generation.
    The spinning reserve requirement is computed based on certain factors, which are either based on the generator with the highest capacity on the power system or using some ratios of total operating capacity as security, such that failure of any generator (crew member) does not result in system collapse. Having enough spinning reserve is always necessary in handling these unforeseen situations.
    Spinning reserve on a balanced power system operation consisting of thermal generation only is given as follows,
    P r s , t = i = 1 K P i , t P d , t + P L , t
    When wind generation and PHG are included in Equation (16) it is expressed as
    P r s , t = i = 1 K P i , t + j = 1 M P w j , t + δ = 1 Y P d i s δ , t P d , t + P L , t
    where,
    P r s , t = Spinning reserve power at time t
    P L , t = Transmission power losses at time t
    P d , t = Demand power at time t

4. Power System Operation During Wind Curtailments

When wind power curtailment becomes inevitable under high wind speed above cut-off, PHG is used for effective wind generation withdrawal from the power system operation. The power balance equation considering the PHG involvement on the power system operation before and during withdrawal of wind generation is, therefore, considered under two modes (power conservation and generation) given as follows,
  • PHG is pumping water to upper reservoir (conserving energy) and therefore consuming power from the power system, given as follows,
    i = 1 K P i , t + j = 1 M P w j , t δ = 1 Y P p p δ , t = P d , t + P L , t
  • PHG is generating power into the power system, and is given as follows,
    i = 1 K P i , t + j = 1 M P w j , t + δ = 1 Y P d i s δ , t = P d , t + P L , t
The minimized cost for the hybrid thermal and wind generations is given in the work by the authors of [17] as follows,
Minimize , C = i = 1 K C i P i , t + j = 1 M C w j P w j , t + j = 1 M C p , w j P w j , t , a v P w j , t + j = 1 M C r , w j P w j , t P w j , t , a v
Assume the following in Equation (20).
P w j , t , a v P w j , t = a j
P w j , t P w j , t , a v = b j
Therefore, when PHG is included in Equation (20) during power generation, the minimized cost is given as follows,
Minimize , C T = i = 1 K C i P i , t + j = 1 M C w j P w j , t + j = 1 M C p , w j a j + j = 1 M C r , w j b j + δ = 1 Y C d i s δ P d i s δ , t
Recall, the minimized cost of running thermal generation alone on a given horizon from Equation (1); similarly, implementing this on Equation (21) with wind generation and PHG gives the overall total minimized cost of power generation as follows,
Minimize , C T F = t = 1 N i = 1 K C i P i , t + j = 1 M C w j P w j , t + C p , w j a j + C r , w j b j + + t = 1 N δ = 1 Y C d i s δ P d i s δ , t
where,
M = Total number of wind generators
Y = Total number of pumped hydro generators
C = Total cost of running generators without PHG on the optimization horizon
C T = Total cost of running all generators on any period
C T F = Total cost of running all generators on the optimization horizon
P w j , t = Scheduled power from wind generator unit j at time t
P w j , t , a v = Available power from wind generator unit j at time t
C d i s δ P d i s δ = Cost of using power from pumped hydro storage from pump unit, δ
C w j P w j , t = Generation cost of wind generator unit j at time t
C p , w j a j = Penalty cost on wind generator unit j at time t for not using available power
C r , w j b j = Cost of using reserve power relating to over estimation of wind power from unit j at time t

4.1. Operating the Wind Turbine above the Cut-Off Speed

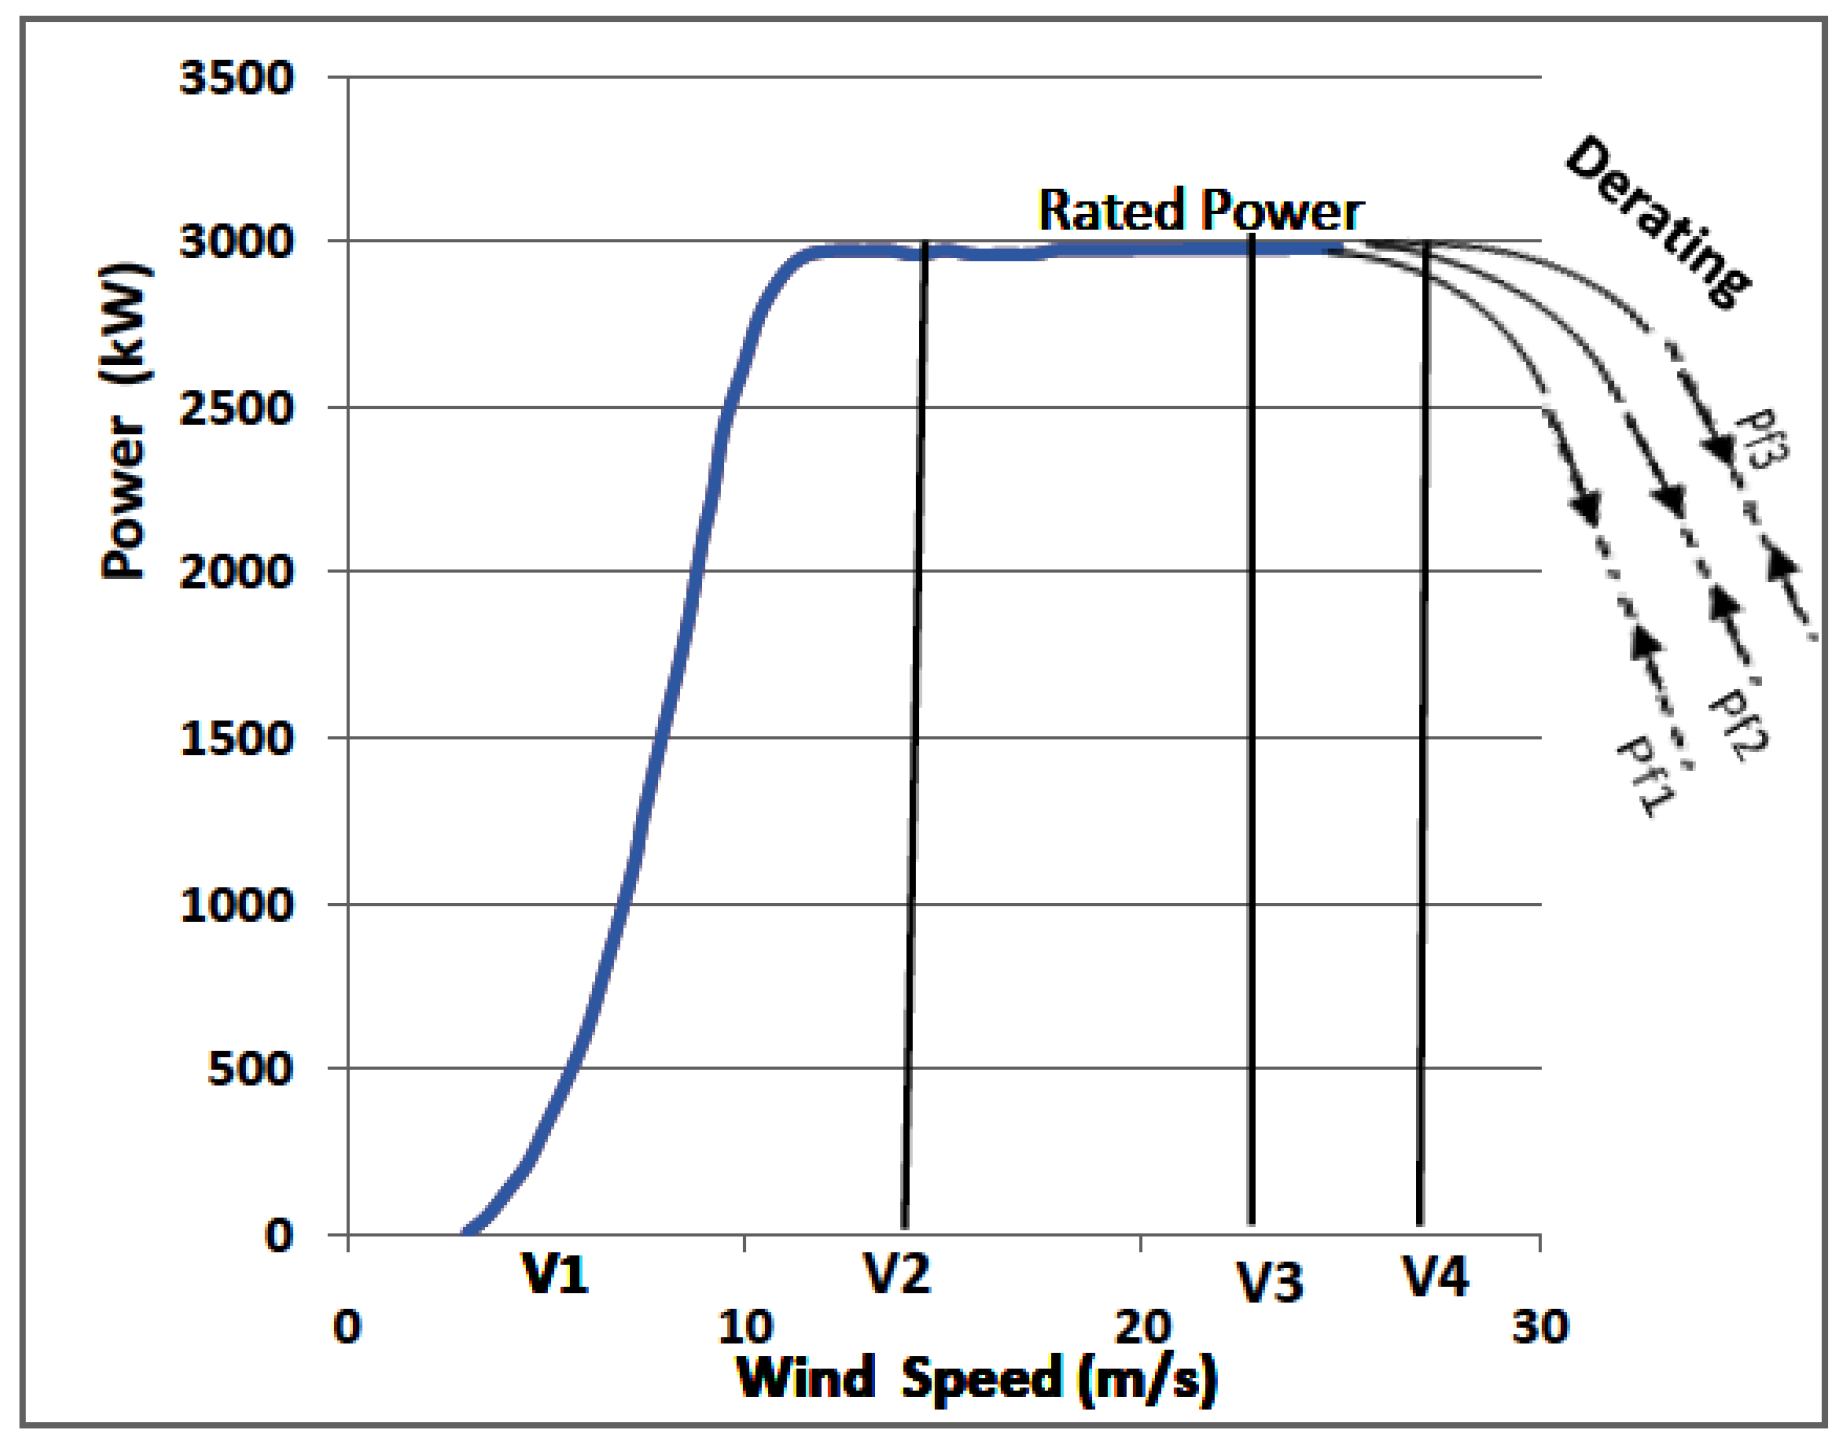
The wind turbine power generation normally operates on four regions as shown on the curve given in Figure 1. These are defined by Equation (23) as modified from the work by the authors of [19] as follows,
P = 0 ; for 0 < V < V c i κ C p ρ A V 3 ; for V ci V V r P r ; for V r V V c o 0 ; for V > V c o
where,
κ = Constant
P = Wind turbine generated power [ kW ]
P r = Wind turbine rated power [ kW ]
V r = Wind turbine rated speed [ ms 1 ]
C p = Maximum power coefficient
ρ = Air density [ kgm 3 ]
A = Turbine blade sweep area [ m 2 ]
V = Wind speed [ ms 1 ]
V c i = Cut-in wind speed [ ms 1 ]
V c o = Cut-off wind speed [ ms 1 ]
On the second region of wind turbine operation, which starts from V 1 / V c i and ends at the rated turbine power ( V 2 / V r ), the output power (P) follows a cubic power of the wind speed ( V 3 ) . From speed V 2 / V r , irrespective of the wind speed change, the rated power is then maintained until the speed reaches cut-off, V 4 / V c o , when the blades are turned away from the wind front and the power generation ceases completely.
The wind turbine needs to be operated above the cut-off speed to avoid the impact of sudden power fallout from wind generation at the rated value ( P r ); when the cut-off speed ( V 4 / V c o ) is attained during high wind speeds, shutdown is required. This, if ignored, may also lead to possible wind turbine migration into a hysteresis loop as shown in Figure 2; when the wind speed briefly returns to a normal rated speed after overshooting the cut-off, possibly several times. Abrupt generation shutdown may also have devastating effects on the stability of the power system and wind turbine. A delay in the cut-off point is achievable by extending the normal cut-off speed limit.
Modification of the blade’s pitch angle and rotor speed controls allows continued operation of the the wind turbine at power levels below the rated power (derating) during high wind speed, thereby maintaining generation at lower output power (ramping down), such that it could safely return to the rated operation at V 3 , when again the wind speed falls (ramping up) below the cut-off speed briefly, as shown in Figure 3. This figure illustrates the curves resulting from the wind turbine system modification of the blade pitch angle and rotor control sections. This results in the wind turbine operating on a power output below the rated value (derating) beyond the preset wind speed limit (V3). The curves designated P f 1 , P f 2 , and P f 3 represent variation of V3 ( V 3 1 , V 3 2 , and V 3 3 , respectively) for different selections on the turbine power curve modification. These curves postpone the onset of cut-off point, thereby allowing sufficient time for start-up of the PHG and completion of power switchover process. This eliminates the intermittence at high wind speeds beyond the cut-off.
Implementing such modification to the turbine control systems, as discussed in works by the authors of [20,21,22], transforms the normal wind turbine power curve in Figure 1 to an extended power curve version beyond the cut-off point, as shown in Figure 3. This ensures safe turbine operation within normal and beyond the cut-off regions and smooth power switchover from the wind power generation to the PHG when curtailment becomes unavoidable beyond certain point.
PHG has the capacity to attain maximum power output within 60 to 90 s of start-up. Therefore, the effective power switchover could take place within the range of the extended wind turbine curve operation on the sub-hourly dispatch power system operation.
In this work, a specific wind turbine is considered: model SL 3000/90, manufactured by Sinovel (China) and installed in a wind farm at Dassiesklip (Western Cape), South Africa. The technical specifications of the turbine are given in Table 1.
Assuming the rising edge of the wind turbine curve from cut-in ( V 1 / V c i ) and the falling edge (beyond V 3 ) follow similar power generation characteristics to those shown in Figure 3, then the modified region of the turbine extended power curve is expressed by Equation (24) as follows,
P f = P r β V V 3 3
Simplifying Equation (24), gives
P f = P r β Δ V ψ 3
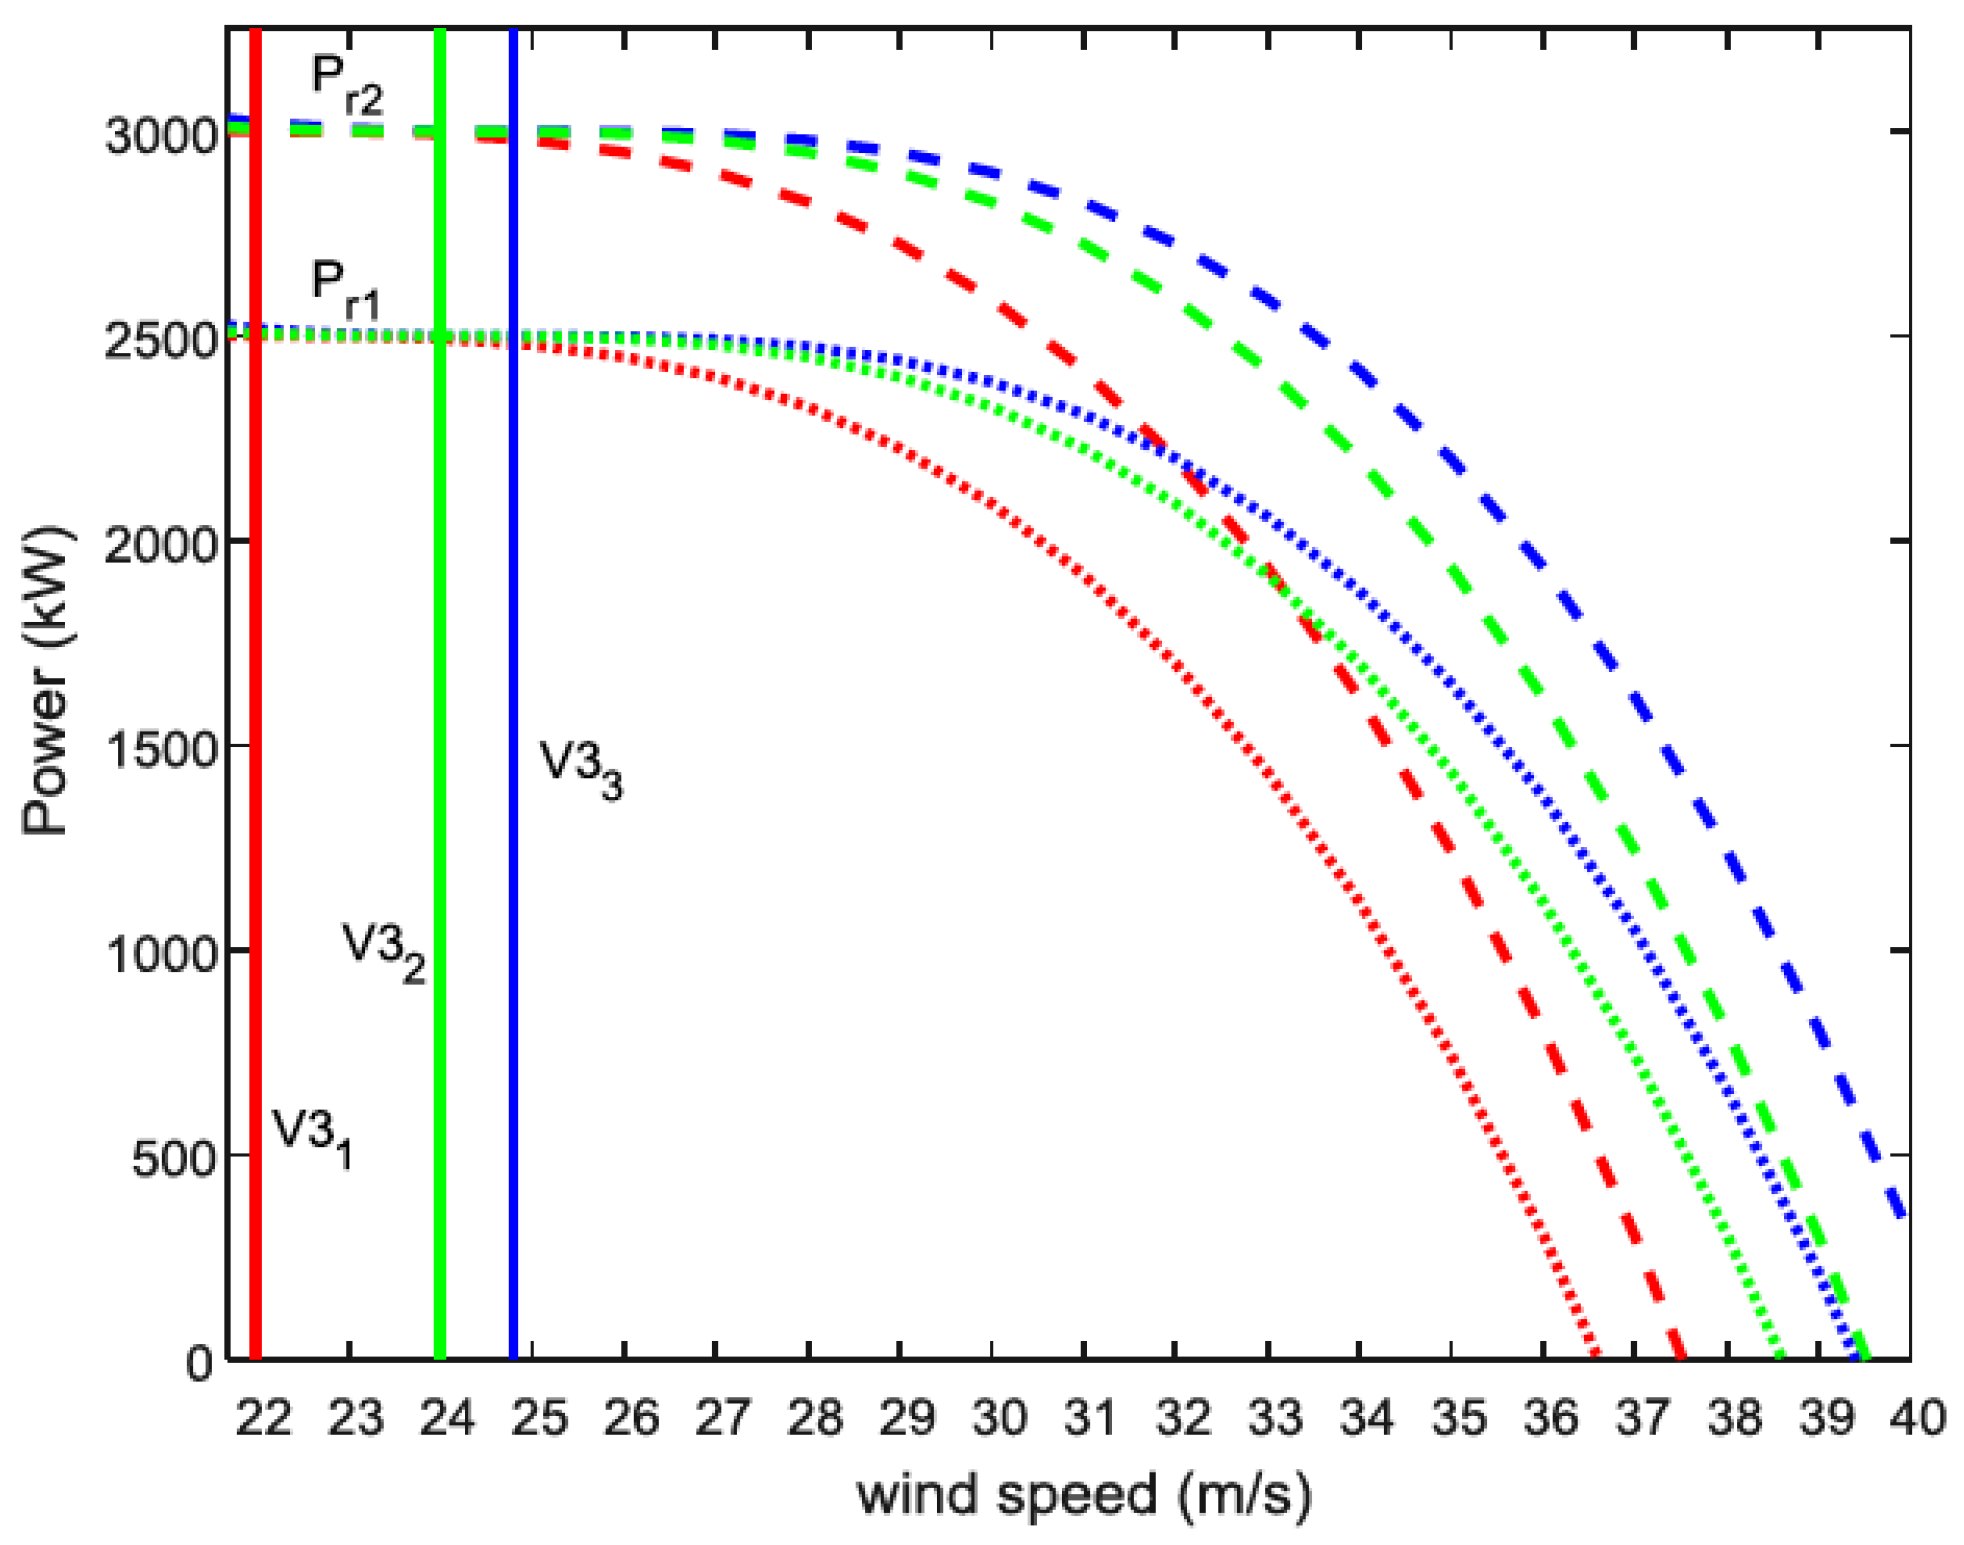
By selecting different power derating starting points ( V 3 ), (i.e., V 3 1 , V 3 2 , V 3 3 , etc.) and also considering wind turbines with different rated power specifications ( P r ), (i.e., P r 1 , P r 2 , etc.), then the derating power curve, P f , changes accordingly as shown in Figure 3 and Figure 4, and expressed in Equations (26)–(28), respectively, as follows,
For wind turbine rated power, P r = P r 1 , with different starting points for V 3 (i.e., V 3 1 , V 3 2 , and V 3 3 ), then the power derating curves, P f , (i.e., P f 1 , P f 2 , and P f 3 ) are expressed respectively as follows,
P f 1 = P r 1 β V V 3 1 3
P f 2 = P r 1 β V V 3 2 3
P f 3 = P r 1 β V V 3 3 3
where,
β = κ C p ρ A
κ = 0.5 E g E b (0.5 = Belz constant, E g = generator efficiency, E b = rotor bearing efficiency)
V 3 1 < V 3 2 < V 3 3 < V c o
P r = Wind turbine rated power [ kW ]
V 3 = Preset power derating starting wind speed [ ms 1 ]
V d r = Maximum preset wind speed on the power derating range [ ms 1 ]
Δ V ψ = Wind speed difference between current speed, V, and V 3 for a wind plant, ψ [ ms 1 ]
P f = Wind power generation beyond cut-off point (derating) [ kW ]
The expanded power derating region is as shown in Figure 4 for two wind turbine models with rated powers P r 1 and P r 2 .
Assume P r 1 = 2500 kW and P r 2 = 3000 kW. ( P r 2 was used in the simulation.)
The power system effective mechanism for power switchover between wind generation and the PHG is based on Δ V ψ . Therefore, the allowable wind turbine power ramping, P f , beyond the cut-off point is a function of rated power, P r , and wind speed, V.
It could be deduced from Figure 3 that appropriate action needs to be taken beyond the wind turbine cut-off point, V 4 / V c o , on the P f region, so that the power switchover to PHG on the power system is effectively accomplished.
On a normal wind turbine curve, the wind power available for harnessing is from the cut-in speed ( V 1 / V c i ) to cut-off speed ( V 4 / V c o ), beyond which the energy is not harnessable because the turbine is turned off. However, on a wind turbine where modification of pitch and rotor controls has been implemented, the turbine continues to run beyond the cut-off point, V c o , up to the preset derating limit, V d r . The limit, V d r , could be flexible depending on the extent of modification imposed on a specific wind turbine.
The wind speed range, ( V d r V c o ), has another flexibility advantage for successful start-up of the PHG and effective switchover of power with the wind generation on the power system, which is due to the delay imposed on the normal wind generation cut-off point during high wind speeds. This also gives the benefit of avoiding the hysteresis mode in the wind turbine operation when the wind speed ramps up and down around the cut-off speed limit and the normal range of operation.

4.2. The Sub-Hourly Power System Operation

The sub-hourly power system operation was formulated using the MATLAB programming along with MATPOWER [23] tool. The MATPOWER tool was used to solve the Optimal Power Flow (OPF) problem using Newton–Raphson (N–R) method in a dynamic system setup. Evaluation of the OPF involves several iterations on the system network parameters to arrive at the final optimal values. The initial angle of the reference bus (slack) is assumed to be zero.
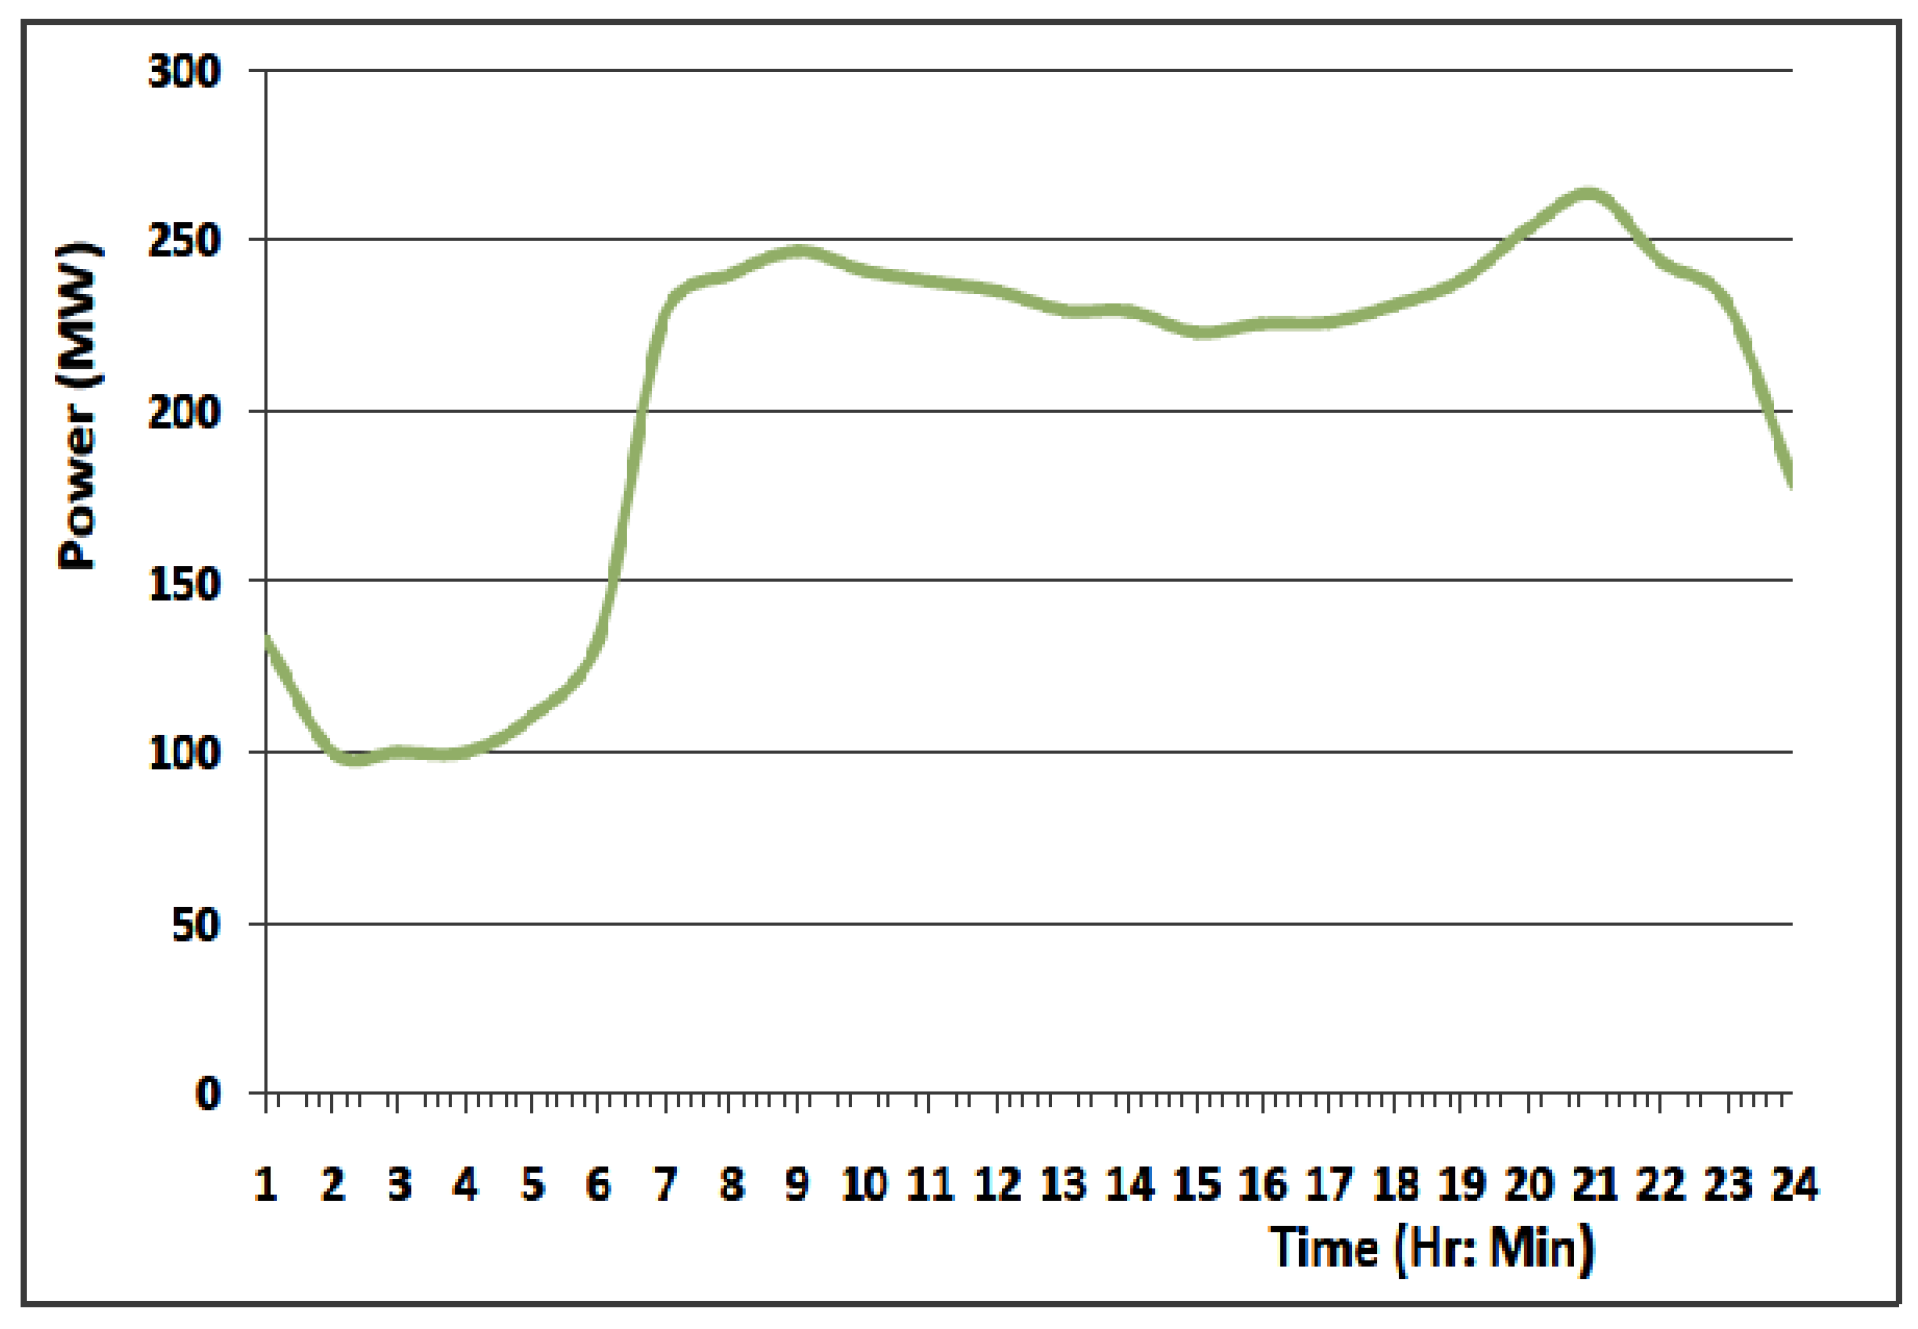
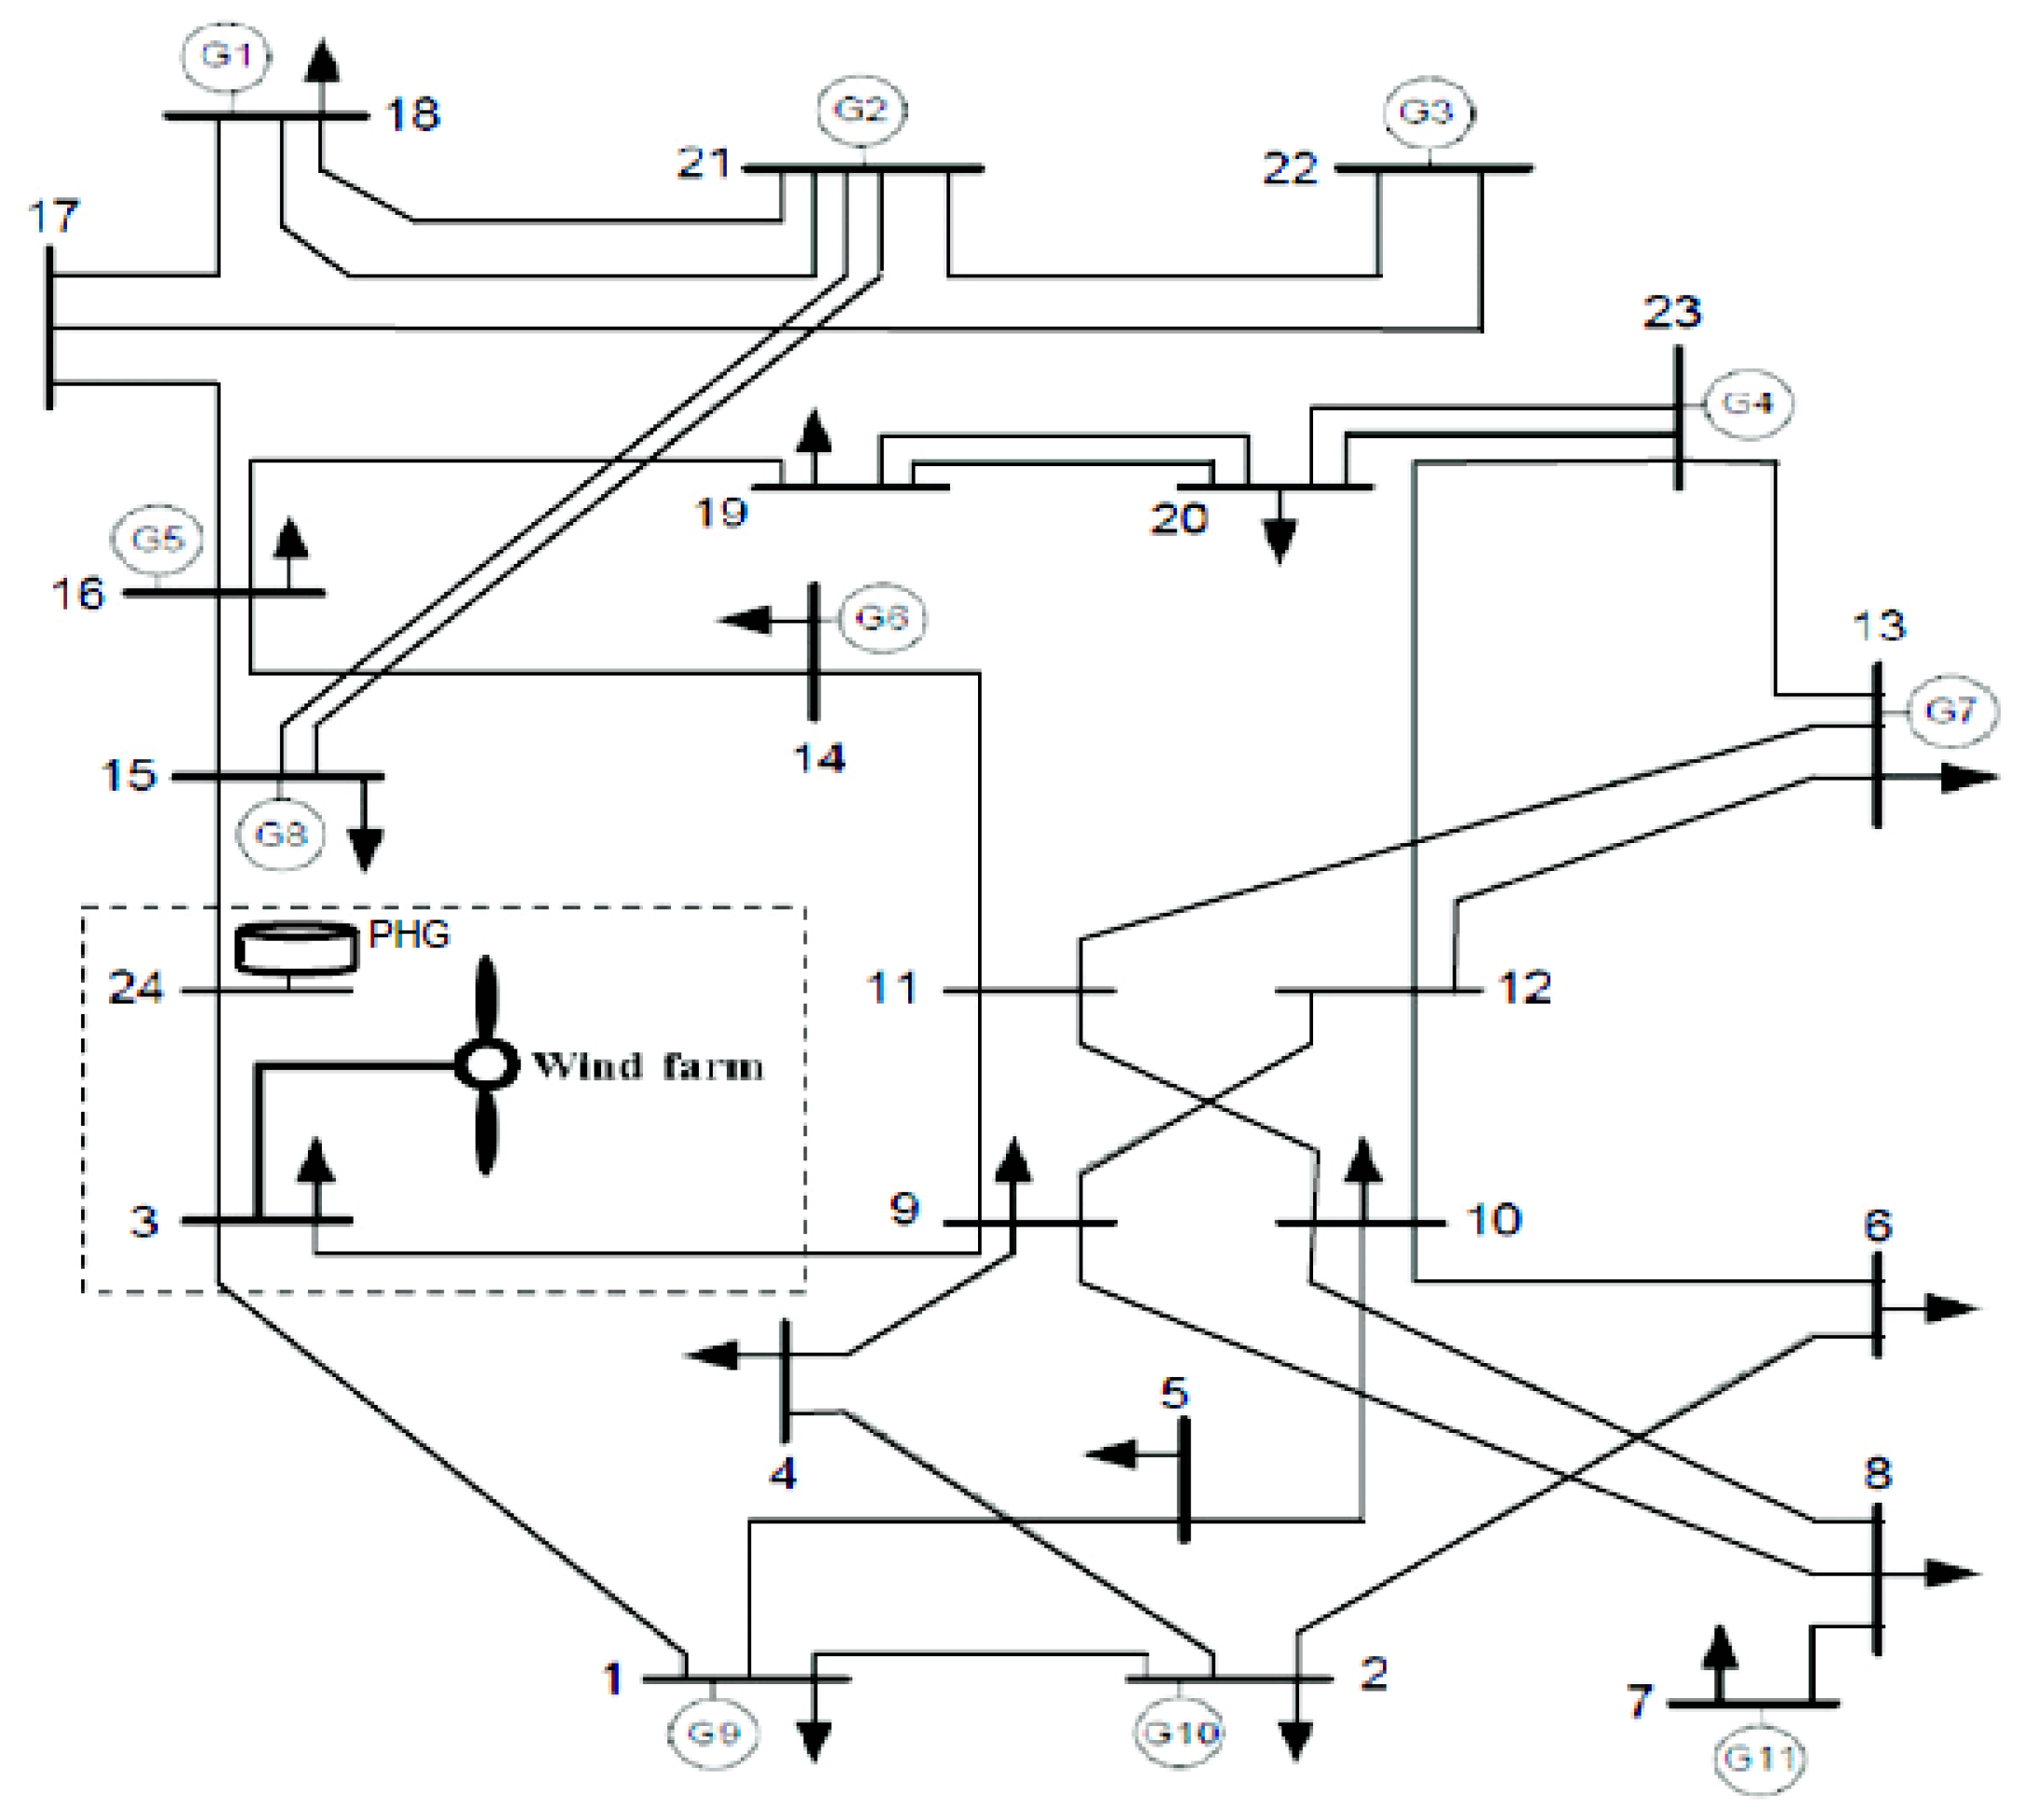
The wind generation and the PHG are added to the base thermal power system operation, and assigned the required specifications and constraints. Consistent internal structure of the MATPOWER is accomplished by using the case struct data conversion. A modified IEEE24-RTS bus system shown in Figure 8 with wind generation as in the work by the authors of [24], and PHG (added on bus 24) was used for running the simulations. The dynamic input data was broken into 144 periods with 10 min intervals on the 24-hour horizon for both the wind and the demand profiles. All the data are assumed to be frozen during the power flow calculations. The PHG is engaged into the power system on the specified range of the extended wind turbine curve ( P f ) during wind power curtailment or during normal power system scheduling.
Typical South African summer time load and wind profiles were used in the analysis. The load profile is shown in Figure 5, and the summer time wind power generation profile (2013) is shown in Figure 6.

4.3. Stability Analysis Using Singular Value Decomposition

A number of methods for power system stability analysis are given in works by the authors of [25,26,27]. However, each method has its strength depending on the specific issue under consideration.
In this work, the impact of the intermittence and the proposed solutions on the power system operation are analyzed using the Singular Value Decomposition (SVD) method on different scenarios. SVD has been used in many research works to analyze power system stability problems, as in the work by the authors of [28].
The equations describing the SVD computation analysis carried out are presented; thus, the difference between the specified real power and the estimated power ( Δ P ) and between the specified reactive power and the estimated value ( Δ Q ) can be expressed as a function of the correction factors in the voltage magnitude ( Δ V ) and voltage angle ( Δ θ ) by making use of the Jacobian matrix ( J ) of the network. The relationships are summarized as given in Equations (29) and (30) as follows,
Δ P Δ Q = J Δ θ Δ V
where,
J is the Jacobian matrix of the system network, given by
J = P θ P V Q θ Q V
Equation (29) is now expressed as
Δ P Δ Q = J P θ J P V J Q θ J Q V Δ θ Δ V
Assuming, the difference between the specified real power and the estimated power, Δ P = 0.
Then, Equation (31) is given as
0 Δ Q = J P θ J P V J Q θ J Q V Δ θ Δ V
Evaluating, Δ Q from Equation (32), gives
Δ Q = J Q V J Q θ J P θ 1 J P V Δ V
Then from Equation (33), the reduced jacobian, J R , is given as
J R = J Q V J Q θ J P θ 1 J P V
therefore,
Δ V = J R 1 Δ Q
When SVD is applied to the reduced Jacobian matrix ( J R ), which is a real square matrix of n × n dimension, it is expressed as
J R = USV T = i = 1 n σ i u i v i T
where,
n = number of buses
S = diagonal matrix with positive singular values, σ 1 , σ 2 , …, σ n , in descending order
U = left orthogonal matrix ( n × n dimension)
V = right orthogonal matrix ( n × n dimension)
The minimum singular value (MSV) of the Jacobian matrix ( σ n ) determines the proximity of a bus system to singularity. The smaller singular value and the corresponding maximum singular vector ( V n ) describe the buses ranking towards voltage singularity. V n is the last column of matrix V .

5. The Power Dispatch Operation

The strategy for addressing the optimum economic power dispatch with hybrid thermal–wind generation, including the use of PHG to mitigate the disturbance caused by wind power during curtailment, is presented.
Instability occurs in a power system when it is not able to maintain stable voltages on the buses under steep changing conditions on the lines that may result in voltage degradation, leading progressively to an uncontrollable state and system collapse.
Two factors are affected when a power system encounters a change in load: voltage magnitude and angle. A change in real power affects, to a greater extent, the voltage magnitude and, to a lesser extent, the voltage angle. Also, a change in reactive power affects mostly the voltage angle and to a lesser extent the voltage magnitude. Both factors could, however, impose some levels of stability issues on the power system operation, depending on the source of the disturbance. Therefore, appropriate action needs to be put in place to avoid system collapse that may occur when the system fails to meet the desired basic requirements. This work deals with real power disturbance from wind generations. Therefore, only the effects of the change of wind power fallout on voltage magnitude are considered. A sudden fallout of the wind generation is perceived by the power system network as a sudden increase in load equivalent to the wind power.
When power disturbance occurs, the power system may quickly recover, or not, depending on the magnitude and actions taken. A power system network, therefore, needs to be analyzed under different conditions of operation to ascertain the limits to which the system could withstand disturbance. Capacitor banks are normally installed on weak transmission lines to address reactive power issues at various points in the network, part of which is also supplied by some active generators online. Necessary actions have to be put in place on the power system operation to minimize voltage deviations under generator failures, changing demand, and loss of transmission lines.

Operational Model of the System

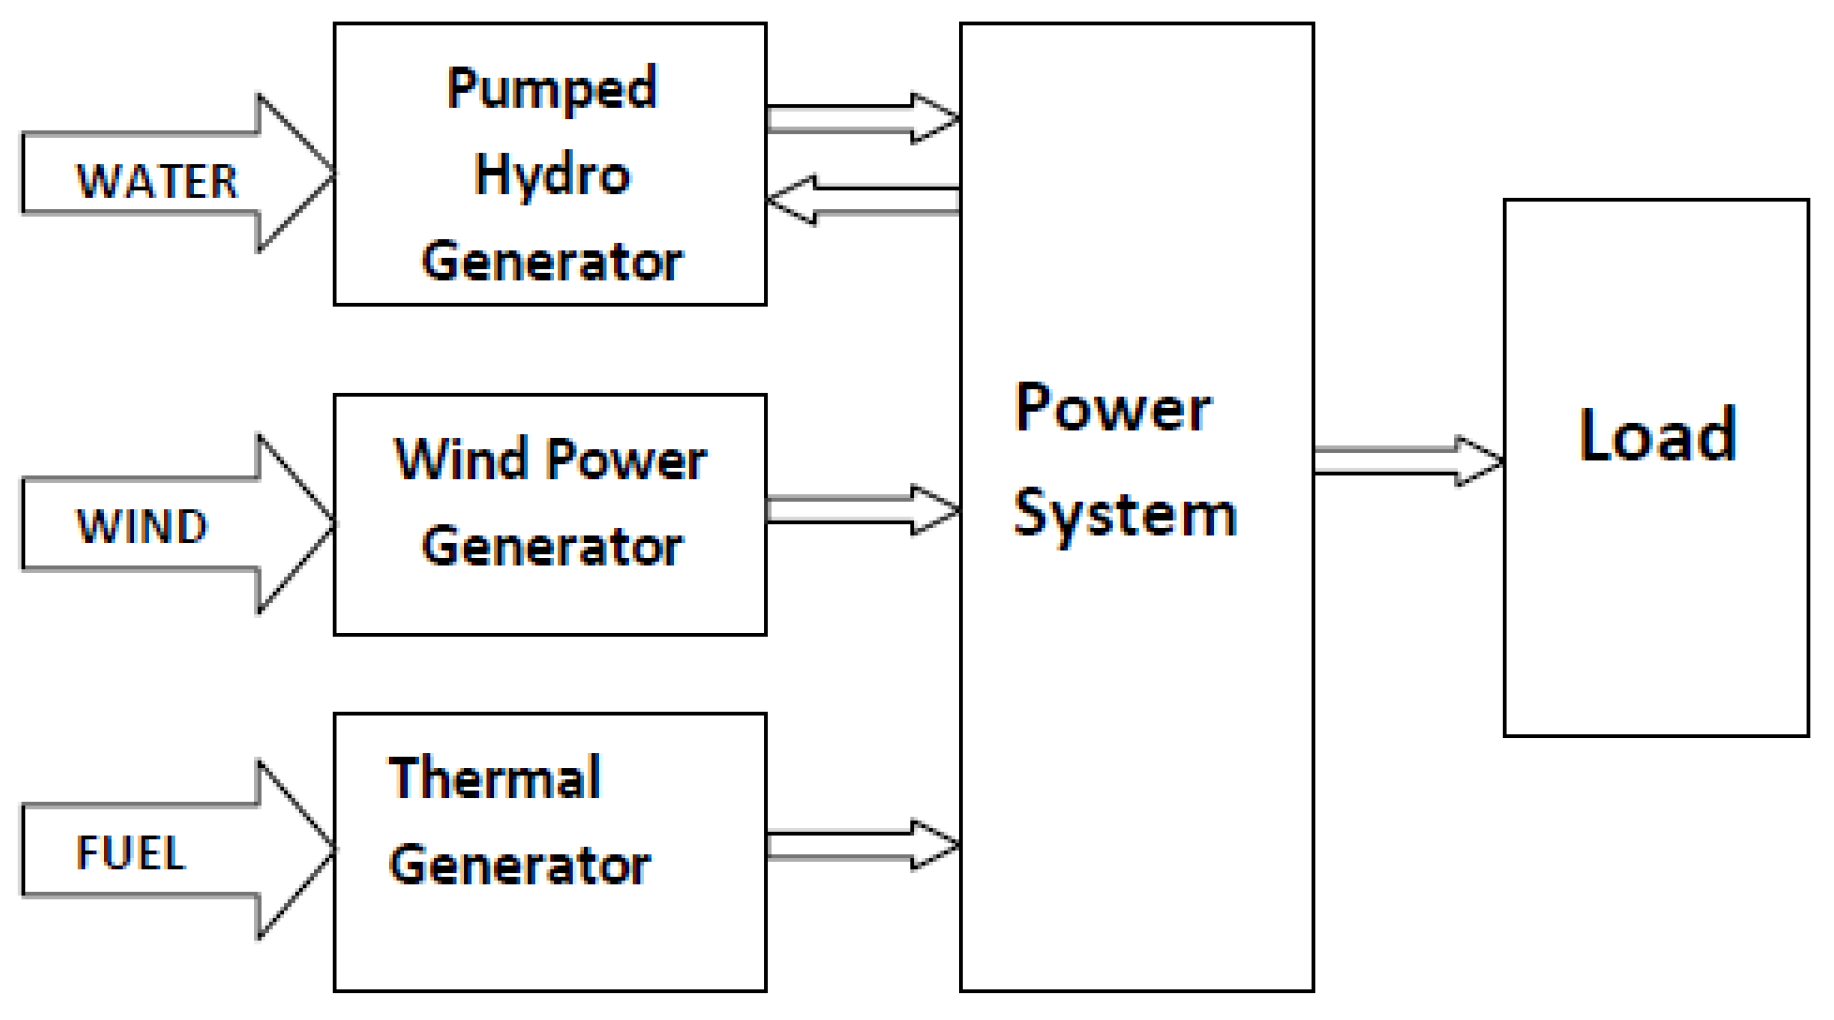
The block diagram of the proposed power system operation and the components are shown in Figure 7.
In the block diagram, the effective mechanism for power switchover between the wind generation and the PHG is formulated on the modified wind power curve, and then the limits serving as boundaries for the wind generation participation on the power system operation are preset. The limit calculations on the extended power curve are also included as part of the power system operation since they may vary for different wind power plants. This is to ensure maximum benefits are derived from wind power generation. Therefore, it determines whether wind generation, hydro generation, or both are engaged into the power system operation. The PHG stores energy during off-peak periods, and uses it during wind power curtailment, high demand periods, or as required otherwise. On other times when wind generation is low or absent, the PHG could be used on a normal power system scheduled operations.

6. Results

The simulations required to analyze the performance of the proposed method and relevant discussions on the results are presented.

6.1. Simulation Procedure

The simulation was set up as shown in Figure 8. The power flow optimization was run on the modified IEEE24-RTS bus system. The wind generation and the PHG were added to the network on buses 3 and 24, respectively, as shown. A typical day South African summer time wind profile (2013) obtained from Wind Atlas of South Africa (WASA), recorded on Weather Mast No. 5 (WM5), was used to run the simulations. Complete OPF calculations were carried out during the program run on the network, with all required parameters included. All of the required results from the calculations were also collated; these include, real power, reactive power, voltage magnitudes, voltage angles, etc. for all the buses and for each period (10 min, sub-hourly) on the 24-hour horizon. However, only the relevant parameters were extracted from the results for the analysis.
The simulation is divided into four cases: Case I, Case II, Case III, and Case IV. Each case was run separately and MSVs were computed for each. However, only the first five MSVs for each case are presented, because the minimum value, σ 1 , is the most relevant in the stability analysis using SVD. Values other than the minimum value are presented for comparison only. PHG is brought online in the power derating range, and wind power generation is withdrawn when the corresponding value of the preset upper speed limit ( V d r ) is attained, as illustrated in Table 2. The corresponding power at this speed in the simulation is assumed to be 140 MW; this is where wind generation is withdrawn. A total maximum power capacity of 50 wind turbines, i.e., 50( P r ), was used in the simulation. The wind speed and the corresponding power went above the stipulated upper limit on seven different periods on the 24-hour horizon considered, but only four periods (3rd, 37th, 46th, and 64th periods) are presented in all the analysis as depicted on Tables 5 and 6 respectively.
Note: The minimum singular value ( σ 1 ) obtained from each period of intermittence is the most relevant in all analysis. Other values presented ( σ 2 , σ 3 , σ 4 , and σ 5 ) are for comparison with σ 1 .
The operating conditions imposed on the wind generation and the PHG on the power system operation on the extended wind turbine curve region are depicted in Figure 3 and also illustrated in Table 2.

6.2. Simulation Results

6.2.1. CASE I: Operation with Base Thermal Generation, Wind Generation, and Fixed Demand

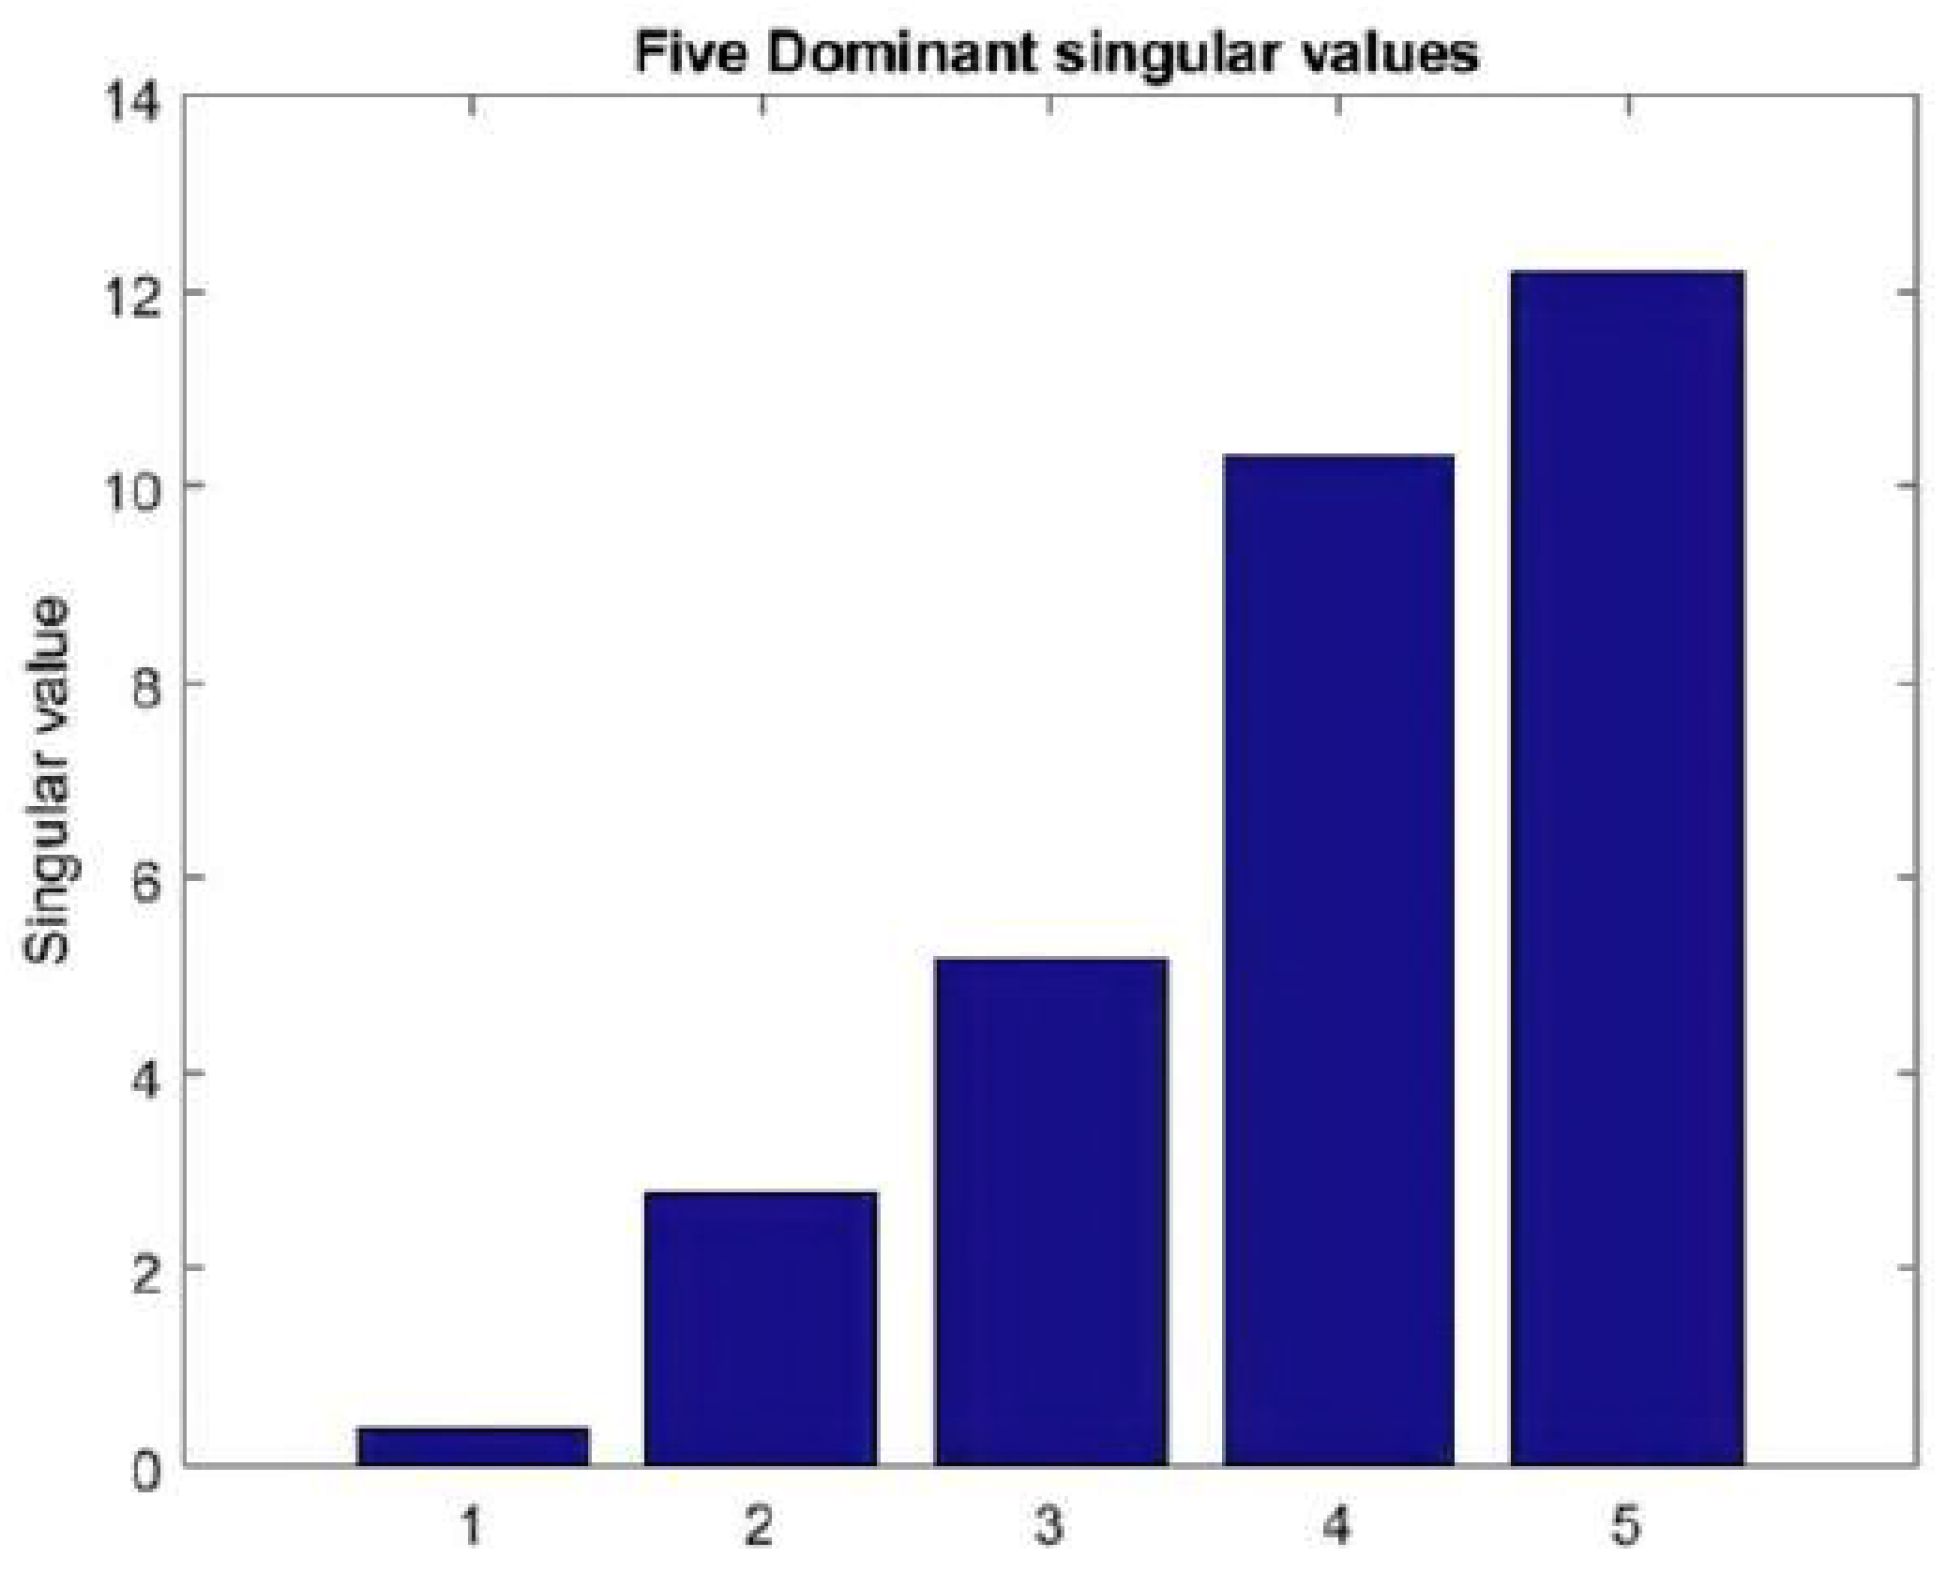
This case was run with the base thermal generation, the wind generation and fixed loads on all buses. The PHG was not included for supports during curtailment here. The analysis was carried out on the 24-hour horizon (10 min sub-hourly periods). The first five MSVs computed on the first period of switchover (3rd period) are shown in Table 3 and the corresponding histogram is as shown in Figure 9. In this case, all other MSVs obtained on the remaining periods of intermittence (37th, 46th, and 64th periods) returned similar values as the first period, therefore only the first five MSVs for the first period (3rd) are presented. The MSV, σ 1 (0.3668), was therefore recorded as the desired relevant minimum value. The results are similar on the specified periods due to the fixed loads imposed on all the buses, which removes other sources of disturbance, except the wind intermittence. This is also because the power switchover occurs on the same preset power (140 MW) on all the periods considered.

6.2.2. CASE II: Operation with Base Thermal, Wind, and PHG Generations under Fixed Demand

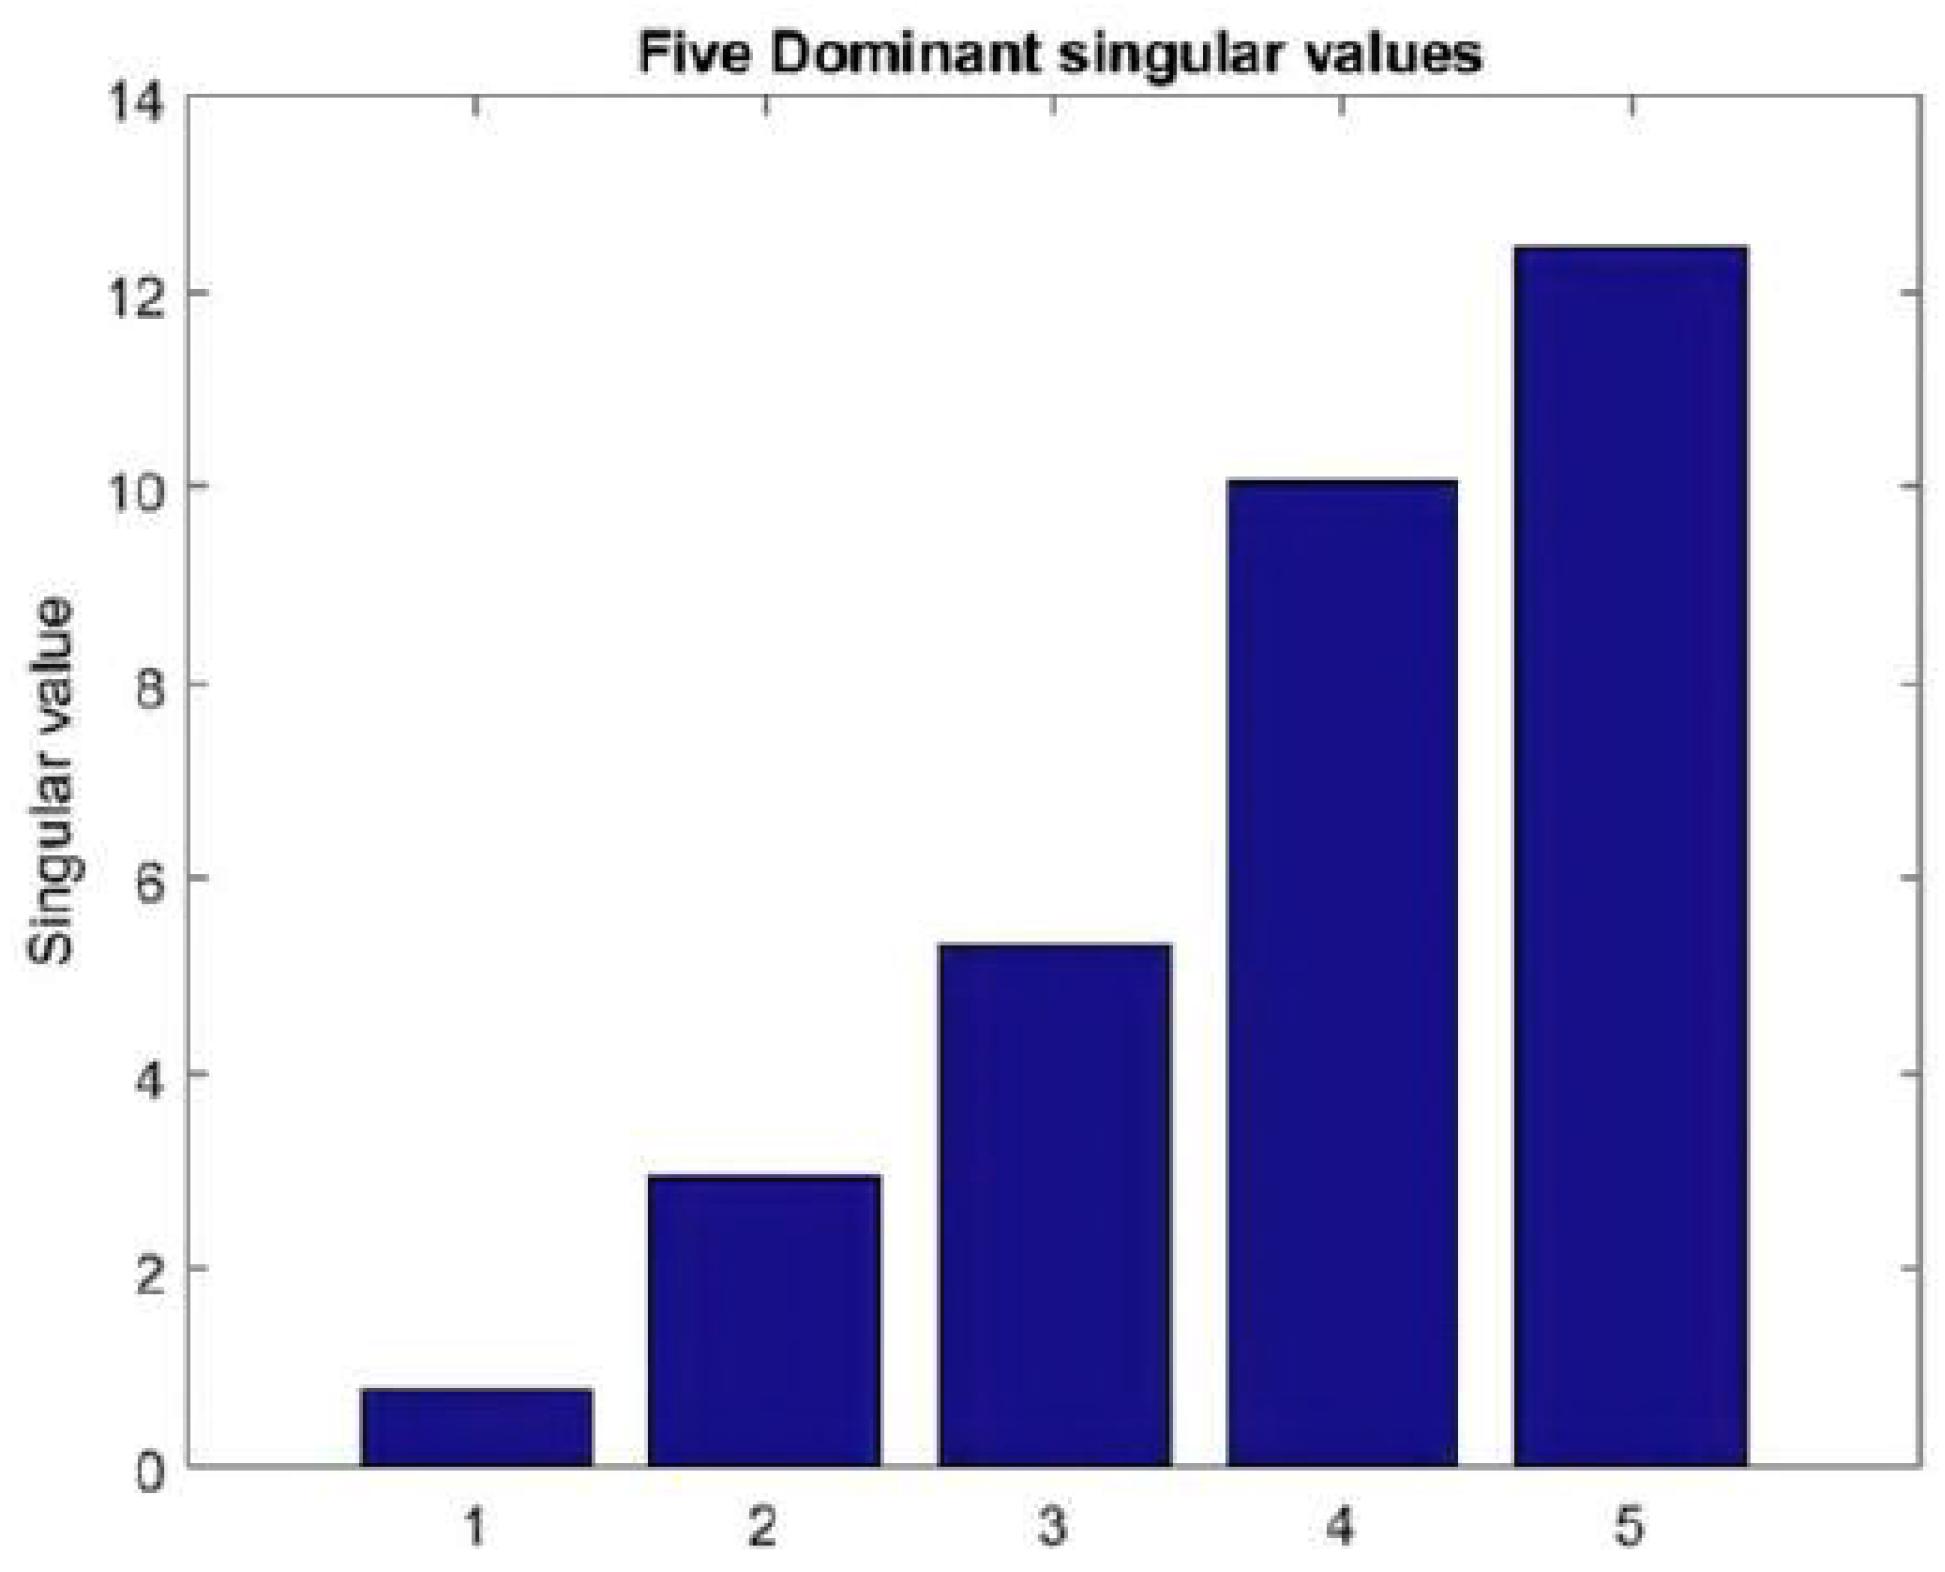
This case was run for the 24-hour horizon (10 min, sub-hourly periods) with the base thermal generation, wind generation, and fixed demands. The PHG was included for support during power switchover. Similar computations were done as in case I. The results obtained are also similar on all the periods of the intermittence (3rd, 37th, 46th, and 64th periods), thus only the first five MSVs for the first period (3rd Period) are presented. The results are as presented in Table 4 and Figure 10, respectively. The MSVs obtained for the entire periods of intermittence are also similar as in case I, due to the fixed loads imposed on all the buses, which removes all other sources of disturbance on the network, except the wind intermittence. This is also because the power switchover takes place on the same preset power level (140 MW) on all the periods considered. The MSV ( σ 1 ) computed for case II (0.7792) is higher compared to the value obtained in case I (0.3668), implying better voltage stability during wind power withdrawal because of the improvement achieved by employing the effective mechanism to switchover to PHG, which also prevents abrupt wind power fallout.

6.2.3. CASE III: Operation with Base Thermal, Wind Generation, and Variable Demand

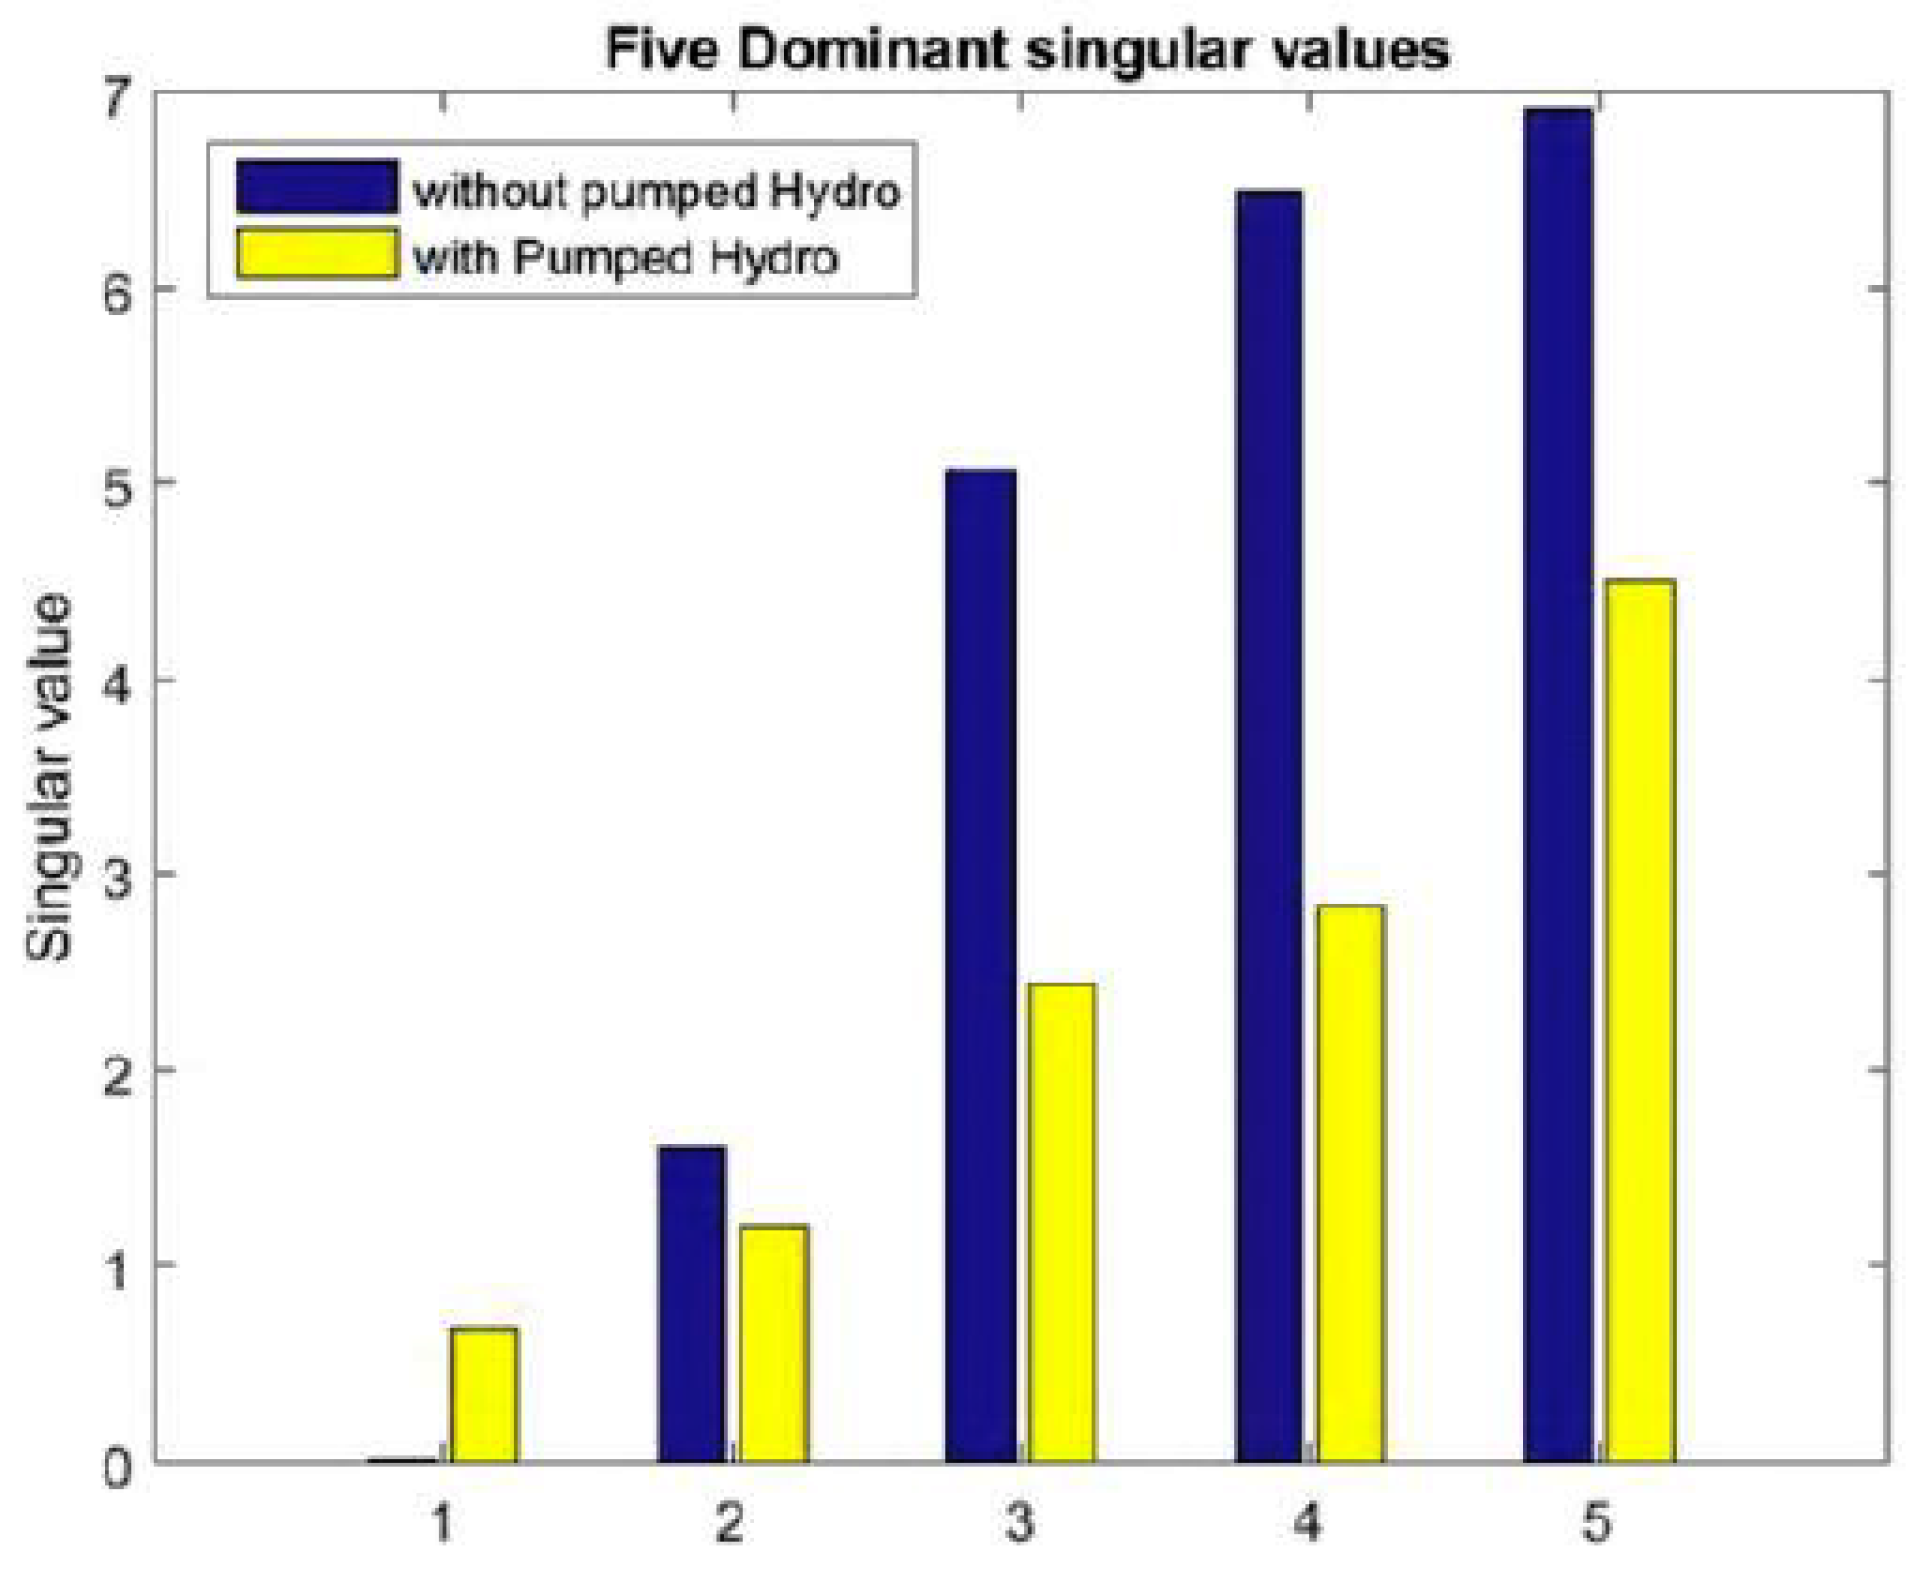
In this case, the power system was run with the base thermal generation and wind power generation and varying loads on the buses. The PHG support was not included. The analysis was also run on the 24-hour horizon (10 min, sub-hourly periods). Results obtained are presented in Table 5 and Figure 11, Figure 12, Figure 13 and Figure 14, respectively, for the periods of switchover. The values of MSV ( σ 1 ) obtained are not the same (0.0123, 0.5931, 0.7954, and 0.5318) for all the periods (3rd, 37th, 46th, and 64th, respectively), as depicted in Table 5, due to the variable loads used on all the buses, which lead to more disturbances on the network. This also contributes to the irregular behavior of the MSVs computed.

6.2.4. CASE IV: Operation with the Base Thermal, Wind, and PHG Generations under Variable Demand

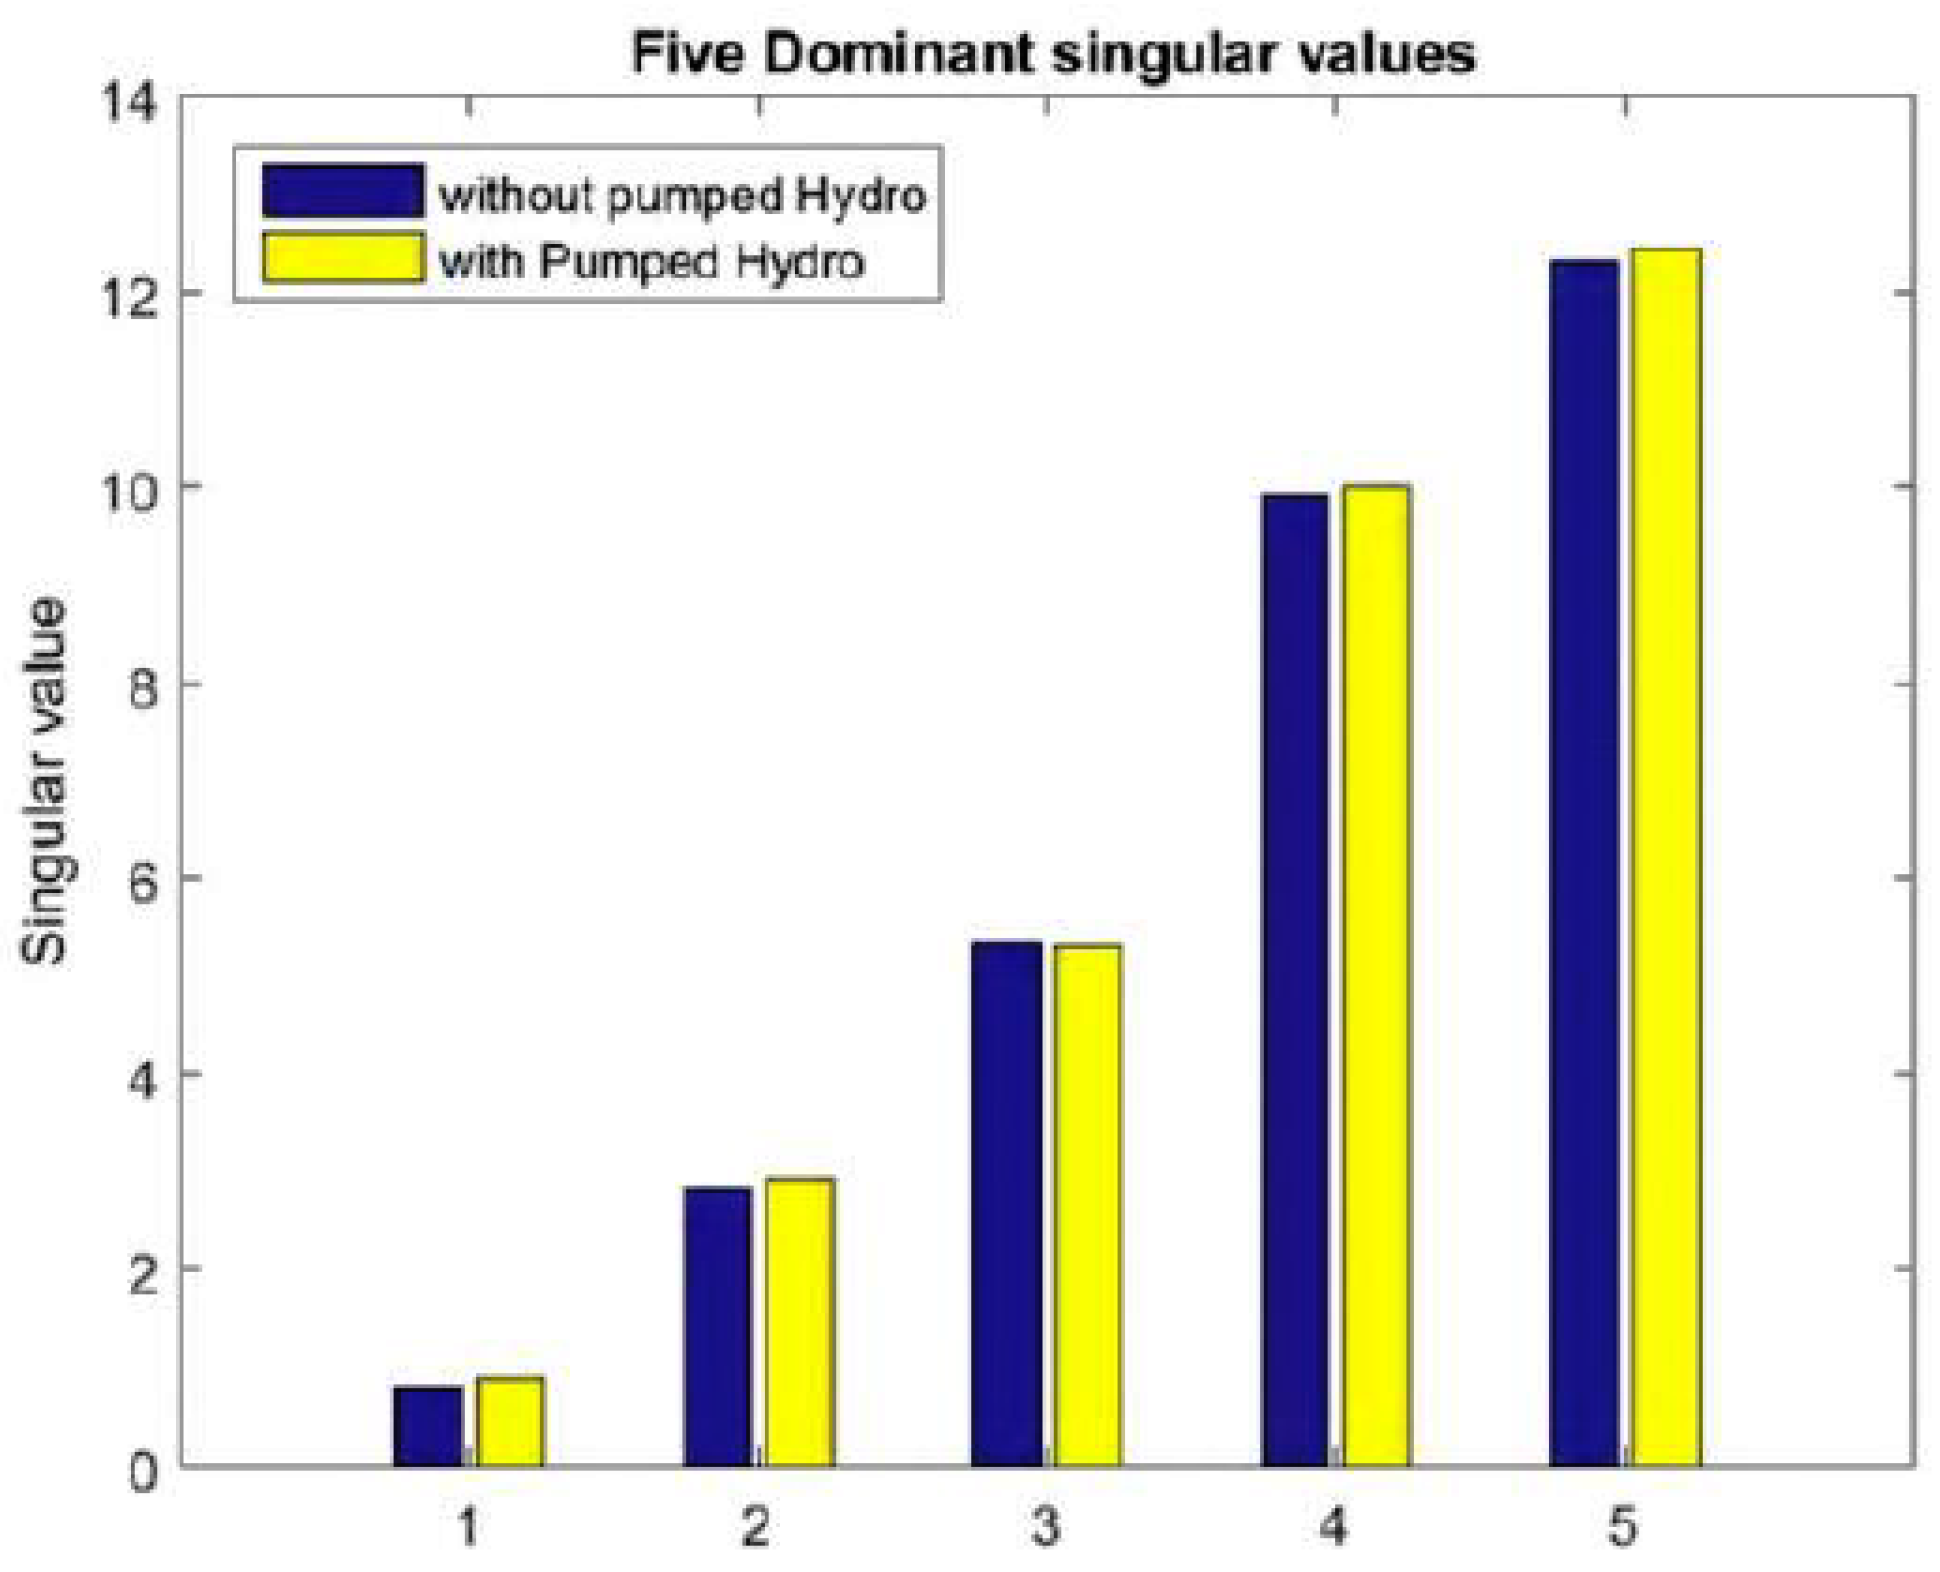
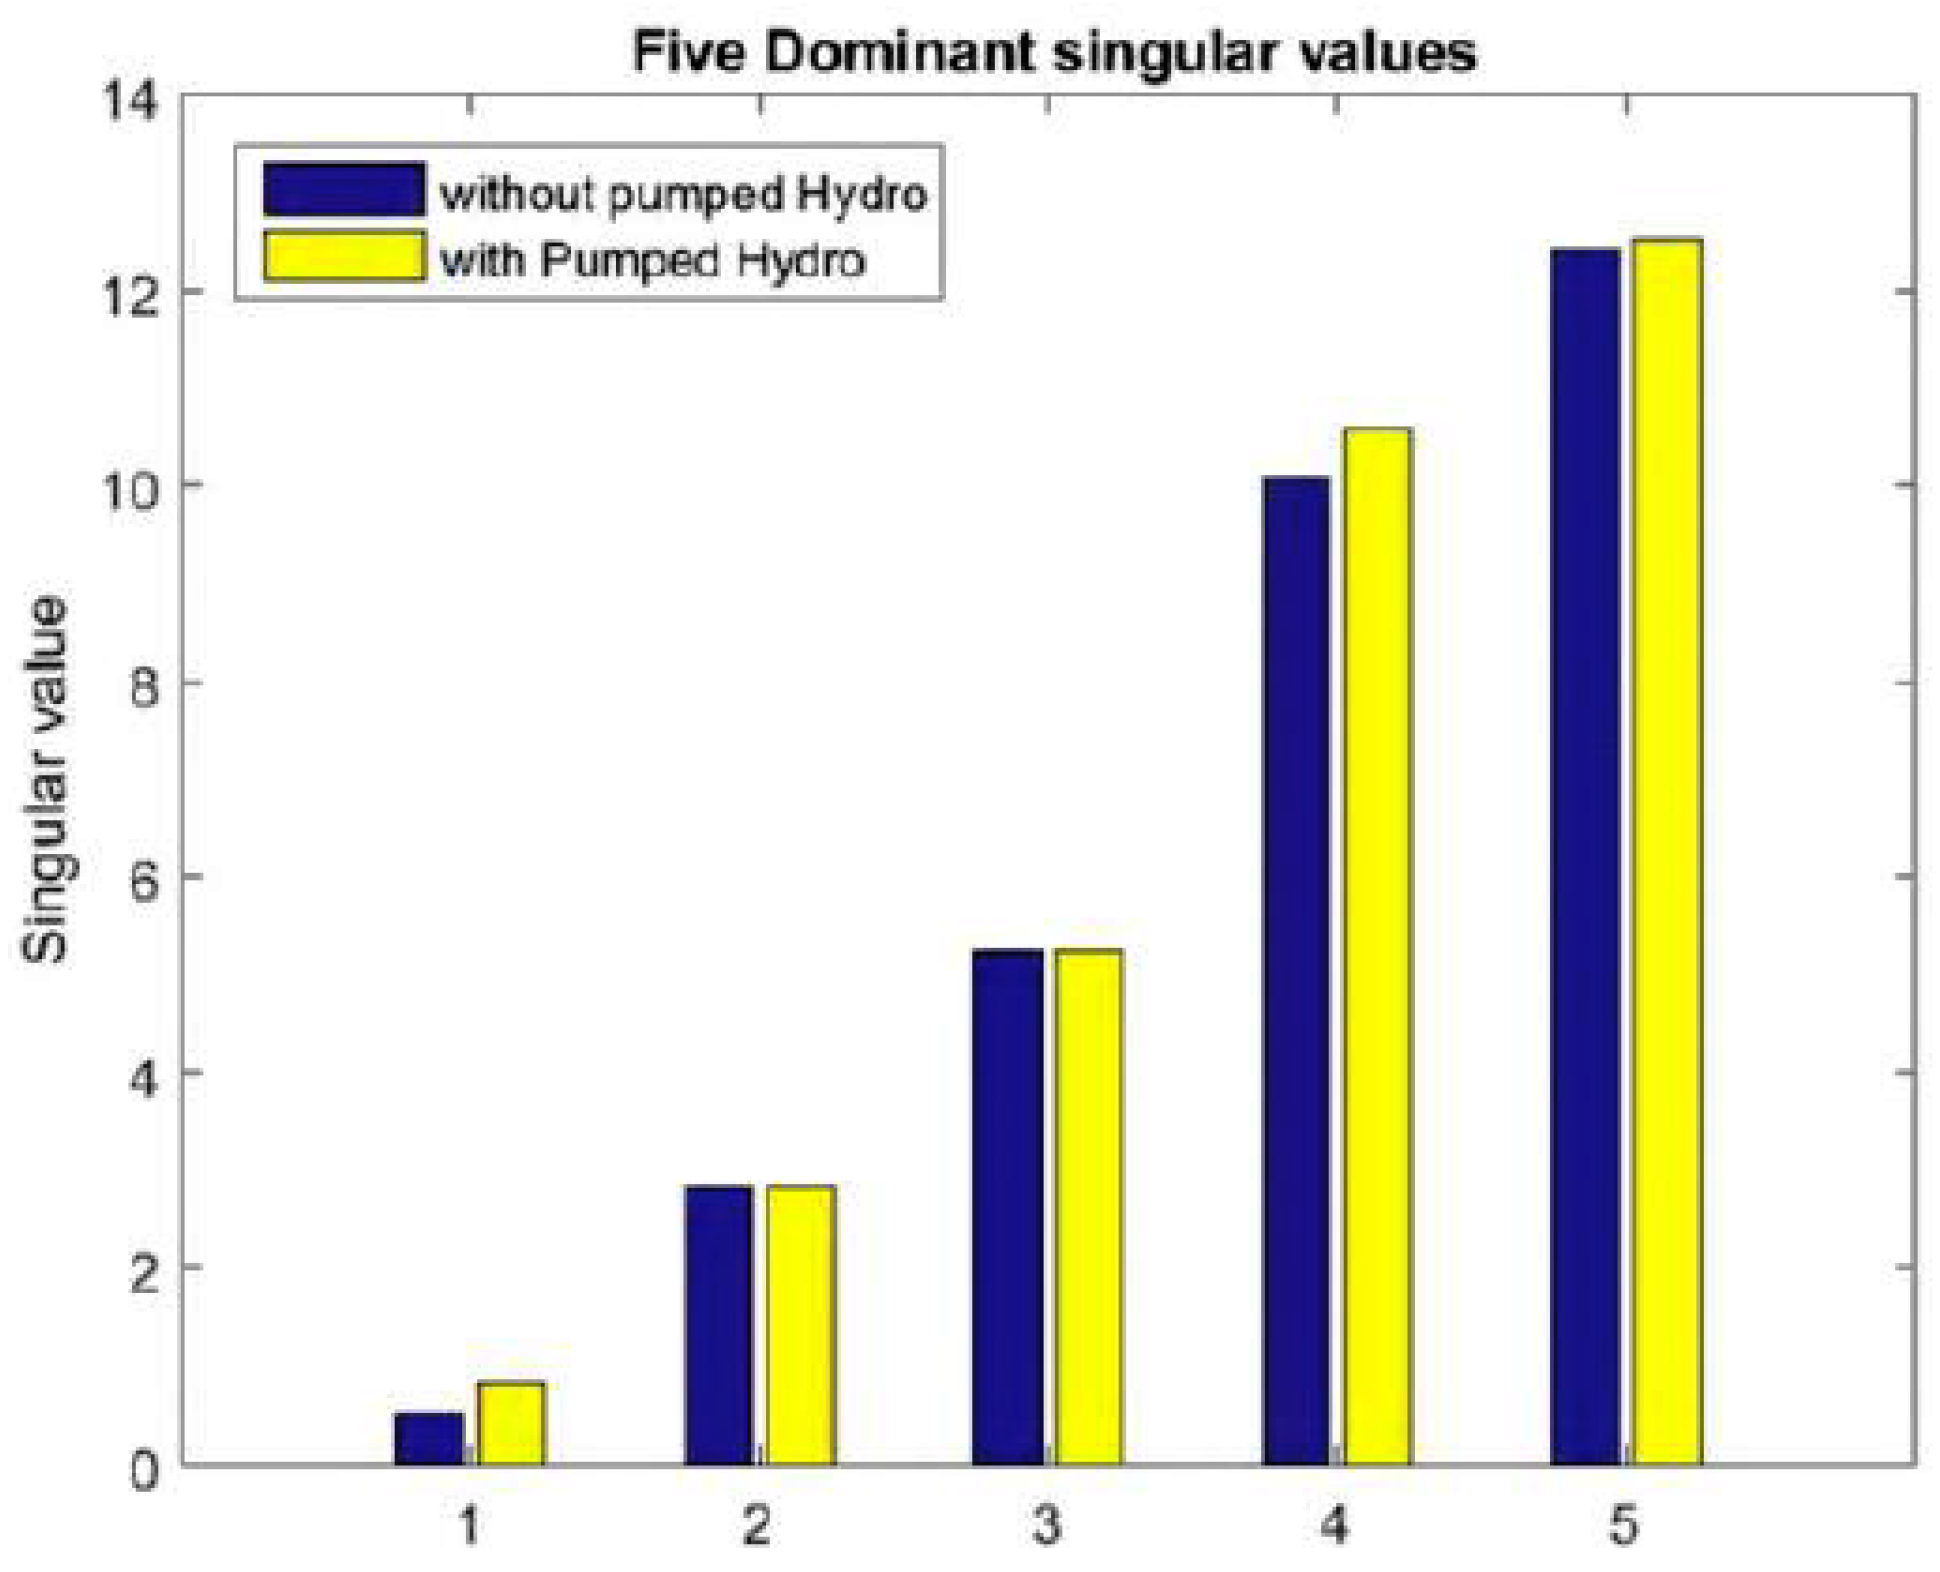
This analysis was run with base thermal generation and wind generation and variable loads on the buses. The PHG was used for support during power switchover for the 24-hour horizon (10 min sub-hourly periods). The variable loads used on all the buses resulted in more sources of disturbance on the network. The values of MSV ( σ 1 ) obtained for all periods (3rd, 37th, 46th, and 64th) of the switchover are therefore not the same, and are thus 0.6733, 0.6473, 0.8873, and 0.8407, respectively. The MSVs are also not the same as in case III due to the variable loads on the buses. The results obtained are presented in Table 6 and the combined plots with case III are given in Figure 11, Figure 12, Figure 13 and Figure 14, respectively. It could be observed that the values of MSV ( σ 1 ) obtained for case IV are higher than the corresponding values in case III as depicted in Table 6. This is an indication that the use of the PHG during power switchover from the wind generation to the PHG improves the voltage stability of the network.

6.3. Discussion of Results

The MSVs computed for case I over the periods of curtailment (3rd, 37th, 46th, and 64th periods) are similar, therefore only the first five MSVs for period 3 are presented, as shown in Table 3. The results are similar because the effects of variable loads on the buses have been removed (fixed loads) and the wind power withdrawal occurs on the same preset power switchover limit (140MW). Therefore, the MSV σ 1 (0.3668) is considered for all other periods of switchover.
In Case II, the curtailments also occurred in the same periods as case I, where PHG was used to substitute for wind generation. Therefore, only the first five MSVs for period 3 are presented, as shown in Table 4. The MSV σ 1 (0.7792) is hence considered for all the periods of switchover in case II.
It could be observed that the MSV, σ 1 (0.7792), for case II is higher than the value for case I, σ 1 (0.3668). This is also depicted on the histograms on Figure 9 and Figure 10. Therefore, the use of the switchover mechanism between the wind generation and the PHG has brought about improvements on the voltage stability of the power system during curtailment.
In case III, the MSVs obtained for periods of curtailment (3rd, 37th, 46th, and 64th periods) vary for each period. Therefore, the MSVs, σ 1 , for these periods are 0.0123, 0.5931, 0.7954, and 0.5318, respectively. These are depicted in Table 5. The values differ for all the periods due to the variable loads used on the buses which introduced more disturbances on the network.
In case IV, the corresponding values of MSV σ 1 obtained during intermittence are 0.6733, 0.6473, 0.8873, and 0.8407, respectively, for all the periods as shown in Table 6. They are also presented on the corresponding histograms in Figure 11, Figure 12, Figure 13 and Figure 14, respectively.
It could be deduced by comparing the σ 1 values for periods of switchover in case III with all the corresponding values in case IV, that case IV produced higher values. This implies that the use of the PHG during power switchover brought improvements in the voltage stability of the power system during wind power withdrawal.
The proposed method is limited to normal power system operation incorporating large wind generation. It is a normal occurrence during operation with wind generation to encounter intermittence and does not always signify a fault. Some other methods are used to address contingencies due to technical failures or attack on the power networks as discussed earlier in the introduction. These are not covered in this work.
Failures in short-term ED will go a long way to effectively modifying systems/equipment design for power systems and networks in order to minimize failure cases in long-term ED planning.

7. Conclusions

The results obtained in Cases I, II, III, and IV show improvements in the voltage stability of the power system when PHG is used to support withdrawal of the wind generation during high wind speeds that necessitate curtailment. The power switchover is effected on the extended wind turbine curve. Therefore, we conclude that the use of an extended curve as well as PHG on the hybrid power system operation with wind offers improvements with respect to the voltage stability of the system during heavy wind speeds above the normal cut-off point, when wind generation needs to be shut down. The switchover procedure is possible on a sub-hourly power system operation. The use of the effective power switchover between the wind generation, and the PHG consequently minimizes disturbance on the power system due to the wind power intermittence, thereby preventing instability. The wind power harvest would also increase due to the extra operational duration achievable on the wind turbine extended curve. The wind generation and the PHG are clean, environmentally friendly, and cheaper sources of renewable energy as compared to fossil fuel-based thermal generations. Therefore, continuous inclusion in the power generation mix would contribute in curtailing green house gas emissions.
Further work could be carried out on the effective switchover mechanism on multiple wind farms integration with different wind turbine specifications and the practical implementation of the system on a wind turbine with extended generation curve.

Author Contributions

The mathematical developments and programming in this work was developed within the framework of the doctorate of A.H. He is supervised by Y.H. and co-supervised by J.L.M. The written document was thoroughly discussed with the supervisors.

Funding

The work was partially funded by the Tshwane University of Technology within the framework of the doctoral programme.

Acknowledgments

We wish to acknowledge with appreciation, the technical facilities and funding granted by the Tshwane University of Technology, Pretoria, South Africa, towards the accomplishment of this research project.

Conflicts of Interest

The authors declare no conflict of interest.

Abbreviations

The following abbreviations are used in this manuscript.
DEDDynamic economic dispatch
DOAJDirectory of open access journals
EDEconomic dispatch
ICFIncremental cost function
LDlinear dichroism
MDPIMultidisciplinary Digital Publishing Institute
MSVMinimum singular value
N–RNewton–Raphson
OPFOptimal power flow
PHGPumped hydro generation
SVDSingular value decomposition
TLAThree letter acronym
WASAWind Atlas of South Africa
WMWeather mast

References

  1. Erin, C.; Eric, D.; Brian, B. FERC Order 764 and the Integration of Renewable Generation; ENERKNOL Research: Brooklyn, NY, USA, 2014. [Google Scholar]
  2. Ela, E.; O’Malley, M. Studying the Variability and Uncertainty Impacts of Variable Generation at Multiple Timescales. IEEE Trans. Power Syst. 2012, 27, 1324–1333. [Google Scholar] [CrossRef] [Green Version]
  3. Acar, C. A comprehensive evaluation of energy storage options for better sustainability. Int. J. Energy Res. 2018, 42, 3732–3746. [Google Scholar] [CrossRef]
  4. Yu, Y.; Chen, H.; Chen, L. Comparative Study of Electric Energy Storages and Thermal Energy Auxiliaries for Improving Wind Power Integration in the Cogeneration System. Energies 2018, 11, 263. [Google Scholar] [CrossRef]
  5. Berrada, A.; Loudiyi, K. Optimal Modeling of Energy Storage System. Int. J. Model. Optim. 2015, 5, 71–77. [Google Scholar] [CrossRef]
  6. Al-Ghussain, L.; Taylan, O.; Baker, D.K. An investigation of optimum PV and wind energy system capacities for alternate short and long-term energy storage sizing methodologies. Int. J. Energy Res. 2019, 43, 204–218. [Google Scholar] [CrossRef]
  7. Awan, A.B.; Zubair, M.; Sidhu, G.A.S.; Bhatti, A.R.; Abo-Khalil, A.G. Performance analysis of various hybrid renewable energy systems using battery, hydrogen, and pumped hydro-based storage units. Int. J. Energy Res. 2018. [Google Scholar] [CrossRef]
  8. Thai, T.T.; Ahn, S.J.; Choi, J.H.; Go, S.I.; Nam, S.R. Real-Time Wavelet-Based Coordinated Control of Hybrid Energy Storage Systems for Denoising and Flattening Wind Power Output. Energies 2014, 7, 6620–6644. [Google Scholar] [Green Version]
  9. Hassan, A.; Agee, J.T. Electric Energy from the Hybrid Wind-Solar Thermal Power Plants. In Proceedings of the 2016 IEEE PES PowerAfrica, Livingstone, Zambia, 28 June–3 July 2016; pp. 264–268. [Google Scholar]
  10. Roustiam, C.; Yuriy, V. Direct conversion of wind energy into heat using Joule machine. In Proceedings of the 2011 International Conference on Environmental and Computer Science, Phuket, Thailand, 21–23 December 2011. [Google Scholar]
  11. Hu, Y.; Li, Y.; Xu, M.; Zhou, L.; Cui, M. A Chance-Constrained Economic Dispatch Model in Wind-Thermal-Energy Storage System. Energies 2017, 10, 326. [Google Scholar] [CrossRef]
  12. Shang, Y. Vulnerability of networks: Fractional percolation on random graphs. Phys. Rev. E 2014, 89, 012813. [Google Scholar] [CrossRef]
  13. Ren, B.; Jiang, C. A Review on Economic Despatch and Risk Management Considering Wind Power in the Market. J. Renew. Sustain. Energy 2009, 13, 2169–2174. [Google Scholar]
  14. Harsha, G.; Suvrajeet, S.; Victor, M.Z. Stochastic Optimization of Sub-Hourly Economic Dispatch With Wind Energy. IEEE Trans. Power Syst. 2016, 31, 949–959. [Google Scholar]
  15. Cheng, W.; Zhang, H. A Dynamic Economic Dispatch Model Incorporating Wind Power Based on Chance Constrained Programming. Energies 2015, 8, 233–256. [Google Scholar] [CrossRef]
  16. Salama, M.M.; Elgazar, M.M.; Abdelmaksoud, S.M.; Henry, H.A. Short Term Pumped Storage Scheduling Using Two Proposed Techniques. Int. J. Energy Environ. (IJEE) 2014, 5, 219–238. [Google Scholar]
  17. John, H.; David, C.Y.; Kalu, B. An Economic Dispatch Model Incorporating Wind Power. IEEE Trans. Energy Convers. 2008, 23, 603–611. [Google Scholar]
  18. Sivanagaraju, S.; Sreenivasan, G. Power Systems Operation and Control, 1st ed.; Dorling Kindersley (Inida) Pvt. Ltd.: Noida, India, 2010. [Google Scholar]
  19. Chedid, R.; Akiki, H.; Rahman, S. A Decision Support Technique for the Design of Hybrid Solar-Wind power system. IEEE Trans. Energy Convers. 1998, 13, 76–83. [Google Scholar] [CrossRef]
  20. Jelavi, M.; Petrovi, V.; Bari, M.; Ivanovi, I. Wind turbine control beyond the cut-out wind speed. In Proceedings of the Annual Conference and Exhibition of European Wind Energy Association (EWEA2013), Vienna, Austria, 4–7 February 2013. [Google Scholar]
  21. Petrovi, V.; Bottasso, C.L. Wind Turbine Envelope Protection Control Over The Full Wind Speed Range. Renew. Energy 2017, 111, 836–848. [Google Scholar] [CrossRef]
  22. Davide, A.; Francesco, C.; Ludovico, T. Wind Turbine Power Curve Upgrades. Energies 2018, 11, 1300. [Google Scholar] [Green Version]
  23. Zimmerman, R.; Murillo-Sanchez, C.; Thomas, R.J. MATPOWER: Steady-State Operations, Planning and Analysis Tools for Power Systems Research and Education. Power Syst. IEEE Trans. 2011, 26, 12–19. [Google Scholar] [CrossRef]
  24. Jin-Woo, C.; Mun-Kyeom, K. Multi-Objective Optimization of Voltage-Stability Based on Congestion Management for Integrating Wind Power into the Electricity Market. J. Appl. Sci. 2017, 7, 573. [Google Scholar] [CrossRef]
  25. Ellithy, K.; Shaheen, M.; Al-Athba, M.; Al-Subaie, A.; Al-Mohannadi, A.; Al-Okkah, S.; Abu-Eidah, S. Voltage Stability Evaluation of Real Power Transmission System Using Singular Value Decomposition Technique. In Proceedings of the 2nd IEEE International Conference on Power and Energy (PECon 08), Johor Bahru, Malaysia, 1–3 December 2008; pp. 1691–1695. [Google Scholar]
  26. Claudia, R.; Maciel, B.P. Assessment of voltage stability of electrical power systems: A simulational survey. In Proceedings of the International Conference on Electrical and Electronics Engineering—ELECO 2009, Bursa, Turkey, 5–8 November 2009; pp. 373–376. [Google Scholar]
  27. Jalboub, M.K.; Rajamani, H.S.; Abd-Alhameed, R.; Ihbal, A.M. Weakest Bus Identification Based on Modal Analysis and Singular Value Decomposition Techniques. Iraq J. Electr. Electron. Eng. 2011, 7, 157–162. [Google Scholar] [CrossRef]
  28. Ekwuea, A.; Wana, H.; Chengb, D.; Songc, Y. Singular Value Decomposition Method For Voltage Stability Analysis On The National Grid System (NGC). Electr. Power Energy Syst. 1999, 21, 425–432. [Google Scholar] [CrossRef]
Figure 1. Wind turbine power curve.
Energies 12 03583 g001
Figure 2. Wind turbine power curve: hysteresis.
Energies 12 03583 g002
Figure 3. Modified wind turbine power curve.
Energies 12 03583 g003
Figure 4. Expanded wind power derating region for P r 1 and P r 2 .
Energies 12 03583 g004
Figure 5. Typical summer time load profile.
Energies 12 03583 g005
Figure 6. Typical summer time wind profile (2013).
Energies 12 03583 g006
Figure 7. Operational block diagram of the system.
Energies 12 03583 g007
Figure 8. Modified IEEE24-RTS with wind generation and Pumped Hydro Generation (PHG).
Energies 12 03583 g008
Figure 9. Operation with wind generation and fixed demand: Case I.
Energies 12 03583 g009
Figure 10. Operation with wind, PHG, and fixed demand: Case II.
Energies 12 03583 g010
Figure 11. Result plot with and without PHG: Period 3.
Energies 12 03583 g011
Figure 12. Result plot with and without PHG: Period 37.
Energies 12 03583 g012
Figure 13. Result plot with and without PHG: Period 46.
Energies 12 03583 g013
Figure 14. Result plot with and without PHG: Period 64.
Energies 12 03583 g014
Table 1. Wind turbine specifications.
S/No.DescriptionSpecification
1.Rated Power3000 kW
2.Rotor Diameter90 m
3.Swept Area6362 m 2
4.Power Density2.13 kWm 2
5.No. Of Blades3
6.Power Control Pitch
7.Cut-In Wind Speed3.5 ms 1
8.Rated Wind Speed13 ms 1
9.Cut-Off Wind Speed25 ms 1
10.Maximum Speed1200 r . p . m
11.Voltage690 V
12.Max. Wind Speed Survival52.5 ms 1
13.Gear Box3 Stage
14.Min./Max. Tower Height80/90 m
Table 2. Operating conditions on the extended curve region.
RegionStatus: WindStatus: PHG
V V 3 ONOFF
V 3 V V d r ONON
V V d r OFFON
Table 3. First 5 MSVs for all period of wind curtailment: Case I.
Minimum Singular Values(MSV)
σ 1 0.3668
σ 2 2.9580
σ 3 5.2976
σ 4 10.0638
σ 5 12.4682
Table 4. First 5 MSVs for all period of wind curtailment: Case II.
Minimum Singular Values(MSV)
σ 1 0.7792
σ 2 2.7684
σ 3 5.1748
σ 4 10.3112
σ 5 12.2080
Table 5. First 5 minimum singular values (MSVs) for all four periods of wind curtailment on the 3rd, 37th, 46th, and 64th periods: Case III.
Minimum Singular Values3rd Period37th Period46th Period64th Period
σ 1 0.01230.59310.79540.5318
σ 2 1.60982.79162.85372.8521
σ 3 5.06355.24895.33365.2408
σ 4 6.491410.17909.937010.0758
σ 5 6.906212.576312.309412.4181
Table 6. First 5 MSVs for all four periods of wind curtailment on the 3rd, 37th, 46th, and 64th periods: Case IV.
Minimum Singular Values3rd Period37th Period46th Period64th Period
σ 1 0.67330.64730.88730.8407
σ 2 1.19982.71432.91872.8413
σ 3 2.43655.18075.29625.2618
σ 4 2.837510.200910.012210.5768
σ 5 4.495812.382712.421712.5050