Article

Computer Model for a Wind–Diesel Hybrid System with Compressed Air Energy Storage

1
Laboratoire de Recherche en Énergie Éolienne, Université du Québec à Rimouski, Québec, QC G5L 3A1, Canada
2
Institut Technologique de Maintenance Industrielle, Cégep de Sept-Îles, Sept-Îles, QC G4R 5B7, Canada
3
Groupe de Recherche en Électronique de Puissance et Commande Industrielle, École de Technologie Supérieure, Montréal, QC H3C 1K3, Canada
4
Groupe de Recherche Industrielle en Technologies de l’Énergie et en Efficacité Énergétique, École de Technologie Supérieure, Montréal, QC H3C 1K3, Canada
*
Author to whom correspondence should be addressed.
Energies 2019, 12(18), 3542; https://doi.org/10.3390/en12183542
Submission received: 10 August 2019 / Revised: 6 September 2019 / Accepted: 10 September 2019 / Published: 16 September 2019
(This article belongs to the Special Issue Hybrid Renewable Energy Systems in Remote Sites 2019)

Abstract

:
A hybrid system combines two or more energy sources as an integrated unit to generate electricity. The nature of the sources associated varies between renewable and/or non-renewable energies. Such systems are becoming popular as stand-alone power systems to provide electricity, especially in off grid remote areas where diesel generators act as primary energy source. Wind–diesel systems are among the preferred solutions for new installations, as well as the upgrade of existing ones. However, efforts to address technical challenges towards energy transformation for sustainable development are multiple. The use of energy storage systems is a solution to reduce energy costs and environmental impacts. Indeed, efficient and distributed storage not only allows the electricity grid greater flexibility in the face of demand variations and greater robustness thanks to the decentralization of energy sources, it also offers a solution to increase the use of intermittent renewables in the energy mix. Among different technologies for electrical energy storage, compressed air energy storage is proven to achieve high wind energy penetration and optimal operation of diesel generators. This paper presents a computer model for performance evaluation of a wind–diesel hybrid system with compressed air energy storage. The model has been validated by comparing the results of a wind–diesel case study against those obtained using HOMER software (National Renewable Energy Laboratory, Golden, CO, United States). Different operation modes of the hybrid system are then explored. The impact of hybridization on time and frequency of operation for each power source, fuel consumption and energy dissipation has been determined. Recommendations are made on the choice of key parameters for system optimization.

1. Introduction

Given the size of the territory and the great geographical variation, Canada includes more than 300 remote communities, representing approximately 200,000 people. These communities are scattered throughout the country exhibiting strong presence in the provinces of Nunavut, Northwest Territories, Quebec and Yukon. At present, access to affordable and reliable electricity remains a challenge. Over the last 15 years, the number of these areas has been decreased while population growth has increased. Thus, the lack of connection to the national electric network makes those communities rely solely on local generated electricity. Most off-grid communities and industrial sites rely on diesel gensets to generate electricity [1]. However, this technology is characterized by high production costs and greenhouse gas (GHG) emissions [2]. In addition, the exploitation of diesel engines in these remote areas is not only sensible to fuel prices fluctuations but preponderantly to fuel transportation costs [3,4]. In this context, the development of power generation systems based on renewable energies from local sources is an effective solution to overcome the aforementioned barriers.
To date, hybrid systems combining different renewable-diesel configurations with energy storage system (ESS) have been implemented and studied [5,6,7,8,9]. As a result, a balance can be achieved simply regulating the power produced by the primary sources and the load demand through a storage system thus, the power system remains stable. The system called wind–diesel hybrid system with compressed air storage (WDCAS) exhibits inherent advantages of high wind energy penetration for extended time periods in case there is an energy surplus over the charge. During these periods, the surplus of wind energy is converted into compressed air. Otherwise, diesel generators are used to supply power to the load. The use of compressed air energy storage (CAES) will optimize the operation of diesel engines by supplying as much air as required at an optimal air/fuel ratio [10].
Numerous authors have conducted studies to assess technical and economic feasibility for stand-alone hybrid renewable energy systems. In consequence, several procedures and software have been developed to meet an optimal design, high energy efficiency and cost-effective configuration. Table 1 presents an overview of existing simulation software for conventional and renewable energy technology projects.
As can be seen from Table 1, available renewable energy software incorporates a large number of energy sources (hydro, wind, solar, biomass, diesel, etc.) and ESS (batteries, hydrogen storage, etc.) for any location in the world. However, none of them allow the use of hybrid systems with CAES. Design of such systems requires not only the additional modeling of the ESS itself, but also the modification of diesel engine characteristics to take into account its overcharge with stored compressed air.
In this work, a computer model for performance evaluation of a WDCAS is presented. It includes a sensitivity analysis of key parameters for optimal system operation. This paper is organized as follows. In Section 2, the WDCAS is briefly described and the mathematical formulation of the proposed model is presented. System configuration and simulation results are discussed in Section 3. Concluding remarks are presented in Section 4.

2. Model-Based System Design

A wind–diesel hybrid system is a stand-alone power system with wind and diesel generators. These systems are designed to maintain simultaneous voltage and frequency regulation due to active and reactive load variations and wind speed changes. ESS integration facilitates a hybrid system to optimize energy usage while maintaining efficient demand response. CAES appears as an economically mature technology. Cost, simplicity, lifespan, fuel consumption and GHG emission are all influential factors that determine the competitiveness of this technology for wind–diesel hybridization. Moreover, CAES represents a promising solution to store electricity derives from kinetic energy of air at one time, for use at another time using compressed air.
WDCAS operates according to compression–decompression cycles. The overall performance depends on the size of the installation and the wind power penetration rate (WPPR). Air is compressed and stored in a reservoir during off-peak wind power demand. During low wind speed conditions, the compressed air is injected into the diesel engine that can operate in three different modes: supercharged, hybrid or pneumatic, having the two-fold advantage of increasing its power and decreasing its fuel consumption [11]. Figure 1 illustrates the wind–diesel hybrid system, which consists of three main parts: the primary energy source (diesel), the renewable energy source (wind) and the compression and storage system (compressor and reservoir). Ancillary systems should be included to ensure safe operation and energy efficiency management in the hybrid system.

2.1. Basic Parameters

In this section, the mathematical models of the major components associated with the WDCAS are introduced. A computer model has been developed at the Wind Energy Research Laboratory attached to the University of Quebec at Rimouski. It optimizes the hybrid system in terms of wind turbines and diesel generator numbers. The model is composed of two parts: one part consisting of system design and technical analysis, the other one consisting of environmental, financial and risk analysis. The scope of this paper is focused on the wind–diesel hybrid system design and optimization parameters.

2.1.1. Simulation Time and Time Step

Simulation time and time step t s t e p can be selected by the user. By default, the simulation time is set to one year as it considers the cycle of seasons, load and weather conditions. The t s t e p is estimated in terms of fuel consumption rate. It is also the same for load and meteorological data, the default value is set to one hour.

2.1.2. Energy Balance

Equation (1) represents the energy balance between the energy produced and the energy consumed. For a given t s t e p , power generation is estimated in function of the load, the wind resource, the diesel genset and the energy stored level.
P L o a d = P W T + P D G P C A E S

2.2. Subsystems Modeling

2.2.1. Load

A load profile must be provided by the user. In particular, the dataset contains the amount of energy typically taken during each hour by a consumer or class of consumers over a defined period. According to the load profile, the WDCAS software (Wind Energy Research Laboratory, Rimouski, QC, Canada) estimates the total power required by each subsystem.

2.2.2. Wind Turbine

The available wind power P W T is determined by measuring the average wind speed v ¯ w at one particular instant in time (or time step) and the WT type used. WT performance is estimated by using either the power coefficient C P W T or the wind power curve, both combined with wind characteristics on the site under study will provide the total energy produced E v ¯ w over a time period.
C P W T given in Equation (2), is a non-dimensional parameter expressing the turbine efficiency in converting aero kinetic power in the wind to mechanical power, and its maximum value is the Betz limit.
C P W T = P W T P W T a = P W T 1 2 ρ a S W T v w 3
where P W T a is the power generated by the kinetic energy of a free flowing wind stream at the entrance of the rotor blades of a WT, it can also be expressed as a factor of 1 2 of the air density ρ a , the swept area S W T and the wind speed cubed v w .
Wind power curve represents the relationship between P W T and v w and is provided by each manufacturer. The software uses a database that includes typical power curves for different wind turbines. The user can also define and use a power curve for a new WT. Wind power curve and wind speed distribution are considered to estimate E v ¯ w . Equation (3) shows an example of the total energy produced by a WT over the course of a year.
E v ¯ w = 8760 v w = 0 v w = 25 P W T ( v w ) f ( v w )
Here f ( v w ) represents the Weibull probability distribution of wind speed, and is defined as follows:
f ( v w ) = k c v w c k 1 exp v w c k
where k and c refer to the shape and scale factors, respectively. These parameters should be provided by the user following a wind speed measurement campaign. If this information is not available, as it is generally the case for pre-feasibility studies, it is possible to use data from wind atlases [12] or meteorological databases [13,14,15]. By default, for a given v ¯ w , k is assumed equal to two (Rayleigh distribution) and c is calculated. The wind speed assumed to be known at a height h 0 is adjusted to the hub height using the shear coefficient α , as presented in Equation (5).
v ¯ w v 0 w = h W T h 0 α
The integration of large-scale wind power depends on many factors related to wind itself. Wind penetration level plays a predominant role in system reliability since it is different for each curve and becomes smaller as the uncertainty level of the wind production increases [16]. Equations (6) and (7) below show how the WPPR and the wind energy penetration rate (WEPR) are calculated.
W P P R = P W T m a x P L o a d m a x
W E P R = E v ¯ w E L o a d
WPPR is defined as the ratio of the installed wind power capacity to the system peak load demand. Similarly, WEPR represents the ratio of the total amount of wind energy produced and the load demand over a time period, generally on an annual basis. WPPR is defined by the user, and then the WDCAS software determines the number of WT needed by using Equation (8).
N B W T = P L o a d m a x W P P R P W T

2.2.3. Diesel Generator

A computational model has been built based on the models described in [17]. The WDCAS software allows using one or more diesel generator units to operate in dual-mode: “normal mode” without compressed air for overcharging and/or “supercharged mode” with compressed air. The software uses a database that includes the most common diesel generators. The user can also define and use a new diesel generator based on predetermined characteristics.
Fuel consumption is also determined by the WDCAS software, under normal operating conditions it is calculated based on diesel generator power P D G . This can be done using Equation (9) below.
m ˙ f D G = A P D G B
where A and B are specific parameters for each diesel generator.
The efficiency of the diesel engine is determined from the relation between the P D G obtained and the product of the specific fuel consumption m ˙ f D G and the lower calorific value of the fuel P C I used.
η D G = P D G P C I m ˙ f D G
In supercharged mode, the stored compressed air is used to keep optimal efficiency by controlling the stoichiometric air/fuel ratio λ . Equation (11) shows the mathematical expression of air and fuel supplied for combustion.
λ = m ˙ i n D G m ˙ f D G
where m ˙ i n D G is the air mass flow entering the engine.
Previous studies have shown that maximum efficiency of diesel generators of about η D G 56 % can be achieved for an air/fuel ratio of λ 53 [17]. Therefore, the WDCAS software considers this optimal ratio for all overcharged operation regimes. Equation (12) shows the fuel and compressed air flow rates required to supercharge the diesel generator, where η D G 56 % .
P D G = P C I η D G m ˙ f D G = P C I η D G m ˙ i n D G λ

2.2.4. Compressed Air Storage

The WDCAS software does not count with predefined compressors; the user should configure them according to the specific scenario. The compressor type determines how the excess of wind energy is used over the load and the size of the storage tank. The efficiency of a compressor is expressed as the ratio of the work of compression for an ideal polytropic process between fixed states of the air to the work of compression for the actual process between the same states. Equation (13) defines the relation between power and compression ratio of a single-stage compressor [17].
P C 1 = n C n C 1 m ˙ C R T s t p o u C p a n C 1 n C 1 1 η p C
where n C is the polytropic index, m ˙ C is the compressed air mass flow rate through the compressor, R is the perfect gas constant and T s t is the storage temperature. In addition, p o u C , p a and η p C are the outlet pressure, the inlet atmospheric pressure and the polytropic efficiency of the compressor, respectively.
An alternative to increase the compression ratio consist to combine several single-stage or use directly a multi-stage compressor. The WDCAS software uses identical compression ratio for each stage of the compressor π i C , it can be expressed as follows:
π i C = p 1 p a = p 2 p 1 = p 2 p 3 = = p N C ( = p o u C ) p N C 1
where N C is the number of compressor stages.
Equation (15) shows the resulting ratio between the outlet and atmospheric pressure for the whole compressor.
π C = p o u C p a = π i C N C
The WDCAS software considers the p o u C identical to the storage pressure p s t and its value should be provided by the user. Equation (16) below defines the relation between the multi-stage compressor power P C and the compressed air mass flow rate.
P C = n C N C n C 1 m ˙ C R T s t p o u C p a n C 1 n C N C 1 1 η p C
P C also can be expressed as the wind power surplus P W T e x adjusted with respect to the electric efficiency η e W T of the WT and the transmission efficiency η t r between the electric motor and the compressor, as presented in Equation (17).
P C = P W T e x η e W T η t r = P W T P L o a d η e W T η t r

2.2.5. Storage Tank

A tank is used under pressure air storage. For a given t s t e p , it supplies the compressed air flow required to supercharge the diesel generator and to balance the load power demand. In Equation (18), the capacity of a storage unit m ˙ u is defined under the assumption that maximum efficiency of diesel generators of about η D G 56 % can be achieved for an air/fuel ratio of λ 53 .
m ˙ u = λ P L o a d a v e η D G P C I
The total volume of the storage system is calculated in Equation (19).
V s t = N u n i t m a x m ˙ u R T s t p s t
where the maximum number of storage units required is a constant defined as:
N u n i t m a x = N D a u t o · 24 · 3600 t s t e p 1 hour
Here N D a u t o is the number of days in which the system will be able to operate without wind power generation and in supercharged mode. This parameter should be provided by the user.

2.3. Definition of the System Operating Modes

WDCAS performance is evaluated according to the operating strategy chosen by the user (e.g., wind penetration level, compressed air stored in the reservoir, etc.). For each case, the developed computer model is enabled to determine system operational parameters over a complete year. It is well known that diesel generator performance declines when it operates below the critical threshold, it means at 30% of their nominal power rate. This condition is considered to be true for all possible scenarios in the WDCAS software. In addition, the use of wind power to generate electricity is privileged by the system. Thus, if wind power production is at its lowest for a given load profile, diesel generators are used to fill the gap.
In this study, three operating modes are considered: diesel only (D-only), wind–diesel (WD) and wind–diesel with compressed air energy storage (WDCAS). According to the operating modes, the WDCAS software determines the number of diesel generator units required. Equation (21) is used when the system operates with wind turbines and diesel generators.
N B D G = P L o a d P W T P D G n o m + 1
In the case when the system operates in WDCAS mode, the operation strategy is based on load profile, available power generation sources and compressed air level (Equation (1)). For instance, if an excess of energy is present, then it will be used to store compressed air into the reservoir tank. If a surplus of energy accumulates in the ESS, then WDCAS software balance power demand and storage capacity to ensure proper energy management at the load side. An outline of the decision algorithm is illustrated in Table 2.

2.4. Case Study

The data for the case study corresponds to a mining camp located in a remote area in Newfoundland and Labrador, Canada. This site belongs to a company providing rail transportation services between the cities of Sept-Îles and Schefferville in Northern Quebec. The camp is open seven months per year, from May to November and it is unconnected to the main grid. Energy consumption varies according to daytime and season, the main loads are for lighting, heating, auxiliary equipment and water pumping station.
Figure 2 shows load and wind speed data under study. Figure 2a illustrates the annual average load profile of Esker camp. Real power data is obtained directly from the stand-alone hybrid system. The average load power is 19.9 kW, the lowest and upper consumption levels are 7 kW and 50 kW, respectively. These values determine the wind–diesel system configuration used for comparison. Figure 2b illustrates the monthly average wind speed data obtained from Environment Canada in a neighboring site of Esker camp. The annual average wind speed at 10 m above ground level is 5.1 m·s−1. As wind speed probability distribution values are unknown, a Weibull function with a shape parameter of two (Rayleigh distribution) is considered.
By using load and wind speed data, WDCAS software calculates the optimal system configuration. It also determines time and frequency of operation for each power source, fuel consumption and energy dissipation. In this case, the wind–diesel system is composed of five Model D13-2 12 kW diesel generators from Caterpillar and one wind turbine (WT) BWC Excel-S Bergey. At two different levels of wind power penetration (40% and 80%), the hybrid system uses two and four wind turbines, respectively. Table 3 summarizes data used for simulation.

3. Results And Discussion

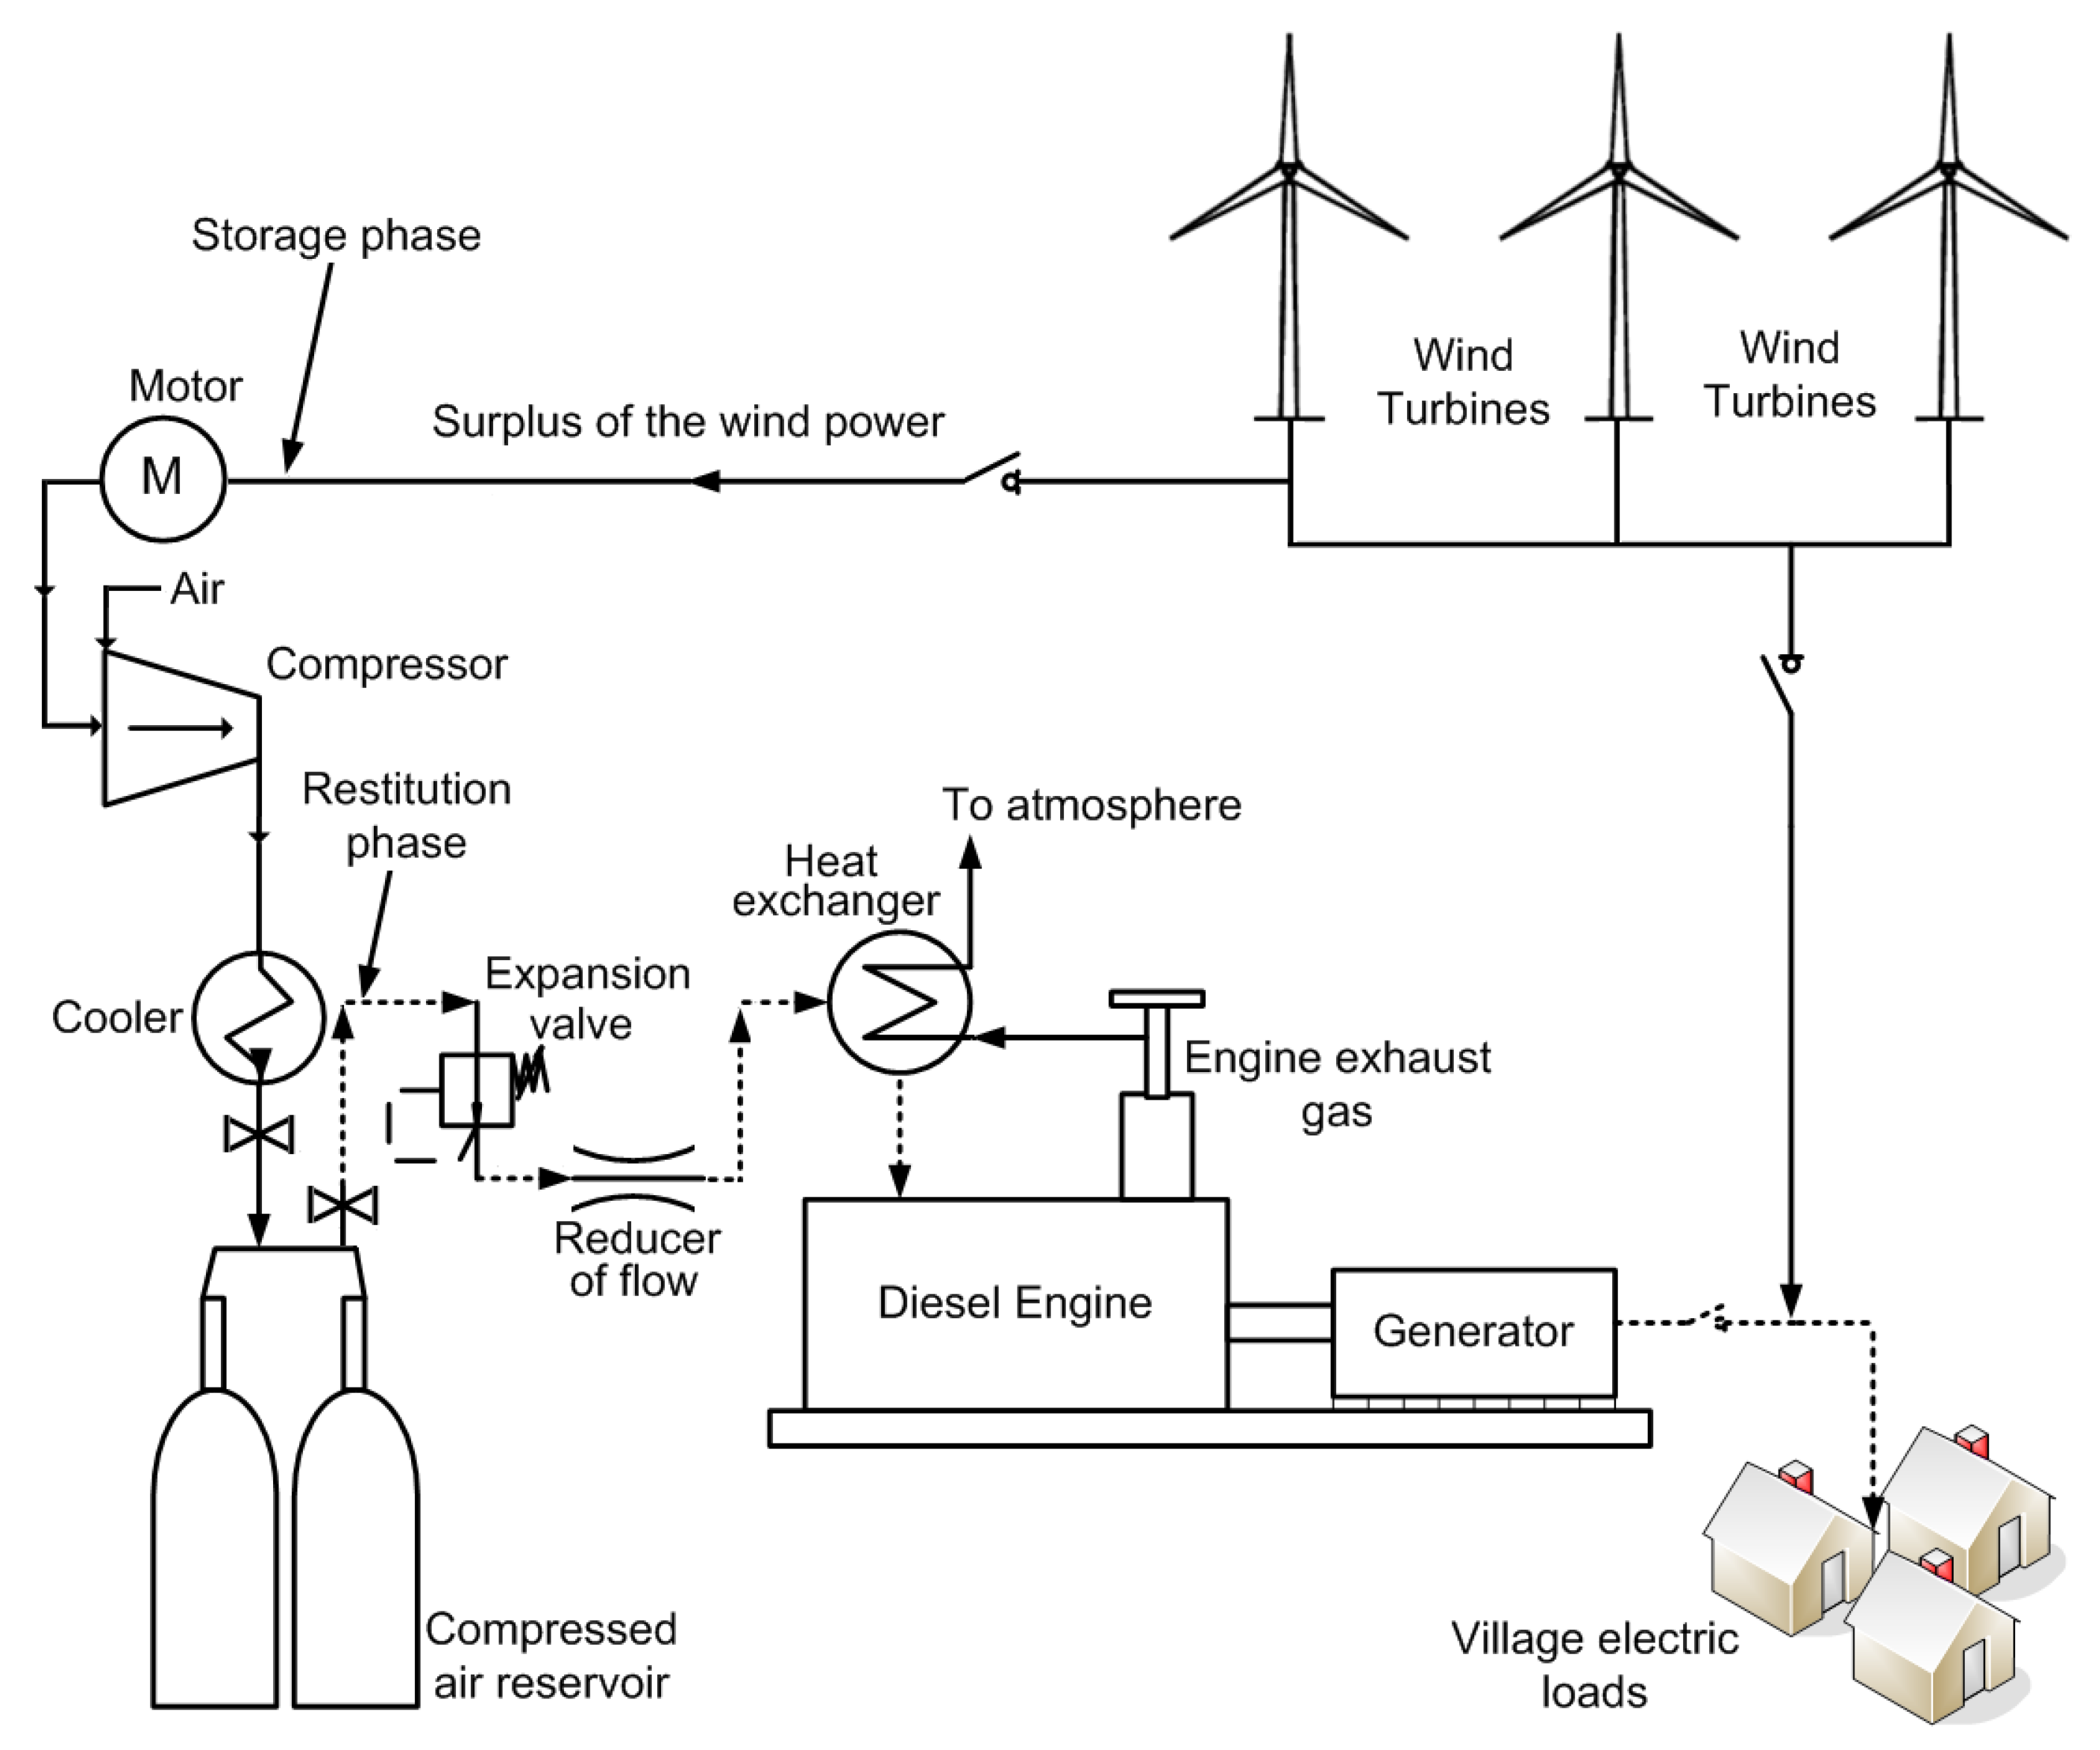
3.1. WDCAS and HOMER Software Comparison Results

In this section, WDCAS and HOMER software are compared for a given wind–diesel hybrid system. WD operation mode is used to compare the accuracy of the estimations. This point is relevant since there is no software available to compare WDCAS operating mode. Indeed, HOMER does not allow simulating compressed air storage as ESS, nor diesel overcharging as operating strategy. Additional parameters like fuel consumption, diesel power generation, engine operating frequency, wind power generation and total wind energy captured by turbines were used to validate the simulation results. Table 4 and Table 5 summarize findings at 40% and 80% WPPR.
As shown in Table 4, the WDCAS simulation results were very close to those obtained with HOMER software. At 40% WPPR the percentage difference is less than 10 while at 80% WPPR is about 21%. This discrepancy may be due to the operating strategies defined in the configuration phase of the system. More precisely, unlike HOMER, WDCAS software allows the use of critical threshold at diesel generator subsystem level; it was fixed at 30% of nominal power. However, in both cases the operating strategies exhibit similar behavior when compared on the total wind energy captured by turbines. Furthermore, it should be noticed that WPPR is a performance indicator directly related to fuel consumption, at 80% WPPR turns in over 5000 L fuel consumption reduction.
In Table 5 the previous observations are confirmed. Despite a slight difference found between both software, the percent operating frequency for each diesel generator is reliable. WDCAS software has proven to be effective for model design, analysis and optimization of wind–diesel hybrid systems. Although simulation results were validated for WD operating mode, it is assumed similar accuracy will be obtained by adding CAES to the system.

3.2. WDCAS Software Validation under Ideal Conditions

In this section, the WDCAS software is used to assess the performance of a wind–diesel hybrid system with compressed air energy storage. The data presented in the case study of the Section 2.4 is used to evaluate the feasibility of the proposed hybrid system.
Simulations are carried out under “ideal” operating conditions to determine the system performance improvements by adding CAES [2,18,19]. The following assumptions characterize the operating strategy:
  • Assuming ideal conditions, there is not limit on the required storage capacity of the tank;
  • The overall power dissipated by the ESS is null, it means that the excess of power is used by the storage unit;
  • For an ideal compressor, the power losses are diminished since motor/compressor efficiency is 100%, as well as the mechanical losses as polytropic efficiency is 100%;
  • Compression performance improvement is achieved when increasing the number of compressor stages;
  • The compression is done under the following conditions: the outdoor air pressure is equal to 1 bar, the storage temperature is set at 20 C and the polytropic index of air at room temperature is n c = 1.3 .
In accordance with the above-mentioned points, model input parameters are presented in Table 6. Simulation results of the proposed hybrid system operating under ideal conditions are illustrated in Figure 3, Figure 4, Figure 5 and Figure 6.
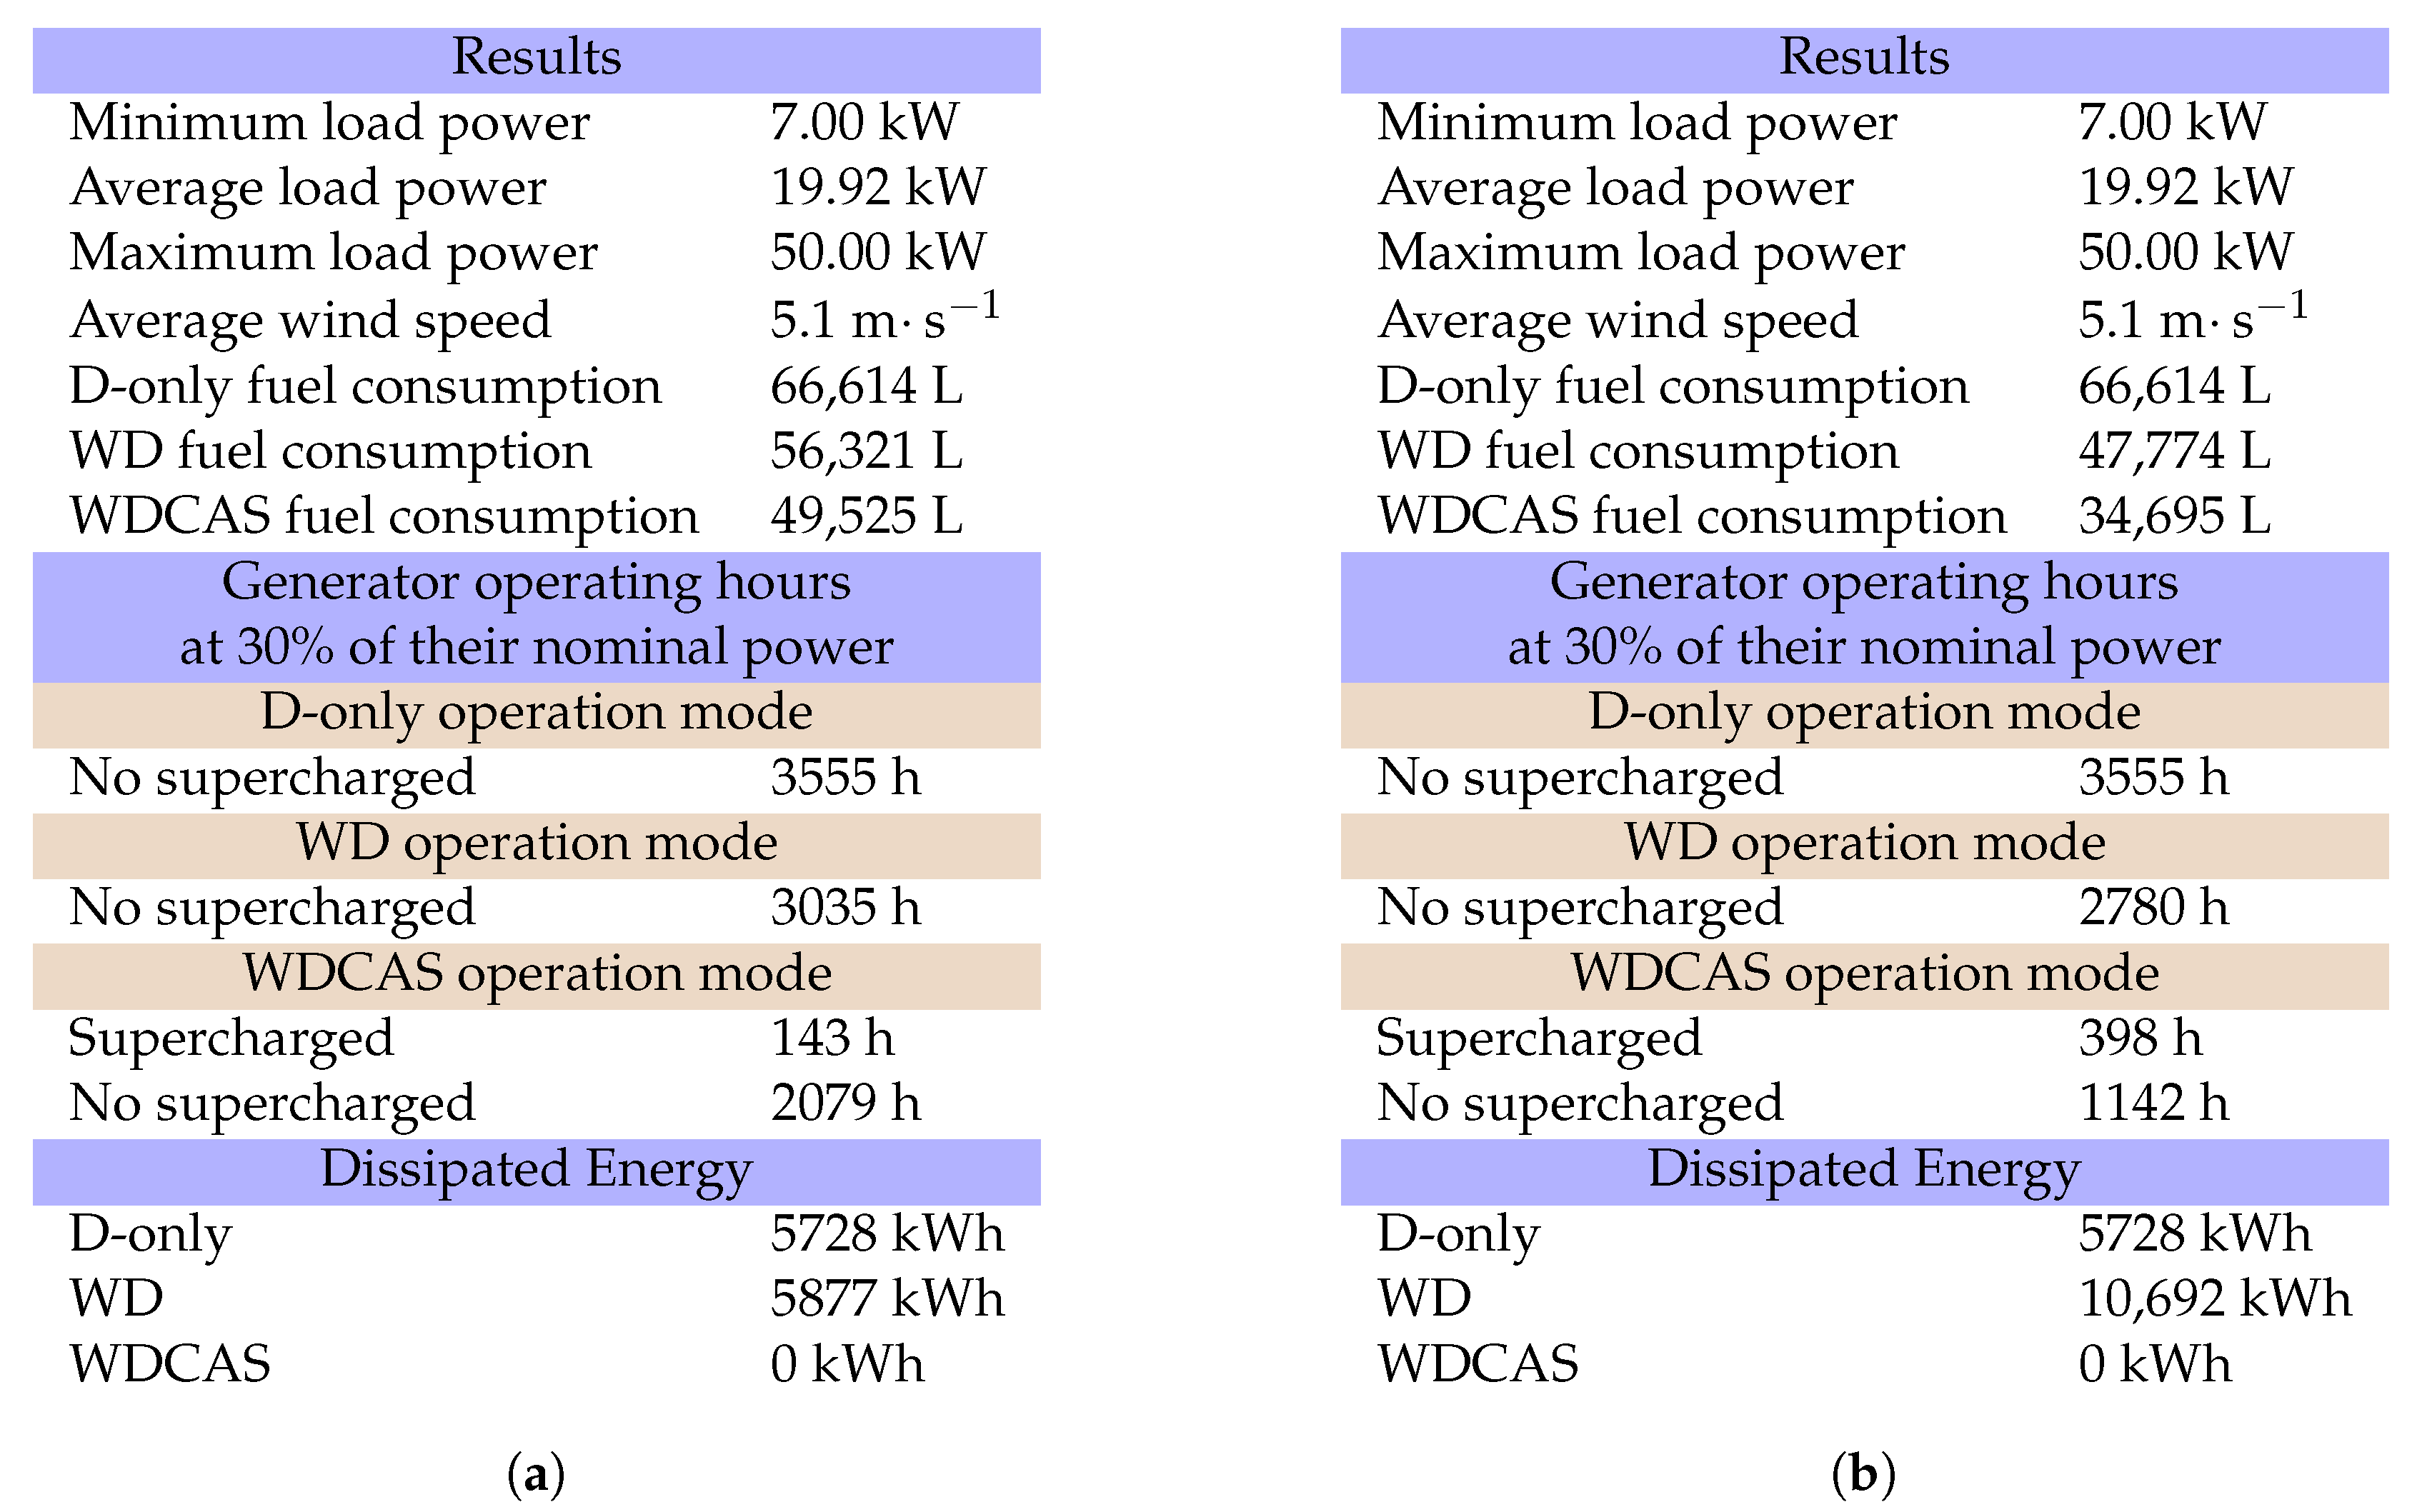
Significant improvements are obtained when adding CAES to the hybrid system. As Figure 3 indicates, at 40% WPPR, the WDCAS requires 49,525 L of fuel comparing with 56,321 L and 66,614 L required by the wind–diesel and the diesel only operating modes, respectively. Thus, fuel savings up to 12% and 25.6% are obtained by using WDCAS instead of WD or D-only modes. Moreover, approximately 14,830 L of fuel are saved at 80% WPPR. Finally, under ideal conditions no power is dissipated and when available, the power surplus is used to compress the air in the storage tank.
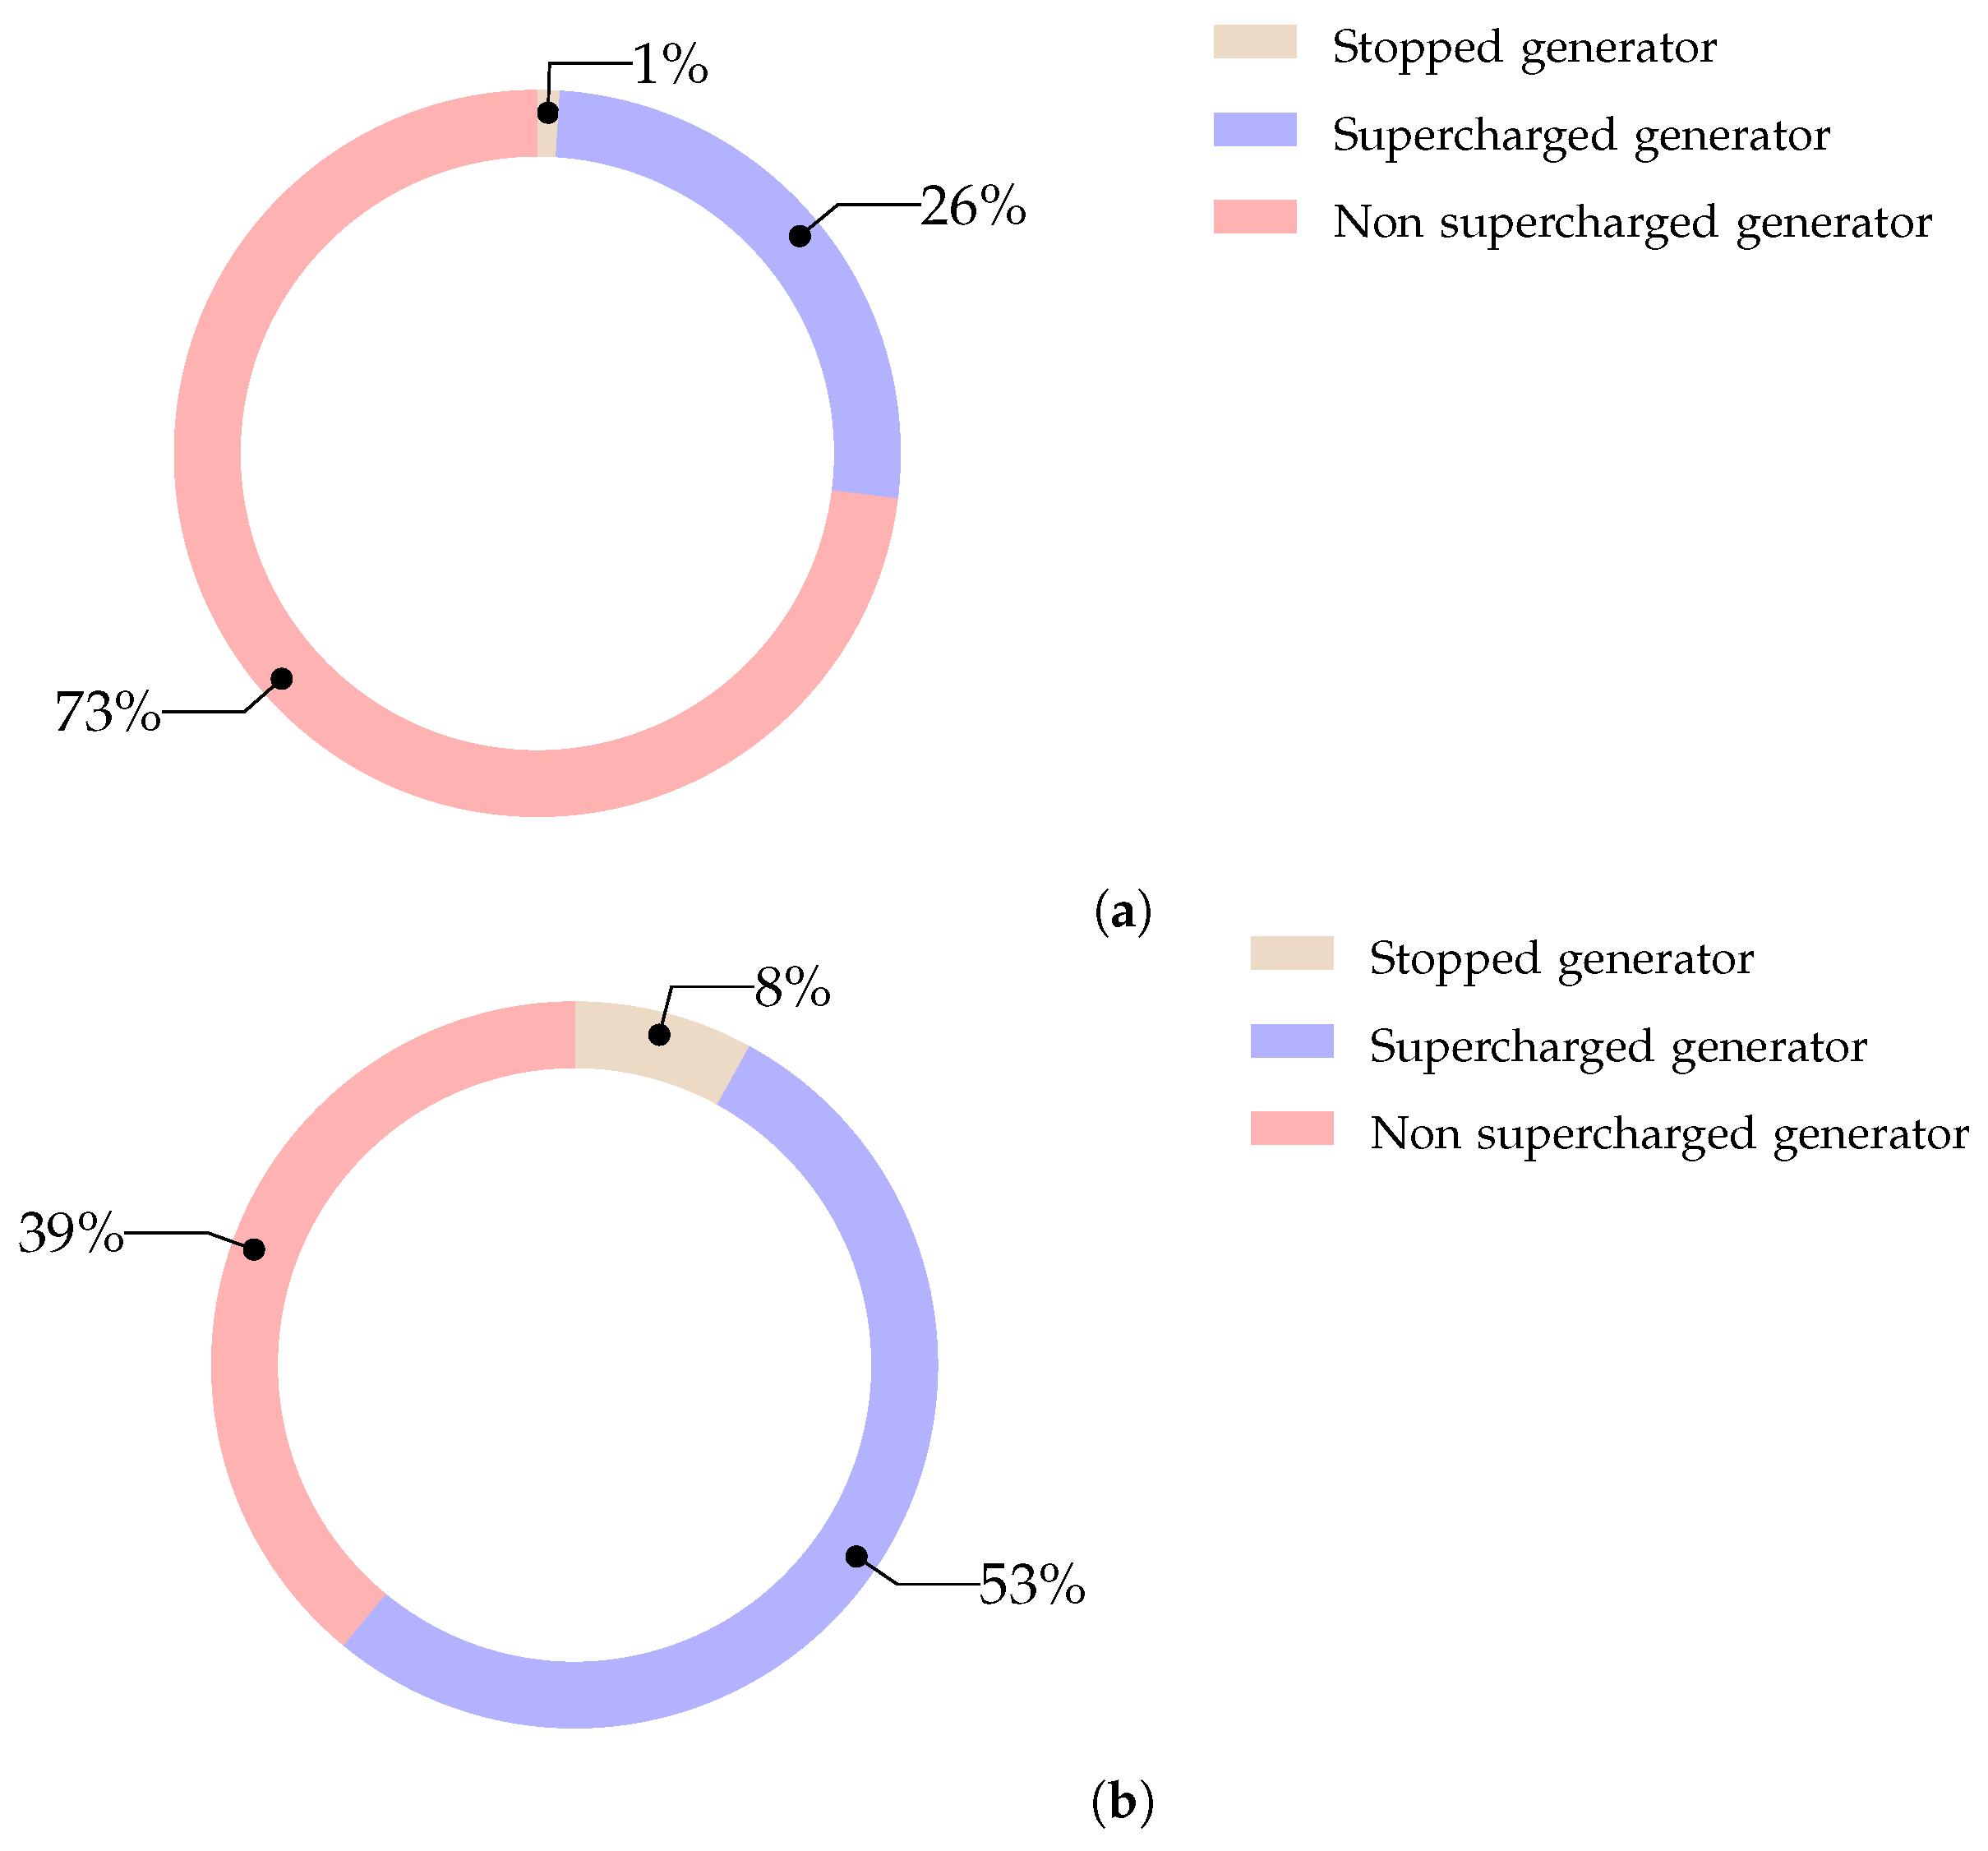
Figure 4 shows that at 40% WPPR, diesel generators require about 26% of the time in supercharged mode against 73% in normal operation mode and 1% they are stopped. In contrast, at 80% WPPR, diesel generators operate about 53% of the time in supercharged mode against 39% in normal mode and 8% they are completely stopped. At 80% WPPR, diesel generators operate in supercharged mode for more than half of the time. Fuel savings up to 27% and 61% are obtained at 40% and 80% WPPR when comparing with diesel only mode.
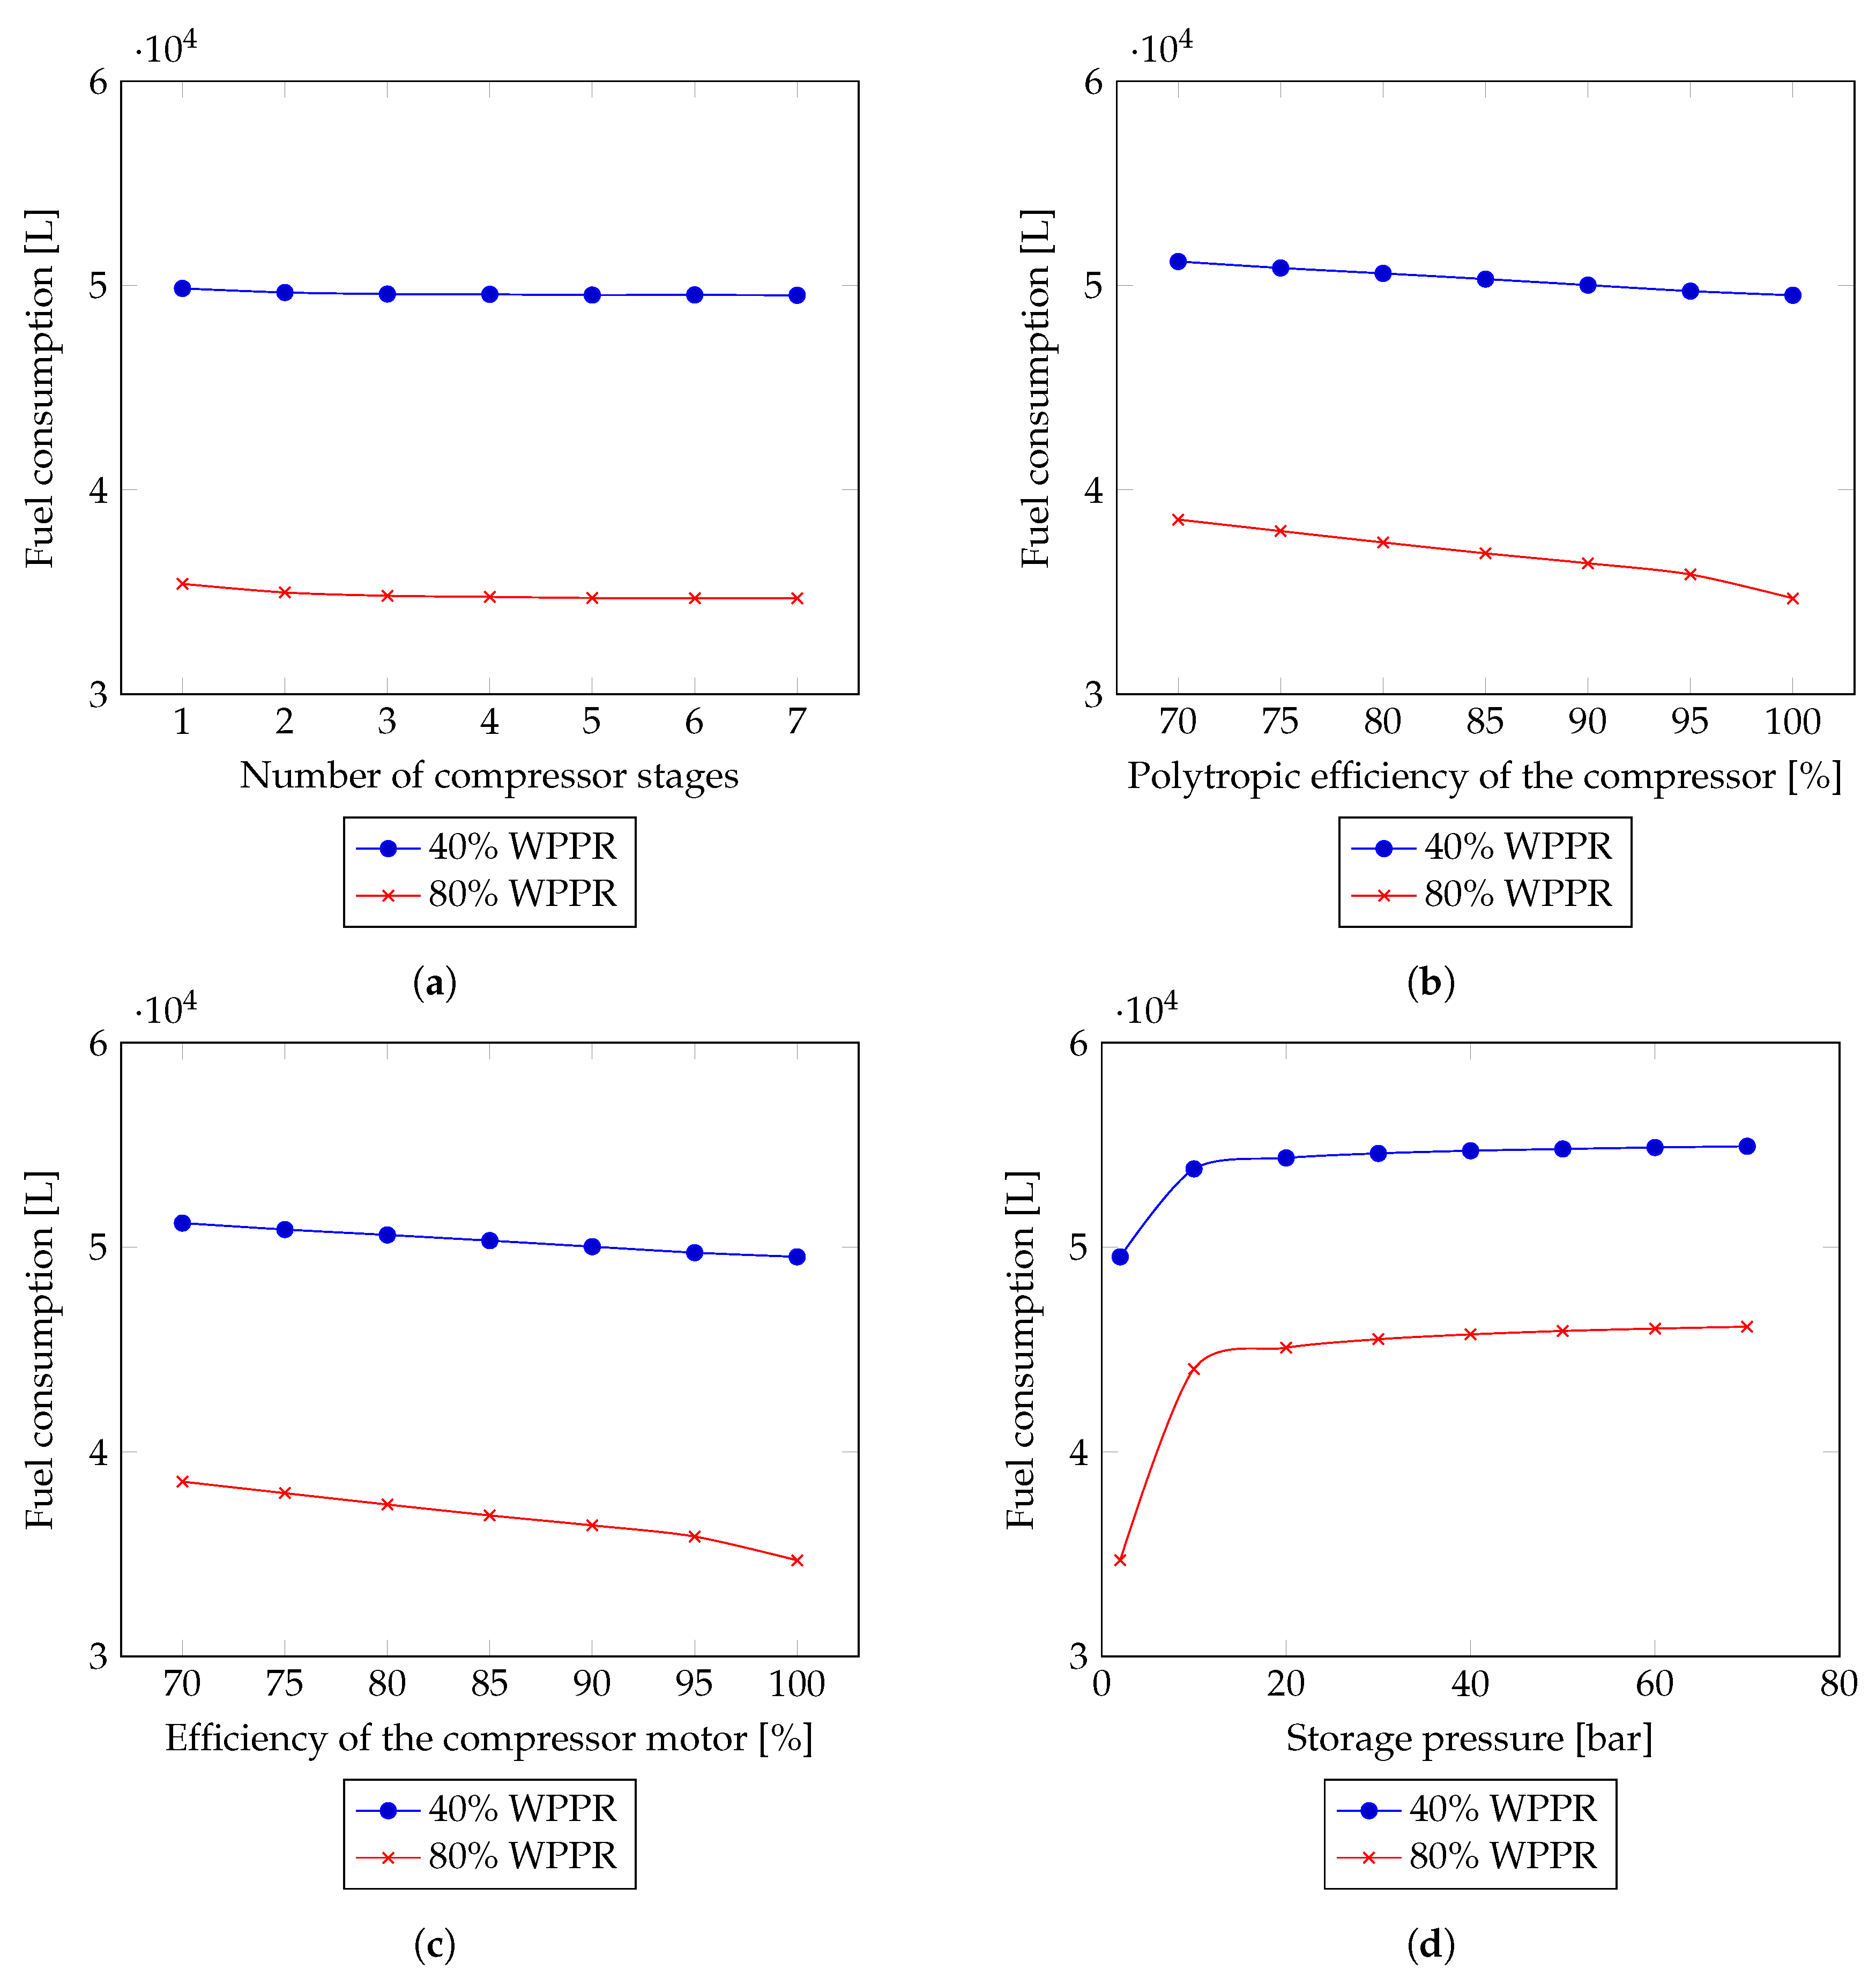
Figure 5 shows the parameter influence on fuel consumption. As can be seen from Figure 5a, diesel fuel consumption is gradually reduced with an increase in the number of compressor stages. The same behavior is observed for both WPPR values. However, at 80% WPPR the fuel consumption is diminished by 15,000 L. From a technical and economic perspective, the use of five stage compressor is considered optimal since the impact on fuel consumption seems not significant beyond this value. Figure 5b shows that the fuel consumption decreases almost linearly with an increase between 70% and 100% compressor efficiency. This behavior is mathematically consistent with Equation (13), where the power consumed by the compressor is inversely proportional to the polytropic efficiency. It should be noticed that fuel consumption significant decrease at 80% WPPR. A similar influence on fuel consumption is observed when varying the compressor motor efficiency, as shown in Figure 5c. Currently, most of the compressors available on the market are rated at close to 95% efficiency and between 75–85% polytropic efficiency [20]. As indicated in Figure 5d, fuel consumption is affected by the storage pressure, more precisely by the volume of the storage tank. Thus, an increase in the storage volume (corresponding to low storage pressure) results in lower fuel consumption. Fuel consumption is negligible after a certain applied pressure. Therefore, a storage pressure between 40 and 50 bars represents a viable option, in both technical and economic terms.
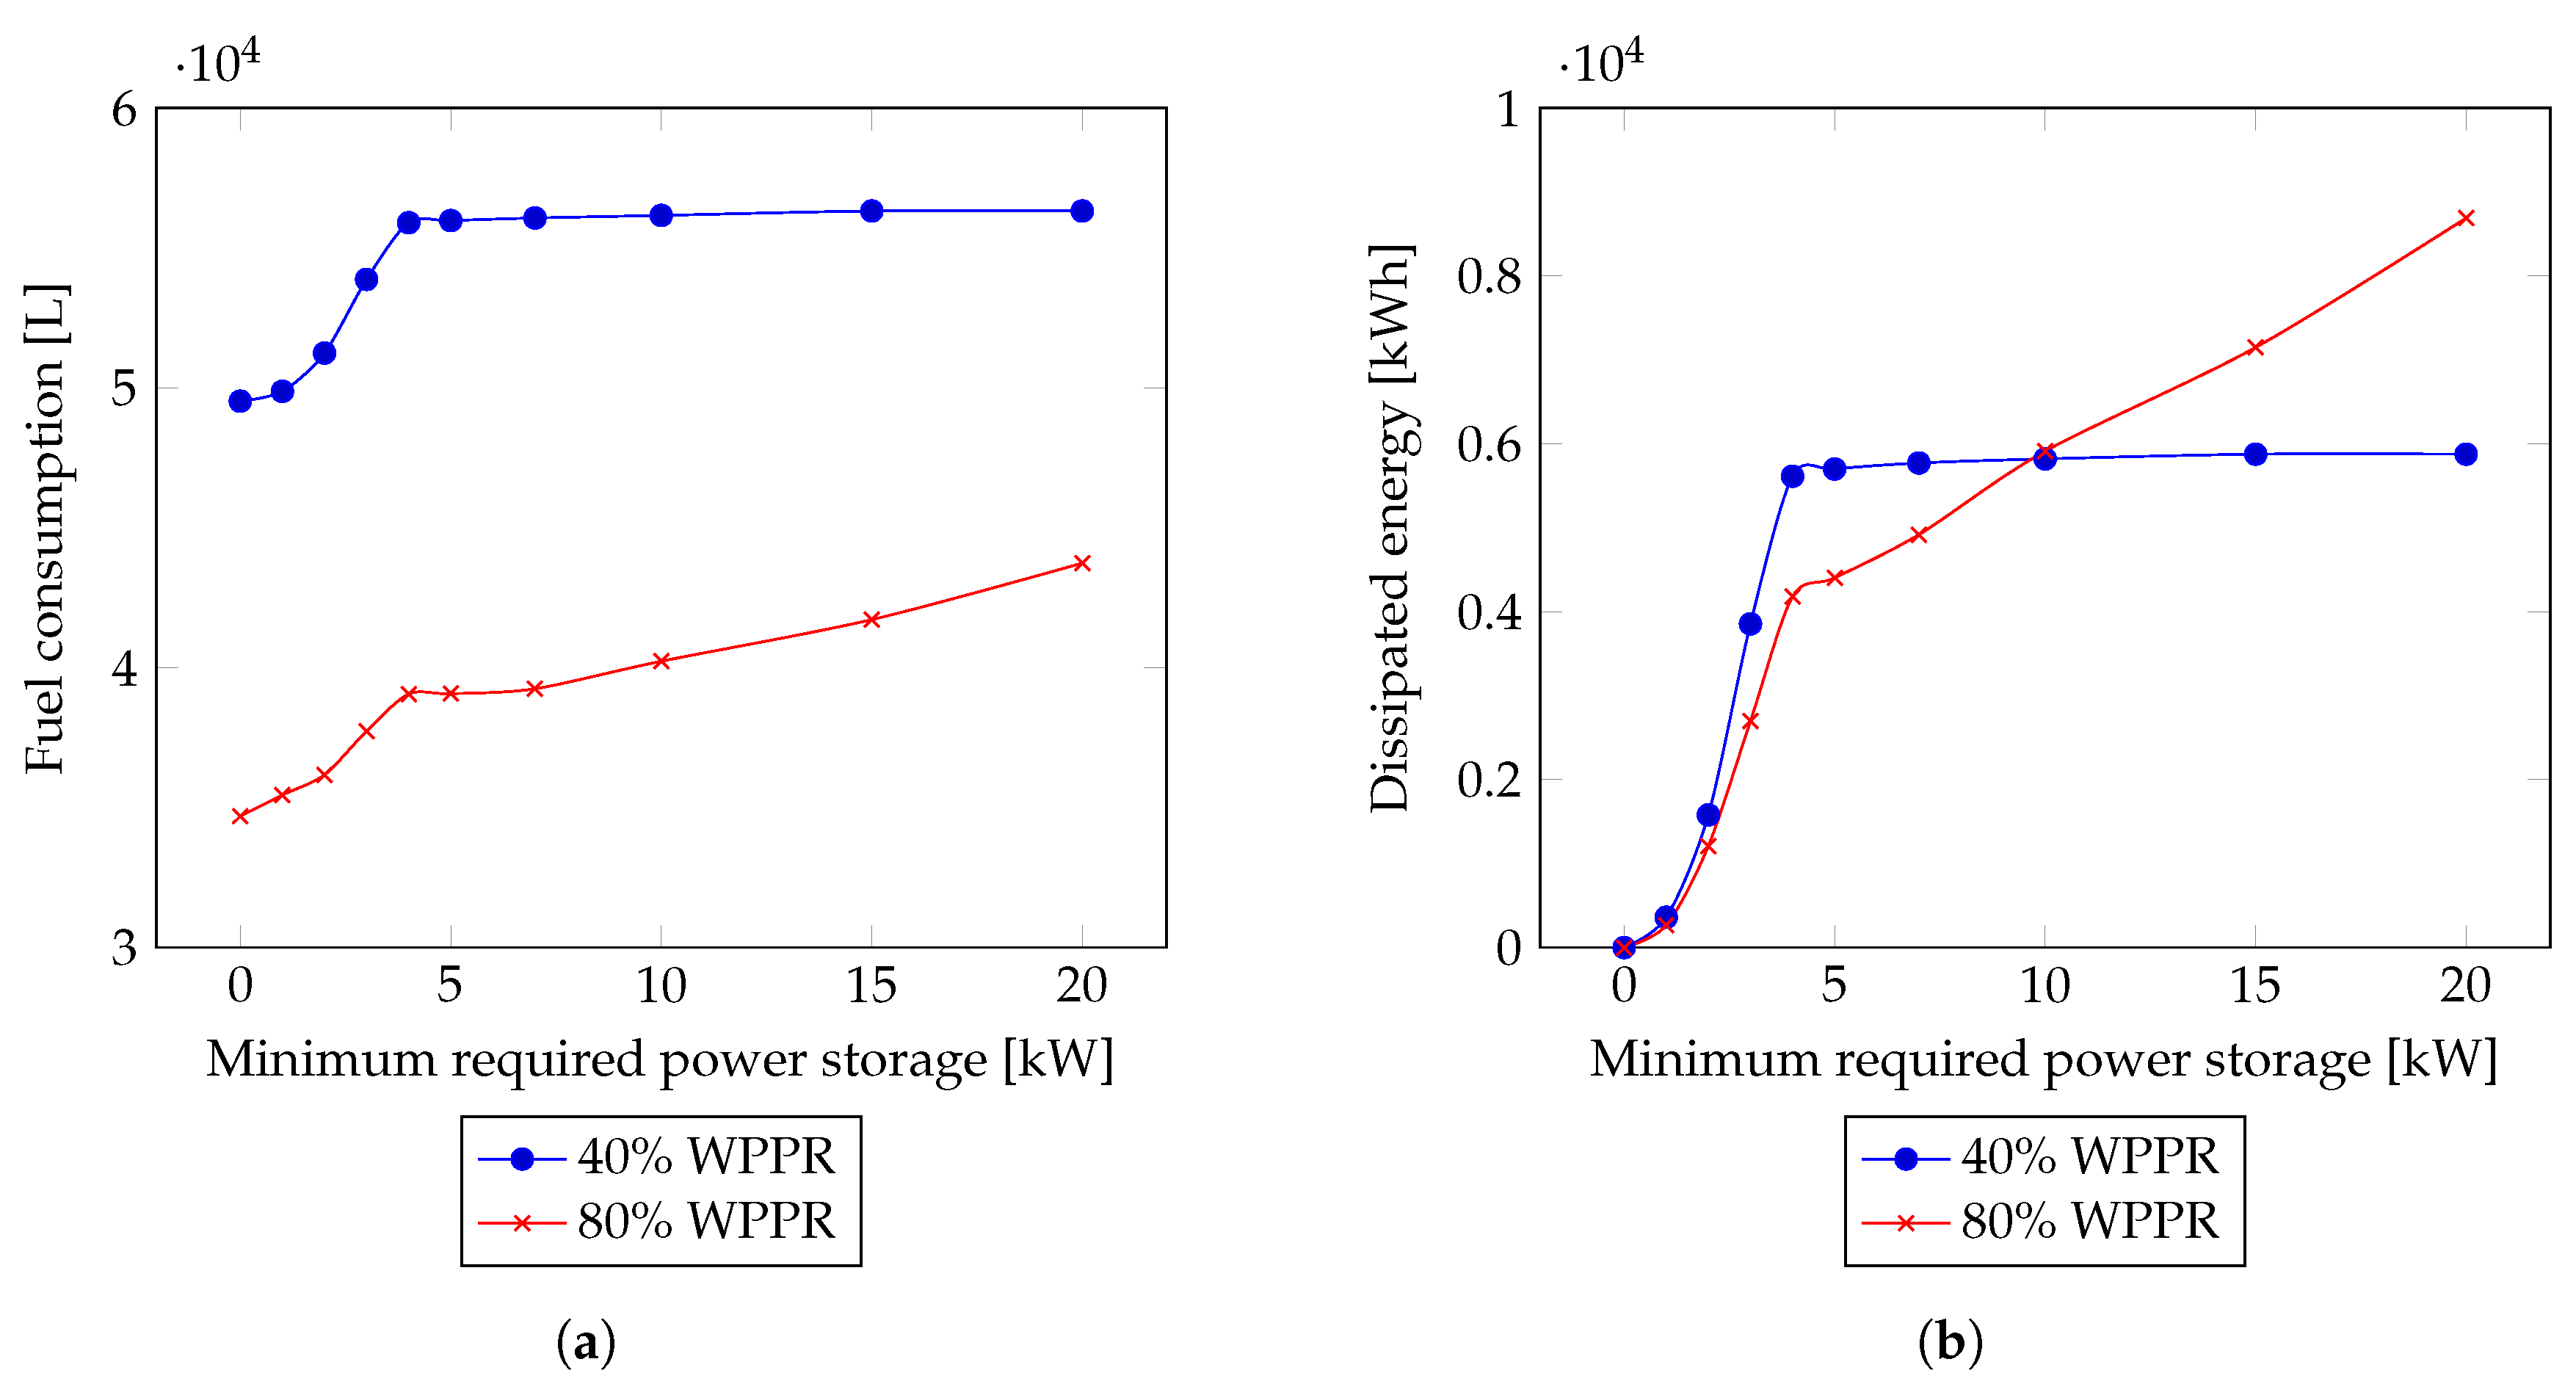
Figure 6 highlights the dependency of the minimum power required to start up the compressor against to the fuel consumption and the dissipated energy. Thus, an increase on this value reflects higher fuel consumption and hence a lower level of compressed air stored. Moreover, dissipated energy originates when wind power production is insufficient to operate the compressor, when the diesel generator operates at a higher regime than required or when the ESS is full. In this case, a dump load must be added to ensure power balance according to Equation (1).
In summary, CAES parameters have significant influence on the hybrid system performance, as their selection affects the overall fuel consumption and the power generation efficiency. Moreover, the storage pressure has an impact on the volume of the storage tank, which in turns is a techno-economic criterion for optimal sizing design.

3.3. WDCAS Software Validation

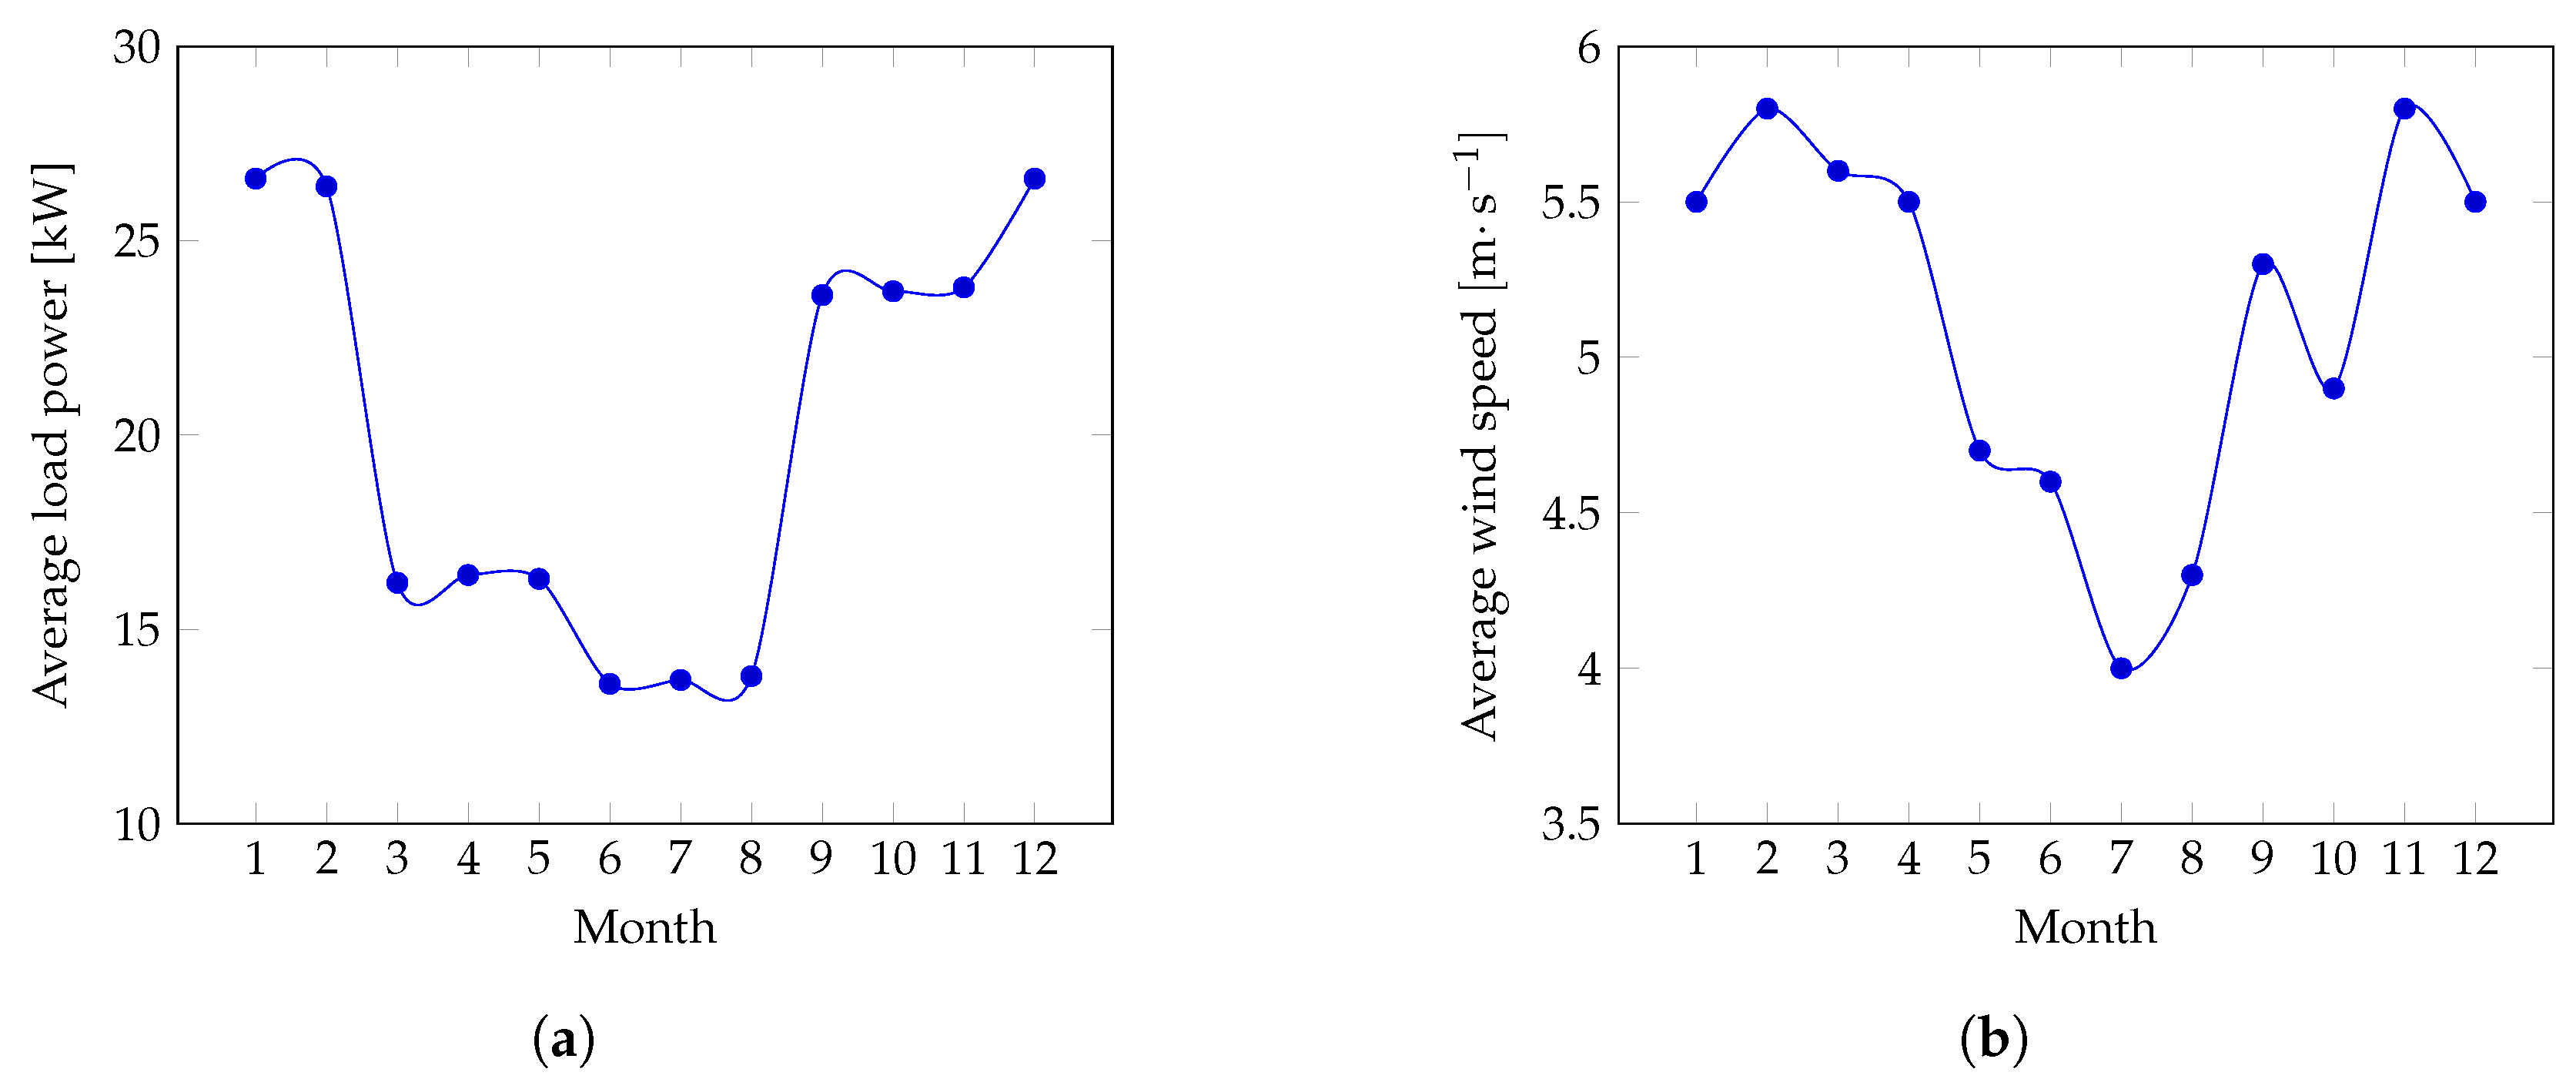
In this section, a new scenario is proposed. The influence of CAES parameters on the operating time of diesel generators is used as key criteria to assess the impact of the ESS in operation costs and GHG emissions. Data presented in Table 3 is used for simulation. A new WPPR of 120% is considered, it corresponds to 60 kW of installed wind turbines (six turbines Bergey BWC Excel-S—10 kW). WDCAS performance is analyzed as function of average wind speed at 5.1 m · s 1 and 6.5 m · s 1 .
Table 7 summarizes the input parameters used to study WDCAS performance. Simulation results of the proposed scenario are presented in Figure 7, Figure 8 and Figure 9.
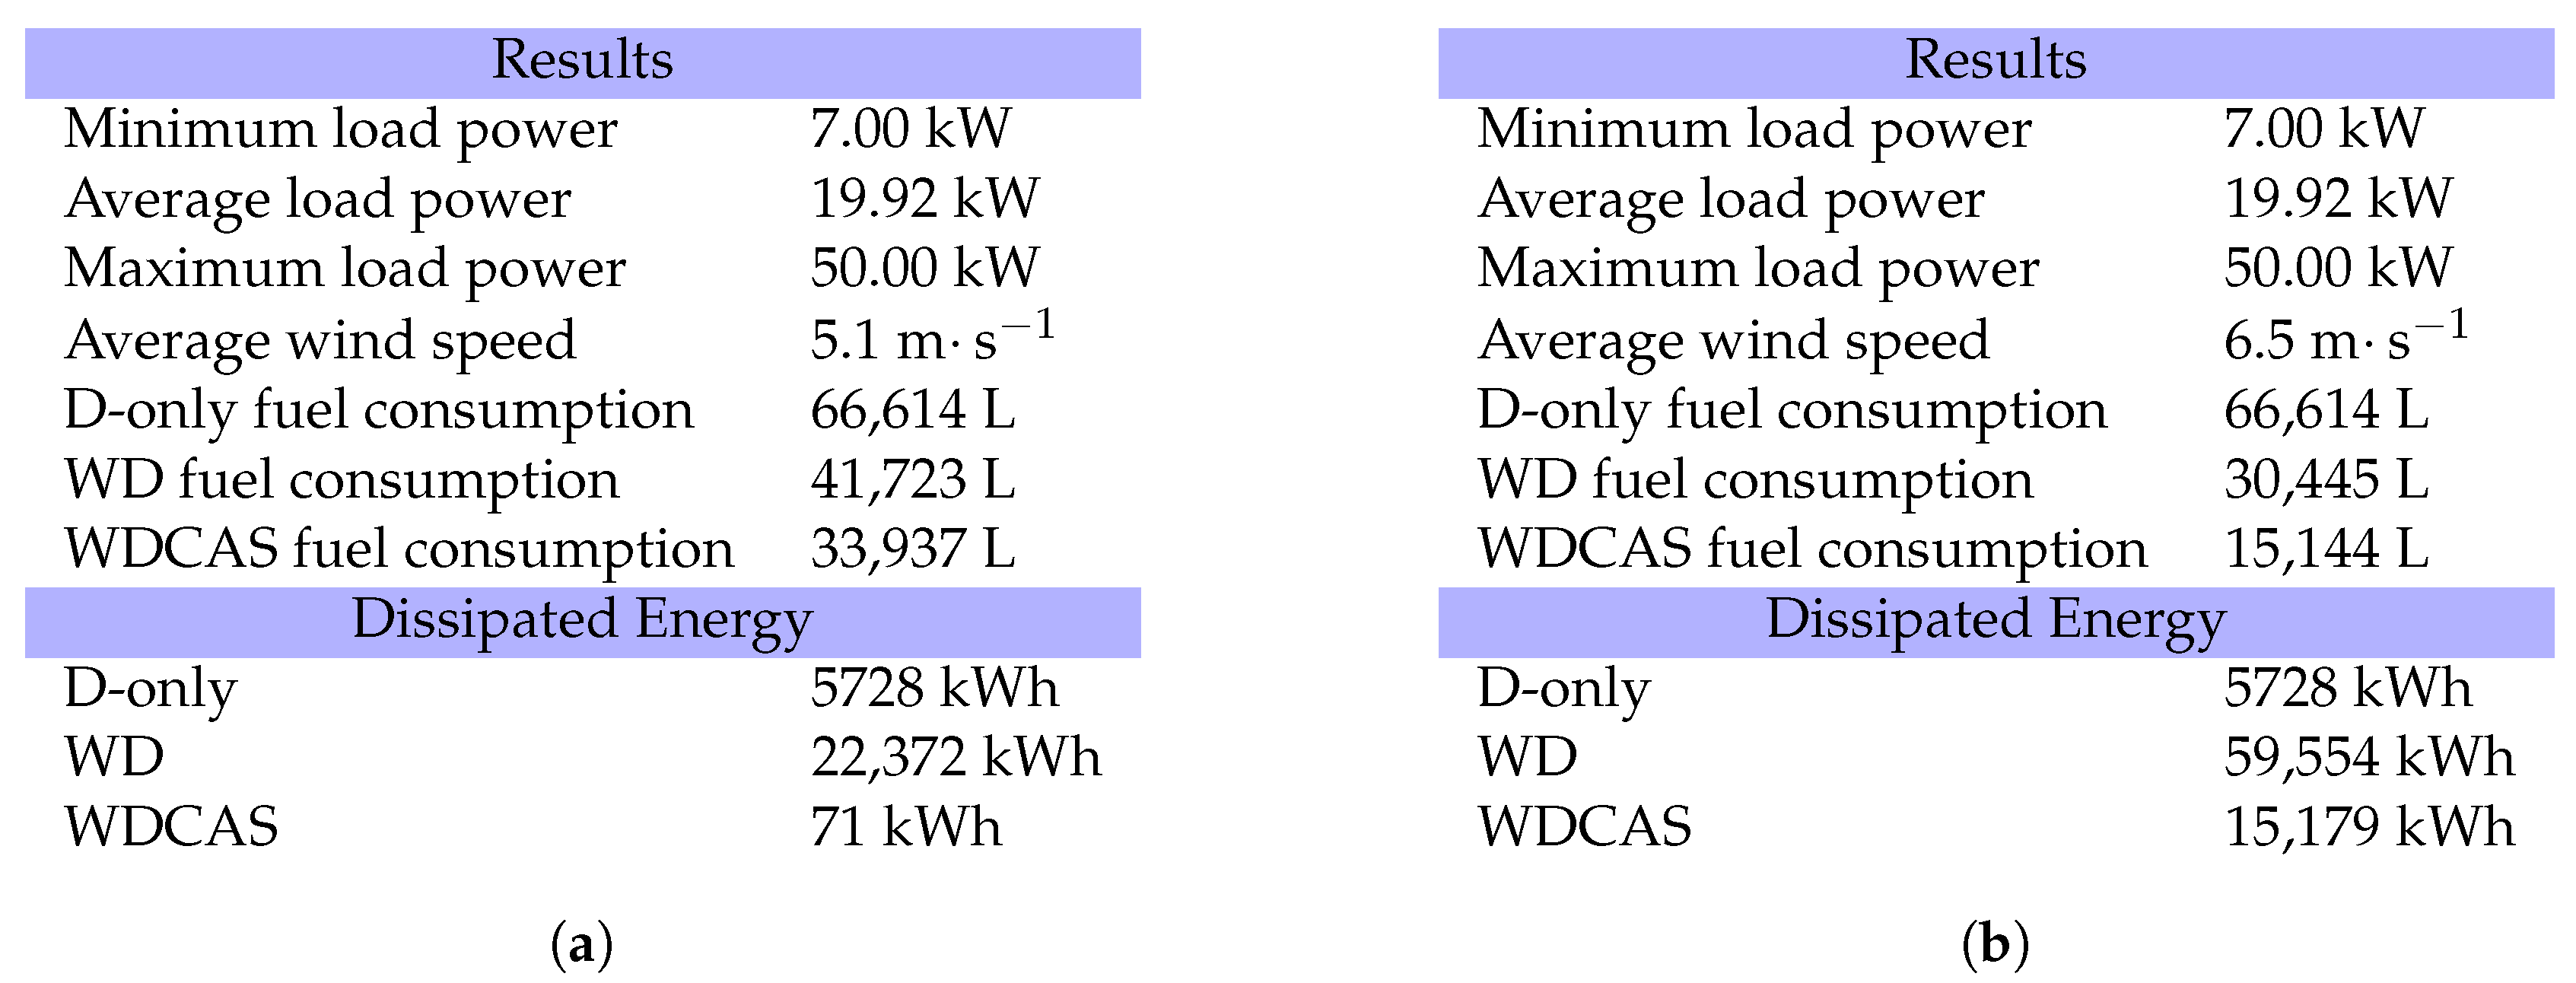
Figure 7 compares the obtained results from the proposed scenario, wherein the WPPR is fixed at 120% and the average wind speed is variable. In WDCAS operating mode with an average wind speed of 5.1 m · s 1 , the hybrid system requires 33,937 L of fuel comparing with 41,723 L and 66,614 L required by the wind–diesel and the diesel only operating modes, respectively. Thus, fuel savings up to 18.7% and 49.1% are obtained by using WDCAS instead of WD or D-only operation modes. Moreover, the hybrid system at an average wind speed equal to 6.5 m · s 1 requires 15,144 L, 30,445 L and 66,614 L to operate in WDCAS, WD and diesel only operation modes. Hence, 50.3% and 77.3% of fuel savings are obtained by adding the ESS. In both cases, the used of CAES exhibits a significant reduction of dissipated power. However, the WPPR in conjunction with the high growth rate of the dissipated energy suggests an insufficient storage volume at an average wind speed of 6.5 m · s 1 .
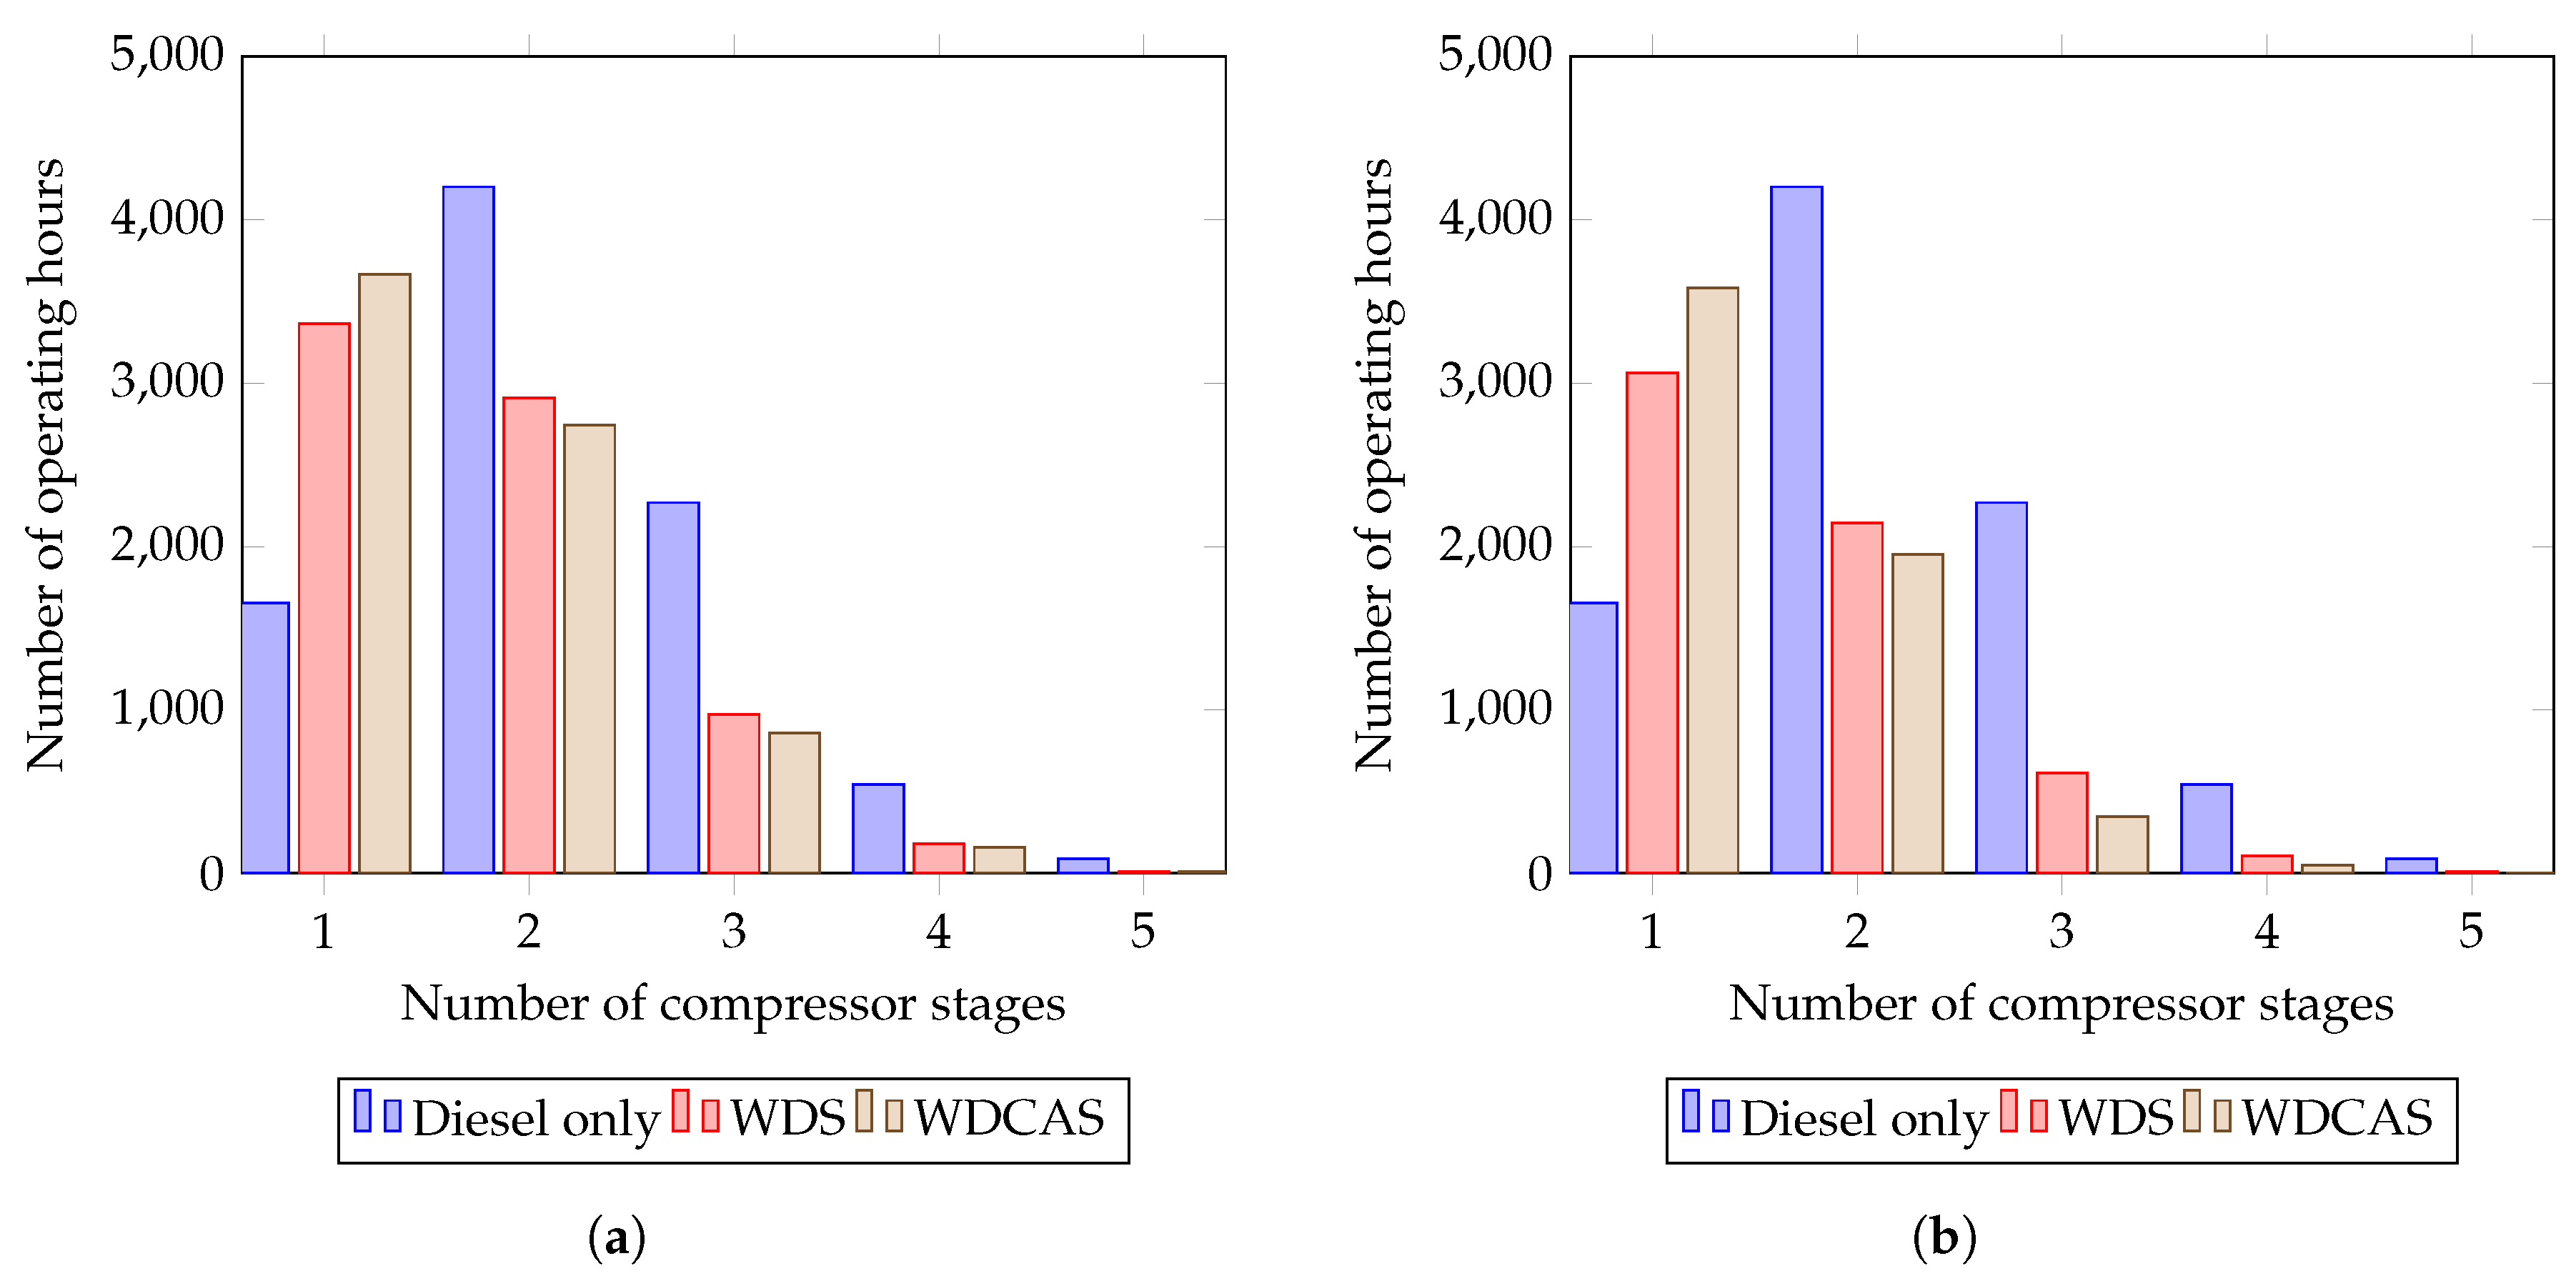
A comparison of the diesel generators operating time, in hours, versus the different operating modes is shown in Figure 8. In this case, most of the time two generators out of the five installed are suitable to provide the required power balance. It is also possible to eliminate at least one diesel generator in each case.
The previous results reveal the impact of the average wind speed and the WPPR on fuel economy and system efficiency. In places where the average wind speed is not high enough and the WPPR is low, the implementation of CAES is not suitable. 
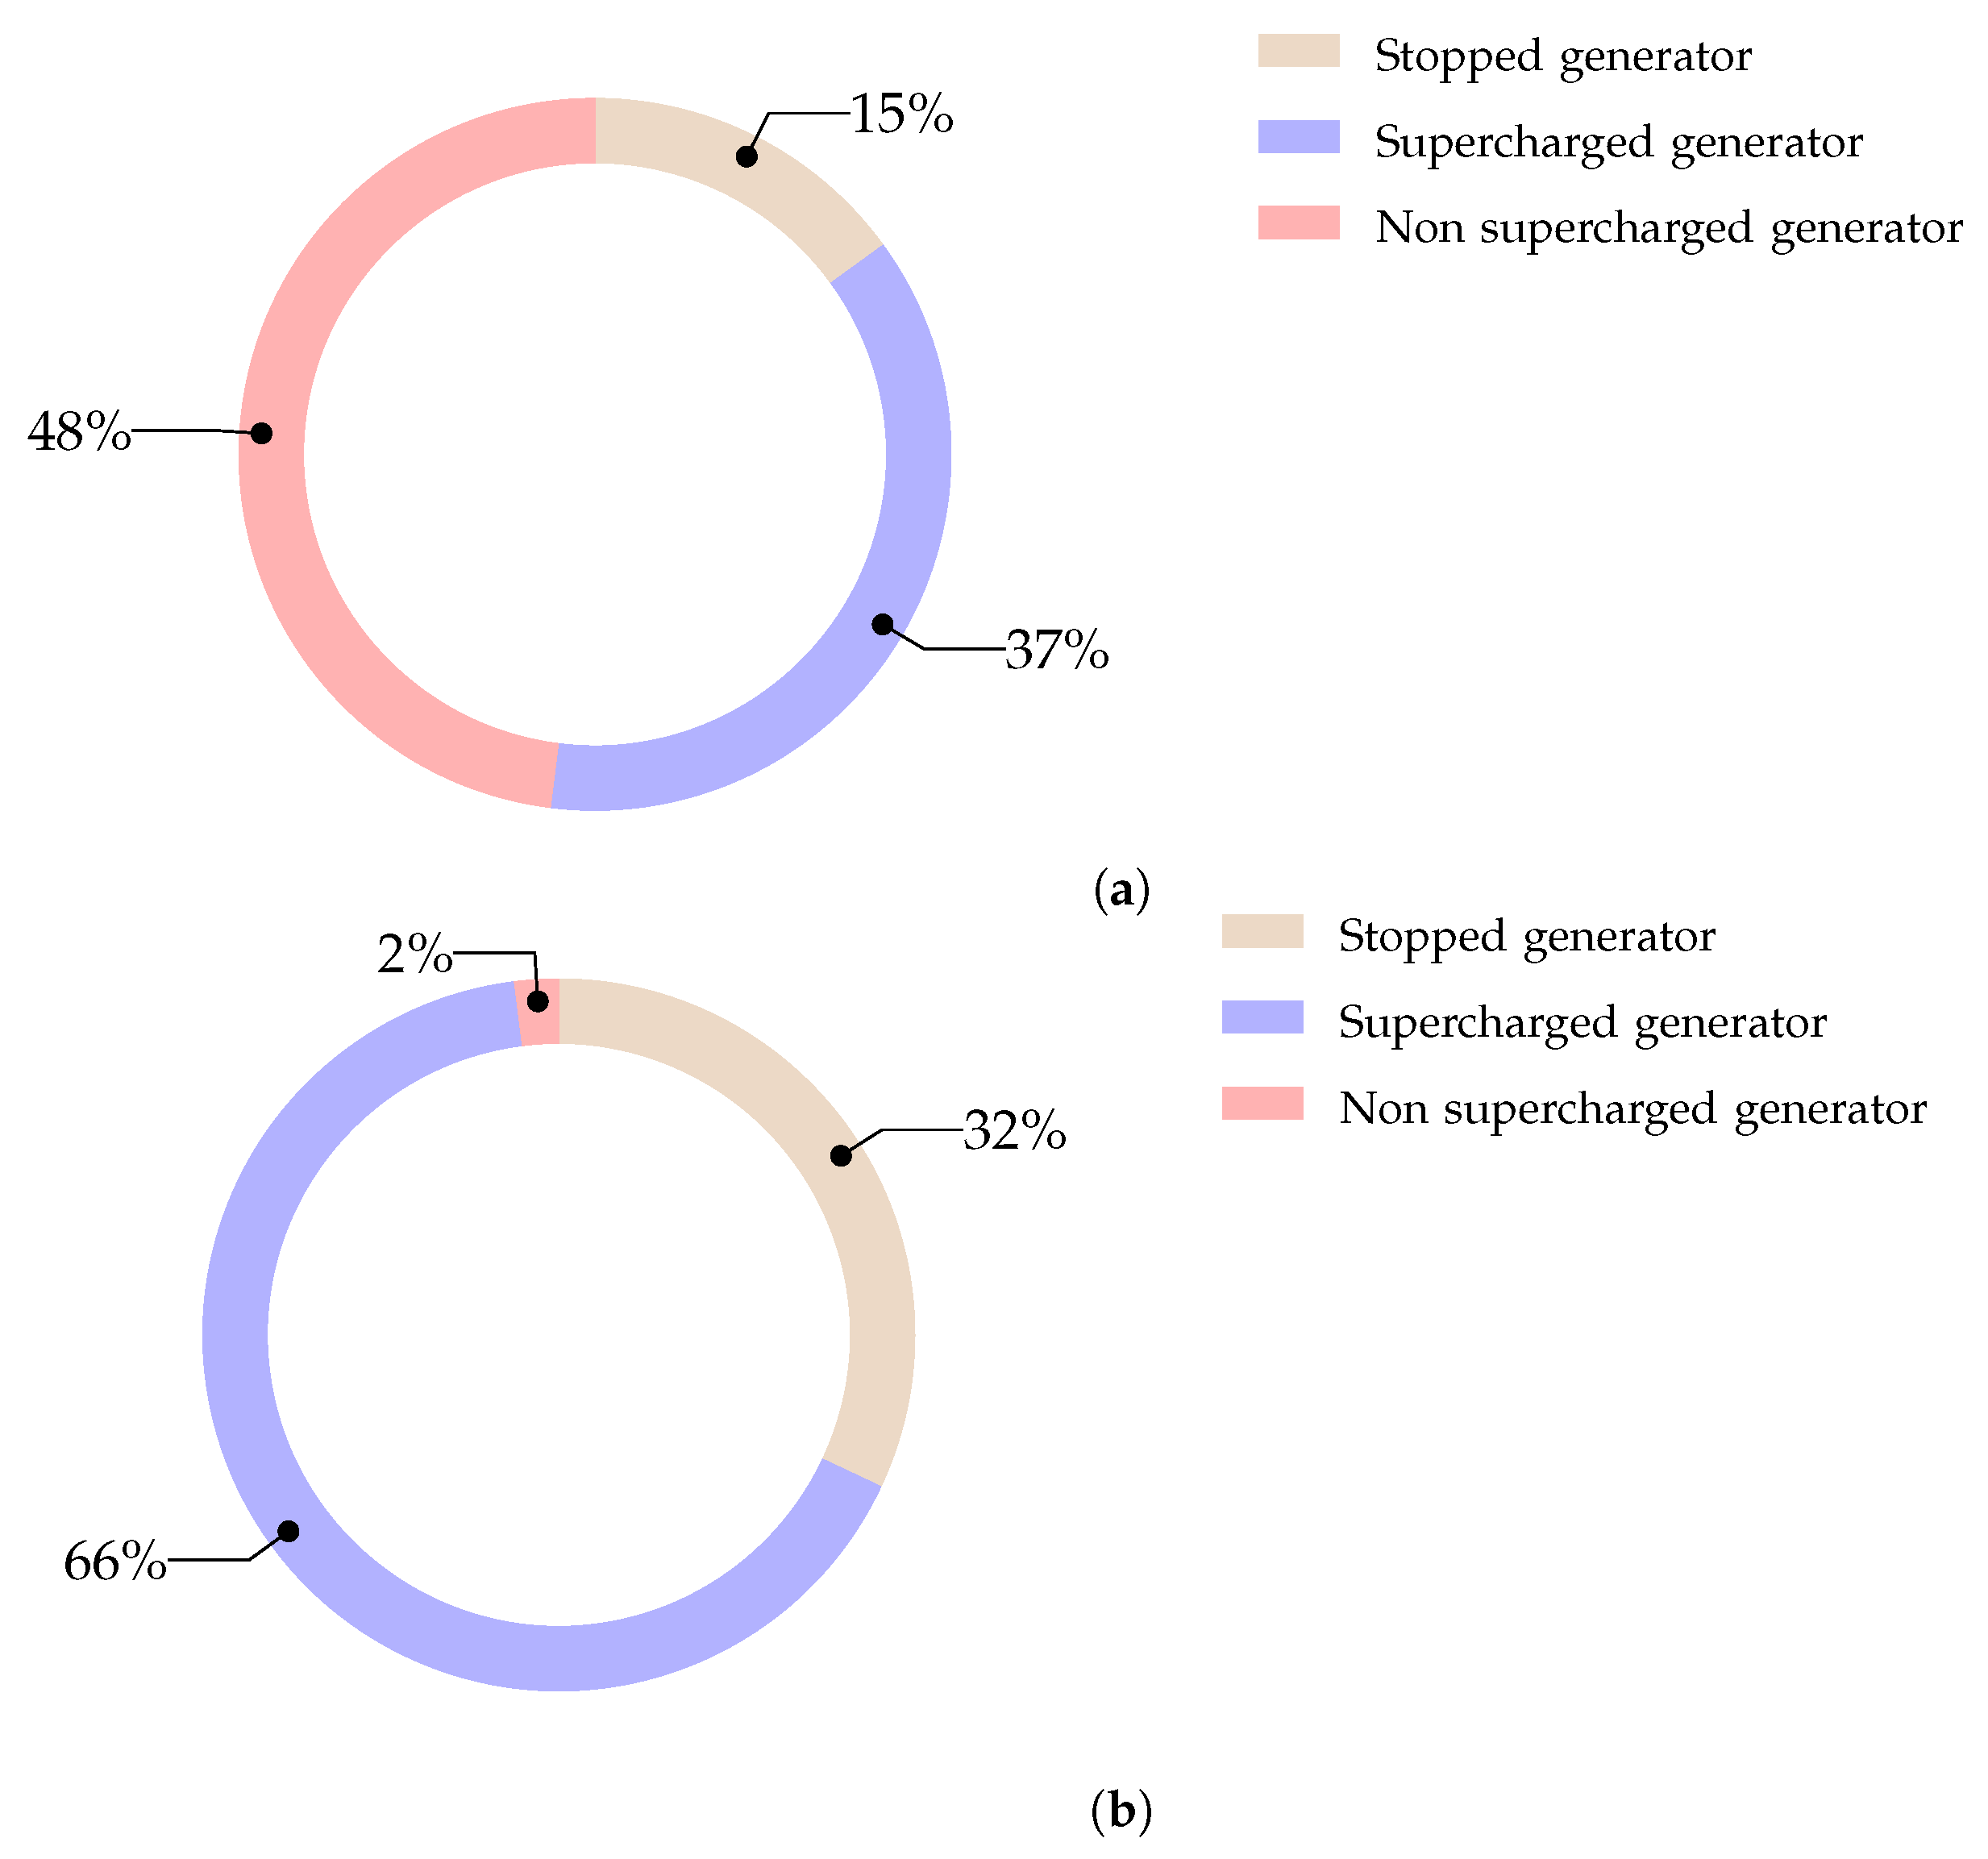
Figure 9 illustrates the time of use of the diesel generator for each operating mode. At 120% WPPR, the diesel generator operates in supercharged mode 37% and 66% of the time for an average wind speed of 5.1 m · s 1 and 6.5 m · s 1 , respectively. When the wind power produced exceeds the load demand, the diesel generators are stopped about 15% and 32% of the time.

4. Conclusions

A computer model for design and analysis performance of a wind–diesel hybrid system with compressed air storage has been developed. The mathematical models of the major components associated with the WDCAS and the operating strategies have been validated based on real data. The model results have been compared with those obtained from HOMER software. The accuracy of the calculations performed with WDCAS software outweighs the benefits of its use in modeling wind–diesel hybrid systems. In addition, a comparative study was made between three operating modes: diesel only, wind–diesel and wind–diesel with compressed air energy storage in view of parameters optimization. Results suggest that WDCAS is directly dependent on average wind speed and WPPR to determine technical-economic viability of the system operating modes. Further studies are required to evaluate the impact on financial, environmental and risk analysis of adding CAES in a wind–diesel hybrid system.

Author Contributions

Conceptualization, N.M.; Y.B. and A.I.; methodology, N.M.; Y.B. and A.I.; software, N.M.; Y.B. and A.I.; validation, A.I.; H.I.; A.C. and D.R.R; formal analysis, N.M.; Y.B.; A.I. and R.E.S.; investigation, N.M.; Y.B.; A.I. and R.E.S.; resources, A.I.; data curation, N.M. and Y.B.; writing—original draft preparation, N.M.; writing—review and editing, R.E.S.; supervision, A.I.; H.I.; A.C; D.R.R.; project administration, A.I.; funding acquisition, A.I.

Acknowledgments

The authors acknowledge the financial support by the FRQNT (Fonds de Recherche du Québec Nature et Technologies), the MERN (Ministère de l’Énergie et des Ressources Naturelles du Québec) and the Tshiuetin Inc. in the framework of the mining development program.

Conflicts of Interest

The authors declare no conflict of interest.

Nomenclature

The following abbreviations are used in this manuscript:
Abbreviations
CAESCompressed air energy storage
ESSEnergy storage system
GHGGreenhouse gas
HOMERHybrid optimization of multiple energy resources
WDCASWind–diesel hybrid system with CAES
WEPRWind energy penetration rate
WPPRWind power penetration rate
WTWind turbine
Greek Letters
α Wind shear coefficient
η e W T Electric efficiency of the WT
η D G Efficiency of the diesel engine
η p C Polytropic efficiency of the compressor
η t r Transmission efficiency between the engine and the compressor
λ Stoichiometric air/fuel ratio
π C Total compression ratio
π i C Compression ratio for each stage
ρ a Air density
Symbols
AFuel consumption parameter
BFuel consumption parameter
cScale parameter describing the height of a Weibull distribution
C P W T Power coefficient
E L o a d Annual load demand of the system
E v ¯ w Total amount of wind energy produced annually
f ( v w ) Weibull density probability function
h 0 Reference height
h W T WT hub height
kShape parameter describing the variation of a Weibull distribution about the mean
m ˙ c Compressed air mass flow rate through the compressor
m ˙ f D G Fuel mass flow injected in the cylinders of the internal combustion engine
m ˙ i n D G Air mass flow entering the engine
m ˙ u Capacity of a storage unit
N B D G Number of diesel generators
N B W T Number of wind turbines
n c Polytropic index
N C Number of compressor stages
N D a u t o Number of days of autonomy
N u n i t m a x Maximum number of storage units
p a Inlet atmospheric pressure of the compressor
P C 1 Single-stage compressor power
P C Multi-stage compressor power
P C A E S Compressed air energy storage power
P C A E S m i n Minimum compressed air energy storage power
P C I Lower calorific value of the fuel
P L o a d Load power
P L o a d a v e Average load power
P L o a d m a x Maximum load power
P L o a d m i n Minimum load power
P D G Diesel generator power
P D G n o m Nominal power of the diesel generator
p o u C Outlet pressure of the compressor
p s t Storage pressure
P W T Wind power
P W T a Wind power generated for a specific WT
P W T e x Wind power surplus
P W T m a x Maximum wind power
RPerfect gas constant
S W T Swept area
T s t Storage temperature
t s t e p Time step
V s t Total volume of the storage system
v w Wind speed
v 0 w Wind speed at a reference height
v ¯ w Average wind speed

References

  1. Ibrahim, H.; Younès, R.; Ilinca, A.; Ramdenee, D.; Dimitrova, M.; Perron, J.; Adegnon, M.; Boulay, D.; Arbez, C. Potential of a Hybrid Wind-Diesel-Compressed air system for Nordic Remote Canadian Areas. Energy Procedia 2011, 6, 795–804. [Google Scholar] [CrossRef] [Green Version]
  2. Chauhan, A.; Saini, R.P. A review on Integrated Renewable Energy System based power generation for stand-alone applications: Configurations, storage options, sizing methodologies and control. Renew. Sustain. Energy Rev. 2014, 38, 99–120. [Google Scholar] [CrossRef]
  3. Abdelkafi, A.; Krichen, L. Energy management optimization of a hybrid power production unit based renewable energies. Int. J. Electr. Power Energy Syst. 2014, 62, 1–9. [Google Scholar] [CrossRef]
  4. Zhou, W.; Lou, C.; Li, Z.; Lu, L.; Yang, H. Current status of research on optimum sizing of stand-alone hybrid solar–wind power generation systems. Appl. Energy 2010, 87, 380–389. [Google Scholar] [CrossRef]
  5. Ibrahim, H.; Ghandour, M.; Dimitrova, M.; Ilinca, A.; Perron, J. Integration of Wind Energy into Electricity Systems: Technical Challenges and Actual Solutions. Energy Procedia 2011, 6, 815–824. [Google Scholar] [CrossRef] [Green Version]
  6. Weis, T.M.; Ilinca, A. Assessing the potential for a wind power incentive for remote villages in Canada. Energy Policy 2010, 38, 5504–5511. [Google Scholar] [CrossRef]
  7. Mohammed, Y.S.; Mustafa, M.W.; Bashir, N. Hybrid renewable energy systems for off-grid electric power: Review of substantial issues. Renew. Sustain. Energy Rev. 2014, 35, 527–539. [Google Scholar] [CrossRef]
  8. Ma, T.; Yang, H.; Lu, L. A feasibility study of a stand-alone hybrid solar–wind–battery system for a remote island. Appl. Energy 2014, 121, 149–158. [Google Scholar] [CrossRef]
  9. Kaabeche, A.; Ibtiouen, R. Techno-economic optimization of hybrid photovoltaic/wind/diesel/battery generation in a stand-alone power system. Sol. Energy 2014, 103, 171–182. [Google Scholar] [CrossRef]
  10. Dursun, B.; Gokcol, C. The role of hydroelectric power and contribution of small hydropower plants for sustainable development in Turkey. Renew. Energy 2011, 36, 1227–1235. [Google Scholar] [CrossRef]
  11. Yekini Suberu, M.; Wazir Mustafa, M.; Bashir, N. Energy storage systems for renewable energy power sector integration and mitigation of intermittency. Renew. Sustain. Energy Rev. 2014, 35, 499–514. [Google Scholar] [CrossRef]
  12. Ilinca, A.; McCarthy, E.; Chaumel, J.L.; Rétiveau, J.L. Wind potential assessment of Quebec Province. Renew. Energy 2003, 28, 1881–1897. [Google Scholar] [CrossRef]
  13. NASA POWER | Prediction of Worldwide Energy Resources. Available online: https://power.larc.nasa.gov/ (accessed on 10 September 2019).
  14. New European Wind Atlas. Available online: https://map.neweuropeanwindatlas.eu/ (accessed on 10 September 2019).
  15. Global Wind Atlas. Available online: https://globalwindatlas.info/ (accessed on 10 September 2019).
  16. Morales, J.M.; Conejo, A.J.; Perez Ruiz, J. Economic Valuation of Reserves in Power Systems with High Penetration of Wind Power. IEEE Trans. Power Syst. 2009, 24, 900–910. [Google Scholar] [CrossRef]
  17. Basbous, T.; Younes, R.; Ilinca, A.; Perron, J. Pneumatic hybridization of a diesel engine using compressed air storage for wind–diesel energy generation. Energy 2012, 38, 264–275. [Google Scholar] [CrossRef]
  18. Basbous, T.; Younes, R.; Ilinca, A.; Perron, J. Optimal management of compressed air energy storage in a hybrid wind-pneumatic-diesel system for remote area’s power generation. Energy 2015, 84, 267–278. [Google Scholar] [CrossRef]
  19. Budt, M.; Wolf, D.; Span, R. A review on compressed air energy storage: Basic principles, past milestones and recent developments. Appl. Energy 2016, 170, 250–268. [Google Scholar] [CrossRef]
  20. Basbous, T.; Younes, R.; Ilinca, A.; Perron, J. A new hybrid pneumatic combustion engine to improve fuel consumption of wind—Diesel power system for non-interconnected areas. Appl. Energy 2012, 96, 459–476. [Google Scholar] [CrossRef]
Figure 1. Wind-diesel hybrid system with compressed air energy storage technology representation.
Energies 12 03542 g001
Figure 2. Load and wind data in Esker Camp: (a) annual average load profile; (b) average wind speed per month.
Energies 12 03542 g002
Figure 3. WDCAS operating under ideal conditions: (a) at 40% WPPR; (b) at 80% WPPR.
Energies 12 03542 g003
Figure 4. Influence of WPPR on diesel generator operating time: (a) at 40% WPPR; (b) at 80% WPPR.
Energies 12 03542 g004
Figure 5. Parameter influence on fuel consumption: (a) number of compressor stages; (b) polytropic efficiency; (c) compressor motor efficiency; (d) storage pressure.
Energies 12 03542 g005
Figure 6. Dependency on the minimum required power storage: (a) fuel consumption; (b) dissipated energy.
Energies 12 03542 g006
Figure 7. WDCAS software results at 120% WPPR: (a) average wind speed of 5.1 m · s 1 ; (b) average wind speed of 6.5 m · s 1 .
Energies 12 03542 g007
Figure 8. Diesel generators comparison as a function of the number of operating hours: (a) at 120% WPPR; (b) average wind speed of 6.5 m · s 1 .
Energies 12 03542 g008
Figure 9. Correlation between the number of operating hours and the operation mode per diesel generator: (a) at 120% WPPR; (b) average wind speed of 6.5 m · s 1 .
Energies 12 03542 g009
Table 1. Software tools for hybrid renewable energy systems.
SoftwareCountryGoalsEnergy SourceESS
HOMERUSAAnalyzes technical and economic feasibility of hybrid renewable energy systems.Photovoltaic (PV), wind turbine (WT), hydroelectric, diesel generator, biomass.Electrochemical cells, flywheel, hydrogen storage.
RETScreenCANAnalyzes technical, economic and environmental feasibility of hybrid systems.PV, WT, hydroelectric, diesel generator, gas turbine, geothermal, biomass.Thermal storage, hydrogen storage.
JPElecFRAOptimizes steady state stability of power grids.PV, WT, hydroelectric, diesel generator.Electrochemical cells.
Hybrid 2USASizes and analyzes the techno economic impact of hybrid networks with renewable energy.PV, WT, diesel generator.Electrochemical cells.
HySimUSAAnalyzes technical and economic feasibility of hybrid systems.PV, diesel generator.Electrochemical cells.
HySysESPSizes and analyzes off grid hybrid systems.PV, WT, diesel generator.-
Hybrid DesignerZAFAnalyzes technical and economic feasibility of hybrid renewable energy systems.PV, WT, diesel generator.Electrochemical cells.
SOLSIMDEUAnalyzes technical and economic feasibility of hybrid systems.PV, WT, diesel generator, biomass.Electrochemical cells.
TRNSYSUSASimulates transient system behavior.PV, WT, diesel generator.Electrochemical cells.
Table 2. Wind-diesel hybrid system with compressed air energy storage decision algorithm.
CAES P WT = 0 P WT < P Load P WT > P Load
P Load < 0.3 P DG P Load > 0.3 P DG P Load < 0.3 P DG P Load > 0.3 P DG
Full Energies 12 03542 i001 Energies 12 03542 i002 Energies 12 03542 i003 Energies 12 03542 i004 Energies 12 03542 i005
Medium Energies 12 03542 i006 Energies 12 03542 i007 Energies 12 03542 i008 Energies 12 03542 i009 Energies 12 03542 i010
Empty Energies 12 03542 i011 Energies 12 03542 i012 Energies 12 03542 i013 Energies 12 03542 i014 Energies 12 03542 i015
Energies 12 03542 i016No wind power Energies 12 03542 i019Empty air tank Energies 12 03542 i022Generator stopped
Energies 12 03542 i017Partial wind power Energies 12 03542 i020Partially filled air tank Energies 12 03542 i023Generator started
Energies 12 03542 i018Strong wind power Energies 12 03542 i021Full air tank Energies 12 03542 i024Consumption
Table 3. Case study: Simulation data.
ParameterDataDetails
Annual load power P L o a d a v e : 19.9 kW
P L o a d m a x : 50 kW
P L o a d m i n : 7 kW
Annual wind resource v ¯ w : 5.1 m · s 1
Diesel generator power P D G : 5 × 12 kW D13-2 Caterpillar
2 WT at 40% WPPR P W T : 2 × 10 kW BWC Excel-S Bergey
4 WT at 80% WPPR P W T : 4 × 10 kW
Table 4. WDCAS and HOMER software results at two different wind power penetration rate values.
ParameterAt 40% WPPRAt 80% WPPR
WDCASHOMERDifference (%)WDCASHOMERDifference (%)
Fuel consumption (L)56.3257.662.3247.7751.216.71
Diesel generator power (kWh)152.20154.261.33128.88136.555.62
Wind power (kWh)22.2620.428.2651.3240.8520.40
WEPR (%)12.8012.000.8028.4721.706.77
Table 5. Engine operating frequency comparison between WDCAS and HOMER software.
Operating Frequency in %At 40% WPPRAt 80% WPPR
Generator NumberWDCASHOMERDifference (%)WDCASHOMERDifference (%)
144.9046.751.8541.7049.808.10
232.8236.073.2540.6634.795.87
318.5013.704.8014.5912.382.21
43.432.970.462.822.620.20
50.360.520.160.220.420.20
Table 6. WDCAS input parameters under ideal conditions.
ParameterSymbolValue
Number of compressor stages N C 7
Polytropic index n c 1.3
Atmospheric pressure p a 1 bar
Storage temperature T s t 20 C
Polytropic efficiency η p C 100%
Compressor motor efficiency η t r 100%
Minimum required power for storage P C A E S m i n 0 kW
Storage pressure p s t 2 bars
Number of days of autonomy N D a u t o 1000
Table 7. WDCAS input parameters under ideal conditions.
ParameterSymbolValue
Number of compressor stages N C 5
Polytropic index n c 1.3
Atmospheric pressure p a 1 bar
Storage temperature T s t 20 C
Polytropic efficiency η p C 85%
Compressor motor efficiency η t r 95%
Minimum required power for storage P C A E S m i n 1 kW
Storage pressure p s t 10 bars
Number of days of autonomy N D a u t o 7

