Article

Analysis of Coupled Wellbore Temperature and Pressure Calculation Model and Influence Factors under Multi-Pressure System in Deep-Water Drilling

1
College of petroleum engineering, China University of Petroleum-Beijing, Beijing 102249, China
2
College of petroleum engineering, Beijing University of Technology, Beijing 100192, China
*
Authors to whom correspondence should be addressed.
Energies 2019, 12(18), 3533; https://doi.org/10.3390/en12183533
Submission received: 22 July 2019 / Revised: 9 September 2019 / Accepted: 12 September 2019 / Published: 14 September 2019

Abstract

:
The purpose of this paper is to discuss the variation of wellbore temperature and bottom-hole pressure with key factors in the case of coupled temperature and pressure under multi-pressure system during deep-water drilling circulation. According to the law of energy conservation and momentum equation, the coupled temperature and pressure calculation model under multi-pressure system is developed by using the comprehensive convective heat transfer coefficient. The model is discretized and solved by finite difference method and Gauss Seidel iteration respectively. Then the calculation results of this paper are compared and verified with previous research models and field measured data. The results show that when the multi-pressure system is located in the middle formation, the temperature of the annulus corresponding to location of the system is the most affected, and the temperature of the other areas in annulus is hardly affected. However, when the multi-pressure system is located at the bottom hole, the annulus temperature is greatly affected from bottom hole to mudline. In addition, the thermo-physical parameters of the drilling fluid can be changed by overflow and leakage. When only overflow occurs, the annulus temperature increases the most, but the viscosity decreases the most. When only leakage occurs, the annulus temperature decreases the most and the viscosity increases the most. However, when the overflow rate is greater than the leakage rate, the mud density and bottom-hole pressure increase the most, and both increase the least when only leakage occurs. Meanwhile, bottom-hole pressure increases with the increase of pump rate but decreases with the increase of inlet temperature. The research results can provide theoretical guidance for safe drilling in complex formations such as multi-pressure systems.

Graphical Abstract

1. Introduction

Deep water drilling faces problems such as narrow formation pressure window and difficult pressure control. The pressure in wellbore is affected not only by properties of drilling fluid but also by formation and annulus temperature in deep water drilling. At the same time, the pressure variation makes the drilling fluid density change, further affecting the annulus and formation temperature distribution. Therefore, to ensure efficient and safe drilling, the study of coupled wellbore temperature and pressure distribution is also very important in deep water drilling. In addition, the tectonic steep, formation fracture, fault, fracture, and hole development are often encountered in deep water drilling. Under the condition of multi-pressure system, it is easy for overflow and leakage to occur simultaneously in the formation. Because the overflow and leakage exist at the same time, part of the fluid from the annulus goes into the formation, and the fluid from the formation enters the annulus. Then, the corresponding thermo-physical property parameters of drilling fluid in annulus also change, which affects the distribution of temperature and pressure in the wellbore. Therefore, in order to ensure safe and efficient drilling operations, the research on coupled wellbore temperature and distribution under multi-pressure system has highly practical significance.
In recent years, the research methods related to wellbore and formation temperature have been mainly analytical and numerical methods [1]. Ekaterina Wiktorski [2] derived temperature-dependent thermo-physical correlations, which were applied in a wellbore heat transfer model for oil production scenario by considering a complex well architecture. Javad Abdollahi and Stevan Dubljevic [3] simplified the heat transfer model of wellbore fluid into a set of hyperbolic partial differential equations. Then the observability of temperature distribution was discussed by using the methods of characteristic functions and Riemann invariants. R. Hasan and C. S. Kabir [4] discussed a unified approach for modeling heat transfer in various situations that result in physically sound solutions. This modeling approach depends on many common elements, such as temperature profiles surrounding the wellbore and any series of resistances for the various elements in the wellbore. Based on the energy conservation principle and the Modified Raymond, Yang M et al. [5] developed simplified and full-scale models, and the results indicated that wellbore and formation temperatures were significantly influenced at the connection points between the drill collar and drill pipe, as well as the casing shoe. Jia HJ, Meng YF, Li G, Su G, et al. [6] established the thermal conductivity model of liquid-filled annulus, and the influence of casing annulus fluid on temperature distribution was simulated numerically. Ramey [7] established temperature calculation model under the condition that the formation and wellbore heat transfer be considered as unsteady and steady respectively. The significant difference between Holmes Swift’s [8] temperature prediction model and other models is that the accuracy of the model can only be reflected under the condition of a long-circulation time. Hasan–Kabir [9,10] established a model where variation of properties of drilling fluid with temperature and pressure was not considered, nor was the heat generated by drilling fluid flow taken into account, so there will be obvious errors in the calculation results. Raymond’s [11] model does not take into account the heat source generated by friction during drilling fluid flow, so the final temperature calculation result is smaller than the actual value. Marshall Bentsen [12] established the wellbore and formation temperature calculation model by using the comprehensive convective heat transfer coefficient without considering the wellbore structure. Li Mengbo et al. [13] established the coupled temperature and pressure calculation model of wellbore in multiphase flow during normal circulation, and the effect of lost circulation or kick on annulus temperature and pressure was not considered. García et al. [14] established the wellbore temperature calculation model in geothermal wells and that during shut-in under the condition of lost circulation. Espinosa et al. [15] obtained the wellbore temperature distribution prediction model according to the law of energy conservation under the conditions of circulation and stopping circulation. Yang Mou et al. [16] considered the axial and radial heat conduction of wellbore and formation simultaneously; the results showed that the axial heat conduction exert almost no effect on distribution of wellbore temperature compared with that of the radial temperature. Zhang Zheng et al. established the wellbore and formation temperature calculation model when leakage was located in different position of stratum, but without considering the comprehensive influence of leakage and overflow and the coupled temperature and pressure [17].
Although there are many models for calculating wellbore and formation temperature under different conditions, there are few models that the effects of multi-pressure systems and coupled temperature and pressure are taken into account on wellbore temperature and pressure during circulation in deep water drilling.
According to the law of energy conservation, when the multi-pressure system is located at different positions of the formation, such as the middle open-hole formation or at the bottom hole, the mathematically coupled temperature and pressure model of the wellbore and the formation is established. Then, the first-order windward scheme is used for the first-order space, three-point central difference is used for the second-order space, and two-point backward difference is used for the first-order time; finally, Gauss Seidel iteration is used for numerical calculation for the discrete model. The distribution law of coupled wellbore temperature and pressure under multi-pressure system is obtained, and the key factors affecting wellbore temperature and bottom-hole pressure are analyzed, which provides theoretical support for adjusting drilling parameters and ensuring safe and efficient drilling in deep water.

2. Mathematical Model of Each Heat Transfer Region

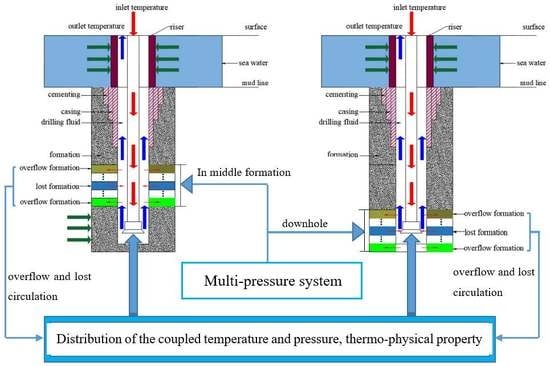
2.1. Physical Model of All Heat Transfer Regions

During the normal circulation in deep water drilling, drilling fluid first enters the pipe, then passes through the drill bit into the annulus and finally returns to the surface ground. In this process, the drilling fluid generates convection heat transfer with the interior wall and exterior wall of the drill pipe as well as the borehole wall. Meanwhile, the interior wall and exterior wall of the drill pipe, casing, cement sheath, seawater and inside of the formation generate radial heat conduction [18]. Hence all heat transfer regions can be divided into three major regions such as inside drill string, in annulus (including formation segment annulus and seawater segment annulus), and inside of the formation [19]. The physical model of all heat transfer regions is shown in Figure 1.
All areas were meshed and divided into layers at intervals of 50 m along the axis of the wellbore, denoted by i, and each zone in the radial direction denoted by j. According to the layer of overflow and leakage, the multi-pressure system is divided into several sub-layers in the axial direction, which are represented by l and k respectively.

2.2. Mathematical Model

2.2.1. Model Hypothesis

(1)
All fluids in the model are incompressible, other thermo-physical parameters do not change with temperature and pressure variation except viscosity and density.
(2)
Radial gradient of the temperature, pressure, and flow rate inside the wellbore are neglected and the radial heat conduction inside seawater and formation is considered.
(3)
The layer of overflow and the leakage alternate with each other; the flow rate of the same type of sublayer is the same, and the fluid entering the annulus is evenly mixed with the drilling fluid.

2.2.2. Heat Transfer Mathematic Models for Each Region

According to the model hypothesis and the first law of thermodynamics, the mathematical model of heat transfer in each region is established because the seawater flow is affected by multiple factors, which cannot be listed simply by hypothesis conditions. In addition, the seawater flow has little influence on wellbore temperature [20], so the flow of seawater is ignored in this model.
(1) Drill string, the casing, riser, and the cement sheath.
During the drilling circulation, drill string, casing, cement ring, and riser have the same type of heat transfer [21]. The heat transfer physical model in control element is shown in Figure 2, therefore, according to the convection heat transfer between the drilling fluid and the interior and exterior wall of the drill string and the heat conduction between the two walls, the heat transfer Equation (1) of drill string can be written as follows: According to the law of energy conservation, the first term of the equation is the convection heat transfer between the annulus drilling fluid and the outer wall of the drill string, the second term is the convection heat transfer between the drilling fluid and the inner wall of the drill string, and the third term is the heat conduction between the inner wall of the drill pipe and the outer wall.
h p o π d p o Δ y Δ t [ T a ( y , t ) T p o ( y , t ) ] Δ t = h p i π d p i Δ y Δ t ( T p ( y , t ) T p i ( ( y , t ) ) = 2 π λ p Δ y Δ t [ T p o ( y , t ) T p i ( y , t ) ] ln ( d p o d p i )
According to the above equation established by the Energy conservation relation, the total heat transferred between the region inside the drill string and in annulus can be obtained, and the relationship is as follows:
Q a p = π d p i [ T a ( y , t ) T p ( y , t ) ] 1 h p i + d p i h p o d p o + d p i 2 λ p ln ( d p o d p i ) Δ y Δ t , 1 U a p = 1 h p i + d p i h p o d p o + d p i 2 λ p ln ( d p o d p i )
According to the heat transfer mechanism of drill string, the heat transfer relationship among casing (or wellbore wall), cement sheath, and formation can be obtained similarly:
2 π λ c e m i Δ y Δ t [ T f ( y , t ) T c e m i ( y , t ) ] ln ( d c e m o d c e m i ) = 2 π λ w Δ y Δ t [ T c e m i ( y , t ) T w ( y , t ) ] ln ( d c e m i d w ) = h w π d w Δ y Δ t ( T w T a )
According to the Equation (3), the comprehensive heat transfer from annulus to outside wall of cement sheath (or formation) can be obtained:
Q a f = π d w [ T f ( y , t ) T a ( y , t ) ] 1 h w + d w 2 λ w ln ( d c e m i d w ) + d w 2 λ c e m ln ( d c e m o d c e m i ) Δ y Δ t , 1 U a f = 1 h w + d w 2 λ w ln ( d c e m i d w ) + d w 2 λ c e m ln ( d c e m o d c e m i )
(2) Inside the drill string.
Heat transfer in these regions include heat convection between drilling fluid and interior wall of drill string, heat gone into the control element during Δt time and heat generated by drilling fluid flow friction. According to the law of the energy conservation, the following Equation (5) can be obtained. The first item of the equation is the change of internal energy in element during Δt time, the second item is the convection heat transfer Δt, the third item is the heat entering the element during Δt, and the fourth item is the heat generated by friction.
π 4 d p i 2 Δ y Δ t [ ρ p ( y , t ) c p ( y , t ) T p ( y , t ) ] t = h p i π d p i ( T p T p i ) Δ y Δ t + Q m [ ρ p ( y , t ) c p ( y , t ) T p ( y , t ) ] y Δ y Δ t + Q c p Δ y Δ t
According to the comprehensive convective heat transfer coefficient of drilling fluid from drill string to annulus, the Equation (5) can be modified as:
π 4 d p i 2 [ ρ p ( y , t ) c p ( y , t ) T p ( y , t ) ] t = U a p π d p i ( T a ( y , t ) T p ( y , t ) ) + Q m [ ρ p ( y , t ) c p ( y , t ) T p ( y , t ) ] y + Q c p
(3) In annulus.
Heat transfer in annulus mainly includes convection heat transfer between drilling fluid and exterior wall of drill string as well as wellbore wall, heat gone into the control element during Δt time, and heat generated by drilling fluid flow friction.
a. When the multi-pressure system is located in the middle open hole formation:
The lower annulus
When the multi-pressure system is located in the middle open-hole formation, the annulus is divided into two parts by taking the multi-pressure system section as a marker. The first part is the lower annulus below the multi-pressure system. The second part is the annulus where the multi-pressure system and its upper segment formation as well as seawater segment. The physical model is shown in Figure 3.
The thermo-physical parameter of the drilling fluid in the lower annulus, which is located upstream of the multi-pressure system, is not affected by overflow and leakage. The heat transfer in this region is the same as that of the annulus during normal circulation. According to the law of energy conservation, the following Equation (7) can be obtained in the control element: The first item of the equation is the change of internal energy in element during Δt time, the second and third items are the convection heat transfer Δt, the fourth item is the heat entering the element during Δt, and the fifth item is the heat generated by friction.
π 4 ( d w d p o 2 ) Δ y Δ t [ ρ a ( y , t ) c a ( y , t ) T a ( y , t ) ] t = h p o π d p o [ T a ( y , t ) T p o ( y , t ) ] Δ y Δ t + h w π d w [ T a ( y , t ) T w ( y , t ) ] Δ y Δ t + Q m [ ρ a ( y , t ) c a ( y , t ) T a ( y , t ) ] y Δ y Δ t + Q c a Δ y Δ t
According to the comprehensive convective heat transfer coefficient from annulus to formation and its counterpart from the drill string to the annulus, Equation (7) can be changed as:
π 4 ( d w d p o 2 ) [ ρ a ( y , t ) c a ( y , t ) T a ( y , t ) ] t = U a p π d p o [ T a ( y , t ) T p ( y , t ) ] + U a f π d w [ T a ( y , t ) T w ( y , t ) ] + Q m [ ρ a ( y , t ) c a ( y , t ) T a ( y , t ) ] y + Q c a
The upper annulus
When the drilling fluid returns to the annulus segment where the multi-pressure system is located, some drilling fluid enters the multi-pressure system formation, and the fluid from the multi-pressure system formation also goes into the annulus because of simultaneous existence of leakage and overflow in this multi-pressure system formation. When drilling fluid from the lower annulus is mixed with fluid from the multi-pressure system formation, then the thermo-physical property of drilling fluid entering the upper annulus is changed. It can be known from the assumed conditions that the formation of leakage and overflow formation are staggered, and the fluid in annulus is evenly mixed. Now, each layer of formation of overflow and leakage is divided into several sub-layers, so the heat transfer equation of drilling fluid in the upper annulus can be described as follows. The physical meaning of terms in the equation is the same as that in Equation (7), except that the value of thermo-physical parameters changes due to the influence of overflow and leakage.
π 4 ( d w d p o 2 ) [ ρ a ( y , t ) c a ( y , t ) T a ( y , t ) ] t Δ y Δ t = h p o π d p o [ T a ( y , t ) T p o ( y , t ) ] Δ y Δ t + h w π d w [ T a ( y , t ) T w ( y , t ) ] Δ y Δ t + Q c a Δ y Δ t + ( v a + k = 1 n v k k l = 2 n 1 v l l ) [ ρ a ( y , t ) c a ( y , t ) T a ( y , t ) ] y Δ y Δ t
Similarly, according to the comprehensive heat transfer coefficient, the Equation (9) can be changed as Equation (10), but the comprehensive convective heat transfer coefficient of the mixed fluid is different from the former in Equation (8):
π 4 ( d w d p o 2 ) [ ρ a ( y , t ) c a ( y , t ) T a ( y , t ) ] t = U a p π d p o [ T a ( y , t ) T p o ( y , t ) ] + U f a π d w [ T f ( y , t ) T a ( y , t ) ] + ( v a + k = 1 n v k k l = 2 n 1 v l l ) [ ρ a ( y , t ) c a ( y , t ) T a ( y , t ) ] y + Q c a
where, the k = 1, 3, 5, …, n, l = 2, 4, 6, …, n − 1.
b. The multi-pressure system is located at the bottom hole
When the multi-pressure system formation is located at bottom hole, as shown in Figure 4, the drilling fluid in the whole annulus is mixed with the fluid from the multi-pressure system formation because of the co-existence of overflow and leakage. According to the law of energy conservation, the heat transfer equation of the annulus can be obtained as follows:
π 4 ( d w d p o 2 ) [ ρ a * ( y , t ) c a * ( y , t ) T a ( y , t ) ] t = U a p * π d p o [ T a ( y , t ) T p o ( y , t ) ] + U f a * π d w [ T f ( y , t ) T a ( y , t ) ] + ( v a + k = 1 n v k k * l = 2 n 1 v l l * ) [ ρ a * ( y , t ) c a ( y , t ) * T a ( y , t ) ] y + Q c a *
Due to the combined effects of overflow and leakage, the composition of drilling fluid in the upper annulus was finally changed [22,23]. According to the literature, the formula for calculating the density of mixed liquid is as follows:
ρ m ( 2 / 3 ) = a + b w 1 + c w 1 2
The thermal conductivity of the mixed liquid is a function of density, so according to the mathematical function expansion theorem:
λ 2 = k 0 + k ρ m ,   making   ρ m 0 ,   λ 2 0 ,   so   λ 2 = k ρ m
where, k0, k is constant, in combination with Equations (12) and (13),
λ 2 ( 2 / 3 ) = B 1 + B 2 w 1 + B 3 w 1 2 ,   ( w 1 + w 2 = 1 )
According to the binary liquid mixture proportion relationship, binary mixed fluid thermal conductivity is obtained and extended to multiple mixed fluid as follows:
λ 2 ( 2 / 3 ) = ( B 1 + B 2 ) w 1 + ( B 1 + B 3 ) w 2 B 3 w 1 w 2
where B1, B2, B3 is the constant, A i = λ 1 ( 2 / 3 ) , B i j = 0.0055 0.011 | ln ( λ i / λ j ) | .
(4) Heat transfer model of formation
Whether the presence of fluid is in the formation or not leads to great difference in the heat transfer of the formation. This paper only considers the condition of the presence of fluid, and the heat transfer equation is as follows:
( ρ c ) e f f T i ( x , y , t ) t = λ e f f 2 T f ( x , y , t ) 2 x + λ e f f x T f ( x , y , t ) 2 x
According to the equilibrium volume method and energy balance equation, the thermal and physical parameters and the fluid in the formation can be calculated [24]. Where, λ = λ l ϕ + λ f ( 1 ϕ ) , ( ρ c ) = ϕ ( ρ c ) l + ( 1 ϕ ) ( ρ c ) f .
The fluid flow in the formation can be regarded as unidirectional incompressible plane radial steady seepage [25]. According to its corresponding differential equation and Darcy’s law, the seepage velocity can be obtained as follows [26]:
v r = K μ P r , K 1 μ ( 2 P r 2 + 1 r P r ) + q ¯ ρ = 0
(5) Heat transfer model of seawater
( ρ s c s ) T i ( x , y , t ) t = λ s 2 T f ( x , y , t ) 2 x + λ s x T f ( x , y , t ) 2 x

2.2.3. Momentum Equation and the Relationship between Pressure and Density

( ρ i v i A i ) t + ( ρ i v i 2 A i ) z = ( ρ i A i ) z + A i P f i z + ρ i g A i
P y = ρ 0 g e χ p ( P P 0 ) + χ p p ( P P 0 ) 2 + χ T ( T T 0 ) + χ T T ( T T 0 ) 2 + χ P T ( P P 0 ) ( T T 0 )

2.3. Initial and Boundary Conditions

2.3.1. Initial Conditions

Since the temperature of seawater is affected by multiple factors such as season, current, depth, and so on, Locarnini described the distribution of seawater temperature in the vertical direction as follows, in consideration of coupling factors [27]:
T 3 = ( y , t = 0 ) = T s u r f ( 200 y ) + 13.68 y / 200 ,   y < 200 ,
T 3 = ( y , t = 0 ) = m 2 + ( m 1 m 2 ) / ( 1 + e ( y m 0 ) / m 3 ) ,   200 < y < y m l
The temperature of the formation is mainly related to the temperature gradient and depth, so the temperature distribution model along the vertical direction can be expressed as [28]:
T f ( y , t = 0 ) = T 3 ( y = y m l , t = 0 ) + G h ,   y m l < y < h

2.3.2. Boundary Conditions

Wellhead temperature can be regarded as the initial temperature inside drill string, so its boundary condition can be expressed as:
T 0 ( y = 0 , t = 0 ) = T i n
According to the continuity of drilling fluid flow at bottom hole, the bottom hole temperatures of the drilling fluid inside the drill string, the wall of drill string, and drilling fluid in the annulus are equal [29]. The boundary condition can be expressed as:
T 0 ( y = H , t ) = T 1 ( y = H , t ) = T 2 ( y = H , t )
The boundary condition of ambient temperature distribution far from the wellbore is as follows:
T ( x , y , t ) = T s u r f + G h
For the meshing of the physical model, the discrete process of the mathematical model and the overall calculation flow chart, all of them are shown in Appendix A.

3. Model Validation

3.1. Comparison and Verification with Theoretical Calculation Model

According to drilling data from Table 1, Table 2 and Table 3, which comes from a well in the South China Sea [30], the calculated results of this paper are obtained and then compared with other scholar’s models; the obtained comparison result is shown in Figure 5a. The model of Zhang Zheng is the closest to the model in this paper, while Yang Mou’s model has a large gap. Marshall’s model also used the comprehensive convective heat transfer coefficient and considered the heat generated by drilling fluid flow friction during circulation. However, the influence of wellbore structure, pressure, and other factors on the temperature distribution was not considered [12]. Because the well structure has a great influence on wellbore heat transfer [12], the temperature in deep formation is generally higher than that in the annulus, while the temperature in shallow formation (including seawater) is lower than that in the annulus.
Therefore, compared with Marshall model, the well structure and pressure was taken into account, and the comprehensive convective heat transfer coefficient was used to solve the temperature distribution in this paper. On the one hand, the deep formation transfers less heat to the lower annulus during same circulation time, so the formation temperature cools more slowly and the temperature of the lower annulus is higher. On the other hand, the drilling fluid from the lower annulus carries less heat into the upper annulus, so the temperature in upper annulus is cooler. Yang Mou’s model is mainly aimed at traditional land drilling [31]. Compared with Yang’s model, the model in this paper is about deep-water drilling and has different assumptions, so there are some errors in the solution. Zhang Zheng’s temperature calculation model is the closest to the solution results of the model in this paper. In the entire annulus temperature distribution, the maximum calculated temperature difference between two models is not more than 3.31 °C, which has little impact on the whole wellbore temperature distribution, thus basically proving the reliability of the temperature calculation model. In addition, compared with Zhang Zheng’s model, the temperature prediction model in this paper not only considers overflow but also considers overflow and leakage occurring simultaneously under multi-pressure system. This temperature prediction model in this paper is more consistent with the actual temperature distribution in deep water drilling and provides a better reference for managed pressure drilling in deep water.

3.2. Verification by Comparison with Measured Data

The wellhead temperature calculated by using the data from Table 1, Table 2 and Table 3 is compared with its counterpart measured in a well in the South China Sea over a period of circulation time. As Figure 5b shows, wellhead temperature drops in calculated results, firstly, because the wellhead temperature is higher than that of the seawater. Therefore, there is heat transfer between drilling fluid near wellhead and seawater, which can lead to wellhead temperature decreases. After circulation for a period of time, the heat absorption of seawater increases and the temperature of seawater increases gradually, while the wellhead temperature decreases gradually and finally tends to stabilize. During the period when the wellhead temperature is stable, although the measured data have some deviation from the theoretical calculation at some time, the overall results are basically consistent, and the calculation and measurement error is less than 5%, so the validity of the model is verified.

4. Analysis of Key Factors Influencing Wellbore Temperature Distribution

The calculation data of this part comes from Table 1, Table 2 and Table 3. If the multi-pressure system is located in the middle open-hole formation from 2500 m to 3500 m, or located at the bottom hole, it is divided into multiple sub-layers, one per 50 m. Then the total number of sub-layers is 20, and the number of the sub-layers of overflow or leakage is 10, respectively, and distributed alternately. According to the assumptions of the model, the overflow rate or leakage rate in each sub-layer is the same. Therefore, on the one hand, if the flow rate of overflow is greater than that of the leakage, take the flow rate of each sub-layer of overflow as 0.6 L/s and the flow rate of sub-layer of each leakage as 0.2 L/s for calculation, then overflow and leakage rates are 6 L/s and 2 L/s, respectively. On the other hand, the flow rate of sub-layer of each leakage is 0.6 L/s, and the flow rate of each sub-layer of overflow is 0.2 L/s, so the total leakage and overflow rates are 6 L/s and 2 L/s, respectively, when the overflow rate is greater than the leakage rate.

4.1. Annulus Temperature Distribution When Overflow and Leakage Rates Are Different under the Multi-Pressure System

In deep water drilling, the deep formation temperature is higher than that in lower annulus during normal circulation, while the upper formation temperature (including seawater) is lower than that in upper annulus. Before the temperature reaches equilibrium, heat from the deep formation is transferred to lower annulus, the temperature of which increases gradually. Then some heat from the drilling fluid in the lower annulus is transferred to the drilling fluid in the upper annulus. The heat from the upper annulus is transferred to the formation or seawater, and the drilling fluid temperature starts to decrease. The temperature gradually increases as it approaches the wellhead; the temperature reaches an equilibrium state after a period of circulation. Under the multi-pressure system, the fluid carrying formation heat goes into the annulus when overflow occurs, and the temperature of the annulus increases. Some drilling fluid enters the formation when leakage occurs, and temperature of the annulus drilling fluid decreases. When the mixed fluid is uniformly mixed in the annulus where the multi-pressure system is located, the thermo-physical properties and the temperature of drilling fluid in the annulus change.
As shown in Figure 6a, the multi-pressure system is located from 2500 m to 3500 m. If the overflow rate is less than that of leakage, the annulus temperature is less than that during the normal circulation. On the contrary, the annulus temperature is higher. Regardless of whether the overflow rate or leakage rate is greater, the area indicating the largest temperature variation is between 2500 m and 3500 m in the annulus. However, the temperature in the annulus deeper than 3500 m changes slightly and is almost unaffected. Moreover, the temperature in the upper part of the annulus, shallower than 2500 m, is affected and gradually decreases as well-depth decreases. Temperature distribution is almost no longer affected in the upper part of the annulus shallower than 1500 m. Therefore, when the multi-pressure system is located in the formation from 2500 m to 3500 m, the annulus temperature is mainly affected from 1500 m to 3500 m.
As shown in Figure 6b, the multi-pressure system is located at bottom hole; because the leakage and overflow occur near the bottom hole, the thermo-physical property of drilling fluid returning from the bottom hole is affected. As drilling fluid returns from the bottom hole to the surface, then the thermo-physical property of drilling fluid in the entire annulus is also changed. However, the influence on the temperature in annulus shallower than 1500 m gradually decreases. Similarly, when the multi-pressure system is located in the middle open-hole formation, the annulus drilling fluid temperature is higher compared with that during the normal circulation when the overflow rate is greater than leakage rate. On the contrary, the annulus temperature is lower than that during normal circulation when the overflow rate is less than leakage rate.

4.2. Annulus Temperature Distribution during Different Circulation Time under Multi-Pressure System When Overflow Rate Is Greater Than Leakage Rate

When the multi-pressure system is located in the middle open formation from 2500 m to 3500 m, the annulus temperature distribution during the circulation for 0 h, 1 h, 2 h, 4 h, and 8 h is shown in Figure 7a. Since the deeper annulus temperature is lower than that of the corresponding deeper formation, the longer the circulation time of drilling fluid is, the more heat in the deeper formation is taken away by the drilling fluid. Then the formation temperature is gradually cooled down, so the annulus temperature gradually decreases at the same depth. The heat in the deeper annulus then is transferred to the shallower annulus, and the longer time the drilling fluid circulates, the higher the upper annulus temperature is.
As shown in Figure 7b, when the multi-pressure system is located at the bottom hole, the annulus temperature distribution during circulation for 0 h, 1 h, 2 h, and 4 h. The trend is basically consistent with the temperature distribution law shown in Figure 8a.

4.3. Annulus Temperature Distribution under Multi-Pressure System, Only Overflow or Only Leakage

As shown in Figure 8a, the multi-pressure system is located in open-hole formation from 2500 m to 3500 m. As the Figure 9a shows, the annulus temperature increases when the overflow rate is greater than leakage rate under the multi-pressure system compared with that during normal circulation. On the contrary, it is smaller than that during normal circulation. The temperature variation is most significant in the annulus where the multi-pressure system is located; however, the temperature in the deeper part of the annulus is almost unaffected, and the temperature in the shallower part of the annulus decreases as the well depth decreases. Figure 8b shows annulus temperature when the multi-pressure system is located at the bottom hole. Since drilling fluid from the lower annulus circulates into the upper annulus gradually, so the thermo-physical properties of the whole annulus drilling fluid is changed. Therefore, compared with the annulus temperature during the normal circulation, the counterpart of the entire annulus is affected. Moreover, the annulus drilling fluid temperature changes more in this case than when the multi-pressure system is located in the middle open-hole formation. In both cases (a) and (b), only leakage or only overflow creates greater influence on the annulus temperature than that when leakage and overflow occur synchronously.

4.4. The Temperature Difference between inside the Drill String and in Annulus When Multi-Pressure System, Only Leakage or Only Overflow Occurs

As shown in Figure 9a,b, the drilling fluid temperature difference distribution was obtained after 2-hour circulation when the multi-pressure system was located in the formation from 2500 m to 3500 m and at bottom hole, respectively. Because the annulus temperature is the same as that inside the drill string at the bottom hole, the temperature difference is 0. When the well depth is from bottom hole to 1500 m, the temperature difference is positive, indicating that the annulus temperature is higher than that inside the drill string. When the well depth is less than 1500 m, the temperature difference is less than 0, indicating that the annulus drilling fluid temperature is lower than that inside the drill string. If overflow rate is greater than leakage rate under multi-pressure system, the temperature difference in this case is higher than that during the normal circulation at the same well depth. On the contrary, the temperature difference is smaller. Obviously, the temperature difference is the largest when only overflow or only leakage occurs. As shown in Figure 9a,b, the obvious temperature difference variation, compared with that during the normal circulation, is mainly in annulus from 1500 to 3500 meters. However, the temperature difference in other parts of the annulus is basically the same when the multi-pressure system is located in the middle formation. As shown in Figure 10b, temperature difference when multi-pressure system is located at bottom hole changes significantly from the bottom hole to the vicinity of the wellhead compared with that during normal circulation.

4.5. Bottom Hole Temperature Distribution When Multi-Pressure System, Only Overflow or Only Loss Circulation Occurs

As shown in Figure 10a,b, the bottom-hole temperature decreases firstly and then gradually tends to stabilize as the circulation time increases. Because the deep formation temperature is higher than that at the bottom hole, the drilling fluid absorbs heat from the deep formation. As the circulation time increases, the formation temperature is cooled gradually and the bottom hole temperature decreases. When the drilling fluid temperature at the bottom hole reaches an equilibrium state with formation temperature, the former basically remains unchanged. For the same circulation time, only overflow increases the bottom hole temperature the most, and only leakage decreases the bottom hole temperature the most the influence on bottom-hole temperature when multi-pressure system occurs is between them.

4.6. Annulus Temperature Distribution at Different Overflow and Leakage Rates When Multi-Pressure System Exists

Figure 11a–d shows the annulus temperature distribution at different overflow and leakage rates after 2 hours of circulation. As shown in Figure 11a,b, it is annulus temperature distribution when overflow rate is 6 L/s and leakage rate is 1 L/s, 2 L/s and 4 L/s, respectively. Some drilling fluid is lost into the formation because of leakage; then, the heat from the drilling fluid is carried away during the process. As the leakage rate increases, so does the heat loss, then the annulus temperature decreases lower than that in normal condition at the same depth. When the leakage rate continues to increase, the abrupt change point occurs at 2500 m and 3500 m, and the annulus temperature in this region is more affected than that in other annulus regions. Figure 11b also shows the annulus temperature distribution when the overflow rate is 6 L/s, the leakage rates are 1 L/s, 2 L/s, and 4 L/s respectively. As the overflow rate increases, the flow carries heat from the formation into the annulus, which leads to temperature increase in the annulus at the same depth. As shown in Figure 11c, when flow rate of overflow is 6 L/s and the flow rate of leakage gradually increases from 1 L/s, 2 L/s, and 4 L/s, the annulus temperature gradually decreases at the same well depth. As the leakage rate increases, the more heat the drilling fluid carries into the formation, the lower the annulus temperature is at the same depth. Figure 11d shows the annulus temperature distribution when the leakage rate is 6 L/s and overflow rate gradually increases from 1 L/s, 2 L/s, and 4 L/s. The annulus temperature increases gradually at the same depth because the fluid from the formation carries heat into the annulus and circulates with the drilling fluid into the shallower part of the annulus from the bottom hole, then the temperature throughout the annulus increases.

5. Analysis of the Influence of Coupled Temperature and Pressure on Viscosity and Density of Drilling Fluid

5.1. Normal Circulation

Density and viscosity of drilling fluid are positively correlated with temperature and negatively correlated with pressure. As shown in Figure 12a,b, During normal circulation, with the increase of circulation time, the pressure variation is not obvious for the same well depth, but the temperature of annulus near borehole gradually decreases, so the density and viscosity increase gradually, especially the annulus drilling fluid near the bottom hole. But from the bottom hole up, the density and viscosity vary less and less. Because, the temperature of the shallower annulus has a tendency to increase gradually with the increase of circulation time, so the density and viscosity gradually decrease.

5.2. Under Multi-Pressure System

After circulating for 3 h, when the multi-pressure system is located in the middle formation or at the bottom hole, the variation of density and viscosity at different overflow and leakage rates is shown in Figure 13a–d, respectively. No matter where the multi-pressure system is located, the density increases with the different overflow and leakage rates. When only leakage occurs, the density variation is the smallest. In other cases, the density variation is more obvious than that in the former case. However, when the overflow rate is greater than the leakage rate, the density variation is the largest. When the density of formation fluid is higher than that of drilling fluid, the density of mixed fluid in this part of the annulus is reduced because of leakage and is increased because of overflow. So the density variation is greatest when the overflow rate is greater than the leakage rate; the condition that only leakage occurs hardly affects the density of the drilling fluid, and the influencing degree of other cases is between them.
Regardless of where the multi-pressure system is located in the middle formation or at the bottom hole or how the leakage rate and overflow rate change according to the four cases, the viscosity of the drilling fluid decreases. In addition, at the same depth, the viscosity of the drilling fluid is the maximum when only leakage occurs, and the minimum when only overflow occurs. Otherwise, the viscosity is between them. Since the viscosity of formation fluid is smaller than that of drilling fluid, the only leakage increases the solid phase ratio and significantly increases the viscosity of the drilling fluid, while the only overflow dilutes the drilling fluid directly in this part of the annulus resulting in a significant decrease in the viscosity.

6. Analysis of Key Factors Influencing Bottom-Hole Pressure under Multi-Pressure System

6.1. Normal Circulation

As shown in Figure 14a, when the pump rate remains unchanged, the bottom-hole pressure increases rapidly with the increase of circulation time; then, the bottom-hole pressure tends to be constant after circulation for 3 h. When the circulation time is the same, if the pump rate continues to increase, the bottom-hole pressure starts to increase significantly and then increases slowly when the pump rate increases from 25 L/s to 30 L/s. As the circulation time increases, the temperature and density of the deep annulus gradually decrease, so the bottom-hole pressure gradually increases. When the annulus temperature reaches equilibrium, the bottom-hole pressure basically stays constant. For the same circulation time, if the pump rate is higher, the more heat is taken away from the annulus near the bottom hole, the greater the temperature drop is, so the bottom-hole pressure is higher. As shown in Figure 14b, the variation of bottom-hole pressure over time is the same as that in Figure 14a. When the circulation time is the same, but the inlet temperature increases, the bottom-hole pressure decreases gradually. This is because when the inlet temperature remains the same, the longer the circulation time is, the annulus temperature near the bottom hole gradually decreases, then the density gradually increases, so the bottom-hole pressure is higher. For the same circulation time, the higher the inlet temperature is, the lower the density of the annulus near the bottom hole is, so the bottom-hole pressure at the bottom of the well is higher.

6.2. Under Multi-Pressure System

As shown in Figure 15a,b, when the multi-pressure system is located in the middle formation or at the bottom hole, the bottom-hole pressure increases with the circulation time under different overflow and leakage rates. The impact on bottom-hole pressure is greatest when the overflow rate is greater than the leakage rate, because the overflow significantly increases the density of the mixed fluid, resulting in increased bottom-hole pressure. Several other conditions affect bottom-hole pressure to a degree between the only leakage and the overflow rate being greater than the leakage rate.

7. Conclusions

According to the law of energy conservation, the coupled temperature distribution prediction model of wellbore and formation is established. Meanwhile, the key factors affecting annulus temperature distribution and bottom-hole pressure are analyzed, and the following conclusions are obtained:
(1)
As the circulation time increases, annulus temperature decreases gradually in the deeper part and increases gradually in the shallower part, no matter where the multi-pressure system is located.
(2)
When the multi-pressure system is located in the middle formation from 2500 m to 3500 m, annulus temperature in this area is most affected; however, the annulus temperature above 2000 m and below 4000 m is almost unaffected. If the multi-pressure system is located at the bottom hole, the annulus temperature from the bottom hole to the mud line is affected, and the temperature above the mud line is basically unchanged.
(3)
Whenever overflow occurs, the annulus temperature increases, or leakage occurs, the annulus temperature decreases. However, the annulus temperature increases the most when only overflow occurs and decreases the most when only leakage occurs.
(4)
Compared with the normal circulation, the temperature difference between inside drill string and in annulus in the middle well depth is more affected than in other areas along the borehole no matter where the multi-pressure system is located. What is more, only overflow or only leakage has the largest influence on temperature difference.
(5)
If the overflow rate is constant and leakage rate keeps increasing, then the annulus temperature gradually decreases; otherwise, it keeps rising at the same depth.
(6)
During normal circulation, bottom-hole pressure increases with increase of pump rate and decreases with the increase of inlet temperature. When the overflow rate is greater than leakage rate, the density of drilling fluid and bottom-hole pressure increases the most, and the only leakage has the least increase; the effect of the other cases listed on bottom-hole pressure is between them.

Author Contributions

Conceptualization, J.L. and G.L.; methodology, R.Z.; software, R.Z. and H.Y; validation, R.Z., H.Y. and H.J.; formal analysis, R.Z.; investigation, R.Z. and H.J; resources, H.Y.; data curation, R.Z.; writing—original draft preparation, R.Z.; writing—review and editing, R.Z.; visualization, R.Z.; supervision, R.Z.; project administration, J.L.; funding acquisition, J.L.

Funding

This research was supported by the National natural science foundation of China, “basic research on wellbore pressure control in deep water oil and gas drilling and production” (51734010).

Conflicts of Interest

The authors declare no conflict of interest.

Nomenclature

hpiconvective heat transfer coefficient of drill string inside wall, W/(m2·°C)
hpoconvective heat transfer coefficient of drill string outside wall, W/(m2·°C)
hwconvective heat transfer coefficient of the borehole, W/(m2·°C)
Uapthe comprehensive convective heat transfer coefficient between drilling fluid in the drill string and drilling fluid in the annulus, W/(m2·°C)
Uafthe comprehensive convective heat transfer coefficient between drilling fluid in the annulus and the formation, W/(m2·°C)
λwheat conductivity coefficient of borehole, W/(m·°C)
λpheat conductivity coefficient of drill string, W/(m·°C)
λfheat conductivity coefficient of formation, W/(m·°C)
λcemheat conductivity coefficient of cement sheath, W/(m·°C)
λeffeffective heat conductivity coefficient of formation, W/(m·°C)
λlheat conductivity coefficient of fluid in the formation, W/(m·°C)
λ2heat conductivity coefficient of mixed fluid in annulus, W/(m·°C)
dpiinside diameter of drill string, mm
dcemiinside diameter of cement sheath, mm
dcemooutside diameter of cement sheath, mm
dpooutside diameter of drill string, mm
Tpdrilling fluid temperature in drill string, °C
Tpiinside wall temperature of drill string, °C
Tpooutside wall temperature of drill string, °C
Tadrilling fluid temperature in annulus, °C
Twwall temperature of the well, °C
Tftemperature of the formation, °C
Tsurfsurface temperature, °C
T0bottom-hole temperature inside the drill string, °C
T1bottom-hole temperature of the drill string, °C
T2bottom-hole temperature in annulus, °C
T3seawater temperature, °C
Tininlet temperature of the drill string, °C
ρsdensity of seawater, kg/m3
ρpdensity of the drilling fluid inside the drill string, kg/m3
ρadensity of the drilling fluid in annulus, kg/m3
ρeffeffective fluid density with in the formation, kg/m3
ρmmixed fluid density within the formation, kg/m3
ρ0original density of the drilling fluid inside the drill string, kg/m3
ρidensity of each fluid phase, kg/m3
csspecific heat capacity of seawater, J/(kg·°C)
cpspecific heat capacity of the drilling fluid inside the drilling string, J/(kg·°C)
caspecific heat capacity of the drilling fluid in the annulus, J/(kg·°C)
ceffspecific heat capacity of fluid information, J/(kg·°C)
Qcpfriction heat source of the drilling fluid inside the drill string, W/m3
Qcafriction heat source of the drilling fluid in the annulus, W/m3
Qcafriction heat source of the drilling fluid in the annulus of the multi-system pressure, W/m3
Qmpump rate of the drilling fluid inside the drill string, m3/s
Qapump rate of the drilling fluid in the annulus, m3/s
Qkflow rate of overflow of fluid in the formation, m3/s
Qlflow rate of leakage of fluid in the formation, m3/s
φporosity of formation rock
vaflow rate of drilling fluid in annulus, m/s
vkkthe flow rate of overflow of each sublayer in a multi-pressure system, m/s
vllthe flow rate of leakage of each sublayer in a multi-pressure system, m/s
vithe flow rate of each fluid phase, m/s
Aithe area of the flow cross section, m2
Kabsolute permeability of isotropic porous medium
K1relative permeability
Pintrinsic average pressure of formation, Pa
PfiAnnulus friction pressure loss
Hwell depth, m
hthe depth of a well at a given location, m
Ggeothermal gradient, °C/m
ymldepth of mudline
μvelocity in the x direction, m/s
vrseepage velocity of fluid information, m/s
χexperimental measurement coefficient

Appendix A. Model Solution

The model established in this paper is discretized by finite difference method. The first-order space uses the first-order windward scheme, the first-order time uses two points for backward difference, and the second-order space uses three points for central difference. The meshing method of wellbore and formation is shown in Figure A1.
Figure A1. Schematic diagram of mesh grids of wellbore and formation.
Energies 12 03533 g0a1

Appendix A.1. Heat Transfer Model Discretization of Drilling Fluid in Drill String

π 4 d p i 2 [ ρ p c p T p ] t = U a p π d p i ( T a T p ) + Q m [ ρ p c p T p ] y + Q c p
Making A 1 = π d p i 2 ρ p c p 4 Δ t , B = π U a p d p i , C = ρ p c p Q m Δ y , Then,
A 1 ( T i , j n T i , j n 1 ) = B ( T i , j + 1 n T i , j n ) C 1 ( T i , j n T i 1 , j n ) + ( Q c p ) i n
Equation (A2) can be rewritten as:
a T i , j n + b T j , j + 1 n + c T i 1 , j n = U i , j n
where, a = A 1 + B + C 1 , b = B , c = C 1 , U i , j n = A 1 T i , j n + ( Q c p ) i n .

Appendix A.2. Heat Transfer Model Discretization of Drilling Fluid in Annulus

Appendix A.2.1. The Multi-Pressure System Is Located in the Middle Section of the Formation

(1) Heat transfer equation of the lower annulus can be written as follows:
π 4 ( d w d p o 2 ) [ ρ a c a T a ] t = U a p π d p o [ T a T p ] + h w π d w [ T a T w ] + Q m [ ρ a c a T a ] y + Q c a
Making D 1 = π ( d w 2 d p 2 ) ρ a c a 4 Δ t , E = π d p o U a p , F = π d w U a f , G 1 = Q a ρ a c a Δ y , Then
D 1 ( T i , j n T i , j n 1 ) = E ( T i , j 1 n T i , j n ) + F ( T i , j + 1 n T i , j n ) + G 1 ( T i + 1 j n T i , j n ) + ( Q c a ) i n
Equation (A5) can be rewritten as follows:
a 1 T i , j n + b 1 T i + 1 , j n + c 1 T i , j + 1 n + d T i , j 1 n = U i , j n
where, a 1 = D 1 + E + F + G 1 , b 1 = G 1 , c 1 = F , d 1 = E , U i , j n = D 1 T i , j n 1 + ( Q c a ) i n .
(2) Heat transfer equation of the upper annulus can be written as follows:
π 4 ( d w d p o 2 ) [ ρ a c a T a ] t = U a p π d p o [ T a T p o ] + U f a π d w [ T f T a ] + ( v a + k = 1 n v k k l = 2 n 1 v l l ) [ ρ a c a T a ] y + Q c a
Making D 1 = π ( d w 2 d p o 2 ) ρ a c a 4 Δ t , E = π d p o U a p , F = π d w U a f , G 1 = ρ a c a ( Q a + Q k Q l ) Δ y , then
D 1 ( T i , j n T i , j n 1 ) = E ( T i , j 1 n T i , j n ) + F ( T i , j + 1 n T i , j n ) + G 1 ( T i + 1 , j n T i , j n ) + ( Q c a ) i n
Equation (A5) can be rewritten as follows:
a 1 T i , j n + b 1 T i + 1 , j n + c 1 T i , j 1 n + d 1 T i , j + 1 n = U i , j n
where, a 1 = D 1 + E + F + G 1 , b 1 = G 1 , c 1 = E , d 1 = F , U i , j n = D 1 T i , j n 1 + ( Q c a ) i n .

Appendix A.2.2. When the Multi-Pressure System Is Located at Bottom Hole, the Whole Annulus Is Affected by the Multi-Pressure System. Therefore, Its Heat Transfer Model and Discrete Method Are the Same as the Upper Annulus Model when the Multi-Pressure System Appears in the Middle Open Hole Formation

Appendix A.3. The Heat Transfer Mode in the Formation and Seawater

The heat transfer mode in the formation and seawater is radial heat conduction, so the heat transfer model and discrete method are the same. Therefore, only the heat transfer equation inside the formation is discretized to illustrate.
( ρ c ) e f f T i ( x , y , t ) t = λ e f f 2 T f ( x , y , t ) 2 x + λ e f f x T f ( x , y , t ) 2 x
Making H 1 = ( ρ c ) e f f Δ r λ e f f Δ t , K = 1 Δ r , then
H 1 ( T i , j n T i , j n 1 ) = K ( T i , j + 1 n 2 T i , j n + T i , j 1 n ) + 1 r j ( T i , j + 1 n T i , j n )
Equation (A11) can be rewritten as follows:
a 2 T i , j n + b 2 T i + 2 , j n + c 2 T i 1 j = U i , j n
where, a 2 = H 1 + 2 K + 1 r j , b 2 = ( K + 1 r j ) , c 2 = K , U i , j n = H 1 T i , j n 1 .

Appendix A.4. Heat Transfer Equation of Boundary between Strata and Annulus Can Be Written as Follows

π d w U a f ( T f T a ) = π d w λ e f f ( T f r ) , making M = U a f Δ r λ e f f
Equation (A13) can be rewritten as follows:
( M + 1 ) T i , j n M T i , j 1 n T i , j + 1 n = 0

Appendix A.5. The Dispersion of the Momentum Equation

P i n A i P i 1 n A i 1 Δ z = ( ρ v ) i n A i ( ρ v ) i n 1 A i Δ t + ( ρ v 2 ) i n A i ( ρ v 2 ) i 1 n A i 1 Δ z ( P f i ) i n A i ( P f i ) i 1 n A i 1 Δ z g A i ρ i n
Making the ψ = Ai−1/Ai, Equation (A15) can be changed as:
P i n ψ P i 1 n = Δ z Δ t [ ( ρ v ) i n ( ρ v ) i n 1 + ( ρ v 2 ) i n ψ ( ρ v 2 ) i n 1 ( ( P f i ) i n ψ ( P f i ) i 1 n ) ] g ρ i n
Figure A2 shows the flow chart of solution process.
Figure A2. Flowchart of wellbore and formation temperature calculation.
Energies 12 03533 g0a2

References

  1. Zhang, Z.; Xiong, Y.M.; Gao, Y.; Liu, L.M.; Wang, M.; Peng, G. Wellbore temperature distribution during circulation stage when well-kick occurs at bottom-hole from the bottom-hole. Energy 2018, 164, 964–977. [Google Scholar] [CrossRef]
  2. Wiktorski, E.; Cobbah, C.; Sui, D.; Khalifeh, M. Experimental study of temperature effects on wellbore material properties to enhance temperature profile modeling for production wells. J. Pet. Sci. Eng. 2019, 176, 689–701. [Google Scholar] [CrossRef]
  3. Abdollahi, J.; Dubljevic, S. Transient Fluid Temperature Estimation in Wellbores. IFAC Proc. Vol. 2013, 46, 108–113. [Google Scholar] [CrossRef]
  4. Hasan, R.; Kabir, C.S. Wellbore heat-transfer modelling and applications. J. Pet. Sci. Eng. 2012, 86–87, 127–136. [Google Scholar] [CrossRef]
  5. Yang, M.; Zhao, X.; Meng, Y.; Li, G.; Zhang, L.; Xu, H.; Tang, D. Determination of transient temperature distribution inside a wellbore considering drill string assembly and casing program. Appl. Therm. Eng. 2017, 118, 299–314. [Google Scholar] [CrossRef] [Green Version]
  6. Jia, H.J.; Meng, Y.F.; Li, G.; Su, G.; Zhao, X.Y.; Wei, N.; Song, W. Research on overflow accompanied with lost circulation during drilling of gas formation with multi-pressure system. Fault-Block Oil Gas. 2012, 19, 360–363. [Google Scholar]
  7. Ramey, H.J., Jr. Wellbore heat transmission. J. Pet. Technol. 1962, 14, 427–435. [Google Scholar] [CrossRef]
  8. Holmes, C.S.; Swift, S.C. Calculation of circulating mud temperatures. J. Pet. Technol. 1970, 22, 670–674. [Google Scholar] [CrossRef]
  9. Kabir, C.S.; Hasan, A.R.; Kouba, G.E.; Ameen, M. Determining circulating fluid temperature in drilling, workover, and well control operations. SPE Drill. Complet. 1996, 11, 74–79. [Google Scholar] [CrossRef]
  10. You, J.; Rahnema, H.; McMillan, M.D. Numerical modeling of unsteady-state wellbore heat transmission. J. Nat. Gas Sci. Eng. 2016, 34, 1062–1076. [Google Scholar] [CrossRef]
  11. Raymond, L.R. Temperature distribution in a circulating drilling fluid. J. Pet. Technol. 1969, 21, 333–341. [Google Scholar] [CrossRef]
  12. Marshall, D.W.; Bentsen, R.G. A computer model to determine the temperature distributions in a wellbore. J. Can. Pet. Technol. 1982, 21, 63–75. [Google Scholar] [CrossRef]
  13. Santoyo-Gutierrez, E.R. Transient Numerical Simulation of Heat Transfer Processes During Drilling of Geothermal Wells. Ph.D. Thesis, University of Salford, Salford, UK, 1 September 1997. [Google Scholar]
  14. García, A.; Santoyo, E.; Espinosa, G.; Hernandez, I. Estimation of temperatures in geothermal wells during circulation and shut-in in the presence of lost circulation. Transp. Porous Media 1998, 33, 103–127. [Google Scholar] [CrossRef]
  15. Espinosa-Paredesa, G.; Garcia, A.; Santoyo Hernandez, E. A computer program for estimation of fully transient temperatures in geothermal wells during circulation and shut-in. Comput. Geosci. 2001, 27, 327–344. [Google Scholar] [CrossRef]
  16. Yang, M.; Tang, D.; Chen, Y.; Li, G.; Zhang, X.; Meng, Y. Determining initial formation temperature considering radial temperature gradient and axial thermal conduction of the wellbore fluid. Appl. Therm. Eng. 2019, 147, 876–885. [Google Scholar] [CrossRef]
  17. Zheng, Z.; Xiong, Y.M.; Guo, F. Analysis of Wellbore Temperature Distribution and Influencing Factors During Drilling Horizontal Wells. J. Energy Resour. Technol. 2018, 140, 092901. [Google Scholar] [CrossRef]
  18. Wang, X.R.; Sun, B.J.; Luo, B.Y. Transient temperature and pressure calculation model of a wellbore for dual gradient drilling. Appl. Therm. Eng. 2018, 30, 701–714. [Google Scholar] [CrossRef]
  19. Farahani, H.S.; Yu, M.; Miska, S.; Takach, N.; Chen, G. Modeling Transient Thermo-Poroelastic Effects on 3D Wellbore Stability. In Proceedings of the SPE Technical Conference and Exhibition, San Antonio, TX, USA, 24–27 September 2006. [Google Scholar]
  20. Song, X.C.; Guan, Z.C. Full Transient Analysis of Heat Transfer During Drilling Fluid Circulation in Deep-Water Wells. Acta Pet. Sin. 2011, 32, 704–708. [Google Scholar]
  21. Zheng, Z.; Xiong, Y.M.; Mao, L.J.; Lu, J.S.; Wang, M.H.; Peng, G. Transient temperature prediction models of wellbore and formation in wellkick condition during circulation stage. J. Pet. Sci. Eng. 2019, 175, 266–279. [Google Scholar] [CrossRef]
  22. Chen, Y.H.; Yu, M.J.; Miska, S.; Zhou, S.H.; Al-Khanferi, N.; Ozbayoglu, E. Fluid flow and heat transfer modeling in the event of lost circulation and its application in locating loss zones. J. Pet. Sci. Eng. 2017, 148, 1–9. [Google Scholar] [CrossRef]
  23. Wang, L.Y.; Wang, K.Q. A new method for calculating thermal conductivity of mixed liquid. Chem. Eng. 1999, 27, 45–51. [Google Scholar]
  24. Yang, H.W.; Li, J.; Liu, G.H.; Wang, C.; Li, M.; Jiang, H. Numerical analysis of transient wellbore thermal behavior in dynamic deepwater multi-gradient drilling. Energy 2019, 179, 138–153. [Google Scholar] [CrossRef]
  25. Arnold, F.C. Temperature variation in a circulating wellbore fluid. J. Energy Res. Technol. 1990, 112, 79–83. [Google Scholar] [CrossRef]
  26. Edwardson, M.J.; Girner, H.M.; Parkinson, H.R.; Williamson, C.D.; Matthews, C.S. Calculation of formation temperatures disturbances caused by mud circulation. J. Pet. Technol. 1962, 14, 416–426. [Google Scholar] [CrossRef]
  27. Deng, S.; Fan, H.; Tian, D.; Liu, Y.; Zhou, Y.; Wen, Z.; Ren, W. Calculation and application of safe mud density window in deepwater shallow layers. In Proceedings of the Offshore Technology Conference, Houston, TX, USA, 2–5 May 2016. [Google Scholar]
  28. Li, M.B.; Liu, G.H.; Li, J.; Zhang, T.; He, M. Thermal performance analysis of drilling horizontal wells in high temperature formations. Appl. Therm. Eng. 2015, 78, 217–227. [Google Scholar] [CrossRef]
  29. Zahedi, G.; Karami, Z.; Yaghoobi, H. Prediction of hydrate formation temperature by both statistical models and artificial neural network approaches. Energy Convers. Manag. 2009, 50, 2052–2059. [Google Scholar] [CrossRef]
  30. Yang, H.W.; Li, J.; Liu, G.H. Development of transient heat transfer model for controlled gradient drilling. Appl. Therm. Eng. 2019, 148, 331–339. [Google Scholar] [CrossRef]
  31. Yang, M.; Li, X.X.; Deng, J.M.; Meng, Y.F.; Li, G. Prediction of wellbore and formation temperatures during circulation and shut-in stages under kick conditions. Energy 2015, 91, 1018–1029. [Google Scholar] [CrossRef]
Figure 1. Heat transfer model of wellbore and formation under multi-pressure system.
Energies 12 03533 g001
Figure 2. Heat transfer physical model in control element.
Energies 12 03533 g002
Figure 3. Physical model of multi-pressure system in the middle open hole formation.
Energies 12 03533 g003
Figure 4. Physic model of multi-pressure system segment located at bottom hole.
Energies 12 03533 g004
Figure 5. Model verification by using previous models and measurement data.
Energies 12 03533 g005
Figure 6. Annulus temperature distribution when overflow and leakage rates are different under the multi-pressure system; (a,b) show conditions when the multi-pressure system is located in middle formation and at bottom hole, respectively.
Energies 12 03533 g006
Figure 7. Annulus temperature during different circulation time under multi-pressure system. (a) The multi-pressure system is located in the middle open formation; (b) The multi-pressure system is located at bottom hole.
Energies 12 03533 g007
Figure 8. Annulus temperature distribution under multi-pressure system, only overflow or only leakage; (a,b) show conditions when the multi-pressure system is located in middle formation and at bottom hole, respectively.
Energies 12 03533 g008
Figure 9. The temperature difference between in annulus and inside drill string when multi-pressure system, only leakage or only overflow occurs; (a,b) show conditions when the multi-pressure system is located in middle formation and at bottom hole, respectively.
Energies 12 03533 g009
Figure 10. Bottom-hole temperature when multi-pressure system, only overflow or only leakage occurs; (a,b) show conditions when multi-pressure system is located in middle open formation and at bottom hole, respectively.
Energies 12 03533 g010
Figure 11. Annulus temperature distribution at different overflow and leakage rates when multi-system occurs. (a) The flow rate of overflow is greater than that of leakage when the multi-pressure system is located in the middle open hole formation; (b) The flow rate of overflow is less than that of leakage when the multi pressure system is located in middle open hole formation; (c) The overflow rate is greater than leakage rate when the multi pressure system is located at bottom hole; (d) The flow rate of overflow is less than that of leakage when the multi pressure system is located at bottom hole.
Energies 12 03533 g011aEnergies 12 03533 g011b
Figure 12. Variation of density and viscosity with time during normal circulation. (a) Drilling fluid density changes over time; (b) Drilling fluid viscosity changes over time.
Energies 12 03533 g012
Figure 13. Variation of density and viscosity at different overflow and leakage rates. (a) Variation of density when the multi-pressure system is located in the middle formation; (b) Variation of viscosity when the multi-pressure system is located in the middle formation; (c) Variation of density when the multi-pressure system is located at bottom hole; (d) Variation of viscosity when the multi-pressure system is located at bottom hole.
Energies 12 03533 g013
Figure 14. Variation of bottom-hole pressure at different pump rate and inlet temperature. (a) Variation of bottom-hole pressure at different pump rate; (b) Variation of bottom-hole pressure with different inlet temperature.
Energies 12 03533 g014
Figure 15. Variation of bottom-hole pressure at different overflow and leakage rates. (a) Variation of bottom-hole pressure when multi-pressure system is located in the middle formation; (b) Variation of bottom-hole pressure when multi-pressure system is located at bottom hole.
Energies 12 03533 g015
Table 1. The Basic parameters of the well.
ParametersValueParametersValue
Well depth, m5094Drilling fluid flow rate, m3/s0.02
Water depth, m1521ROP, m/h3.05
Open hole diameter, mm215.9Surface temperature, °C20
Inlet temperature, °C15Geothermal gradient, °C0.024
Drilling fluid viscosity, mPa·s10Fluid density in formation, kg/m31100
Table 2. Thermo-physical parameters of different materials or fluid.
MediumDensity, kg/m3Specific Heat, J/(kg·K)Coefficient of Heat Conduction W/(m·K)
Drilling fluid118039351.75
Drill string785040043.7
Drill collars891040043.7
Fluid in formation115042000.8
Seawater105041280.6
Casing830040043.7
Cement21409000.85
Rock 26408532.3
Table 3. Inner diameter and outer diameter of drill string and casing.
ParametersInside Diameters (mm)Outside Diameters (mm)
Drill pipe108127
Drill collar80171
First casing486508
Second casing 317339
Third casing221245

