Abstract
In drying systems, the examination of the drying rate values of the food product in advance gives important information about the raw material to be dried. In this study, thin-layer drying behavior of apple slices in a convective solar dryer was investigated. The experiments were carried out at a drying air temperature of 46–63 °C and a drying air speed of 0.7–1.8 m/s. In order to determine the drying kinetics, the mass change of apple slices was recorded under all drying air conditions. The effects of drying air temperature and speed, drying speed of apple slices, dimensionless moisture content, were investigated. In a solar drying system, thermal efficiency, solar radiation and air velocity values were measured. The drying kinetics of 15-mm thick apple slices were examined for three days in the solar drying system. Using the decision tree algorithm, which is a machine learning algorithm, a predictive model was created for moisture rate in drying experiments and four linear equations were obtained. According to obtained equations, the collector in the drying system depends on the inlet–outlet temperature values, the drying room inlet–outlet temperature values, the drying room humidity values and air velocity values. Moisture rate data were applied to twelve different models and their performance was determined by root mean square error (RMSE) analysis. The mathematical model with the least error rate was (RMSE: 0.09) Midilli model. A comparison was made between these drying models in the literature and the model generated by the decision tree algorithm. According to the results of RMSE error analysis, it was shown that the model created with the decision tree algorithm predicted the moisture rate values with less error values RMSE: 0.03) than the Midilli model.
1. Introduction
Food drying is a process that has been carried out since ancient times with the aim of reducing or decreasing the amount of water in a raw material to a very low level and thus storing various agricultural products for long periods and consuming them outside the production season. In addition to such advantages, the drying process has become an increasing practice due to the high income of dry products []. Thus, drying or dehydration is one of the most effective methods of preserving food products. Depending on the type of product, the moisture content after drying is between 1–15% relative to the wet base. Possible microbiological and chemical deterioration with drying, unwanted quality losses are prevented []. Convective drying systems are the most commonly used systems among the drying systems. In convective drying, heat is transmitted from the drying medium to the wet material by convection. The hot air is passed either over or through the dried product layer. The thermal efficiency of this method is lower than contact drying. In convection drying, one of the factors affecting drying is the speed of drying air. Evaporating moisture forms a thin boundary layer saturated with water around the raw material. Since the partial vapor pressure value of said saturated layer is high, this has a drying-inhibiting effect. The speed of air is important because it determines the rate of evaporation of moisture from the raw material. The effect of air velocity on drying is seen up to a certain air velocity value. After this value, it has no additional effect on drying. In addition, the air velocity is more effective in the drying phase at constant speed, in other words, in the early stages of drying. Since the drying speed in the drying phase with decreasing speed is limited by the rate of transport of moisture through the material to the surface by diffusion, the effect of air velocity at these stages is lower than temperature [].
In the literature, some studies on apple drying using solar collector food drying system are given in Table 1. Table 1 shows the raw material thickness, drying air velocity―temperature values and solar radiation values. In this study, the apple slices to be dried are 15 mm thick. The average air velocity value in the solar drying system is 1.25 m/s. The radiation value on the air-heated solar collector is 650 W/m2. The average temperature of the drying chamber is 50 °C.

Table 1.
Some studies related to drying apples using solar dryer in the literature.
Many valuable studies have been carried out in the literature to determine the drying performance and drying characteristics of the dried raw material in convective dryers. In their study, Yaldız and Ertekin examined the drying of pumpkin, green pepper, green beans and onions in an exhibition in a solar cabinet-type dryer. In order to make a comparison, they also dried the raw materials in sunny conditions. Using three different air velocities, they investigated the effect of velocity on drying time. In addition, they tried to explain the drying curves with the drying models and determined the most suitable model for each dried product []. Akpınar [] explained the effect of parameters such as speed and temperature on the drying rate of apple slices cut in different sizes with empirical relations. Akpınar et al. [] studied the drying kinetics of potatoes in a cyclone-type convective dryer and made mathematical modeling of moisture curves and diffusion coefficients that they found experimentally. Midilli [] determined the drying conditions and behavior of this product by drying shelled and unshelled peanut samples both in a solar dryer and outdoors in the sun. He found the peanut-drying curve equation by the least-squares method. Nguyen et al. [] a suitable kinetic model for the drying process was determined by determining the moisture data corresponding to four different temperature levels (50, 55, 60 and 65 °C). In addition, they estimated the effect of drying temperature on dehumidification rate, effective diffusion coefficient and activation energy using seven different drying models. As a result, they showed that the dehumidification time increased proportionally with the air drying temperature and that the Weibull model was the most suitable model for defining the drying process.
Many data and formulas are used in the calculation of drying parameters. The use of machine learning algorithms to process this data has become increasingly common. There are many valuable studies in the literature about the use of machine learning algorithms with drying systems. Aktaş et al. [] analyzed and modeled the performance of the closed circuit heat pump dryer they used to dry bay leaves using artificial neural network. To control relative humidity and temperatures, they performed low temperature drying (40 °C, 45 °C and 50 °C). They analyzed and modeled the experimental data and the drying kinetics of laurel leaf using artificial neural network (ANN). In their study, Beigi et al. [] investigated the drying behavior of coarse rice in convective deep bed drying system. ANN was used to estimate the energy performance, energy consumption, drying and thermal efficiency of the process. Das and Akpınar [] have designed a solar-assisted drying system. They calculated the convective heat transfer coefficient of pear product in the drying system. They developed a predictive model for the convective heat transfer value using the support vector machine algorithm. Their model estimated the convective heat transfer coefficient with an accuracy rate of 98%. Akpınar and Das [] have designed a forced convection solar energy food drying system. In this drying system they dried the mushrooms. They calculated the moisture content values (MC), drying rate values (DR) and moisture content (MR) values of the mushroom product. They obtained a predictive model by using artificial neural network algorithm (ANN) for MC, DR and MR values.
In this study, the drying behavior of sliced apple product of about 15 mm in thickness in a solar air collector dryer was investigated at a drying air speed of 0.7–1.8 m/s at 46–63 °C air temperature. Drying behavior of apple slices for three days was examined. The thermal efficiency of the solar collector in the solar drying system was calculated. The transfer of liquid mass in the apple product which is dried with the help of hot air produced from solar collector was examined. Mass change was expressed by moisture content (MR). For modeling MR values, 12 different mathematical models and decision tree algorithm which is machine learning algorithm were used.
2. Materials and Methods
2.1. Experimental Setup
The solar drying system consists of three main parts: (i) solar air collector (ii) drying cabinet and (iii) circulation fan. The flowchart and experiment set of the thin layer forced solar drying process is given in Figure 1 and Figure 2.
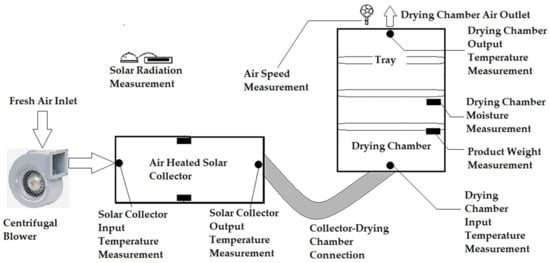
Figure 1.
Flowchart of drying process and measurement points.
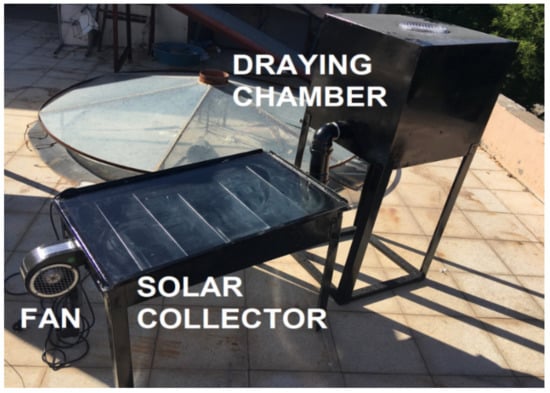
Figure 2.
Experimental setup.
Drying experiments began in the open sunny weather and test started at 8:00 a.m. and continued till 18:00 in Elazig, Turkey. Elazig is locating at 38°60′ N and 39°28′ E and 950 m above sea level in the eastern part of Anatolia, Turkey. The solar collector used in the experiments is 1000 mm × 600 mm and consists of transparent cover, absorber plate, flat plate, insulation material and outer casing. Also used was glass as transparent cover, corrugated stainless steel sheet (thickness: 0.5 mm) painted as black matt as absorber plate (thickness: 0.5 mm), stainless steel sheet (thickness: 0.5 mm) painted as flat mat, stone wool (thickness: 4 cm) as insulating material and as casing material aluminum (thickness: 4 mm) is used. The drying cabinet is made of aluminum material (thickness: 2 mm) and is designed in rectangular dimensions (60 cm × 60 cm × 80 cm). Insulated plastic tubing is used to transfer heated air between the solar collector and the drying cabinet. In the experiments, air temperature and relative humidity, inlet and outlet temperatures of the air in the solar collector, moisture of the air in the chamber, inlet and outlet temperatures of chamber, solar radiation values and mass loss values of apples in the drying chamber measured 30 min apart. The experiments continued until the weight of the apple slices changed. If the weight change of the apple slices continued after 18:00, the experiments were restarted at 8:00 am the next day. The mass loss of apple slices was neglected during the time the experiments were not performed. After 18.00, the experiments were terminated because the solar radiation value was low (I < 300 W/m2K). During the experiment, the mean relative humidity of the air ranged between 7% and 15%. After the test, the raw materials were kept in airtight environment. A circulating fan (0.9 m³/h, 0.4 kW, 220 V, 50 Hz) connected to the air inlet of the solar collector carried out heat transfer by forced convection in the drying chamber.
According to the moisture analyzer, the initial wet base moisture content of raw material was measured as 83.6% and the dry base moisture content was 4.31 (g liquid / g solids).
In the experimental study, weight change of apple product, solar collector input-output temperatures, drying room input-output temperatures and solar radiation measurements were made. The moisture content, moisture rate and solar collector yield values were calculated with the values obtained from these measurements.
The instruments used and the sensitivity values for the measurements performed in the experiments are shown in Table 2.
Table 2.
Measurement Tools.
The uncertainty value of the measurements made in the experiment set was based on the method found by Kline and McClintock (Equation (2)) [,]. In Equation (2), x represents uncertainty properties and W represents uncertainty value. In this study, the uncertainty analysis calculated for various measurements is shown in Table 3.
Table 3.
Uncertainty Analysis Results.
2.2. Theoretical Information
Some general equations used in the drying analysis of the system are given below. Equations (2) and (3) were used for dry base moisture content (MCk) and wet base moisture content (MCy) values in apples []. MCy is the moisture content value in percent, and MCk is the moisture content obtained by the ratio of liquid to dry matter in the raw material.
Equations (2) and (3); “Ww” is the wet weight of material and “Wd” is the dry weight of material. Dimensionless moisture content (MR) values were calculated using Equation (4) [].
In Equation (4), M is the moisture, Me is the equilibrium moisture, Mo is the first moisture content. In solar air collector, the useful energy is calculated with the help of Equation (5) depending on the inlet and outlet temperature of the air passing through the collector.
In Equation (5), ṁ is the mass flow (kg/s) of the air passing through the collector, Cp is the specific heat of the air (J/kgK), Ti and To are the collector air inlet and outlet temperatures (°C) respectively. The mass flow rate of the air passing through the collector was calculated by Equation (6).
In Equation (6), ρ is the density of the air (kg/m3), V is the air flow rate (m/s), and Ak is the collector’s cross-sectional area (m2). Using the first law of thermodynamics, the thermal efficiency of the collector was calculated with the help of Equation (7).
In Equation (7), η is thermal efficiency, I is the solar radiation (W/m2) coming to the collector surface, and Ac is the absorber plate surface area (m2) directly hit by the solar radiation.
2.3. Semi-Theoretical Models and Experimental Drying Equations Developed for Slow Speed Drying Phase
Moisture conduction that occurs in the material during the drying phase with decreasing speed is tried to be explained by simulating Newton’s law on cooling. The law in question states that the amount of change in the temperature of an object placed in an environment whose temperature is considered to be unchanged provided that the temperature difference between the object and the environment is not too large is proportional to the difference between the object and ambient temperatures. This law can be shown in mathematics with the following equations [].
The change in the moisture of any material contained in an environment considered to be unchanged with moisture content can be achieved by Equation (9) as follows.
The solution of the differential equation in Equation (10) is as follows [];
The expression “k” in Equation (11) is called the drying constant and its unit is h−1 or s−1. Drying constant is determined by using experimental data according to the raw material to be dried and drying conditions. Equation (9), which is the most widely used in semi-theoretical models, is defined as the Newton model. When the results calculated with the help of Equation (9) are compared with the experimental results, it is seen that the obtained values show a good agreement with the first part of the decreasing speed stage, but some deviations occur in the second part []. Therefore, semi-theoretical and empirical models have been developed by some researchers to explain the drying curves. These models are presented in Table 4.
Table 4.
Some drying curve models in the literature.
2.4. Decision Tree
Decision tree is a classification and pattern identification algorithm that has been widely used in the literature in recent years. The most important reason for the widespread use of this method is that the rules used to form tree structures are understandable and simple []. The basic structure of a decision tree consists of three basic parts called nodes, branches and leaves, as shown in Figure 3. In this tree structure, each attribute (air velocity, temperature etc.) is represented by a node. Branches and leaves are other elements of the tree structure. The last and the upper part of the tree is called root. The parts between the roots and leaves are expressed as branches []. In other words, a tree structure; a root node containing data, internal nodes (branches), and end nodes (leaves). The basic principle in constructing a decision tree structure by using the attribute information of the training data can be expressed as a series of questions about the data and concluding in the shortest time by acting on the answers obtained. In this way, the decision tree collects the answers to the questions and creates decision rules. The root node, which is the first node of the tree, begins with question for the classification of the data and the structure of the tree, and this process continues until the nodes or leaves without branches are found [].
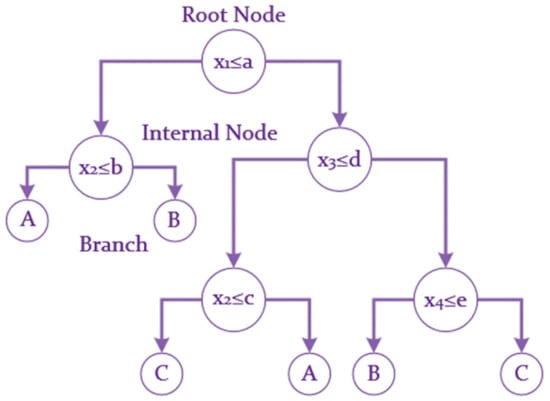
Figure 3.
Decision tree structure consisting of three classes with four-dimensional property space.
Figure 3 shows a simple tree structure consisting of four-dimensional attribute values of three classes. In the figure xi attribute values; the a, b, c, d, and e values represent the threshold values for the branching and the A, B and C class labels.
In this study, collector inlet temperature (Tg), collector outlet temperature (Tc), drying chamber inlet–outlet temperatures (Tkg, Tkc), drying chamber humidity values (N), solar radiation values (I), collector efficiency values with decision tree algorithm moisture values (MR) were estimated using (n) and drying air velocity values (V). The decision tree and tree equations generated by the decision tree algorithm are shown in Figure 4 and Table 5. The decision tree method, which is used for estimating the MR values of apple, was applied by using WEKA 3.1 software. The M5P algorithm was used in WEKA software. Figure 4 shows the tree structure used by the alternating decision tree algorithm to estimate MR values. In Figure 4, the MR values were estimated according to the rules in the branches of trees depending on the values of N, Tg, Tc, V and Tkg in the decision tree algorithm.
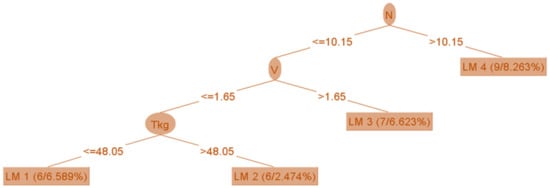
Figure 4.
The decision tree algorithm structure for the estimation of MR values.
Table 5.
Linear model (LM) equations of MR values in the decision tree algorithm.
In Figure 4, the drying cabinet moisture (N) parameter forms the root part of the tree. V and Tkg forms the inner root. LM 1–4 forms the leaves. The ADTree algorithm continues to apply rules until the data is separated by the decisions in the branches and reaches the LM values. The ADTree algorithm sets the rules and roots randomly.
The RMSE error analysis used for the accuracy analysis of the mathematical models created for the moisture content values obtained from the apple drying experiments and the predictive model generated by the decision tree algorithm are given in Table 6 [].
Table 6.
Error Analysis, Formula and Parameters.
The equations expressing the drying curves used for the apple product in Table 3 were analysed with the help of Statistica 7.0 program as well as the MR values and time values (min) of apple product. The Statistica 7.0 program and constant coefficients of 12 models and MR values of 12 models were obtained.
3. Results
Since the drying trays in the drying cabinet are metal, excessive shrinkage of the raw material edges occurred during drying as shown in Figure 5. This shrinkage was caused by the fact that the metal tray had a cooking effect during drying. Apple slices were not pretreated with sodium metabisulphite before drying. For this reason, darkening of the raw material surface has occurred.
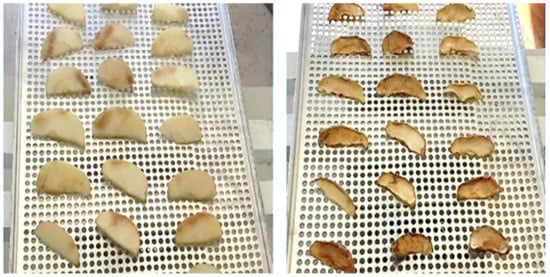
Figure 5.
Images of apple products before and after drying.
The moisture content of the apple product dried in a solar food dryer is shown in Figure 6. According to Figure 6, the MCy value varied between 83.1% and 21.5%. The MCk values ranged from 4.9 to 0.3.
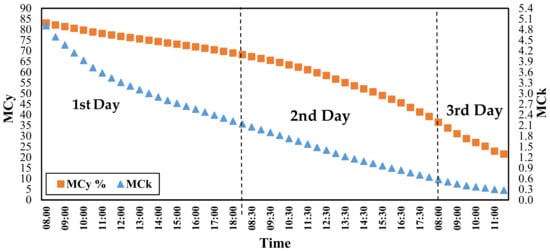
Figure 6.
Variation of moisture content values with time.
Figure 7 shows the thermal efficiency values of the air-heated solar collector in the solar drying system during the drying period. The thermal efficiency of the collector reaches the maximum between 12:00 noon and 13:30 during the three-day drying period. The reason for this is that the sun’s rays reach the collector at a more acute angle than other time periods.
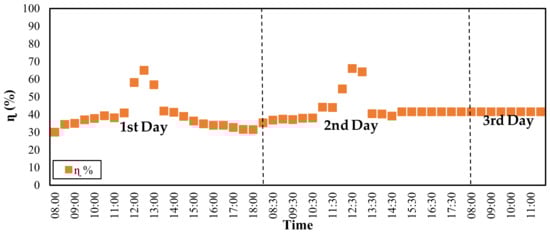
Figure 7.
Variation of thermal efficiency (η) values with time.
Figure 8 shows the thermal efficiency and drying chamber air velocity of the air-heated solar collector in the solar drying system for three days (drying time of apple slices). The highest thermal efficiency during the day was generally calculated between 12:00 and 14:00. Air velocity values also increased in the same time periods.
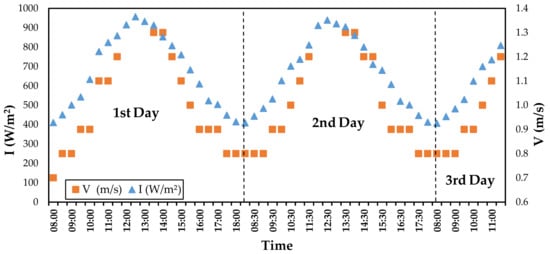
Figure 8.
Variation of solar radiation (I) and air velocity (V) values with time.
Figure 9 shows the moisture ratio (MR) and mass change (m) values of apple slices. The weight of apple slices decreased from 238.6 g to 51.4 g. MR moisture content of the apple product dried in the drying system is shown in Figure 9. In Figure 9, MR values range from 1 to 0.0058.
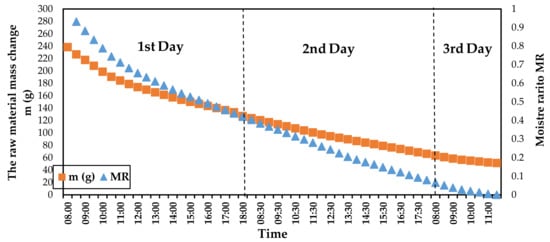
Figure 9.
Variation of the raw mass change (m) and moisture ratio (MR) values with time.
Among the 12 different drying models examined for the MR values of the raw material dried in the drying system, the model expressing the drying behavior of apples is the Midilli–Küçük model. The coefficients of the models and the results of RMSE error analysis are given in Table 7. According to Table 7, among the other models, the model with the least error value with 0.0908 RMSE error result is the Midilli–Küçük model.
Table 7.
Statistical analysis results of 12 models applied to MR values.
The estimated MR values using the decision tree and the MR values obtained by the Midilli–Küçük model are shown in Figure 10.
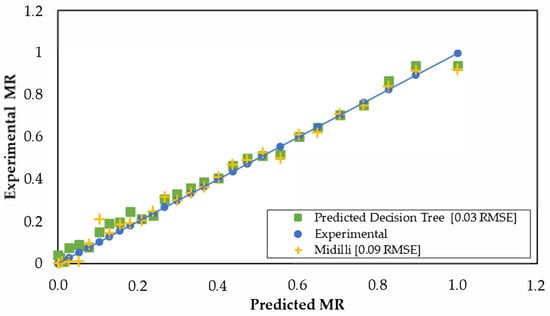
Figure 10.
Experimental and predictive MR values.
According to Figure 10, the MR values obtained by the decision tree algorithm are closer to the experimental MR values. The results of the RMSE analysis of the model created by the decision tree algorithm and the Midilli–Küçük model are given in Table 8. According to Table 8, the model created with the decision tree has a lower RMSE error rate than the Midilli–Küçük model.
Table 8.
Results of RMSE.
4. Conclusions
There are no studies in the literature regarding the modelling of mass transfer of the raw material in food drying systems using both mathematical and computational intelligence methods. In this study, 15-mm-thick apple product was dried in solar energy food drying system. Twelve different models on the apple product in the literature, which can best express the drying behaviour, were examined. MR values of moisture content of apple products were obtained with 12 different models. At the same time, MR values of apple product were modelled by using the decision tree algorithm. According to Table 7, among the 12 mathematical models, the best model expressing the drying behaviour of the apple product according to the RMSE value (0.0908) was the Midilli–Küçük model. The MR values obtained by the decision tree algorithm have a lower RMSE value (0.03) than the MR values obtained by the Midilli–Küçük model according to Table 8.
As a result, the MR values btained by the decision tree algorithm according to Figure 10 and Table 8 are closer to the MR values obtained from the experiments and the model generated by decision tree algorithm has successfully estimated the MR values. With the decision tree algorithm, preliminary information about the raw material to be dried can be obtained by using linear equation obtained depending on the characteristics of the drying system. This model on mass transfer can also be used for convective heat transfer coefficient. Thus, this study can be added to the literature among the different studies related to estimating the thermophysical properties of the raw material to be dried. Using different mathematical models and using different drying systems, the drying behaviour of the apple product can be expressed with fewer errors. Furthermore, more data can be obtained by using different raw materials, and less error models can be obtained by applying a different computational intelligence method.
Author Contributions
A.B.D. supervised all aspects of the research, developed computational intelligence methods and wrote the paper.
Conflicts of Interest
The author declares no conflict of interest.
Abbreviations
The following abbreviations are used in this manuscript:
| AC | Absorber plate surface exposed to solar radiation (m2) |
| Ak | Air outlet cross-sectional area of the collector (m2) |
| Cp | Specific heat value of drying air (kJ/kgK) |
| I | Solar radiation reaching the collector surface (W/m2) |
| MR | Moisture rate (gwater/gsolid) |
| Mo | Initial moisture content of raw material (gwater/gsolid) |
| Mt | Moisture content of raw material at time "t" (gwater/gsolid) |
| Mt+Δt | Moisture content of raw material at time “t+Δt” (gwater/gsolid) |
| Me | Equilibrium moisture (gwater/gsolid) |
| M | Moisture content (% or gwater/gsolid) |
| t | Time (min) |
| Ti | Collector air inlet temperature (°C) |
| To | Collector air outlet temperature (°C) |
| T | Dry thermometer temperature of the drying air (°C) |
| Te | The raw material surface temperature (°C) |
| V | Air velocity (m/s) |
| ρ | Air density (kg/m3) |
| ṁ | Mass flow rate (kg/s) |
| η | Thermal efficiency (%) |
References
- Montero, I.; Miranda, T.; Arranz, J.I.; Rojas, C.V. Thin Layer Drying Kinetics of By-Products from Olive Oil Processing. Int. J. Mol. Sci. 2011, 12, 7885–7897. [Google Scholar] [CrossRef]
- Gunasekaran, S. Pulsed microwave-vacuum drying of food material. Dry. Technol. 1999, 17, 395–412. [Google Scholar] [CrossRef]
- Yagcioglu, A.F. Drying Characteristic of Laurel Leaves under Different Conditions. In Proceedings of the 7th International Congress on Agricultural Mechanization and Energy, İzmir, Turkey, 26–27 May 1999; pp. 565–569. Available online: https://www.researchgate.net/publication/296695885_Drying_Characteristics_of_Laurel_Leaves_Under_Different_Drying_Conditions (accessed on 5 September 2019).
- Azouma, Y.O.; Drigalski, L.; Jegla, Z.; Reppich, M.; Turek, V.; Weiß, M. Indirect Convective Solar Drying Process of Pineapples as Part of Circular Economy Strategy. Energies 2019, 12, 2841. [Google Scholar] [CrossRef]
- Kabeel, A.E.; Abdelgaied, M. Performance of novel solar dryer. Process Saf. Environ. Prot. 2016, 102, 183–189. [Google Scholar] [CrossRef]
- Atalay, H.; Çoban, M.T.; Kıncay, O. Modeling of the drying process of apple slices: Application with a solar dryer and the thermal energy storage system. Energy 2017, 134, 382–391. [Google Scholar] [CrossRef]
- Blanco-Cano, L.; Soria-Verdugo, A.; Garcia-Gutierrez, L.M.; Ruiz-Rivas, U. Modeling the thin-layer drying process of Granny Smith apples: Application in an indirect solar dryer. Appl. Therm. Eng. 2016, 108, 1086–1094. [Google Scholar] [CrossRef]
- Al-Neama, M.A.; Farkas, I. Thermal efficiency of vertical and horizontal-finned solar collector integrated with forced air circulation dryer for Apple as a sample. Dry. Technol. 2019, 37, 546–558. [Google Scholar] [CrossRef]
- Yaldiz, O.; Ertekin, C.; Uzun, H.I. Mathematical modeling of thin layer solar drying of sultana grapes. Energy 2001, 26, 457–465. [Google Scholar] [CrossRef]
- Akpinar, E.K. Determination of suitable thin layer drying curve model for some vegetables and fruits. J. Food Eng. 2006, 73, 75–84. [Google Scholar] [CrossRef]
- Akpınar, E.K.; Midilli, A.; Biçer, Y. Single Layer Drying Behavior of Potato Slices in A Convective Cyclone Dryer and Mathematical Modeling. Energy Convers. Manag. 2003, 44, 1689–1705. [Google Scholar] [CrossRef]
- Midilli, A. Determination of Pistachio Drying Behavior and Conditions in a Solar Drying System. Int. J. Energy Res. 2001, 25, 715–725. [Google Scholar] [CrossRef]
- Nguyen, T.V.L.; Nguyen, M.D.; Nguyen, D.C.; Bach, L.G.; Lam, T.D. Model for Thin Layer Drying of Lemongrass (Cymbopogon Citratus) by Hot Air. Processes 2019, 7, 21. [Google Scholar] [CrossRef]
- Aktaş, M.; Şevik, S.; Özdemir, M.B.; Gönen, E. Performance analysis and modeling of a closed-loop heat pump dryer for bay leaves using artificial neural network. Appl. Therm. Eng. 2015, 87, 714–723. [Google Scholar] [CrossRef]
- Beigi, M.; Torki-Harchegani, M.; Tohidi, M. Experimental and ANN modeling investigations of energy traits for rough rice drying. Energy 2017, 141, 2196–2205. [Google Scholar] [CrossRef]
- Das, M.; Akpinar, E.K. Investigation of Pear Drying Performance by Different Methods and Regression of Convective Heat Transfer Coefficient with Support Vector Machine. Appl. Sci. 2018, 8, 215. [Google Scholar] [CrossRef]
- Das, M.; Akpinar, K.E. Mushroom Drying in Air Heated Solar Collector Drying System and Modeling of Drying Performance with Artificial Neural Network. Erzincan Univ. J. Sci. Technol. 2018, 11, 23–30. [Google Scholar] [CrossRef]
- Kline, S.J.; McClintock, F.A. Describing Uncertainties in Single-Sample Experiments. Mech. Eng. 1953, 75, 3–8. [Google Scholar]
- Holman, J.P. Experimental Methods for Engineers, 5th ed.; Mc-Graw Hill Company: New York, NY, USA, 1989. [Google Scholar]
- Mujumdar, A.S.; McCabe, S. Fluidized Bed Drying Technology. In Mujumdar’s Practical Guide to Industrial Drying; Devahastin, S., Ed.; Exergex Corporation: Montreal, QC, Canada, 2000. [Google Scholar]
- McCabe, W.L.; Smith, J.C. Unit Operations of Chemical Engineering, 3rd ed.; McGraw-Hill: New York, NY, USA, 1976; Volume 521. [Google Scholar]
- El-Beltagy, A.; Gamea, G.R.; Essa, A.H.A. Solar drying characteristics of strawberry. J. Food Eng. 2007, 78, 456–464. [Google Scholar] [CrossRef]
- Akoy, E.O.M. Experimental characterization and modeling of thin-layer drying of mango slices. Int. Food Res. J. 2014, 21, 1911–1917. [Google Scholar]
- Vega, A.; Fito, P.; Andr’es, A.; Lemus, R. Mathematical modeling of hot-air drying kinetics of red bell pepper (var. Lamuyo). J. Food Eng. 2007, 79, 1460–1466. [Google Scholar] [CrossRef]
- Hashim, N.; Onwude, D.; Rahaman, E. A preliminary study: Kinetic model of drying process of pumpkins (Cucurbita Moschata) in a convective hot air dryer. Agric. Sci. Procedia 2014, 2, 345–352. [Google Scholar] [CrossRef]
- Rayaguru, K.; Routray, W. Mathematical modeling of thin-layer drying kinetics of stone apple slices. Int. Food Res. J. 2012, 19, 1503–1510. [Google Scholar]
- Sacilik, K. Effect of drying methods on thin-layer drying characteristics of hull-less seed pumpkin (Cucurbita Pepo L.). J. Food Eng. 2007, 79, 23–30. [Google Scholar] [CrossRef]
- Dash, K.K.; Gope, S.; Sethi, A.; Doloi, M. Star fruit slices. Int. J. Agric. Food Sci. Technol. 2013, 4, 679–686. [Google Scholar]
- Omolola, A.O.; Jideani, A.I.O.; Kapila, P.F. Modeling microwave-drying kinetics and moisture diffusivity of Mabonde banana variety. Int. J. Agric. Biol. Eng. 2014, 7, 107–113. [Google Scholar]
- Yaldız, O.; Ertekin, C. Thin-layer solar drying of some vegetables. Dry. Technol. 2007, 19, 583–597. [Google Scholar] [CrossRef]
- Zenoozian, M.S.; Feng, H.; Shahidi, F.; Pourreza, H.R. Image analysis and dynamic modeling of thin-layer drying of osmotically dehydrated pumpkin. J. Food Process. Preserv. 2008, 32, 88–102. [Google Scholar] [CrossRef]
- Akpinar, E.K. Mathematical modeling of thin-layer drying process under open sun of some aromatic plants. J. Food Eng. 2006, 77, 864–870. [Google Scholar] [CrossRef]
- Midilli, A.; Küçük, H.; Yapar, Z. A New Model for Single-Layer Drying. Dry. Technol. 2002, 20, 1503–1513. [Google Scholar] [CrossRef]
- Freeman, J.A.; Skapura, D.M. Neural Networks Algorithms. In Applications and Programming Techniques; Addison-Wesley Publishing Company: New York, NY, USA, 1991. [Google Scholar]
- Demirpolat, A.B.; Das, M. Prediction of Viscosity Values of Nanofluids at Different pH Values by Alternating Decision Tree and Multilayer Perceptron Methods. Appl. Sci. 2019, 9, 1288. [Google Scholar] [CrossRef]
- Alic, E.; Das, M.; Kaska, O. Heat Flux Estimation at Pool Boiling Processes with Computational Intelligence Methods. Processes 2019, 7, 293. [Google Scholar] [CrossRef]
- Daş, M.; Balpetek, N.; Kavak Akpınar, E.; Akpınar, S. Investigation of wind energy potential of different provinces found in Turkey and establishment of predictive model using support vector machine regression with the obtained results. J. Fac. Eng. Archit. Gazi Univ. 2019, 34, 2203–2214. [Google Scholar] [CrossRef]
© 2019 by the author. Licensee MDPI, Basel, Switzerland. This article is an open access article distributed under the terms and conditions of the Creative Commons Attribution (CC BY) license (http://creativecommons.org/licenses/by/4.0/).