Article

Experimental and Simulation Studies on Adsorption and Diffusion Characteristics of Coalbed Methane

1
Department of Mineral Resources and Energy Engineering, Chonbuk National University, 567 Baekje-daero, Deokjin-gu, Jeonju-si, Jeollabuk-do 561-756, Korea
2
Korea Gas Corporation, 638-1 Sangnok-gu, Ansan, Gyoggi-do 15328, Korea
*
Author to whom correspondence should be addressed.
These authors equally contribute to this work.
Energies 2019, 12(18), 3445; https://doi.org/10.3390/en12183445
Submission received: 2 July 2019 / Revised: 10 August 2019 / Accepted: 3 September 2019 / Published: 6 September 2019
(This article belongs to the Special Issue Development of Unconventional Reservoirs)

Abstract

:
Coalbed methane (CBM) content is generally estimated using the isotherm theory between pressure and adsorbed amounts of methane. It usually determines the maximum content of adsorbed methane or storage capacity. However, CBM content obtained via laboratory experiment is not consistent with that in the in-situ state because samples are usually ground, which changes the specific surface area. In this study, the effect of the specific surface area relative to CBM content was investigated, and diffusion coefficients were estimated using equilibrium time analysis. The differences in adsorbed content with sample particle size allowed the determination of a specific surface area where gases can adsorb. Also, there was an equilibrium time difference between fine and lump coal, because more time is needed for the gas to diffuse through the coal matrix and adsorb onto the surface in lump coal. Based on this, we constructed a laboratory-scale simulation model, which matched with experimental results. Consequently, the diffusion coefficient, which is usually calculated through canister testing, can be easily obtained. These results stress that lump coal experiments and associated simulations are necessary for more reliable CBM production analysis.

Graphical Abstract

1. Introduction

Coalbed gas, coalbed methane (CBM), and coalbed natural gas are terms that refer to the characteristic gases adsorbed in coal [1]. CBM development began in the San Juan basin in the mid-1980s, and CBM production became a new industry in the oil and gas domain [2]. CBM is often extracted from depths lower than conventional natural gas wells, and the methane storage capacity in coal layers is 2–3 times higher than conventional gas reservoirs at the same depth and pressure. Therefore, CBM is usually easier to develop than a traditional natural gas reservoir [3].
CBM is generated during the maturation of organic matter and by microbes residing in coal seams [4]. CBM is composed of methane, with minor amounts of carbon dioxide and nitrogen [5]. Of the produced gas, 98% is adsorbed via van der Waals forces onto the surface of the organic matter. The remaining 2% is compressed in natural cracks or dissolved during water formation [6]. The essential elements in determining gas content are the coal rank and the burial depth. Commonly, a higher coal rank and increased depth denote higher gas content [7].
Typically, the internal surface area of coal, which has a significant impact on its ability to contain methane, differs with coal rank and composition. The internal surface area in the coalbed, which greatly affects the ability to contain CH4, usually varies according to the rank and composition of the coal; the largest value is observed in bituminous coal, followed by anthracite. Among components, the largest value is observed for vitrinite, and the smallest is observed for inertinite [8]. Also, physical changes cause differences in the amount of gas adsorbed. These primarily occur during the measurement of gas content in laboratories. Specific surface area is one of the main parameters that undergo physical changes. A smaller size of coal particle results in a larger internal surface area that the gas can adsorb onto [9]. Beamish and O’Donnell [10] studied the change in gas content with the increase in surface area by crushing bituminous coal to 250 mm. Zhang [11] suggested that the specific surface area increases as the coal particle size becomes smaller since the amount of ash and moisture interfering with gas adsorption decreases. Thus, a thorough understanding of all factors is essential for the accurate determination of gas content in a CBM reservoir.
Furthermore, the mechanism of gas flow through the tight coal matrix and cleats is highly complex. In particular, diffusional flow is dominant in the matrix due to low permeability. Therefore, the diffusion coefficient is a crucial factor that dramatically affects gas flow. The diffusion coefficient is roughly obtained from the sorption time in the canister test, which is time-consuming and costly.
In this study, adsorption experiments with various size fractions of coal were performed to determine the effect of specific surface area on the amount of gas adsorbed. In this manner, the diffusion flow of gas through coal with different particle sizes could be determined through the analysis of the adsorption equilibrium time. Following this, a history matching technique was applied to calculate the diffusion coefficient by combining the experimental results with the simulation results. This procedure is believed to be more economical in terms of cost and time compared with canister test. It may also serve to address the shortcomings of the indirect method and to provide a more accurate estimation of CBM.

2. Materials and Methods

2.1. Gas Content Measurement

There are two standard ways of measuring gas content, a direct method and an indirect method. The direct method measures the gas content of coal obtained during the drilling operation, and measures the volume of desorbed gas, lost gas, and residual gas via canister desorption [12]. The direct method is widely used in the petroleum industry for gas content estimation because it uses in situ samples, and the diffusion coefficient can be calculated by sorption time analysis. For this reason, it is considered to be a more reliable method than the indirect method. However, the direct method has the following disadvantages: (1) it is difficult to calculate the amount of lost gas that occurs during the core extraction from the underground to the surface; (2) the entire test process usually takes a long time, from two weeks to four months; and (3) the measurement cost is high [13].
In contrast, the indirect method can measure the maximum gas content that can be adsorbed onto the coal surface. It is generally analyzed using the sorption characteristics between coal and gas and a sorption isotherm with pressure [14]. The indirect method usually takes less time, and results are more easily obtained. However, it has the following disadvantages: (1) the physical properties of coal such as ash, moisture, cleat, and pore structure can be altered when a coal sample is crushed to appropriately sized pieces; (2) since the experiment is conducted using single-component gas, it cannot be applied directly where multi-component gases are adsorbed. Therefore, there is an inconsistency between experimental and in situ gas content.

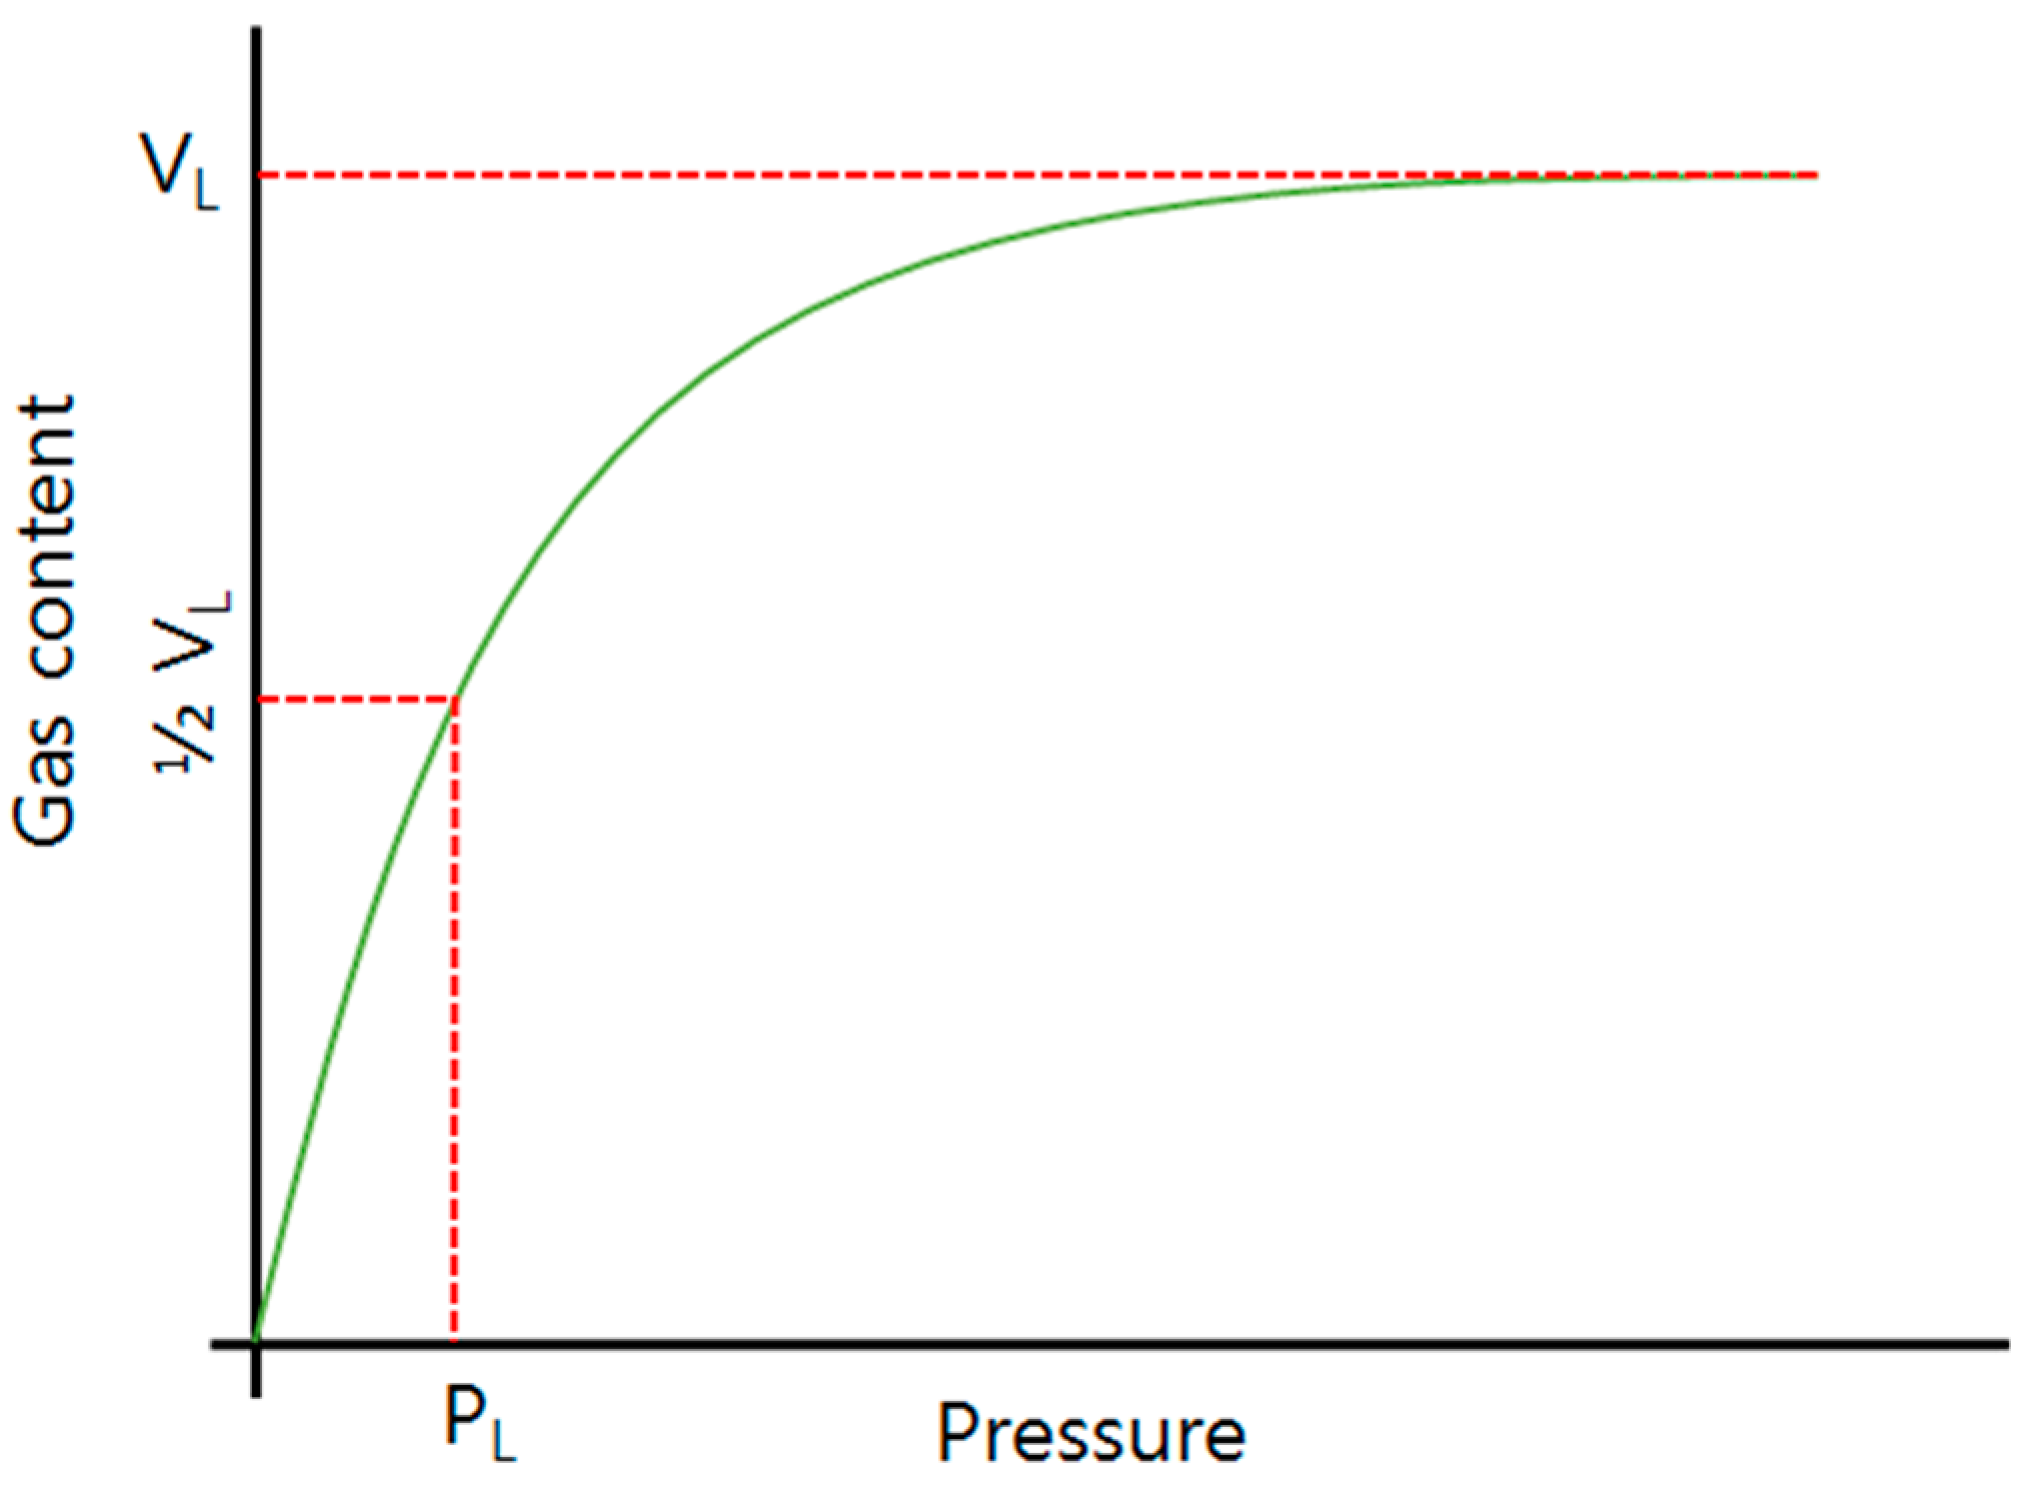
2.2. Sorption Isotherm

Gas adsorption refers to the phenomenon of gas adherence onto a solid surface. The adsorbed volume increases as pressure increases and temperature decreases. The isotherm theory is usually used to explain adsorption characteristics.
An adsorption isotherm shows the relationship between the adsorbed volume and the pressure when the adsorption equilibrium occurs at a specific temperature. Therefore, it is critical to analyze the adsorption characteristics to accurately estimate the storage capacity [15]. Until now, many previous studies applied the adsorption mechanism to different isotherm curves such as the Langmuir, Freundlich, and Brunauer–Emmett–Teller (BET) models. Among them, the Langmuir model is widely accepted in the petroleum industry. In previous CBM studies, various sorption isotherm models were tested using experimental data to find the best-fitted model, and it was found that the Langmuir isotherm model showed the lowest absolute error and a better regression value for all cases [16].
The Langmuir model is derived from the assumptions that gas has single-layer adsorption on a uniform sample surface, and the adsorption amount and the desorption amount are in a dynamic equilibrium state. More precisely, the assumptions are as follows [17]:
One gas molecule is adsorbed onto a single adsorption site;
There is no interaction between the adsorbed molecules;
The adsorbed gas has the properties of an ideal gas.
The Langmuir equation can be written in the following form, described as shown in Figure 1:
V a = V L × P P L + P ,
where VL is the maximum content of adsorbed gas, PL is the pressure at half VL, and Va is the total adsorption content.

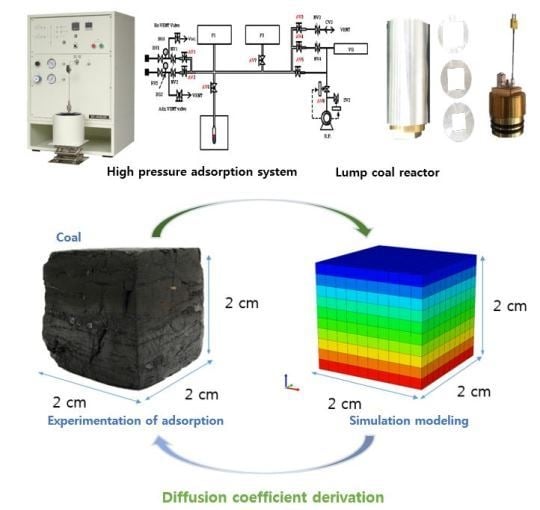
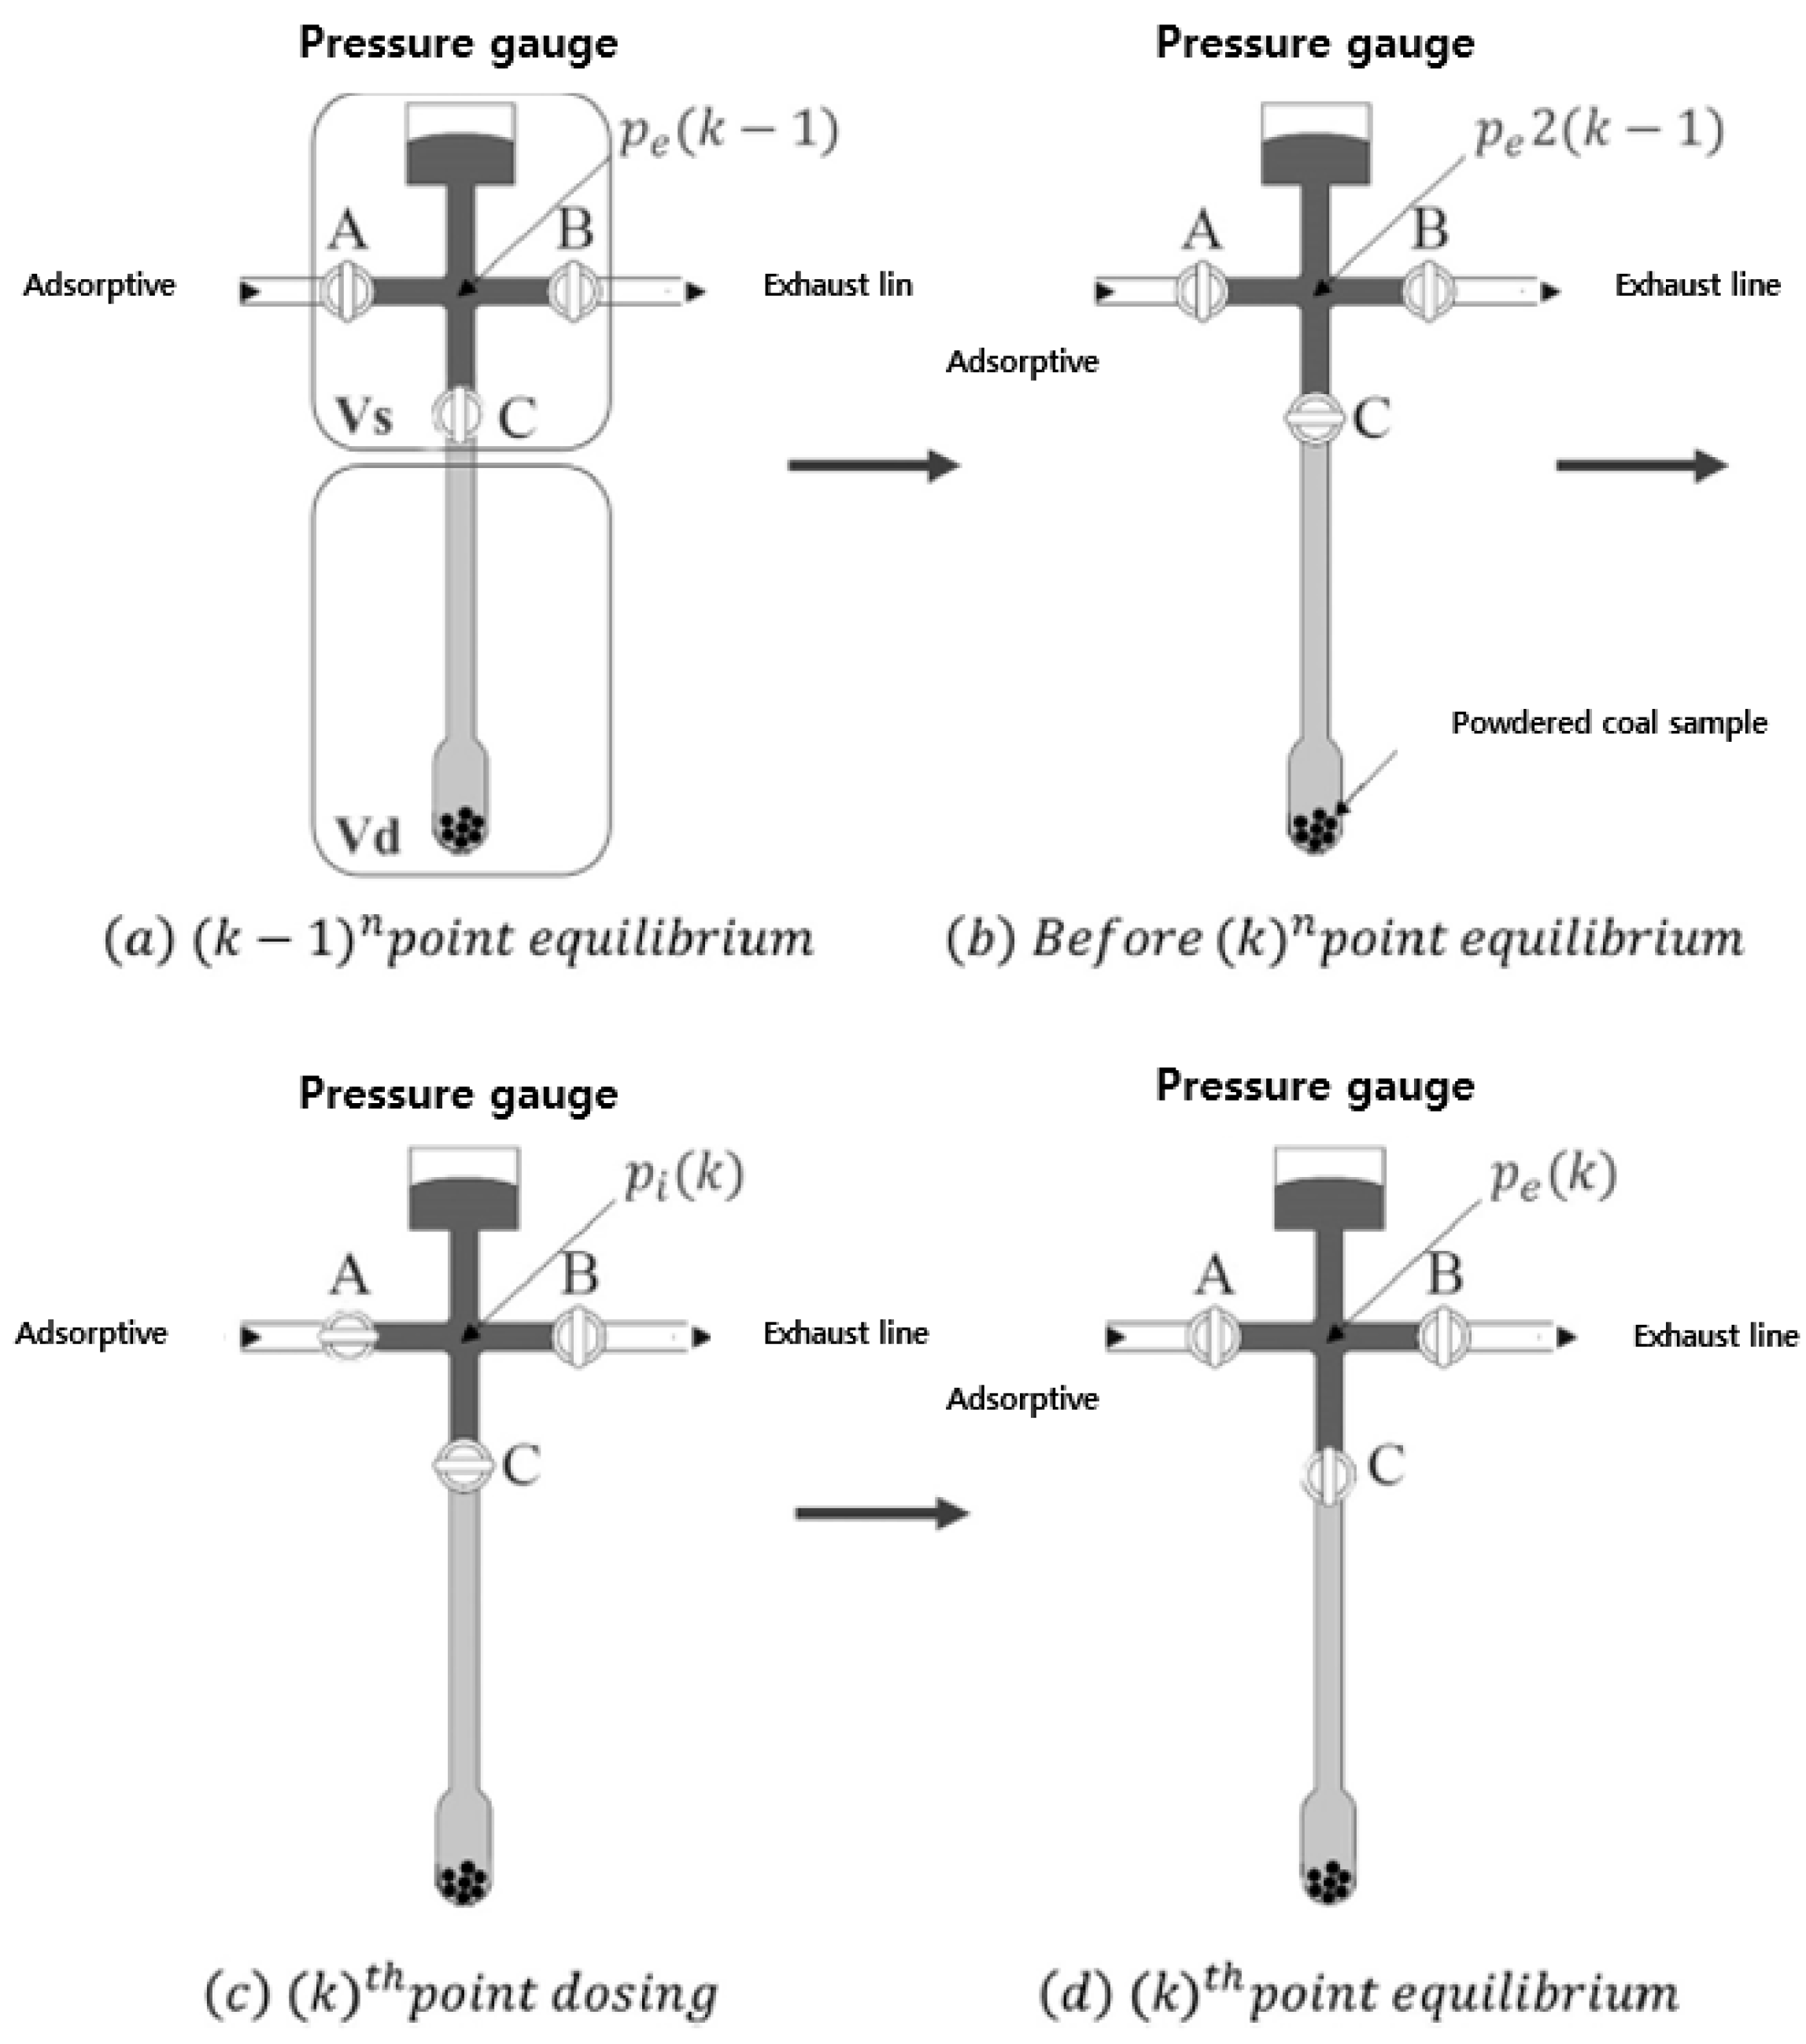
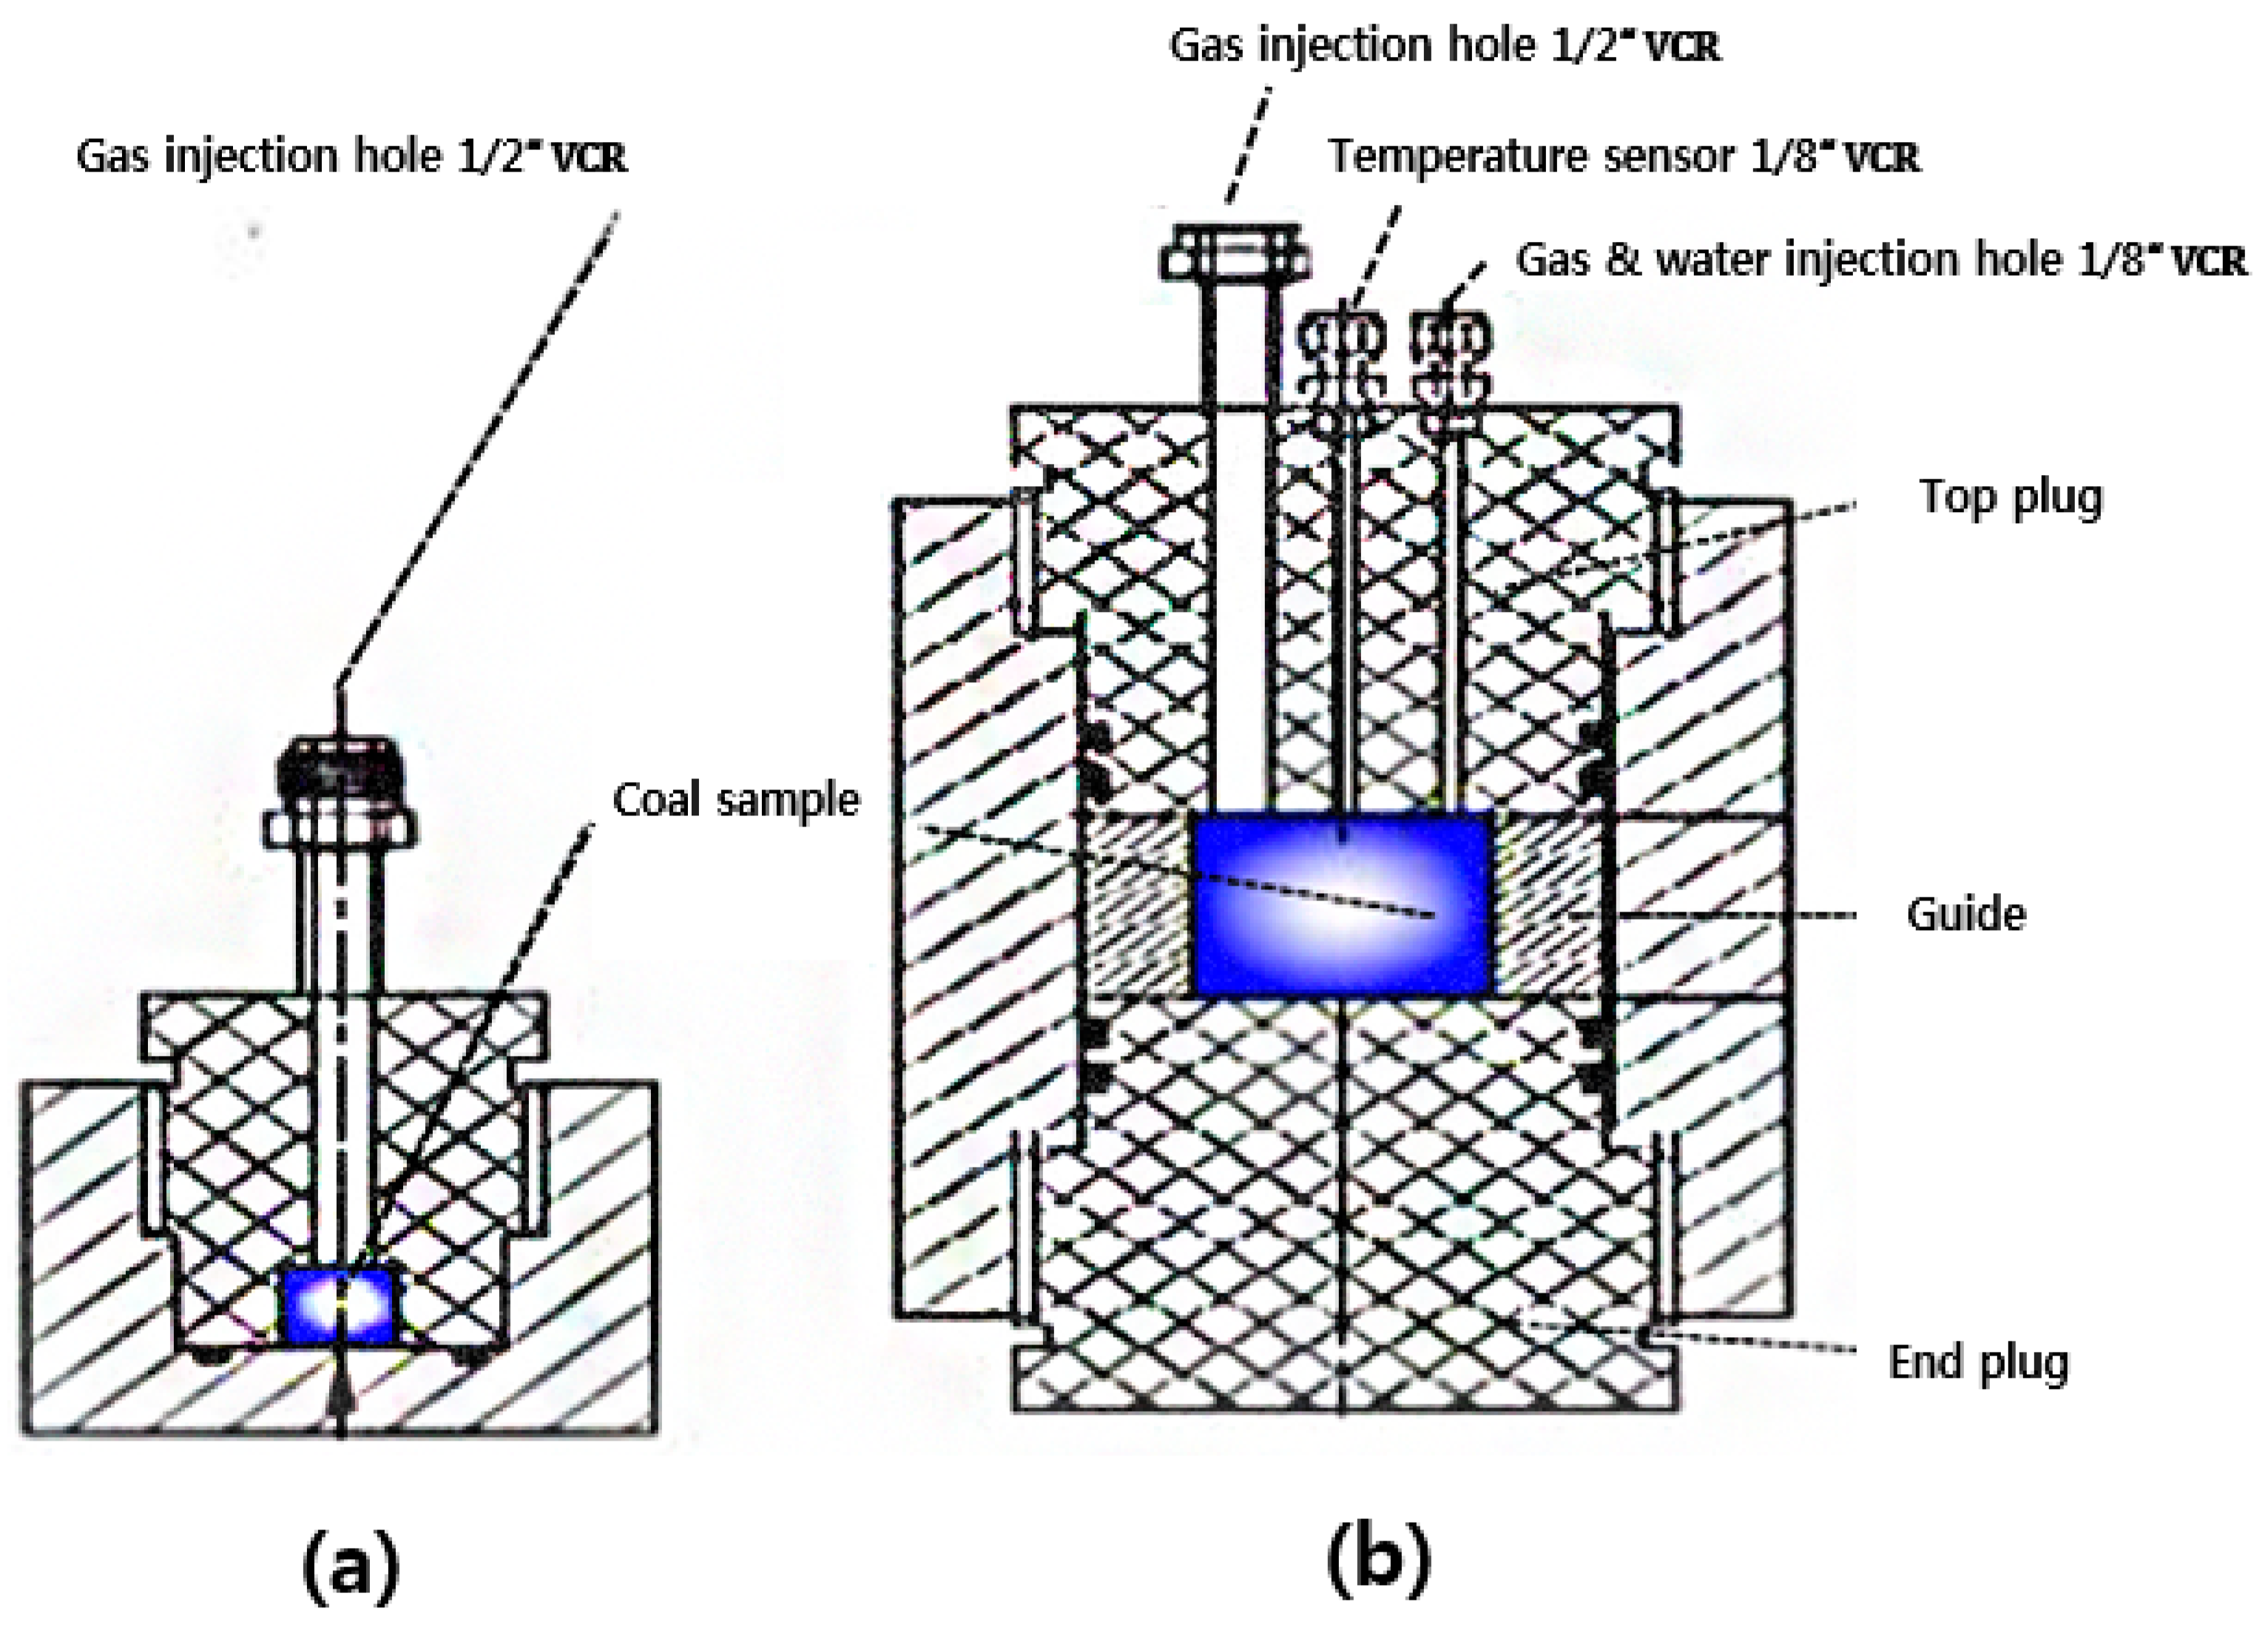
2.3. Experimental Method

The indirect methods that measure the adsorbed volume of gas include volumetric measurement and gravimetric measurement. The volumetric analysis calculates the quantities of adsorbed gas with pressure. The gravimetric measurement is a calculation method achieved by directly checking the mass change in a reactor at a constant pressure.
In this study, BELSORP high-pressure adsorption equipment, which applies the volumetric method, was used for the measurement of adsorbed gas. A schematic diagram of the apparatus is drawn in Figure 2. To calculate the adsorbed amount of gas, the gas amount remaining after adsorption was subtracted from the injected amount, since the volumetric method could not directly estimate the amount of adsorbed gas.
The volumetric method calculates the gas content of coal through four steps. With the adsorption calculation equation, the volume of adsorption is estimated according to the equation of state using the temperature and the equilibrium pressure obtained from the measurement.
The total number of moles of adsorbed gas is calculated using Equation (2), and the total volume of adsorbed gas in each step is obtained using Equation (3) [18].
V ( k ) = V ( k     1 ) + n × 22 , 414 S W ,
where V(k) is the gas volume at k step, n is the number of molecules of adsorbed gas, k is the adsorption step, and SW is the sample weight.
n = n 1 n 2 + n 3 n 4 ,
where n is the total number of molecules, and n1, n2, n3, and n4 represent each molecule of adsorbed gas calculated according to each step.
The value of n for each step can be calculated as described below (Figure 2).
The experimental apparatus used for measuring the adsorption volume is divided into two parts at the location of valve C: a reference volume area Vs, and a dead volume area Vd.
At the (k − 1)th point equilibrium, the amount of gas that did not adsorb onto the sample but remained in the gas phase, n1, is expressed as follows:
n 1 = P e ( k     1 ) × ( V s + V d ) R × T e ( k     1 ) × Z ( P e ( k     1 ) ) .
At the (k − 1)th point measurement, the amount of gas inside Vs after the C valve is closed is expressed in Equation (5), where Te(k − 1) is the absolute temperature at Pe(k − 1), Pe(k − 1) is the measured pressure when the internal pressure in Vs and Vd is at equilibrium at the (k − 1)th step, and R is the ideal gas constant (8314.102965 kPa∙cm3∙mol−1∙K−1.
n 2 = P e 2 ( k     1 ) × V s R × T e 2 ( k     1 ) × Z ( P e 2 ( k     1 ) ) .
The amount of gas inside Vd after the (k − 1)th point measurement can be expressed as follows:
n 1 n 2
At the (k)th point measurement, the amount of gas administered into Vs, n3, is given by
n 3 = P i ( k ) × V s R × T i ( k ) × Z ( P i ( k ) ) ,
where Ti(k) is the absolute temperature at Pi(k), Pi(k) is the measured pressure when the internal pressure in Vs and Vd is at equilibrium at the (k)th step.
At the (k)th point equilibrium, the amount of gas that did not adsorb onto the sample but remained in the gas phase, n4, is expressed by
n 4 = P e ( k ) × ( V s + V d ) R × T e ( k ) × Z ( P e ( k ) ) ,
where Te(k) is the absolute temperature at Pe(k), and Pe(k) is the measured pressure when the internal pressure in Vs and Vd is at equilibrium at the (k)th point.
Equation (6) is used to calculate the number of gas molecules remaining in Vd at the (k − 1)th point before the new gas is injected, while Equations (7) and (8) calculate the number of gas molecules adsorbed at the (k)th point after the new gas is injected.
Commonly, gas compressibility has to be corrected to capture real gas behavior; hence, the virial coefficient (Equation (9)) was applied using the gas property database from the NIST (National Institute of Standards and Technology) chemistry web-book (https://webbook.nist.gov) [19]. Details of the experimental procedure were provided by Kim et al. [20].
Z = 1 + B ( P ) ρ + C ( P ) ρ 2 + D ( P ) ρ 3 ,
where Z is a compressibility factor, p is the equilibrium pressure, and B(P)p, C(P)p, and D(P)p are the second, third, and fourth virial coefficients, respectively.
Since conventional reactor experiments only allow a small volume of powdered coal to be used, a new reactor which can hold a lump coal sample was newly manufactured for the test. This reactor had the following characteristics: (1) a maximum pressure of 7000 kPa and a maximum temperature of 343.14 K are achievable; (2) various sample sizes can be used with a guide to minimize the dead volume. It was possible to measure the gas content of a sample up to 6 cm long on each side (Figure 3). In Figure 3, the left and right reactors have different coal particle sizes. For the left side (a), a coal size of only 1 to 2 cm is possible. For the right side (b), various sizes of coal can be used from 1 to 6 cm. This reactor was also designed to perform not only adsorption and desorption experiments, but also other applications such as CBM production (gas + water).

3. Results and Discussion

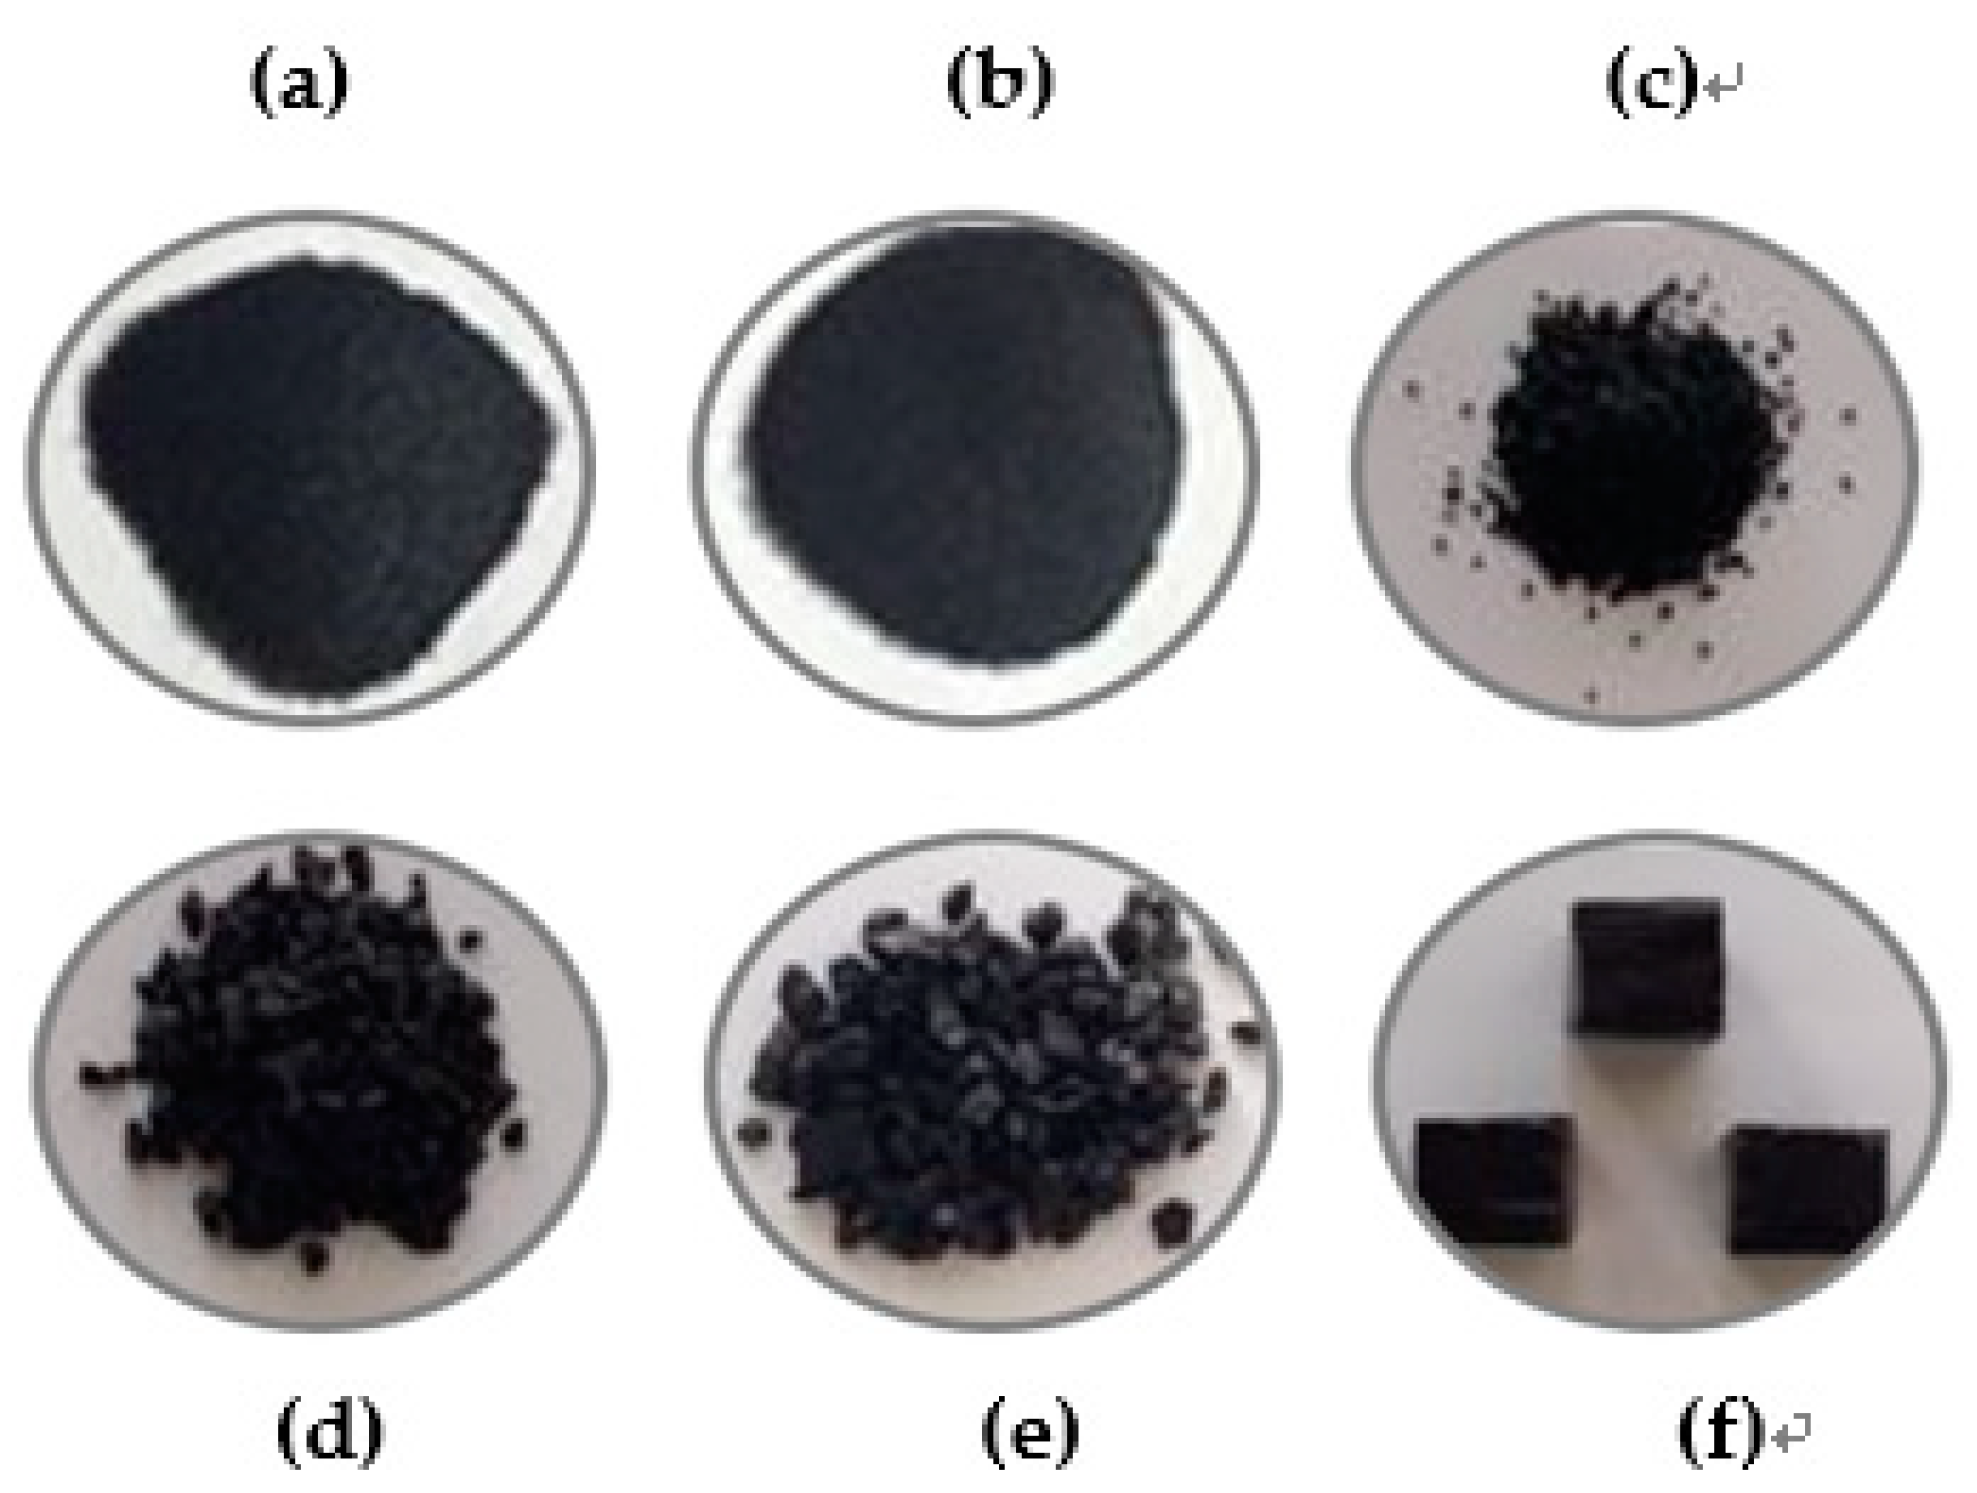
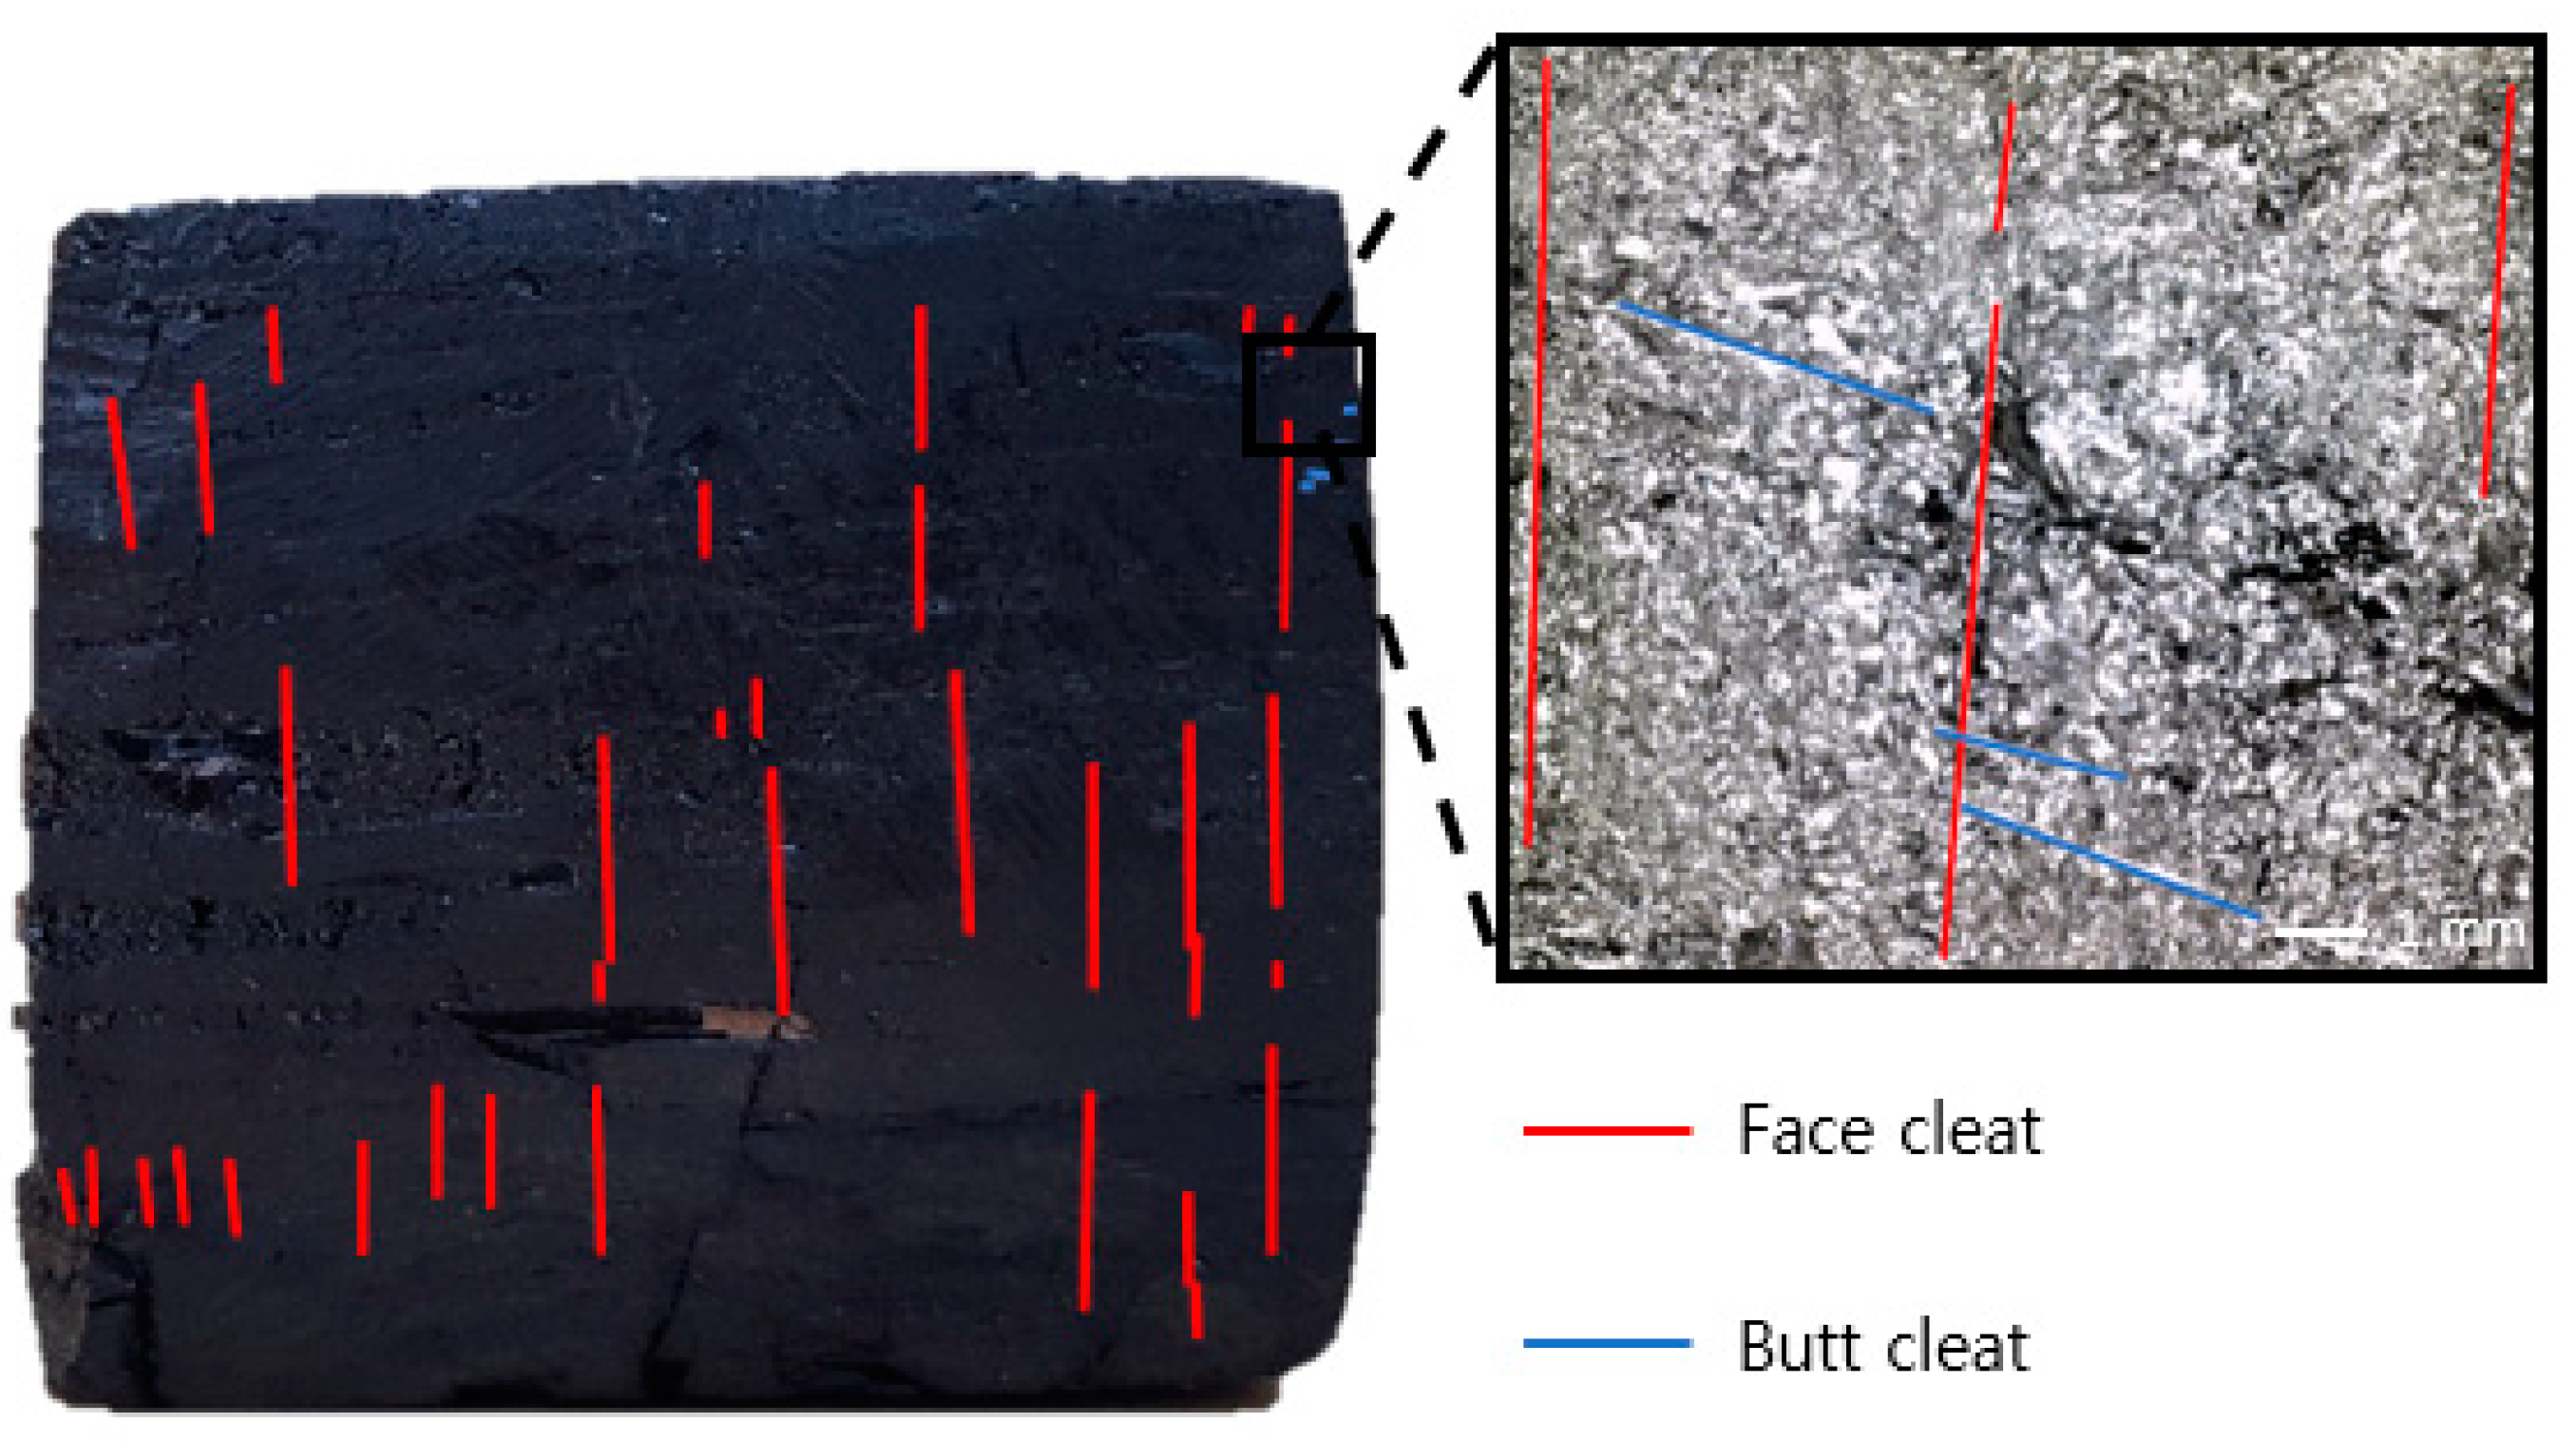
3.1. Sample Preparation

The experiment used two coal samples (coal sample group A and coal sample group B) that were obtained from CBM fields located in Indonesia and Australia. The rank types of coal included lignite, bituminous coal, and anthracite; in some cases, bituminous coal and anthracite were subdivided as sub-bituminous or semi-anthracite by carbonization degree. To check the contents of fixed carbon, volatile matter, and moisture, proximate analysis was performed. Then, the data were converted to ASTM (American Society for Testing Materials) scale using the Parr formula, shown in Equations (11) and (12) (Table 1) [21].
D r y ,   M m f r e e   F C     = F C 0.15   S 100 ( M + 1.08   A + 0.55   S ) × 100 % ,
D r y ,   M m f r e e   V M = 100 D r y ,   M m   F C ,   % ,
where FC is fixed carbon, S is sulfur, M is moisture, A is ash, and VM is volatile matter.
Coal sample group A had 2.66% natural moisture and 11.46% ash. On the other hand, coal sample group B had 1.2% inherent moisture and 18.53% ash. This shows that coal sample group B had a lower level of natural moisture and a higher portion of ash compared to coal sample group A. As a result of the analysis, since both samples of coal existed on the ground for a long time, but not underground, it was judged that contents of inherent moisture and ash were low. Therefore, we determined that the two coals were sub-bituminous considering gross calorific value.
Each coal sample was ground into six sizes: 180–252 µm, 253–508 µm, 0.5–1 mm, 2–4 mm, and 2 cm cubes (Figure 4). Then, a mortar was used to crush the small pieces of coal. After cleaning the coal samples with distilled water, a centrifuge was used to remove impurities from the coal samples. As a result of the centrifugation, the soil in the coal and tiny branches were separated. Then, the samples were kept at a temperature of 45 °C for three days.
In general, the adsorption experiments are performed in a dry ash-free (DAF) state. However, in this study, experiments were not carried out in a DAF state because it was impossible to remove ash and inherent moisture from the lump coal. Therefore, all experiments were carried out on an air-dried basis. To prevent the penetration of moisture from the air into the coal, samples were sealed in containers and stored in a temperature chamber at 45 °C prior to experiments for more than one week.

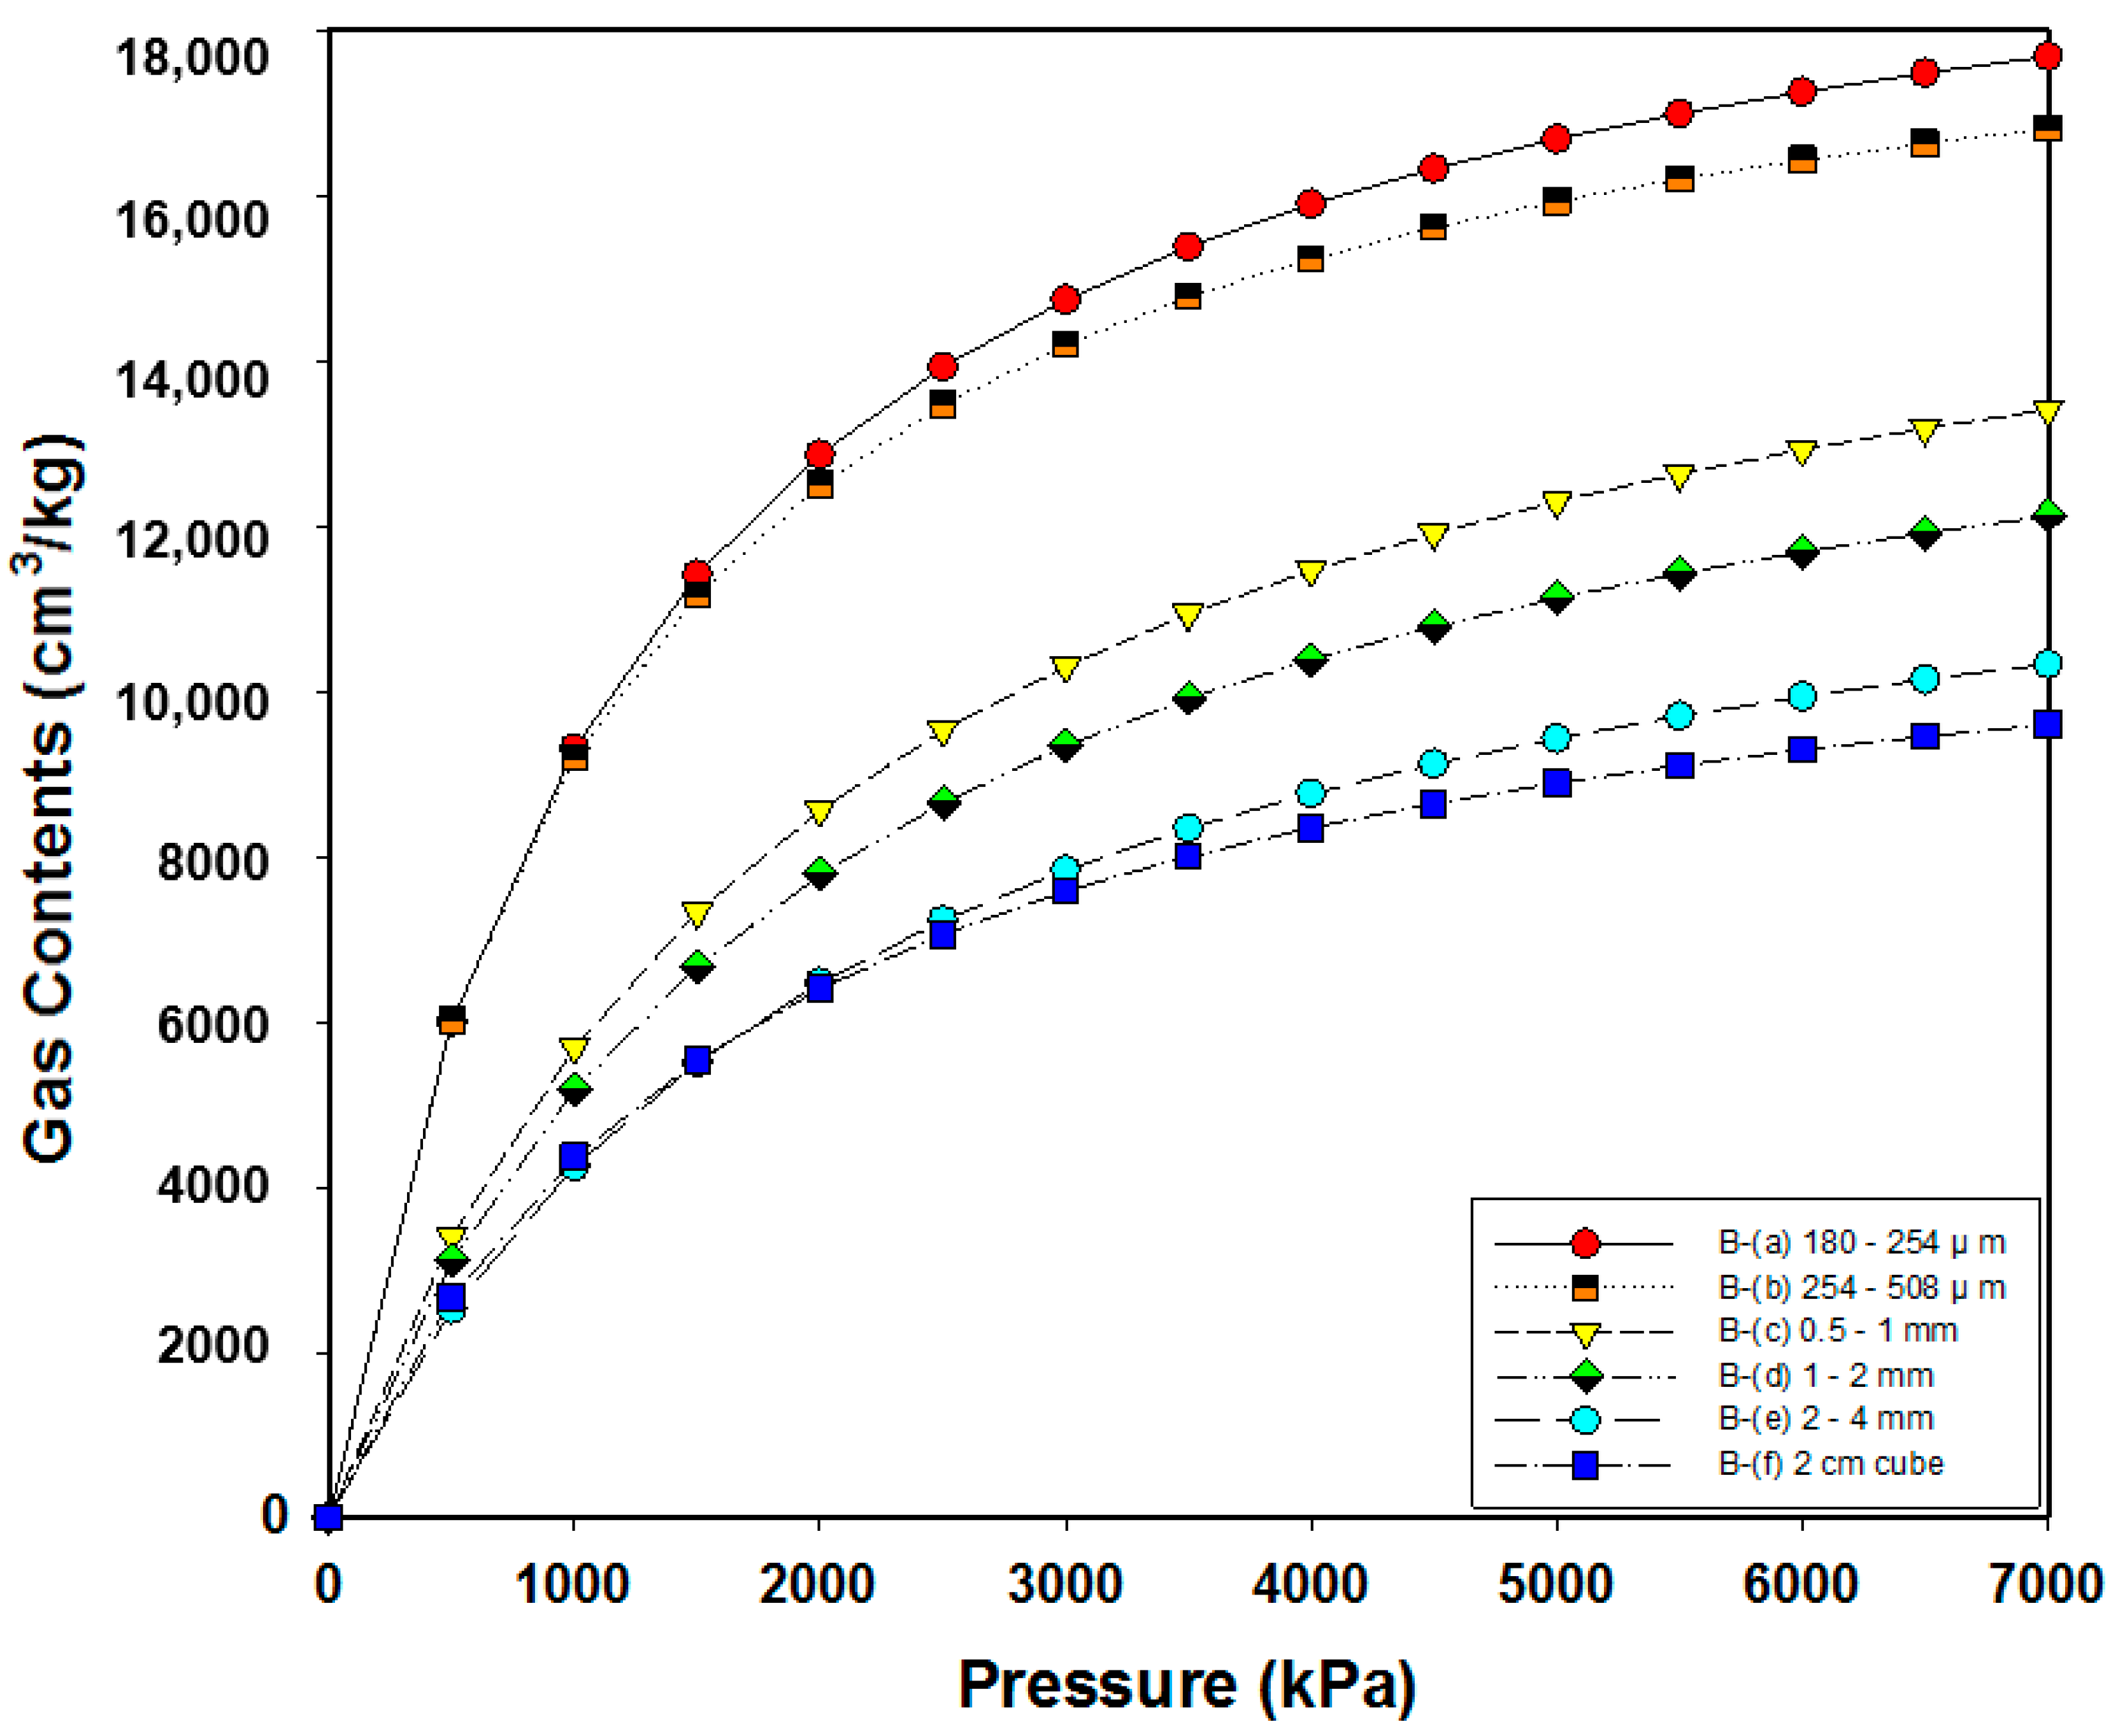
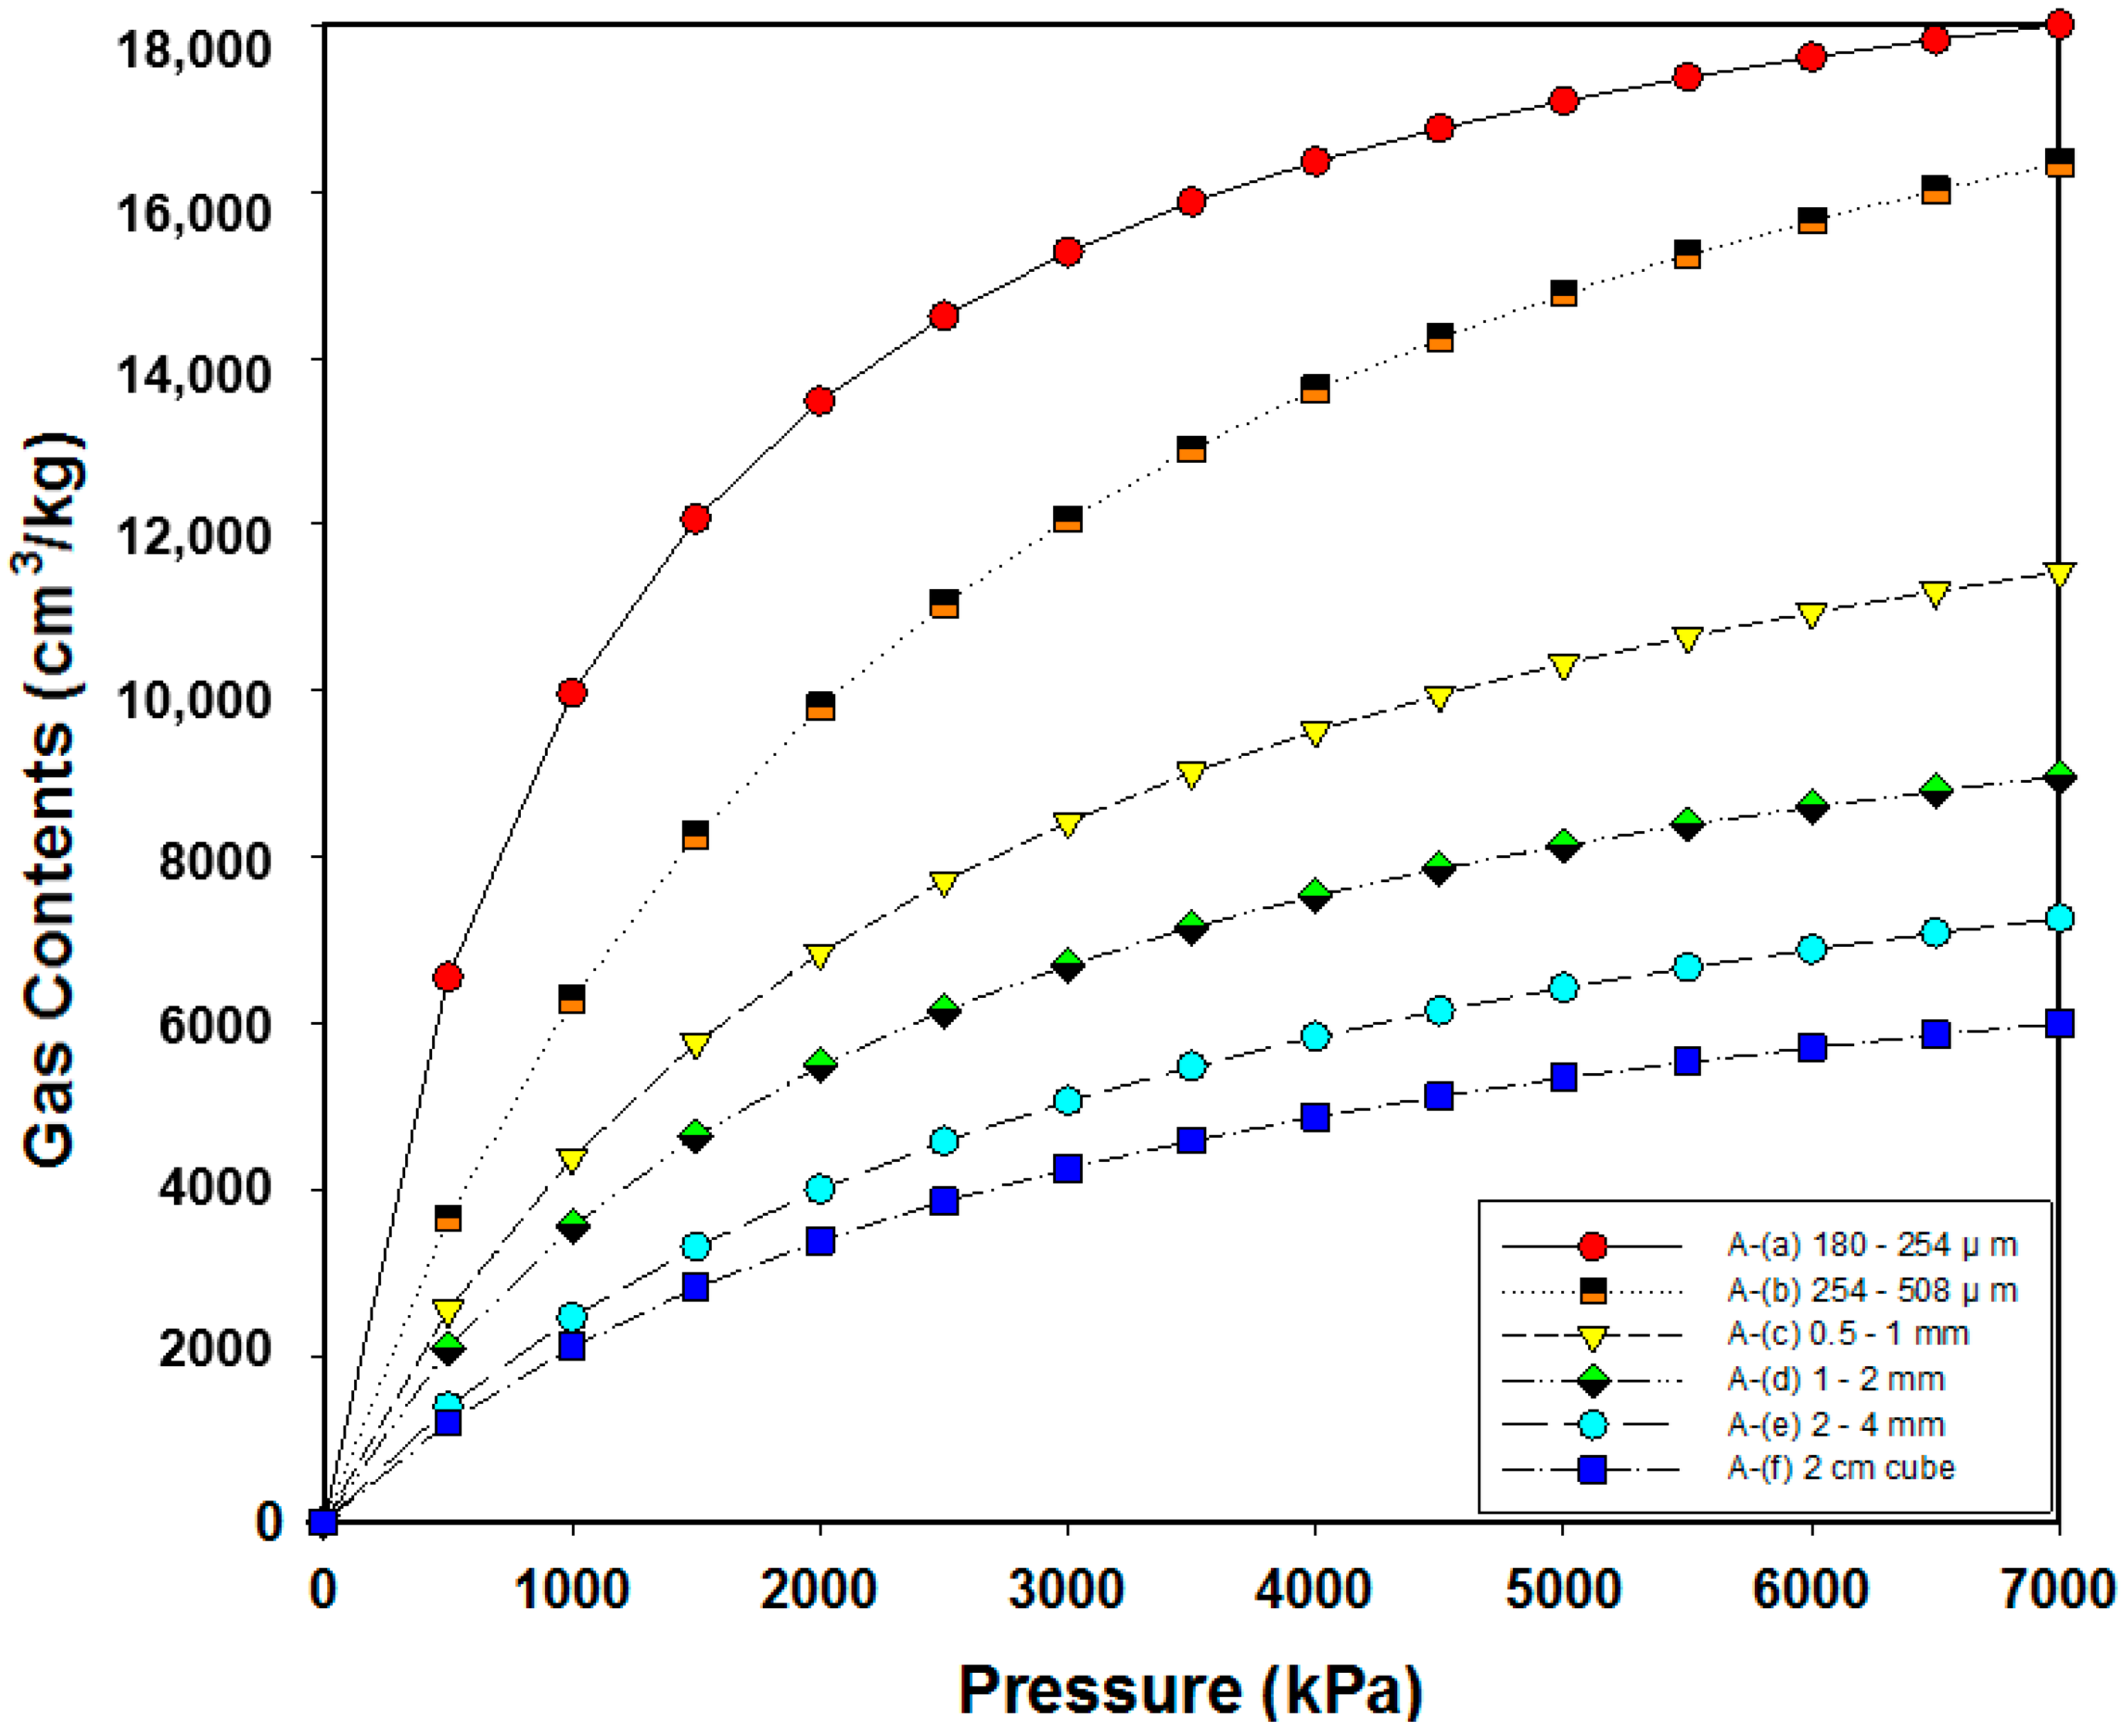
3.2. Analysis of Adsorption Characteristics According to the Particle Size

The CH4 adsorption content, dependent on the particle size of coal, was measured with high-pressure sorption measuring equipment. Both coal samples had different VL values according to the particle size of the samples (Table 2). Coal sample A(b), which was the second smallest coal particle size in coal sample group A, showed the highest VL of 22,295.85 cm3/kg. In contrast, coal sample A(f), which had the largest coal particle size, had the lowest VL of 8670.62 cm3/kg. Thus, there was a three-fold difference in VL values between the two samples (Figure 5).
Unlike coal sample group A, coal sample group B had the highest VL of 20,809.44 cm3/kg in the smallest coal particle size, sample B(a), and the largest coal particle size sample B(f) had the lowest VL of 12,000.53 cm3/kg (Figure 6). These results relate to an increase in the specific surface area and a reduction in ash contents during coal crushing [22]. Coal sample group B had a lower content of volatile matter and a higher content of fixed carbon than coal sample group A. Shan et al. [23] suggested that fixed carbon has a positive effect on the adsorption of CBM, while the volatile matter has an adverse impact. For this reason, when the particle size of coal was identical, more gas was adsorbed onto coal sample group B, because there was more fixed carbon, which had a positive effect on the adsorption.
At the same time, the aggregation of coal particles was found to have an impact on VL. Gas was not able to be sufficiently adsorbed for the powdered samples and caused a VL reduction because of this effect. This was observed in both powder types of coal sample groups A and B, but especially in coal sample group A. While coal sample A(a) was expected to have the highest adsorption value, coal sample A(b) had the highest VL value. This result was found to be related to the aggregation of fine particles in the reactor; the crushed particles were clustered together and attached to the wall of the reactor after the test.
Many previous studies described the effect of coal aggregation with an increase in compressive load. Furthermore, this phenomenon intensified with the reduction in coal particle size and its moisture content, as well as the rise in ash content. However, these results varied depending on the type of coal [24]. Consequently, a smaller particle size of coal led to more gas being adsorbed due to the increase in surface area.

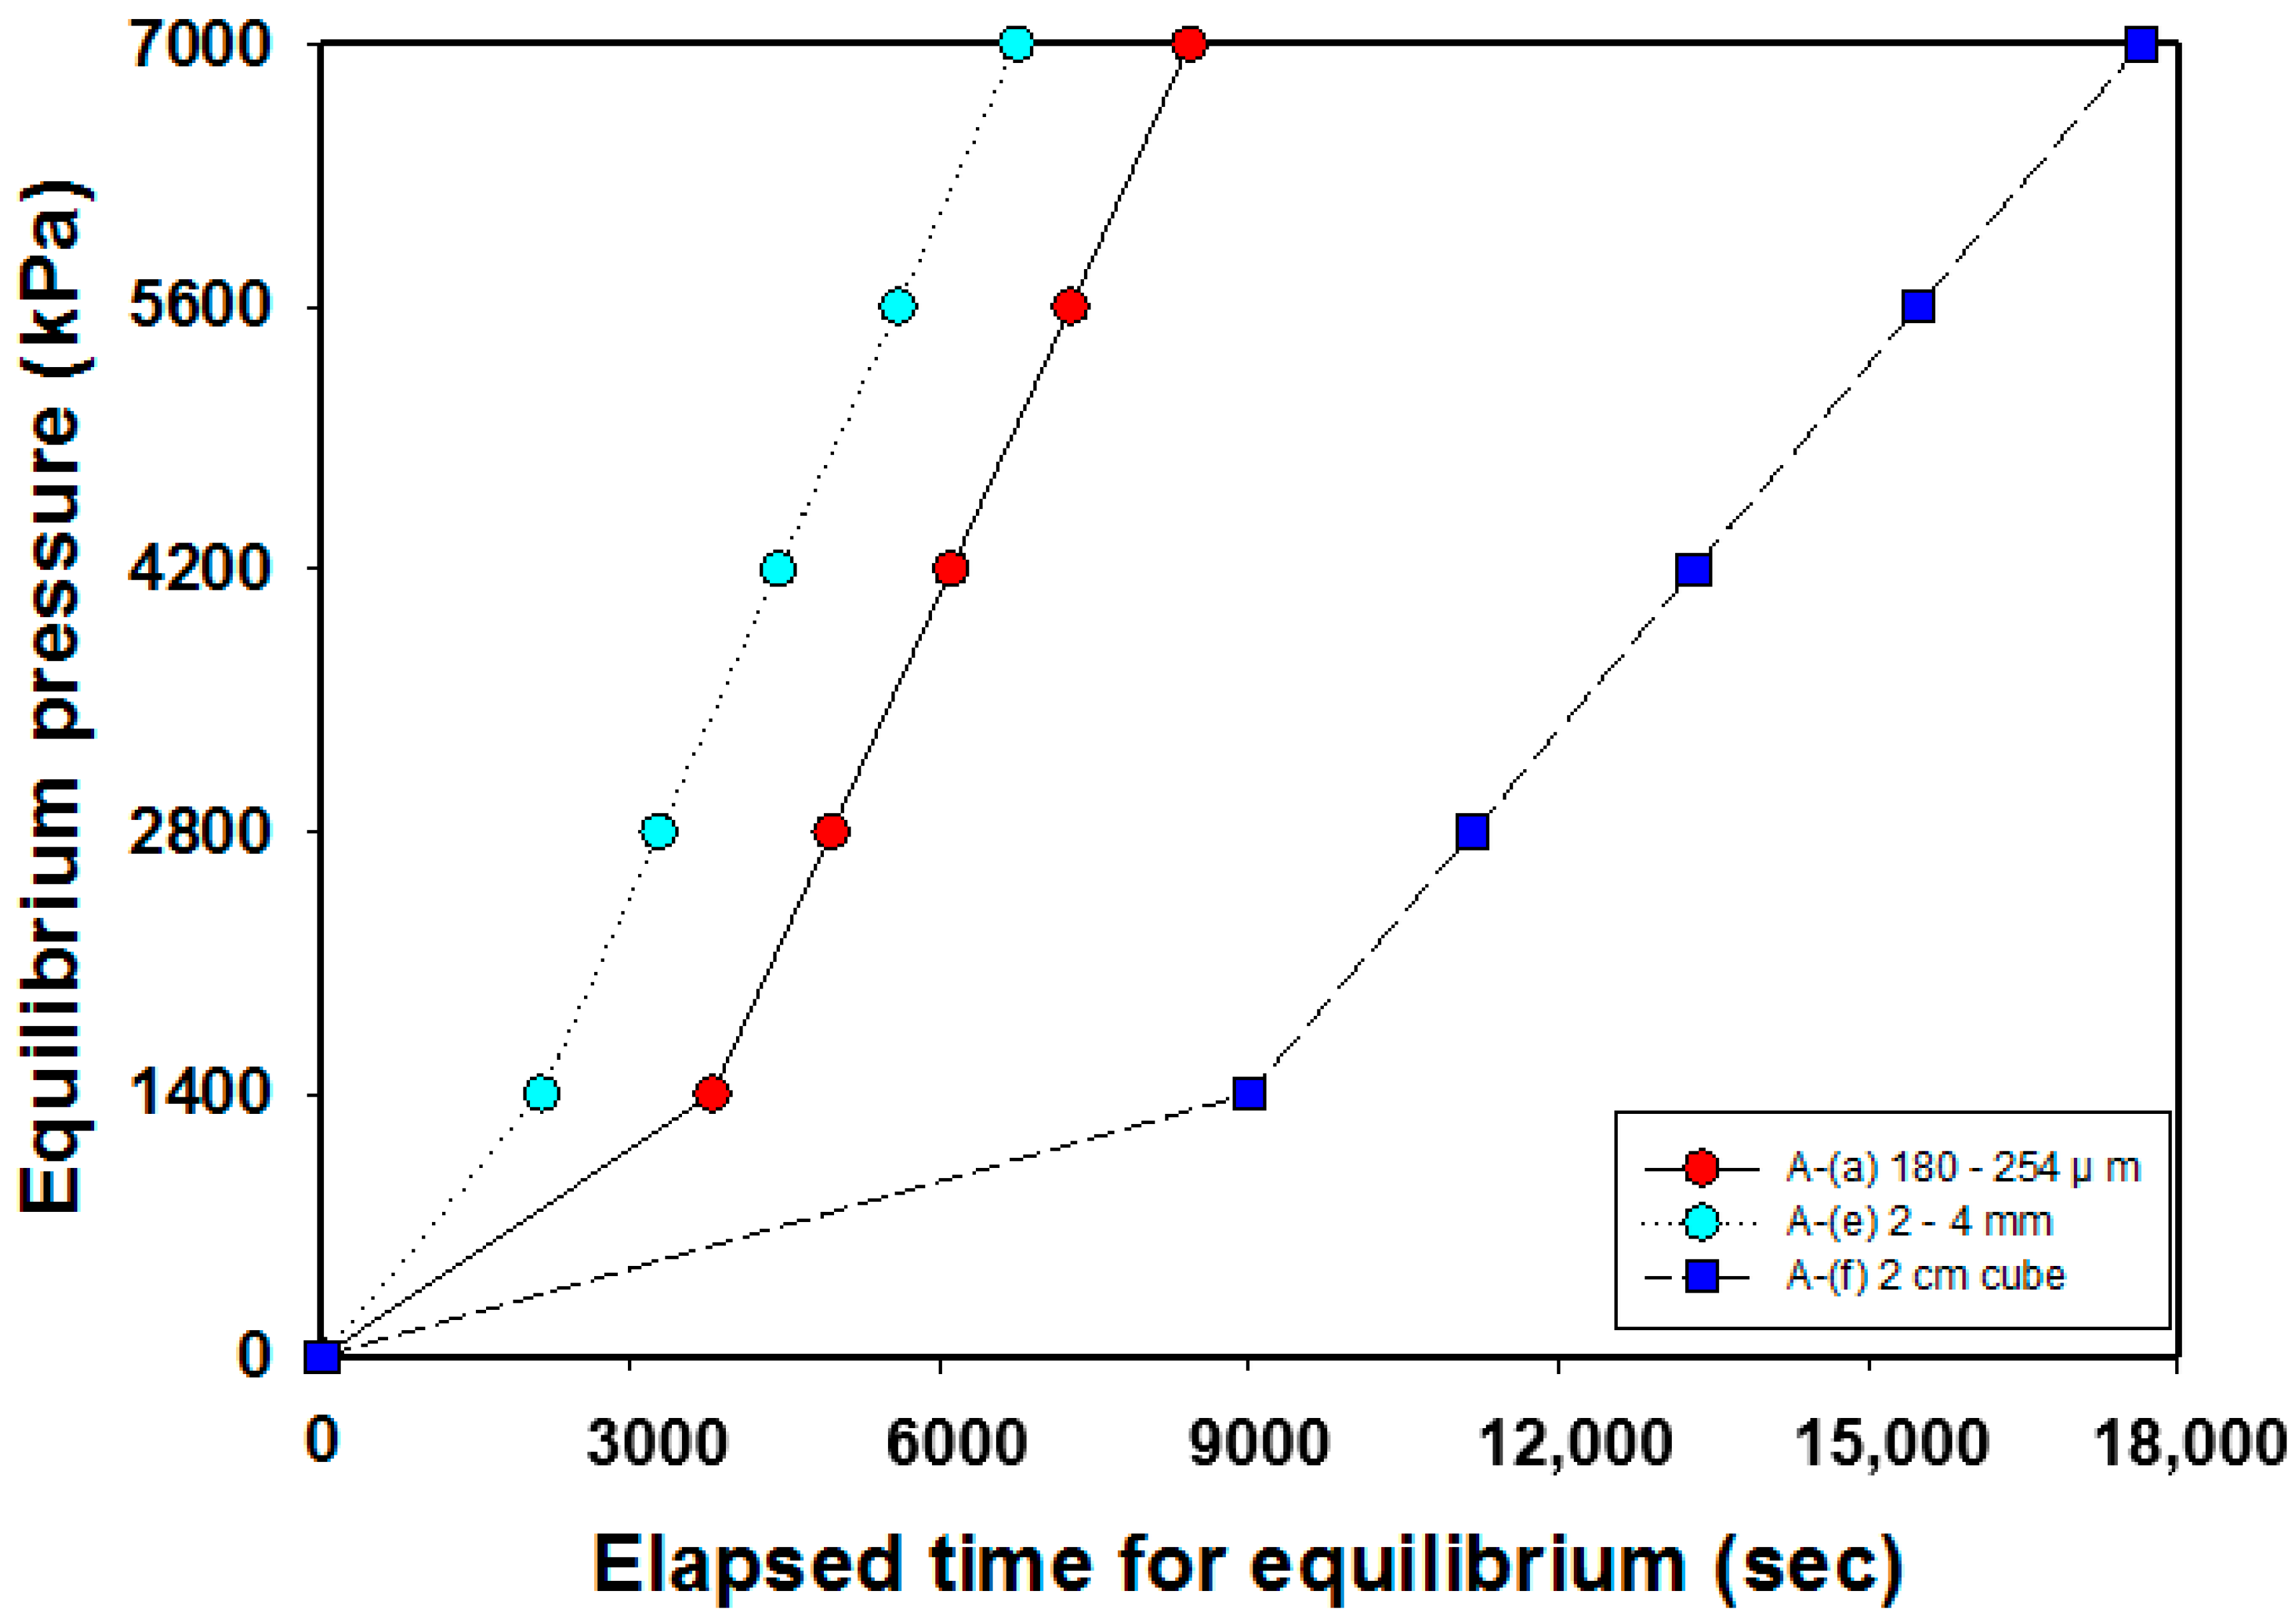
3.3. Equilibrium Time Analysis in the Adsorption Process

In the indirect method, gas is artificially adsorbed onto coal in the laboratory. Sufficient time is needed to achieve an equilibrium condition for gas to adsorb onto the coal surface. If the equilibrium time is not enough, the reliability of the experiment diminishes because the test finishes without complete adsorption. Also, crushed coal and lump coal might have different equilibrium times, since diffusion rarely occurs with small particles. Our motivation was based on the fact that, if the equilibrium time varies with coal particle size, it can still be possible to estimate the effects of gas diffusion in an alternative way. Therefore, an accurate equilibrium time measurement was required, and it was measured when the pressure variation was less than 0.1%. Figure 7 shows the adsorption equilibrium time with the particle size of coal sample group A. Through samples A(b) to A(e), the difference was negligible and, thus, they are all represented as A(e). As Figure 7 demonstrates, less equilibrium time was required for adsorption onto a smaller coal sample at a low pressure range (<1400 kPa); the results of sample A(a) can be explained by the difference in equilibrium time of adsorption due to the rearrangement of the aggregated particles as pressure increased. However, these differences were seen only at low pressures. Conversely, when pressure was higher than 1400 kPa, the samples had almost the same equilibrium time, which can be verified by the similar slopes between the samples with smaller particle sizes. These results mean that there was no particular tendency for adsorption, and adsorption time was almost identical from A(a) to A(e).
However, in the case of the lump coal sample A(f), it took a long time to achieve an equilibrium condition. In particular, the slope of the adsorption time was different compared to the powdered samples. More specifically, it took 9000 s, which is about three times longer than for the other powdered samples. This situation occurred because more time was needed for the gas to diffuse through the coal matrix and adsorb onto the surface. Also, we believed that we could obtain diffusion coefficients from the adsorption analysis of lump coal. Therefore, the diffusion coefficient, which is usually calculated through the canister test, can be more accurately obtained using the history matching technique as described in the next section.

3.4. Model Description

A reservoir simulation was carried out using the results of sample B, using the same size of coal as in the experiment, to determine the diffusion coefficient via the indirect method. The significant assumptions were as follows:
  • The sample was homogeneous and isotropic;
  • The interval of each cleat was equal;
  • Gravity force and the stress of the cleat system were ignored;
  • The gas diffusion coefficient was constant.
CBM is notably different compared to a conventional gas reservoir. The methane is in a near-liquid state and is adsorbed inside pores within the coal matrix. The open fractures in the coal (cleats) can also contain free gas or can be saturated with water. The system is called a “dual-porosity reservoir”, which is characterized by a complex interaction between the coal matrix and cleat system coupled with the adsorption/desorption process. Fluid movement in a lump of coal is controlled by diffusion from the coal matrix to the fracture and by Darcy flow in the fracture (cleat) system. The reservoir pressure is decreased upon producing gas from the cleats. This causes the gas to desorb from the coal matrix at the matrix/cleat interfaces, creating a methane concentration gradient across the coal matrix. The gas diffuses through the matrix and is released into the cleat system.
Here, we describe the fracture block governing equations for the dual-porosity approach to modeling naturally fractured reservoirs [25]. These equations are an extension of that derived for single-porosity systems described by Nghiem and Li [26]. In the dual-porosity matrix-diffusion model, the solute cannot move globally through the rock matrix. The matrix simply acts as a one-dimensional source or sink for diffusion between the adjacent fractures. Thus, the diffusion coefficient applies to the flow from the matrix to the fracture.
Dual porosity formulation—matrix blocks:
φ i m = τ i g m f V t ( N i n + 1 N i n ) m = 0                   i = 1 , , n c ; φ p m = i = 1 n c N i m n + 1 m n + 1 ( ρ g S g ) m n + 1 = 0
Dual porosity formulation—fracture blocks:
φ i f = T g f s y i g f s ( p n + 1 γ g s D ) f + q i n + 1 + τ i g m f V t ( N i n + 1 N i n ) m = 0 i = 1 , , n c ; φ p f = i = 1 n c N i f n + 1 f n + 1 ( ρ g S g ) f n + 1 = 0
In these equations, N i ,   i = 1 , , n c + 1 are the moles of i per unit of gridblock volume. The subscript i with i = 1 , , n c corresponds to the hydrocarbon components. D is the diffusion coefficient from the matrix to the fracture. τ i g m f is the matrix–fracture transfer in the gas phase for component i. The subscripts n and n + 1 denote the old and current time levels, respectively, and the superscript s refers to n for explicit blocks and to n + 1 for implicit blocks. The subscript f and m correspond to the fracture and matrix, respectively. Many authors performed studies using dual-porosity systems [27,28,29,30,31]. We also utilized this system with two-phase flow to describe gas flow from the matrix to the fracture.
A Cartesian grid system was applied to build a core model. To represent the cleat network with a face and butt cleat, the total core area (2 × 2 cm2) was divided into 10 × 10 grids in the I- and J-directions, and cleat spacing was selected as 0.2 cm in the I-, J-, and K-directions according to the electron microscope images (Figure 8). A detailed description of the model is listed in Table 3.
To simulate the laboratory system accurately, one imaginary injection well was installed, and the recorded experimental data (cell pressure, temperature, gas injection rate) were converted to simulation input data. The measured pressure was selected as an objective function in the history matching. The Langmuir isotherm, which was determined in the lump coal experiment, was used to model adsorption and desorption in coal. In the case of porosity, the dead volume was measured using helium in the experimental process, and the porosity was estimated indirectly. The permeability was measured by core analysis. GEM software (reservoir simulator for compositional, chemical, and unconventional reservoir modeling) from CMG (Computer Modelling Group) was used to conduct the simulation. Table 3 lists the initial parameters of the base model.

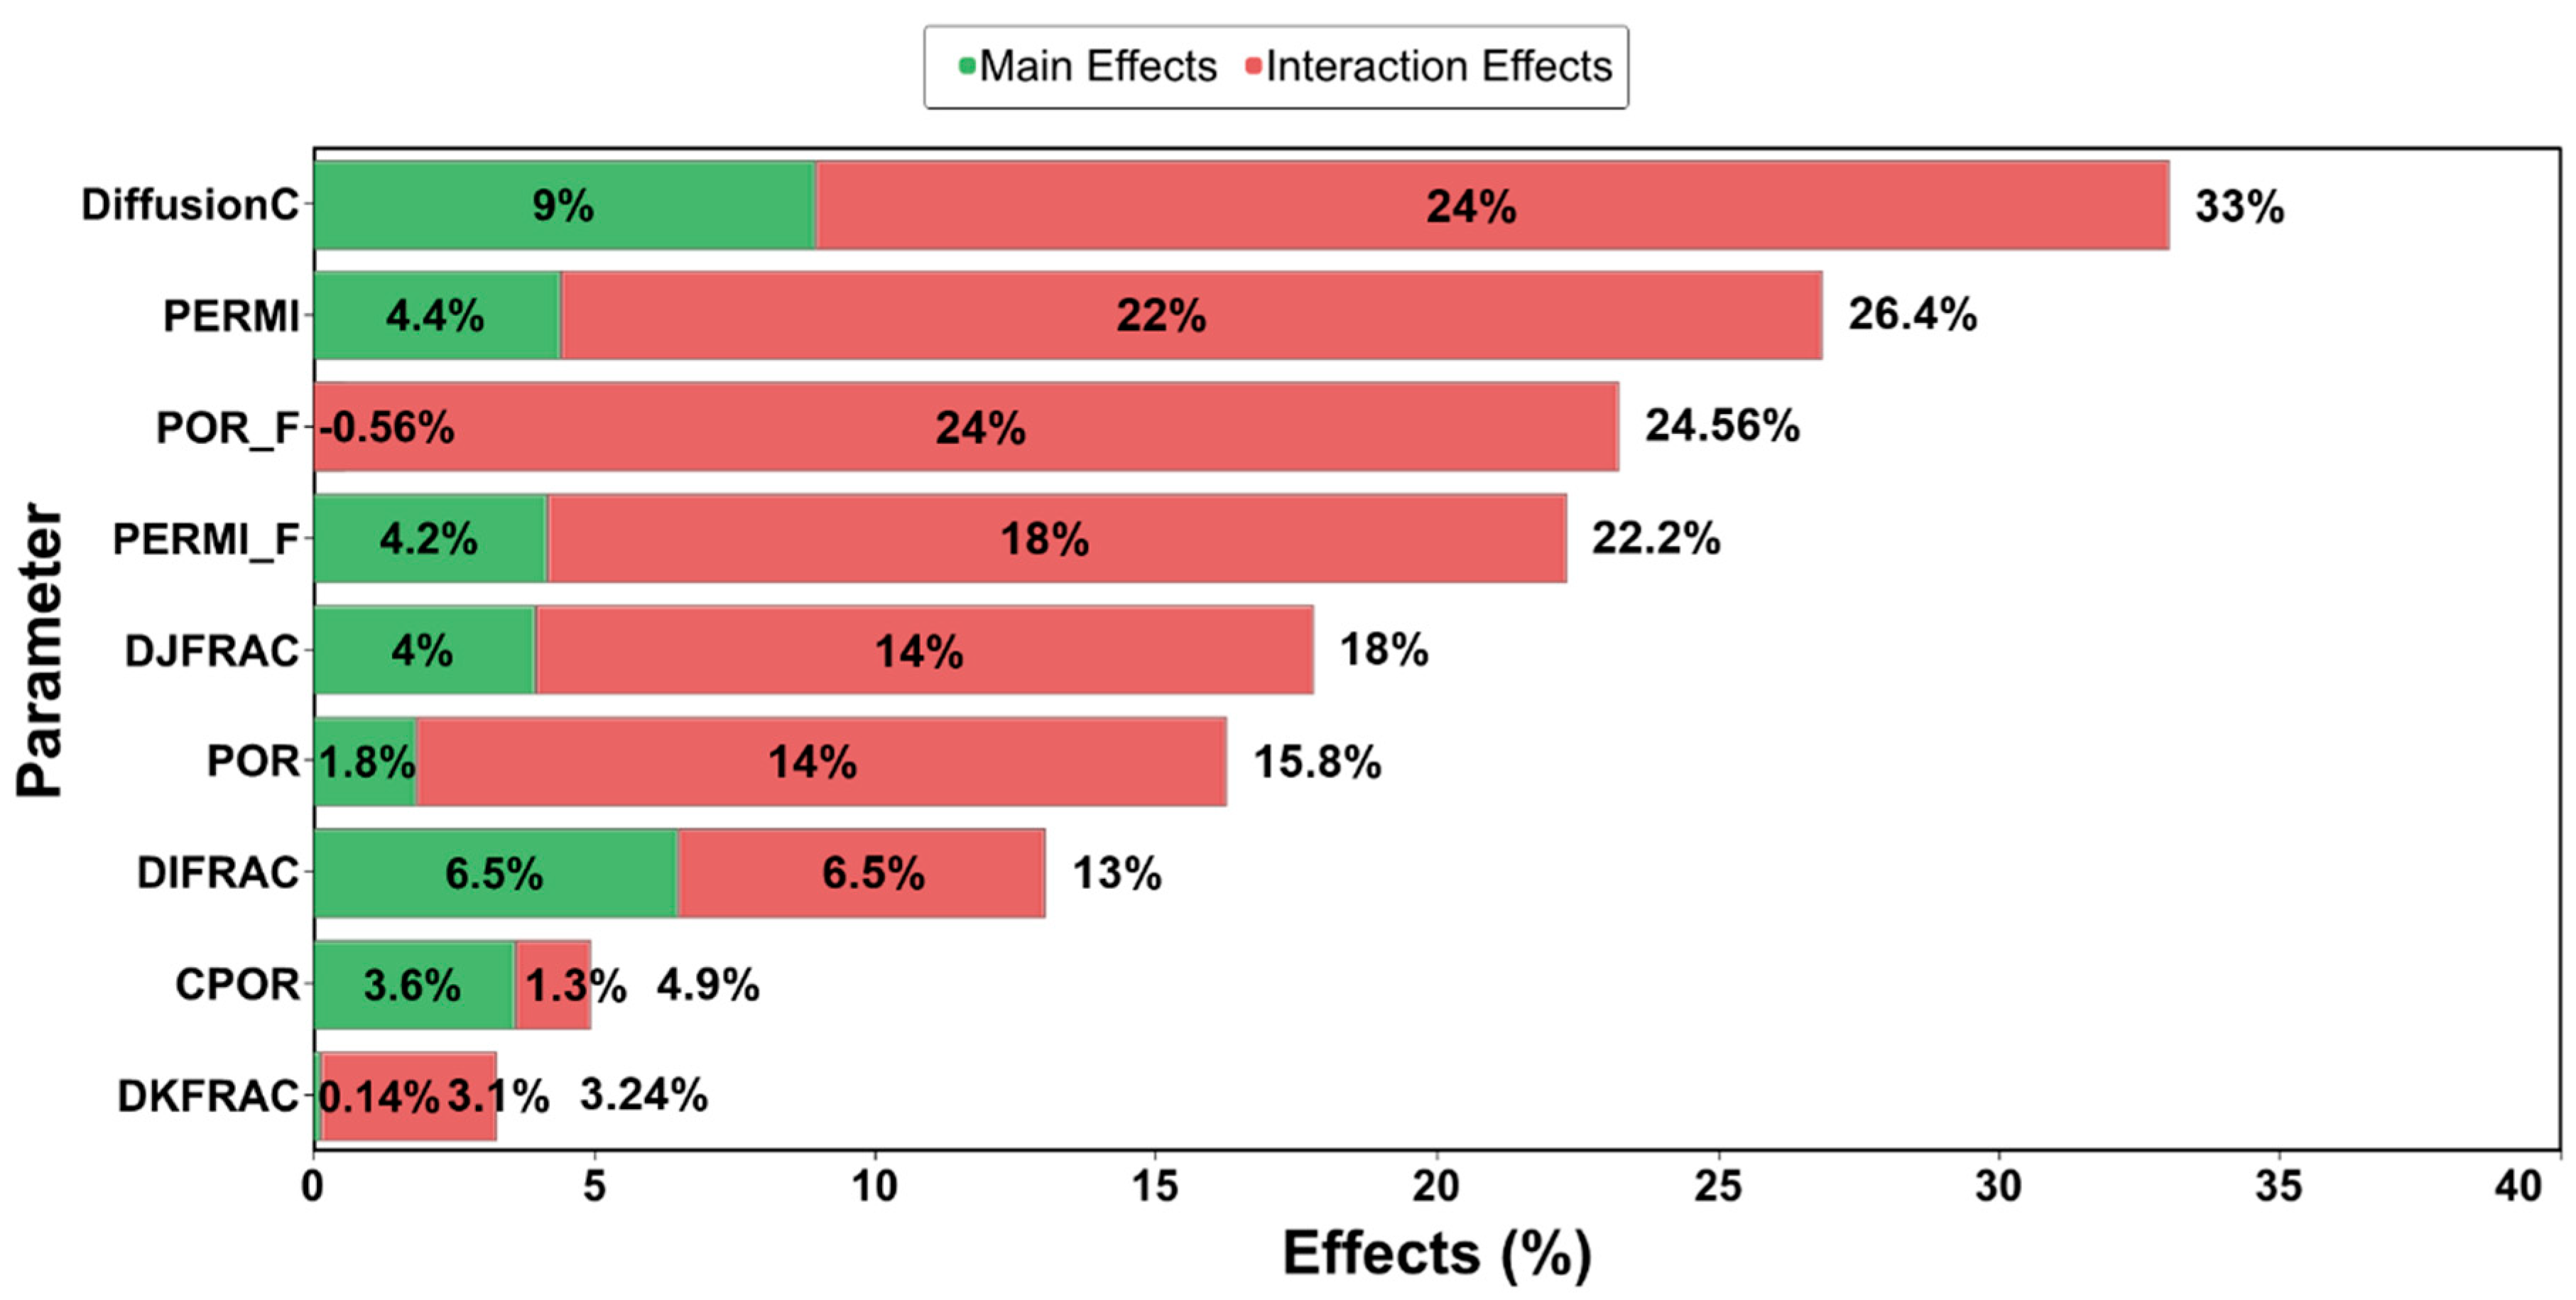
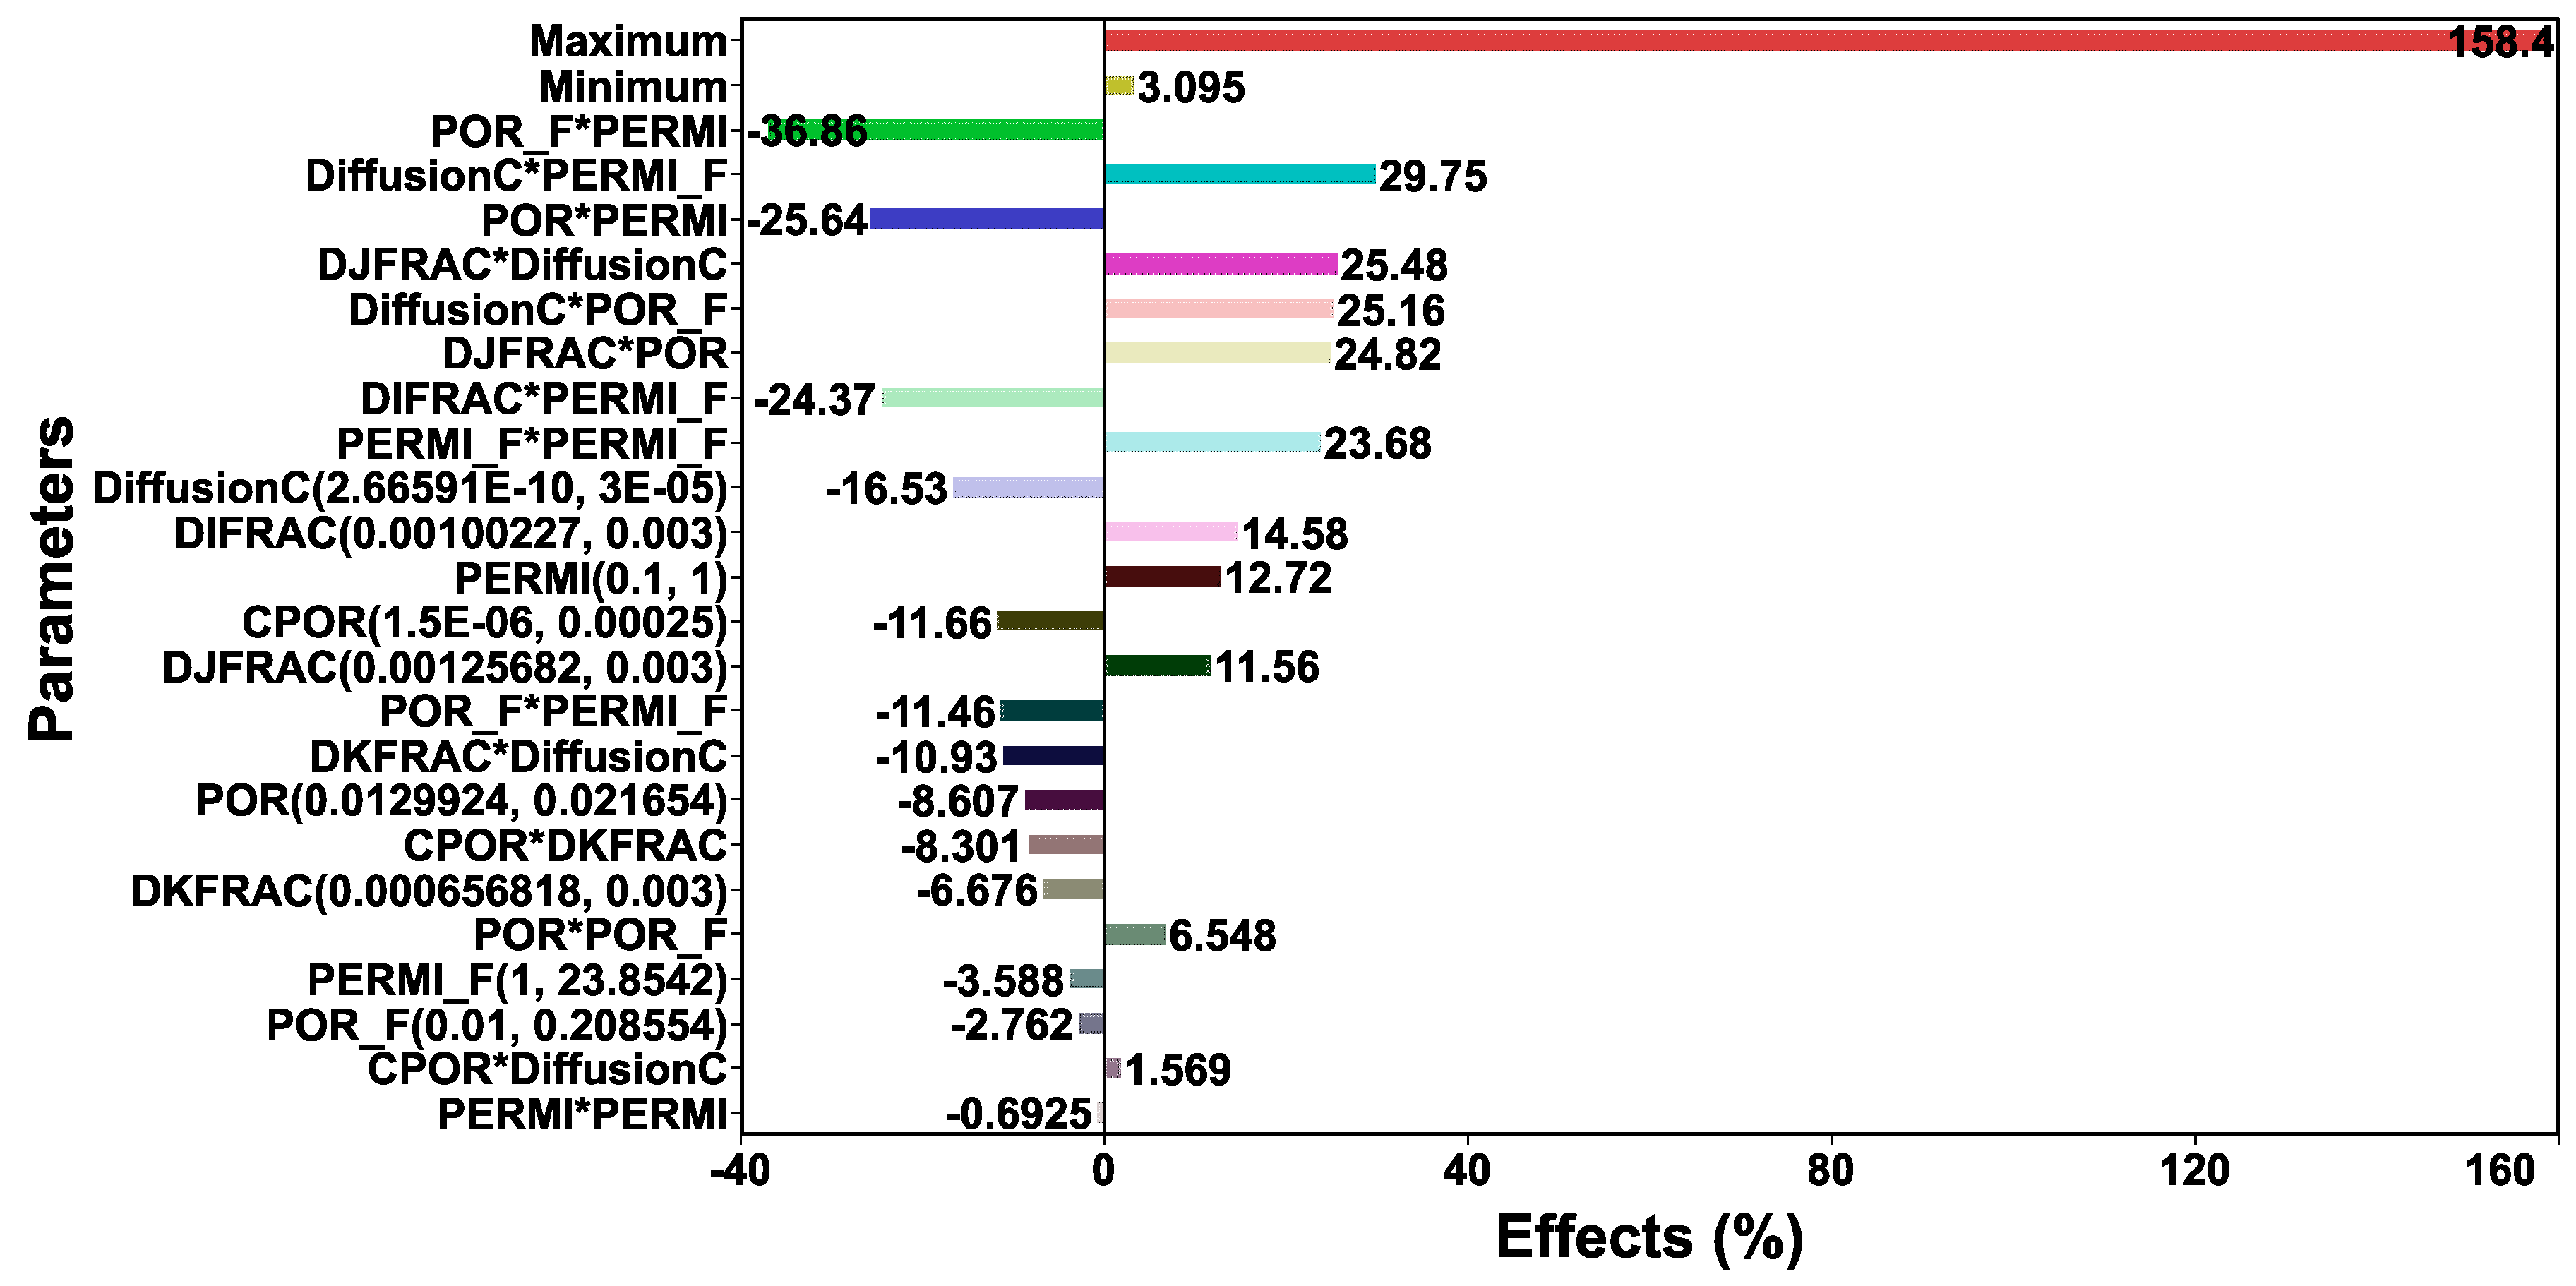
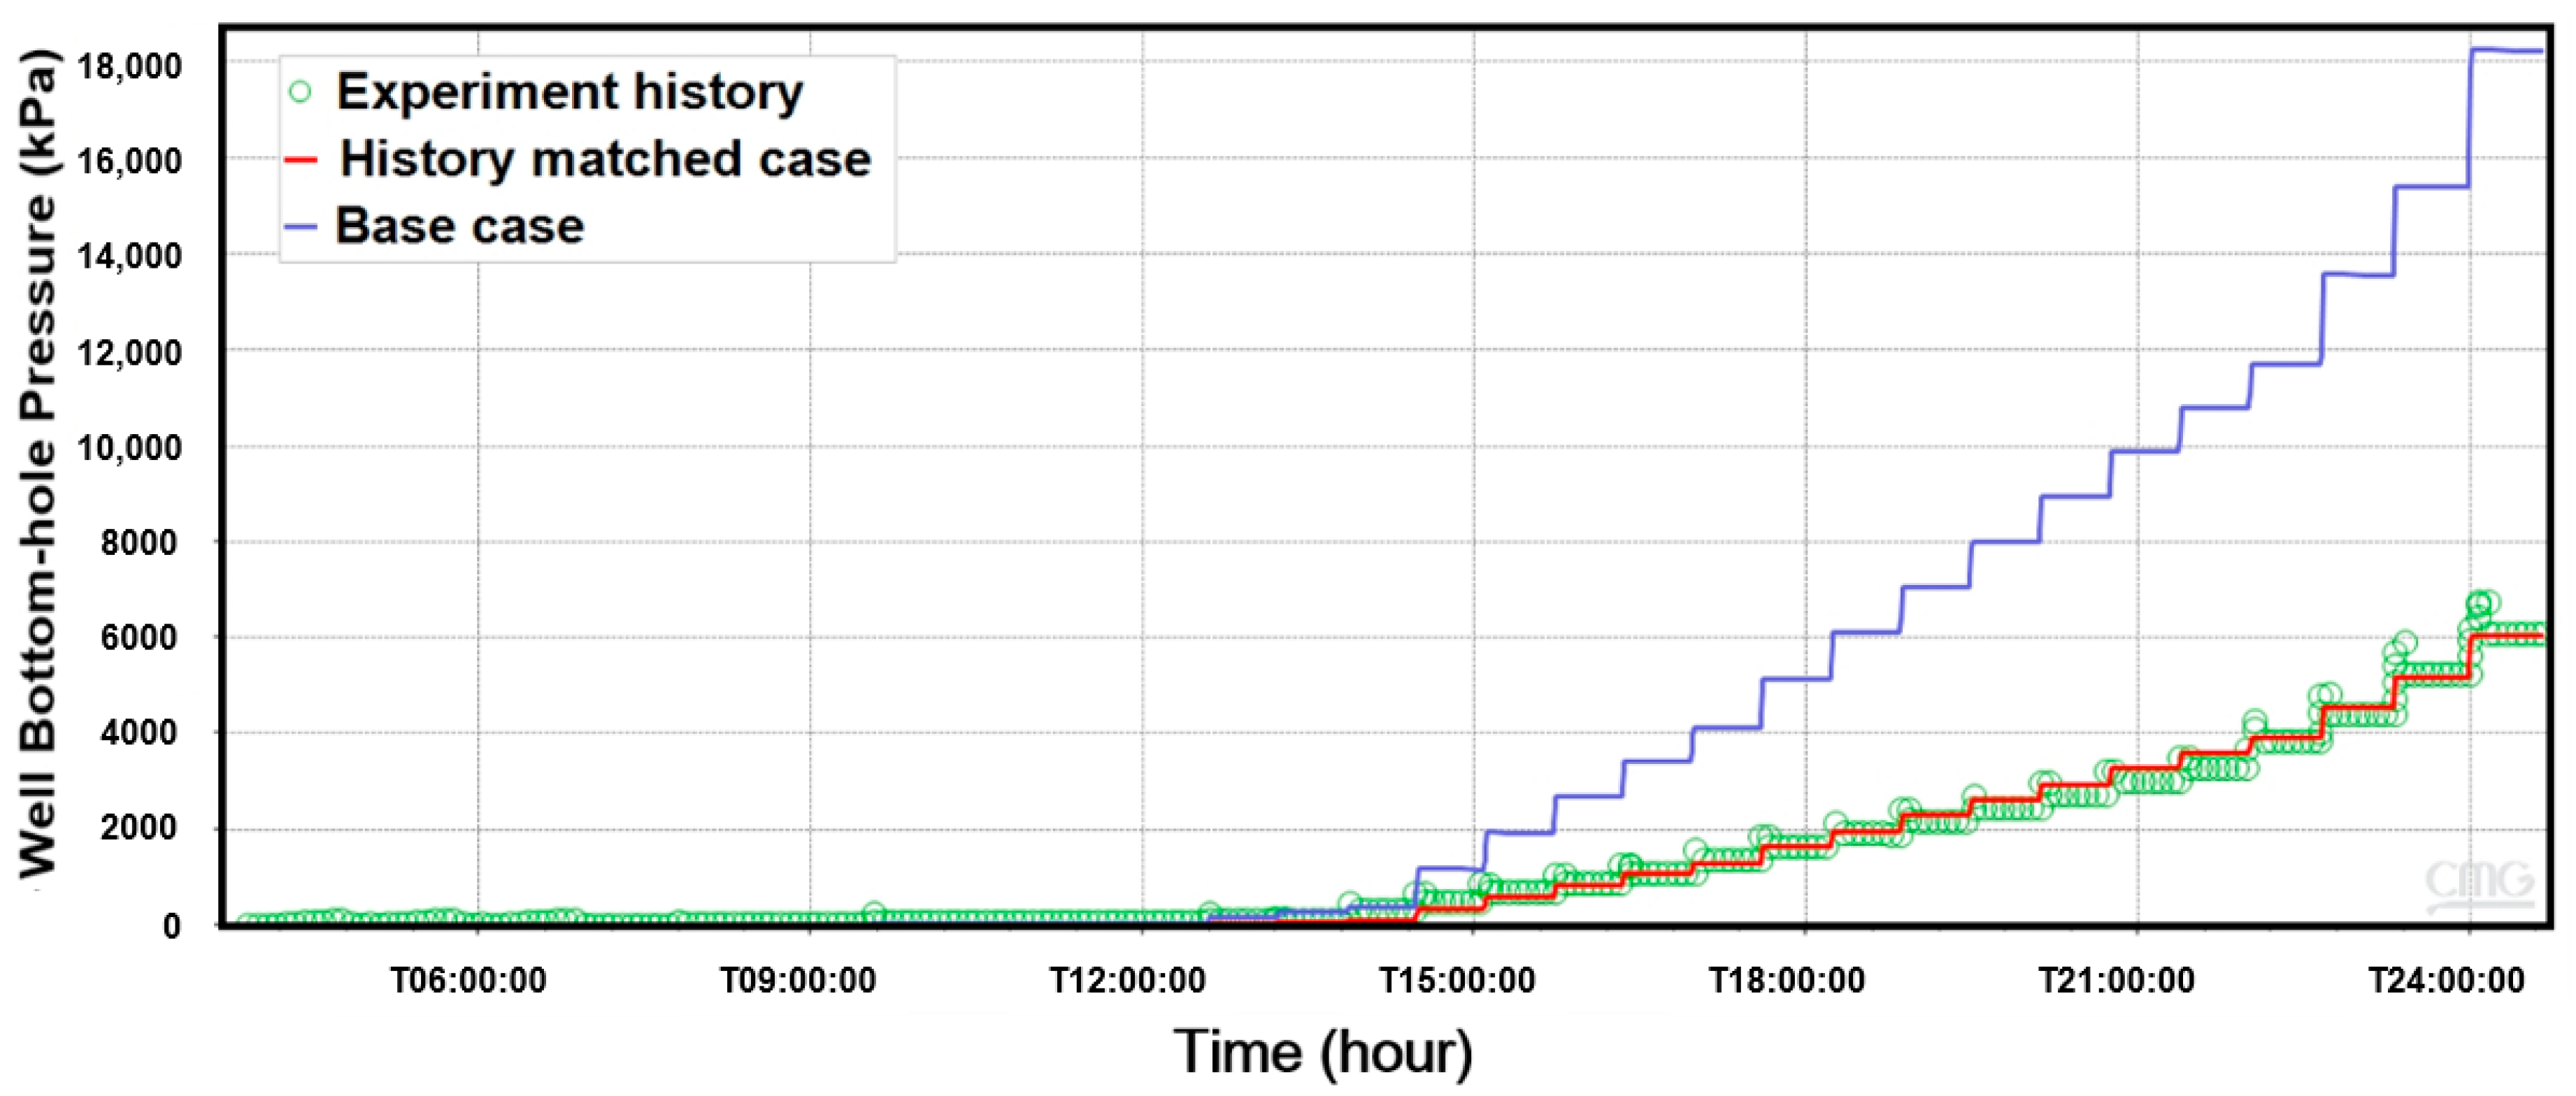
3.5. Simulation Results

Firstly, the base simulation was performed to investigate the diffusion coefficient and other reservoir properties. The primary constraint was the flow rate, which was identical to the actual experiment. The injection scenario was designed as an injection fall-off test, and the average period of shut-in was 2500 s after the 300 s of injection. The error between the base model and the actual experiment was around 73%. Many parameters had uncertainty because of the lack of sample properties, and sensitivity analysis was performed to determine the priorities among parameters for the history matching and to understand the interaction effects between each property. RSM (response surface methodology) was used for sensitivity analysis by utilizing the nine parameters listed in Figure 9. In total, 180 cases and a proxy model were also established for more accurate analysis. The quadratic model and the Sobel method were used to calculate the importance (sensitivity) of the parameters affecting the objective function and the interaction between parameters. A large importance means that increasing or decreasing the parameter value leads to a significant change in the objective function (e.g., well bottom-hole pressure). The interaction effect is an index indicating whether or not there is a relationship between parameters; if it has a value of 0, there is no relationship.
In Figure 9, the most sensitive parameter was the diffusion coefficient, which had 33% sensitivity and dominantly affected the gas flow in the coal. Next, matrix permeability was shown to have a high sensitivity (26.40%). Also, the sensitivities of fracture porosity and fracture permeability (23.44% and 22.20%, respectively) showed that they dominantly affected the gas flow in the cleat structure. The above parameters also had substantial interaction effects with other parameters. These phenomena, which appeared in the results of the interaction effect analysis, are shown in Figure 10. Notably, the interaction effect between the diffusion coefficient and the fracture porosity was 29.75%. Thus, we determined that the diffusion coefficient is a crucial factor in gas flow through the coal. Meanwhile, the compressibility, the matrix porosity, and the fracture spacing were found to have relatively low sensitivity because of the small size of the core sample. Accordingly, the diffusion coefficient, the matrix permeability, the fracture porosity, and the fracture permeability were selected as the main parameters for the history matching.
History matching was carried out to achieve reasonable values for each parameter. Of the 300 cases, three different cases were run, and the error rate of the final history-matched case was approximately 2.9% (Figure 11). We determined that this error rate occurred due to the small size of the sample and the assumptions of the model, such as homogeneous medium and isotropic permeability. The diffusion coefficient calculated by the history matching was 2.66 × 10⁻¹⁰ cm2/s, which is reasonable compared with the typical value calculated from experiment studies [32,33,34]. The cleat properties, fracture permeability and fracture porosity, were adjusted from 4 mD to 23.85 mD, and from 0.005 to 0.15 because of the large number of cleats compared to the area of coals. The other properties showed small changes. Through this procedure, we found that a relatively accurate diffusion coefficient can be calculated by implementing adsorption experiments and simulation techniques without canister testing. Table 4 lists the parameters of the history-matched model.

4. Conclusions

This study presented the adsorption and diffusion characteristics of CBM using the indirect method of measurement and reservoir modeling. The difference in adsorption content of CH4 depended on the particle size measured with a high-pressure sorption measuring equipment. We used both powdered and lump samples and analyzed factors affecting VL such as aggregation, ash and moisture content, and specific surface area. As sufficient time is necessary to achieve equilibrium conditions, adsorption time analyses were also conducted.
In conclusion, a smaller coal particle adsorbs more gas due to the increase in surface area. Lump samples had the lowest gas content because they contained ash and moisture. Adsorption isotherms showed different characteristics. Also, when the coal particle size decreased, the content of moisture and ash, which negatively affects adsorption, was reduced, leading to an increase in the amount of adsorbed gas. With regard to adsorption equilibrium time, a smaller coal particle took less time. Furthermore, the lump sample had a different slope because it needed more time to diffuse through the matrix. Therefore, to derive more accurate CBM characteristics that are similar to the actual site, the history-matching technique was applied to optimize coal properties. According to the sensitivity analyses, cleat properties and the diffusion coefficient had a great influence on fluid flow in coal.
Consequently, it is possible to measure the diffusion coefficient, which was previously measurable only using the direct method. However, more lump coal experiments and associated simulations are necessary for a more accurate CBM production analysis. With additional data, it is believed that the processes derived from this study could overcome the shortcomings of the indirect method.

Author Contributions

D.K. wrote the paper, conducted the experimental study, and analyzed the results; Y.S. wrote the paper, contributed to tuning the model, and ran the reservoir simulation; J.K. contributed to processing the raw data and made the initial model; J.H. edited the original draft; Y.L. suggested the main idea and supervised the work, providing continuous feedback.

Funding

This research was funded by the Energy Efficiency and Resources Core Technology Program of the Korea Institute of Energy Technology Evaluation and Planning (KETEP), granted financial resources from the Ministry of Trade, Industry, and Energy, Republic of Korea (No. 20152510101880).

Acknowledgments

This research was supported by the Energy Efficiency and Resources Core Technology Program of the Korea Institute of Energy Technology Evaluation and Planning (KETEP), granted financial resources from the Ministry of Trade, Industry, and Energy, Republic of Korea (No. 20152510101880) and this research was supported by Basic Science Research Program through the National Research Foundation of Korea(NRF) funded by the Ministry of Education(2019R1I1A3A01060375).

Conflicts of Interest

The authors declare no conflict of interest.

References

  1. Flores, R.M. Coal and Coalbed Gas: Fueling the Future, 1th ed.; Newnes: Waltham, MA, USA, 2013; Volume 1, pp. 210–235. [Google Scholar]
  2. Cho, J.; Kim, J. Global trends of unconventional CBM gas science information. J. Econ. Environ. Geol. 2013, 46, 351–358. [Google Scholar] [CrossRef]
  3. Yoon, Y.; Oh, S.; Kim, J. An real option application on the feasibility study of an Indonesian CBM project. J. Korean Soc. Miner. Energy Resour. Eng. 2014, 51, 631–640. [Google Scholar] [CrossRef]
  4. Levine, J.R. Generation, storage and migration of natural gas in coal bed reservoirs. Alta. Res. Counc. Inf. Ser. 1990, 109, 84–130. [Google Scholar]
  5. Stricker, G.D.; Flores, R.M.; McGarry, D.E.; Stilwell, D.P.; Hoppe, D.J.; Stilwell, K.R.; Ochs, A.M.; Ellis, M.E.; Osvald, K.S.; Taylor, S.L.; et al. Gas desorption isotherm studies in coals in the Powder River Basin and adjoining basins in Wyoming and North Dakota. US Geol. Surv. Open File Rep. 2006, 1174, 273. [Google Scholar]
  6. Jang, H.; Lee, J.; Shin, C.; Lee, Y.; Kwon, S.; Lee, W. A study on the development status and key technologies of coalbed methane. J. Korean Soc. Miner. Energy Resour. Eng. 2012, 49, 545–556. [Google Scholar]
  7. Hall, F.E.; Chunhe, Z.; Gasem, K.A.M.; Robinson, R.L.; Dan, Y. Adsorption of pure methane, nitrogen, and carbon dioxide and their binary mixtures on wet Fruitland coal. In Proceedings of the SPE Eastern Regional Conference and Exhibition 1994, Charleston, WV, USA, 8–10 November 1994; pp. 329–344. [Google Scholar] [CrossRef]
  8. Steidl, P.F. Coal as a reservoir. In A Guide to Coalbed Methane Reservoir Engineering; Report No. GRI-94/0397; Gas Research Institute: Chicago, IL, USA, 1996; pp. 1–16. [Google Scholar]
  9. He, X.; Zhang, Z. Microscopic pore structural characteristics in coal particles. In Proceedings of the 3rd International Conference on Material, Mechanical and Manufacturing Engineering (IC3ME 2015), Guangzhou, China, 27–28 June 2015. [Google Scholar] [CrossRef]
  10. Beamish, B.B.; O’Donnell, G. Microbalance applications to sorption testing of coal. In Proceedings of the Symposium Coalbed Methane Research and Development, Townsville, Australia, 19–21 November 1992; pp. 31–41. [Google Scholar]
  11. Zhang, L.; Aziz, N.; Ren, T.; Wang, Z. Influence of temperature on the gas content of coal and sorption modeling. In Proceedings of the 11th Underground Coal Operators’ Conference, Wollongong, Australia, 10–11 February 2011; pp. 269–276. [Google Scholar]
  12. Owen, L.B.; Sharer, J. Method calculates gas content per foot of coalbed methane pressure core. Oil Gas J. 1992, 2, 47–49. [Google Scholar]
  13. Diamond, W.P.; Schatzel, S.J. Measuring the gas content of coal: A review. Int. J. Coal Geol. 1998, 35, 311–331. [Google Scholar] [CrossRef]
  14. Kim, A.G. Estimating methane content of bituminous coalbeds from adsorption data. US Bur. MinesRep. Investig. 1997, 8245, 22. [Google Scholar]
  15. Lee, S.H.; Kim, C.K.; Park, J.G.; Choi, D.K.; Ahn, J.H. Comparison of steel slag and activated carbon for phosphate removal from aqueous solution by adsorption. J. Korean Soc. Environ. Eng. 2017, 39, 303–309. [Google Scholar] [CrossRef]
  16. Karmakar, B. Prospective Evaluation and Prediction of Coalbed Methane Production from a Part of Raniganj and Jharia Coalfields in India. Ph.D. Thesis, Indian School of Mines, Dhanbad, India, 2013; pp. 68–116. [Google Scholar]
  17. Langmuir, I. the adsorption of gases on plane surfaces of glass, mica, and platinum. J. Am. Chem. Soc. 1918, 40, 1403–1461. [Google Scholar] [CrossRef]
  18. BELSORP. High-Pressure Gas Adsorption Measuring System Operation Manual; BEL Japan: Osaka, Japan, 2012; Volume 1, pp. 15–20. [Google Scholar]
  19. National Institute of Standards and Technology Chemistry Webbook. Available online: https://webbook.nist.gov/ (accessed on 23 October 2018).
  20. Kim, J.; Kim, D.; Lee, W.; Lee, Y.; Kim, H. Impact of total organic carbon and specific surface area on the adsorption capacity in Horn River shale. J. Pet. Sci. Eng. 2017, 149, 331–339. [Google Scholar] [CrossRef]
  21. Parr, S.W. The Classification of Coal; Engineering Experiment Station; College of Engineering; University of Illinois: Champaign, IL, USA, 1928. [Google Scholar]
  22. Zhang, L.; Aziz, N.; Ren, T.; Nemcik, J.; Tu, S. Influence of coal particle size on coal adsorption and desorption characteristics. Arch. Min. Sci. 2014, 59, 807–820. [Google Scholar] [CrossRef]
  23. Shan, C.; Zhang, T.; Liang, X.; Zhang, Z.; Zhu, H.; Yang, W.; Zhang, K. Influence of chemical properties on CH4 adsorption capacity of anthracite derived from southern Sichuan Basin. Mar. Pet. Geol. Chin. 2018, 89, 387–401. [Google Scholar] [CrossRef]
  24. King, G.; Rtekin, T.; Schwerer, F.C. Numerical simulation of the transient behavior of coal-seam degasification wells. SPE Formul. Eval. 1986, 1, 165–183. [Google Scholar] [CrossRef]
  25. CMG. GEM User Guide: Compositional & Unconventional Simulator; Computer Modelling Group Ltd.: Calgary, Canada, 2018. [Google Scholar]
  26. Nghiem, L.X.; Li, Y.K. Phase-equilibrium calculations for reservoir engineering and compositional simulation. In Proceedings of the First International Forum on Reservoir Simulation, Alpbach, Austria, 12–16 September 1988. [Google Scholar]
  27. Kim, Y.; Unurbayan, B.; Lee, J. A study on the estimation of CBM resources using probabilistic approach from Mongolian coal basin information. J. Korean Soc. Miner. Energy Resour. Eng. 2013, 50, 678–691. [Google Scholar] [CrossRef]
  28. Remner, D.J.; Ertekin, T.; Sung, W.; King, G.R. A parametric study of the effects of coal seam properties on gas drainage efficiency. SPE Reserv. Eng. 1986, 1, 633–646. [Google Scholar] [CrossRef]
  29. Sung, W.; Ertekin, T.; Schwerer, F.C. The development, testing, and application of a comprehensive coal seam degasification model. In Proceedings of the SPE Unconventional Gas Technology Symposium, Louisville, Kentucky, 18–21 May 1986. [Google Scholar] [CrossRef]
  30. Sawyer, W.K.; Paul, G.W.; Schraufnagle, R.A. Development and application of a 3D coalbed simulator. In Proceedings of the International Technical Meeting, Petroleum Society CIM, Society of Petroleum Engineers, Calgary, Alberta, Canada, 10–13 June 1990. [Google Scholar]
  31. Manik, J.; Ertekin, T.; Kohler, T.E. Development and validation of a compositional coalbed simulator. J. Can. Pet. Technol. 2002, 41, 39–45. [Google Scholar] [CrossRef]
  32. Connell, L.D.; Sander, R.; Pan, Z.; Camilleri, M.; Heryanto, D. History matching of enhanced coal bed methane laboratory core flood tests. Int. J. Coal Geol. 2011, 87, 128–138. [Google Scholar] [CrossRef]
  33. Dong, J.; Cheng, Y.; Liu, Q.; Zhang, H.; Zhang, K.; Hu, B. Apparent and true diffusion coefficients of methane in coal and their relationships with methane desorption capacity. Energy Fuels 2017, 31, 2643–2651. [Google Scholar] [CrossRef]
  34. Kumar, H.; Mishra, M.K.; Mishra, S. Laboratory investigation of gas permeability and its impact on CBM potential. J. Pet. Explor. Prod. Technol. 2018, 8, 1–15. [Google Scholar] [CrossRef]
Figure 1. Langmuir isotherm.
Energies 12 03445 g001
Figure 2. The process of the volumetric method.
Energies 12 03445 g002
Figure 3. Manufactured reactor for the lump coal experiments. For (a), a coal size of only 1 to 2 cm is possible. For (b), various sizes of coal can be used from 1 to 6 cm.
Energies 12 03445 g003
Figure 4. Coal particle sizes: (a) 180–254 µm, (b) 254–508 µm, (c) 0.5–1 mm, (d) 1–2 mm, (e) 2–4 mm, (f) 2-cm cubes.
Energies 12 03445 g004
Figure 5. The results of adsorption characteristics with particle size (coal sample group A).
Energies 12 03445 g005
Figure 6. The results of adsorption characteristics with particle size (coal sample group B).
Energies 12 03445 g006
Figure 7. Adsorption equilibrium time with particle size (coal sample group A).
Energies 12 03445 g007
Figure 8. Electron microscope images of cleat structure in sample B.
Energies 12 03445 g008
Figure 9. Results of sensitivity analysis.
Energies 12 03445 g009
Figure 10. Interaction effect of each parameter in the simulation.
Energies 12 03445 g010
Figure 11. Comparison of the experiment history with the base (blue) and the history-matched (magenta) cases.
Energies 12 03445 g011
Table 1. Proximate analysis of the samples.
TitleCoal Sample Group ACoal Sample Group B
Inherent moisture (air-dried basis) (wt.%)2.661.20
Ash (air-dried basis) (wt.%)11.4618.53
Volatile matter (air-dried basis) (wt.%)42.6825.38
Fixed carbon (air-dried basis) (wt.%)43.2054.89
Volatile matter (dried basis) (wt.%)44.3825.91
Fixed carbon (dried basis) (wt.%)44.1655.56
Volatile matter (dry ash-free, DAF) (wt.%)49.1530.33
Fixed carbon (DAF) (wt.%)50.8569.67
Gross calorific value (air-dried basis) (MJ/kg)27.8427.84
Gross calorific value (dried basis) (MJ/kg)28.5927.75
Table 2. Langmuir factors of CH4 depending on the sample particle size.
Sample GroupCoal Particle Size(a)
180–254 µm
(b)
254–508 µm
(c)
0.5–1 mm
(d)
1–2 mm
(e)
2–4 mm
(f)
2-cm Cube
AVL (cm3/kg)20,809.44 22,295.85 15,60712,005.53 10,765.40 8670.62
PL (kPa)1086.76 2545.86 2556.53 2370.44 3371.62 3108.35
BVL (cm3/kg)20,809.44 19,508.75 17,341.25 15,60713,571.22 12,005.53
PL (kPa)1233.72 1120.04 2047.85 2009.12 2191.64 1749.51
Table 3. Initial parameter settings in the base model.
Input ParametersValues
Coal volume (cm3)8.00
Grid dimension10 × 10 × 10
Matrix porosity0.017
Fracture porosity0.005
Matrix permeability (mD)0.01
Fracture permeability (mD)4.00
Fracture spacing I (cm)0.20
Fracture spacing J (cm)0.20
Fracture spacing K (cm)0.20
Cleat compressibility (1/kPa)2.00 × 10−6
Coal Density (kg/cm3)1.43 × 10−3
Diffusion coefficient (cm2/s)3.50 × 10−10
Langmuir pressure (CH4) (kPa)3500
Langmuir volume (CH4) (cm3/kg)12,920
Table 4. History-matched parameters.
Matched ParametersValues
Cleat compressibility (1/kPa)2.40 × 10−5
Matrix porosity0.01
Fracture porosity0.15
Matrix permeability (mD)0.11
Fracture permeability (mD)23.85
Fracture spacing I (cm)0.24
Fracture spacing J (cm)0.17
Fracture spacing K (cm)0.20
Diffusion coefficient (cm2/s)2.66 × 10−10

