Article

Sensitivity of Axial Velocity at the Air Gap Entrance to Flow Rate Distribution at Stator Radial Ventilation Ducts of Air-Cooled Turbo-Generator with Single-Channel Ventilation

1
School of Electrical Engineering, Beijing Jiaotong University, Beijing 100044, China
2
China North Vehicle Research Institute, Beijing 100072, China
*
Author to whom correspondence should be addressed.
Energies 2019, 12(18), 3442; https://doi.org/10.3390/en12183442
Submission received: 17 July 2019 / Revised: 12 August 2019 / Accepted: 23 August 2019 / Published: 6 September 2019
(This article belongs to the Special Issue Heat and Mass Transfer in Energy Systems)

Abstract

:
In the design and calculation of a 330 MW water-water-air cooling turbo-generator, it was found that the flow direction of the fluid in the local stator radial ventilation duct is opposite to the design direction. In order to study what physical quantities are associated with the formation of this unusual fluid flow phenomenon, in this paper, a 100 MW air-cooled turbo-generator with the same ventilation structure as the abovementioned models is selected as the research object. The distribution law and pressure of the fluid in the stator radial ventilation duct and axial flow velocity at the air gap entrance are obtained by the test method. After the calculation method is proved correct by experimental results, this calculation method is used to calculate the flow velocity distribution of the outlets of multiple radial ventilation ducts at various flow velocities at air gap inlets. The relationship between the flow distribution law of the stator ventilation ducts and the inlet velocity of the air gap is studied. The phenomenon of backflow of fluid in the radial ventilation duct of the stator is found, and then the influence of backflow on the temperature distribution of stator core and winding is studied. It is found that the flow phenomenon can cause local overheating of the stator core.

1. Introduction

Regarding the research on the temperature field of large turbo-generators, most scholars have mainly focused on the research on the fluid field and the temperature field [1,2,3]. Some research mainly focused on the heat transfer relationship between the temperature rise of structural parts such as the stator winding and fluid flow. There were also some studies on the internal fluid distribution law of generators, and the main research direction was the rational design of the ventilation system of the generator [4,5,6]. Unlike the above research contents, the main content of this paper is about which physical quantities of the fluid are related to the fluid flow distribution rules in the ventilation duct of the generator and which significant changes will occur with the changes of these physical quantities. The accurate measurement results of the fluid distribution in the ventilation duct of the stator core are the prerequisites for the accurate calculation of the above research contents.
In this paper, a 100 MW single-channel ventilation turbo-generator set is taken as the research object, and the experimental measurement method [7,8,9] of flow in stator radial duct distribution and air gap flow velocity of ventilation duct is proposed. The fluid pressure and flow velocity measuring sensors are buried at the generator stator ventilation duct and the air gap entrance. After measuring the pressure and flow speed at these positions, it is found that the fluid velocity at the local stator radial ventilation duct is significantly lower. Then the calculation results of fluid flow velocity in different ventilation ducts of the generator stator during the test conditions are obtained by the three-dimensional fluid field calculation method. The calculated results are in good agreement with the experimental results after comparison.
Though our analysis, it is found that the air gap inlet velocity is the main factor affecting the distribution of the fluid flow rate in the stator ventilation duct. Based on this calculation method, the results of velocity distribution in different radial ventilation ducts of generator stator are calculated at three different flow velocities at the air gap entrance. It is also found that with the increase of the velocity at the air gap entrance, the phenomenon of backflow in the stator iron core ventilation duct will occur locally.

2. Experimental Measurement and Result Analysis

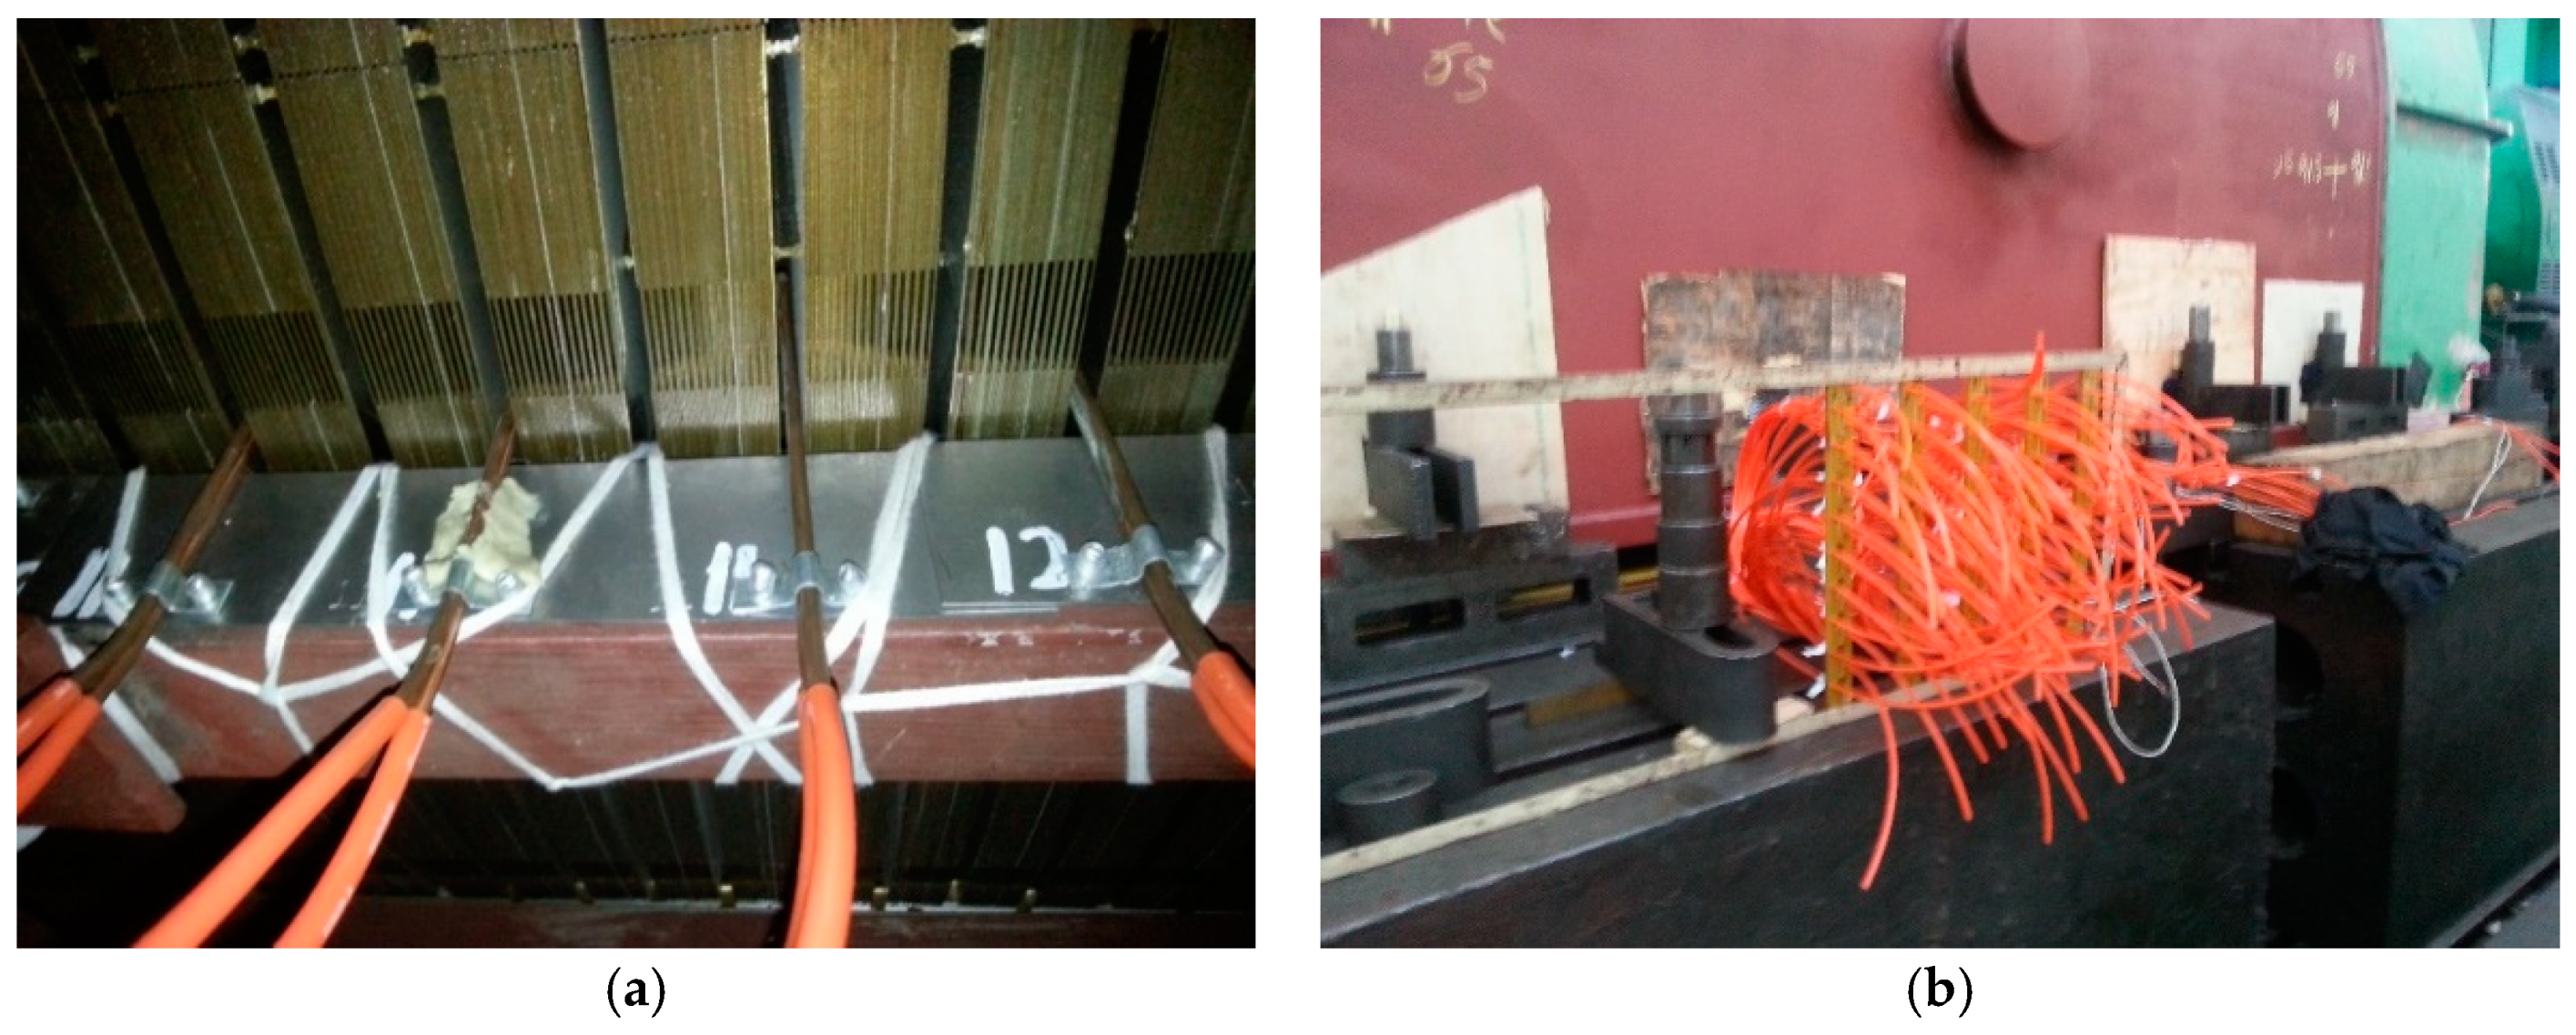
2.1. Test and Measurement of the Velocities at Air Gap Inlet and Radial Ventilation Duct Outlets in the Generator

The schematic diagram of single ventilation is shown in Figure 1. There are 76 radial ventilation ducts in the stator of the test generator. Due to the large number of them, the test basically follows the principle of embedding a wind speed measuring component in every other wind duct. Due to the existence of the step structure on both sides of the stator core end, the fluid is blocked by the core step in this area, resulting in a large change in the fluid flow velocity in this area. Therefore, the measuring elements are embedded densely at the air gap entrance of the generator. The measuring component adopts the pitot tube, and the pitot tube is connected with two pressure measuring tubes at the tail. The measured full pressure and static pressure are led to the outside of the generator through the pressure tube, which is convenient for connecting the pressure collector and obtaining the test result. The pitot tubes are buried in the ventilation duct yokes of the stator core and care to ensure the same embedment depth and axial position. In the axial direction, the buried pitot tube is located in the axial center of the ventilation duct, and it is not affected by the boundary layer with low flow velocity at the wall surface. Each pitot tube in the radial direction is oriented toward the center of the circle to ensure the consistency between the measurement sensor and the direction angle of the flow velocity. In this way, the measuring point placed in the ventilation duct can clearly and effectively measure the wind speed and pressure in the entire wind channel, ensuring the consistency of data. The specific installation positions are shown in Figure 2 and Figure 3.
Figure 3 shows the embedding position of the wind speed sensor at the air gap entrance. The sensor is located at the entrance of the generator air gap. Considering the influence of rotating air flow at the air gap entrance, the installation angle between the wind sensor direction and the axial direction is 40 degrees. Since the air volume passing through this position accounts for about 70% of the total air volume of the generator, it is very important to accurately measure the wind speed at this inlet position. At the same time, in single-channel ventilation of turbo-generator, the flow resistance at the air gap entrance is the biggest in the whole ventilation system. It is necessary to bury the pressure measuring point here, which is also of great guiding significance to verify the calculated value of the whole ventilation system design. This measurement will provide important inlet boundary conditions for the following finite element calculations.

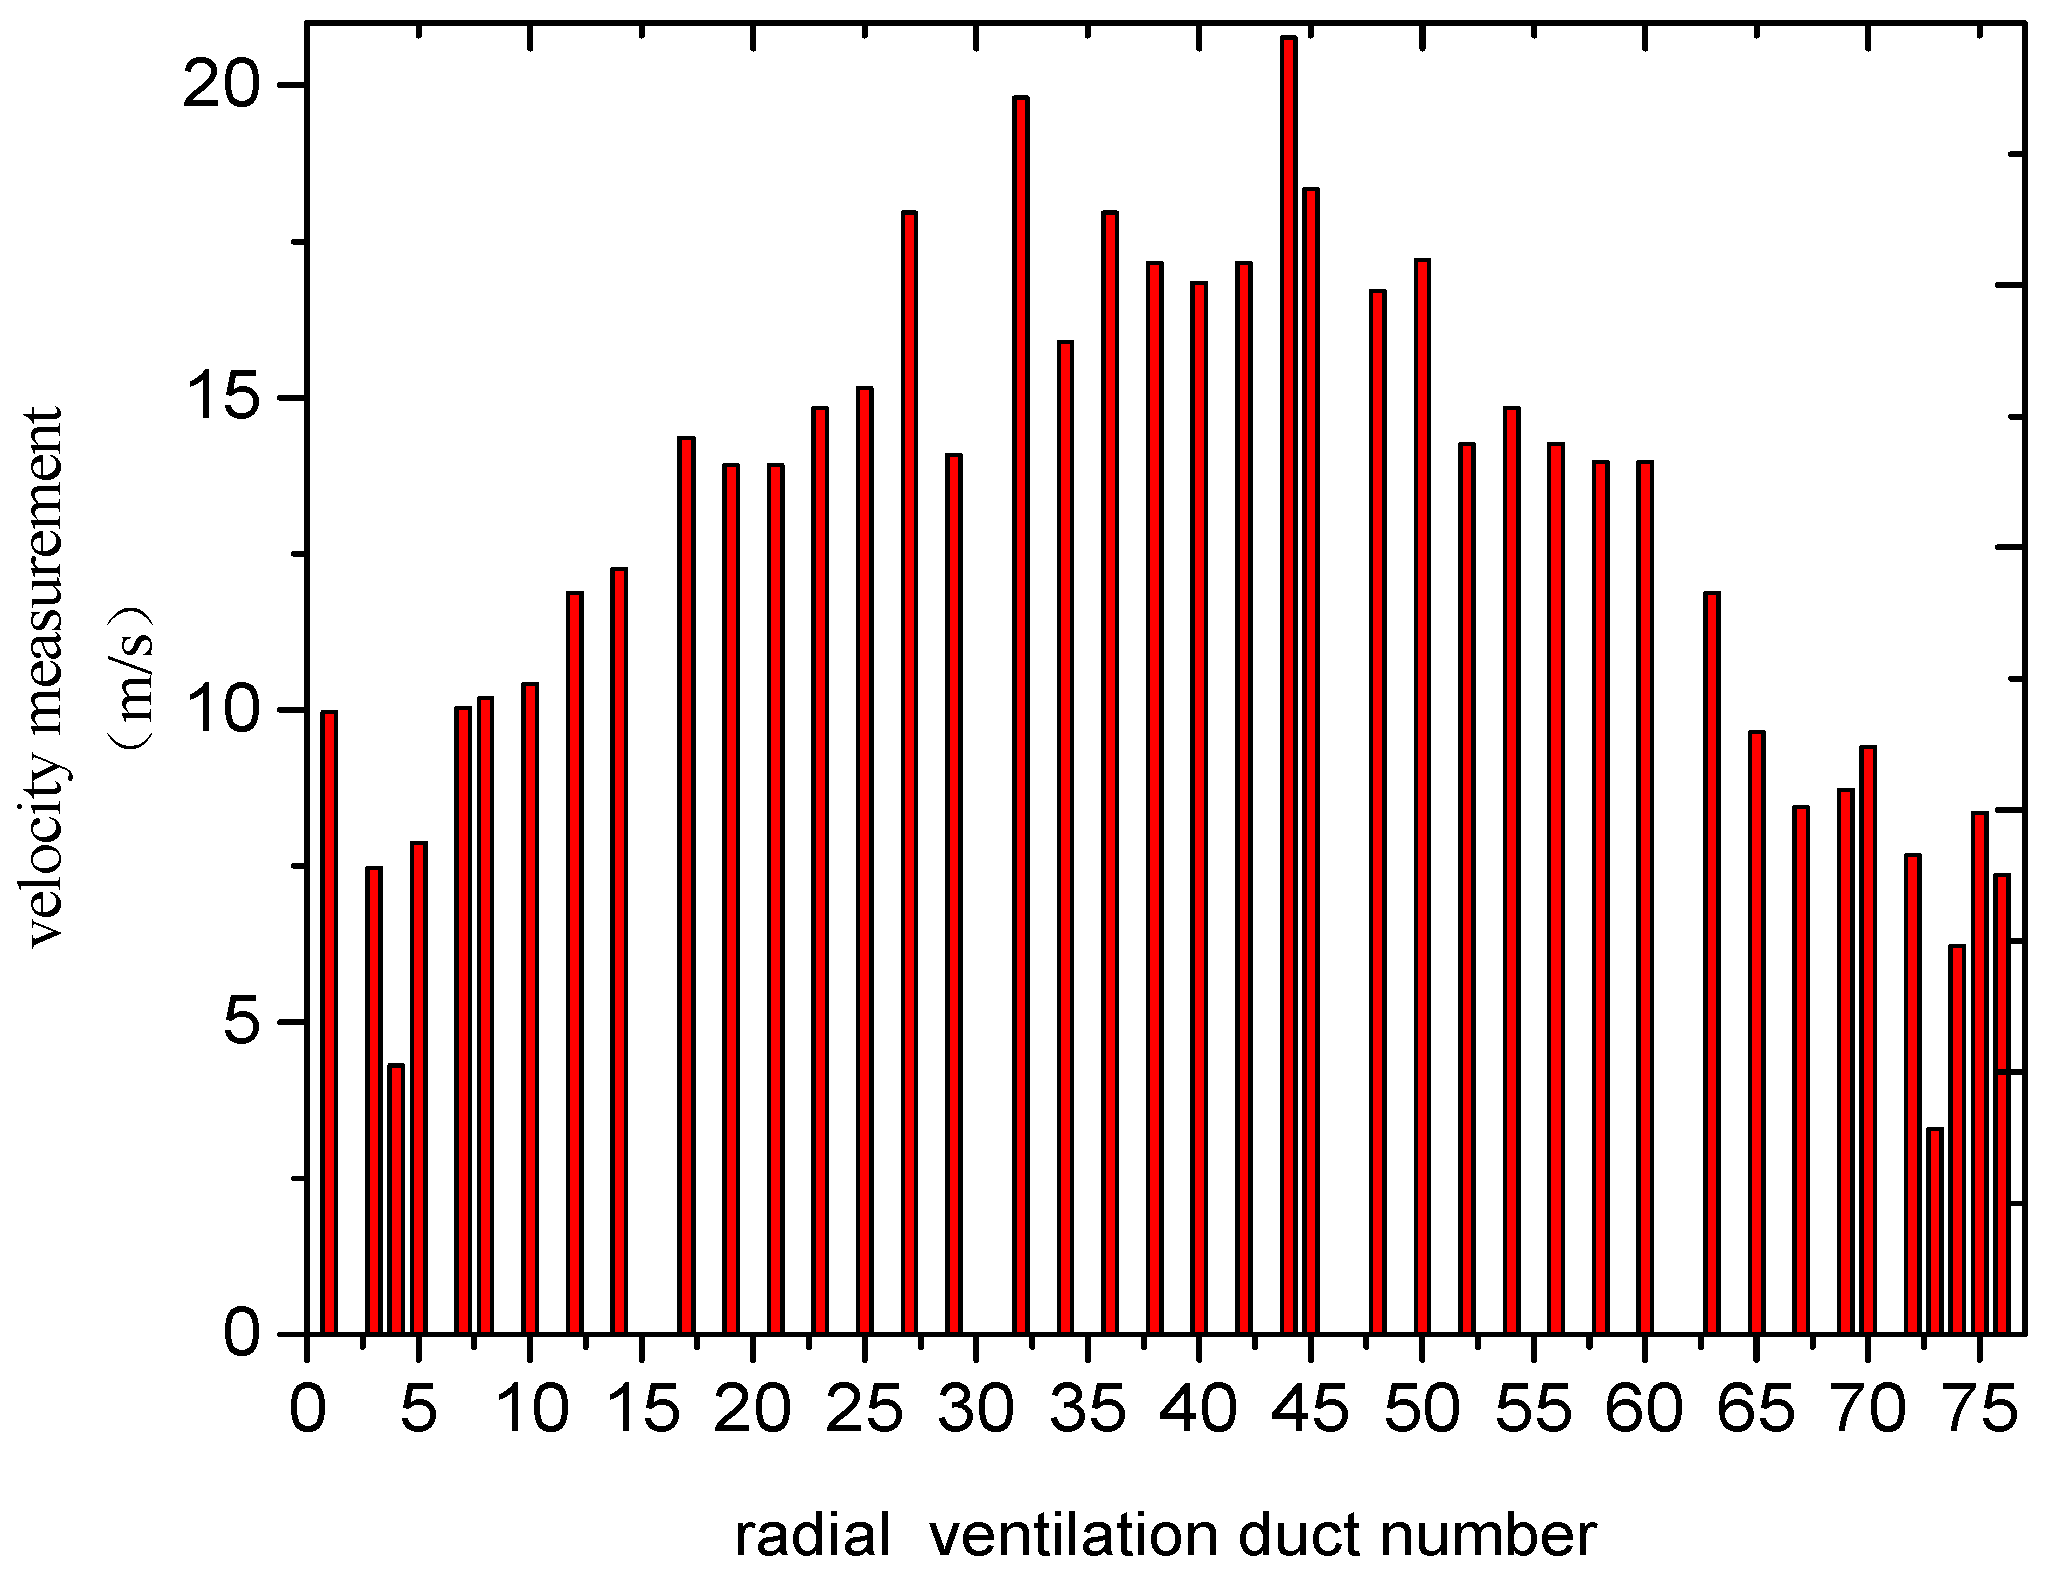
2.2. Stator Radial Ventilation Duct Outlet Flow Rate Measurement Results

Table 1 shows that the static pressure at the measuring position of the stator core yoke ranges from 1000 to 1500 Pa. From the distribution of pressure difference, when the fluid is located at the end of both sides of the stator core, the pressure difference is small, and it is bigger close to the stator core center. According to the Bernoulli equation of fluid flow, it can be known that: This pressure difference is actually the dynamic pressure of the fluid, and this value can reflect the fluid velocity at the measurement position.
p t o t a l p s t a t i c = p D y n a m i c = 1 2 ρ v 2
The calculated static pressure at the generator fan inlet is about 4500 Pa. It can be inferred from the static pressure measured by the sensor in Table 1 that the sum of fluid flow resistance at the generator end, air gap, core tooth, and other positions is 3000 Pa. The static pressure in the ventilation duct on both sides of the generator end is large, but the difference between the total pressure and the static pressure is small. The static pressure at the ventilation duct of the generator center is small, but the difference between the total pressure and the static pressure is large, indicating that the flow velocity in most ventilation ducts in the central area of the generator stator is larger than that at the end. Detailed analysis of the data in the table: It was found that the pressure difference in radial ventilation duct no. 49 and 74 was negative. After rechecking the measuring element, it was found that an installation error caused the negative measuring result.
In order to facilitate intuitive analysis, the measurement results are shown in Figure 4. The wind speed measurement results in the stator core ventilation duct have a total of 76 ventilation ducts throughout the core. The wind speed measurement components are densely packed at the ends and relatively less in the middle. It can be seen that the fluid radial velocities in the entire core ventilation ducts show a higher speed in the middle and a lower speed at both sides of the end. This indicates that the flow velocity from the two ends to the center gradually increases, and the maximum flow velocity is about 20 m/s.
It can also be found that the flow velocity in the first three ventilation ducts is high on both sides of the stator, while the flow velocity in the fourth, fifth, and sixth ventilation ducts decreased rapidly, down to less than 4 m/s. It is not difficult to infer that the stator cores and winding near the fourth to the seventh ventilation ducts will have a higher temperature rise due to the lower wind speed.
The reason for the decrease of the fourth, fifth, and sixth ventilation duct wind speeds on both sides of the stator is that this position is the beginning of the normal stator ventilation duct. These ventilation duct structures are different from the first, second, and third which have the characteristics of the step structure, shown in Figure 5. The wind in the first three ventilation ducts, due to the iron core step structure block, has a higher wind speed in radial ventilation ducts. After passing through the first three ventilation ducts, the flow duct structure area is smooth in the axial direction and the flow becomes unobstructed. The wind has a high axial velocity when it flows in the air gap. This will cause the static pressure around the gap to drop. Thus, it results in a very low wind speed in radial ventilation ducts at this location. As the capacity of the generator increases, the fluid velocity at the entrance of the air gap increases, and this problem becomes more serious.
In order to study the influence of different axial velocities at the air gap entrance on the radial velocity of fluid in the adjacent ventilation duct, the finite element method is used to calculate the test condition.

3. Study on Sensitivity of Air Gap Inlet Flow Velocity to Stator Radial Ventilation Duct Flow Rate Distribution

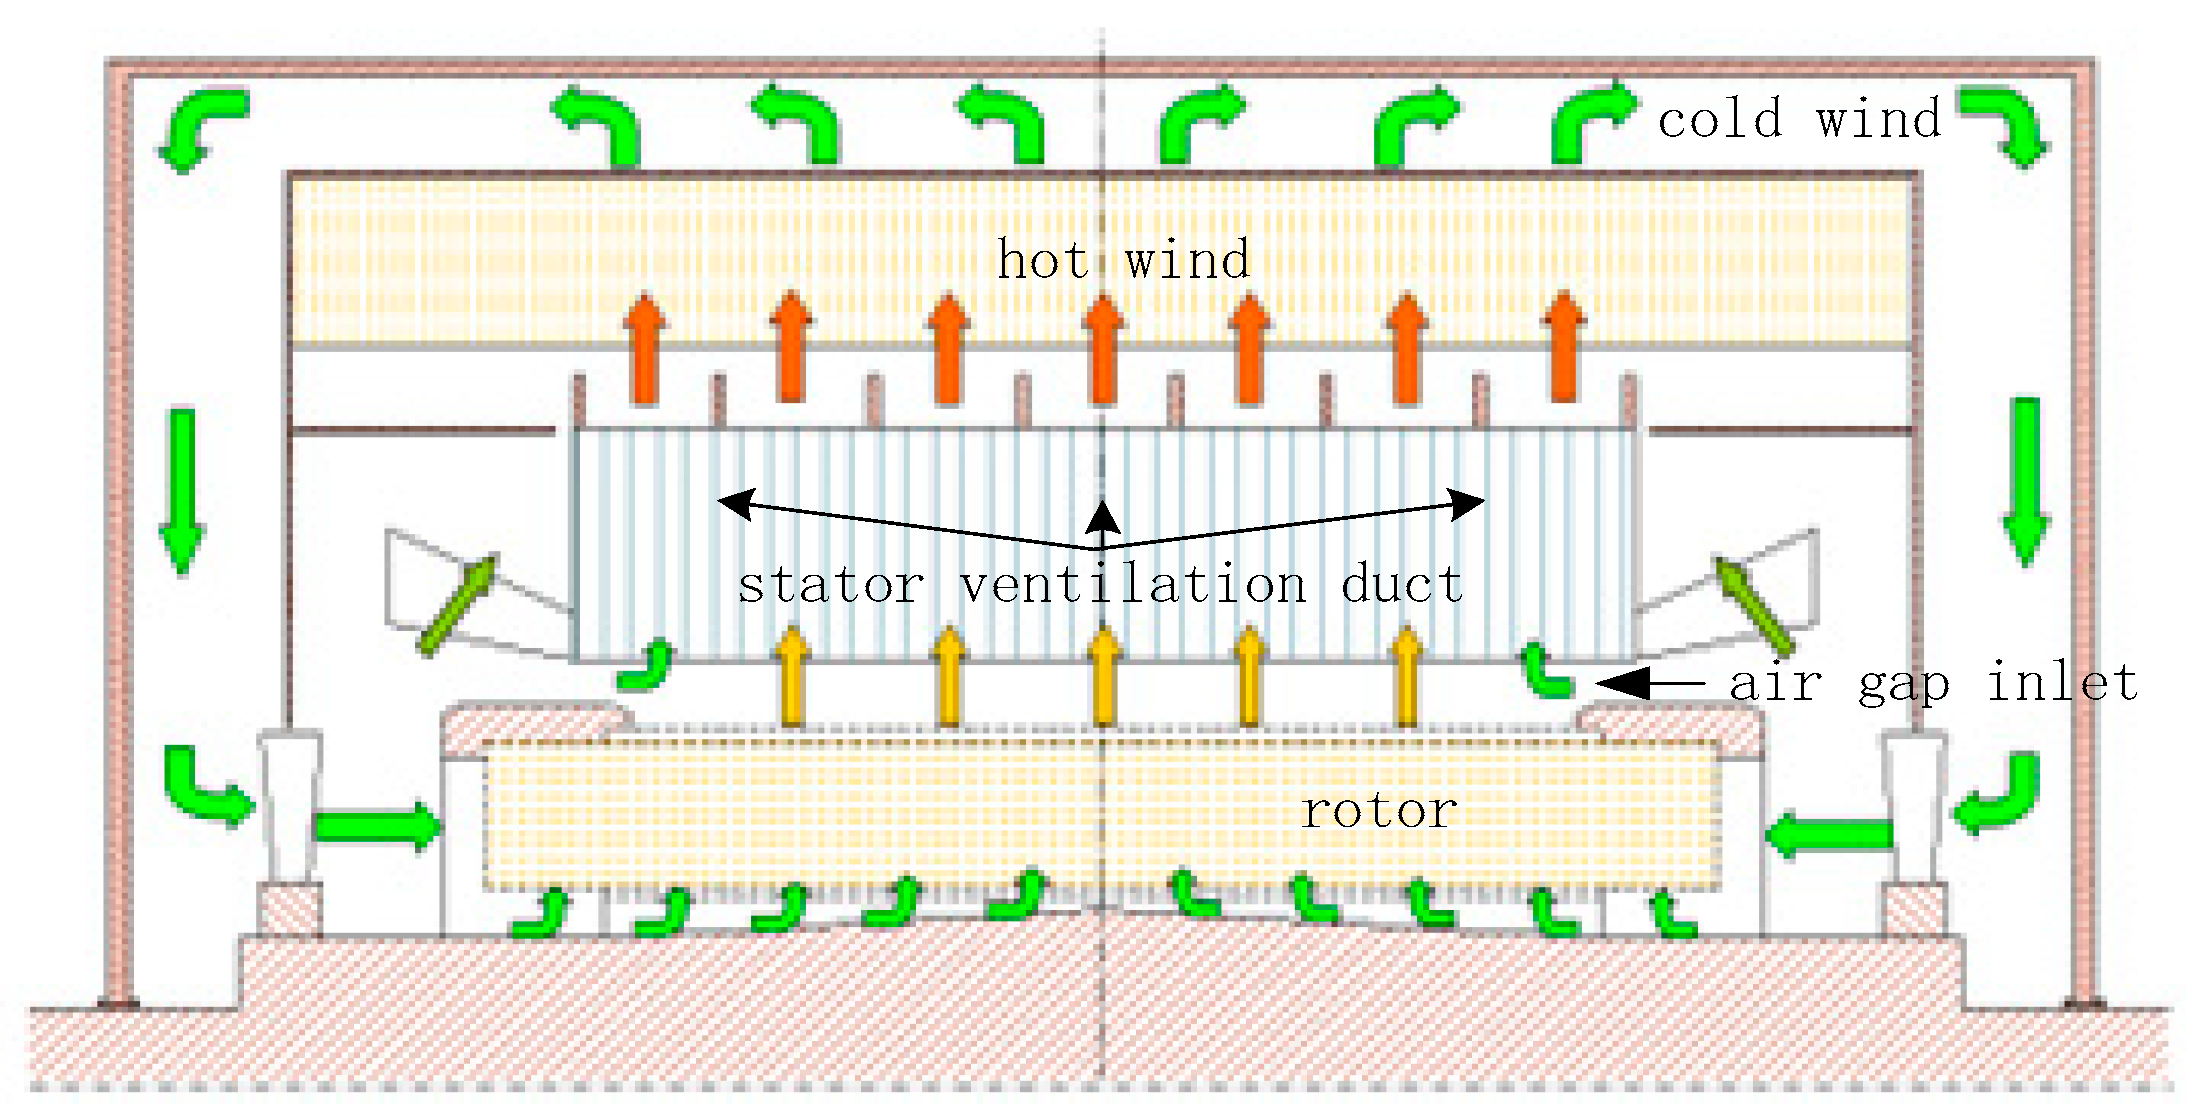
3.1. Mathematical Model and Physical Model Description

3.1.1. Mathematical Model Description

Mass conservation equation [10,11,12]:
div ( ρ V ) = 0
Momentum conservation equation [10,11,12]:
{ ( ρ u ) t + div ( ρ V u ) = div ( μ gradu ) p x + S u ( ρ v ) t + div ( ρ V v ) = div ( μ gradv ) p x + S v ( ρ w ) t + div ( ρ V w ) = div ( μ gradw ) p x + S w
Energy conservation equation [10,11,12]:
( ρ T ) t + div ( ρ V T ) = div ( λ c grad T ) + S T
where ρ is fluid density; t is the time; V is the relative fluid velocity vector; u, v, and w are the components of V in x, y, and z axes; μ is viscosity coefficient; p is static pressure acting on a micro cell in air; Su, Sv, and Sw are the source items of the momentum equation; λ is thermal conductivity; c is specific heat in constant pressure; ST is the ratio of the heat generated in the unit volume and specific heat c.
Since the fluid in the stator calculation domain has a turbulent flow and the air in the radial ventilating duct of the generator can be regarded as incompressible, a standard k-ε model in the commercial solver “FLUENT” is used to solve the turbulence movement [10,11,12].
{ ( ρ k ) t + d i v ( ρ k V ) = d i v [ ( μ + μ t σ k ) g r a d k ] + G k ρ ε ( ρ ε ) t + d i v ( ρ V ε ) = d i v [ ( μ + μ t σ ε ) g r a d ε ] + G 1 ε ε k G k G 2 ε ρ ε 2 k
where k is the turbulent kinetic energy, ε is the diffusion rate, Gk is turbulent generation rate, μt is turbulent viscosity coefficient, G1ε and G2ε are constant; σk and σε are, respectively, the equation k and equation ε of Planck’s constant turbulence.

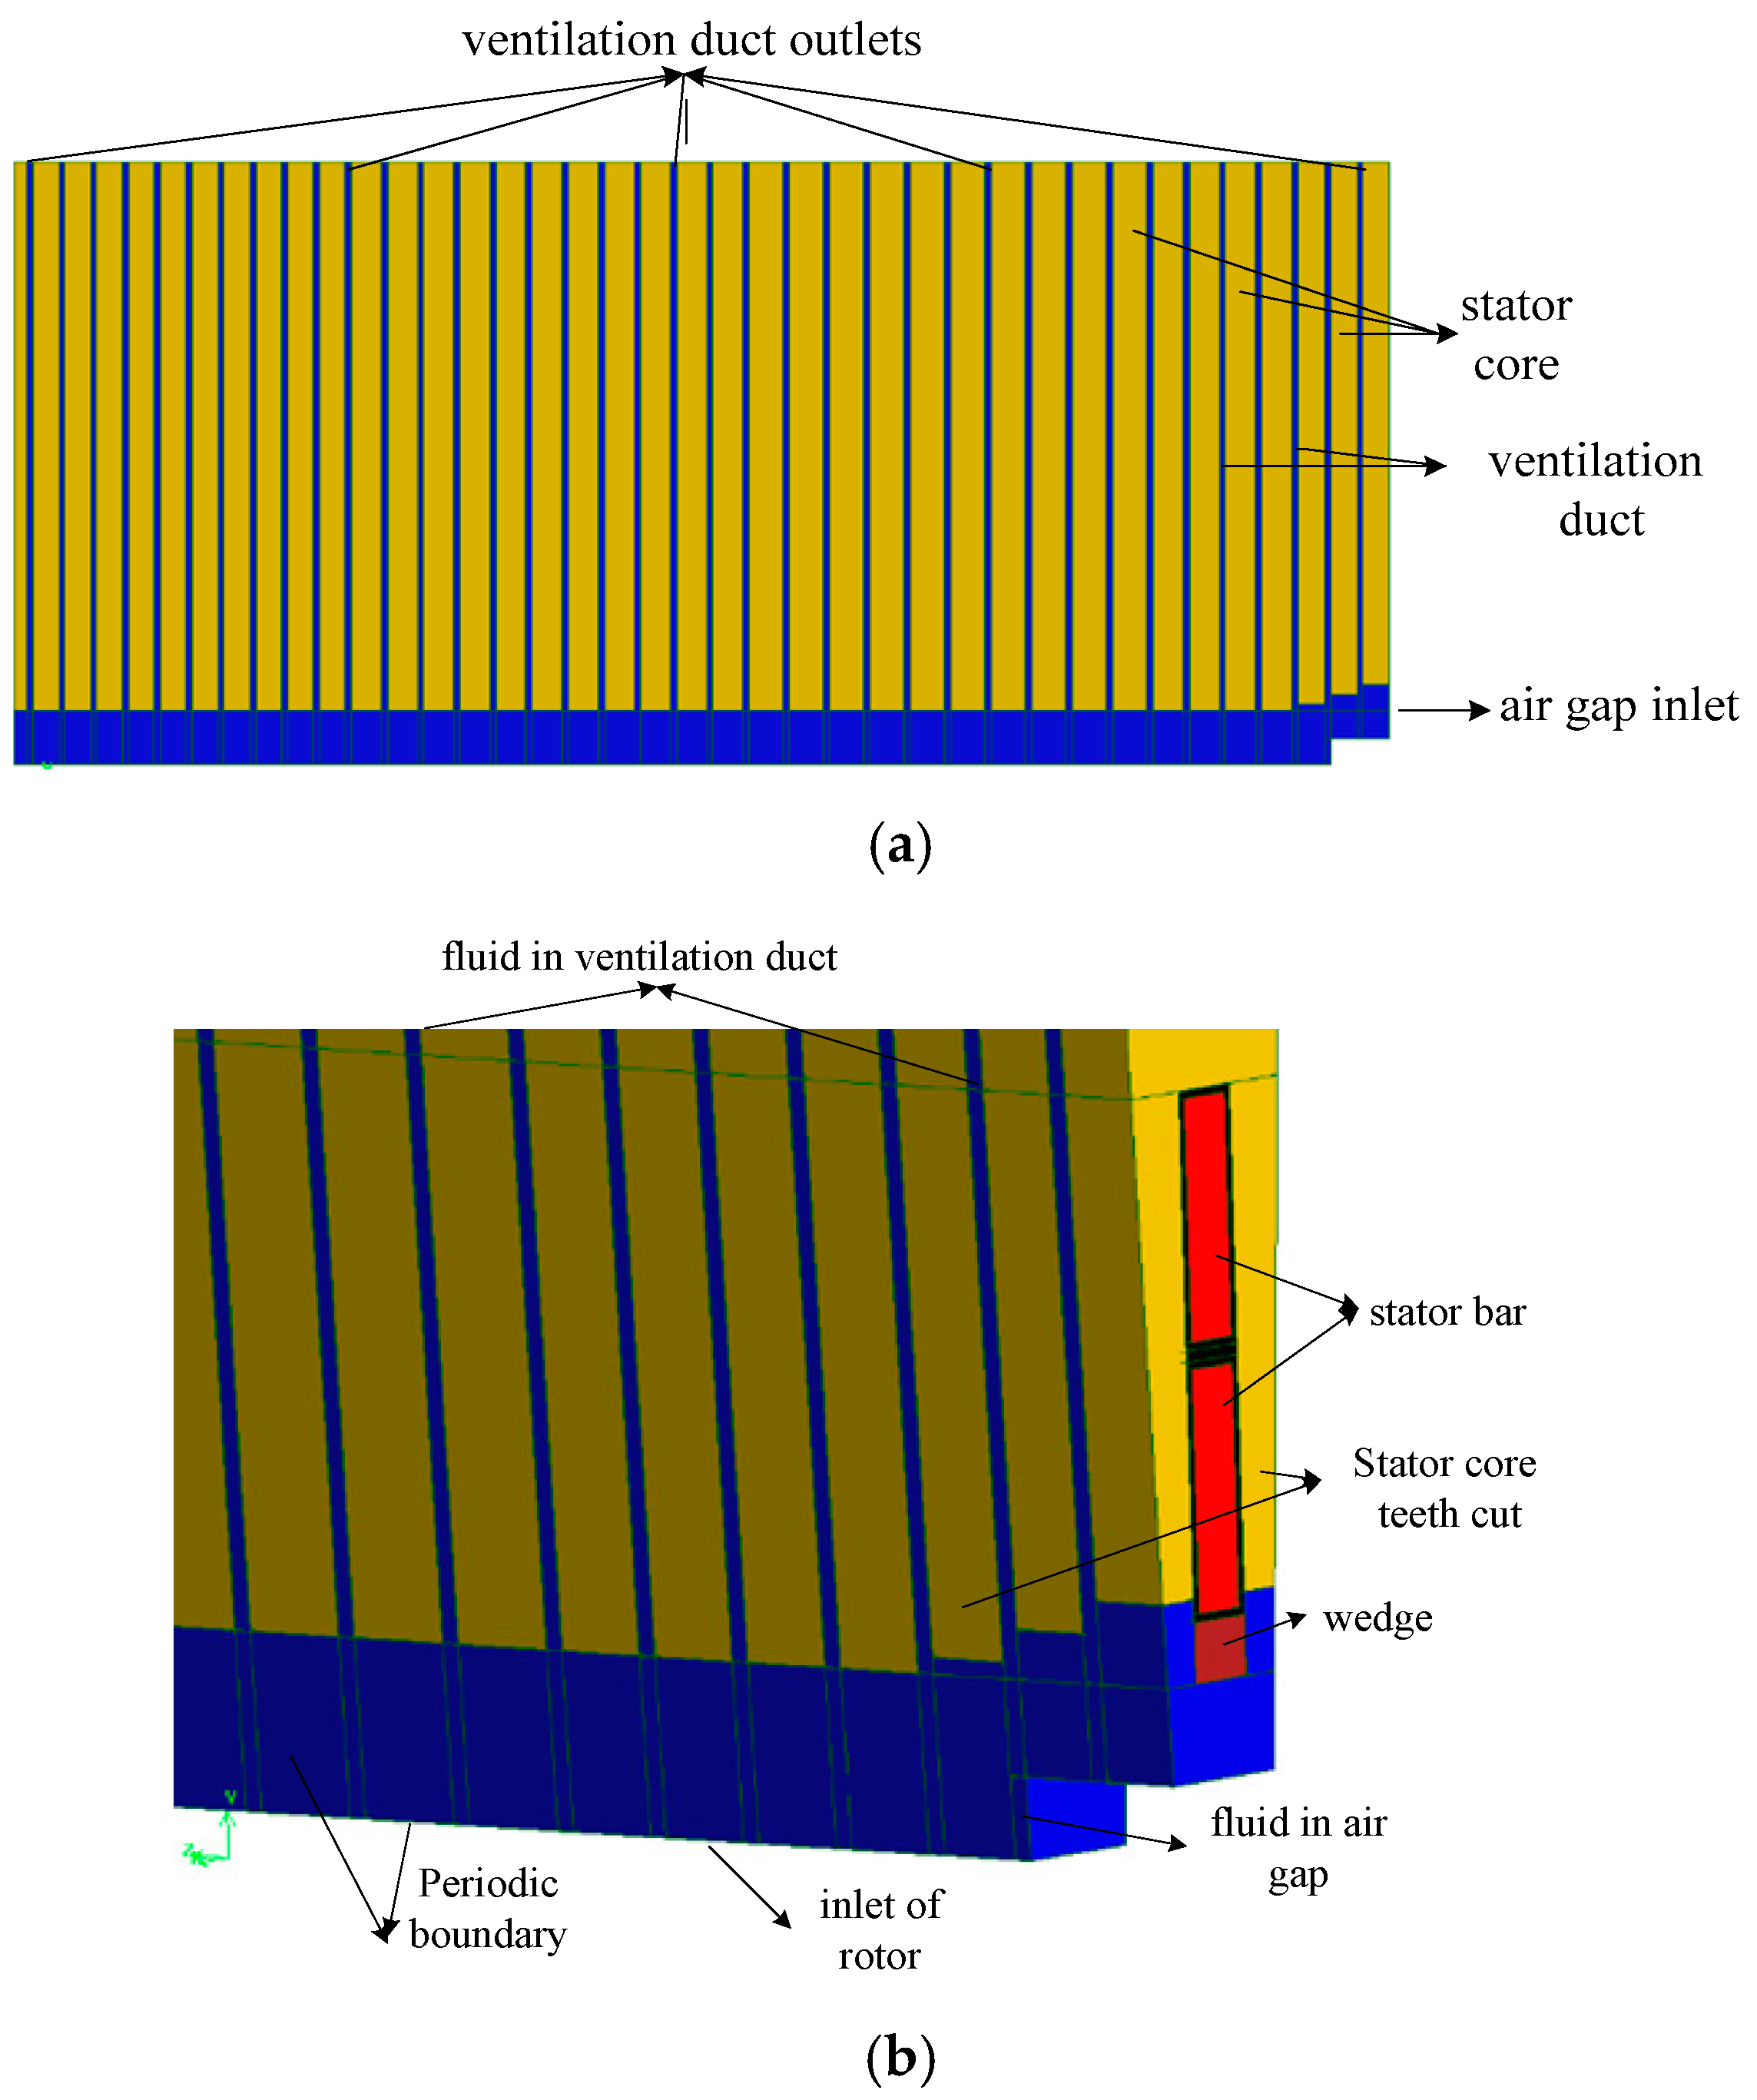
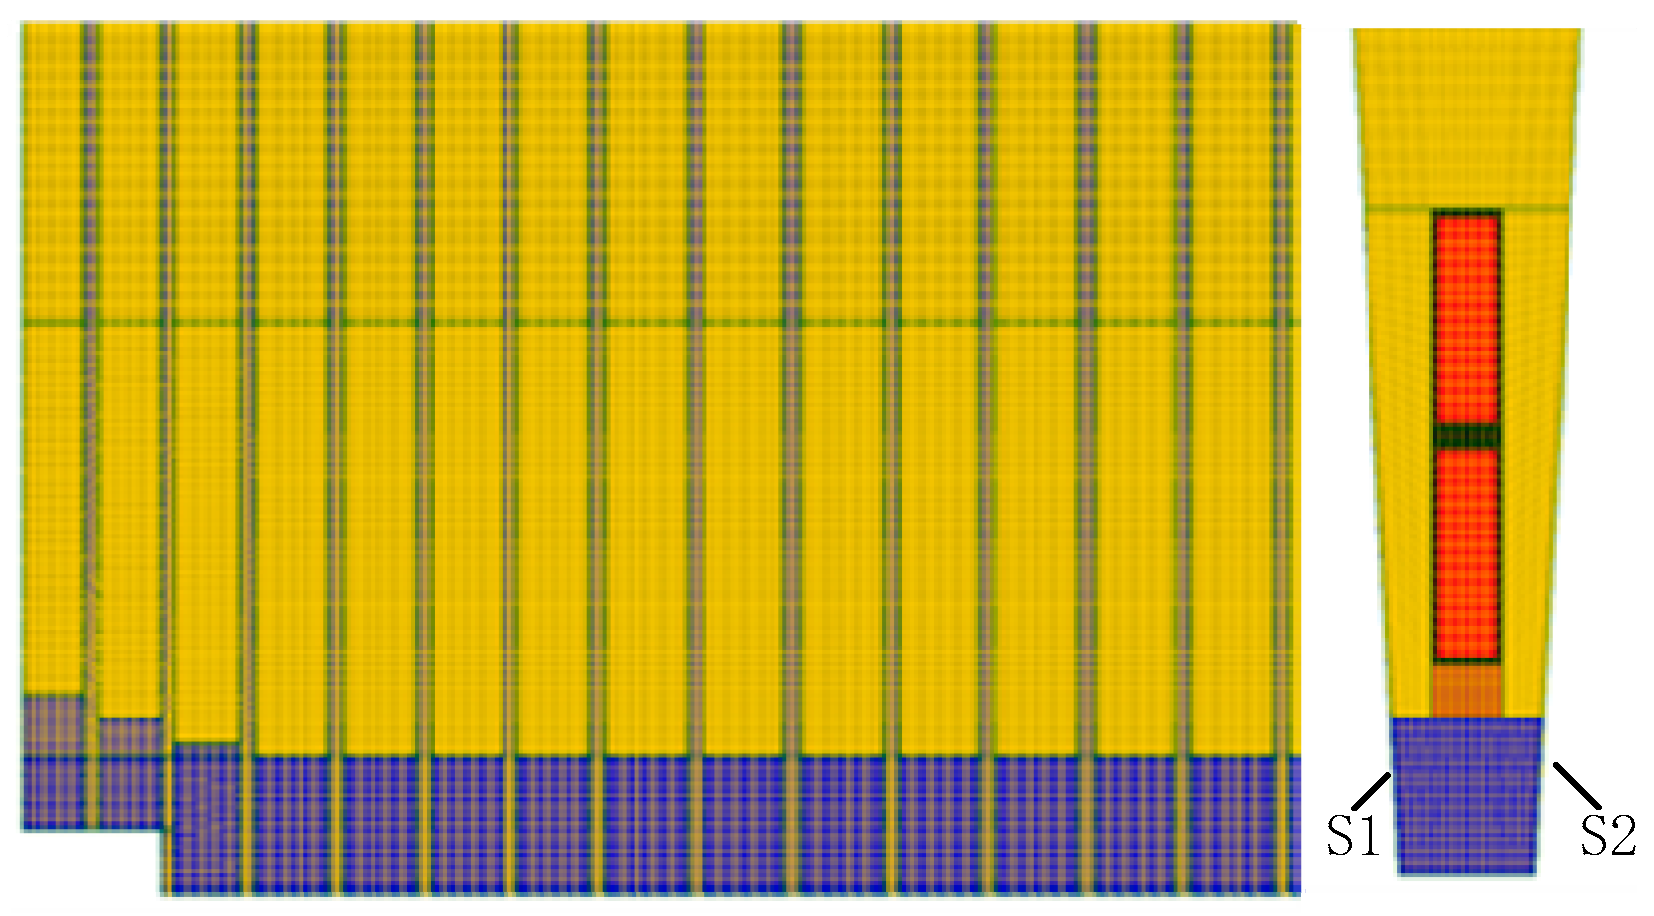
3.1.2. Physical Model Description, Mesh Analysis, and the Boundary Conditions

a. Physical Model Description
The model of Figure 6a includes 76 air gap inlets and radial ventilation duct outlets, the stator core is near the ventilation ducts, and the fluid flow in the ventilation ducts will take away the loss in the core. The model of Figure 6b includes: The upper- and lower-layer bar of the generator stator slots and their main insulation, wedges, and ventilation ducts fluid area. The first three ventilation ducts of the iron core have the step structure shown in Figure 5, and their lengths in the radial direction are sequentially increased, and the corresponding fluid area here is sequentially reduced.
b. Grid Mesh and Memory Usage
All the models adopted eight-node hexahedral mesh generation, as shown in Figure 7. The mesh generation was regular, and there were no over-sized or under-sized cells of the generation volume or area. The statistical results of the number of nodes and memory are shown in Table 2.
In order to improve the computational accuracy of the fluid domain, the grid density in the fluid domain was dense, the grid density ratio between the fluid domain and the solid domain was about 10:1 in the axial direction. In the radial direction, the grid density was dense at the air gap and sparse at the yoke. While ensuring the accuracy of calculation, this effectively reduces the amount of computation and shortens the time. The grid mesh accuracy of this calculation method has been verified by the grid encryption method through previous work, which can better meet the calculation accuracy [13].
c. Boundary Conditions
The calculation boundary conditions are given as follows [14,15,16]:
(1)
The air gap inlet is set as the velocity boundary condition, which is given according to the measurement results: The angle between the measuring element direction (Figure 3) and the axial direction is about 40 degrees, and the measured velocity is 74 m/s. Therefore, after triangle calculation, the inlet velocity of the air gap entrance is given as 56 m/s.
(2)
The 38 radial ventilation outlets (half of generator) are basically balanced with the surrounding atmospheric pressure. Given the pressure boundary condition, the value is equivalent to one atmospheric pressure.
(3)
The air gap exists in the whole circumferential direction, but the calculation model includes two additional surfaces, S1, S2 (shown in Figure 7), at the air gap that will increase the frictional resistance when fluid flows. In fact, this frictional resistance does not exist, so the periodic boundary conditions given for these two sides, eliminate the influence of frictional resistance on fluid flow.
(4)
The velocity inlet of the rotor is given as the velocity boundary condition, and the velocity value is given according to the calculation results of the rotor ventilation calculation.

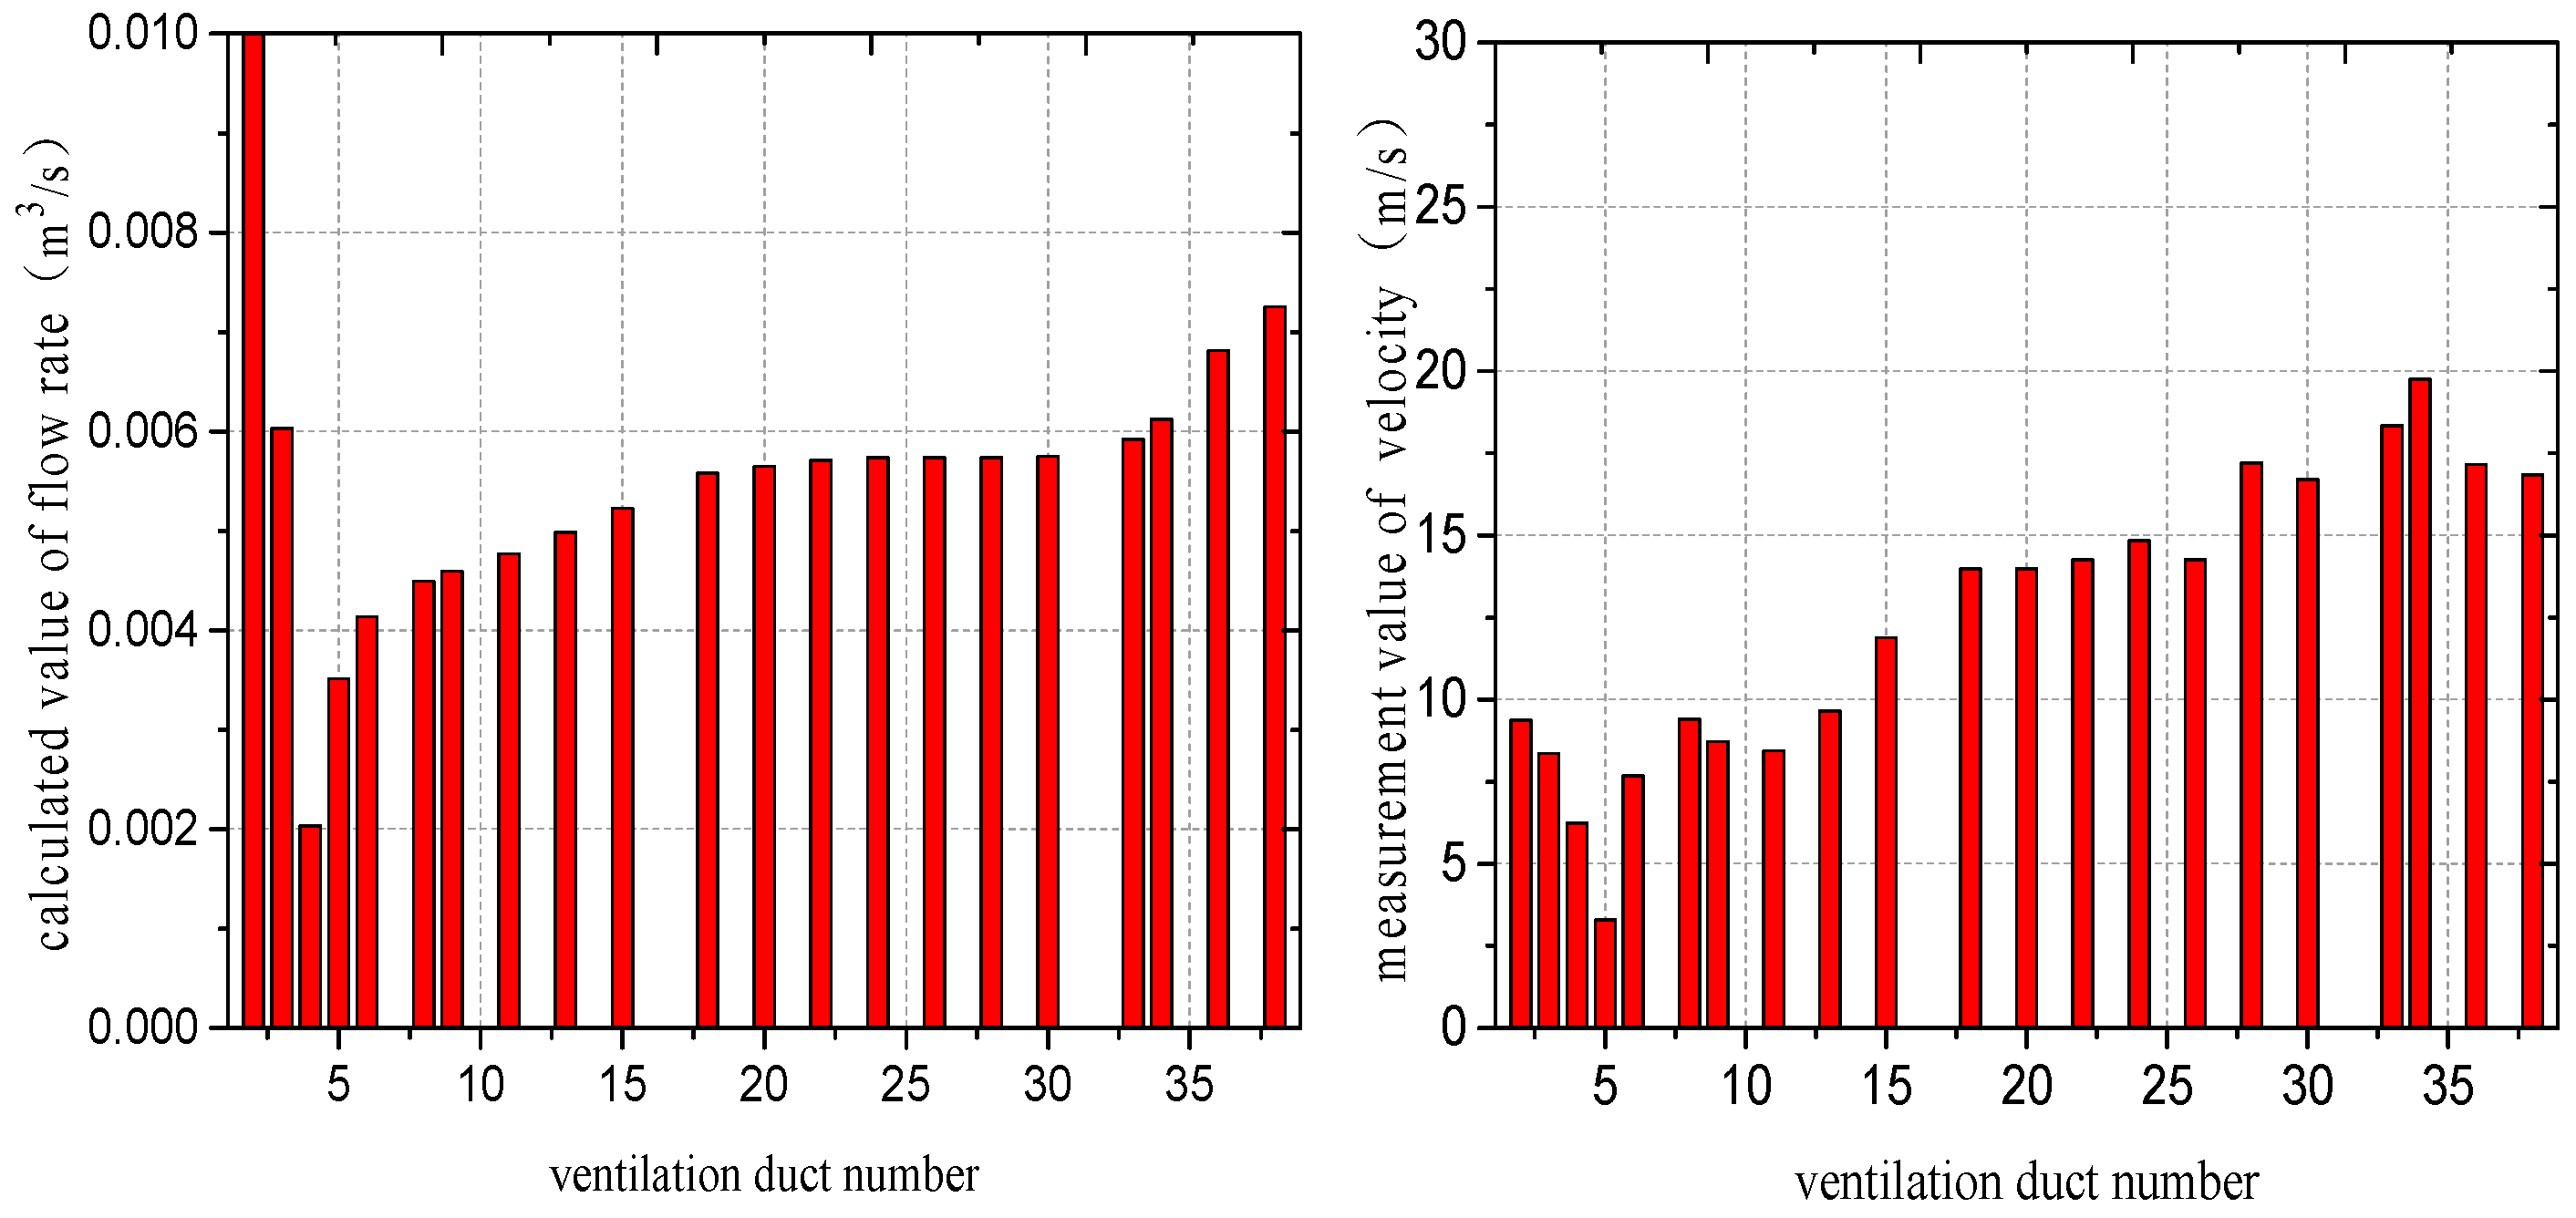
3.2. Comparison of Fluid Calculation Results and Measured Values at Test Conditions

The comparison of the test results and the calculation results of stator ventilation system are shown in Figure 8.
Because the fluid distribution is not uniform even in the same ventilation duct of the stator, the flow velocity value of one measuring point in the ventilation duct cannot completely reflect the distribution law of fluid velocity in this ventilation duct. Furthermore, the flow rate of the test result in this ventilation duct cannot be accurately obtained. However, since the fluid flow velocity measurement points are buried in the same position in each radial ventilation duct of the generator, the test velocity distribution law can indirectly reflect the flow rate distribution law in the stator radial ventilation ducts. The test results of flow velocities in different ventilation ducts and FEM calculation results of flow rates in different ventilation ducts are comparable.
It can be seen intuitively from Figure 8 that, in the fourth ventilation duct of the stator, the test results and calculated results both show a small flow rate at this position. In addition, the flow trend of fluid in different ventilation ducts is consistent. They all showed that the flow rate in the first three radial ventilation ducts is large, and then there is a trend of rapid increase after the flow rate decreases. The calculated flow distribution results are in agreement with the experimental measurements, which proves the accuracy of the calculation method.

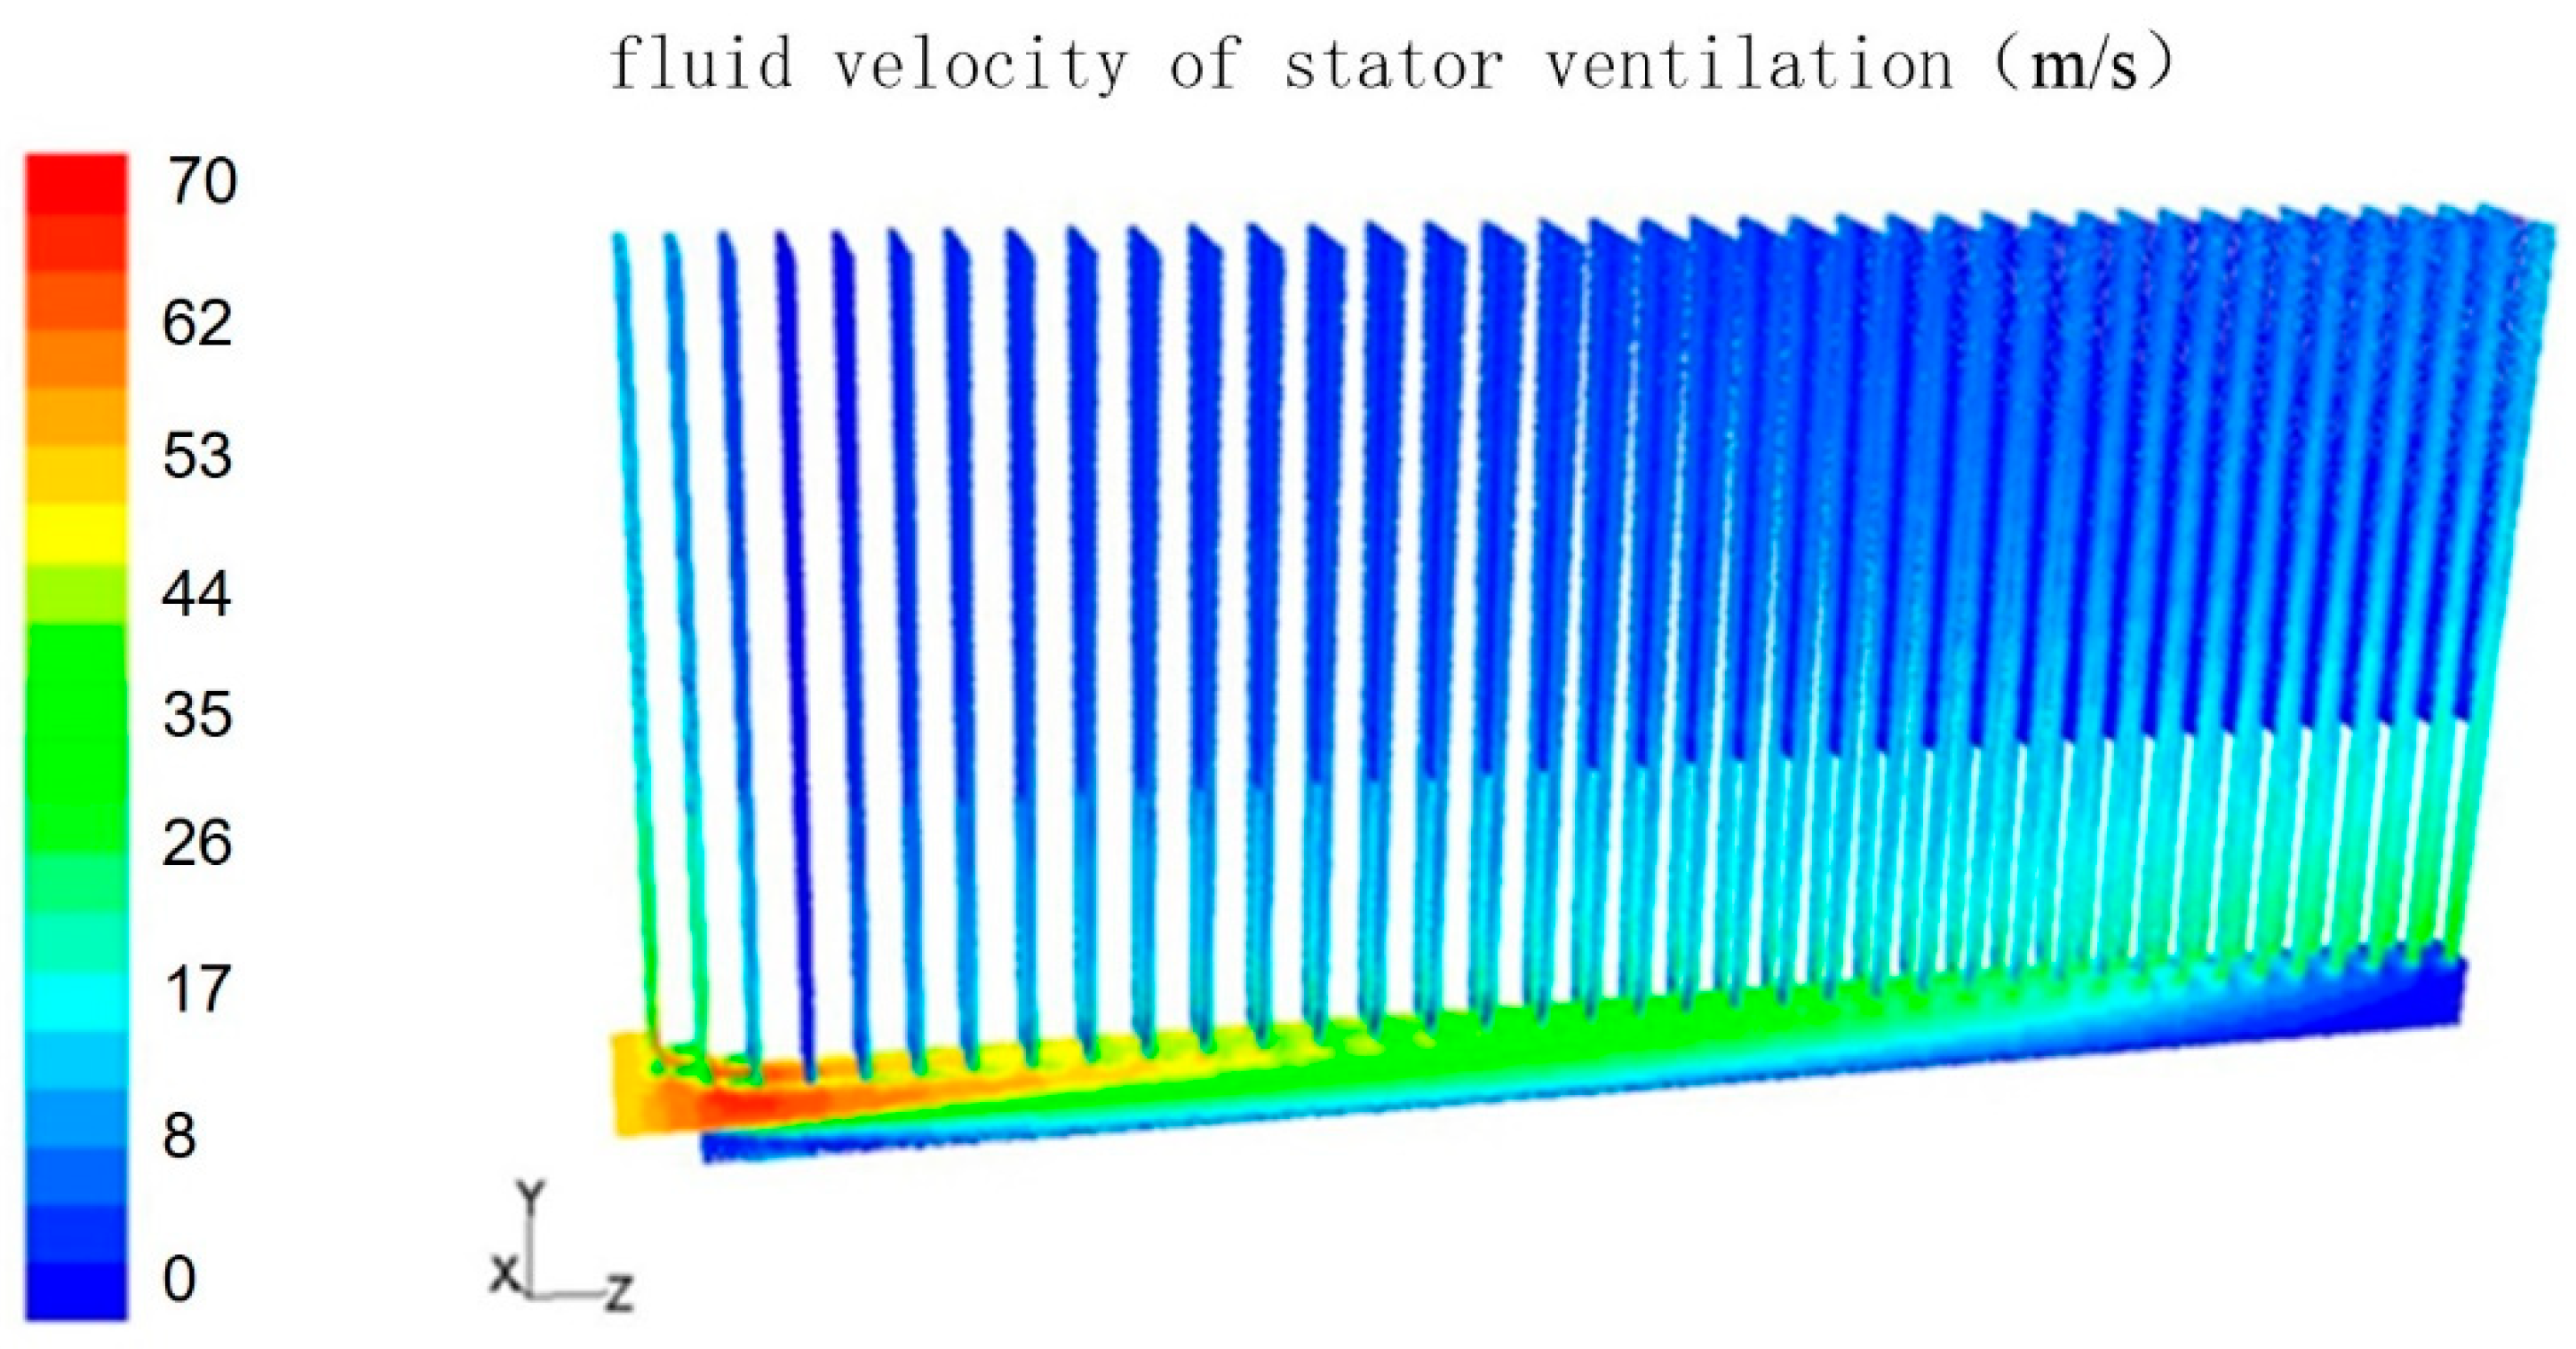
3.3. Study on Sensitivity of Axial Velocity at the Air Gap Entrance to Flow Rate Distribution at Stator Radial Ventilation Ducts

In order to analyze the effect of different axial velocities at the air gap entrance on flow rate distribution at the stator radial ventilation ducts, this section gives four different wind speeds at the air gap entrance, which are 56, 70, 85, and 100 m/s respectively. Through the calculation of finite element theory, the distribution law of fluid flow in different radial ventilation ducts can be determined at the four different air gap inlet flow velocities.
When the air gap inlet velocity is 56 m/s, the flow velocity distribution of the fluid in the air gap and in each radial ventilation duct can be seen from Figure 9. After the fluid enters the air gap, the maximum flow velocity is 71 m/s, located below the second ventilation duct. According to the analysis of fluid continuity theory, the flow area in this place is the smallest position in the air gap, so the fluid velocity is the highest here. After fluid flowing through this position, the cross-sectional area in the air gap suddenly increases, but the fluid distribution does not rapidly expand as the air gap space increases, and the flow velocity in the air gap is still high. The velocity distribution trend shows the higher velocity in upper layer of the air gap, and the lower velocity in the lower layer. As the fluid in the air gap flows into the radial ventilation ducts sequentially, the flow velocity in the air gap becomes smaller and smaller. From the 38 radial flow velocity distributions, it can be seen directly that the velocity in the fourth and fifth ventilation ducts are lower, while the velocity of the first, second, 37th, and 38th are higher.
Similar to the above flow law, for the convenience of comparison, the fluid flow distribution in each radial ventilation duct is shown in Figure 10 under four different air gap entrance velocities.
In Figure 10, the horizontal axis is the stator ventilation duct number. There is a total of six curves in the figure. Among them four curves are the four different inlet wind speed calculated values of the fluid velocity distribution in each ventilation duct of the stator; the other two curves are when the air gap inlet is 56 m/s, the flow rate test measured value and linear fit value at different radial ventilation ducts of the stator. From the calculated-value curves it can be seen that, with the increase of the flow velocities at the air gap entrance, the flow velocity in the other radial ventilation ducts except the fourth, fifth, and sixth ducts increases correspondingly; while the flow velocity in the fourth, fifth, and sixth ventilation ducts has the opposite distribution law, where the flow velocity does not increase but decreases.
After analyzing the calculation results of the fourth ventilation duct flow velocity, when the inlet speed is 56, 70, 85, and 100 m/s, the fluid average velocity of the radial ventilation duct outlets is 1.1, 0.24, −0.6, and −1.3 m/s. From the analysis of the calculation results, it can be seen that when the air gap inlet wind speed increases to a value between 70 and 85 m/s, the wind speed in the fourth ventilation duct will be close to zero. That is to say, there is no cooling wind blowing through the core and winding, the internal loss can only be taken away by the fluid in the adjacent ventilation duct; and when the speed at the air gap entrance is greater than the critical value above, the fluid velocity in the radial ventilation duct will form a reverse-direction reflux. At this time, the hot air from the other ventilation ducts will flow back into this ventilation duct. No matter which of any the above situations occurs, it is very unfavorable to the heat transfer of the generator stator structure and the safe operation of the generator.

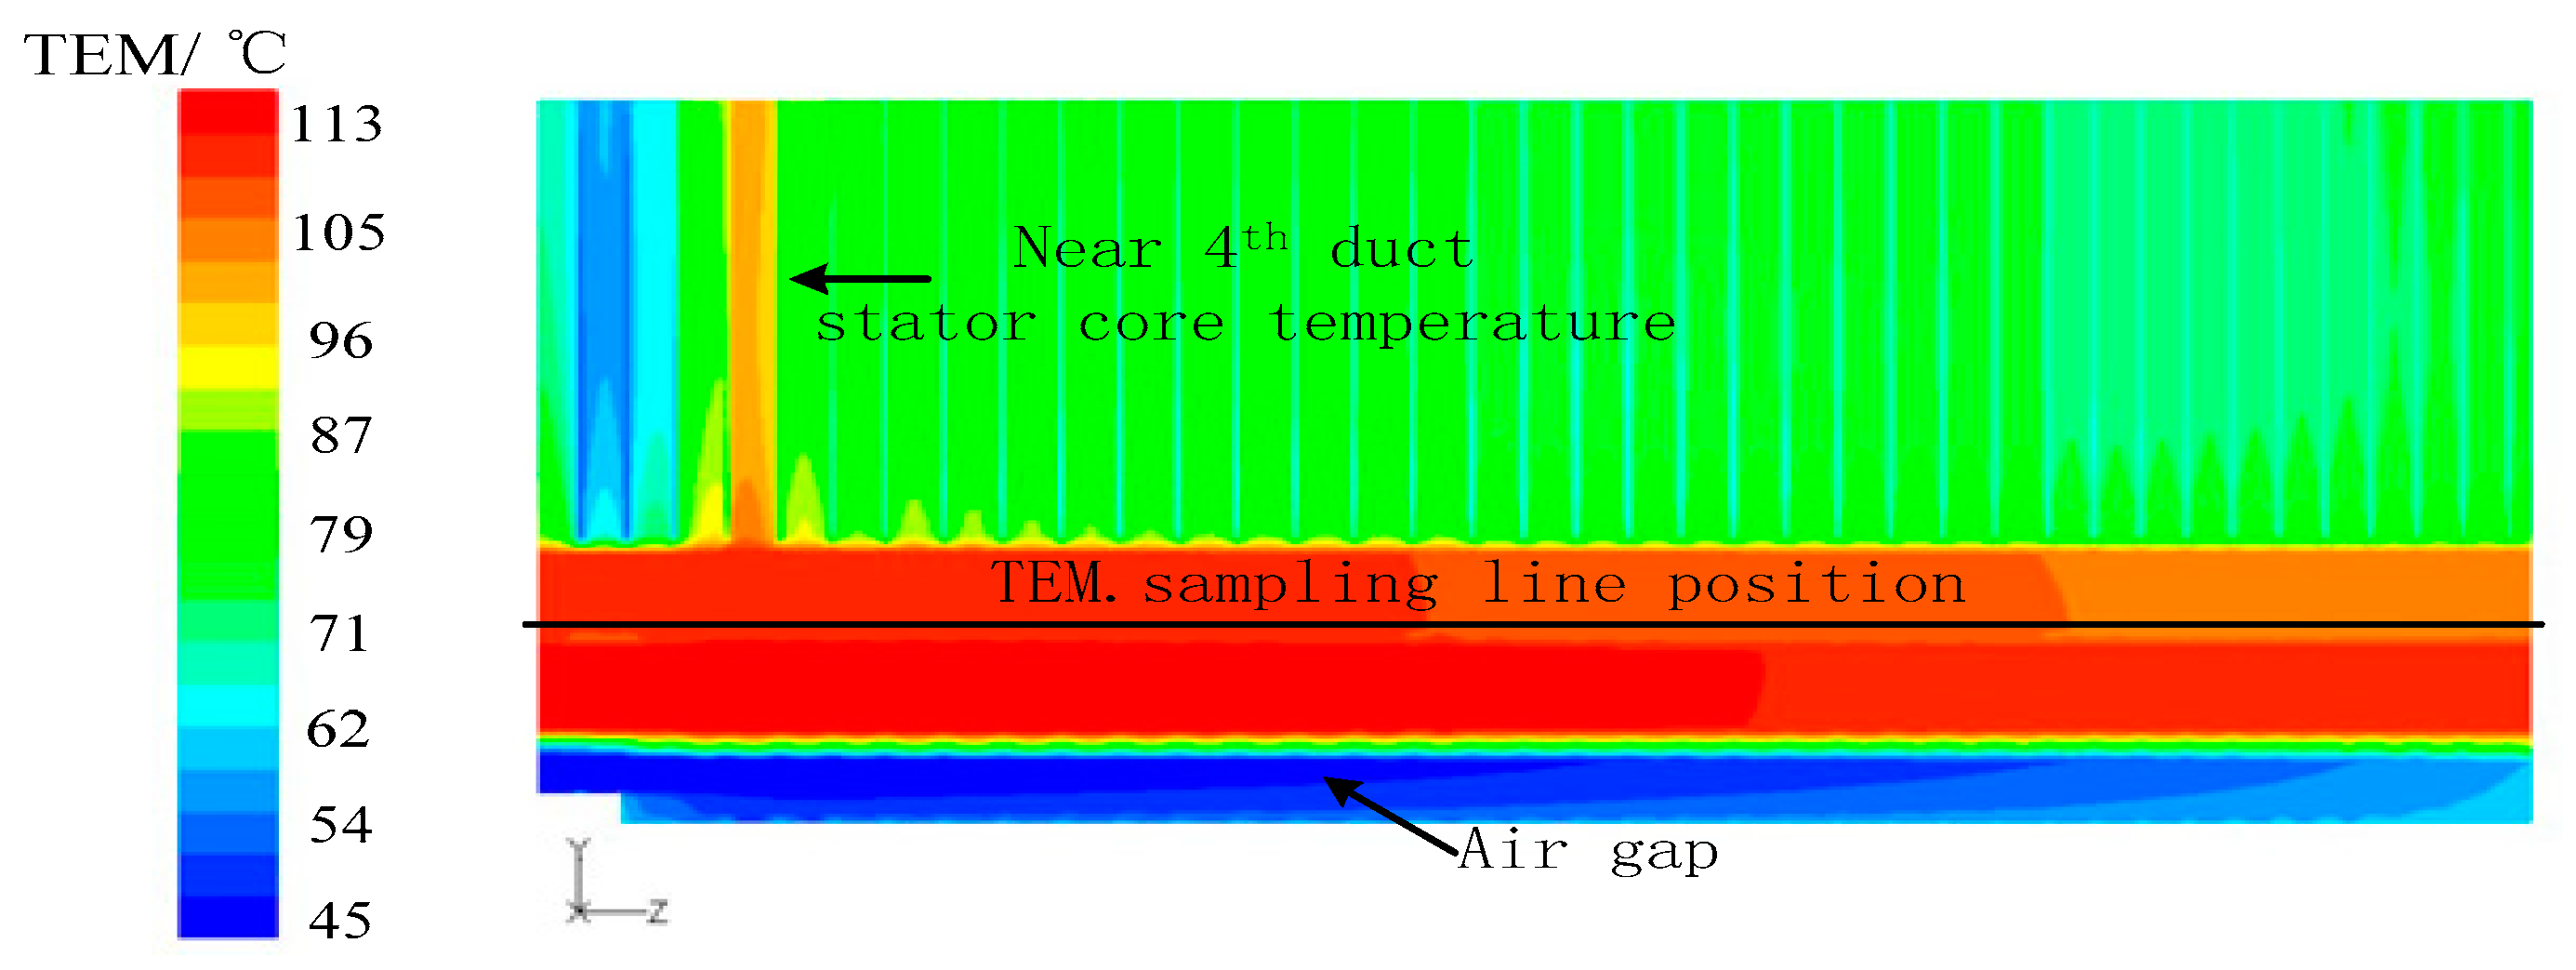
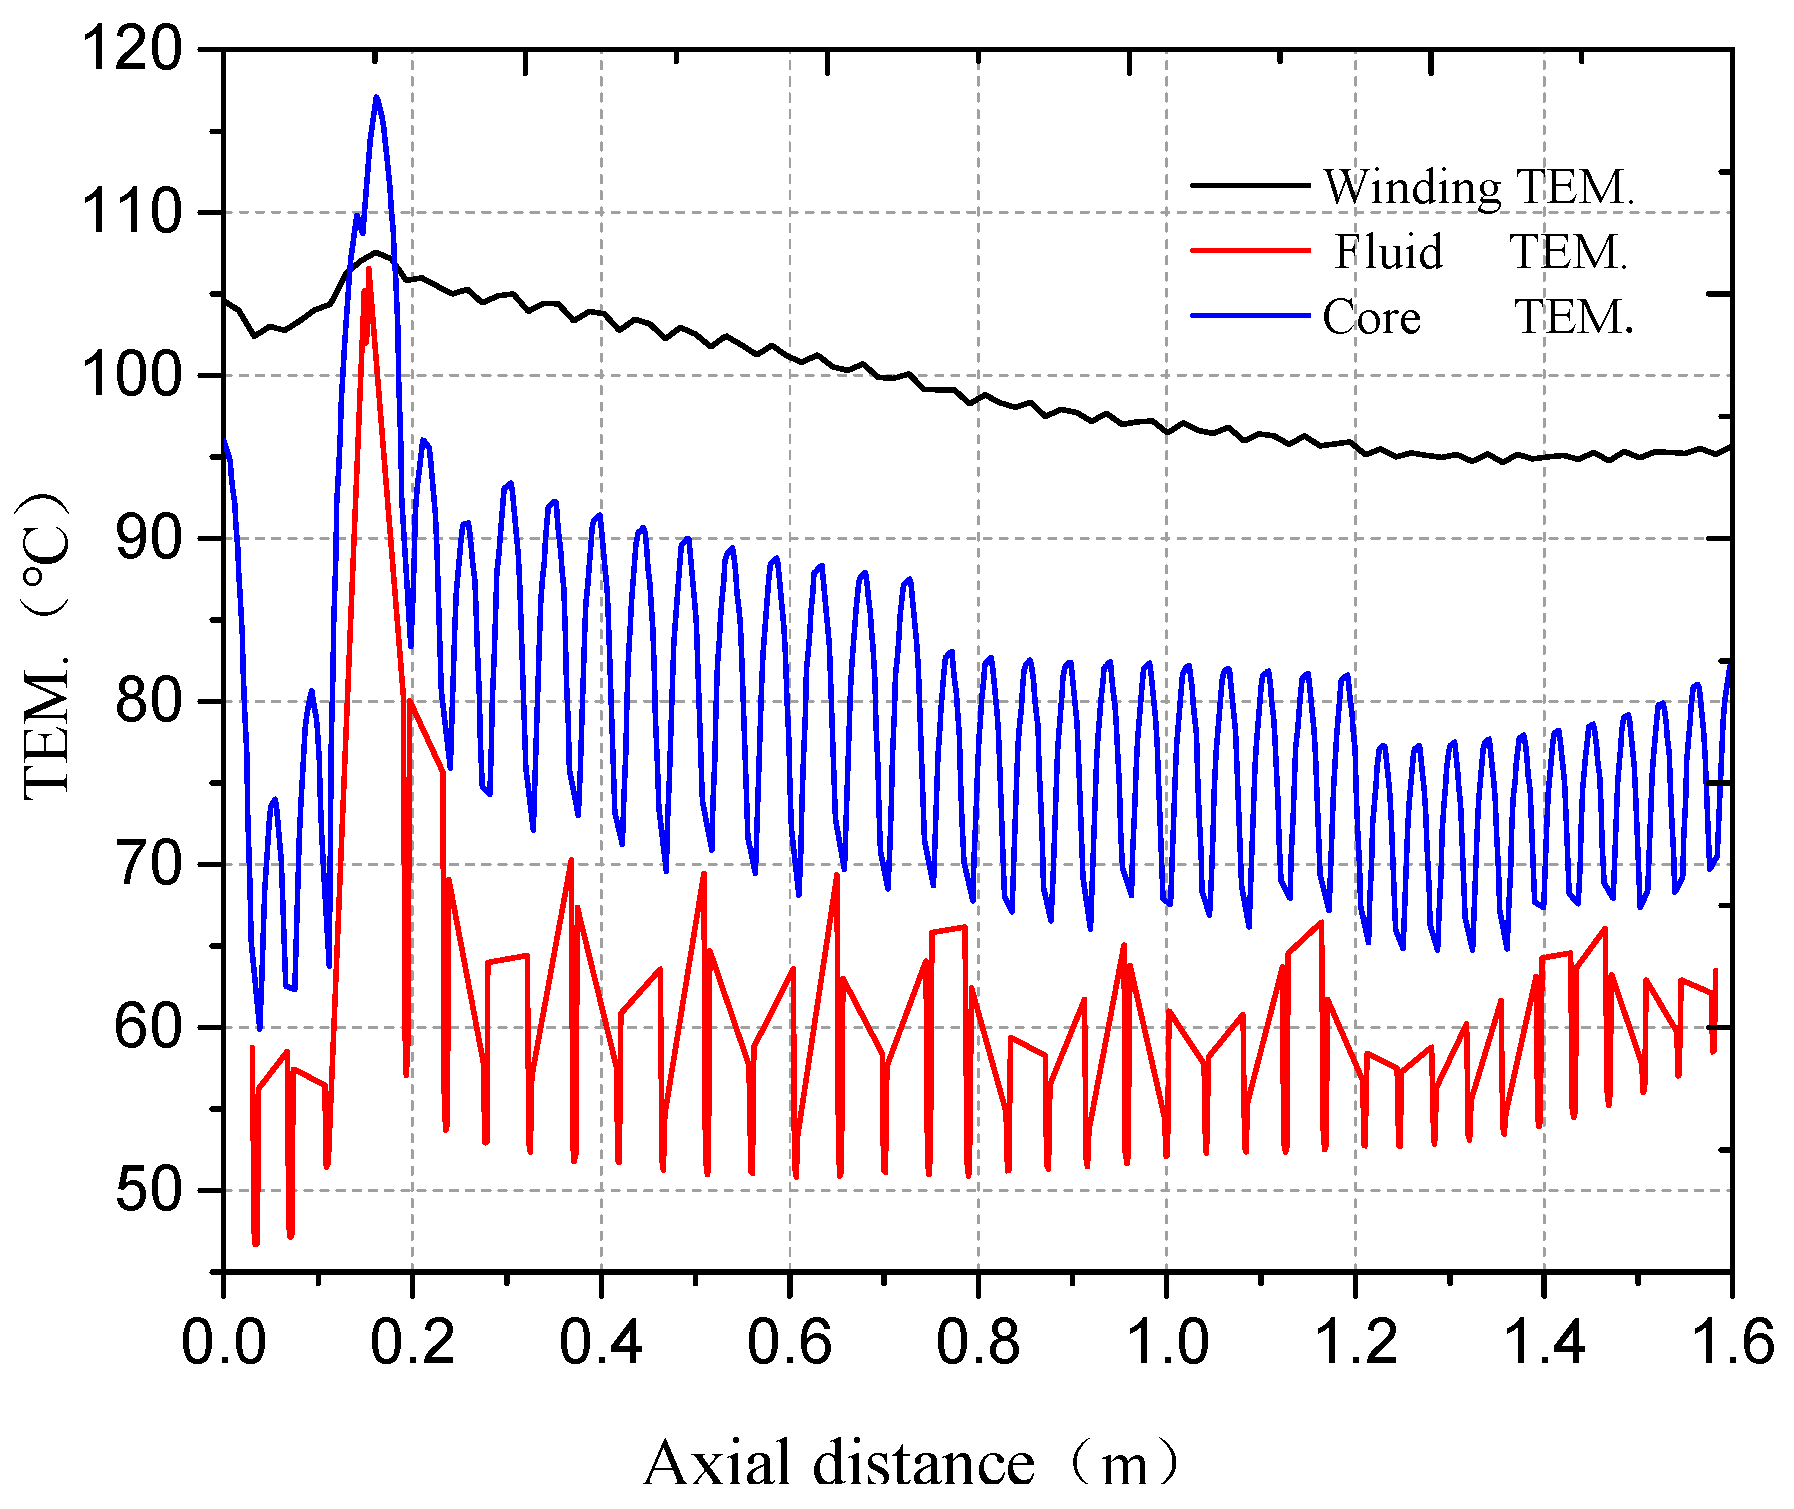
3.4. The Influence of Backflow in the Radial Ventilation Duct on the Temperature of the Stator Winding and Core

Figure 11 shows the calculation results of the generator stator temperature field when the air gap inlet velocity is 56 m/s. It can be seen from the figure that the temperature of the stator core near the fourth radial ventilation duct is significantly higher than that of the other stator cores, but the temperature of the upper and lower windings of the stator is less affected by the low wind speed in this region.
In order to analyze the axial distribution of the temperature of the stator core and winding in the case of backflow in the radial ventilation duct, Figure 12 shows the axial temperature distribution curve of the sampling line with the same radial height. The sampling line position is shown in Figure 11. When backflow occurs in the stator radial ventilation duct, the calculated temperatures of the stator core, winding, and cooling air along the axial direction are collected from the sampling line. At the same time, the corresponding air gap inlet velocity was 85 m/s.
It can be seen from Figure 12 that when backflow occurs in the local radial ventilation duct of the stator core, the negative pressure brings the hot wind at the back of the stator yoke into one or several radial ventilation ducts of the stator yoke to cool the stator core, resulting in a significant rise in the local stator core temperature, which reaches 115 °C. The core temperature is even higher than the average temperature of the stator windings. However, the average temperature of the stator winding is less affected by backflow. Therefore, the backflow of the fluid in the ventilation duct will have a direct impact on the temperature rise of the stator core, which is likely to produce local overheating of the core and affect the safe operation of the unit.

4. Conclusions

In this paper, a 100 MW air-cooled turbo-generator is taken as the research object. Through experimental measurement and finite element analysis of the model, the following conclusions are obtained:
  • Through the measurement of the fluid flow law in the stator radial ventilation duct, it is found that after the fluid passes through the first three radial ventilation ducts, the wind speed will decrease significantly in the back one or two radial ventilation ducts.
  • Through calculation and research, it is found that with the increase of the flow velocity at the air gap entrance, the flow velocity in several radial ventilation ducts after the step structure of the stator core end will gradually decrease to zero. At this time, if flow velocity at the air gap inlet continues to increase, the velocity direction of fluid in radial ventilation ducts will reverse, forming a backflow.
  • The backflow of the fluid in the ventilation duct will have a direct impact on the temperature rise of the local stator core, which is likely to produce local overheating of the core and affect the safe operation of the unit.

Author Contributions

Y.L. analyzed the data, contributed analysis tools and wrote the paper; W.L. conceived and designed the experiments; Y.S. performed the experiments.

Funding

We received National Natural Science Foundation for covering the costs to publish in open access, which name is “Cooling Mechanism of New Stator Tooth Inner Cooling and End Key-Type Shielding Structure Ventilation System for Air-Cooled Turbogenerator” and which number is 51477005.

Conflicts of Interest

The authors declare no conflict of interest.

References

  1. Pickering, S.J.; Lampard, D.; Shanel, M. Modelling Ventilation and Cooling of The Rotors of Salient Pole Machines. In Proceedings of the IEEE International Electric Machines and Drives Conference (IEMDC), Cambridge, MA, USA, 17–20 June 2001; pp. 806–808. [Google Scholar] [CrossRef]
  2. Shanel, M.; Pickering, S.J.; Lampard, D. Conjugate Heat Transfer Analysis of a Salient Pole Rotor in an Air-Cooled Synchronous Generator. In Proceedings of the International Electric Machines and Drives Conference, Madison, WI, USA, 1–4 June 2003; Volume 2, pp. 737–741. [Google Scholar] [CrossRef]
  3. Shoulu, G.; Yichao, Y.; Yuzheng, L. Review on ventilation system of large turbine generator. Energy Res. Inf. 2004, 4, 195–200. [Google Scholar]
  4. Shuang, L.; Zhihua, A.; Guangyu, Q. Research and performance verification of 150 MW air-cooled turbo-generator ventilation system. Large Mot. Technol. 2007, 1, 8–10. [Google Scholar]
  5. Dongping, Z.; Rongshan, C. Calculation of ventilation and temperature rise of 100–200 MW air-cooled turbo-generator. Power Gener. Equip. 2006, 3, 193–195. [Google Scholar]
  6. Guangde, L.; Weihong, Z. Ventilation system design of air-cooled turbo-generator. Large Mot. Technol. 1998, 4, 13–16. [Google Scholar]
  7. Yamamoto, M.; Kimura, M. Ventilation and cooling technology of a new series of double-pole air-cooled steam turbine generator (Translated by Cai Qianhua). Foreign Large Electr. Mot. 2000, 3, 16–18. [Google Scholar]
  8. Chauveau, E.; Zaim, E.H.; Trichet, D.; Fouladgar, J. A statistical of temperature calculation in electrical machines. IEEE Trans. Mag. 2000, 36, 1826–1829. [Google Scholar] [CrossRef]
  9. Fujita, M.; Kabata, Y.; Tokumasu, T.; Kakiuchi, M.; Shiomi, H.; Nagano, S. Air-Cooled Large Turbine Generator with Multiple-Pitched Ventilation Ducts. In Proceedings of the IEEE International Conference on Electric Machines and Drives, San Antonio, TX, USA, 15 May 2005; pp. 910–917. [Google Scholar] [CrossRef]
  10. Zixiong, Z.; Zengnan, D. Viscous Fluid Mechanics; Tsinghua University Press: Beijing, China, 1998; pp. 255–279. [Google Scholar]
  11. Borishenko, A.N. Aerodynamics and Heat Transfer in Motor; Machinery Industry Press: Beijing, China, 1985. [Google Scholar]
  12. Changming, Y. Heat Conduction and Its Numerical Analysis; Tsinghua University Press: Beijing, China, 1981; pp. 1–7. [Google Scholar]
  13. Huo, F.; Li, Y.; Li, W. Calculation and analysis of stator ventilation structure optimization scheme of large air-cooled turbo-generator. Chin. J. Electr. Eng. 2010, 6, 95–103. [Google Scholar]
  14. Li, H.J.W. Calculation and analysis of fluid velocity and fluid temperature in large air-cooled turbo-generator stator. Proc. CSEE 2006, 26, 168–173. [Google Scholar] [CrossRef]
  15. Li, W.; Ding, S.; Zhou, F. Diagnostic numerical simulation of large hydro-generator with insulation aging. Heat Transf. Eng. 2008, 29, 902–909. [Google Scholar] [CrossRef]
  16. Li, W.; Hou, Y. Heating analysis of stator strands of large hydro-generator based on numerical method. Proc. CSEE 2001, 21, 115–1186. [Google Scholar] [CrossRef]
Figure 1. Single-channel ventilation air-cooled turbo-generator ventilation system.
Energies 12 03442 g001
Figure 2. Placement and measuring position of pitot tube in the stator ventilation ducts. (a) Placement position of pitot tube; (b) measuring position of ventilation duct.
Energies 12 03442 g002
Figure 3. The sensor placement at the air gap entrance.
Energies 12 03442 g003
Figure 4. The distribution of wind speed values in the stator radial ventilation duct at 3000 r/min.
Energies 12 03442 g004
Figure 5. The step structure of stator end.
Energies 12 03442 g005
Figure 6. Physical model of stator ventilation system. (a) Calculation model of fluid field for 100 MW air-cooled turbo-generator; (b) partial display of calculation model.
Energies 12 03442 g006
Figure 7. Model axial–radial and circumferential sections grid mesh.
Energies 12 03442 g007
Figure 8. Comparison of calculated and measured values of fluid flow rate in the ventilation duct.
Energies 12 03442 g008
Figure 9. Fluid velocity distribution of stator air gap and the ventilation duct.
Energies 12 03442 g009
Figure 10. Flow rate distribution in the radial ventilation ducts at different air gap entrance velocities.
Energies 12 03442 g010
Figure 11. Temperature field of stator at air gap inlet velocity 56 m/s.
Energies 12 03442 g011
Figure 12. Winding and core temperature distribution at air gap inlet velocity 85 m/s.
Energies 12 03442 g012
Table 1. Pressure and flow velocity measurement results in stator radial ventilation ducts.
No. of Ventilation DuctsTotal Pressure PaStatic Pressure PaPressure Difference PaCalculated Wind Speed m/s
215141464508.8
3132412566810.3
411881178103.9
51122111752.8
611531143103.9
812051145609.6
911781125539.1
1111731136377.6
1311931144498.7
15123811538511.5
181231111811313.2
201191108810312.6
221201108511613.4
241231109213914.7
261211109711413.3
281270110316716.1
301257108916816.1
331317111720017.6
341367109727020.5
361286109419217.3
381259111214715.1
401359110325619.9
421304109321118.1
441263109416916.2
461353110824519.5
4911421281−13914.7
511359115220717.9
531289114414515.0
551281113414715.1
571259114011913.6
591260112413614.5
611311116214915.2
64129812069211.9
66128412097510.8
68128012166410.0
7012561203539.1
7112561212448.3
7312051191144.7
7410191172−15315.4
7512591220397.8
7615761515619.7
Table 2. Statistical results of the number of nodes and memory.
CellsFacesNodesEdges
Number Used561,1801,830,765692,0140
Mbytes Used102136290
Number Allocated561,1801,830,765692,0140

