Capacity Management of Hyperscale Data Centers Using Predictive Modelling
by
 , , and
Raihan Ul Islam
1,* ,
,
Xhesika Ruci
1,
Mohammad Shahadat Hossain
2,
Karl Andersson
1 and
Ah-Lian Kor
3
1
Pervasive and Mobile Computing Laboratory, Luleå University of Technology, 93187 Skellefteå, Sweden
2
Department of Computer Science and Engineering, University of Chittagong, Chittagong 4331, Bangladesh
3
School of Computing, Creative Technologies and Engineering Leeds Beckett University, Leeds LS1 3HE, UK
*
Author to whom correspondence should be addressed.
Energies 2019, 12(18), 3438; https://doi.org/10.3390/en12183438
Submission received: 31 July 2019
/
Revised: 28 August 2019
/
Accepted: 3 September 2019
/
Published: 6 September 2019
Abstract
:Big Data applications have become increasingly popular with the emergence of cloud computing and the explosion of artificial intelligence. The increasing adoption of data-intensive machines and services is driving the need for more power to keep the data centers of the world running. It has become crucial for large IT companies to monitor the energy efficiency of their data-center facilities and to take actions on the optimization of these heavy electricity consumers. This paper proposes a Belief Rule-Based Expert System (BRBES)-based predictive model to predict the Power Usage Effectiveness (PUE) of a data center. The uniqueness of this model consists of the integration of a novel learning mechanism consisting of parameter and structure optimization by using BRBES-based adaptive Differential Evolution (BRBaDE), significantly improving the accuracy of PUE prediction. This model has been evaluated by using real-world data collected from a Facebook data center located in Luleå, Sweden. In addition, to prove the robustness of the predictive model, it has been compared with other machine learning techniques, such as an Artificial Neural Network (ANN) and an Adaptive Neuro Fuzzy Inference System (ANFIS), where it showed a better result. Further, due to the flexibility of the BRBES-based predictive model, it can be used to capture the nonlinear dependencies of many variables of a data center, allowing the prediction of PUE with much accuracy. Consequently, this plays an important role to make data centers more energy-efficient.
1. Introduction
By 2020, ICT industries will account for 3.5% of global carbon emissions, which are predicted to grow by up to 14% by 2040 [1]. Data centers are becoming a predominant ICT industry due to the rapid growth of Big Data applications, the Internet of Things (IoT), 5G, autonomous systems, Blockchain, and artificial intelligence (AI) [2,3]. In addition, it has been predicted that demand for data centers will rise exponentially by 2025, which would make data centers consume 33% of the total global ICT electricity consumption [4]. Furthermore, it is also predicted that data centers will use 30% of the total world’s energy and, nevertheless, produce only 5.5% of the global carbon footprint due to the adaptation of efficient energy sources and technologies. In addition, data centers will produce 340 metric megatons of CO2 per year by 2030 [5]. All the above-mentioned statistics present an alarming growth rate of power usage and Greenhouse Gas (GHG) emissions by data centers in the coming decades. These facts have inspired researchers to increase power-usage efficiency and lower the environmental impact of data centers. The latest research work conducted by big IT companies in the sector reveals that the adoption of predictive modeling in the capacity management of data centers is the key to unlocking stranded capacity and identify practices for higher efficiency and reliability [6,7,8].
Gao [8] used a Neural Network to predict the Power Usage Effectiveness () [9] of a Google data center using data from different sensors with the aim of increasing the energy efficiency of the data center. However, this research does not address the different types of uncertainty caused by sensors [10]. Hossain et al. [7] used a trained Belief Rule-Based Expert System (BRBES) to predict PUE with sensor-data uncertainty in a data center. BRBES consists of belief rules as knowledge base and evidential reasoning as inference engine, which is capable of addressing different types of uncertainty such as incompleteness, ignorance, vagueness, imprecision, and ambiguity. Different parameters of belief rules such as, attribute weight, rule weights, and belief degrees are usually determined by domain experts. However, the values set by experts are not always accurate. Therefore, Hossain et al. [7] used randomly generated rules to learn about these parameters from the dataset. However, this method was not suitable as the results were not reproducible. Yang et al. [11] proposed a learning mechanism for BRBES using a sequential quadratic programming-based optimization technique. For this, they have the fmincon function of the MATLAB optimization tool box. The proposed learning mechanism for training the BRBES suffers from a local optimal problem where the algorithm finds the best solution from the smallest number of candidates instead of all solutions to the problem. Therefore, a learning mechanism is needed that can address the aforementioned problem and provide a better prediction.
The Differential Evolution (DE) algorithm is not prone to a local optimal problem due to its randomness [12,13]. However, the control parameters of DE, such as the crossover () and mutation (F) factors, play an important role in the success of DE. The BRBES-based adaptive DE algorithm, named BRBaDE [14], helps to identify the proper value of and F for DE. Furthermore, the learning mechanism for BRBES can be considered as two types. One is parameter optimization and the other one is structure optimization. In parameter optimization, the BRBES parameters are optimized, while in structure optimization the structure of belief rules of the BRBES is optimized. Yang et al. [15] proposed a parameter and structure optimization for BRBES using DE. However, their proposed method has the inherent problem of determining the optimal values of F and for DE. Therefore, BRBES accuracy can be improved by employing parameter and structure optimization using BRBaDE as a learning technique.
In our previous work [7], two parameters, indoor and outdoor temperature, were used for predicting . To improve prediction accuracy in this research work, wind speed and direction were also included, as these parameters also influence the environment. The accurate prediction of helps data-center operators to take necessary steps for making their data centers more energy-efficient. This paper aims to demonstrate the employment of parameter and structure optimization using BRBaDE as a learning technique for BRBES to predict the energy-efficiency metric, , from existing data generated within a data center. The raw data used for the experiments were sourced from a Facebook data center in Luleå. The collected data were used to provide trends and predict data-center energy efficiency.
The article is organized according to the following structure: Section 2 reviews related work, and Section 3 and Section 4 cover the methodology followed by the experimental part. Subsequently, Section 5 contains the implementation of the predictive models that forecast , followed by Section 6, which presents results and their analysis. Lastly, Section 7 outlines the conclusion and indicates our future work.
2. Related Work
Data centers are becoming a more integral part of our daily life. All major services, such as telecommunications, transport, public health, and urban traffic, are now using data centers to deploy IT services. Due to the importance of the above-mentioned facilities and increasing demand, the power consumption and operating cost of data centers are rapidly rising. Therefore, researchers are now primarily focusing on optimizing data centers.
In recent years, significant research has been devoted to the development of appropriate matrices for measuring data-center energy efficiency. First, the energy efficiency of a system is measured as the ratio of useful work done by a system to the total energy delivered to the system. For a data center, energy efficiency can be considered as useful work performed by different subsystems. According to the Green Grid Association [16], PUE and Data Center Infrastructure Efficiency (DCiE), which are shown by Equations (1) and (2), can help to better understand and improve the energy efficiency of existing data centers. This also helps to support smarter managerial decision making for improving data-center efficiency.
IT Equipment Power includes the load associated with all IT equipment, such as computing, storage, and network devices.
Total Facility Power includes everything that supports the processing of IT equipment load (e.g., mechanical and cooling systems).
However, the Green Grid Association also proposed metrics such as Carbon Usage Effectiveness () [17], Water Usage Effectiveness () [18], and Electronics Disposal Efficiency () [19] to measure the CO footprint, water consumption per year, and the disposal efficiency of data centers, respectively. From all these matrices, and are considered as the industry de facto for measuring power efficiency.
Nowadays, data centers consist of numerous sensors that generate millions of data points every day. These huge numbers of data are usually used for monitoring purposes. However, machine-learning algorithms can exploit the use of these monitoring data to improve the energy efficiency of data centers. In addition, machine-learning algorithms are capable of predicting using these data while considering the complexity of the components of the data centers. According to Belden Inc. [20], one of the largest US-based manufacturers on networking, connectivity, and cable products: “It won’t be long before Data Center Infrastructure Management (DCIM) systems will routinely contain an AI tool that not only optimizes critical mechanical- and electrical-equipment performance, but also optimizes compute and storage needs. AI will affect how data-center operations teams work and change what’s involved with day-to-day tasks like fulfilling normal maintenance needs and monitoring networks. They’ll become “automation engineers”, using the AI engine to optimize data centers”.
Furthermore, Vigilent [21] is another IT company that has succeeded in reducing data-center cooling capacity by implementing real-time monitoring and machine learning to match cooling needs with the exact cooling capacity. This frees up stranded capacity and allows to determine when cooling infrastructure is at risk of failure, resulting in uptime improvement, and preventing unexpected downtime and revenue loss.
Moreover, Rego [22] developed a set of software tools named Prognose that could be used for the predictive modelling of energy and capacity planning within a data center. Their model analyzes different metrics that go into building a data center and is intended to perform predictive modelling throughout the life of the data center (not just during planning).
Shoukourian et al. [23] have used neural network based machine learning approach for modeling the coefficient of performance of a high performance data center. Balanici et al. [24] used server traffic flow to improve the power usage of a data center. They have used auto-regressive neural networks to predict the server traffic flow. Furthermore, power usage of a data center can be improved by optimizing the control policy of the cooling system. Li et al. [25] proposed a Reinforcement Learning based control policy of the cooling system of a data center. The proposed model has been able to reduce 11% cooling cost in a simulation platform. Moreover, Haghshenas et al. [26] have also used multi-agent based Reinforcement Learning algorithm to minimize energy consumption of a large-scale data center.
Gao [8] conducted extensive work to predict the metric of a Google data center. This work aims to demonstrate that machine learning is an effective tool to leverage existing sensor data to model data-center performance and improve energy efficiency. The model has been tested and validated at Google’s data centers. In his work, a neural network was selected as the mathematical framework for training data-center energy-efficiency models. Their training dataset contained 19 normalized input variables and one normalized output, the data center PUE, each variable spanning 182,435 samples (two years of operational data). This custom AI DCIM solution reduced overall data-center power consumption by 15% and reduced cooling power by 40%. However, the data coming from sensors contained different types of uncertainty, such as ignorance, incompleteness, ambiguity, vagueness, and imprecision. Different kinds of uncertainty exist in sensor data due to malfunctions, and faulty or duplicate sensor measurements [10]. A neural network uses forward propagation as an inferencing procedure that does not have a mechanism to address data uncertainty. Therefore, BRBES can be used to address these uncertainties by using a Belief Rule Base (BRB) as the knowledge base and Evidential Reasoning (ER) as the inference engine.
Hossain et. al. [7] used trained BRBES to predict the of a data center. BRBES has the capability to address the uncertainties of sensor data [10]. Furthermore, Yang et al. [11] used a MATLAB tool-based optimization technique fmincon as a learning methodology for training BRBES. However, this gradient-based method does not always perform better due to local optima-related problems. Furthermore, the above-mentioned research work used conjunctive BRB, which becomes computationally costly as the number of rules grows with the increase of referential values and antecedent attributes. Therefore, a better learning mechanism is needed for training the BRBES and effective BRB that is not computationally costly.
Chang et al. [27] proposed an optimization model for disjunctive BRB where lower and upper bounds are set for the utility values of the referential values of the antecedent attributes. These strict constraints influence the optimized model to become stuck in local optima instead of finding a global optimal solution. However, the disjunctive BRB does not grow exponentially with the increase of referential values and it is computationally less costly.
Yang et al. [15] proposed a join optimization model for BRBES that consisted of parameter and structure optimization. A heuristic strategy is used to optimize the structure of BRB, while a DE algorithm is used to perform parameter optimization. Furthermore, the generalization capability of BRBES is shown in this research work. This research work illustrates DE efficiency for BRBES parameter optimization. However, there is a lack of finding optimal values for the control parameters of DE, which may lead to better results.
In summary, the joint optimization of the parameters and structure for BRBES has shown better results among the different optimization techniques as mentioned above. Among evolutionary algorithms, DE is preferable for the joint optimization of BRBES, as it is better suited for multiple local minima. However, there is a lack of determining optimal values for DE control parameters. Furthermore, there should be a balance of exploration and exploitation of search space while finding the optimal solution for using DE. Therefore, a hyperoptimized algorithm is required to find the optimal values of the DE control parameters while ensuring the balanced exploration and exploitation of the search space. In the next sections, BRBES and its learning mechanism are discussed in detail.
3. BRBES
In this section, a brief description of BRBES is discussed. BRBES is an integrated expert system framework for handling different types of uncertainty with support for both qualitative and quantitative data [28]. BRBES consists of a knowledge base and an inference mechanism. Expert knowledge is elicited and represented in a knowledge base, using belief structure, incorporated with IF-THEN rules, which is named BRB. The inference mechanism uses ER for processing the input and generating output based on BRB [29].
Each belief rule of BRB is formulated using an antecedent and consequent. The antecedent consists of antecedent attributes with referential values to represent the inputs for the system. The consequent has the consequent attribute with the associated belief degrees that represent the output of the system. These rules can be prioritized using rule weights. An example of belief rule is given in Equation (3).
where are the antecedent attributes of the kth rule. is the referential value of the ith antecedent attribute. is the jth referential value of the consequent attribute. is the degree of belief for the consequent reference value . If , then the kth rule is considered as complete; otherwise, it is incomplete.
A belief rule can also be explained with linguistic terms as shown in the following example.
In the above rule, External Temperature and Room Temperature have the following referential values: “Medium" and “High", while is the consequent attribute with referential values, “Critical", “Moderate", and “Low". As the summation of belief degrees () is one, hence the rule is considered complete.
Furthermore, this can also be represented as a tree structure with two leaf nodes and one parent as shown in Figure 1. The logical connectives of the antecedent attributes in a belief rule can either be AND or OR, which represent the conjunctive or the disjunctive assumptions of the rule, respectively. Based on the logical connectivity of the BRB, a BRBES can be named either Conjunctive or Disjunctive BRB.
The inference procedures consist of four steps, namely, input transformation, rule activation, belief update, and rule aggregation using an evidential-reasoning approach. The input data are distributed over the referential values of the antecedent attributes, which is called the matching degree during the input transformation. The belief rules are called packet antecedent, which are stored in short-term memory. The activation weight of the rules are calculated using matching degrees.
Activation weight for the kth rule for conjunctive assumption can be generated using the following equation:
Here, is the rule weight and is the matching degree of the kth rule. As in the conjunctive assumption, all matching degrees are multiplied.
However, for disjunctive assumption, activation weight for the kth rule can be generated using the following equation:
Here, is the rule weight and is the matching degree of the kth rule. In the disjunctive assumption, all matching degrees are summed.
Moreover, the belief degrees associated with each belief rule in the rule base should be updated when input data for any of the antecedent attribute are ignored. The belief-degree update is calculated using the method presented in [28]. Subsequently, rule aggregation is performed using a recursive reasoning algorithm [30] due to its less computational cost by using Equation (7).
Here, is the activation weight of the kth rule, while denotes the belief degree related to one of the consequent reference values.
4. Learning in BRBES Based on BRBaDE
Different parameters of BRBES, such as attribute weights, rule weights, and belief degrees (, , and ) play an important role in result accuracy. These parameters are usually known as learning parameters, which are generally assigned by domain experts or they are randomly selected. The antecedent attributes and belief rules are prioritized by consecutively using the attribute and rule weights. Belief degrees of the consequent attribute are used to present the uncertainty of the output. Hence, the learning parameters are important for a BRBES. Therefore, a suitable method is needed to find the optimal values of the learning parameters. By training the BRBES with data, the optimal values of the learning parameters could be discovered [11]. Different optimization techniques have been proposed to discover the optimal values [11,31,32,33,34,35].
The learning parameters need to be trained to determine the optimal values by using an objective function that considers linear equality and inequality constraints. The output from BRBES is considered as a simulated output (), and the output from the system is named the observed output (). Difference between a simulated and observed output needs to be minimized by the optimization process, as shown in Figure 3. The training sample contained M data points, where the input for BRBES was , the observed output was , and the simulated output was (). Error was measured by Equation (9).
Optimization of the learning parameters was executed using the following equation:
The objective function for training the BRBES consists of Equations (7) and (8). Additionally, the values of the attribute weights, rule weights, and belief degrees ranged between zero and one. Henceforth, to enforce the above-mentioned criteria, the following constraints were considered:
- Utility values of consequent attributes :
- Rule weights :
- Antecedent attribute weights :
- Consequent belief degrees for the kth rule :
DE is highly influenced by mutation and crossover factors [36]. The mutation (F) and crossover factor () can be adapted to improve DE performance [37]. It was evident that F and may change during each iteration of DE, which facilitates a more efficient way to find optimal values. Most of the research on DE parameter adaptation considers the variation of parameter values based on fitness values of an optimization function. However, previous researchers [38,39] have not considered the different types of uncertainty related to DE approaches. Therefore, we propose a BRBES-based DE parameter-adaptation algorithm, BRBaDE, which addresses different types of uncertainty. Figure 4 depicts the system diagram of BRBaDE.
In BRBaDE, the changes of population and objective-function values in each generation are supplied to two BRBESs as input. Subsequently, based on the belief rule base and using an evidential-reasoning approach, new F and values are selected for the next generation as shown in Figure 4. The BRBES helps to achieve the optimal exploration and exploitation of the search space by considering the changes of population and objective-function values in each generation.
Here, is the change in magnitude of a population vector during the last two generations, and and are the population vectors on the gth generation and th, respectively. is the change in magnitude of the objective function during the last two generations, while the and are the function values for the ith population on gth generation and th respectively. The values of and have been rescaled between 0 to 1 using Equations (17) and (18), where and contain the rescaled value of and , respectively. Similarly, using Equations (19) and (20), the values of and were rescaled between 0 to 2 and assigned in and , which were subsequently used as inputs for BRBES for determining new values for F and . Table 1 and Table 2 and Figure 5 present the details of the BRBES used to predict the values of F and .
Therefore, the proposed BRBaDE provides a solution for addressing uncertainty in objective functions by incorporating BRBES with DE. Furthermore, it facilitates optimal exploration and exploitation of the search space, which leads to finding the optimal solution with fewer iterations.
Subsequently, structure optimization of the initial BRB was performed using the Structure Optimisation-based on the Heuristic Strategy (SOHS) algorithm mentioned in [15]. These iterations continue until the structure of the BRB remains unchanged for a certain number of iterations. The above-described BRBaDE-based parameter and structure-optimization process are presented in Figure 6.
In summary, parameter optimization (PO) using BRBaDE is performed with the initial BRB, while structure optimization (SO) is performed using the SOHS algorithm. When the number of iterations reaches the threshold value, the stop criterion is met and that is considered as an optimized BRB; otherwise, the loop continues.
By incorporating BRBaDE as a parameter-optimization technique and performing structure optimization of the BRB using SOHS, a better optimized BRB can be generated that subsequently helps in producing results with higher accuracy. The next section presents the implementation of BRBES for predicting the of the Facebook data center.
5. Model Implementation
This section describes the process of predicting for data centers using BRBES. Furthermore, BRBaDE is a novel adaptive DE algorithm that is used as a learning methodology.
5.1. Use Case Scenario
Our previous work [7] used external and server-room temperature to predict . Furthermore, fmincon-based optimization was used for optimizing the learning parameters. The main focus of this research work is to increase accuracy of a data center by incorporating additional inputs, such as wind speed and direction. In addition, BRBaDE is used as a learning technique for BRBES to improve the learning process. The Facebook data center situated in Luleå, Sweden was chosen as a use case for this research work. The data center had sensors for measuring humidity and temperature. We collected data from the data center for a three-month period from 1 December 2017 to 25 February 2018, where the data were sampled every seven hours. Furthermore, wind speed and direction for the same period and location were collected from Weather Underground [40]. Preprocessing of the raw data is an important step for conducting different types of analysis. The raw data from the sensors were examined, and missing and abnormal data were removed. Wind-speed and direction data for the corresponding date of the sensor data were collected from the Weather Underground site. After preprocessing, the dataset contained around 298 data points. The dataset consisted of time temperature, humidity, wind speed, wind direction, and PUE. Temperature, humidity, wind speed, and wind direction were considered as input, while the PUE was considered as output. The dataset was divided into a training and a testing set. The BRBES was trained using proposed PO and SO using BRBaDE by the training dataset. Afterward, the testing dataset was used to evaluate the performance of the trained BRBES, which is presented in Section 6 in detail.
5.2. BRBES for
Based on the data from the data center, a BRBES system was developed to predict the . The system contained a knowledge base, a BRBES main module, a configuration module, a BRB UI model, a training module, and an input module, as shown in Figure 7. The proposed system is an extension of our earlier proposed Web-BRBES [41]. A brief description of the components is given below.
5.2.1. BRBES Knowledge Base
The Knowledge Base Module maintains the belief rules. Belief rules are stored in a SQL or a NoSQL database system. Usually, these systems have powerful software engines for efficiently querying and storing large numbers of data. The initial and optimized learning parameters are also stored in the database. Based on the fields of the dataset from the Facebook data center, a BRB framework was created where antecedent attributes were temperature, humidity, wind speed, and direction, while was considered as the consequent attribute. Figure 8 depicts the BRB framework, while Table 3 and Table 4 represent the initial rule base for disjunctive and conjunctive BRBs, respectively.
For Temperature (X2) (°F), referential and utility values are the following:
For Humidity (X3) (%), referential and utility values are the following:
For Wind Speed (X4) (km/h), referential and utility values are the following:
For Wind Direction (X5) (°), referential and utility values are the following:
For PUE (X1), referential and utility values are the following:
5.2.2. Knowledge-Base Driver Module
This module facilitates the storage and retrieval of data from the Knowledge Base Module based on the requirements from the BRB Main Module. This module provides a generic interface to connect with different kinds of SQL or NoSQL database systems. For this work, a mySQL database is used.
5.2.3. Input Module
The input module is used for providing inputs such as a BRB framework related data to the system. It supports Comma Separated Value (CSV) files, RESTful API-based data sources [42], sensors, and sensor platforms. The input module also offers a RESTful API for providing data [43]. After processing the data, the outcome is shared with BRB main module. A Python-based script was used to parse json files with data and extract values corresponding to the respective timestamps.
5.2.4. BRB Main Module
This module is the core of our proposed system. It receives data from the input module and subsequently sends the partial data and initial values of the learning parameters to the training module to obtain the optimized values. These values are then stored in the knowledge-base module. This module then uses the remaining data as testing data for prediction. Testing data are distributed among the referential values of the antecedent attributes using the input-transformation process. Next, the inference mechanism is triggered using the ER algorithm [28]. As part of the inference mechanism, matching degrees and activation weights are calculated, while belief-degree updates are performed due to presence of uncertainties. In the end, rule aggregation is performed to calculate the predicted value. However, the predicted fuzzy values are converted to crisp values using the utility function.
5.2.5. Configuration Module
The configuration module is responsible for configuring the different parameters of the other modules. To render the system dynamic, several different parameters (e.g., database URL, user credentials, database sources, number of referential values of antecedent and consequent attributes, and default values of attribute weights) are stored in a configuration file. This module checks the format of the configuration parameters and then passes the values to the different relevant modules.
5.2.6. BRB UI Module
This module provides a user interface to view prediction. It also provides an option for manual input to predict the of single data points.
5.2.7. Training Module
The training module is responsible for incorporating learning in BRBES, as described in Section 4. It fetches the initial values and training dataset from the BRB main module and returns the optimized values of the learning parameters.
The training module performs learning by constructing an objective function using Equations (7)–(10). Subsequently, the BRBaDE base parameter and structure optimization are performed based on the objective function and constraints for the attribute weights, rule weights, and belief degrees. Finally, the optimal values of the learning parameters are passed to the BRB main module that is used for predicting the of the data center.
6. Results
An accurate prediction model is very useful for efficiently managing data centers. This allows data-center operators to evaluate data-center sensitivity with respect to its operational parameters. Furthermore, a comparison of actual versus predicted values provide invaluable insight into real-time plan efficiency and generating performance alerts. Additionally, a data-center efficiency model allows operators to simulate data-center operating configuration without making physical changes—note that this is a challenging task due to the complexity of modern data centers and the interactions among multiple control systems. Therefore, it is very important to verify the accuracy of the predicted . We used the Mean Square Error (MSE) metric, which is very commonly used for measuring the error of predicted . The PO and SO using BRBaDE were implemented using MATLAB 2018b. All experiments were conducted on a MacBook Pro with Intel Core i7 processor, 2.2 GHz, and 16 GB RAM. The dataset was partitioned into a 80:20 ratio for training and testing with fivefold cross-validation. The results of training and testing are shown in Table 5 and Table 6. The second, third, and fourth columns of the Table 5 and Table 6 represent the MSE values for fmincon-based learning, PO and SO using BRBaDE for Conjunctive and Disjunctive BRBs. From Table 5, it can be observed that PO and SO using BRBaDE for Disjunctive BRB preformed better than the other methods with the best value of 0.000230, and an average value of 0.000302 for the training dataset. Similar results were also observed for the test datasets from Table 6. The best MSE obtained by the BRBES for the training dataset after training it by PO for SO using BRBaDE for a disjunctive BRB was 0.0023, which is shown on the last row of the fourth column of Table 5. On the other hand, the best MSE obtained by the BRBES while being trained by the fmincon-based learning mechanism was 0.000320, which can be seen from the last row and second column of Table 5. The fmincon-based learning mechanism was only parameter optimization. Therefore, it can be concluded that result accuracy by BRBES could be improved by employing parameter and structure optimization using BRBaDE as a learning technique.
In addition, the BRBES is compared with two other machine-learning techniques, namely, Artificial Neural Network (ANN) and Adaptive Neuro Fuzzy Inference System (ANFIS) [44]. The ANN was implemented using MATLAB. The ANN had one input layer, one hidden layer with three neurons, and one output layer. Levenberg–Marquardt was used as the training algorithm for the ANN. The ANFIS model was also developed in MATLAB. The "gaussmf" function of MATLAB was used as the membership function for the inputs, and hybrid function was used for training the fuzzy interface function. The results are presented in the fifth and sixth columns of Table 5 and Table 6 for training and testing, respectively. For the training dataset, it could be observed that the average MSE value of all cross-validation for PO and SO using BRBaDE for Disjunctive BR qas 0.000302, while ANN and ANFIS had 0.001727 and 0.00346, respectively. This clearly presents that PO and SO using BRBaDE for Disjunctive BRB performed better than ANN and ANFIS for the training dataset. For the testing dataset, the average MSE value of PO and SO using BRBaDE for Disjunctive BRB performed better than ANFIS and ANN. However, the minimum MSE value was achieved by PO and SO using BRBaDE for Disjunctive BRB compared with ANN and ANFIS.
To have more detailed analysis of the results, the root mean square error (RMSE), mean absolute percentage error (MAPE), and mean absolute error (MAE) were calculated on the test dataset as shown in Table 7. From the table, it can be observed that PO and SO optimization using BRBaDE had better results compared to fmincon, PO and SO using conjunctive BRB, ANN, and ANFIS. Regarding MAE and MAPE values, similar phenomena can be seen.
Furthermore, the receiver operating characteristic (ROC) curve provides detailed visualization and comparative assessment of the different methods [45]. Therefore, it is used in different domains, such as clinical applications [46], atmospheric science, and many other fields [47]. Additionally, the ROC curve is used to assess the accuracy of trained disjunctive and conjunctive BRBs, ANN, and ANFIS for the prediction of . The area under curve (AUC) of the ROC curve is the measurement of the accuracy of a result, where one is the highest value. Usually, ROC curves with a larger area and higher AUC values are considered better in terms of performance.
Figure 9 illustrates the ROC curves of fmincon, Disjunctive BRB, Conjunctive BRB, ANN, and ANFIS for predicting the of the Facebook data center. The AUC and confidence-interval (CI) values of the aforementioned method are shown in Table 8. The AUC for fmincon, Disjunctive BRB, Conjunctive BRB, ANN, and ANFIS was 0.50, 0.68, 0.29, 0.57, and 0.53, respectively. By taking into account 95% CI, the lower and upper limit of AUC for Disjunctive BRB, Conjunctive BRB, ANN, and ANFIS were 0.31–0.69, 0.46–0.90, 0.12–0.45, 0.36–0.79, and 0.32–0.75, respectively. Hence, it can be argued that Disjunctive BRB trained by PO and SO optimization using BRBaDE performed better than the other machine learning methods such as ANN, ANFIS, and fmincon-based optimization method. The disjunctive BRB performed better than other methods not only in terms of AUC but also in respect to other lower and upper limits with 95% CI. The PO and SO using BRBaDE helps to uncover the optimal values of the learning parameters and the optimal BRB structure based on the training dataset. The PO is enhanced by BRBaDE as the BRBES helps to find optimal values of F and during each DE iteration while ensuring balanced exploration and exploitation of the search space of the learning parameters. The Disjunctive BRB performed better than the Conjunctive BRB due to the use of an OR logical operator in the belief rule, which helped in more accurately capturing the relationship between the attributes for the mentioned use case scenario. Due to the strictness of the AND logical operator, the Conjunctive BRB failed to capture the relationship beween the attributes and performed poorly. ANFIS has the inherent problem of a fuzzy system that fails to address all types of uncertainty. Due to this, ANFIS did not perform better than the Disjunctive BRB. ANN performed better than the ANFIS but not the Disjunctive BRB. In ANN, there was only one learning parameter, namely, weight, whereas BRBES had multiple learning parameters, such as attribute weights, rule weights, and belief degrees. Hence, the lack of learning parameters hindered the performance of ANN.
Furthermore, the complexity of the model influenced the results predicted by them. The Akaike Information Criterium (AIC) [48] and Bayesian Information Criterium (BIC) [49] are commonly used for comparison between different models’ complexity. AIC takes into account loss function (sum squared error) and the number of parameters used for calibrating model complexity. BIC is closely related to AIC, which is also based on likelihood function. However, the penalty of the parameters is comparatively higher for BIC. Therefore, AIC and BIC are used to compare the complexity between fmincon-based BRBES optimization, PO, and SO using BRBaDE for disjunctive and conjunctive BRB, ANN, and ANFIS. Table 9 shows the results of AIC and BIC comparisons among the methods. Among the different methods, the Disjunctive BRB was preferable as it contained lesser values for AIC and BIC. Thus, the model demonstrates its reliability compared to the other models.
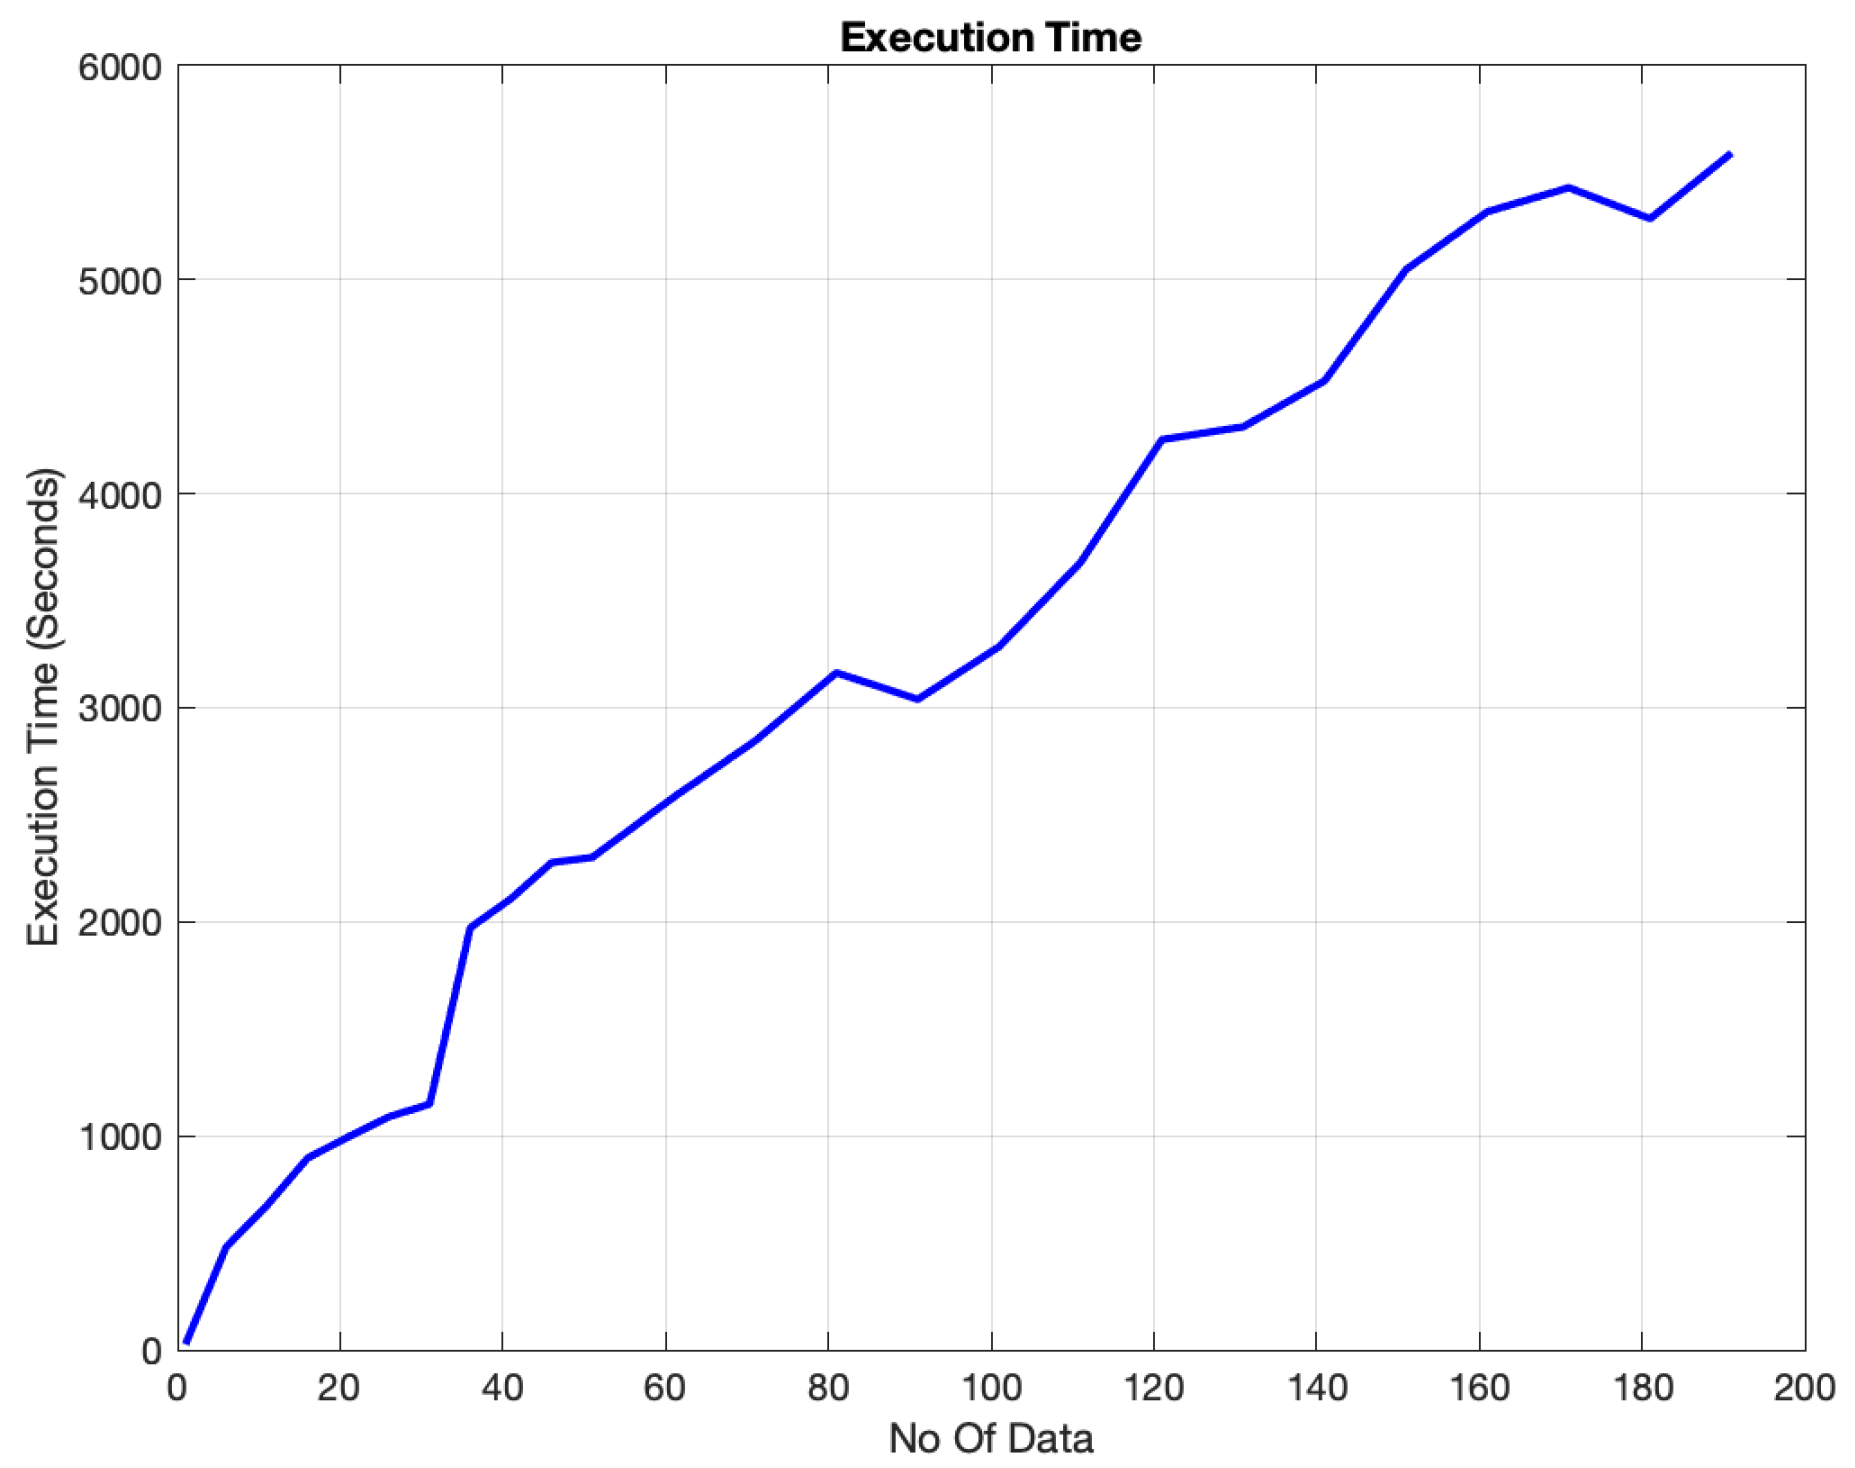
The convergence of PO and SO using BRBaDE for Conjunctive and Disjunctive BRB are depicted in Figure 10. The solid blue line illustrates the decrease of the MSE for the Disjunctive BRB during each iteration. The initial MSE was 4.111466, which decreased to 0.000281 after the 1000th iteration. The dashed line represents convergence for the Conjunctive BRB. The initial MSE for the Conjunctive BRB was 7.235699, which decreased to 0.003566 around the 499th iteration, after which it became fixed. Even though the BRBaDE reached a steady state for the Conjunctive BRB in fewer iterations, it had a more accurate result for the Disjunctive BRB. For better visualization of the convergence of the BRBaDE, the MSE value was been converted to LOG scale as shown in Figure 10b. From Figure 10, it can be concluded that PO and SO using BRBaDE performed better for the Disjunctive BRB than the Conjunctive BRB. Figure 11 illustrates the learning time of the PO and SO using BRBaDE in correspondence with different data sizes, where it can be observed that learning time grew linearly with the increase of the data size.
To further investigate the impact of BRBES PO and SO using BRBaDE, the initial and trained structure of the disjunctive BRB is represented in Table 10 and Table 11 respectively. The trained structure of disjunctive BRB has four referential values for each antecedent attribute with optimized utility values to improve the accuracy of predicting , which is evident from Table 11. Furthermore, the attribute weights of the antecedent attributes were also optimized based on training the dataset. The higher values of the attribute weights demonstrate the importance of attributes. Similarly, the utility values of the consequent attributes were also optimized, which is also shown in Table 11. The trained BRB for disjunctive BRB is presented in Table 12. It can be observed that the rule weights and belief degrees changed in respect to the initial rule base (Table 3), improving prediction accuracy.
Furthermore, to evaluate the robustness of the proposed learning mechanism, we have used another dataset from the Joint Information Systems Committee (JISC) funded project named Measuring Data Center Efficiency [50,51]. The dataset contained outside temperature, server room temperature, IT equipment energy consumption, and from 26 October 2011 to 15 December 2011 with a sample rate of 30 min. The dataset contained a total of 2400 data points, whereas in the Facebook dataset there were 298 data points as mentioned in Section 5.1. Therefore, this dataset is significantly larger than the previous one. Outside temperature, server room temperature, and IT equipment energy consumption of this dataset were considered as input and as output. The dataset was partitioned into a 80:20 ratio for training and testing. Disjunctive BRB with our proposed learning algorithm, named BRBaDE (Section 4), ANN, and ANFIS were used for predicing the . Table 13 presents the results of predicting by Disjunctive BRB with PO and SO using BRBaDE, ANN, and ANFIS for different evaluation metrics (such as RMSE, MAPE, MAE) on the testing dataset. The RMSE values for PO and SO using BRBaDE, ANN, and ANFIS are 0.0139, 0.01418, and 0.0138 respectively. The MAPE values for the above-mentioned algorithms are 0.0035, 0.0197, and 0.0074 respectively. Subsequently, 0.0111, 0.0115, and 0.0112 are the MAE values for PO and SO using BRBaDE, ANN, and ANFIS respectively. For all the evaluation matrices, it can be observed that PO and SO using BRBaDE has the lowest value than the other methods. Thus it can be concluded that Disjunctive BRB with PO and SO using BRBaDE is performing better than ANN, and ANFIS.
Thus from the above discussion it can be seen that prediction using new learning algorithm BRBaDE performed better than the ANN and ANFIS due to its capability of addressing all kinds of uncertainties in data. Furthermore, new learning algorithm BRBaDE helps to find optimal values better than the fmincon-based gradient algorithm used in MATLAB.
7. Conclusions
This study presented a BRBES-based learning system as a novel capacity-management technique for data centers to automate the monitoring and forecasting of . This helps data-center operators to take necessary measures to ensure better values and generate alarms in advance, while there is the probability of exceeding the threshold value of . Furthermore, an efficient prediction model helps to evaluate data-center sensitivity with respect to its operational parameters. All this helps data centers to become more energy-efficient and sustainable. We provided real-life examples from big IT companies in the industry, and demonstrated the importance of this technique to capture and forecast dynamic nonlinearities of data-center variables. This has resulted in a significant increase of energy efficiency for these energy-greedy facilities. Furthermore, it was also presented that PO and SO using BRBaDE helped a disjunctive BRB-based BRBES to optimize its learning parameters and the structure of BRB, which, in turn, helped to achieve a more accurate prediction of the of data centers. The prediction of disjunctive BRB-based BRBES was compared with other machine-learning techniques such as ANN and ANFIS. The results showed that disjunctive BRB outperformed ANN and ANFIS due to BRBES’s inherent capability of addressing a vast range of uncertainties, optimization of learning parameters, and structure of the BRB. Furthermore, it was shown that the new PO and SO using a BRBaDE-based learning mechanism performed better than the previous fmincon-based learning mechanism of BRBES. Since our model has the flexibility to incorporate different parameters found in diverse domains, this model has the capability to address the problem of those domains. In this way, the generic capability of our model could be explored. In the future, this mode will be used in different domains such as health informatics and disaster management to explore its capabilities.
Author Contributions
Conceptualization, K.A., M.S.H., A.-L.K., X.R. and R.U.I.; Methodology R.U.I.; Software, X.R. and R.U.I.; Writing–original draft preparation, X.R. and R.U.I.; Writing–review and editing, R.U.I., K.A., M.S.H. and A.-L.K.; Supervision, K.A., M.S.H. and A.-L.K.
Funding
The research work was financially supported by the Swedish Research Council (under grant 2014-4251) and the Erasmus Mundus program PERCCOM [52], facilitated by the European Commission.
Acknowledgments
This research was conducted as part of the masters thesis [53] of Xhesika Ruci at the Pervasive and Mobile Computing Laboratory, Luleå University of Technology, Sweden.
Conflicts of Interest
The authors declare no conflict of interest.
References
- Vidal, J. ‘Tsunami of Data’ could Consume one Fifth of Global Electricity by 2025. 2017. Available online: https://www.climatechangenews.com/2017/12/11/tsunami-data-consume-one-fifth-global-electricity-2025/ (accessed on 31 July 2019).
- Garg, S.; Kaur, K.; Kaddoum, G.; Gagnon, F.; Rodrigues, J.J. An Efficient Blockchain-based Hierarchical Authentication Mechanism for Energy Trading in V2G Environment. In Proceedings of the ICC 2019 Workshop on Research Advancements in Future Networking Technologies (RAFNET), Shanghai, China, 20–24 May 2019. [Google Scholar]
- Kaur, K.; Garg, S.; Kaddoum, G.; Ahmed, S.H.; Jayakody, D.N.K. En-OsCo: Energy-aware Osmotic Computing Framework using Hyper-heuristics. In Proceedings of the ACM MobiHoc Workshop on Pervasive Systems in the IoT Era, Catania, Italy, 2 July 2019; pp. 19–24. [Google Scholar]
- Andrae, A.S.; Edler, T. On global electricity usage of communication technology: Trends to 2030. Challenges 2015, 6, 117–157. [Google Scholar] [CrossRef]
- Qi, W.; Li, J. Towards optimal coordinated operation of distributed internet data center microgrids. In Proceedings of the 2016 IEEE Power and Energy Society General Meeting (PESGM), Boston, MA, USA, 17–21 July 2016; pp. 1–5. [Google Scholar] [CrossRef]
- Fallah, S.; Deo, R.; Shojafar, M.; Conti, M.; Shamshirband, S. Computational intelligence approaches for energy load forecasting in smart energy management grids: State of the art, future challenges, and research directions. Energies 2018, 11, 596. [Google Scholar] [CrossRef]
- Hossain, M.S.; Rahaman, S.; Kor, A.L.; Andersson, K.; Pattinson, C. A belief rule based expert system for datacenter PUE prediction under uncertainty. IEEE Trans. Sustain. Comput. 2017, 2, 140–153. [Google Scholar] [CrossRef]
- Gao, J. Machine Learning Applications for Data Center Optimization. 2014. Available online: https://ai.google/research/pubs/pub42542 (accessed on 31 July 2019).
- Geng, H. Data Center Handbook; John Wiley & Sons: Hoboken, NJ, USA, 2014. [Google Scholar]
- Islam, R.U.; Hossain, M.S.; Andersson, K. A novel anomaly detection algorithm for sensor data under uncertainty. Soft Comput. 2018, 22, 1623–1639. [Google Scholar] [CrossRef]
- Yang, J.B.; Liu, J.; Xu, D.L.; Wang, J.; Wang, H. Optimization models for training belief-rule-based systems. IEEE Trans. Syst. Man Cybern. 2007, 37, 569–585. [Google Scholar] [CrossRef]
- Storn, R.; Price, K. Differential evolution–a simple and efficient heuristic for global optimization over continuous spaces. J. Glob. Optim. 1997, 11, 341–359. [Google Scholar] [CrossRef]
- Al-Dabbagh, R.D.; Neri, F.; Idris, N.; Baba, M.S. Algorithmic design issues in adaptive differential evolution schemes: Review and taxonomy. Swarm Evol. Comput. 2018. [Google Scholar] [CrossRef]
- Islam, R.U.; Hossain, M.S.; Andersson, K. A Novel Differential Evolution Approach to Improve Belief Rule Based Expert System Learning; Springer: Berlin/Heidelberg, Germany, 2005. [Google Scholar]
- Yang, L.H.; Wang, Y.M.; Liu, J.; Martínez, L. A joint optimization method on parameter and structure for belief-rule-based systems. Knowl. Based Syst. 2018, 142, 220–240. [Google Scholar] [CrossRef]
- Avelar, V.; Azevedo, D.; French, A.; Power, E.N. PUE: A Comprehensive Examination of the Metric; The Green Grid: London, UK, 2012. [Google Scholar]
- Azevedo, D.; Patterson, M.; Pouchet, J.; Tipley, R. Carbon Usage Effectiveness (CUE): A Green Grid Data Center Sustainability Metric; The Green Grid: London, UK, 2010. [Google Scholar]
- Azevedo, D.; Belady, S.C.; Pouchet, J. Water Usage Effectiveness (WUE™): A Green Grid Datacenter Sustainability Metric; The Green Grid: London, UK, 2011. [Google Scholar]
- Banks, M.; Benjamin, E.; Calderwood, T.; Llera, R.G.; Pflueger, J. Electronics Disposal Efficiency (EDE): An IT Recycling Metric For Enterprises and Data Centers; The Green Grid: London, UK, 2013. [Google Scholar]
- Bodenski, D. Artificial Intelligence Uses in Data Centers. 2017. Available online: https://www.belden.com/blog/data-centers/ artificial-intelligence-uses-in-data-centers (accessed on 31 July 2019).
- Vigilent Optimizing Mission Critical Cooling. 2018. Available online: http://www.vigilent.com/who-we-serve/by-facility/data-centers/ (accessed on 31 July 2019).
- Rego, C.W. Prognose could be a Game-Changer as the Leading TCO/Predictive Modeling Solution for the Data Center Industry. 2017. Available online: http://www.vigilent.com/who-we-serve/by-facility/data-centers/ (accessed on 31 July 2019).
- Shoukourian, H.; Wilde, T.; Labrenz, D.; Bode, A. Using machine learning for data center cooling infrastructure efficiency prediction. In Proceedings of the 2017 IEEE International Parallel and Distributed Processing Symposium Workshops (IPDPSW), Lake Buena Vista, FL, USA, 29 May–2 June 2017; pp. 954–963. [Google Scholar]
- Balanici, M.; Pachnicke, S. Server Traffic Prediction Using Machine Learning for Optical Circuit Switching Scheduling. In Proceedings of the 20th ITG-Symposium Photonic Networks, Leipzig, Germany, 8 May 2019; pp. 1–3. [Google Scholar]
- Li, Y.; Wen, Y.; Tao, D.; Guan, K. Transforming cooling optimization for green data center via deep reinforcement learning. IEEE Trans. Cybern. 2019. [Google Scholar] [CrossRef]
- Haghshenas, K.; Pahlevan, A.; Zapater, M.; Mohammadi, S.; Atienza, D. MAGNETIC: Multi-Agent Machine Learning-Based Approach for Energy Efficient Dynamic Consolidation in Data Centers. IEEE Trans. Serv. Comput. 2019. [Google Scholar] [CrossRef]
- Chang, L.; Zhou, Z.; You, Y.; Yang, L.; Zhou, Z. Belief rule based expert system for classification problems with new rule activation and weight calculation procedures. Inf. Sci. 2016, 336, 75–91. [Google Scholar] [CrossRef]
- Yang, J.B.; Liu, J.; Wang, J.; Sii, H.S.; Wang, H.W. Belief rule-base inference methodology using the evidential reasoning approach-RIMER. IEEE Trans. Syst. Man, Cybern. 2006, 36, 266–285. [Google Scholar] [CrossRef]
- Yang, J.B.; Singh, M.G. An evidential reasoning approach for multiple-attribute decision making with uncertainty. IEEE Trans. Syst. Man Cybern. 1994, 24, 1–18. [Google Scholar] [CrossRef]
- Wang, Y.M.; Yang, J.B.; Xu, D.L. Environmental impact assessment using the evidential reasoning approach. Eur. J. Oper. Res. 2006, 174, 1885–1913. [Google Scholar] [CrossRef]
- Chang, L.; Sun, J.; Jiang, J.; Li, M. Parameter learning for the belief rule base system in the residual life probability prediction of metalized film capacitor. Knowl. Based Syst. 2015, 73, 69–80. [Google Scholar] [CrossRef]
- Chang, L.; Zhou, Y.; Jiang, J.; Li, M.; Zhang, X. Structure learning for belief rule base expert system: A comparative study. Knowl. Based Syst. 2013, 39, 159–172. [Google Scholar] [CrossRef]
- Wang, Y.M.; Yang, L.H.; Fu, Y.G.; Chang, L.L.; Chin, K.S. Dynamic rule adjustment approach for optimizing belief rule-base expert system. Knowl. Based Syst. 2016, 96, 40–60. [Google Scholar] [CrossRef]
- Zhou, Z.J.; Hu, C.H.; Yang, J.B.; Xu, D.L.; Chen, M.Y.; Zhou, D.H. A sequential learning algorithm for online constructing belief-rule-based systems. Expert Syst. Appl. 2010, 37, 1790–1799. [Google Scholar] [CrossRef]
- Chen, Y.W.; Yang, J.B.; Xu, D.L.; Zhou, Z.J.; Tang, D.W. Inference analysis and adaptive training for belief rule based systems. Expert Syst. Appl. 2011, 38, 12845–12860. [Google Scholar] [CrossRef]
- Yang, X.S. Nature-Inspired Optimization Algorithms; Elsevier: Oxford, UK, 2014. [Google Scholar]
- Das, S.; Suganthan, P.N. Differential evolution: A survey of the state-of-the-art. IEEE Trans. Evol. Comput. 2011, 15, 4–31. [Google Scholar] [CrossRef]
- Liu, J.; Lampinen, J. A fuzzy adaptive differential evolution algorithm. Soft Comput. 2005, 9, 448–462. [Google Scholar] [CrossRef]
- Leon, M.; Xiong, N. Greedy adaptation of control parameters in differential evolution for global optimization problems. In Proceedings of the 2015 IEEE Congress on Evolutionary Computation (CEC), Sendai, Japan, 25–28 May 2015; pp. 385–392. [Google Scholar] [CrossRef]
- Weather Underground. 2019. Available online: https://www.wunderground.com/ (accessed on 31 July 2019).
- Islam, R.U.; Andersson, K.; Hossain, M.S. A web based belief rule based expert system to predict flood. In Proceedings of the 17th International Conference on Information Integration and Web-Based Applications & Services, Brussels, Belgium, 11–13 December 2015; pp. 1–8. [Google Scholar] [CrossRef]
- Fielding, R.T. Architectural Styles and the Design of Network-Based Software Architectures. Ph.D. Thesis, University of California, Berkeley, CA, USA, 2000. [Google Scholar]
- Sabbir Hridoy, M.R.; Hossain, M.S.; Islam, R.U.; Andersson, K. A web based belief rule based expert system for assessing flood risk. In Proceedings of the 19th International Conference on Information Integration and Web-based Applications & Services, Salzburg, Austria, 4–6 December 2017; pp. 434–440. [Google Scholar] [CrossRef]
- Jang, J.S. ANFIS: Adaptive-network-based fuzzy inference system. IEEE Trans. Syst. Man Cybern. 1993, 23, 665–685. [Google Scholar] [CrossRef]
- Gönen, M. Analyzing Receiver Operating Characteristic Curves with SAS; SAS Institute: Amsterdam, The Netherlands, 2007. [Google Scholar]
- Hossain, M.S.; Hasan, M.A.; Uddin, M.; Islam, M.M.; Mustafa, R. A belief rule based expert system to assess lung cancer under uncertainty. In Proceedings of the 2015 18th International Conference on Computer and Information Technology (ICCIT), Dhaka, Bangladesh, 21–23 December 2015; pp. 413–418. [Google Scholar] [CrossRef]
- Zou, K.H.; O’Malley, A.J.; Mauri, L. Receiver-operating characteristic analysis for evaluating diagnostic tests and predictive models. Circulation 2007, 115, 654–657. [Google Scholar] [CrossRef] [PubMed]
- Akaike, H. Fitting autoregressive models for prediction. Ann. Inst. Stat. Math. 1969, 21, 243–247. [Google Scholar] [CrossRef]
- Schwarz, G. Estimating the dimension of a model. Ann. Stat. 1978, 6, 461–464. [Google Scholar] [CrossRef]
- Pattinson, C.; Cross, R. Measuring data centre efficiency. JISC Green Tech. Rep. 2013. [Google Scholar]
- Pattinson, C.; Kor, A.L.; Cross, R. Critical issues for data center energy efficiency. In Green Information Technology; Elsevier: Amsterdam, The Netherland, 2015; pp. 223–248. [Google Scholar]
- Klimova, A.; Rondeau, E.; Andersson, K.; Porras, J.; Rybin, A.; Zaslavsky, A. An international Master’s program in green ICT as a contribution to sustainable development. J. Clean. Prod. 2016, 135, 223–239. [Google Scholar] [CrossRef]
- Ruci, X. Capacity Management in Hyper-Scale Datacenters using Predictive Modelling. Master’s Thesis, Luleå University of Technology, Luleå, Sweden, 2019. [Google Scholar]
Figure 1.
Sample representation of Belief Rule-Based (BRB) tree.
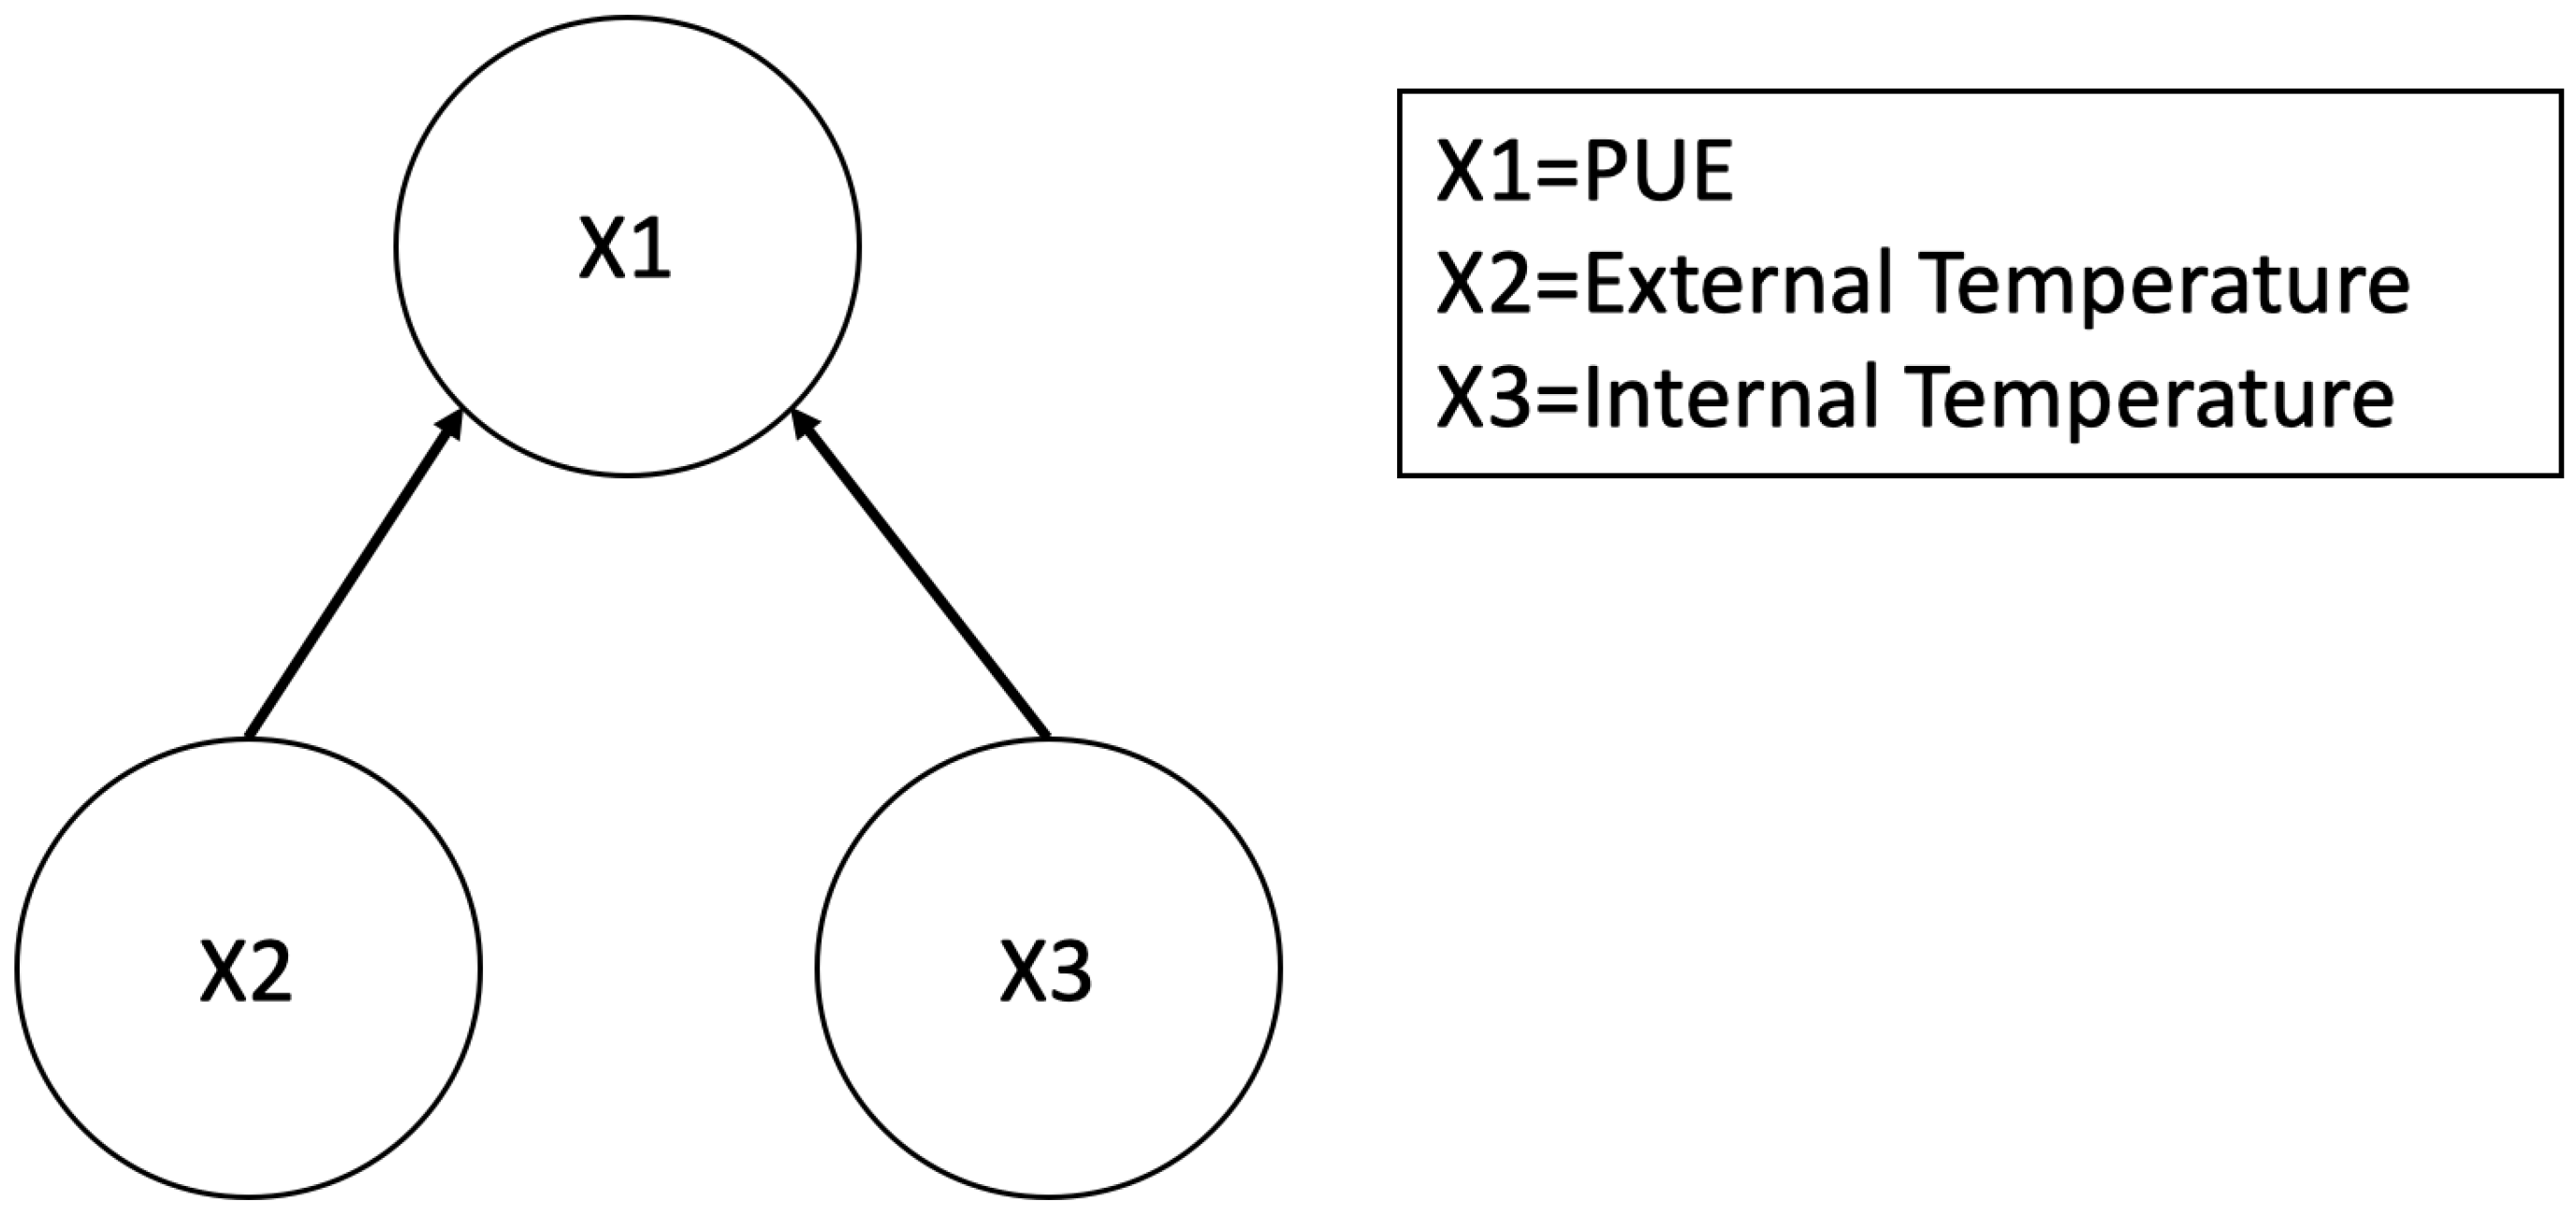
Figure 2.
Working process of BRB Expert System (BRBES).
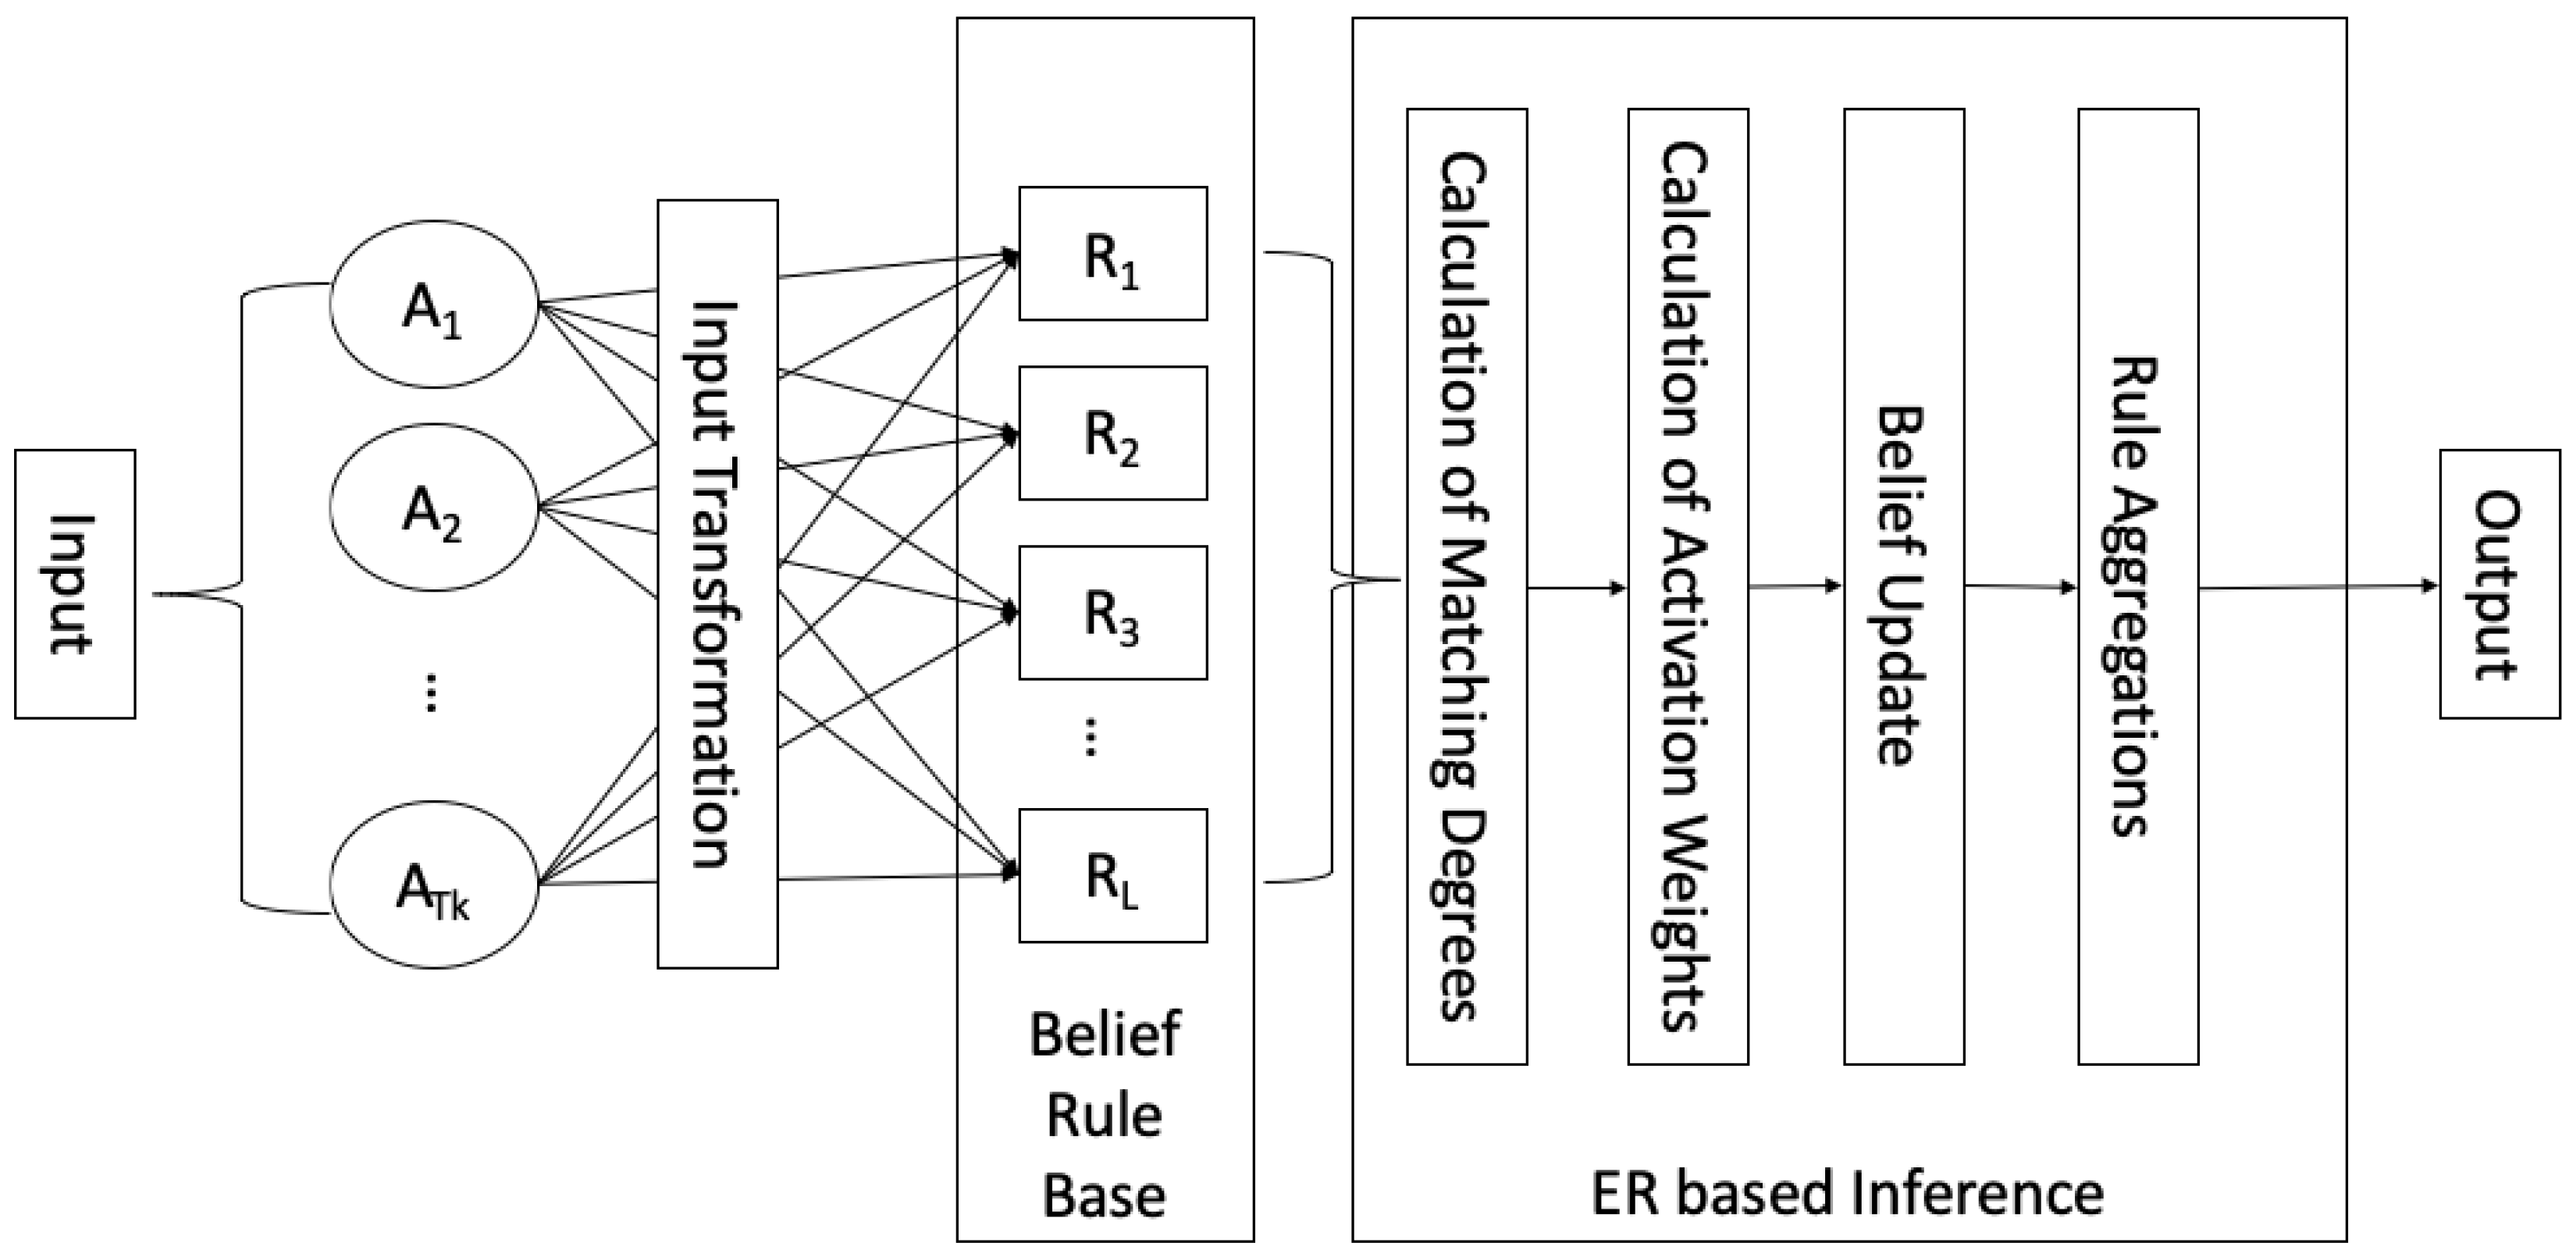
Figure 3.
Learning process of BRBES.
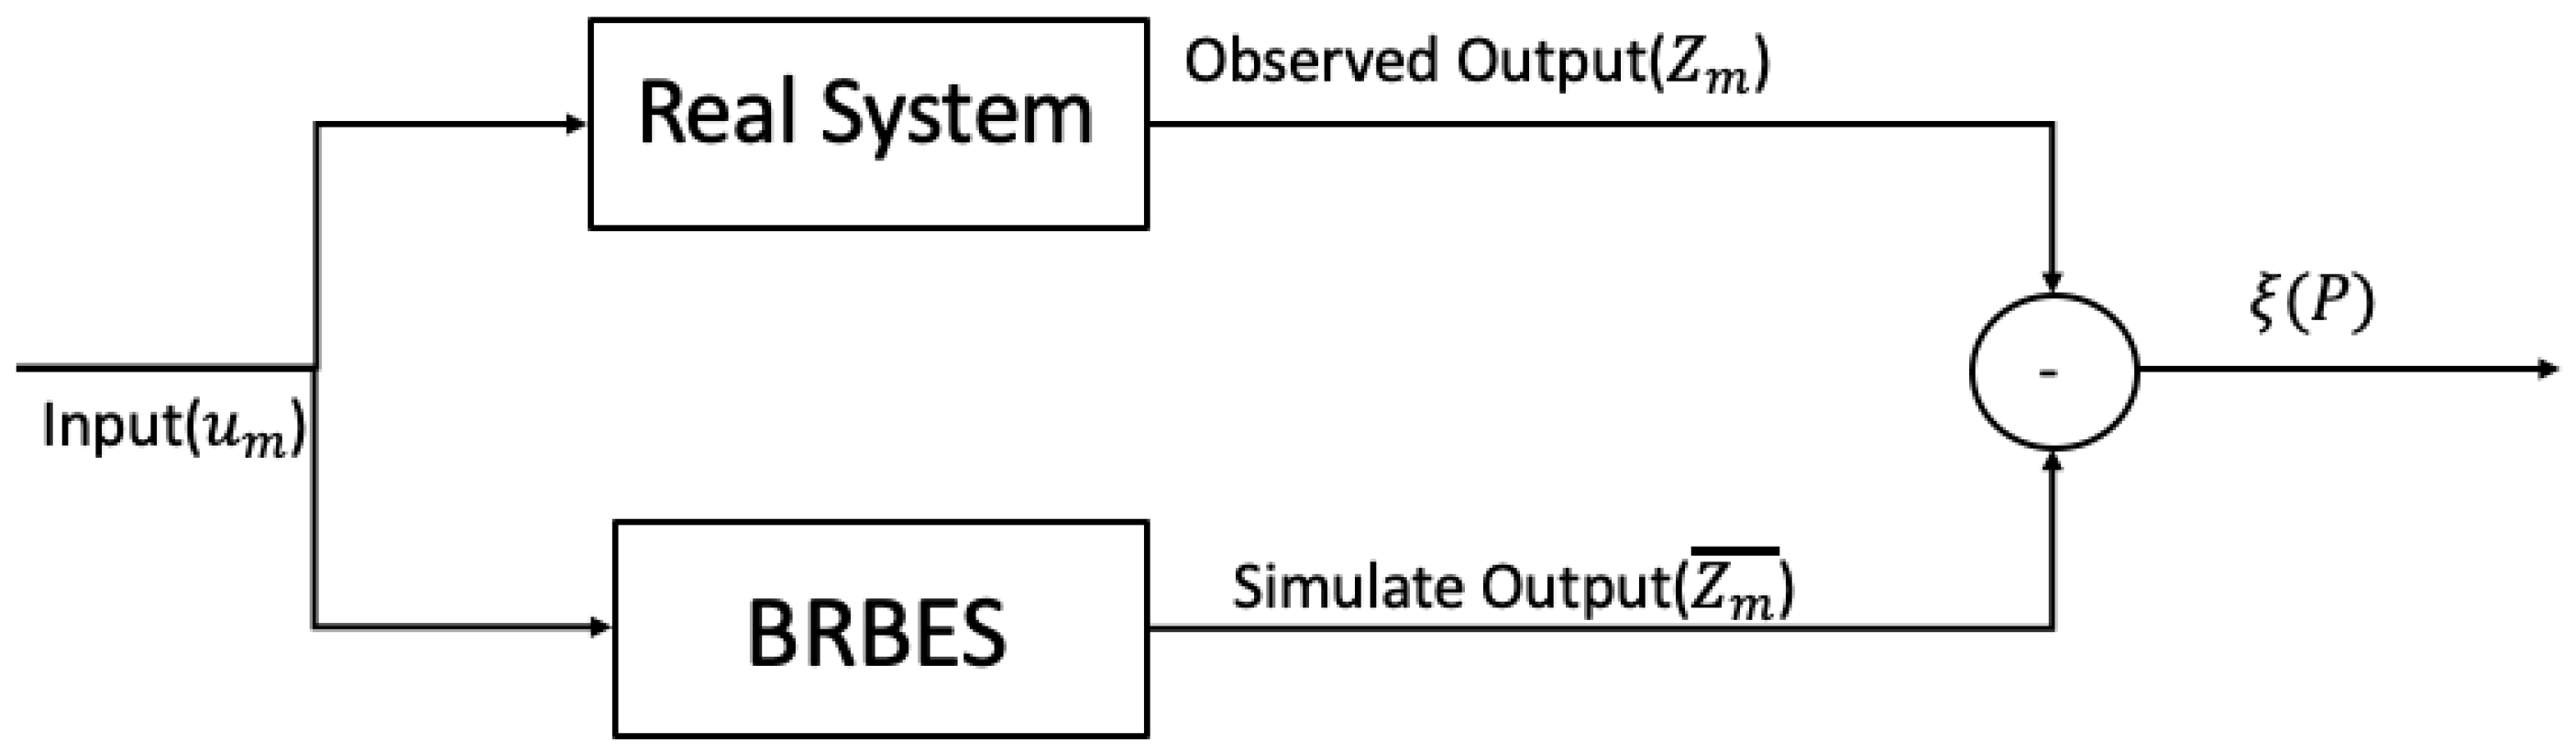
Figure 4.
BRB adaptive Differential Evolution (BRBaDE).
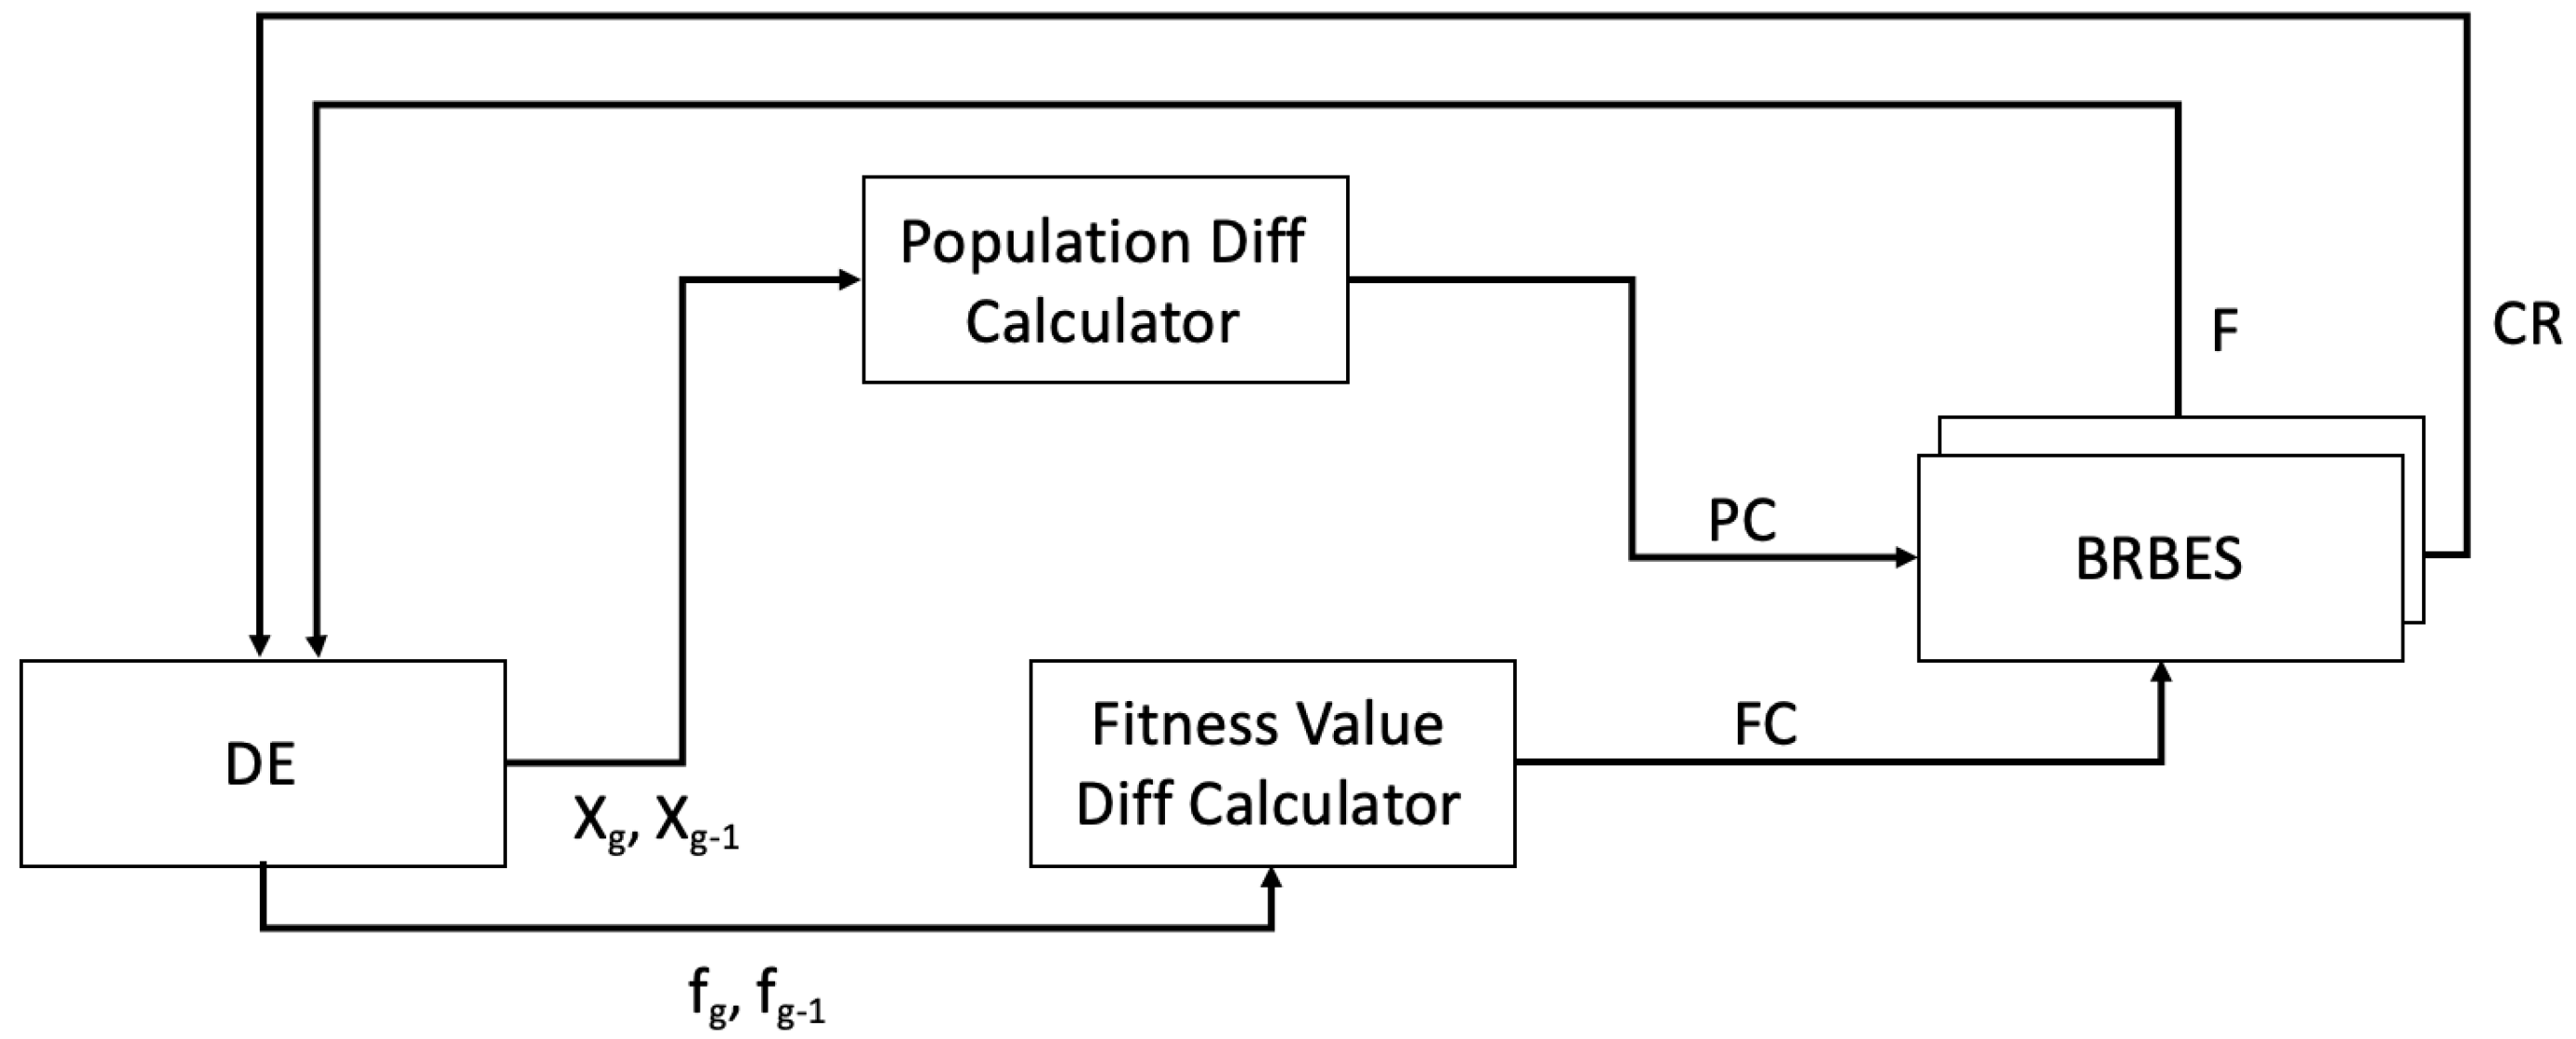
Figure 5.
Two BRBESs used for BRBaDE.
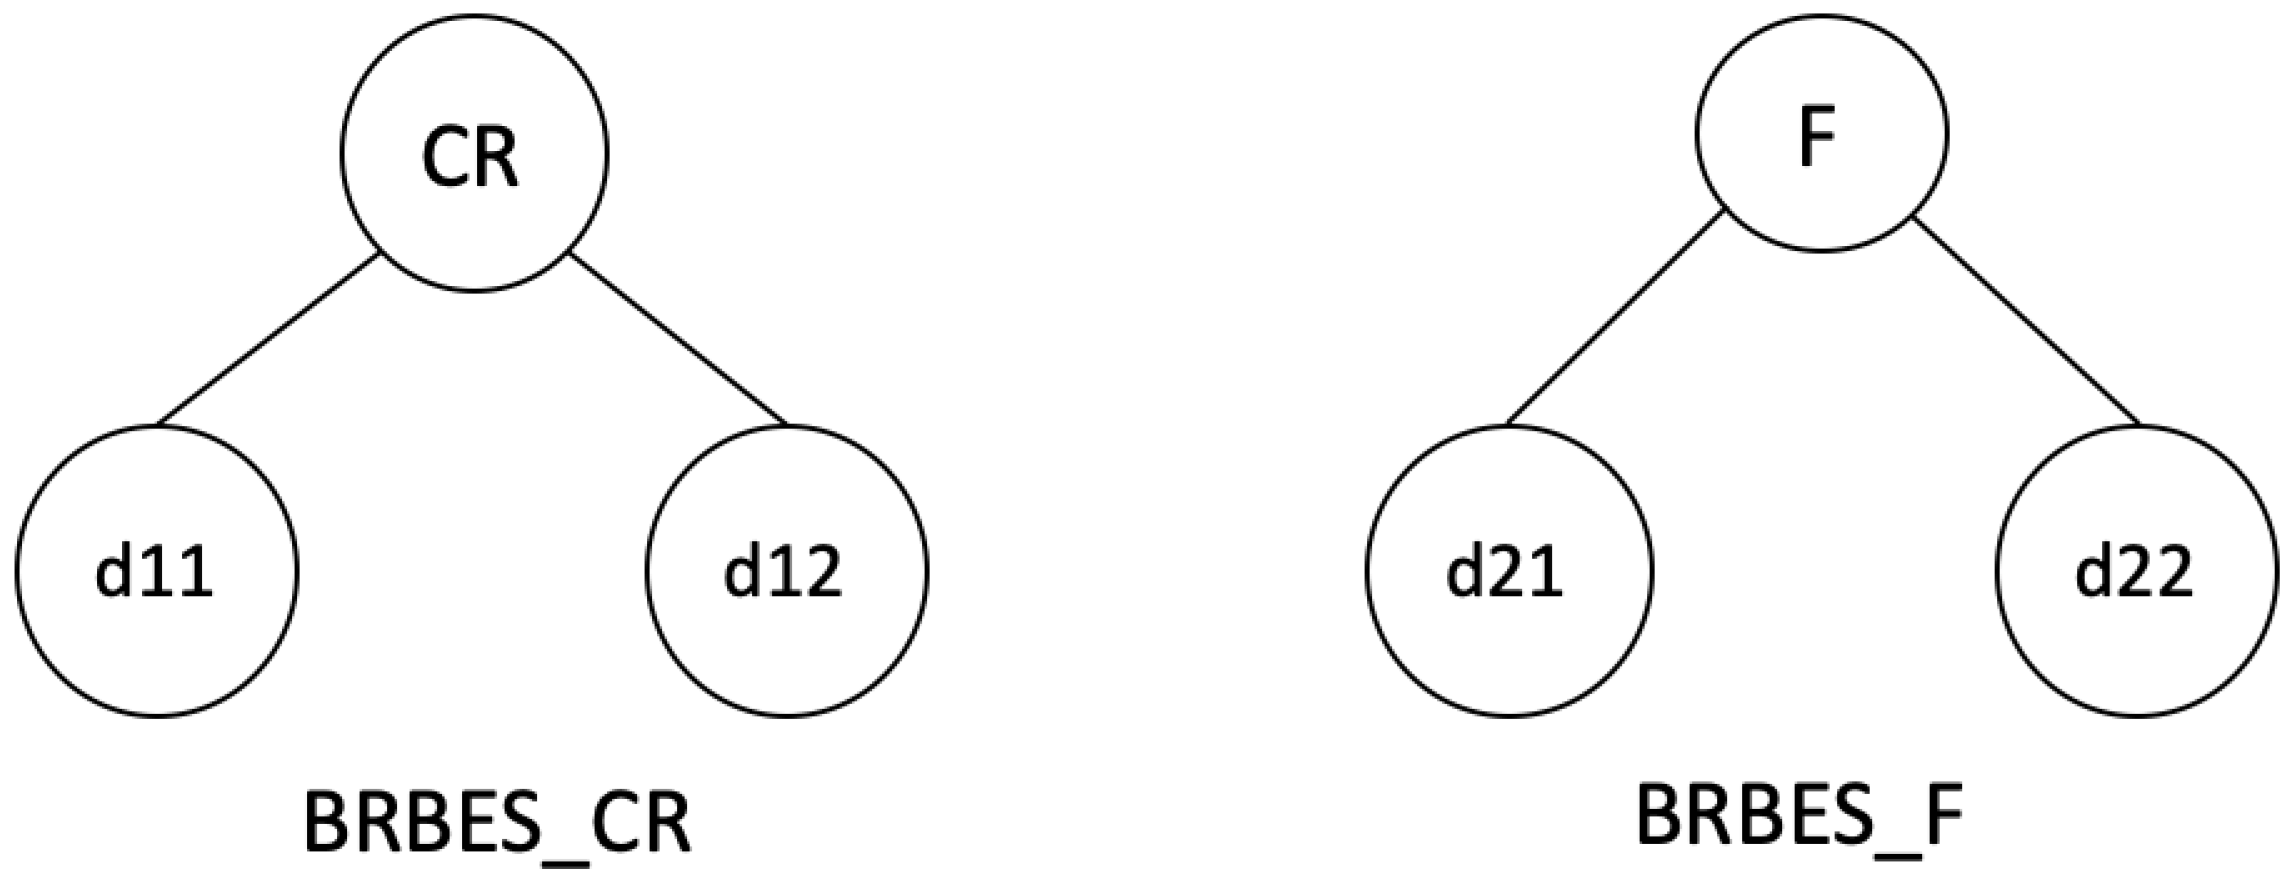
Figure 6.
Flowchart of BRBaDE-based learning.
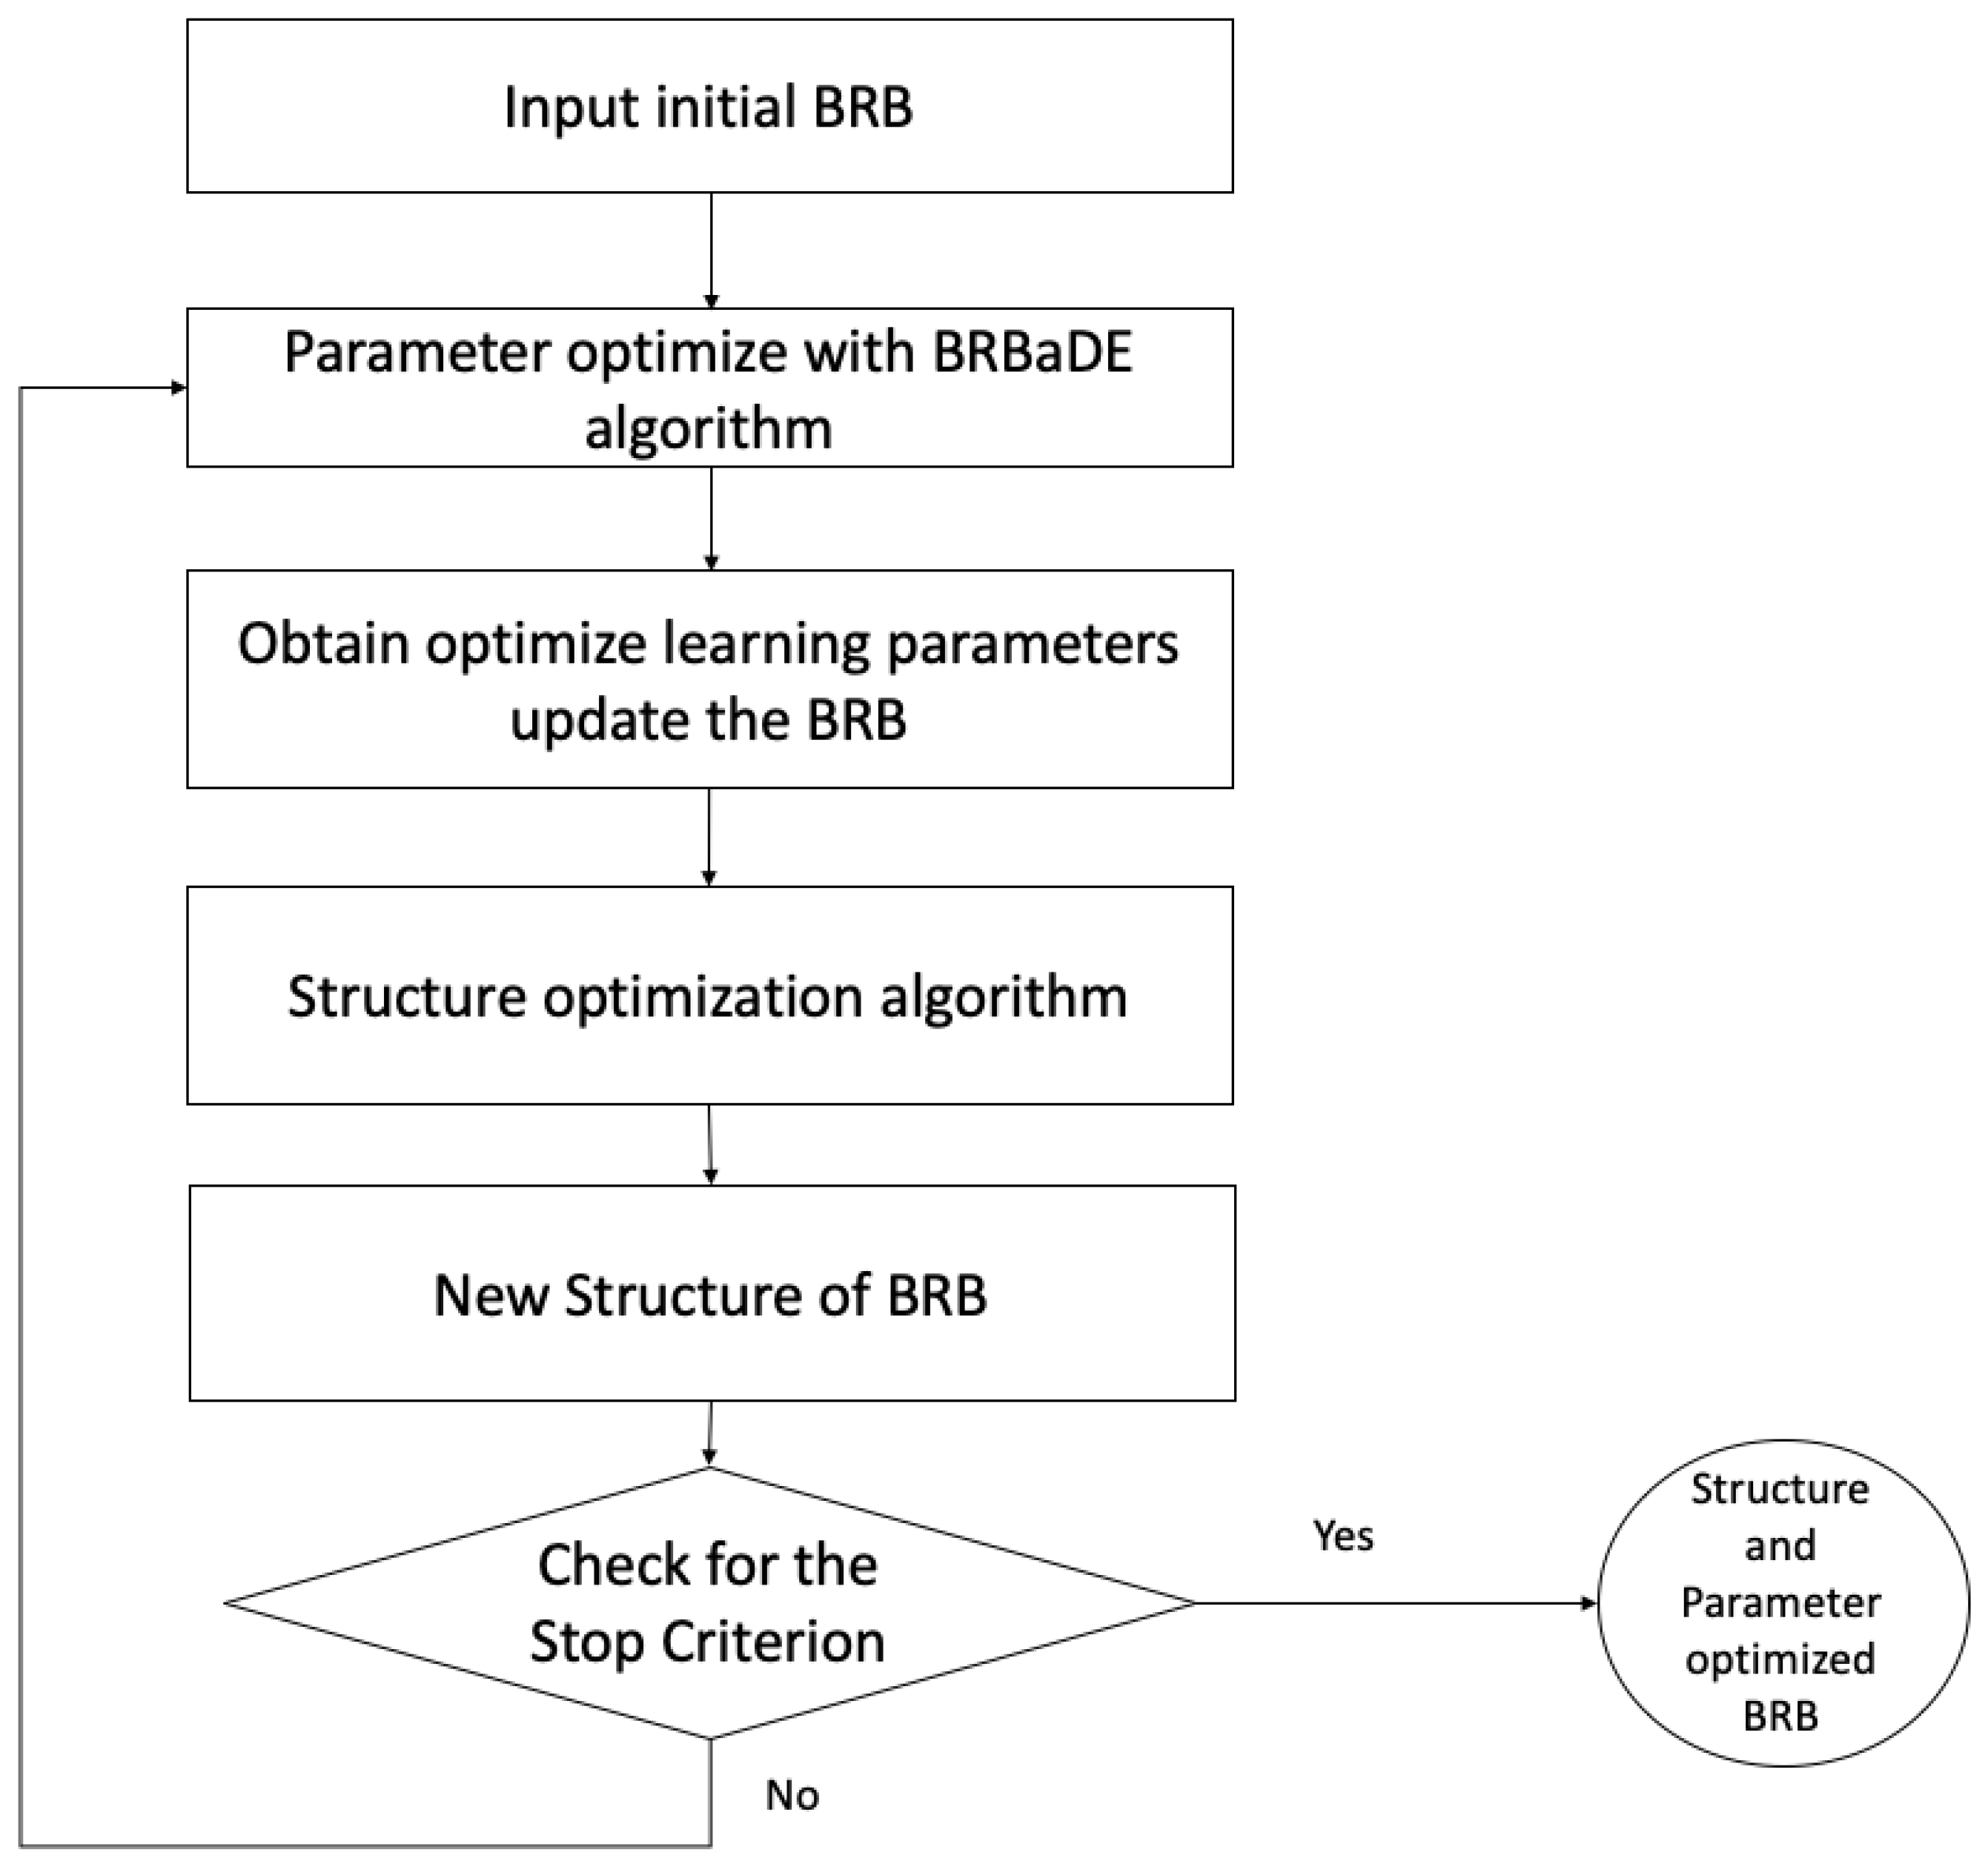
Figure 7.
BRBES system architecture.
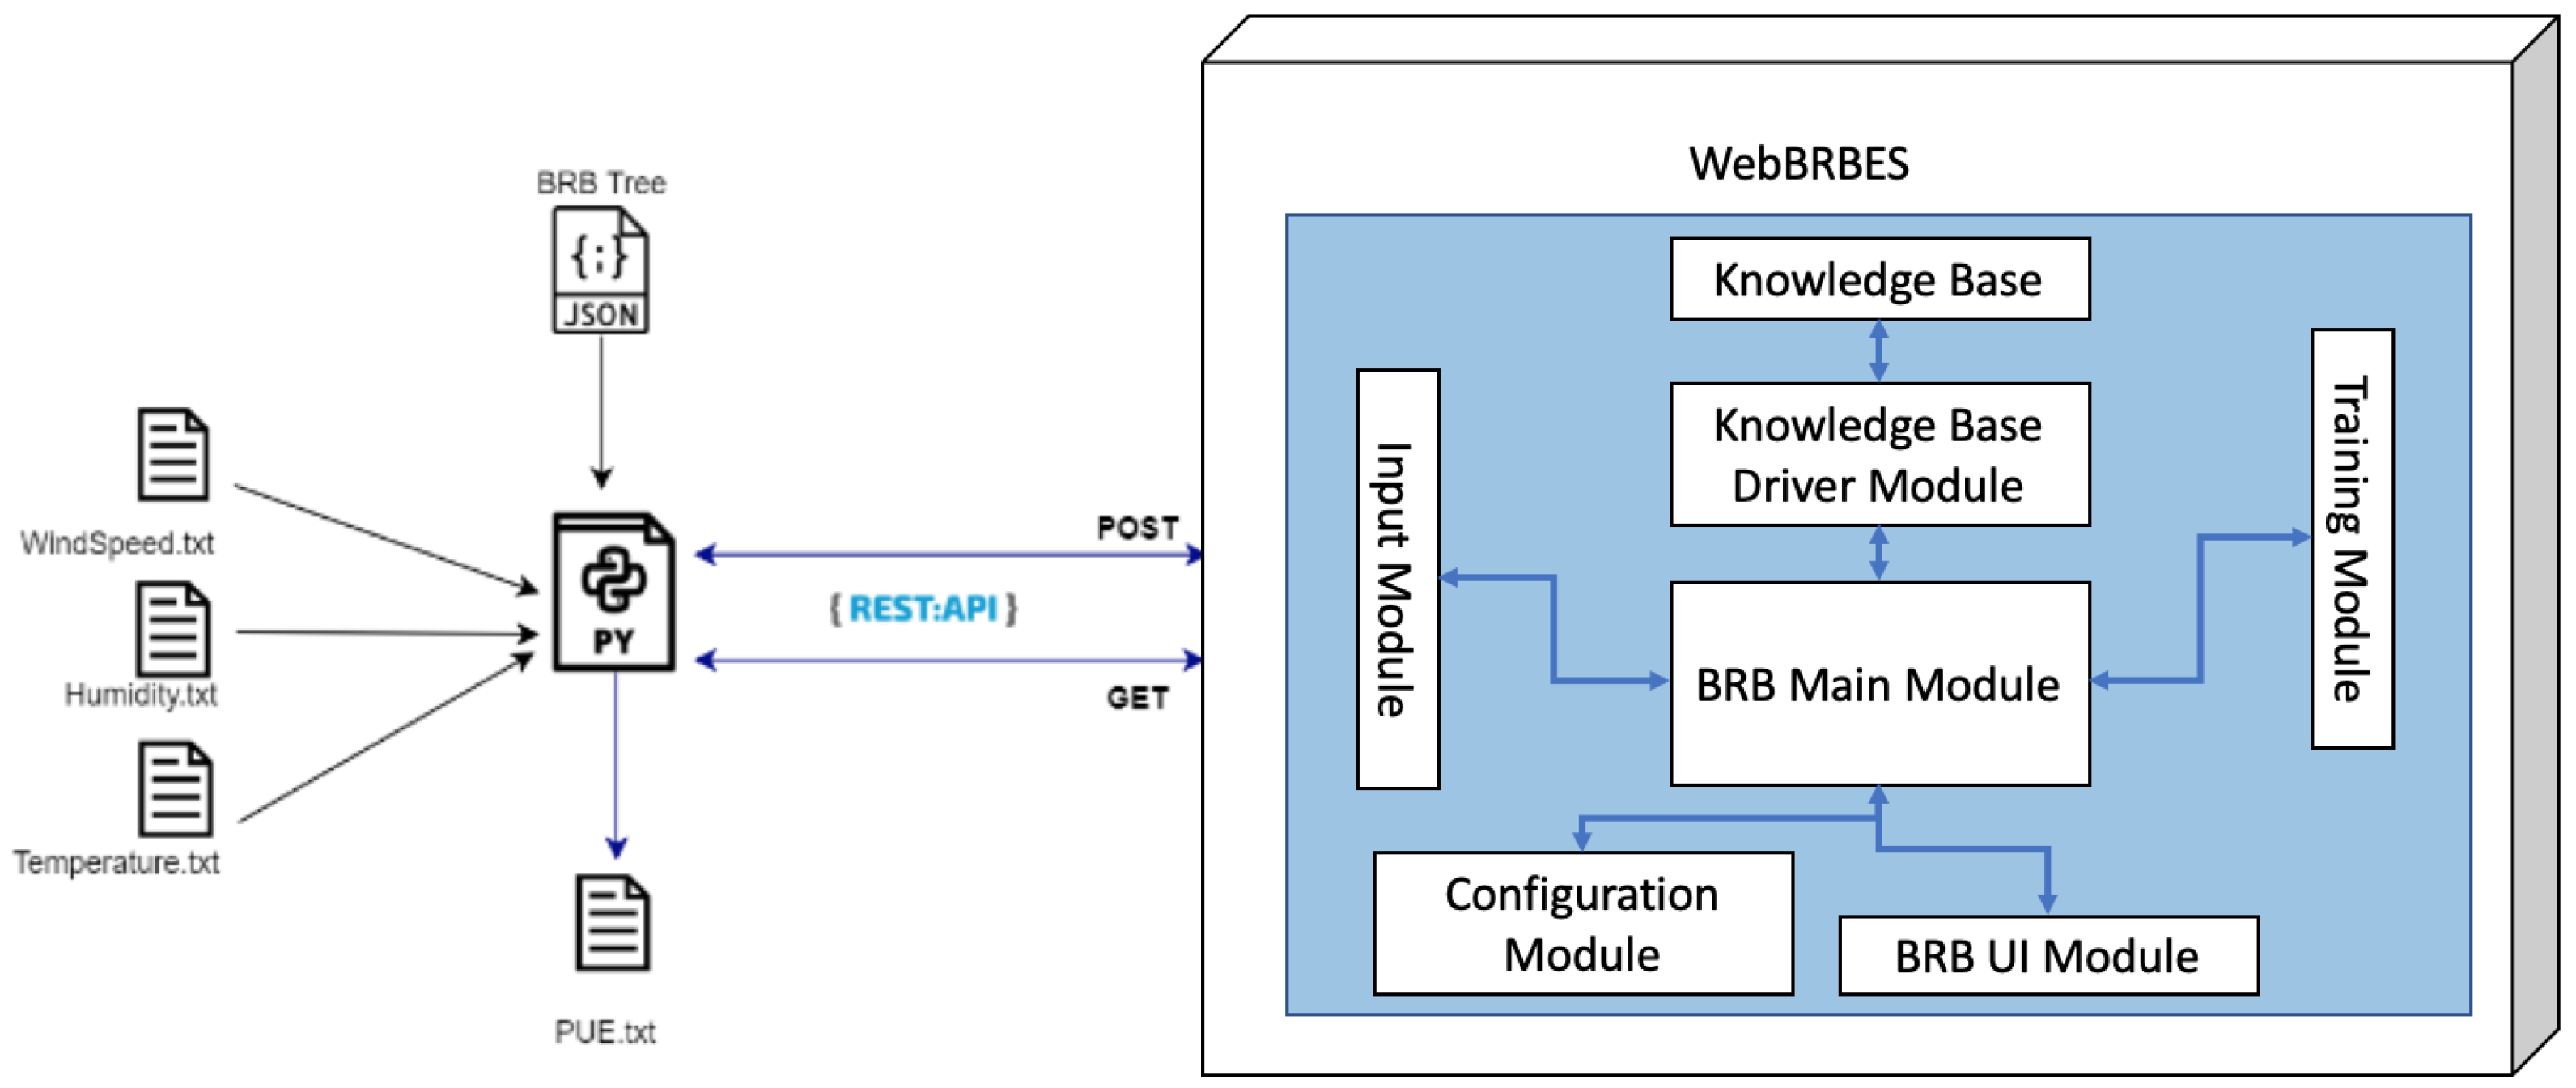
Figure 8.
BRB framework for Power Usage Effectiveness ().

Figure 9.
Receiver operating characteristic (ROC) curve comparison of fmincon, Disjunctive BRB, Conjunctive BRB, ANN, and ANFIS for predicting of Facebook data center.
Figure 9.
Receiver operating characteristic (ROC) curve comparison of fmincon, Disjunctive BRB, Conjunctive BRB, ANN, and ANFIS for predicting of Facebook data center.

Figure 10.
Convergence of PO and SO using BRBaDE for Conjunctive and Disjunctive BRB. (a) MSE; (b) MSE (Converted to Log scale).
Figure 10.
Convergence of PO and SO using BRBaDE for Conjunctive and Disjunctive BRB. (a) MSE; (b) MSE (Converted to Log scale).
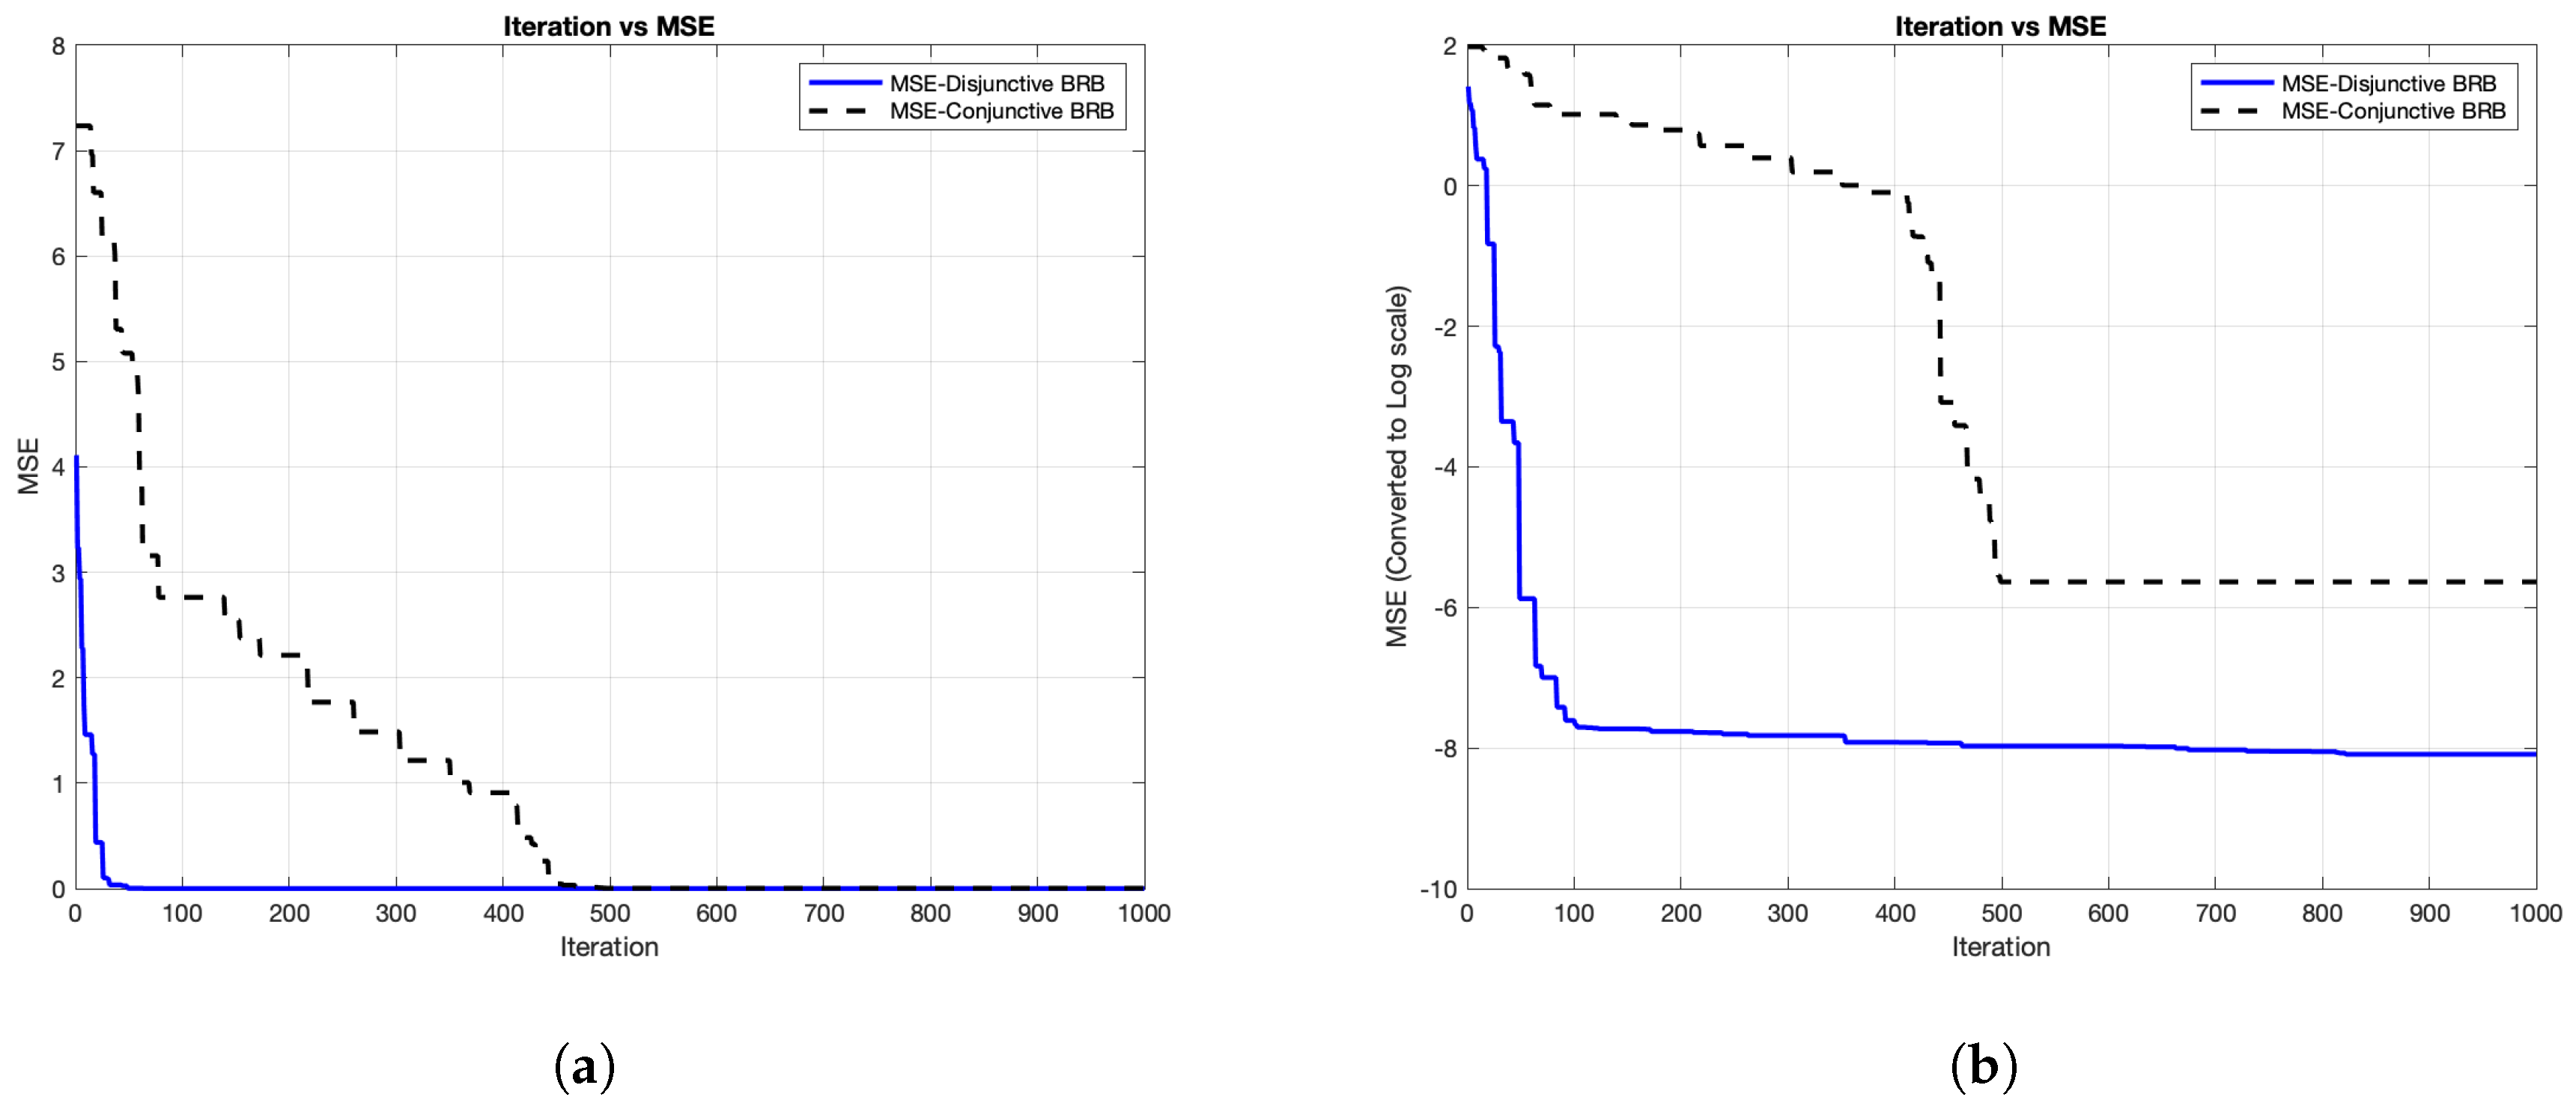
Figure 11.
Data vs learning time for the disjunctive BRB.

Table 1.
Details of Belief Rule-Based Expert System (BRBES)_CR.
| Antecedent Attributes | Consequent Attribute | |||||
|---|---|---|---|---|---|---|
| and | CR | |||||
| Referential Values | Big | Medium | Small | Big | Medium | Small |
| Utility Values | 1 | 0.5 | 0 | 1 | 0.75 | 0.1 |
Table 2.
Details of BRBES_F
| Antecedent Attributes | Consequent Attribute | |||||
|---|---|---|---|---|---|---|
| and | F | |||||
| Referential Values | Big | Medium | Small | Big | Medium | Small |
| Utility Values | 2 | 1 | 0 | 2 | 1 | 0.1 |
Table 3.
Initial BRB for disjunctive BRB.
| Rule ID | Rule Weight | X2 | X3 | X4 | X5 | Belief Degrees | ||
|---|---|---|---|---|---|---|---|---|
| 1 | 1 | H | H | H | H | 1 | 0 | 0 |
| 2 | 1 | M | M | M | M | 0 | 1 | 0 |
| 3 | 1 | L | L | L | L | 0 | 0 | 1 |
Table 4.
Initial Belief Rule Base for conjunctive BRB.
| Rule ID | Rule Weight | X2 | X3 | X4 | X5 | Belief Degrees | ||
|---|---|---|---|---|---|---|---|---|
| 1 | 1 | H | H | H | H | 1.000 | 0.000 | 0.000 |
| 2 | 1 | H | H | H | M | 0.328 | 0.672 | 0.000 |
| 3 | 1 | H | H | H | L | 0.000 | 0.647 | 0.353 |
| 4 | 1 | H | H | M | H | 0.921 | 0.079 | 0.000 |
| 5 | 1 | H | H | M | M | 0.248 | 0.752 | 0.000 |
| 6 | 1 | H | H | M | L | 0.000 | 0.568 | 0.432 |
| ⋮ | ⋮ | ⋮ | ⋮ | ⋮ | ⋮ | ⋮ | ⋮ | ⋮ |
| 28 | 1 | M | H | H | H | 0.888 | 0.112 | 0.000 |
| 29 | 1 | M | H | H | M | 0.216 | 0.784 | 0.000 |
| 30 | 1 | M | H | H | L | 0.000 | 0.535 | 0.465 |
| 31 | 1 | M | H | M | H | 0.809 | 0.191 | 0.000 |
| ⋮ | ⋮ | ⋮ | ⋮ | ⋮ | ⋮ | ⋮ | ⋮ | ⋮ |
| 80 | 1 | L | L | L | M | 0.000 | 0.680 | 0.320 |
| 81 | 1 | L | L | L | L | 0.000 | 0.000 | 1.000 |
Table 5.
Mean Square Error (MSE) for different kinds of BRBES using parameter optimization (PO) and structure optimization (SO) using BRBES-based adaptive Differential Evolution (BRBaDE), Adaptive Neuro Fuzzy Inference System (ANFIS), Artificial Neural Network (ANN), and the fmincon of Facebook training datasets.
| MSE | MSE | MSE | MSE | MSE | |
|---|---|---|---|---|---|
| Training Dataset | fminconBRBES | PO and SO Using BRBaDE for Conjunctive BRB | PO and SO Using BRBaDE for Disjunctive BRB | ANN | ANFIS |
| 1st fold | 0.000440 | 0.035870 | 0.000280 | 0.000790 | 0.000404 |
| 2nd fold | 0.000730 | 0.003570 | 0.000230 | 0.000544 | 0.000251 |
| 3rd fold | 0.000400 | 0.069020 | 0.000380 | 0.002400 | 0.000385 |
| 4th fold | 0.000320 | 0.036594 | 0.000260 | 0.002400 | 0.000291 |
| 5th fold | 0.000430 | 0.281800 | 0.000360 | 0.002500 | 0.000399 |
| Average | 0.000464 | 0.085371 | 0.000302 | 0.001727 | 0.000346 |
| Best value | 0.000320 | 0.003570 | 0.000230 | 0.000544 | 0.000251 |
Table 6.
MSE for different kinds of BRBES using PO and SO using BRBaDE, ANFIS, ANN, and the fmincon of testing datasets from Facebook.
Table 6.
MSE for different kinds of BRBES using PO and SO using BRBaDE, ANFIS, ANN, and the fmincon of testing datasets from Facebook.
| MSE | MSE | MSE | MSE | MSE | |
|---|---|---|---|---|---|
| Testing Dataset | fminconBRBES | PO and SO Using BRBaDE for Conjunctive BRB | PO and SO Using BRBaDE for Disjunctive BRB | ANN | ANFIS |
| 1st fold | 0.000080 | 0.003910 | 0.000080 | 0.001200 | 0.000087 |
| 2nd fold | 0.000730 | 0.001140 | 0.000770 | 0.007600 | 0.000685 |
| 3rd fold | 0.000280 | 0.001220 | 0.000290 | 0.000713 | 0.000197 |
| 4th fold | 0.000600 | 0.001140 | 0.000610 | 0.000820 | 0.000577 |
| 5th fold | 0.000160 | 0.004950 | 0.000200 | 0.000333 | 0.000140 |
| Average | 0.000370 | 0.002472 | 0.000390 | 0.002133 | 0.000337 |
| Best value | 0.000080 | 0.001140 | 0.000080 | 0.000333 | 0.000087 |
Table 7.
Comparison of root mean square error (RMSE), mean absolute percentage error (MAPE), and mean absolute error (MAE) for different kinds of BRBES using PO and SO using BRBaDE, ANFIS, ANN, and the fmincon of testing datasets from Facebook.
Table 7.
Comparison of root mean square error (RMSE), mean absolute percentage error (MAPE), and mean absolute error (MAE) for different kinds of BRBES using PO and SO using BRBaDE, ANFIS, ANN, and the fmincon of testing datasets from Facebook.
| Evaluation Matrix | fmincon BRBES | PO and SO Using BRBaDE for Disjunctive BRB | PO and SO Using BRBaDE for Conjunctive BRB | ANN | ANFIS |
|---|---|---|---|---|---|
| RMSE | 0.0089 | 0.0089 | 0.0625 | 0.0346 | 0.0093 |
| MAPE (%) | 0.4115 | 0.3945 | 5.3671 | 0.1616 | 0.1234 |
| MAE | 0.00433 | 0.00415 | 0.0572 | 0.0086 | 0.0063 |
Table 8.
Comparison of area under curve (AUC) of fmincon, Disjunctive BRB, Conjunctive BRB, ANN, and ANFIS. CI: 95% confidence interval.
Table 8.
Comparison of area under curve (AUC) of fmincon, Disjunctive BRB, Conjunctive BRB, ANN, and ANFIS. CI: 95% confidence interval.
| Results | fmincon | Disjunctive BRB | Conjunctive BRB | ANN | ANFIS |
|---|---|---|---|---|---|
| AUC | 0.50 | 0.68 | 0.29 | 0.57 | 0.53 |
| CI | 0.31–0.69 | 0.46–0.90 | 0.12–0.45 | 0.36–0.79 | 0.32–0.75 |
Table 9.
Model-complexity analysis for fmincon, Disjunctive BRB, Conjunctive BRB, ANFIS, and ANN.
| Model Selection Methods | fmincon BRBES | PO and SO Using BRBaDE for Disjunctive BRB | PO and SO Using RBaDE for Conjunctive BRB | ANN | ANFIS |
|---|---|---|---|---|---|
| AIC | −276.273 | −352.307 | −248.372 | −194.379 | −342.287 |
| BIC | −110.82 | −270.628 | −82.9185 | −87.5673 | −227.098 |
Table 10.
Initial structure of the disjunctive BRB for the Antecedent and Consequent part.
| Antecedent Attributes | Consequent Attribute | ||||||||||||||
|---|---|---|---|---|---|---|---|---|---|---|---|---|---|---|---|
| X2 | X3 | X4 | X5 | X1 | |||||||||||
| Attribute Weights | 1 | 1 | 1 | 1 | X1 | ||||||||||
| Referential Values | H | M | L | H | M | L | H | M | L | H | M | L | H | M | L |
| Utility Values | 55.032 | 27.037 | 0.959 | 99.010 | 65.076 | 31.068 | 39.060 | 19.80 | 0 | 338 | 170 | 0 | 1.25 | 1.13 | 1 |
Table 11.
Trained structure of the disjunctive BRB for the Antecedent and Consequent part.
| Antecedent Attributes | Consequent Attribute | ||||||||||||||||||
|---|---|---|---|---|---|---|---|---|---|---|---|---|---|---|---|---|---|---|---|
| X2 | X3 | X4 | X5 | X1 | |||||||||||||||
| Attribute Weights | 0.24 | 0.23 | 0.99 | 0.84 | X1 | ||||||||||||||
| Referential Values | H | HM | M | L | H | HM | M | L | H | HM | M | L | H | HM | M | L | H | M | L |
| Utility Values | 54.57 | 31.45 | 14.11 | 0 | 99.08 | 76.25 | 33.07 | 31.07 | 36 | 36 | 36 | 0 | 337.50 | 292.12 | 146.44 | 0 | 1.07 | 1.07 | 0.90 |
Table 12.
Trained BRB for disjunctive BRB.
| Rule ID | Rule Weight | X2 | X3 | X4 | X5 | Belief Degrees | ||
|---|---|---|---|---|---|---|---|---|
| 1 | 0.99 | H | H | H | H | 1 | 0.000 | 0.000 |
| 2 | 0.08 | HM | HM | HM | HM | 0.000 | 0.370 | 0.630 |
| 3 | 1.0 | M | M | M | M | 0.001 | 0.090 | 0.910 |
| 4 | 0.28 | L | L | L | L | 0.000 | 0.000 | 1.000 |
Table 13.
Comparison of root mean square error (RMSE), mean absolute percentage error (MAPE), and mean absolute error (MAE) for Disjunctive BRB using PO and SO using BRBaDE, ANN, and ANFIS of testing datasets from Measuring Data Centre Efficiency project.
Table 13.
Comparison of root mean square error (RMSE), mean absolute percentage error (MAPE), and mean absolute error (MAE) for Disjunctive BRB using PO and SO using BRBaDE, ANN, and ANFIS of testing datasets from Measuring Data Centre Efficiency project.
| Evaluation Matrix | PO and SO Using BRBaDE for Disjunctive BRB | ANN | ANFIS |
|---|---|---|---|
| RMSE | 0.0139 | 0.01418 | 0.0138 |
| MAPE (%) | 0.0035 | 0.0197 | 0.0074 |
| MAE | 0.0111 | 0.0115 | 0.0112 |
© 2019 by the authors. Licensee MDPI, Basel, Switzerland. This article is an open access article distributed under the terms and conditions of the Creative Commons Attribution (CC BY) license (http://creativecommons.org/licenses/by/4.0/).
Share and Cite
MDPI and ACS Style
Islam, R.U.; Ruci, X.; Hossain, M.S.; Andersson, K.; Kor, A.-L. Capacity Management of Hyperscale Data Centers Using Predictive Modelling. Energies 2019, 12, 3438. https://doi.org/10.3390/en12183438
AMA Style
Islam RU, Ruci X, Hossain MS, Andersson K, Kor A-L. Capacity Management of Hyperscale Data Centers Using Predictive Modelling. Energies. 2019; 12(18):3438. https://doi.org/10.3390/en12183438
Chicago/Turabian StyleIslam, Raihan Ul, Xhesika Ruci, Mohammad Shahadat Hossain, Karl Andersson, and Ah-Lian Kor. 2019. "Capacity Management of Hyperscale Data Centers Using Predictive Modelling" Energies 12, no. 18: 3438. https://doi.org/10.3390/en12183438
Note that from the first issue of 2016, this journal uses article numbers instead of page numbers. See further details here.