Article

Evaluation of Radiant Heating Ceiling Based on Energy and Thermal Comfort Criteria, Part II: A Numerical Study

Building Science Group (fbta), Institute for Building Design and Technology, Karlsruhe Institute of Technology (KIT), 76131 Karlsruhe, Germany
*
Author to whom correspondence should be addressed.
Energies 2019, 12(18), 3437; https://doi.org/10.3390/en12183437
Submission received: 29 July 2019 / Revised: 17 August 2019 / Accepted: 28 August 2019 / Published: 6 September 2019
(This article belongs to the Section G: Energy and Buildings)

Abstract

:
Large-surface radiant heating ceiling systems favor energy-efficient solutions on the heat generation side because of the relatively low temperature of the heat transfer medium. Additionally, their application in the renovation of existing buildings is relatively uncomplicated and requires minimal changes to the building’s construction. However, ASHRAE Standard-55 and former studies by Fanger indicated that among large-surface radiant systems, the highest percentage of dissatisfaction for an equal radiant temperature asymmetry (RTA) was reported for a warm ceiling. The maximum RTA of 4 K corresponding to 5% of dissatisfaction was suggested. In the first part of our study (subjective experiments), we have suggested the RTA of about 7.4 K if occupants have winter clothing (Safizadeh et al., 2018). However, former studies tested radiant ceiling systems at different temperatures in “neutral conditions” with a constant operative temperature, which rarely occurs in reality. Accordingly, the goal of this study is to evaluate the potential application of low-temperature radiant heating ceilings in a building with low- and high-performance facades using steady-state simulations with a coupled CFD–thermal comfort model and transient simulations using TRNSYS. Forty combinations of simulation scenarios including six ceiling surface temperatures (20 °C, 25 °C, 28 °C, 33 °C, 38 °C, and 45 °C), two low- and high-performance facades, two rooms with one and two facades, and distances of 1 m and 3 m to the window were examined. The findings of this research show that the supply water temperatures between 28–45 °C from a heat pump are ideal for a building with a high-performance façade. Additionally, the results suggest that ceiling temperatures as low as 20–25 °C in renovated buildings and 25–28 °C in a building with low-performance facades can provide optimal thermal sensations at most body parts. This study also proves that the PMV comfort model (Predicted Mean Vote index) is not at all a suitable model for the evaluation of radiant heating systems (especially if occupants have winter clothes), even if the air/operative temperature distribution near an occupant is uniform.

Graphical Abstract

1. Introduction

In comparison with conventional high-temperature radiators, large-surface radiant heating systems can operate at lower temperatures due to the larger proportion of radiant surface and may provide better thermal comfort due to less radiant temperature asymmetry [1]. The radiant heating floor system has been widely used in new and renovated buildings in Germany [2]. Although a floor heating system is a suitable system to be compared with an energy-efficient low-temperature heat pump and provide thermal comfort for the occupants, it requires rebuilding all floors, and thus is not proper for the renovation of existing buildings, particularly old buildings. An alternative to a floor heating system is the radiant heating ceiling system, which can either be plastered directly as a capillary system or mounted with suspended panels. Despite its potential application for renovation processes, Fanger et al. [3] claimed that warm ceilings can cause thermal comfort dissatisfaction because of radiant temperature asymmetry. They performed the experiments under a neutral condition, which is not the case in reality. Therefore, the comfort aspects of the warm ceiling in existing buildings with different insulation qualities need to be looked at closely. In a building, not only the ceiling temperature and its distance from the occupant influence the thermal satisfaction of the occupant, but the inner surface temperature of facades and the distance of the occupants to the façade matter as well [4]. For example, the poor quality of windows and the façade can lead to high radiant temperature asymmetry and the local dissatisfaction of some body parts [5,6]. It is of utmost importance to see how the radiant ceiling can influence the inner surface temperatures of the room due to direct radiation effects.
Fanger et al. [3] evaluated the effect of a warm ceiling (24 to 69 °C) and cooled window (0 to 25 °C) on the thermal dissatisfaction, separately. The radiant temperature asymmetries up to about 24 K and 18 K were created for a warm ceiling and cool window, respectively. In their experiments, the operative temperature at the height of 60 cm was kept about 24 °C, and occupants had summer clothing insulation. In the experiments, the effect that increasing the surface temperature of the ceiling and wall had on the operative temperature of the specific point was diminished by cooling the room air and other surfaces. The authors suggested the radiant temperature asymmetries of 4 K and 11 K as limits for applications of a warm ceiling and a cool window, respectively, which correspond to 5% of comfort dissatisfaction. A similar approach was applied in our former study [1]. However, the differences were: (i) participants had winter clothing insulation, (ii) the operative temperature corresponding to the neutral condition for winter clothing was set to about 20 °C, and (iii) the warm ceiling was tested together with the cool window. In opposite to the standard Fanger’s curve for ceiling systems [7], the subjective experimental results implied that the highest percentage of dissatisfaction was recorded at the lowest radiant temperature asymmetry. It is because, at this condition (minimum radiant temperature asymmetry and operative temperature of 20 °C), occupants felt cold at the extremities, which caused overall dissatisfaction. The minimum dissatisfaction was recorded for the ceiling temperatures of 33 °C and for both cool and warm facades when the radiant temperature asymmetry was about 7.4 K. Although the minimum percentage of dissatisfied occupants was 10%, occupants fairly felt neutral at all body parts, particularly in when the façade was well insulated. The criterion of 10% as a percentage of dissatisfaction for about neutral thermal sensation is between Fanger’s suggestion (5%) and the suggestion (20%) from Chrenko [8] and Heise et al. [9].
The aforementioned experimental studies evaluated the radiant ceiling heating in different radiant temperatures asymmetries and suggested some limits for maximum ceiling temperature; however, the results were explained based on “thermally neutral conditions”, which do not happen often in reality. Accordingly, this study aims to evaluate the potential application of the radiant heating ceiling system in existing buildings with low- and high-performance building envelopes based on energy and comfort criteria. For this purpose, we used the multi-node thermoregulation model and the advanced UCB thermal comfort model developed by the Center for the Built Environment (CBE) at the University of California, Berkeley [10]. The UCB thermal comfort model is capable of predicting the human response in non-uniform and asymmetry conditions. Additionally, this study addresses transient building energy simulations using TRNSYS for the evaluation of warm ceilings corresponding to different renovation and operation scenarios in the winter. Multizone building modeling (Type 56) was used to model the radiant ceiling consisting of capillary tubes.
The performed search through Google Scholar, Scopus, and Web of Science, unfortunately, did not give adequate literature about the evaluation of radiant heating ceilings based on the thermal comfort criteria using combined Computational fluid dynamics (CFD) and thermoregulation models. Some studies at CBE [11,12] used the UCB comfort model, yet without CFD to simulate the effect of the radiant ceiling systems and cool window on thermal comfort criteria, and they suggested new acceptable criteria for ceiling temperatures (10–50 °C). Tanabe et al. [13] combined the CFD model and their 65-node thermophysiological model to simulate the cool ceiling; however, they did not perform detailed thermal comfort and sensation analyses. A few recent studies used a coupled CFD and PMV model for the evaluation of a radiant heating ceiling panel together with a cool window [14,15] under winter conditions. However, the basic assumptions behind the PMV model and former studies [1,16,17] recommended not using the PMV model for non-uniform and asymmetric conditions.
The numerical simulations presented in Section 4 address challenges with the application of the warm ceiling in buildings with low- and high-performance facades and provide practical information about optimal ceiling temperatures in which maximum thermal comfort can be satisfied. Section 2 is allocated to describe the methods, Section 5 summarizes the key findings and the suggestions, and finally, limitations are given in Section 6.

2. Materials and Methods

2.1. Transient Energy Simulation

The building model was developed based on a multi-family house that stands for the typical building constructed in Germany between the years 1958–1968. Throughout this period, about 586,000 buildings were built, which constituted 19% of the total number of multi-family houses built between 1860–2009 in Germany [18]. An exemplary construction contains four floors. On each floor, there are two apartments that each has a gross floor area of 67.2 m2. An exemplary and a graphical representation of the multi-family house created in SketchUp software are shown in Figure 1.
For the purpose of energy simulations, some simplifications in comparison with the real building were done. First, simulations took into account of one side of the multi-family house (one apartment) due to their symmetric plan in which the adjacent wall is considered as adiabatic and the other three walls are exposed to ambient (Figure 1c). Secondly, in order to evaluate the pure impact of all considered scenarios, the building model did not take into account any heat gain from any other heat sources such as equipment, occupants, and solar radiation. For this assumption, the building orientation does not have any impact on solar gain. The building is 6.72 m wide and 10 m long, and each apartment is 2.5 m high. The total surface area of the external walls equals 223.2 m2, and the window area is 27.6 m2. In contrast to conventional methods of energy building simulations that use a single node for a building, in this study, the building was divided into three zones, representing the number of corresponding floors, with different thermal segments. This method facilitated the analysis of air temperature and operative temperature stratifications. These thermal air nodes were placed at the heights of 10 cm, 60 cm, and 175 cm from the floor, which reproduce the level of feet, the center of a seated person, and the head of a standing person.
It is assumed that the buildings are equipped with radiant heating systems made of capillary tubes. Due to higher heat transfer surface area and narrower distances between the tubes, capillary tubes have a better heat transfer performance and a more uniform temperature distribution than conventional pipes. The capillary tubes were placed above a conductive layer and under ceiling construction materials. Table 1 presents the properties of the radiant heating system consisting of capillary tubes.
Based on the experimental data from [2,19], the infiltration rate was established depending on the renovation scenario, and is presented in Table 2. Additionally, the air change rate of 0.5 (1/h) was considered for all scenarios. It is assumed that windows are opened every two hours, and each time, the period of the window opening is only sufficient to change the room air volume completely.

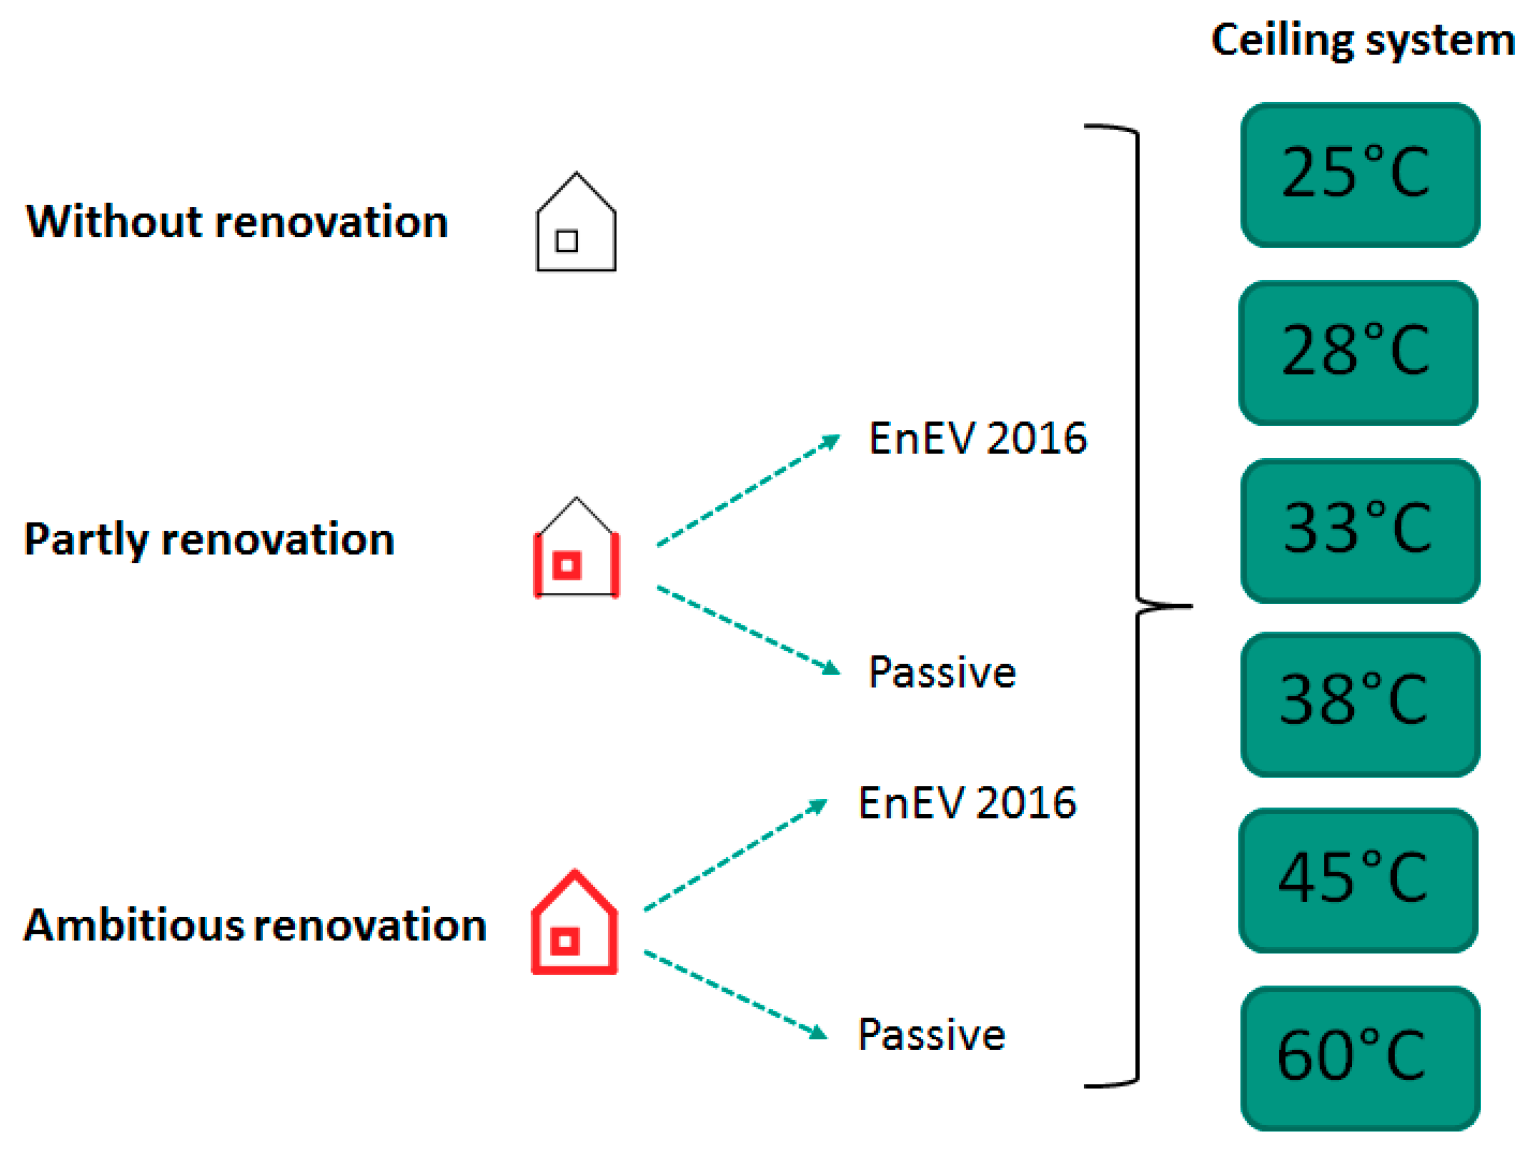
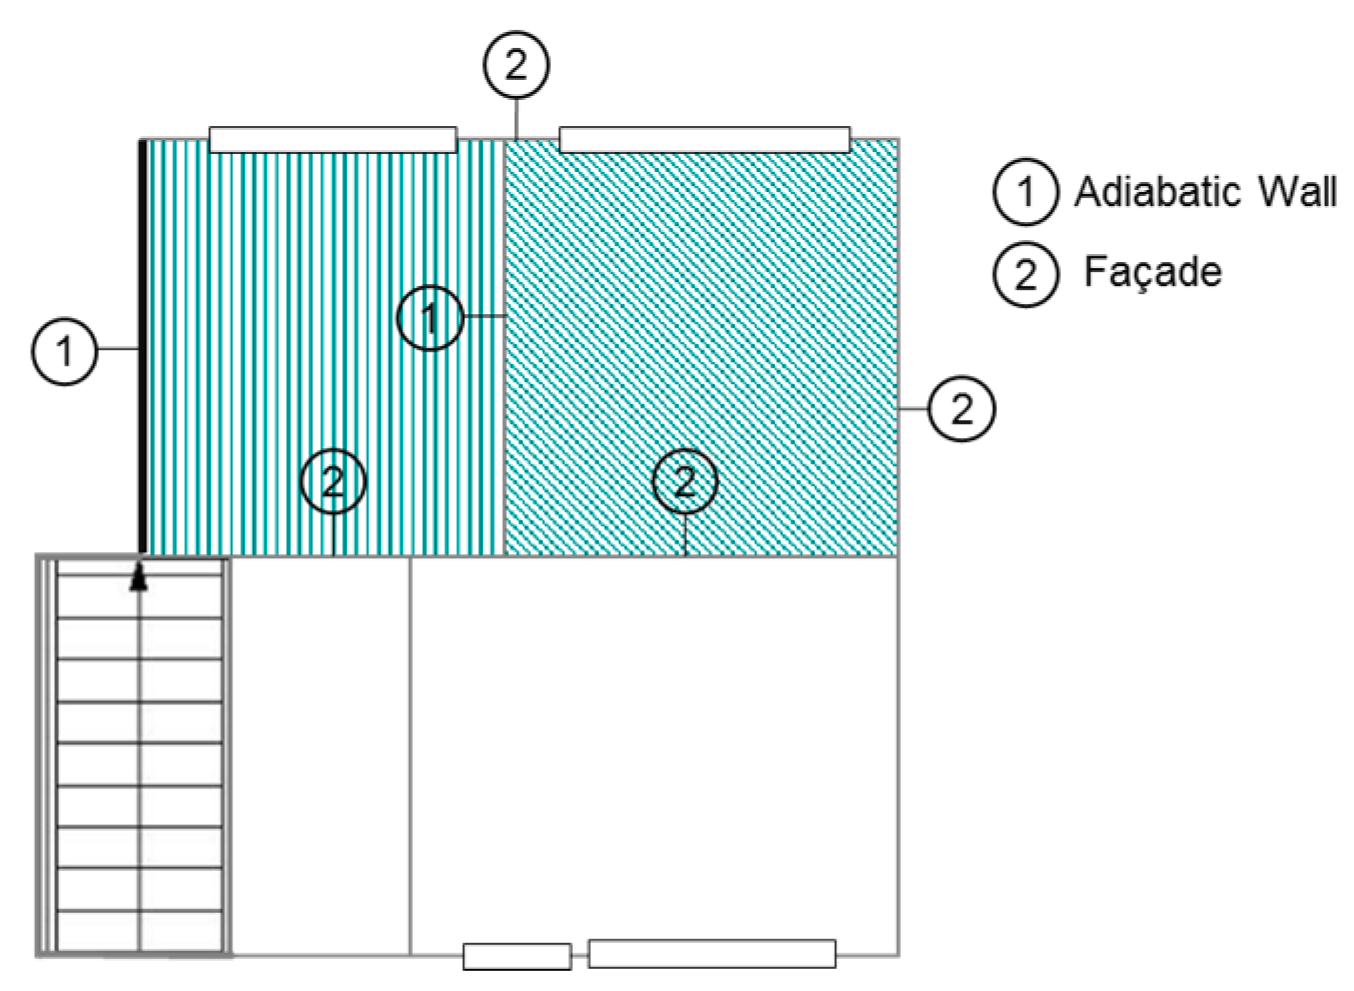
2.1.1. Heating and Renovation Scenarios

Figure 2 presents combinations of 30 scenarios for five different types of renovation and six operating temperatures used for the transient simulation of a radiant heating ceiling. The first scenario is a reference building that reproduces the real construction design described in Section 2.1, the second is a type of renovation, called partial renovation, which is regarded as a building construction with improved external walls’ insulations and windows’ quality, and the third is an elevated type of renovation called ambitious renovation, where the level of restoration is higher, affecting every surface of the building model. The simulations involving renovations were performed with respect to two energy-efficiency standards (EnEV 2016 and Passive House Standard) that define different U-values for materials used in the refurbishment. This included external and inner (ceiling and floor) walls, as well as the roof and windows. The U-values of the building model components together with the thermal heat capacities of the building envelope are presented in Table 3. For comparisons, since the heat capacities of insulation materials are negligible compared to the relatively high heat capacities of the existing building envelopes, the heat capacities of the building envelope for all types of renovation scenarios are equal to those from the reference building. In terms of the warm ceiling, the temperature of supply water ranges from 25 °C to 60 °C, where the upper limit represents the supply temperature of conventional radiators.

2.1.2. TRNSYS Simulation Model

The Multizone building modeling with Type 56 and its visual interface (TRNBuild) integrated into TRNSYS 17 facilitated the modeling of the radiant heating ceiling system based on the “active layer” model. The active layer was developed based on the properties given in Table 1. The operation mode of the radiant heating ceiling is subjected to an input heating signal, which is the operative temperature at a height of 60 cm from the floor, which is then compared to a set value of 20 °C with a dead band of 1 °C. This range of temperatures corresponds to the thermal sensation between “slightly cool” and “neutral” when the air velocity is about 0.1 m/s and the clo value is about 1. Thus, exceeding the upper or lower temperature limit resulted in sending the ‘off’ signal to the active layer system. The surface temperatures are taken to calculate the mean radiant temperature (MRT) using the following equation. Later, the operative temperature is calculated as an average value of room air temperature and MRT. TN is the Nth surface temperature in kelvins, and Fp-N is an angle between a person and surface N.
T m r t 4 = T 1 4 F p 1 + T 2 4 F p 2 + + T N 4 F p N

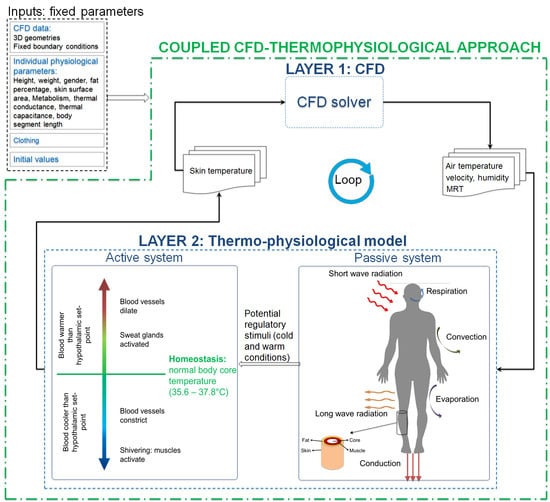
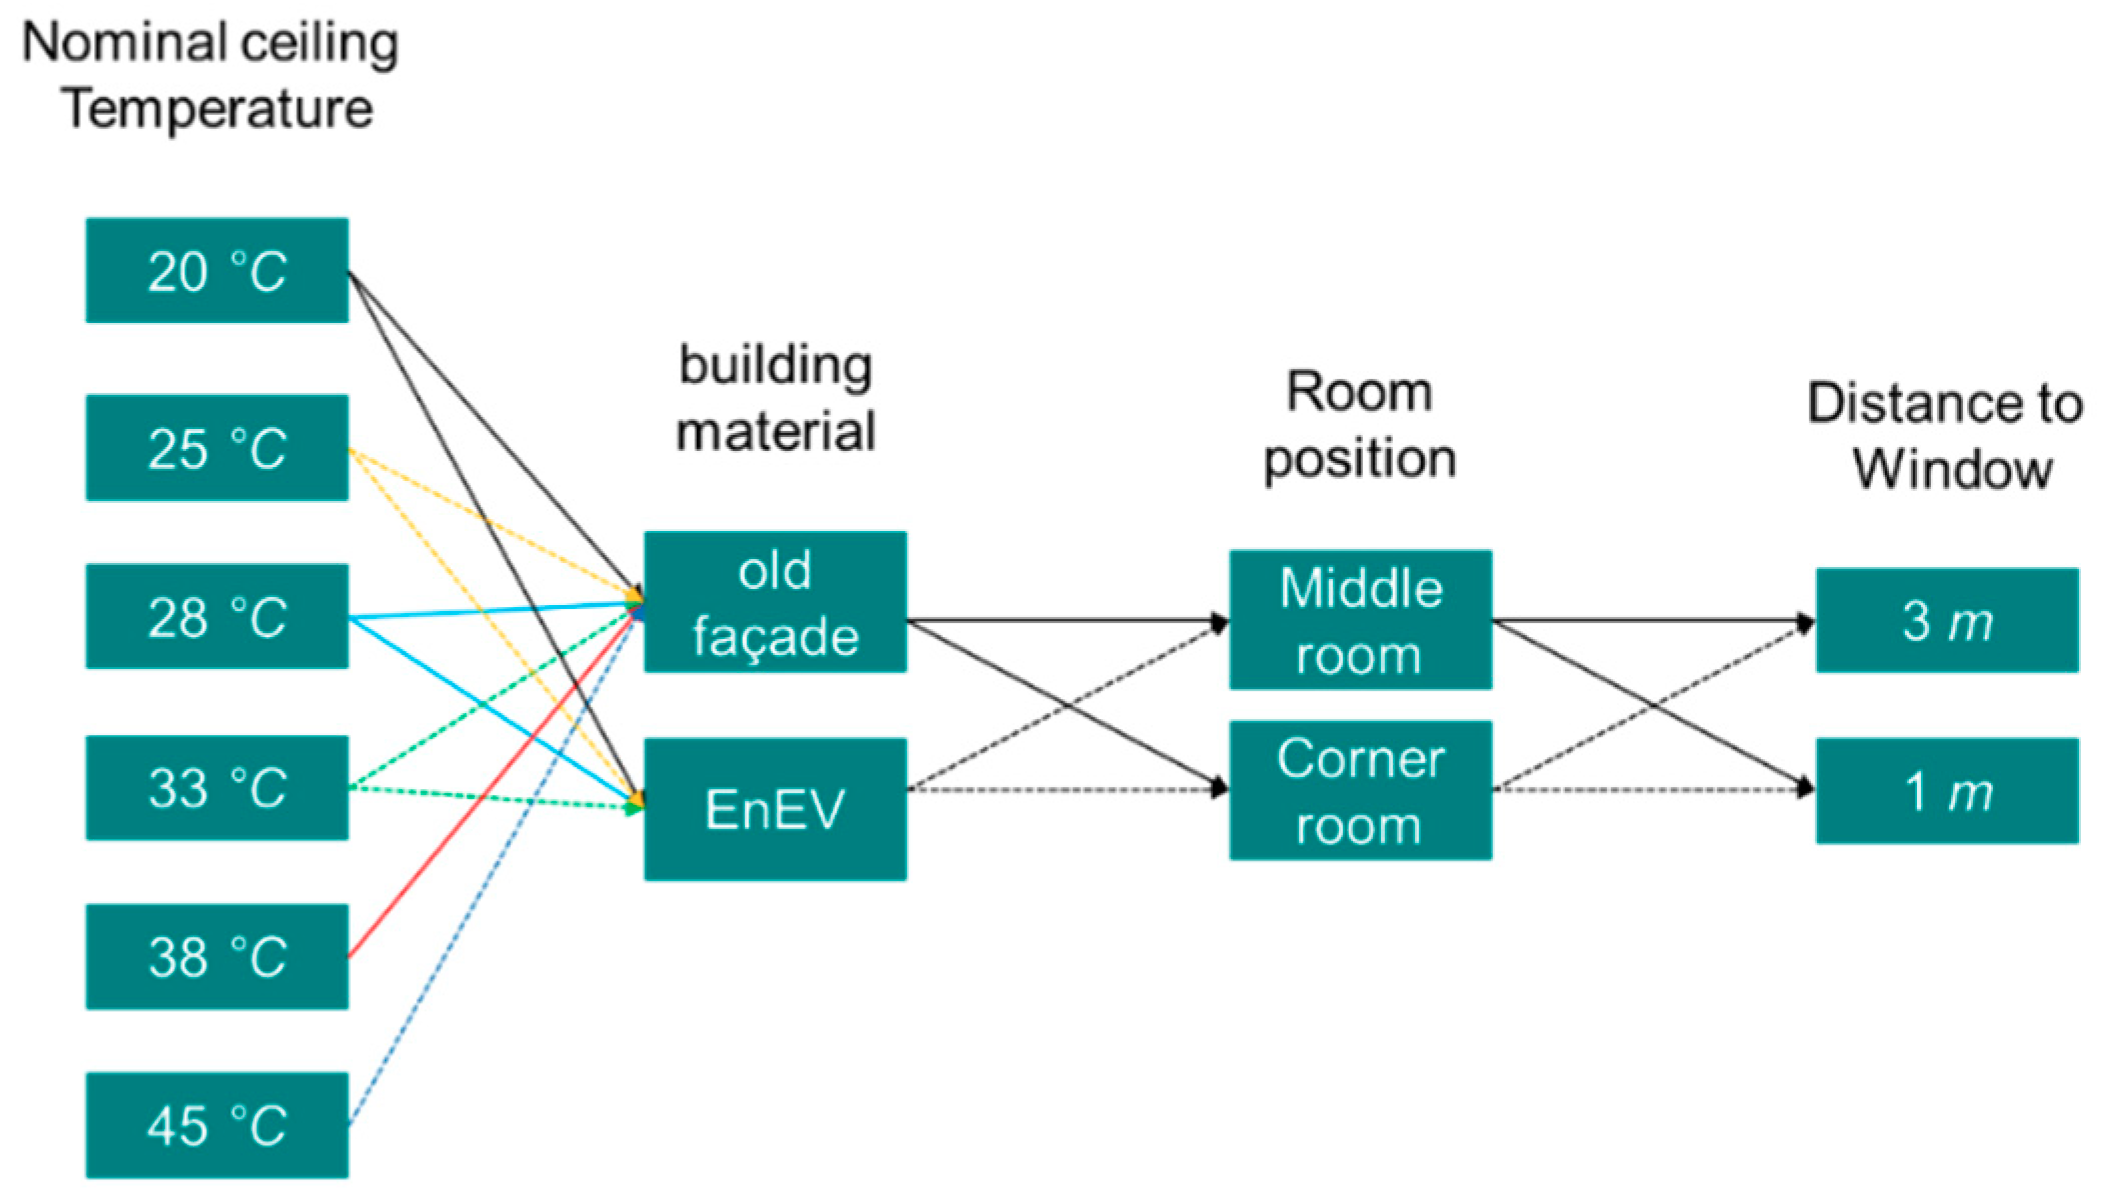
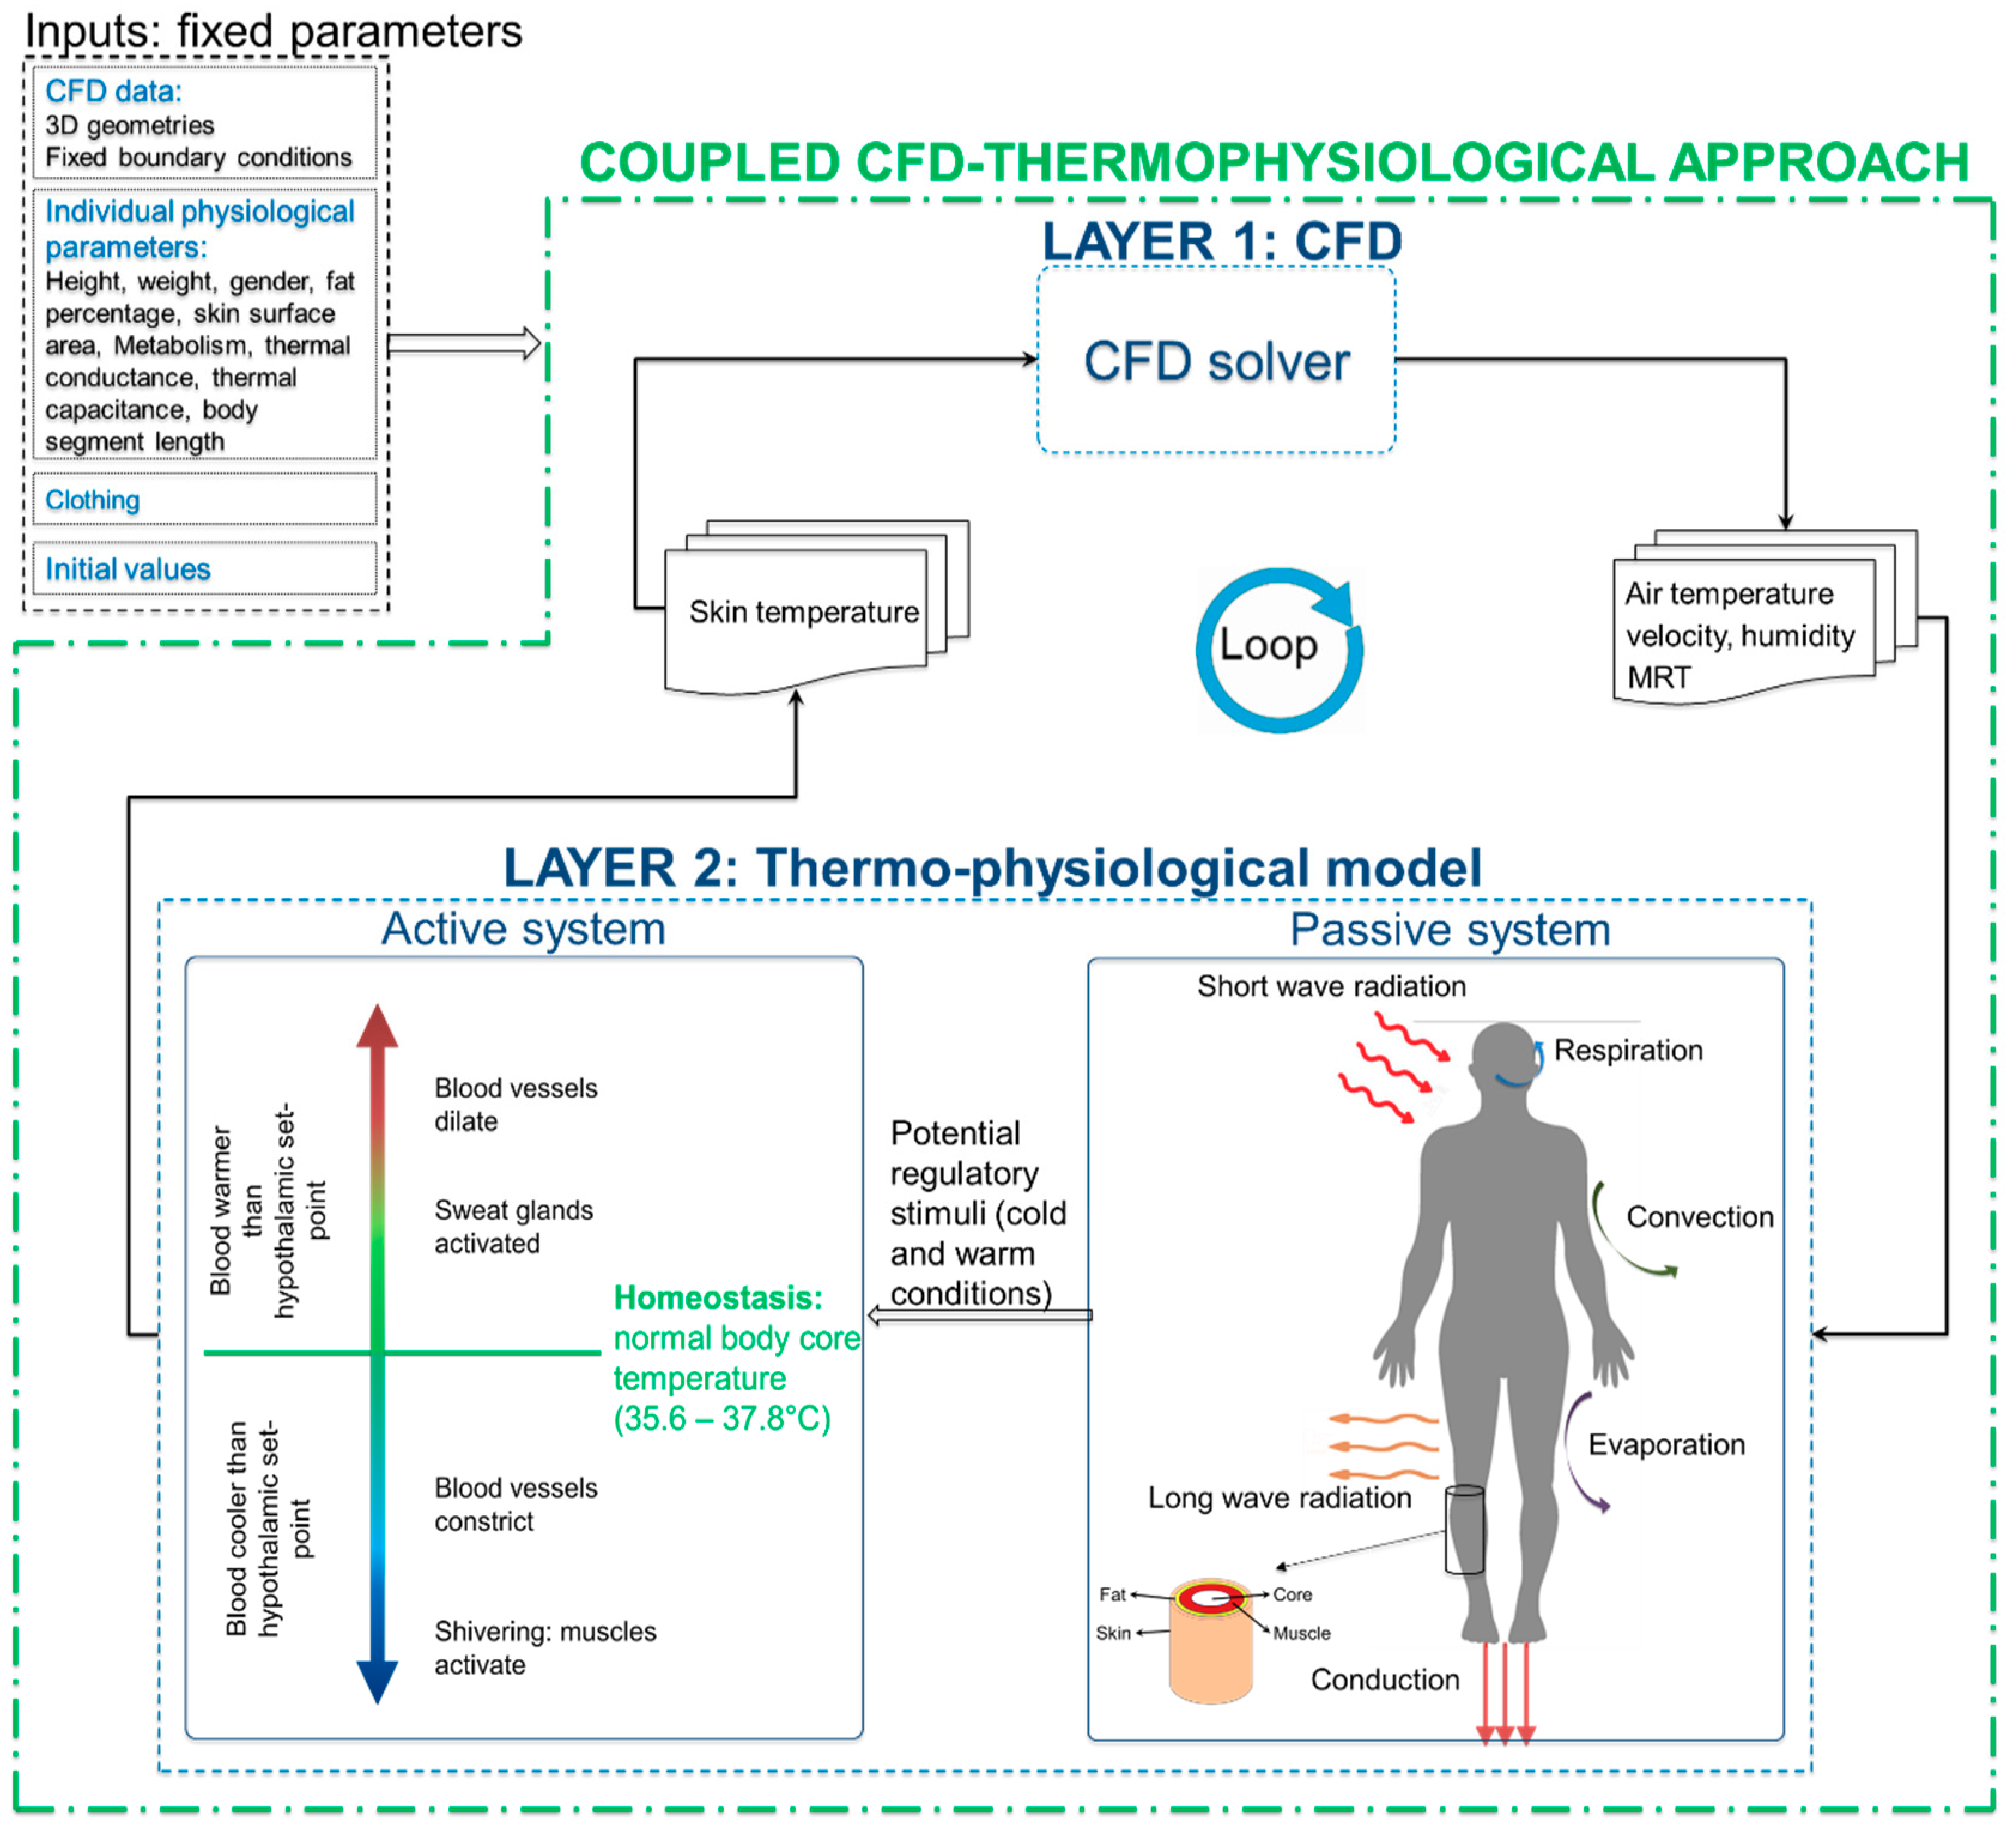
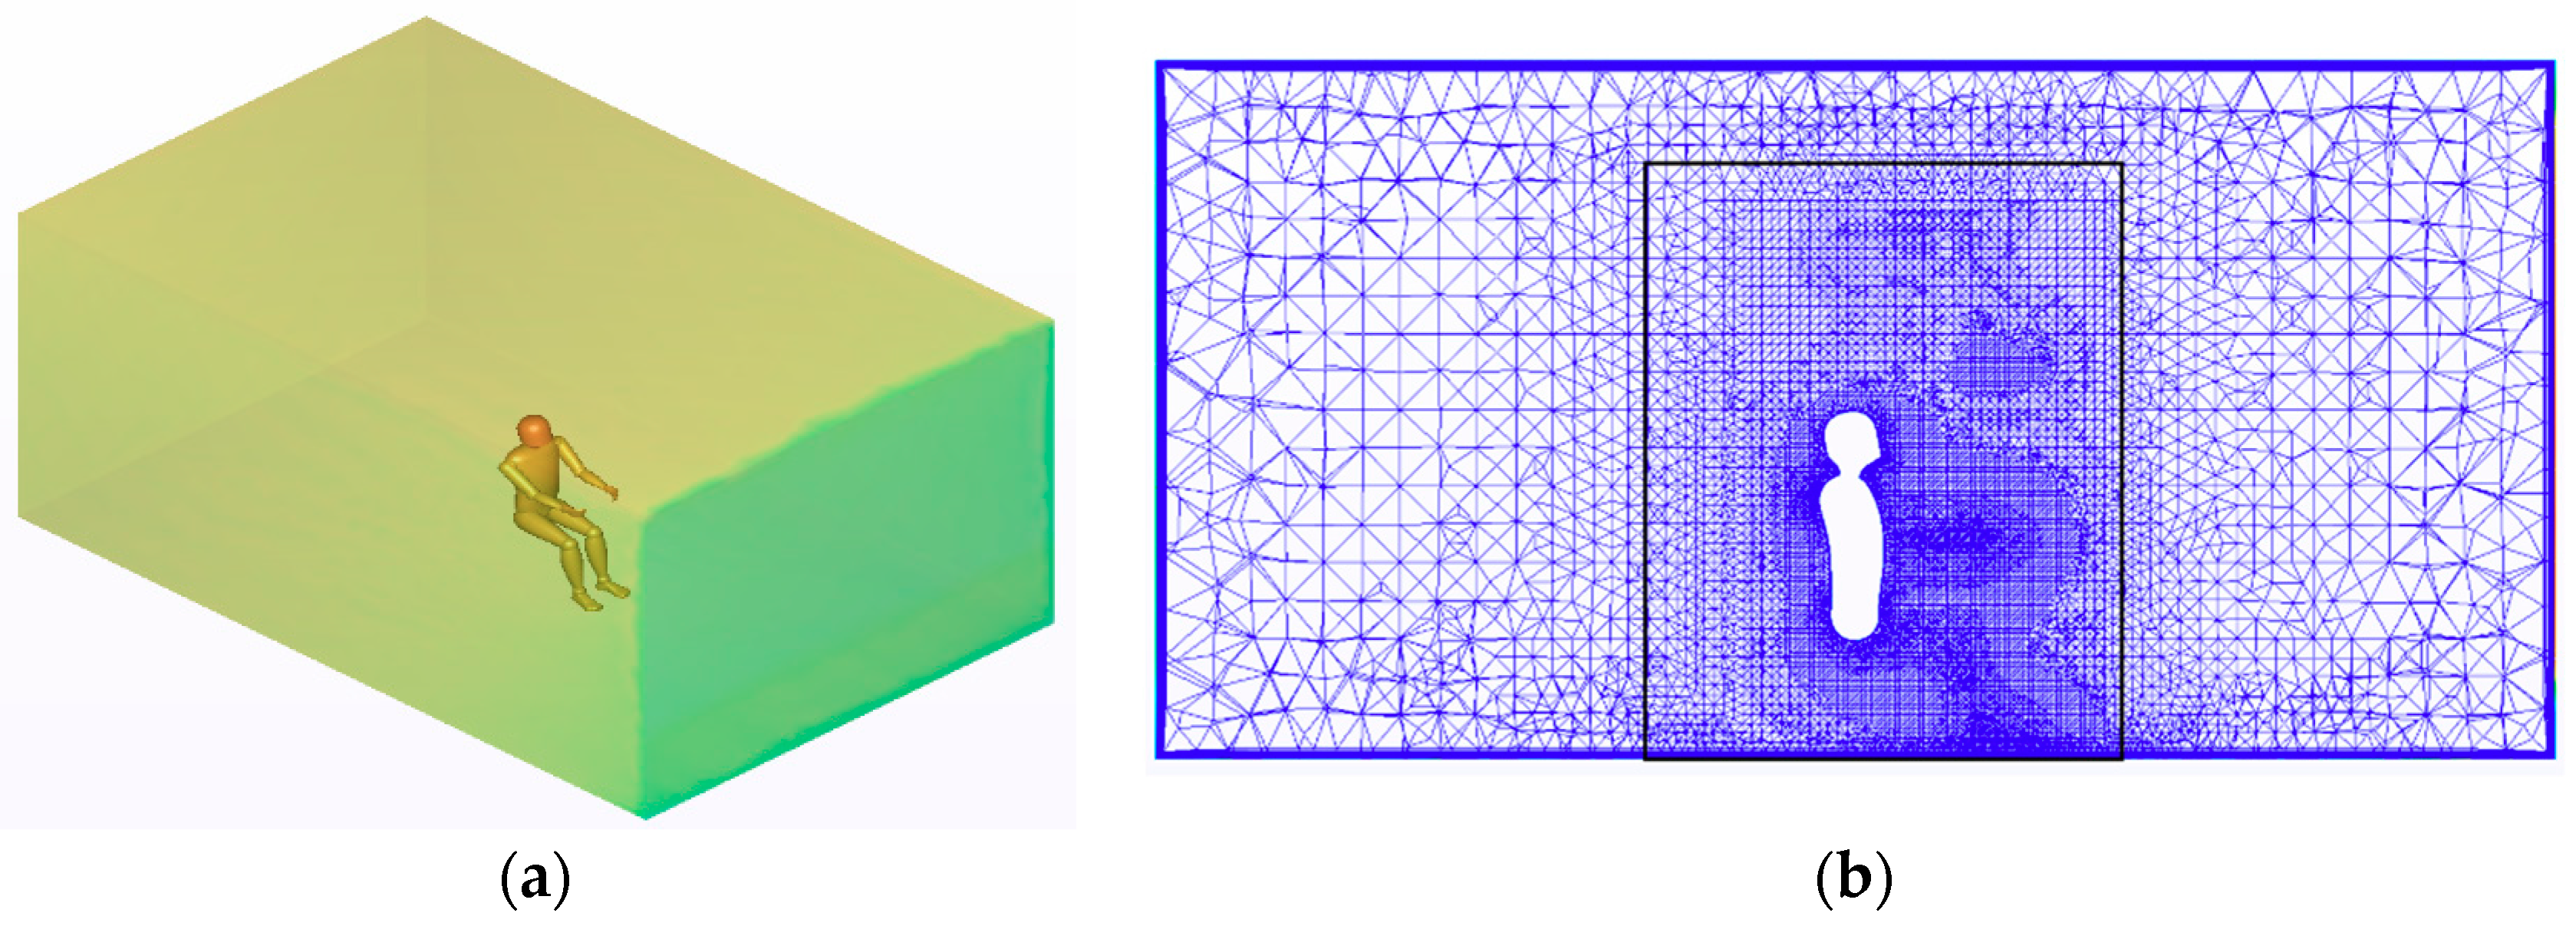
2.2. CFD–Thermoregulation Simulation

In this paper, while the transient simulations (TRNSYS) are performed to analyze the energy losses in a complete floor including all rooms, the CFD–thermoregulation model is proposed to evaluate the radiant heating ceiling based on detailed thermal comfort analyses. The main challenge in the evaluation of the radiant ceiling systems is the analysis of the thermal comfort criteria in asymmetric thermal environments created by the heating ceiling system. Therefore, it is necessary to consider the asymmetry analyses for the middle and corner rooms that respectively have one and two cool facades. Figure 3 presents an exemplary floor plan, including two rooms with two cool facades on the right and one cool façade on the left. The temperatures of the cool facades depend on the ceiling temperatures, outside air temperatures, and quality of the building envelope. In this study, two types of original and EnEV materials are considered for the building envelope. Figure 4 presents combinations of simulation scenarios that are used for the CFD–thermoregulation simulations. Since the distance of the thermal manikin to the cool facade is regarded as an important factor in thermal asymmetric analyses, two distances of 1 m and 3 m to the coolest façade, which integrates the cool window, are taken into account.
In these analyses, all the presented ceiling temperatures in Figure 4 were combined with the scenarios for the middle room. However, since the ceiling temperatures of 38 °C and 45 °C create very warm conditions in the room, for reducing the number of simulations, we ignored these two ceiling temperatures for the corner rooms in the EnEV scenario. Consequently, 40 combinations of scenarios were considered for the CFD analyses.

Coupled CFD–Thermoregulation Model
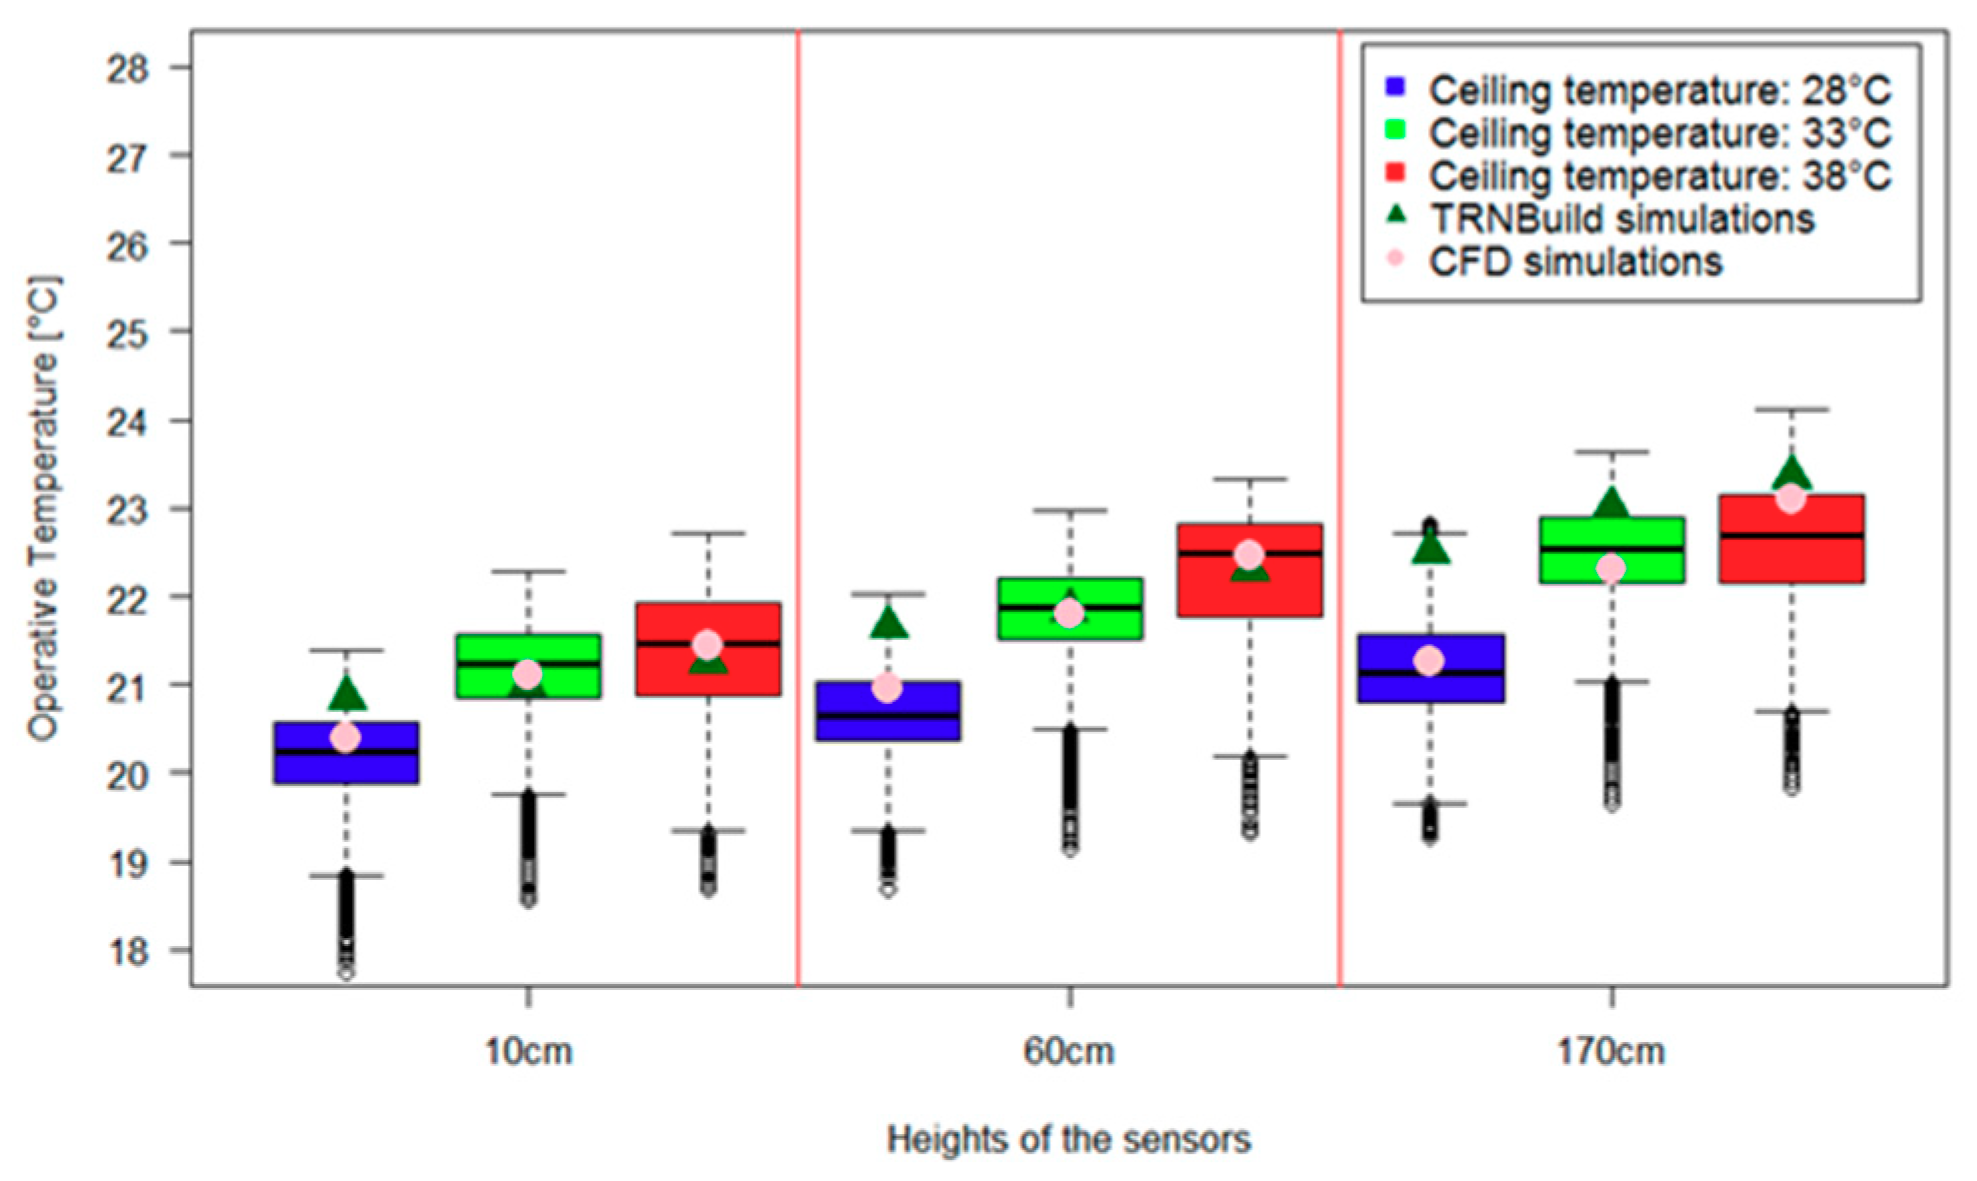
In order to evaluate the impact of the radiant ceiling on the thermal status of the human body and consequently its perceived thermal comfort, it is of utmost importance to develop a model that is able to simulate the thermal environment properties and at the same time the thermal status of a human subject. In this study, the technique of coupling CFD and thermoregulation was used. Here, the CFD solver simulates the thermal environment created by the warm ceiling, and the thermophysiological model predicts the human thermoregulatory responses to static, dynamic, uniform, and non-uniform surrounding thermal conditions. Figure 5 presents a detailed schematic of the methodology toward developing the coupled CFD and thermophysiological model for simulation of the environment, human, and thermal comfort responses. Based on this approach, the CFD solver calculates the thermal environmental parameters such as air temperature, velocity, humidity, and radiant temperature based on inputs specified by the user or calculated by the thermophysiological model. Thereafter, the thermophysiological model simulates the reaction of the human to these parameters, calculates the values of skin temperature at different body parts, and then returns these conditions to the CFD solver. The iterations and the exchange of data between the two models continue until convergence is reached, based on the fluctuation of skin temperature.
The thermophysiological model consists of passive and active systems. The passive system solves the first law of thermodynamics for each body part based on amounts of generated metabolic heat as well as body heat gains and losses due to convection, conduction, radiation, respiration, and evaporation effects. If the body core temperature decreases or increases beyond normal temperatures, the active system signals the thermoregulatory responses of the body such as sweating, shivering, blood flow, vasoconstriction, and vasodilatation.
CFD software from Autodesk® 2017 was used for steady-state simulations; then, a Python script processed the simulation results in order to define the optimal air temperatures for the microclimate of each of the 16 body parts, and finally, the UCB Berkeley Comfort Model simulated the thermophysiology and perceived thermal comfort of a male person. The virtual thermal manikin in the CFD and UCB model was developed based on a standard male person with 1.75 m height, 75 kg weight, and 13% fat. The UCB model used a nine-point scale to analyze the local and overall thermal sensation, in which it varies from “very cold, −4” to “neutral, 0”, to “very hot, +4”. Similarly, it used a nine-point scale for perceived comfort, in which −4 = “very uncomfortable”, −2 = “uncomfortable”, −0 = “just uncomfortable”, +0 = “just comfortable”, +2 = “comfortable”, and +4 = “very comfortable” [10]. Python is used as an interface program to analyze and process the outputs from the CFD and UCB models, as well as activate them to create loops between them. A detailed explanation of the analyses of local microclimates and mesh analyses are presented in a thesis conducted in the Building Science Group (fbta) at the Karlsruhe Institute of Technology (KIT) [21].
CFD simulations were developed using the SST k-omega turbulence model with the maximum y+ (dimensionless wall distance) value of 8.9 at the room surfaces and 0.7 at the manikin surfaces. This model is a two-equation eddy viscosity model and a hybrid model that combines Wilcox k-omega and the k-epsilon models. Wilcox k-omega is well suited for simulation of flow near surfaces where high shear stress exists, and the k-epsilon model is suitable for the simulation of flow in the regions away from the surface. Therefore, the SST k-omega model is a proper turbulence model for the case that the air velocity in the room and particularly near human and room surfaces is very low. For higher accuracy and at the same time optimizing the number of mesh elements, the fluid domain was divided into two sub-domains: a small domain around the virtual manikin, and a bigger domain between the first domain and the room boundaries (Figure 6b). In the small domain, a mesh growth rate of 1.1, and in the bigger domain, a growth rate of 1.3 were considered as optimal values after some trial and errors. Near the surfaces, 10 prism layers were considered for increasing the accuracy of the convection and radiation heat transfer mechanisms. In total, 3,558,761 and 3,975,839 mesh elements in the fluid domain were defined for the two scenarios of 1 and 3 m.

3. Data Validation

In this study, the TNRSYS and steady-state CFD simulations were validated against experimental data acquired in an indoor test facility (called LOBSTER) located at the Karlsruhe Institute of Technology (KIT), Germany. For the TRNSYS simulations, it was critical to validate the active layer model and the concept of stratification introduced in Type 56. The test facility consists of two rooms, each with dimensions of 6 m long, 4 m wide, and 2.55 m tall. The single room has a window with dimensions of 3.9 × 2.15 m2, and is positioned 80 cm above the floor, facing north. Inside each room, sensors were placed at heights of 10 cm, 60 cm, and 170 cm to measure the physical properties of the indoor air. In each wall of the test facility, there is a controlled radiant system installed, which gives the ability to define different surfaces temperatures for each individual wall. A detailed description of the test facility was reported by Wagner et al. [22].
For each simulation, the temperature of the ceiling was set to either 28 °C, 33 °C, or 38 °C; the temperatures of the remaining surfaces were set to a constant level of 20 °C. Figure 7 presents a comparison of the obtained values from the TRNBuild and CFD simulations with the collected experimental data (operative temperatures) related to three ceiling temperatures and three sensors’ heights. As shown, the majority of results from the TRNBuild and CFD simulations correspond well to the real experimental outcome. The temperature results are within the range presented in the figures above. Due to modeling assumptions, there is a slight difference at higher heights for the TRNBuild simulations. Nevertheless, the results show that two aspects are working properly in the building simulation model: the vertical stratification and active layer, which directly represent the radiant heating system installed in the building.

4. Results and Discussion

4.1. Transient Energy Simulation

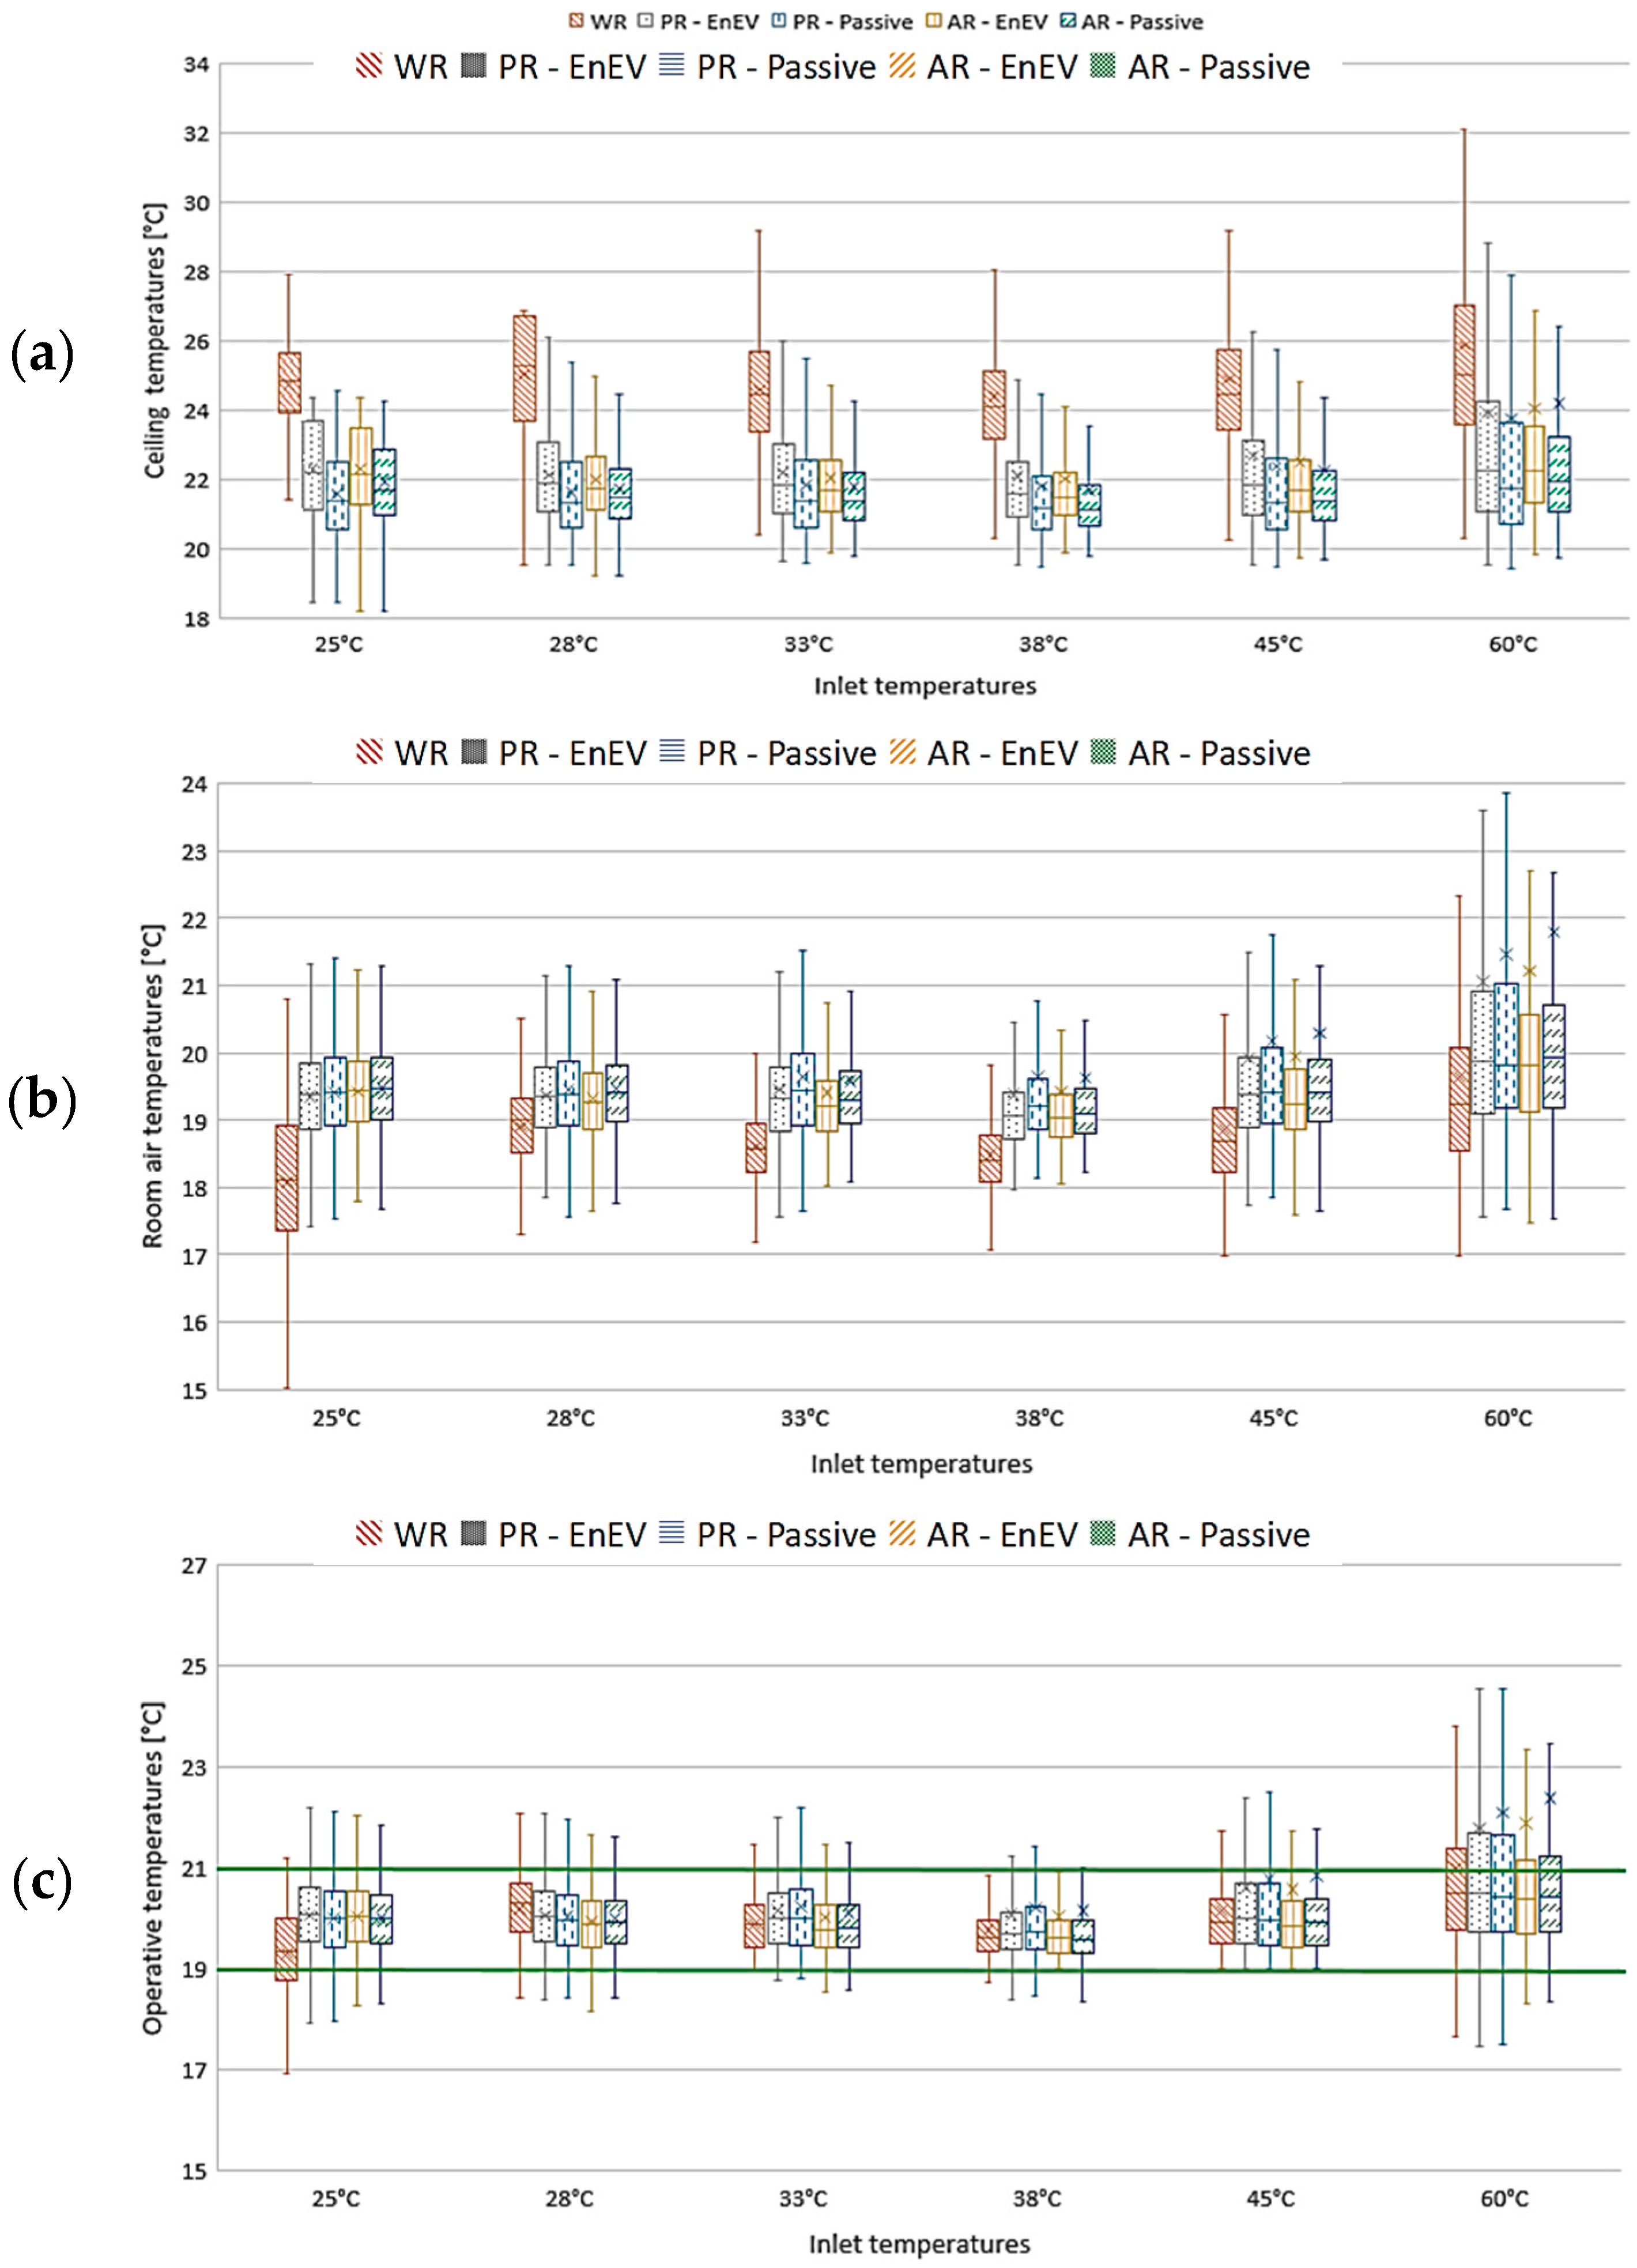
4.1.1. Room Conditions Corresponding to the Scenarios

Figure 8a–c present the simulation results of the radiant ceiling, room air, and room operative temperatures corresponding to different supply water temperatures and renovation scenarios (see Figure 2). Figure 8 indicates that the supply water temperatures and the control mode of operation influence the surface temperature of the ceiling. The variation of the ceiling temperatures is stronger for higher supply water temperatures and particularly for buildings with low-performance materials (WR). In contrast, the small ceiling temperature variation can be seen for renovated buildings with the ideal supply water temperatures between 28–45 °C. The variation is minimum for the supply water temperature of 38 °C. The value of the ceiling temperature for these ideal supply water temperatures lies between 21–29 °C for a reference building without renovation and 20–24 °C for a building with the ambitious passive house renovation.
In comparison with the reference building, the high-performance building envelope in renovated buildings results in fewer heat losses through the facades and higher inner surface temperatures of the external walls and windows. Consequently, as seen in Figure 8b in renovated buildings, a supply water temperature as low as 25 °C can result in desired operative temperatures. However, in a reference building with poor insulation and relatively high heat losses, the supply water temperature of 25 °C cannot satisfy the minimum operative temperature (19 °C).
Furthermore, Figure 8b shows that the fluctuation of operative temperature is notable when the supply water temperature is higher than 45 °C. It can be explained by the following: for high supply water temperatures, the high thermal capacity of the ceiling holds a high amount of energy at relatively high surface temperatures, and the heating ceiling continues to heat the room for a relatively long period, even if the heating mode is previously terminated. This causes the room air and operative temperatures to increase beyond the limit. When the operative temperature drops under the desired minimum, the warm water is supplied to the system, and the ceiling surface temperature for high supply water temperatures rises very fast. The fast increase of the ceiling temperature and a long period of heating in the off-period result in high operative temperature fluctuations. In contrast, if the water supply temperature is between 28–45 °C, the on- and off-periods are more balanced, and the ceiling temperature closely follows the supply water temperature. In order to improve the dynamic behavior of the radiant ceiling systems, especially for high supply water temperatures, more sophisticated control systems — for example, conventional Proportional–Integral–Derivative (PID) or advanced Model Predictive Control (MPC) controllers — can be applied.
Although radiant heating ceilings in the majority of scenarios—particularly scenarios with supply water temperatures between 28–45 °C—provide desired operative temperatures in all scenarios, median ceiling temperatures for the reference buildings are about 2–4 °C higher than the scenarios with renovations. The higher operating temperatures result in increased energy consumption in the heating supply system and higher energy loss through a low-performance envelope in the reference building. Additionally, the results imply that a ceiling heating that is integrated into a reference building with a low-performance envelope is not able to reach the desired range of operative temperatures if the supply water temperature is below 28 °C. In contrast, when it comes to the other renovation scenarios, such as partial renovation (PR) and ambitious renovation (AR), it can be seen that even with the lower inlet temperatures, such as 25–33 °C, the desired operative temperatures can be satisfied. Undesirably, in these solutions, the change of inlet temperature to either 45 °C or 60 °C causes relatively high fluctuations for the operative and air temperatures, which results in the instantaneous deregulation of the thermal comfort conditions. This might be seen by the large range of the upper whisker presented on the box plot chart, and by the average temperature value being considerably above the median value.

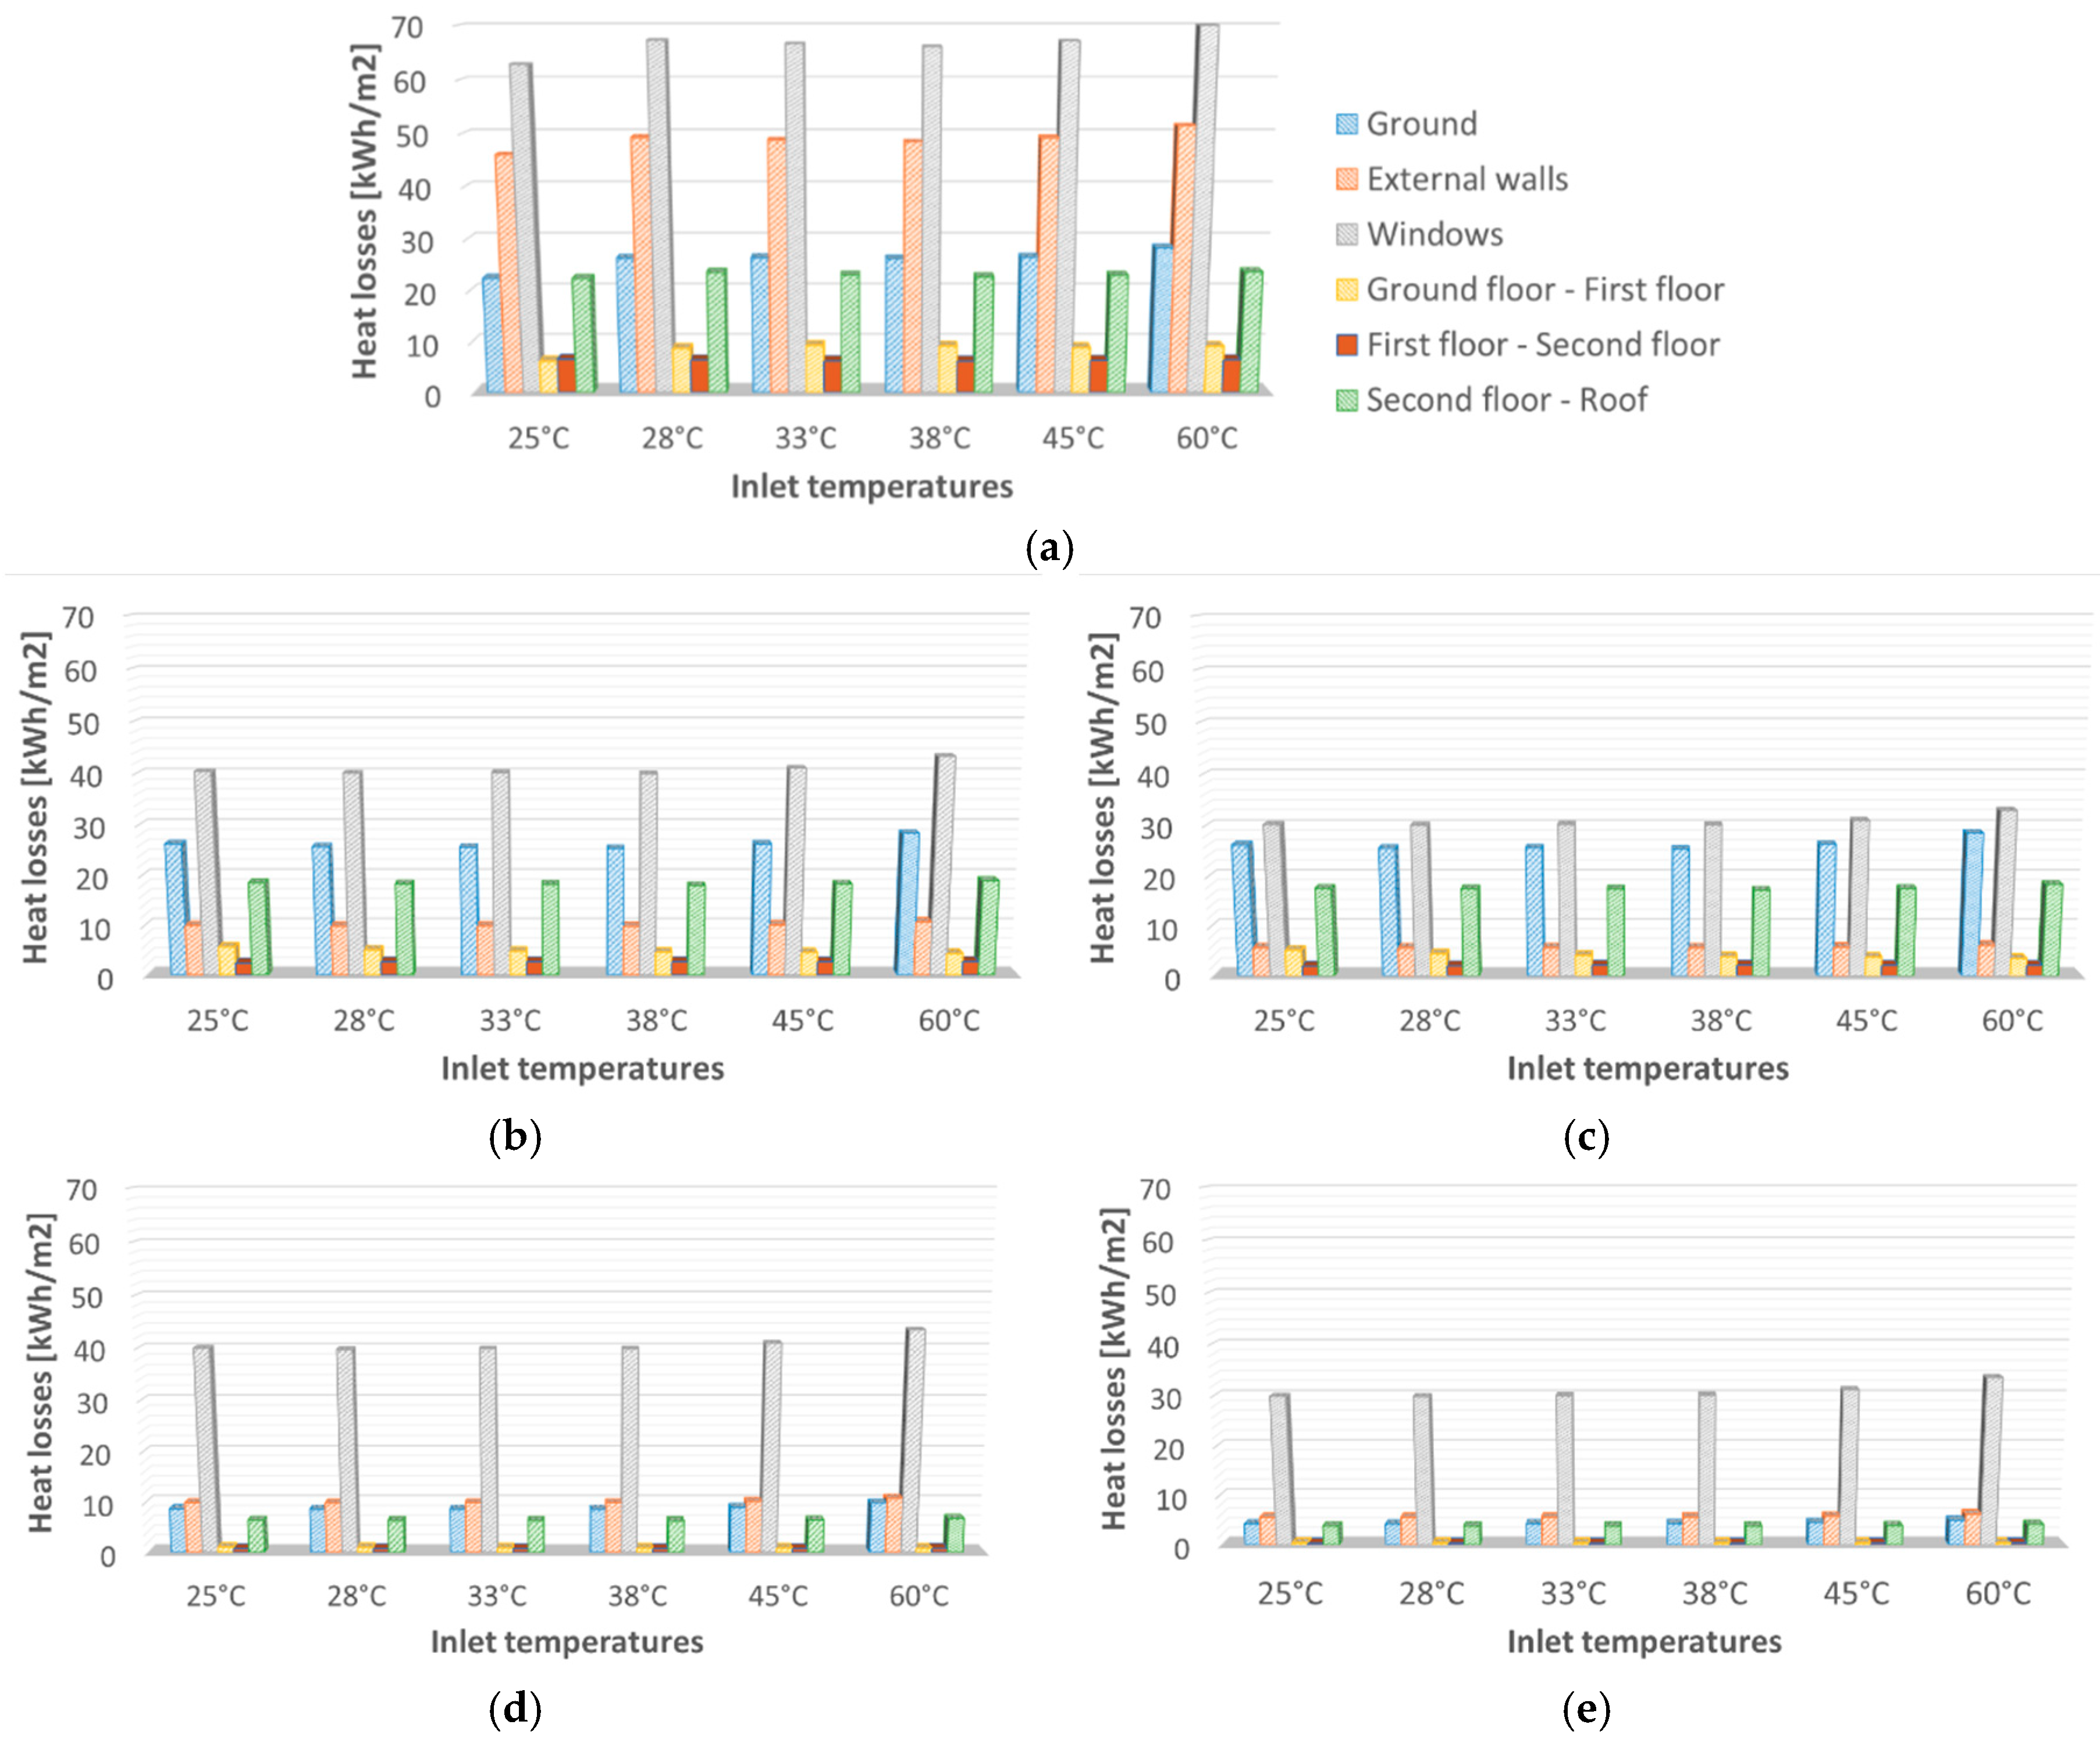
4.1.2. Heat Losses and Energy Consumption

While speaking about energy performance, issues such as the overall heat losses and the primary energy consumption are worth being considered. In Figure 9a–e, the visualization of the heat losses for different renovation scenarios is presented. The analysis of the heat losses indicates that they can be significantly reduced if the building envelope, particularly the facades, are well insulated. For the reference building presented in Figure 9a, the highest losses occur for the windows followed by external walls, reaching the level of 70 kWh/m2 and 40 kWh/m2 in a winter period, respectively. However, these losses can be reduced almost twice for windows and four times for external walls by implementing the EnEV standard, where the U-value of the window and the external walls are changed from 3 W/m2·K to 1.3 W/m2·K and 1.4 W/m2·K to 0.25 W/m2·K (see Figure 9b). If the two ambitious renovation scenarios are considered, namely ambitious renovation (EnEV) and ambitious renovation (Passive House), the losses can be significantly reduced (see Figure 9d–e). The high amount of heat loss between the second floor–roof area and ground–first floor in the reference building is noticeable. Therefore, it is of utmost importance to provide well-insulated materials to reduce heat losses. These heat losses have been minimized in ambitious scenarios of EnEV and Passive House renovations. There is also a minor heat exchange between the floors; however, by renovating the building area, they can be almost eliminated.

4.2. Coupled CFD–Thermoregulation Simulation-Based Thermal Comfort
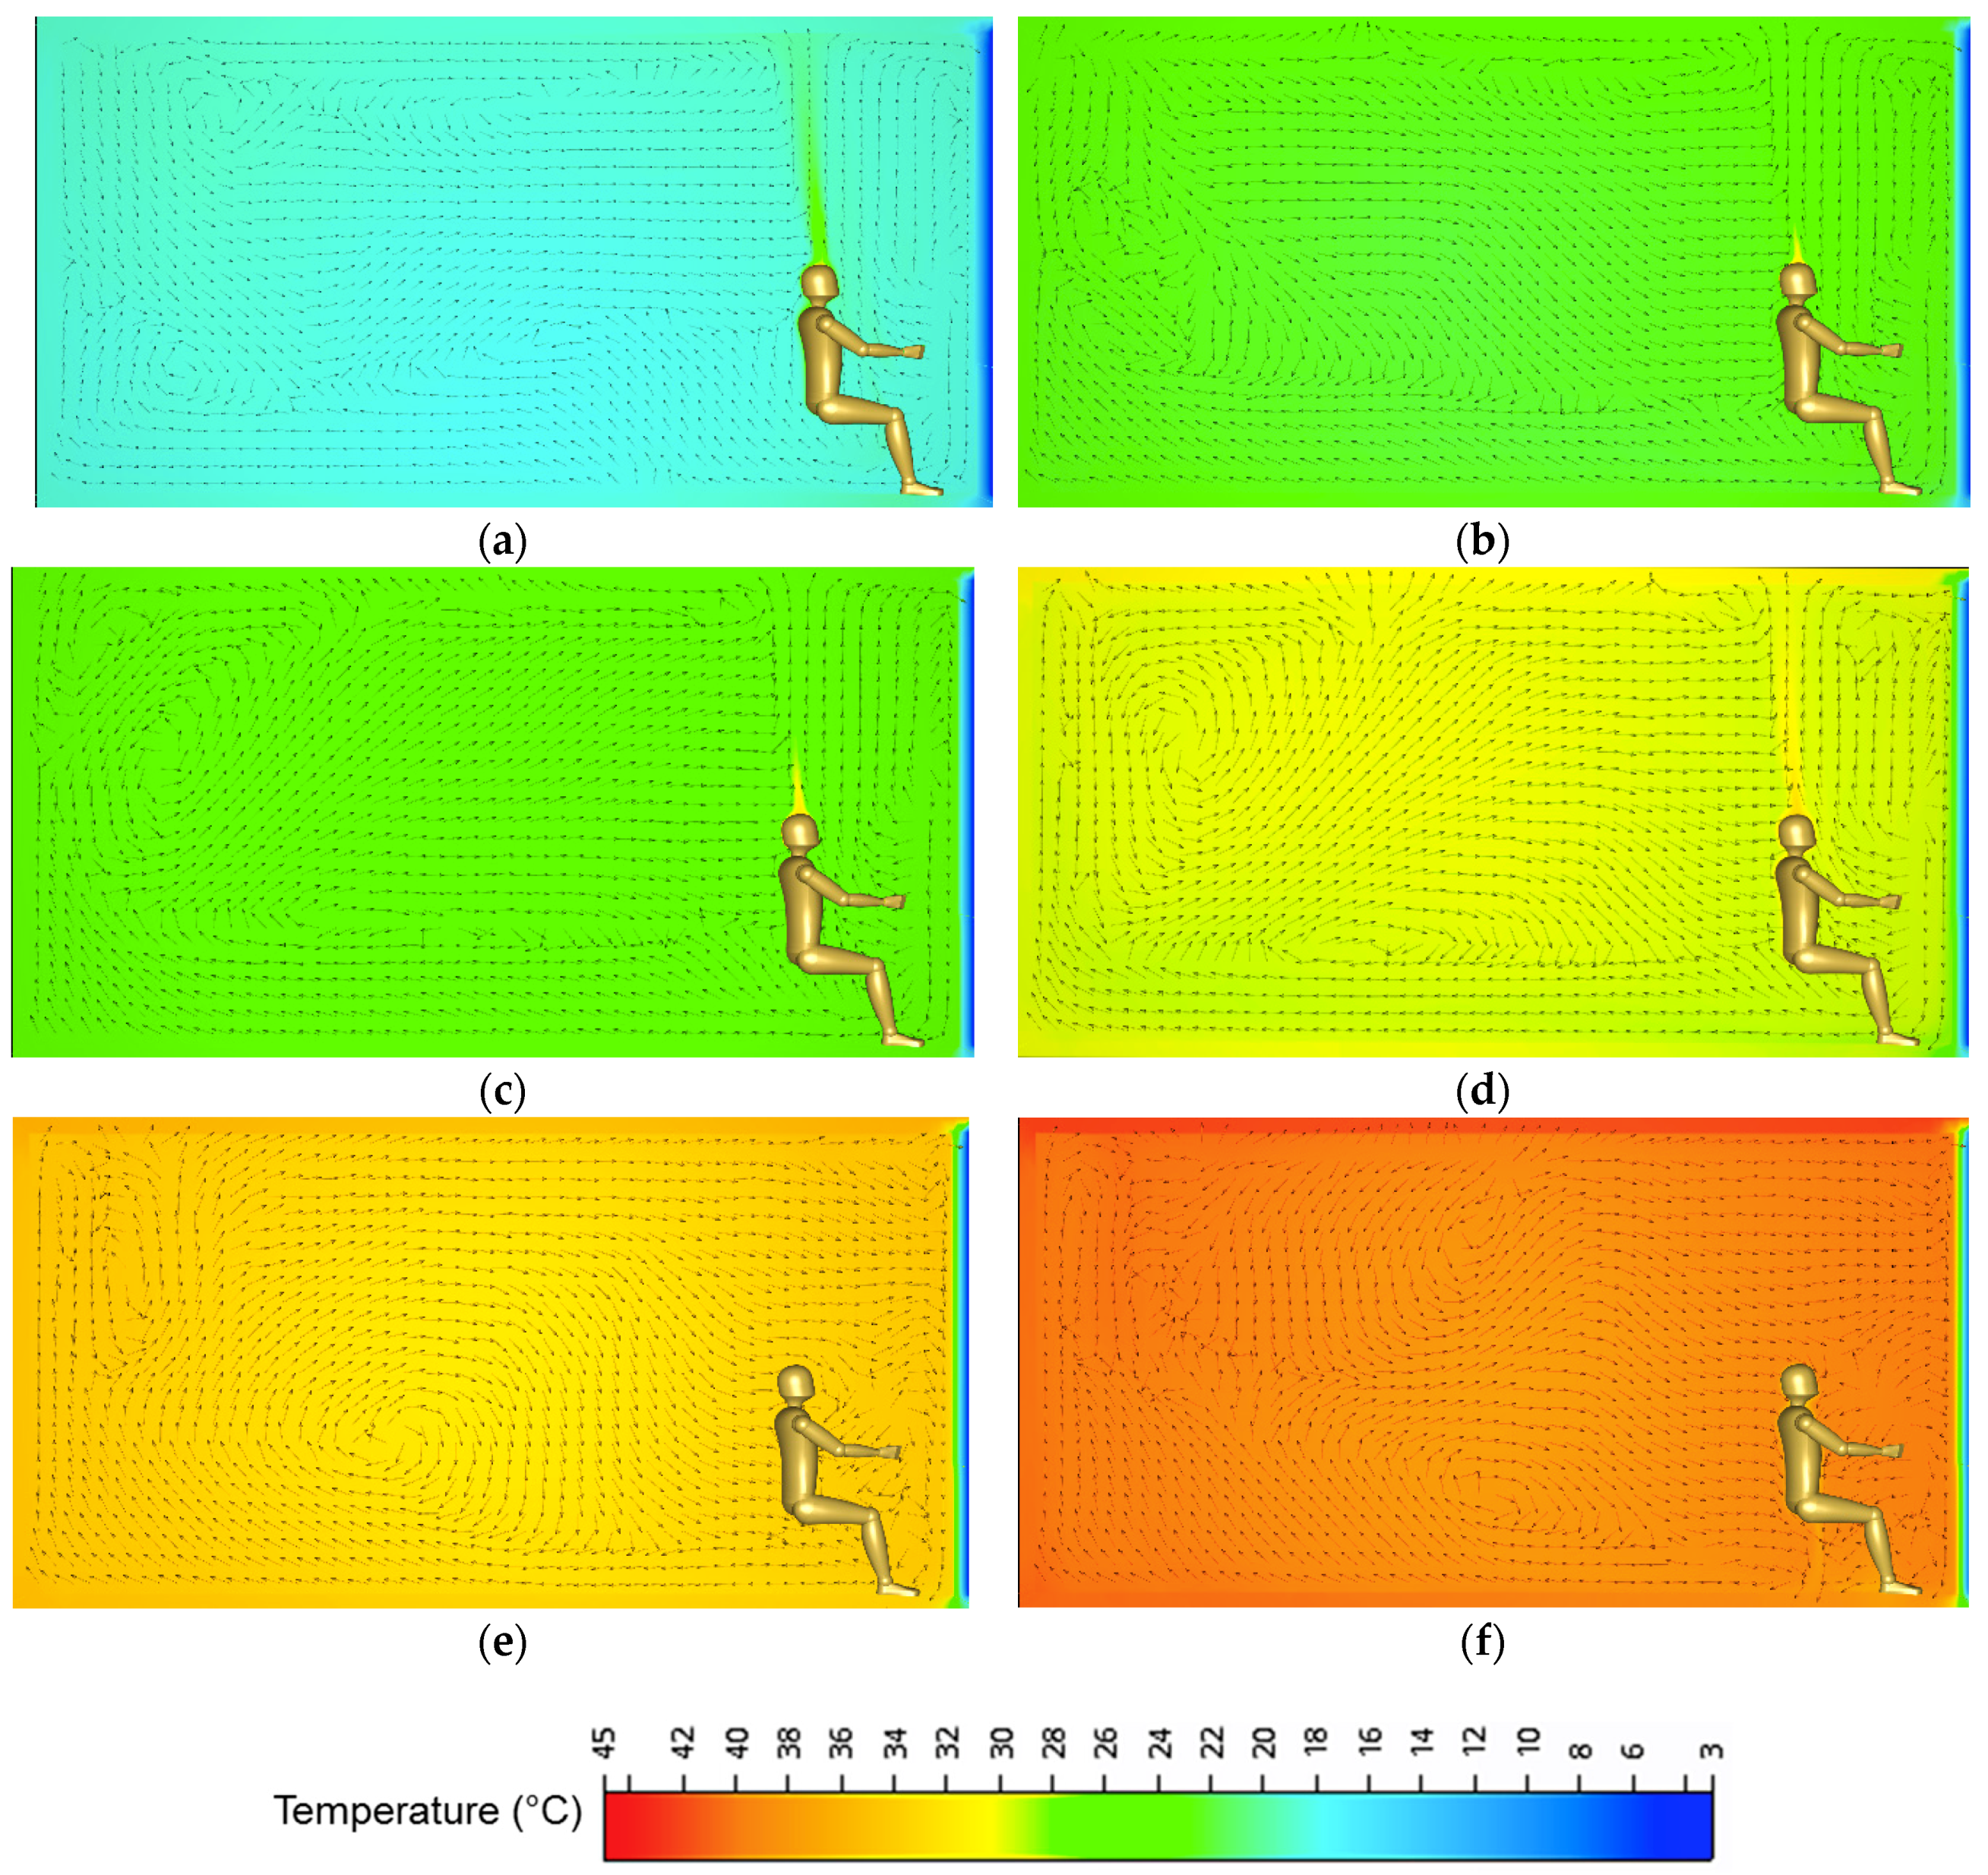
4.2.1. CFD Analyses

The temperature and velocity fields of the numerical simulations for six ceiling temperatures between 20–45 °C in the scenario with one cool façade are presented in Figure 10 and Figure 11. As seen in Figure 10, the air temperature stratification corresponding to all ceiling temperatures is negligible. In contrast to the conventional high-temperature radiators in which radiators directly heat the indoor air through the dominant convection process, the large warm ceiling heats other room surfaces through direct radiation, and later, the warm surfaces in the room almost heat the indoor air volume from all directions, causing almost uniform air temperature. The results are consistent with our experimental findings that the temperature stratification is negligible for the radiant heating ceiling (see Figure 7), and are against the general understanding that the radiant heating ceiling systems cause high-temperature stratification in which cold air is trapped at lower heights, and warm air stays at higher heights. Interestingly, as the floor receives radiation from the ceiling directly and is therefore slightly warm, the draught from the cool window is limited. The floor temperature and consequently the room air temperature can be lower if the floor is not adiabatic and loses heat to the ground [23] (see limitations in Section 6).
Figure 11 implies that the ceiling temperature can influence the form of air circulation in a room. As seen, the plume from the virtual thermal manikin is strong at low room air and ceiling temperatures. The plume moves from the human to the ceiling and then travels on the ceiling surface and drops on the cool window or when it meets another air stream from another wall. In contrast, there is no plume from the human when the ceiling and room air temperatures are higher than the surface temperature of the virtual manikin.
Figure 12 and Figure 13 present the air temperatures at six selected body-limb locations related to different ceiling temperatures, quality of facades, and the position of the manikin for the middle and corner rooms, respectively. The air temperatures were acquired at specific points in microclimates of the body limbs in which the gradient of air temperature at these points is less than 0.1 K [24]. As seen, the air temperatures at the different body parts for all scenarios are about the same. The highest air temperatures belong to the head and back, whereas the coolest air temperature belongs to the feet. The results indicate that the position of the manikin in each building type has a minimum impact on the air temperatures. Improving the quality of the building envelope (based on the EnEV standard, Table 3) results in increased air temperatures, and is noticeable specifically for the corner room.

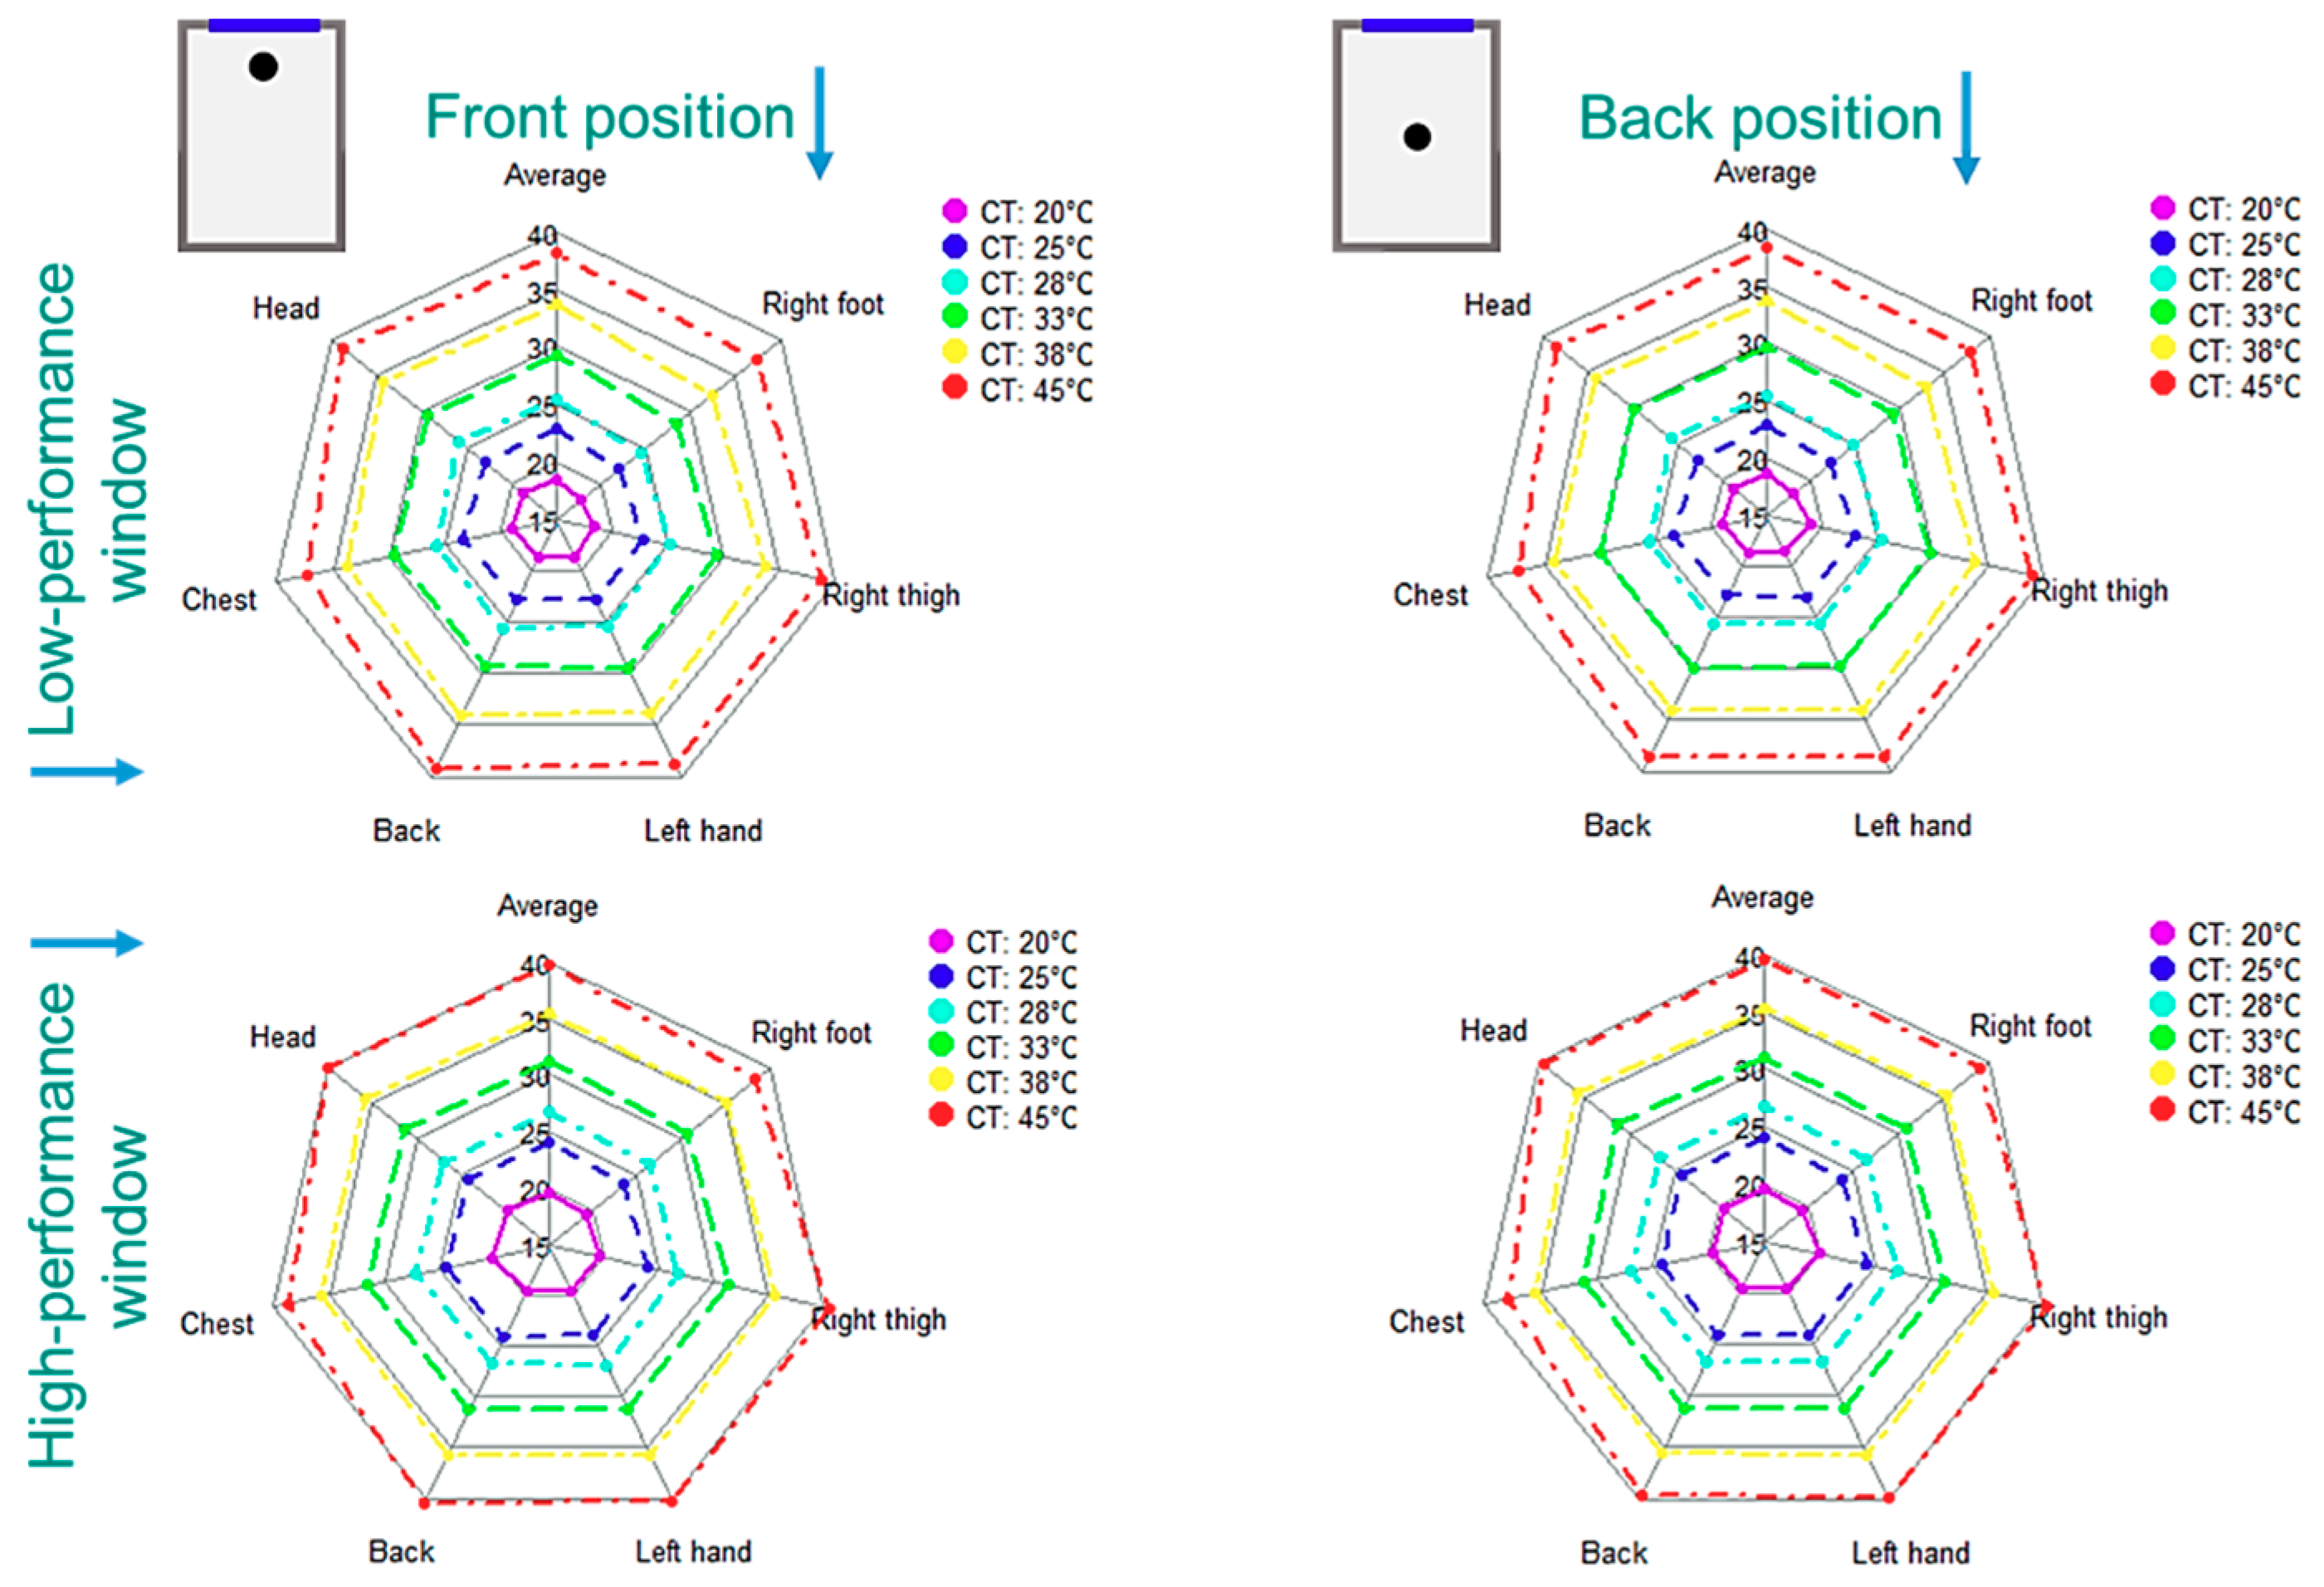
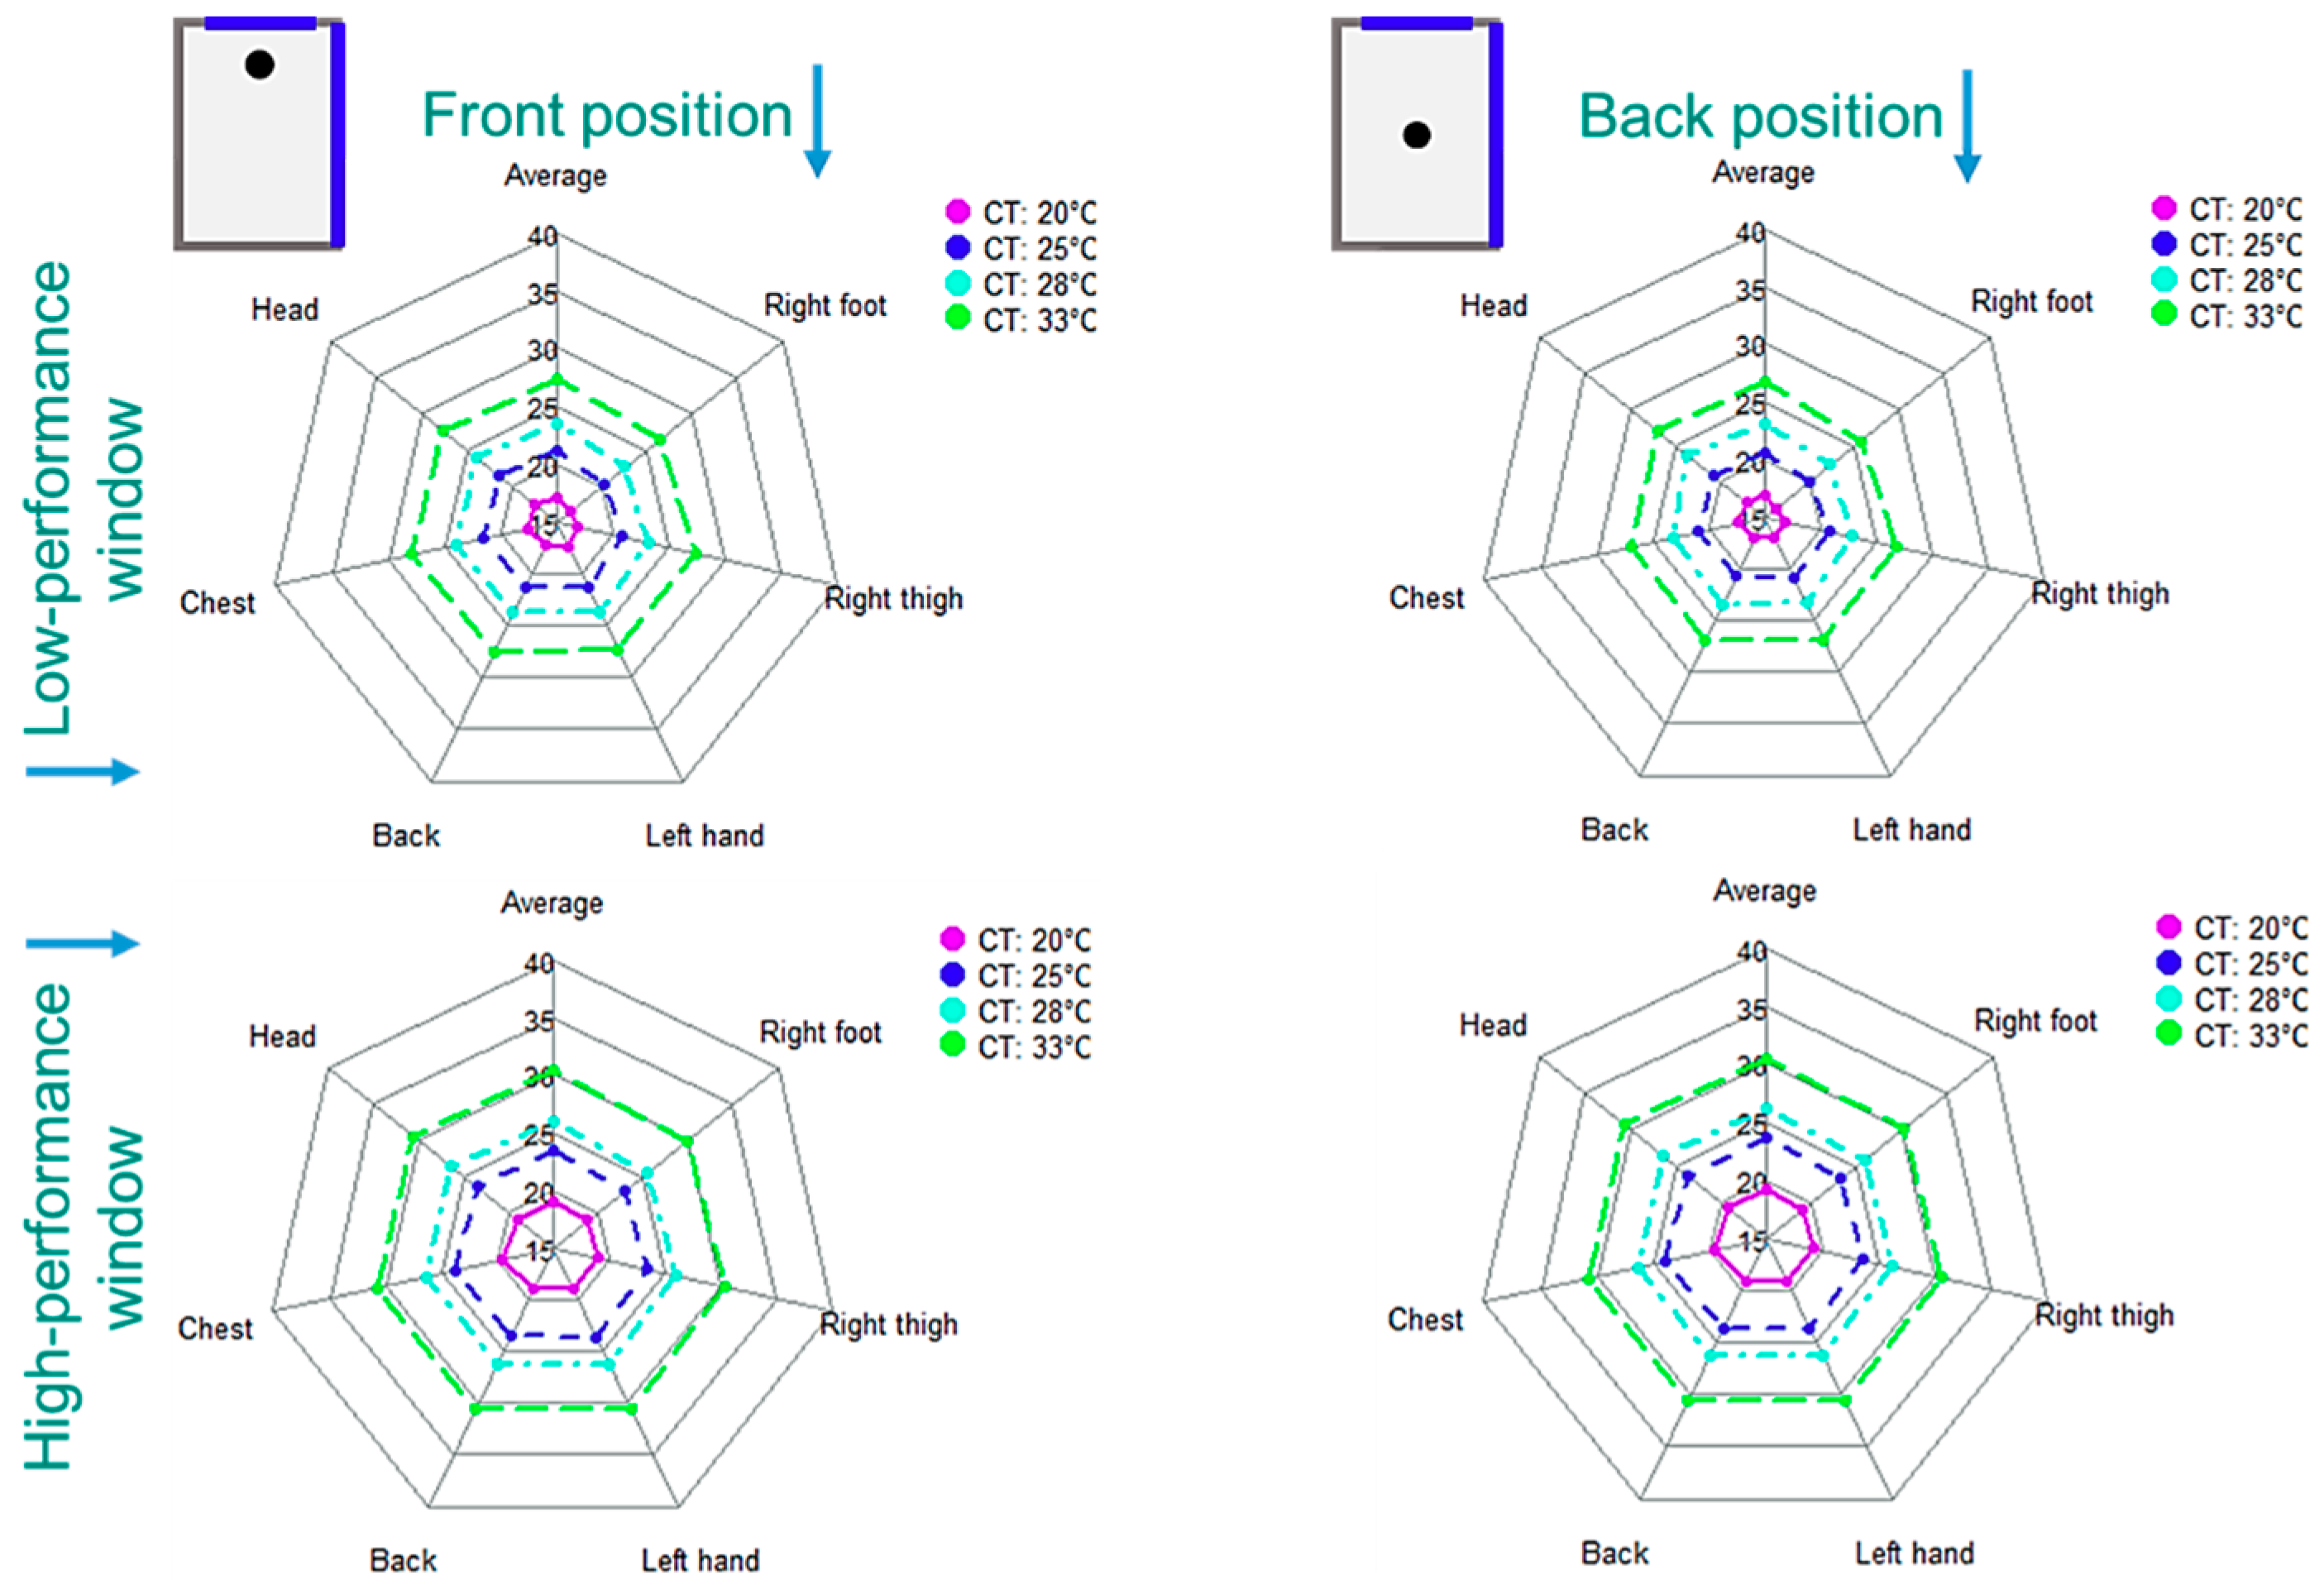
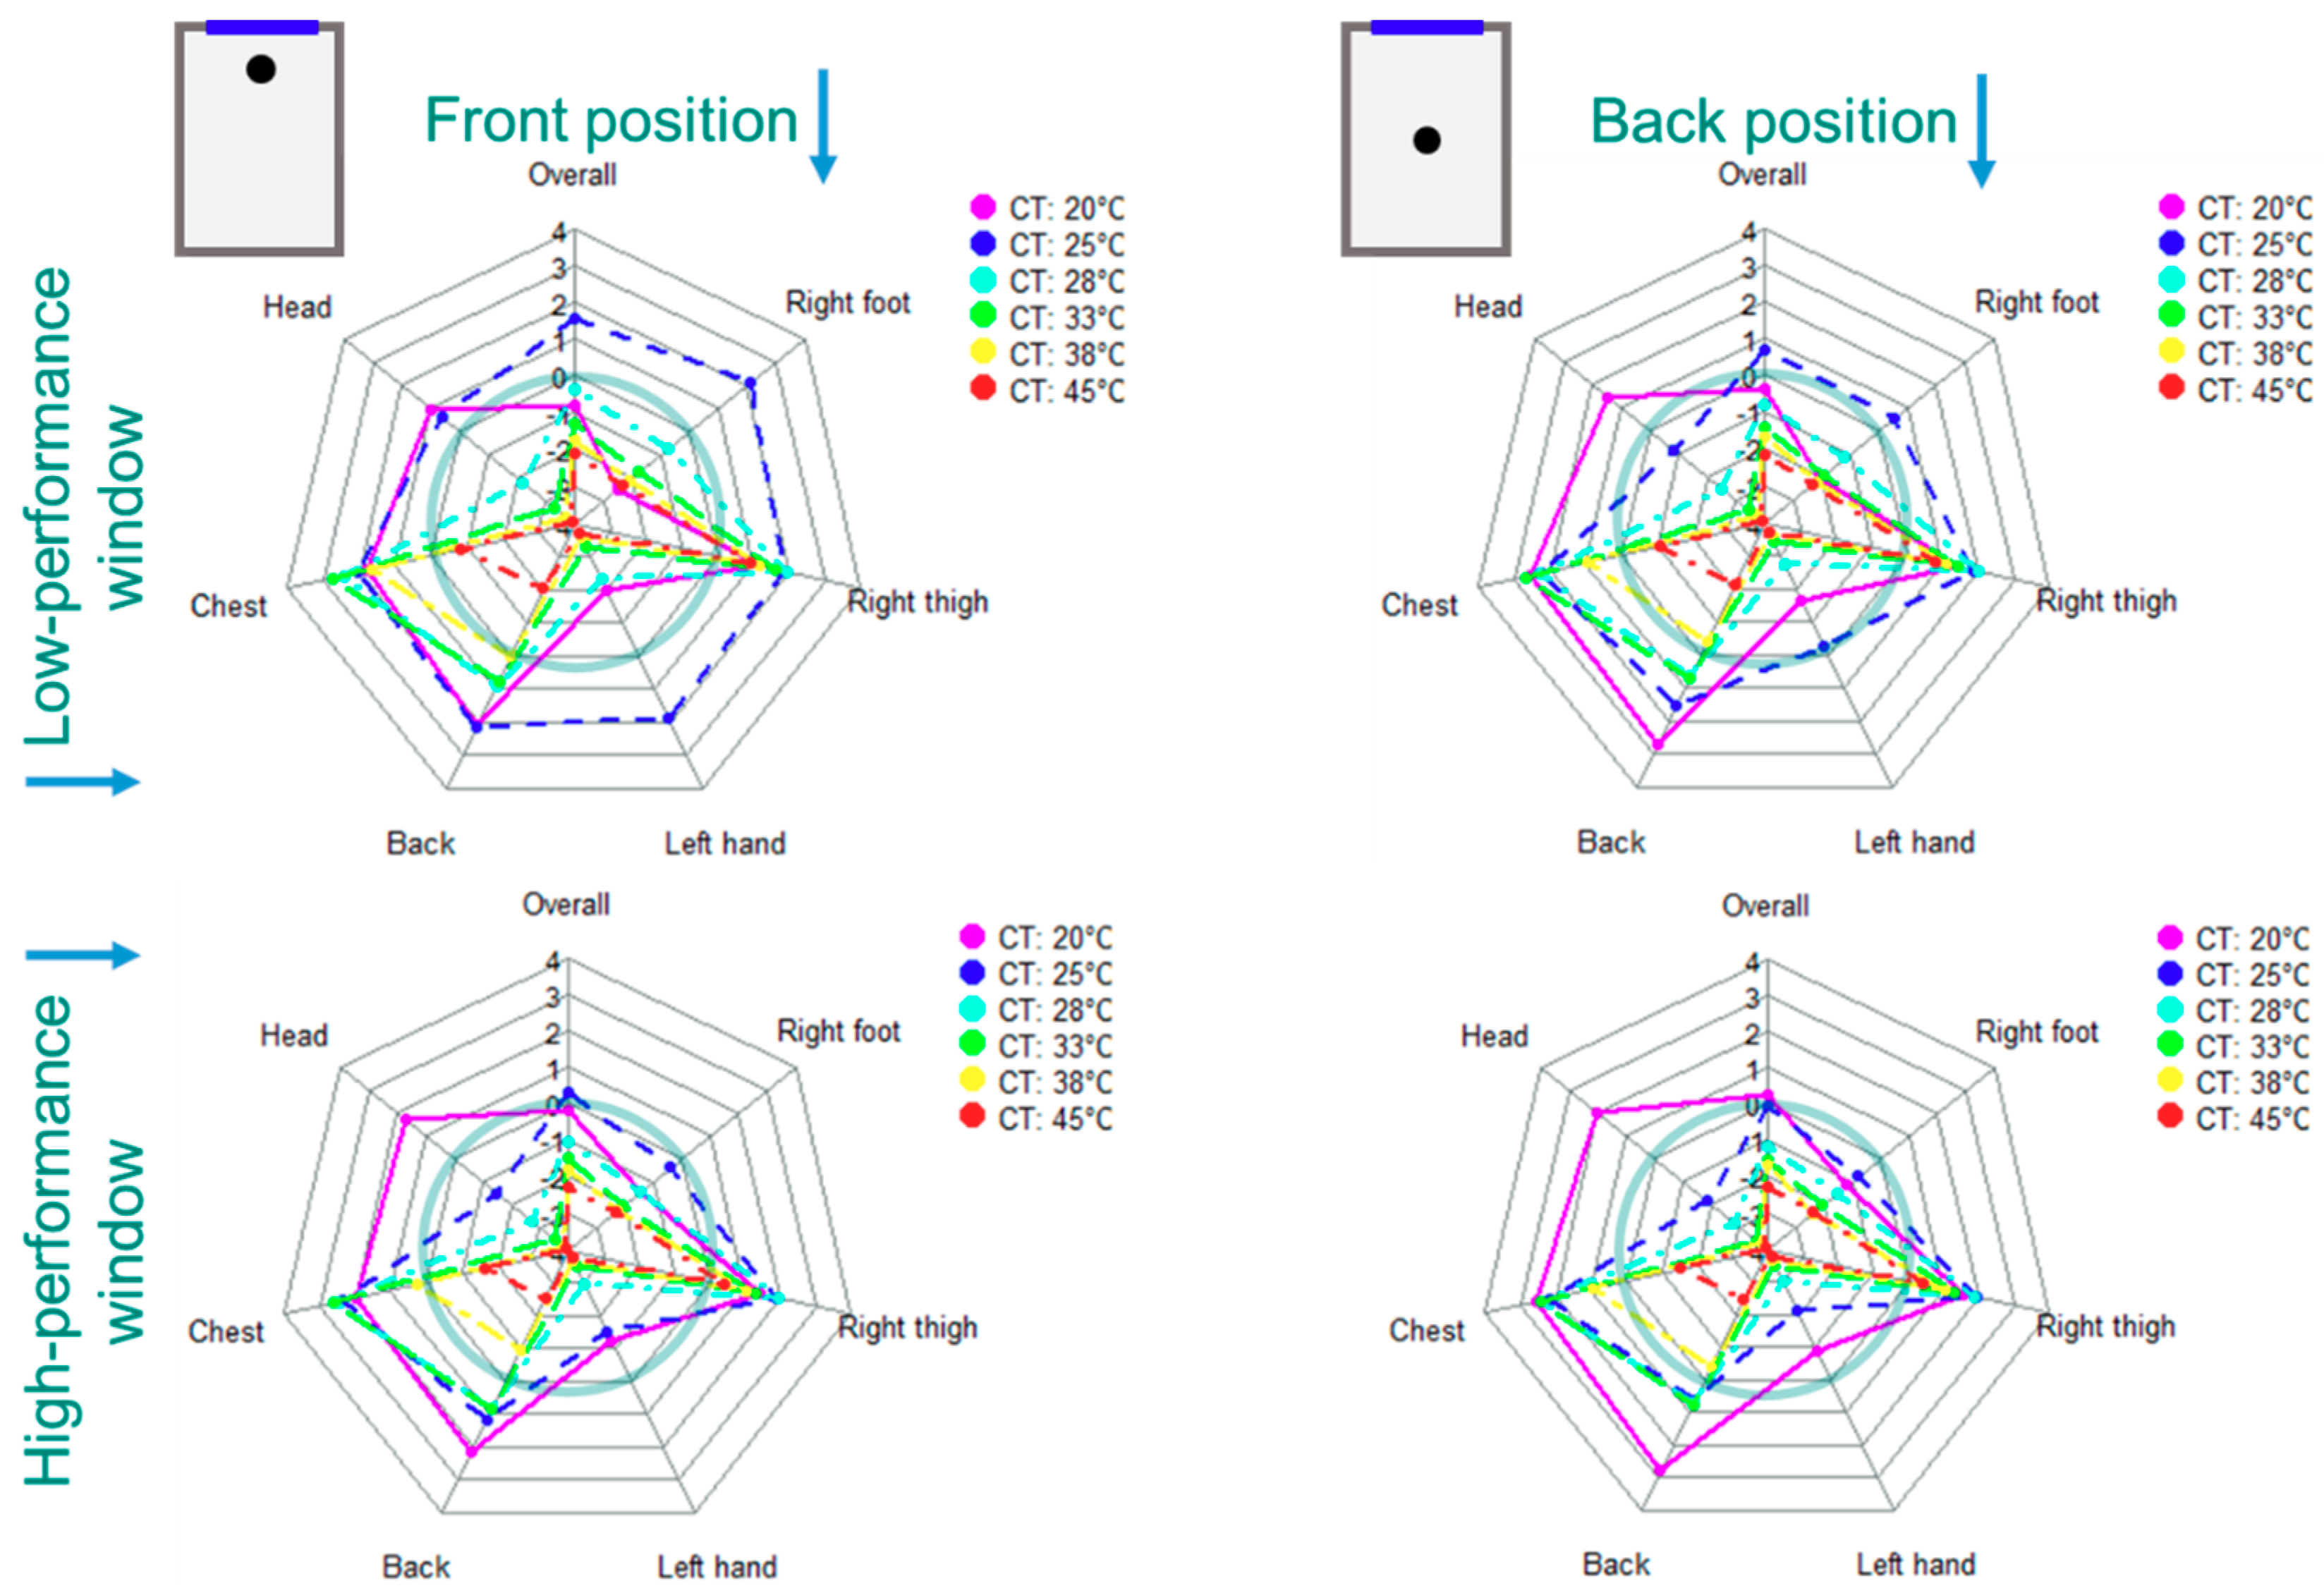
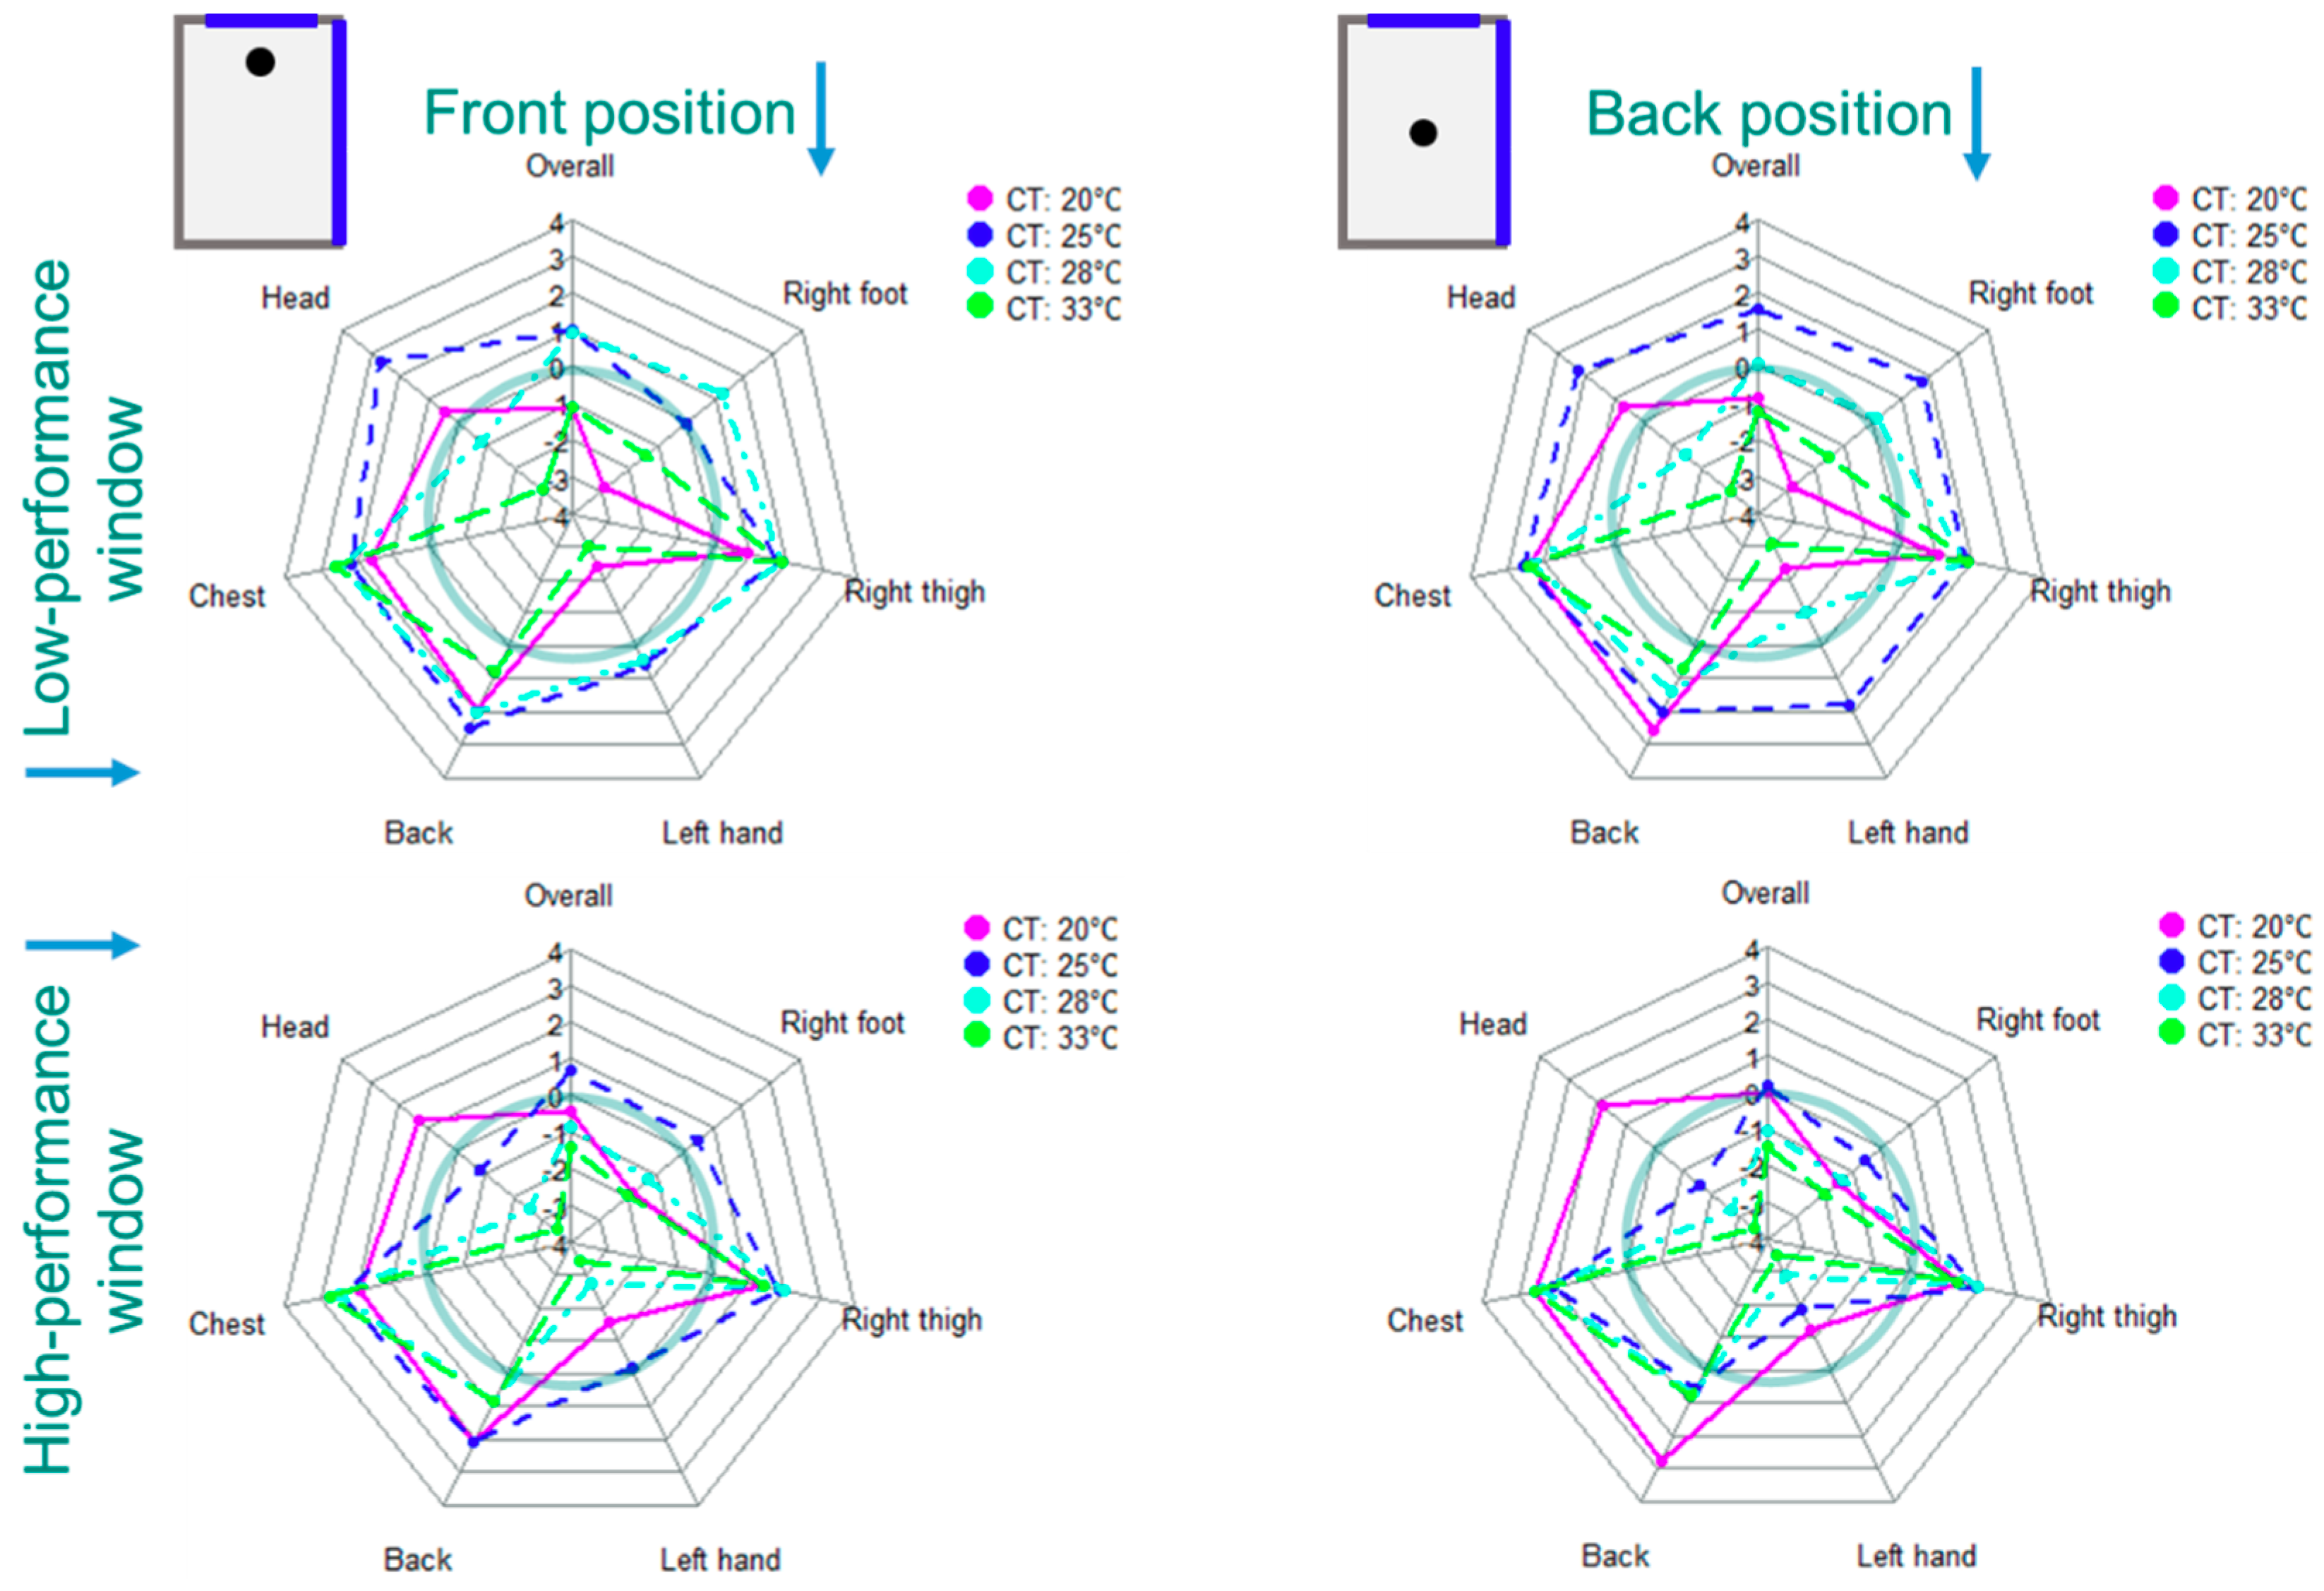
4.2.2. Thermal Sensation and Comfort Analyses

The influence of simulated physical environment factors, corresponding to the 40 scenarios, on the thermal sensation was calculated by the UCB Comfort model and is shown in Figure 14 and Figure 15. In general, the escalation of ceiling temperature and consequently the room air temperature results in an increase of the overall and local thermal sensations at the majority of body parts. However, exemptions are interestingly reported for the chest and back, which is explained on pages 16 and 17. Figure 14 shows that with a low-performance facade, a ceiling temperature of 25 °C can provide a fairly neutral overall condition in the middle room. In contrast, the ceiling temperatures between 20–25 °C may satisfy neutral conditions if the middle room has a high-performance envelope. However, as shown in Figure 15, the neutral overall conditions in the corner room can only be met for slightly higher ceiling temperatures.
Speaking of local thermal sensations, the head is the warmest part of the body, because it is the closest to the warm ceiling, as well as the most sensitive part of the body to warm conditions. It is worth noting that although the hands and feet are the coldest parts of the body for the ceiling temperature of 20 °C, after the head, they are the warmest parts of the body for higher ceiling and subsequent operative temperatures. This can be explained by two factors: (i) nude hands receive more radiation than other covered body parts, whereas feet are in direct contact with the floor, which is also warm at high ceiling temperatures and (ii) the feet and the hands, as extremities, are responsible for extracting higher amounts of heat at higher operative temperatures.
Out of expectations, the local thermal sensations of the back and chest at ceiling temperatures of 28 °C and 33 °C are lower than the one at a ceiling temperature of 25 °C. Subsequently, by increasing the ceiling and air temperatures, the thermal sensations of the back and chest expectedly increase.
These irregularities can be explained by the evaporation cooling effect. As shown in Figure 5, the human’s thermophysiology is regulated in a way that the temperatures of the main organs such as the brain, heart, lung, liver, kidneys, stomach, and intestines, which are located in the head and chest, are kept in a safe temperature range (35.6–37.8 °C). In high operative temperatures, the chest, back, and head actively transfer heat to other limbs through blood circulation and to the surrounding environment through vasodilation and sweating mechanisms. Sweat retention on the skin and clothes can cause evaporative cooling at the skin, and the evaporation rate depends on the amount of sweat retention and adjacent air temperature. The sweat rate is indirectly determined by the operative temperature, meaning that at higher operative temperatures, the sweat rate is higher [25]; however, the sweat rate reaches an asymptotic limit at one point. On the other hand, at a constant relative humidity and sweat rate, the wet-bulb temperature at the skin/clothes is relatively low for low room air temperatures. Therefore, at some thermal conditions where the sweat retention on the skin is relatively high and the wet-bulb temperature is low, a good evaporation rate and consequently lower skin temperature is expected. Figure 14 and Figure 15 imply that at the thermal conditions corresponding to the ceiling temperature of 33 °C, the sweat rate at the chest and back is slightly higher than 28 °C, and although its wet-bulb temperature is slightly higher, the evaporation rate is stronger because of enough sweat retention. At warmer thermal conditions corresponding to the ceiling temperatures of 38 °C and 45 °C (in Figure 14), the evaporation cooling effect is weaker because the sweat rate is limited and wet-bulb temperatures corresponding to higher air temperatures (Figure 12 and Figure 13) are higher.
In Figure 16a, Zhang et al. [26] empirically derived a correlation between the local thermal sensation and the local skin temperature at different overall body states (overall thermal sensation states). As seen, at equal skin temperatures (Tlocal–Tlocal,set, e.g., −3 °C), a body part feels cooler if the thermal state of the body overall is warmer. Figure 16b presents the exemplary local skin temperatures measured using iBotton sensors. The figure is presented as an example for clarification of irregularities seen in thermal sensation values at the chest and back. As seen, the local skin temperature at the chest and back for the ceiling temperatures of 25 °C, 28 °C, and 33 °C are about the same; however, the overall thermal sensation increases as the ceiling temperature (room air temperature) increases. Therefore, based on Zhang’s correlation, at the ceiling temperatures of 25 °C, 28 °C, and 33 °C, the thermal states of chest and back are cooler for higher ceiling/air temperatures. Similarly, in an earlier study, Hensel et al. (1982) [27] recorded the local thermal sensation vote corresponding to two air temperatures (12 °C and 45 °C), while they conditioned the abdomen to achieve the skin temperatures between 25–38 °C. The results implied that the local thermal sensation at the abdomen at a specific skin temperature was higher for a cooler room air temperature.
Figure 17 and Figure 18 present the calculated overall and local thermal comfort at the selected six body limbs related to the 40 scenarios listed in Figure 4. It can be seen that the maximum overall comfort condition in the middle room with the low-performance façade and window can be satisfied with a ceiling temperature of 25 °C, while the ceiling temperature of 20 °C can be optimal for the high-performance façade and window. In the corner room with two adjacent surfaces with the outside air, slightly higher ceiling temperatures are required. For the room with a low-performance envelope, the ceiling temperatures of 25 °C and 28 °C provide minimum thermal comfort conditions. However, the ceiling temperature of 25 °C is an optimal temperature. Similar to the middle room, ceiling temperatures of 20 °C and 25 °C in the corner room with a high-performance envelope have about the same impact on the overall thermal comfort condition.
The analyses of the predicted local thermal comfort at the six body parts imply that ceiling temperatures of 25 °C and 20 °C for the low- and high-performance envelopes, respectively, generally provide minimum local thermal comfort conditions, particularly at extremities. While the highest comfort condition is reported at the head, chest, back, and thigh, the feet and hands are the least comfortable at these temperatures. These results are broadly consistent with the experimental results obtained in the LOBSTER test facility [1]. The experiments were performed with ceiling temperatures of 28 °C, 33 °C, and 38 °C, and the other surface temperatures were kept at about 20 °C, resulting in about neutral conditions. Similar to the simulation results, participants voted the head as the most comfortable body part, even though the head was the closest body part to the warm ceiling, and it is the most sensitive upper extremity to the warm condition. In the experiments, hands and feet were as well the most uncomfortable body parts.

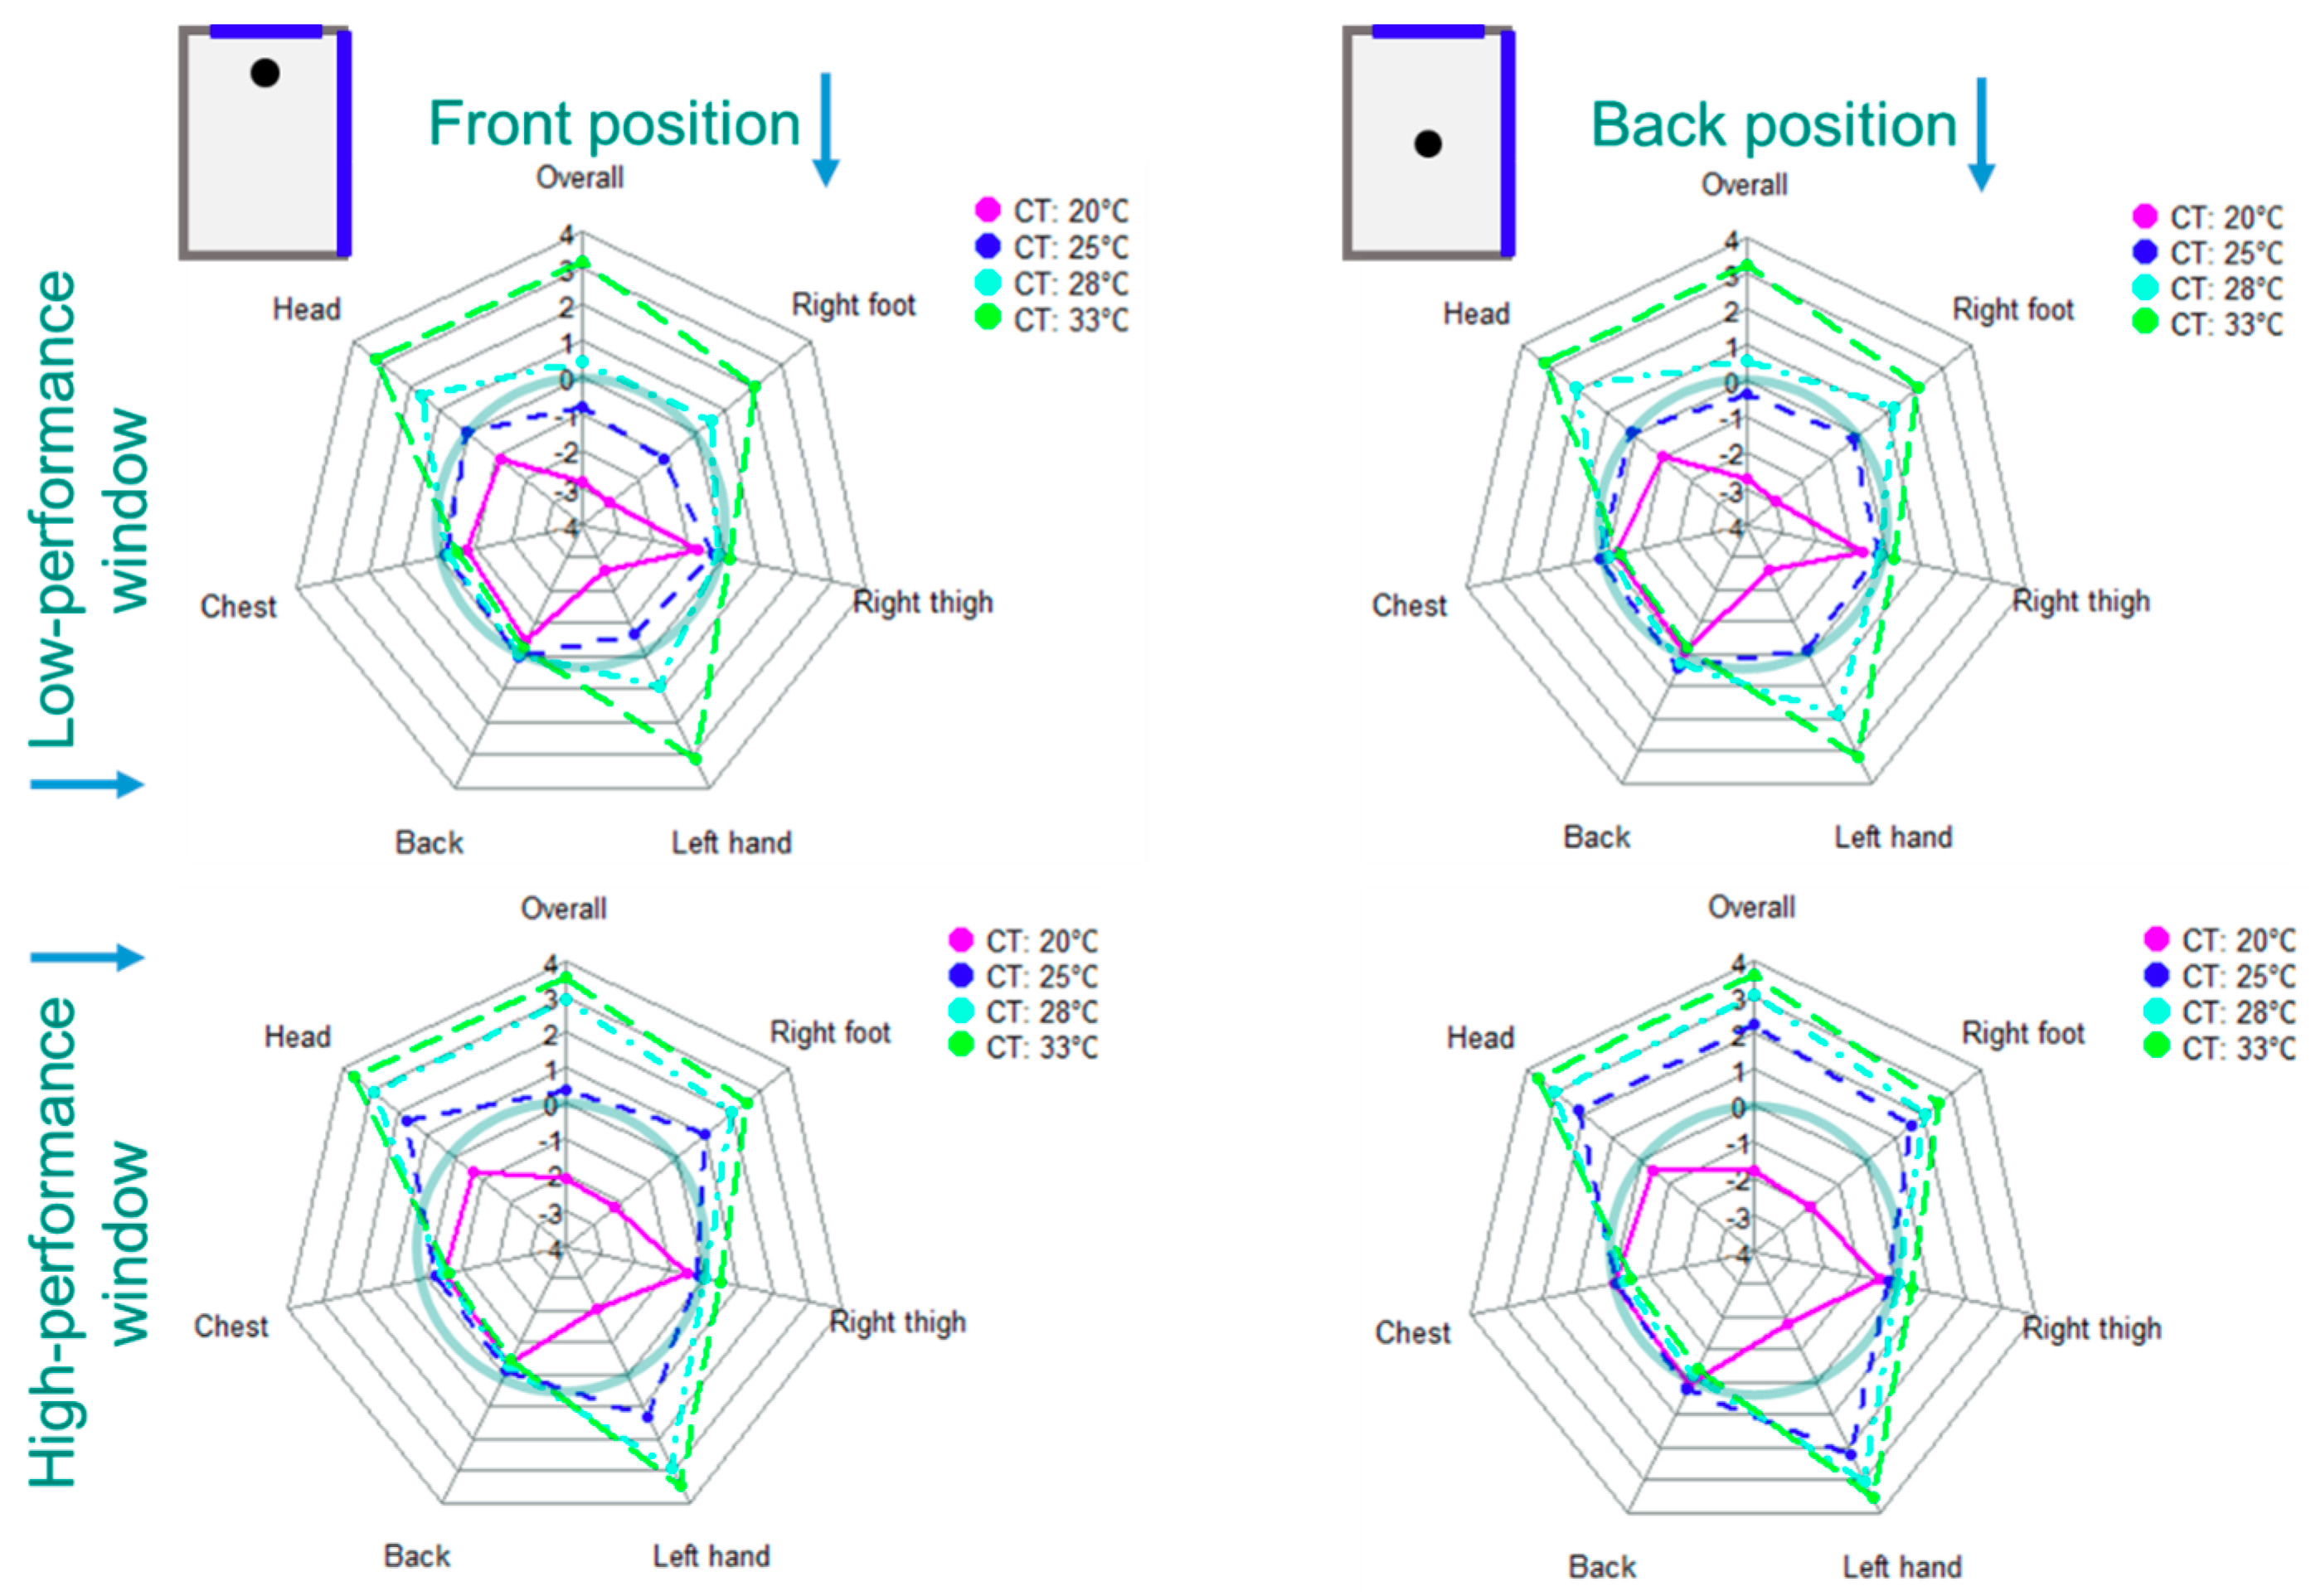
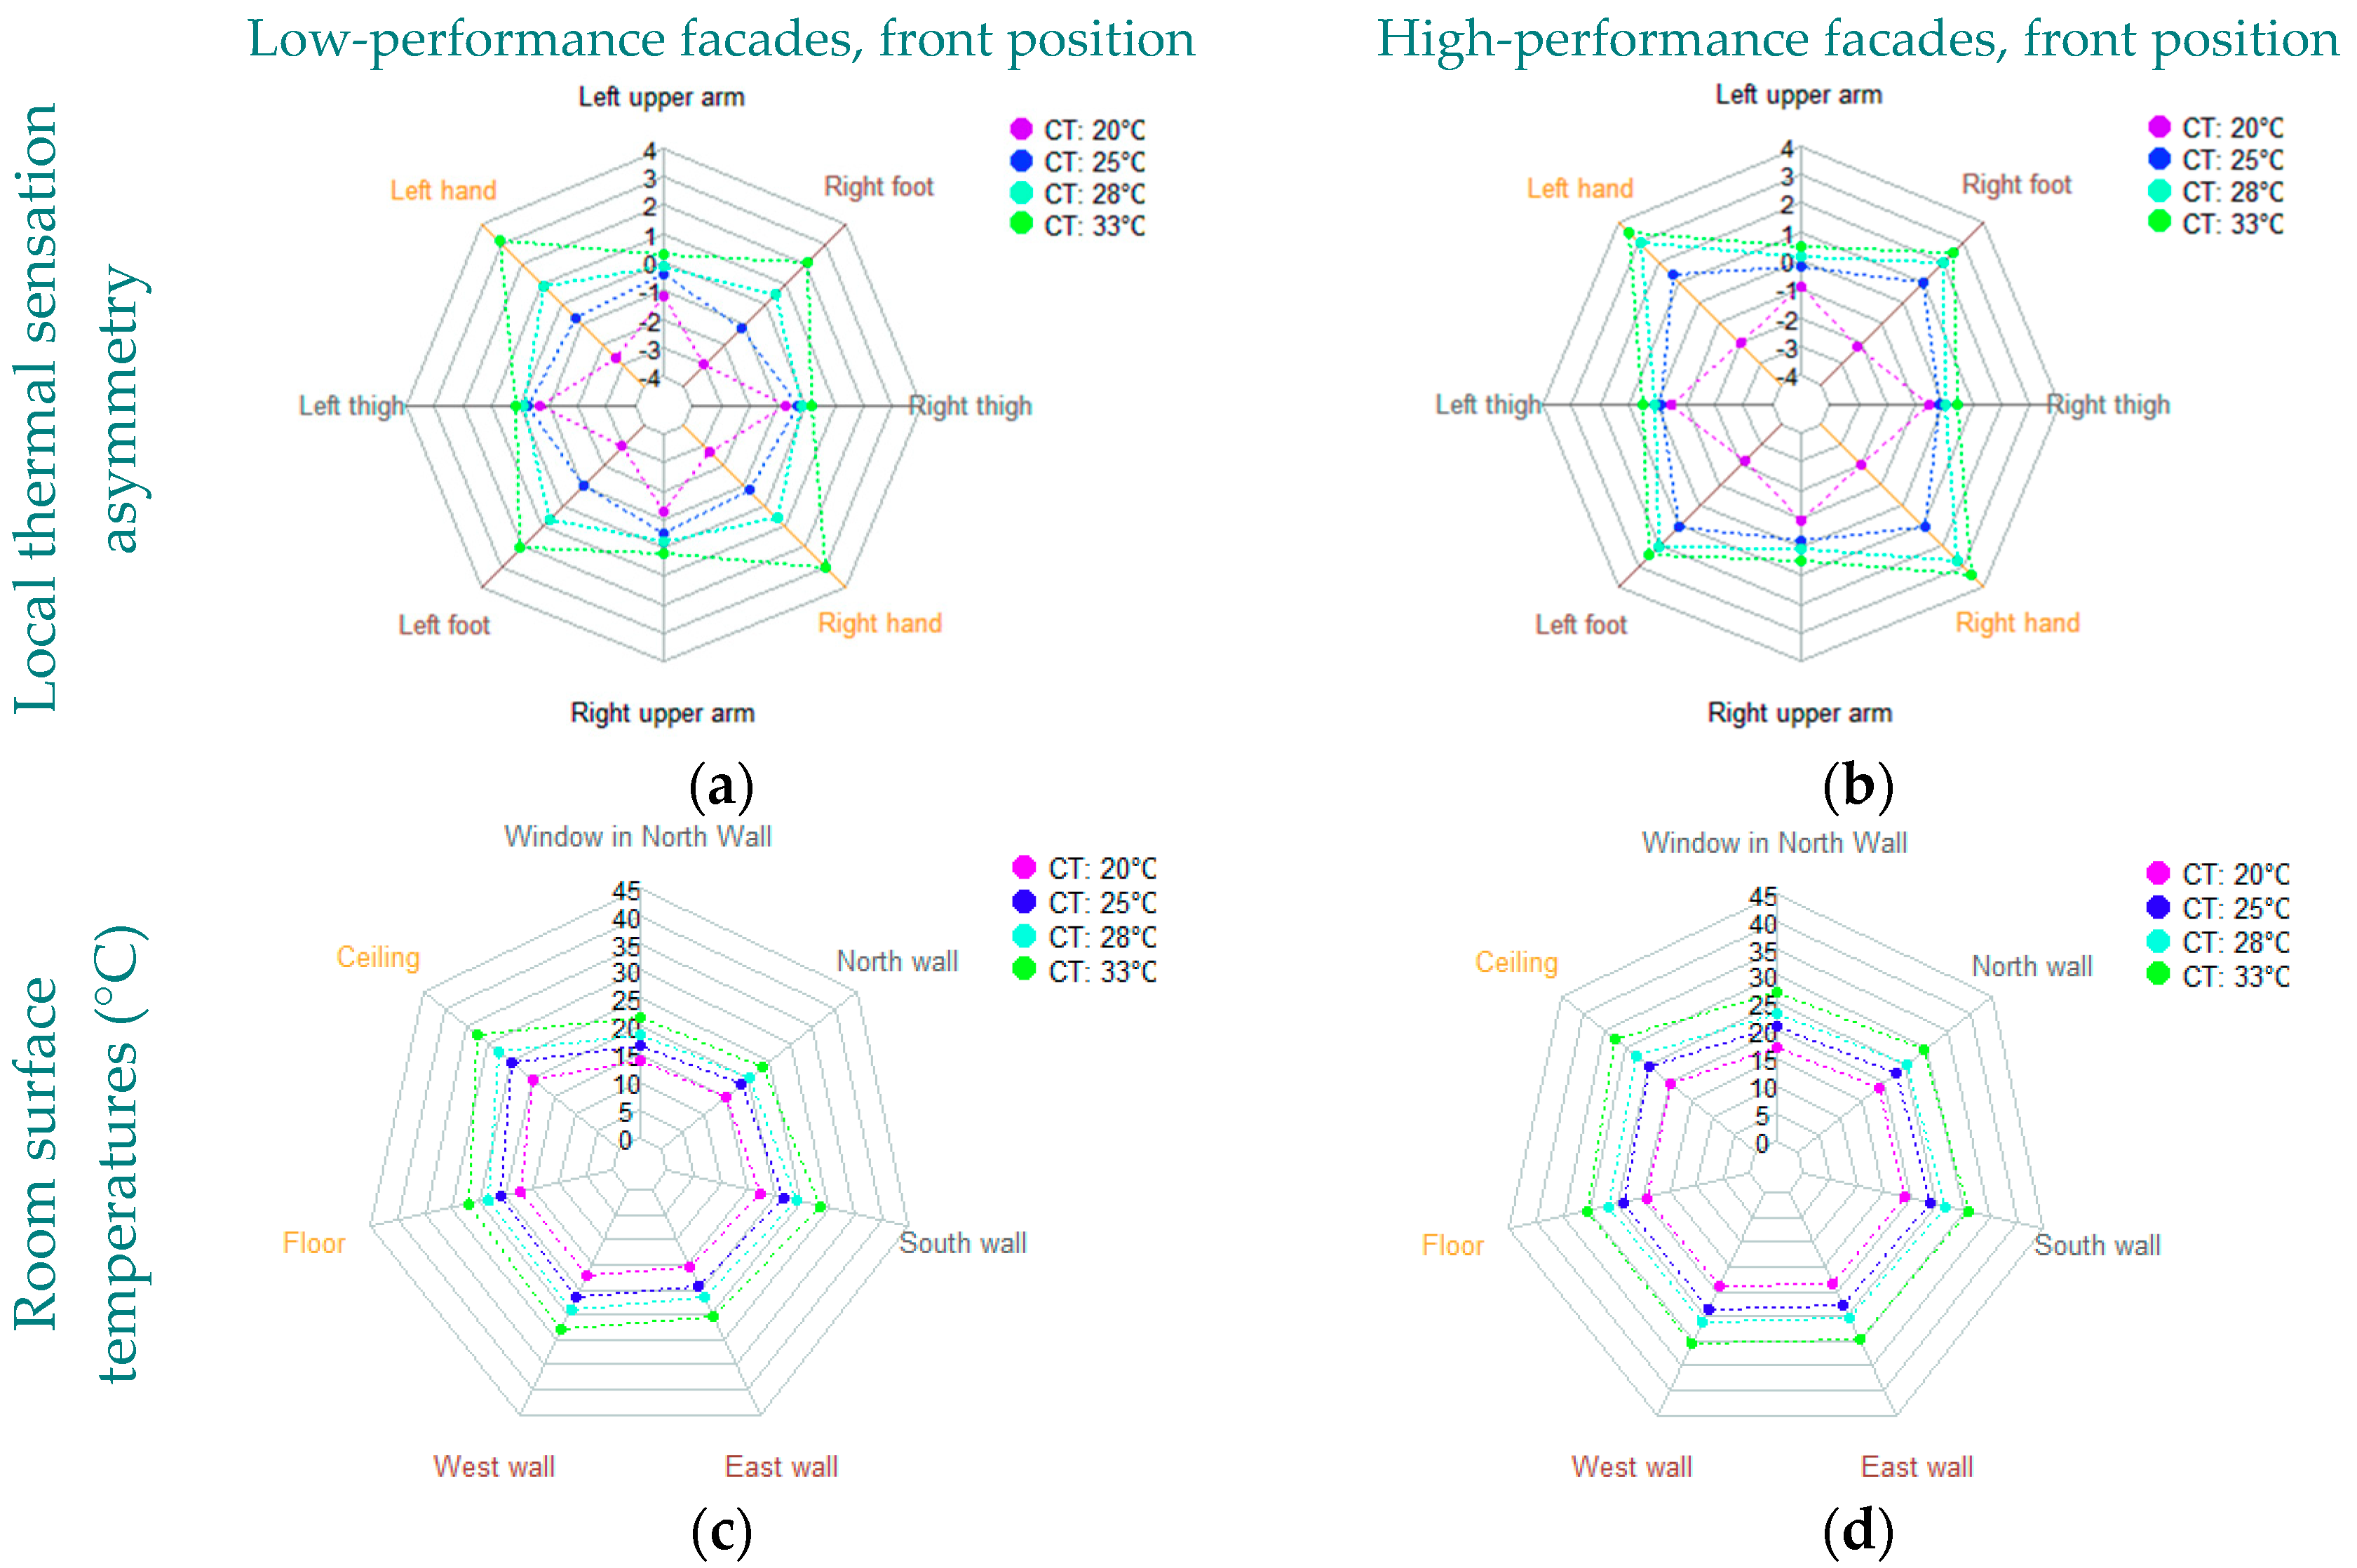
4.2.3. Thermal Sensation Asymmetry Analyses

In heating seasons, poor quality of building façades results in relatively low inner surface temperatures of corresponding facades compared to other room surfaces, which consequently influence the thermal sensation asymmetry of occupants. This study deals with the question of how poor-quality facades can influence the thermal sensation asymmetry if a warm ceiling operates. Figure 19 presents the local thermal sensation asymmetry between the right and left sides of selected pairs of body parts (a, b) and room surfaces’ temperatures (c, d) corresponding to four ceiling temperatures and the qualities of two façades in the corner room. The corner room with two facades and the front position were selected because the inner surface temperature asymmetry between the right (east) and left (west) was maximum. As seen from Figure 19a,b, the simulation results imply that the thermal asymmetry between the four pairs of body parts corresponding to both quality of facades and all ceiling temperatures is negligible. The following three reasons can provide an explanation:
  • The east wall (right wall and façade) and the west wall have about similar inner surface temperatures, and its difference is negligible for the high-performance façade. As discussed in Section 4.2.1, the large surface of the warm ceiling evenly heats surfaces through the radiation and consequently, the warm room surfaces heat the room air volume. The direct radiation from all warm surfaces and the adjacent warm air can increase the surface temperature façade even its thermal insulation is relatively poor;
  • The winter clothing insulation reduces the efficiency of the radiation heat exchange between the body parts and the room surfaces. The influence of slightly different temperatures of opposite surfaces on the thermal status of the insulated body parts is negligible.
  • The unclothed right and left hands are at an equal distance with respect to the right and left walls. Additionally, the thermal status of nude hands is mainly influenced by the relatively cool window and north façade. Therefore, the temperature asymmetry of the right and left walls has a negligible effect on the thermal sensation asymmetry of the hands.

5. Summary

This study aims to evaluate the potential application of low-temperature radiant heating ceiling in buildings with low- and high-performance facades. Despite some systematic experimental studies that evaluate the warm ceiling based on “radiant temperature asymmetry” in neutral climate conditions, this study used a coupled CFD–thermoregulation model to predict the local thermal comfort/sensation corresponding to thermal conditions that are close to reality. Additionally, the inner surface temperatures of facades, operative temperature, and heat losses through the building envelope corresponding to different supplies of warm water temperatures and the façade qualities in a winter period in Potsdam were simulated using TRNSYS (Type 56). Forty combinations of simulation scenarios including six ceiling surface temperatures (20 °C, 25 °C, 28 °C, 33 °C, 38 °C, and 45 °C), two qualities (conventional and advanced materials) for facades, two rooms with one and two facades, and distances of 1 m and 3 m to the window were developed for CFD–thermoregulation simulations. The influence of these systems on the local thermal sensation and comfort of occupants, thermal sensation asymmetry, skin temperatures, air temperature, and velocity profiles’ radiant temperature asymmetry was investigated. From the carried out research, the key findings and practical suggestions can be summarized as follows:
  • Highlights:
    • The results of this study indicate that the radiant heating ceiling creates negligible radiant temperature asymmetry, particularly for the buildings that have high-performance facades. This is due to the room surfaces receiving direct radiative heat from the warm ceiling; thus, their temperatures increase almost evenly unless the energy performance of the envelope or outside air temperature is extremely low. The room surfaces with roughly equal temperatures result in minimum radiant asymmetry, operative temperature stratification, and maximum uniform conditions.
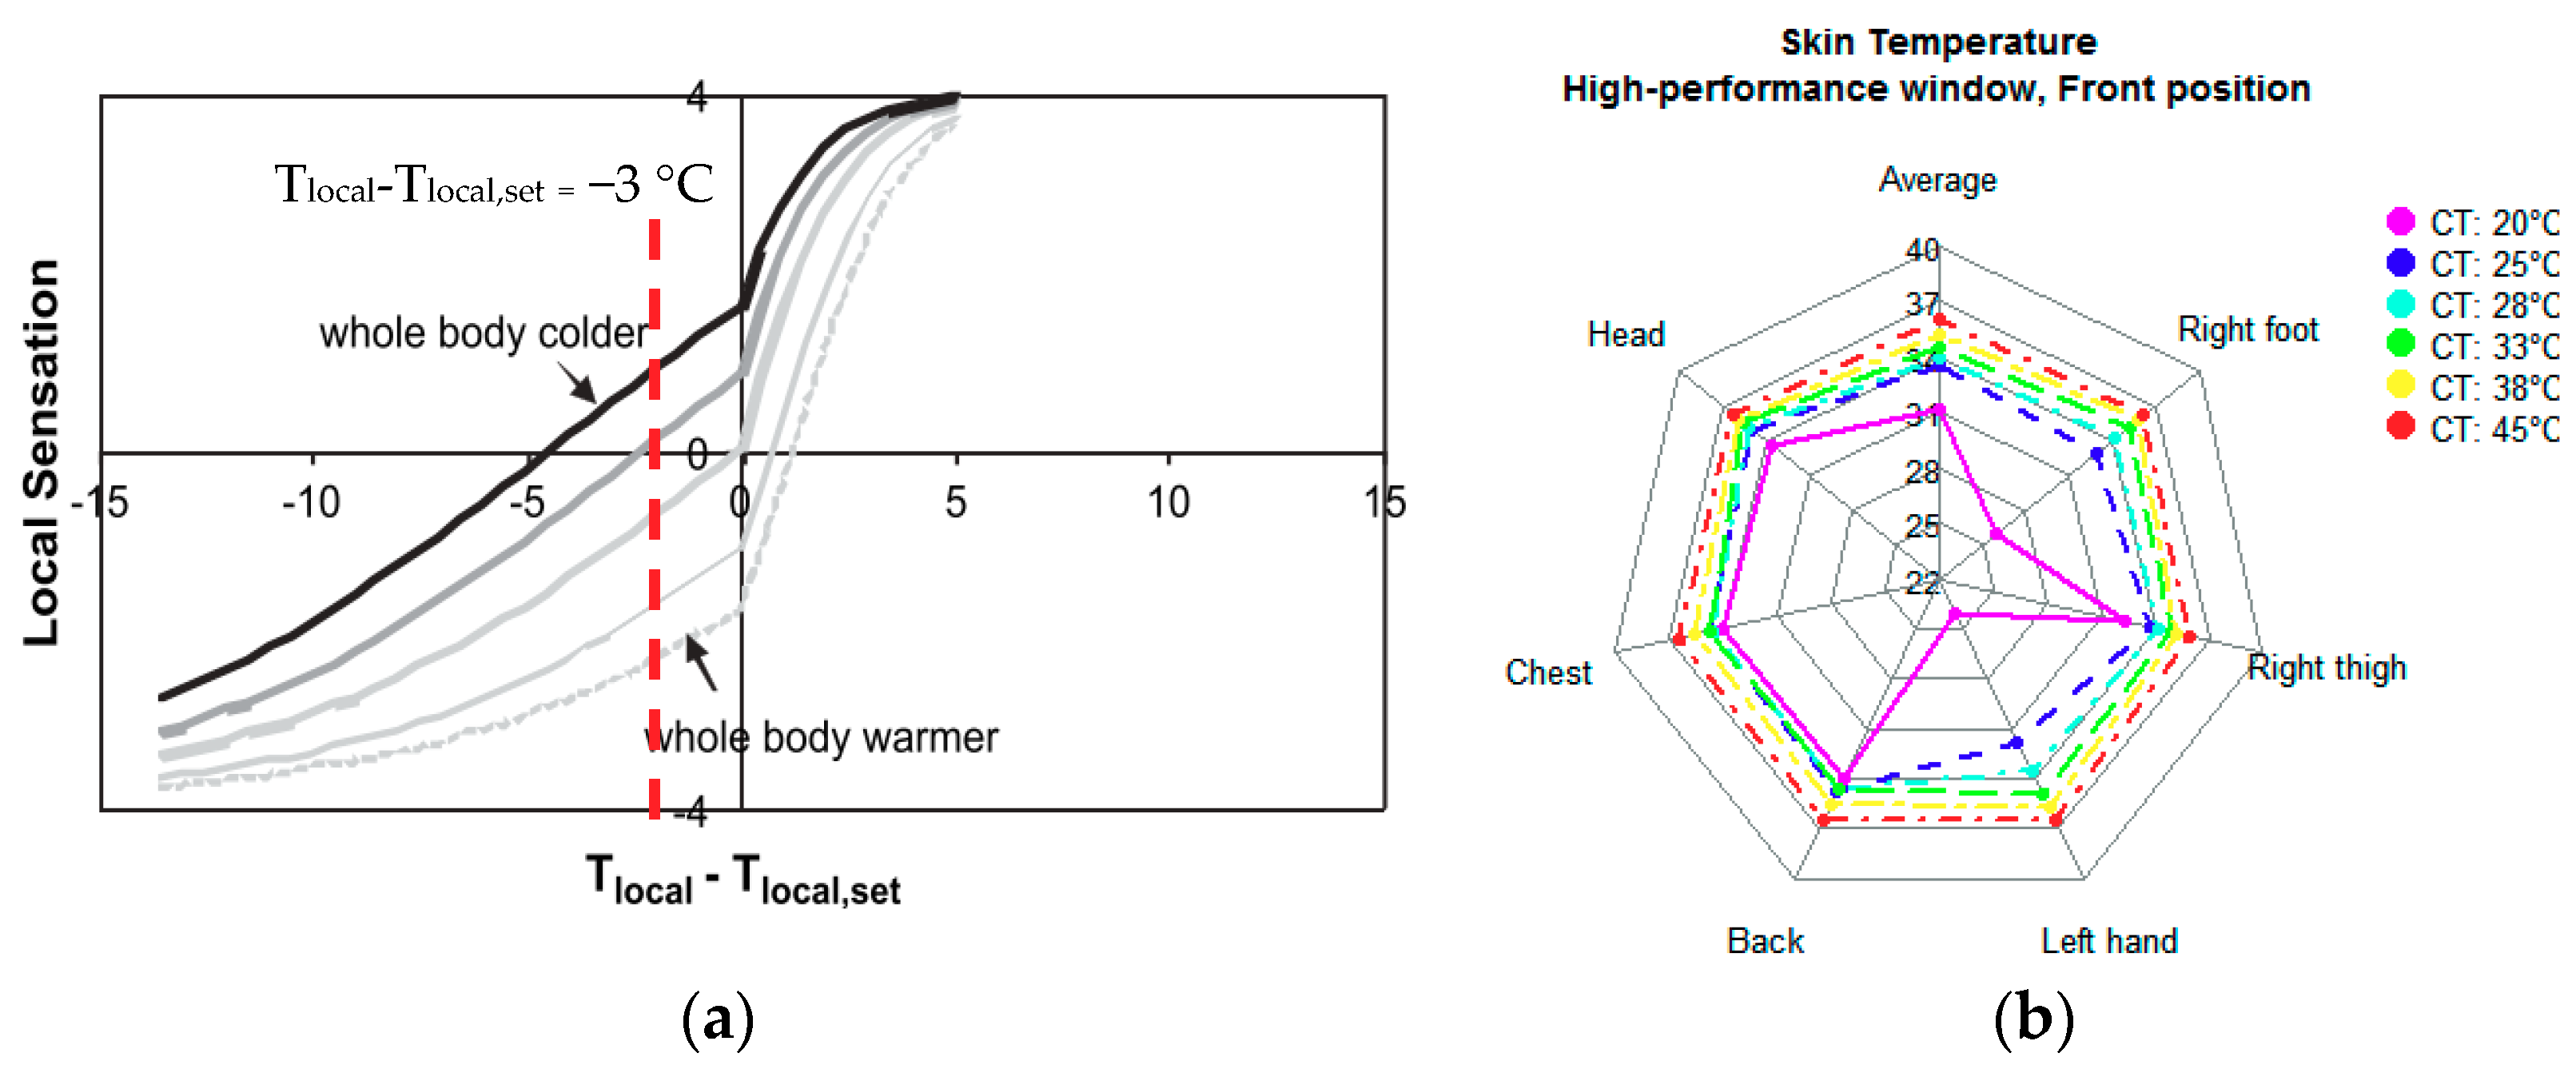
    • It is worth mentioning here that the results of this study suggest that ceiling temperatures as low as 20–25 °C in renovated buildings and 25–28 °C in a building with low-performance facades can provide optimal thermal sensations at most body parts, particularly at extremities.
    • Fanger, ASHRAE-55, and CIBSE Guide-A [3,7,28] suggested that the maximum radiant temperature asymmetry of 4 K corresponds to 5% dissatisfied persons for overhead radiant systems. However, the results imply that in reality, relatively uniform room air/operative temperatures corresponding to each ceiling temperature have a stronger effect on the overall and local thermal sensations than radiant temperature asymmetry.
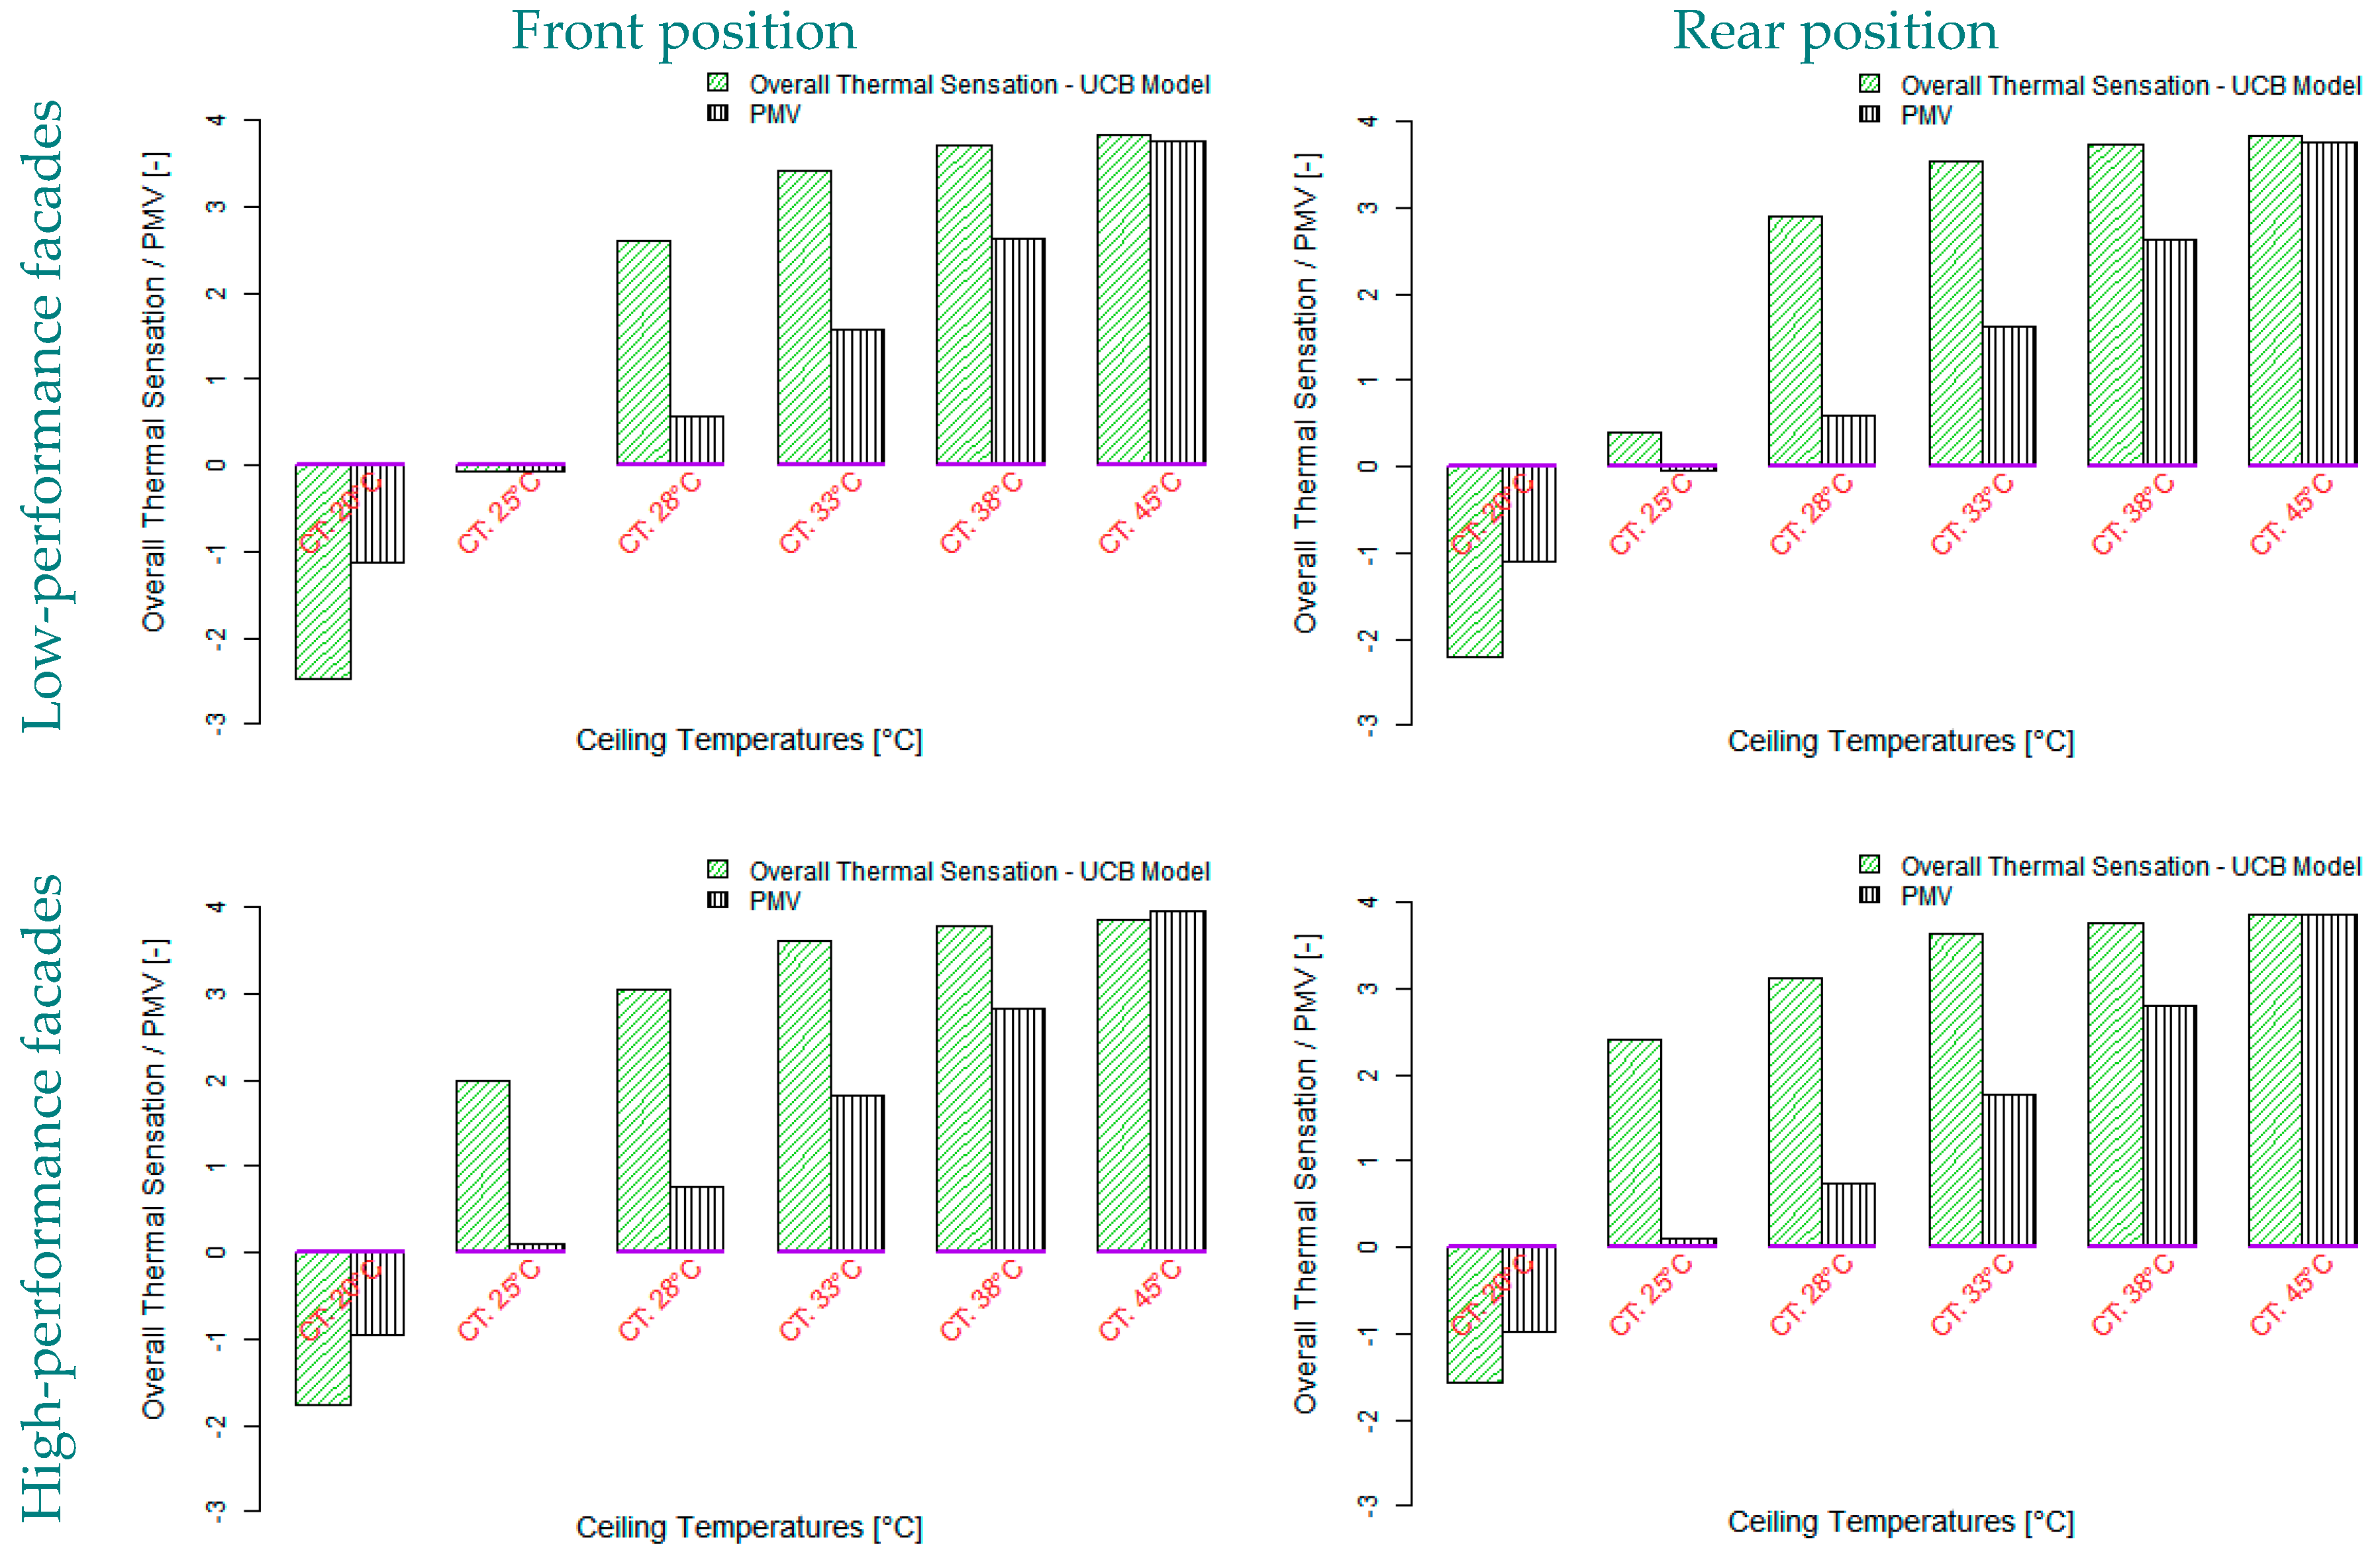
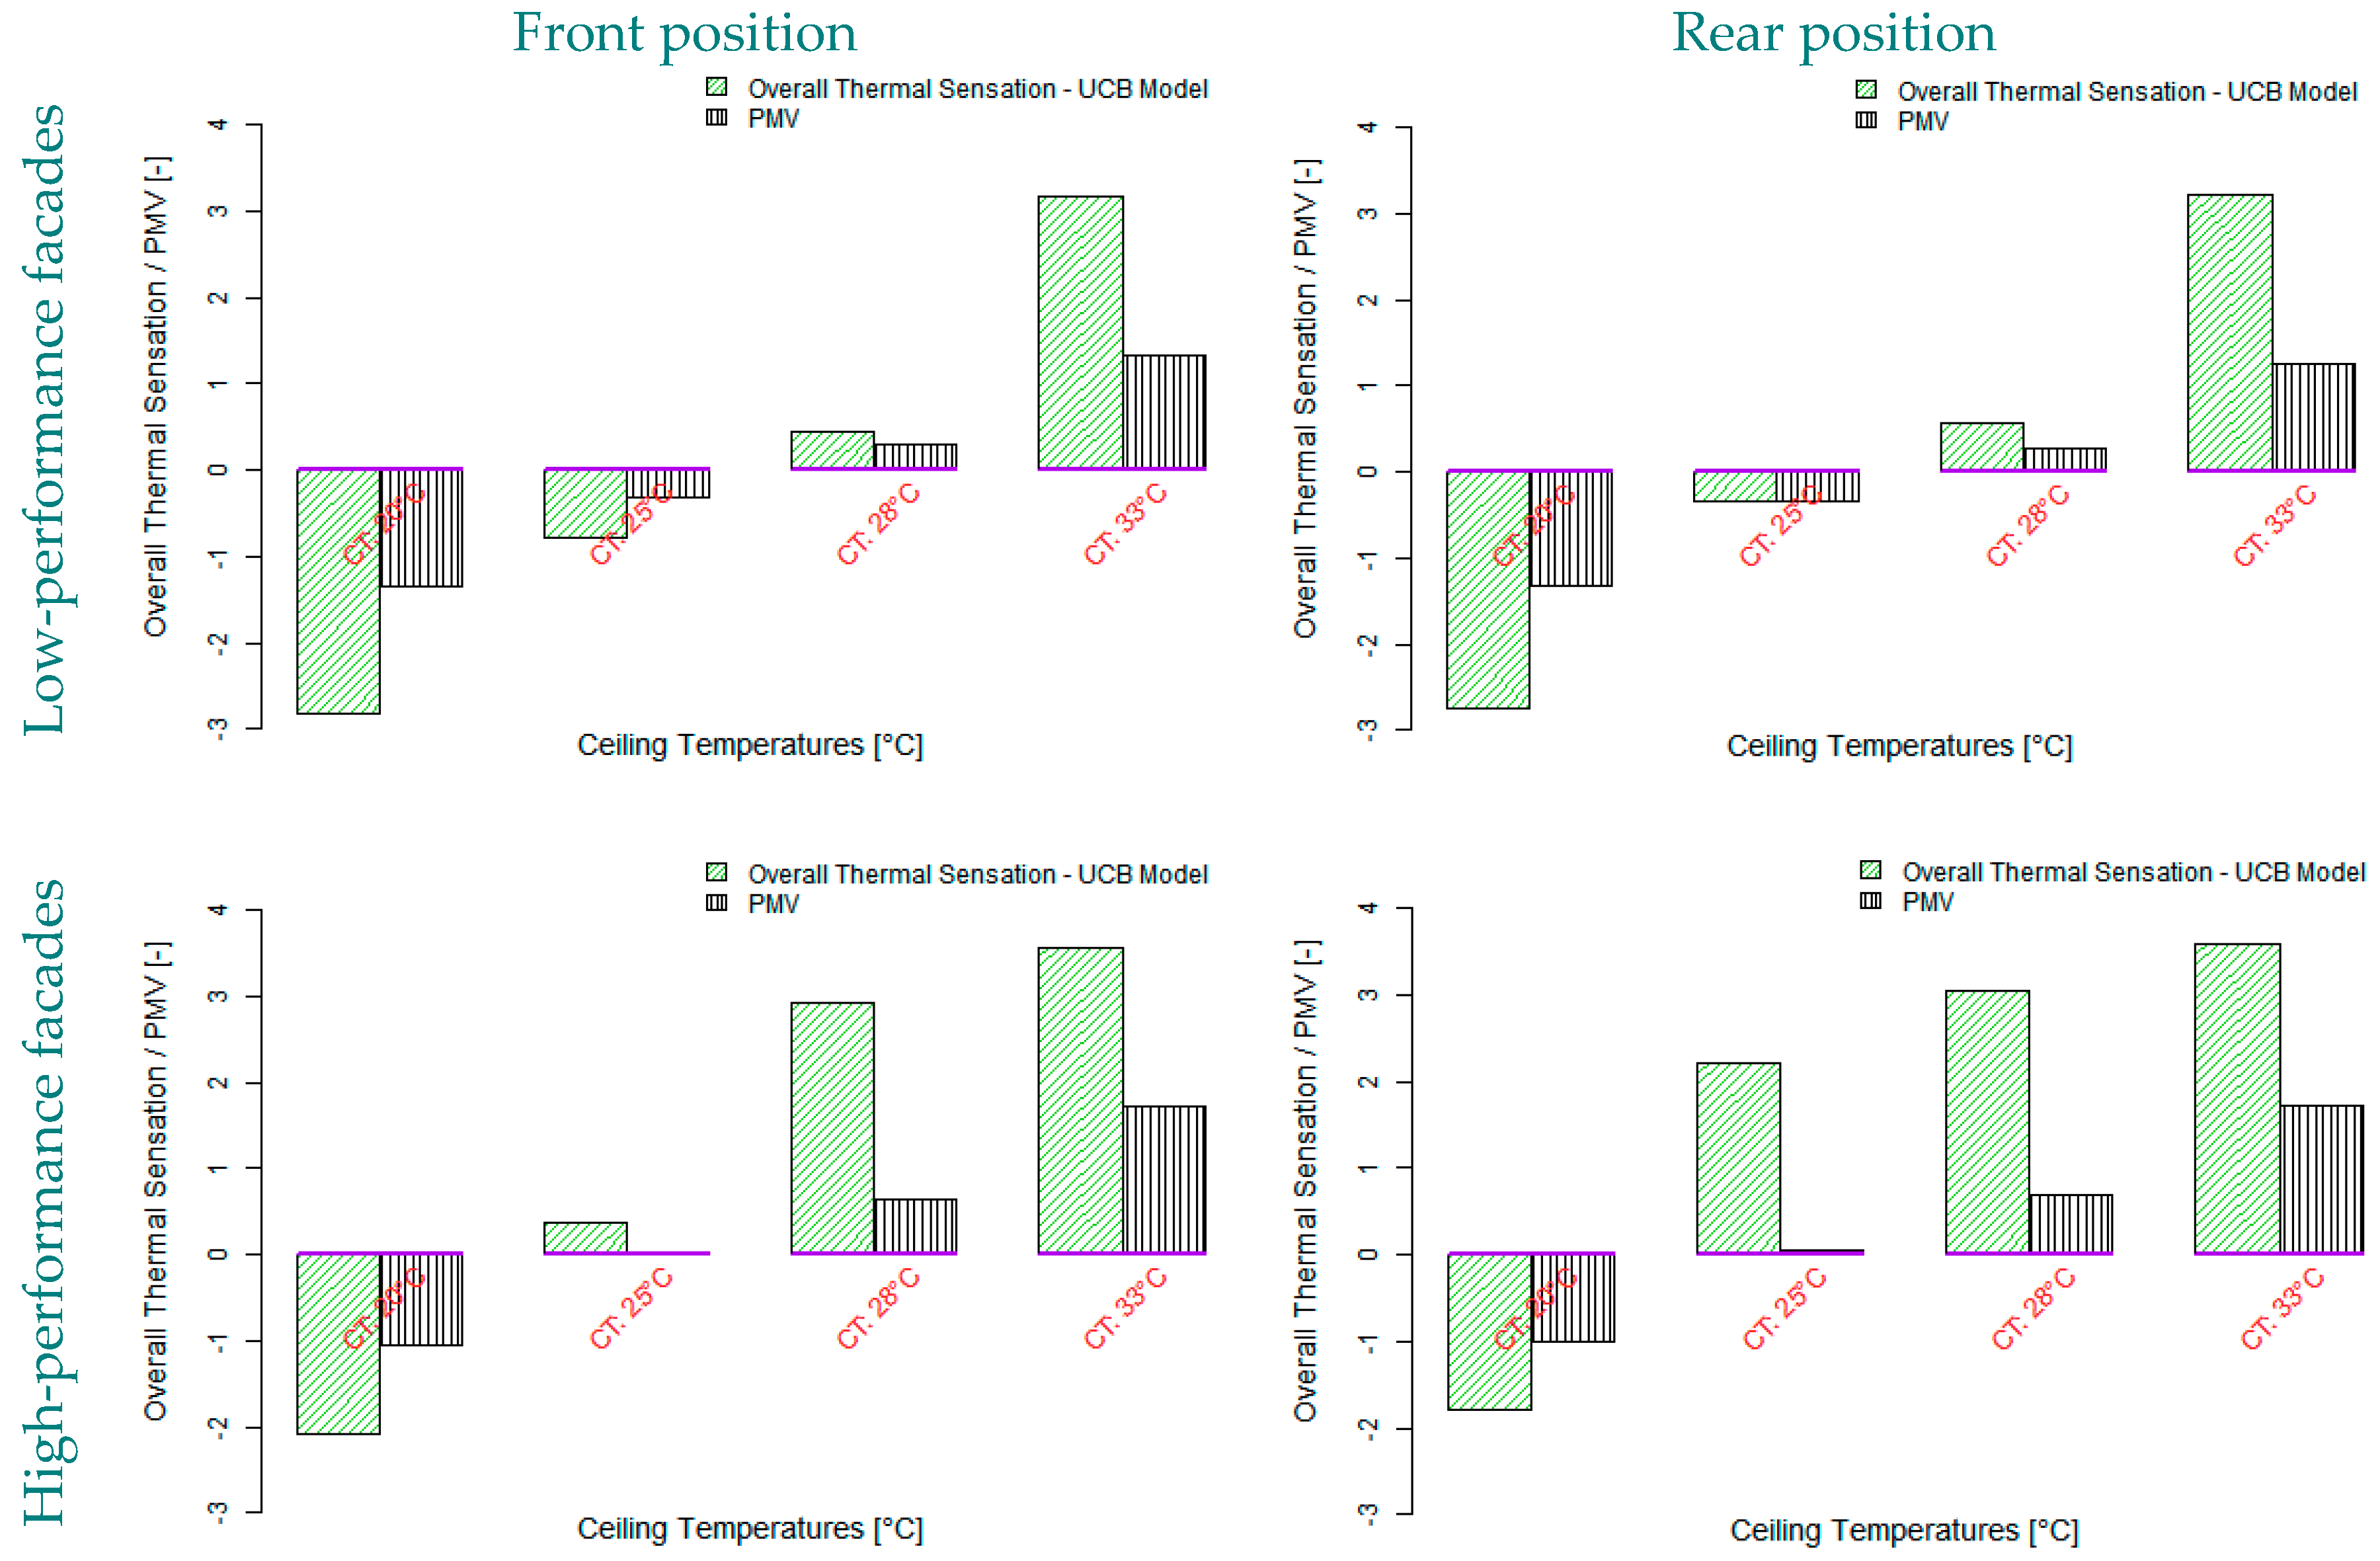
    • Importantly, the comparisons shown in Appendix A prove that the PMV comfort model is not a suitable model for the evaluation of radiant heating ceiling systems based on thermal comfort criteria (especially if occupants have winter clothes), even if the air and operative temperature distributions near an occupant are uniform. It is because the PMV model calculates the heat balance between the human and its environment at a single node. However, as the studies by Zhang et al. [10,26] showed, the overall thermal sensation depends on local thermal sensation values at various body parts. For the UCB model, the effect of only one/few warmest or coolest part(s) (e.g., warm head or cold feet) may have a dominant effect (depending on weighting factor, C1 [26]) on the overall thermal sensation.
    • For a controlled operation of the radiant ceiling, the variation of the ceiling temperatures is strong for relatively high supply water temperatures and particularly for buildings with low-performance materials. In contrast, the small ceiling temperature variation can be seen for renovated buildings with the ideal supply water temperatures between 28–45 °C. The variation is minimum for the supply water temperature of 38 °C, which is a realizable supply temperature from a low-temperature heat pump.
    • Unexpectedly, at some operative temperatures (28 °C and 33 °C) the chest and back feel cooler compared to the lower operative temperatures (25 °C). The reasons are discussed in Section 4.2.2.
  • Lowlights:
    • Due to negligible radiant temperature asymmetry and the dominant effect of uniform air temperatures, the thermal sensation asymmetries between the right and left body parts or chest and back are negligible.
    • While the highest comfort condition is reported at the head, chest, back, and thigh, the feet and hands are the least comfortable at these temperatures. These results are broadly consistent with the experimental results obtained in the LOBSTER test facility [1].
    • Simulation results show clear differences between the local thermal sensations as well as comfort in approximately equal operative temperatures. For instance, although the operative temperatures at the thighs and hands are about the same, hands feel cooler than thighs. The differences can be traced to a different level of cloth insulation on each body part, different skin temperatures, different local thermoregulation, and thus the corresponding equations at each body part derived by Zhang [10].
    • In comparison with the reference building, in a building with high performance, the operative temperature maintains within the comfort range for a longer time with fewer fluctuations.

6. Limitations and Future Challenges

In this study, the advanced thermal comfort model (UCB thermal comfort) was applied. This model was developed based on intensive subjective experiments that were specially developed for automotive applications in which because of blown air from air vents with relatively high air velocity, the heat exchange between the local body surface and the surrounding thermal environment takes place through the dominant convection effect. However, in a room with a large radiant surface where the air movement is relatively low, the effect of convection heat transfer between the human and its environment is not dominant compared to the radiation effect. This model has been considered as the best available thermal comfort model for the evaluation of radiant systems, and correction of the comfort model for dominant radiation heat transfer is in process.
In this study, the floor and the lower body parts received radiation directly from the warm ceiling and other surfaces without any obstacle such as a table; otherwise, we assume that the thermal sensation of lower-body parts has a slightly cooler sensation than the presented results. Our pilot experiments with an influence of office desks were presented in Windsor conference 2018 [29].

Author Contributions

The project funding was acquired by A.W.; M.R.S. and A.W. conceived and designed the simulation scenarios. M.R.S. performed validations and the CFD–thermal comfort simulations and wrote the paper; L.W. performed transient simulations using TRNSYS software; A.W. improved the paper organization and English of the manuscript.

Funding

This work was supported by the Federal Ministry for Economic Affairs and Energy, BMWi, under project No. 03SBE0001 A (LowEx-Bestand).

Acknowledgments

The authors acknowledge support by the KIT-Publication Fund of the Karlsruhe Institute of Technology (KIT). They would like to express their gratitude to Hui Zhang from the Center for the Built Environment of UC Berkeley for her valuable comments, particularly with regard to the interpretation of local effects on thermal sensation values at the chest and back. They would like to thank Roberto Sabatino for the mesh analysis in the pilot CFD study, and Spencer Owen from the University of North Carolina at Charlotte, in the US for proofreading.

Conflicts of Interest

The authors declare no conflict of interest.

Appendix A

Figure A1. Comparisons between overall thermal sensation values calculated by UCB model-based 16 local thermal sensation values [10] and PMVs calculated using the six environmental and personal parameters [7] in the corner room with one facade.
Energies 12 03437 g0a1
Figure A2. Comparisons between overall thermal sensation values calculated by UCB model-based 16 local thermal sensation values [10] and PMVs calculated using the six environmental and personal parameters [7] in the corner room with two facades.
Energies 12 03437 g0a2

References

  1. Safizadeh, M.R.; Schweiker, M.; Wagner, A. Experimental Evaluation of Radiant Heating Ceiling Systems Based on Thermal Comfort Criteria. Energies 2018, 11, 2932. [Google Scholar] [CrossRef]
  2. Rhee, K.-N.; Kim, K.W. A 50 year review of basic and applied research in radiant heating and cooling systems for the built environment. Build. Environ. 2015, 91, 166–190. [Google Scholar] [CrossRef]
  3. Fanger, P.O.; Banhidi, L.; Olesen, B.W.; Langkilde, G. Comfort limits for heated ceilings. ASHRAE Trans. 1980, 86, 141–156. [Google Scholar]
  4. Atmaca, I.; Kaynakli, O.; Yigit, A. Effects of radiant temperature on thermal comfort. Build. Environ. 2007, 42, 3210–3220. [Google Scholar] [CrossRef]
  5. Huizenga, C.; Zhang, H.; Mattelaer, P.; Yu, T.; Arens, E.; Lyons, P. Window Performance for Human Thermal Comfort; Center for the Built Environment, University of California, Berkeley: Berkeley, CA, USA, 2006. [Google Scholar]
  6. Rowe, D. Effect on Thermal Comfort of Radiant Heat Exchange Near Single Glazed Windows. Archit. Sci. Rev. 2003, 46, 29–35. [Google Scholar] [CrossRef]
  7. ASHRAE-55. ANSI/ASHRAE Standard 55-2017: Thermal Environmental Conditions for Human Occupancy; ASHRAE: Atlanta, GA, USA, 2017. [Google Scholar]
  8. Chrenko, F.A. Heated Ceilings and Comfort. J. Inst. Heat. Vent. Eng. 1953, 20, 375–396. [Google Scholar]
  9. Heise, Z.; Huafen, H. A field study of occupant thermal comfort with radiant ceiling panel systems. ASHRAE Trans. 2013, 199, 1–8. [Google Scholar]
  10. Zhang, H. Human Thermal Sensation and Comfort in Transient and Non-Uniform Thermal Environments; University of California, Berkeley: Berkeley, CA, USA, 2003. [Google Scholar]
  11. Wang, Z.H.; Zhang, H.; Arens, E.; Lehrer, D.; Huizenga, C.; Yu, T.; Hoffman, S. Modeling thermal comfort with radiant floors and ceilings. In Proceedings of the 4th International Building Physics Conference, Istanbul, Turkey, 15–18 June 2009; Volume 94, pp. 9–10. [Google Scholar]
  12. Wang, D.; Zhang, H.; Arens, E.; Huizenga, C. Observations of upper-extremity skin temperature and corresponding overall-body thermal sensations and comfort. Build. Environ. 2007, 42, 3933–3943. [Google Scholar] [CrossRef] [Green Version]
  13. Tanabe, S.I.; Kobayashi, K.; Nakano, J.; Ozeki, Y.; Konishi, M. Evaluation of thermal comfort using combined multi-node thermoregulation (65MN) and radiation models and computational fluid dynamics (CFD). Energy Build. 2002, 34, 637–646. [Google Scholar] [CrossRef] [Green Version]
  14. Karacavus, B.; Aydin, K. Numerical investigation of general and local thermal comfort of an office equipped with radiant panels. Indoor Built Environ. 2019, 28, 806–824. [Google Scholar] [CrossRef]
  15. Han, C. Influence of laying position of capillary planar radiant air conditioner on thermal comfort. AIP Conf. Proc. 2019, 2106, 020008. [Google Scholar] [CrossRef]
  16. Alfano, F.R.D.A.; Dell’Isola, M.; Palella, B.I.; Riccio, G.; Russi, A. On the measurement of the mean radiant temperature and its influence on the indoor thermal environment assessment. Build. Environ. 2013, 63, 79–88. [Google Scholar] [CrossRef]
  17. Alfano, F.R.D.A.; Palella, B.I.; Riccio, G. Notes on the Calculation of the PMV Index by Means of Apps. Energy Procedia 2016, 101, 249–256. [Google Scholar] [CrossRef]
  18. Loga, T.; Stein, B.; Diefenbach, N.; Born, R. Deutsche Wohngebäudetypologie Beispielhafte Maßnahmen zur Verbesserung der Energieeffizienz von Typischen Wohngebäuden; Institut Wohnen und Umwelt GmbH (IWU): Darmstadt, Germany, 2015; p. 18. [Google Scholar]
  19. Zottl, A.; Nordman, R.; Miara, M. Benchmarking method of seasonal performance. IEE Proj. SEPEMO-Build 2012. [Google Scholar]
  20. Ornth, W. Bekanntmachung der Regeln zur Datenaufnahme und Datenverwendung im Wohngebäudebestand; Bundesministerium für Verkehr Bau und Stadtentwicklung: Germany, 2009; p. 23. [Google Scholar]
  21. Sabatino, R. A Coupled CFD and Thermoregulation Model to Evaluate Thermal Comfort Criteria in Asymmetrical Thermal Environments Created by Ceiling Heating Systems; Karlsruhe Institute of Technology (KIT): Karlsruhe, Germany, 2018. [Google Scholar]
  22. Wagner, A.; O’Brien, W.; Dong, B. Exploring Occupant Behavior in Buildings: Methods and Challenges; Wagner, A., O’Brien, W., Dong, B., Eds.; Springer International Publishing: Berlin/Heidelberg, Germany, 2017. [Google Scholar]
  23. Li, R.; Yoshidomi, T.; Ooka, R.; Olesen, B.W. Field evaluation of performance of radiant heating/cooling ceiling panel system. Energy Build. 2015, 86, 58–65. [Google Scholar] [CrossRef]
  24. Voelker, C.; Alsaad, H. Simulating the human body’s microclimate using automatic coupling of CFD and an advanced thermoregulation model. Indoor Air 2018, 28, 415–425. [Google Scholar] [CrossRef] [PubMed]
  25. Fiala, D. Dynamic Simulation of Human Heat Transfer and Thermal Comfort; De Montfort University: Leicester, UK, 1998. [Google Scholar]
  26. Zhang, H.; Arens, E.; Huizenga, C.; Han, T. Thermal sensation and comfort models for non-uniform and transient environments: Part I: Local sensation of individual body parts. Build. Environ. 2010, 45, 389–398. [Google Scholar] [CrossRef]
  27. Hensel, H. Thermal Sensations and Thermoreceptors in Man; Springfield: Thomas, IL, USA, 1982; ISBN 0398046980. [Google Scholar]
  28. Nicol, F.; Nikolopoulou, M.; Humphreys, M.; Liddament, M.; Loe, D.; Shelton, J.; Wilson, M.; Yao, R. Environmental criteria for design. In GVA/15 CIBSE Guide A Environmental Des. 2015; CIBSE: London, UK, 2016. [Google Scholar]
  29. Safizadeh, M.R.; Wagner, A. Evaluation of Radiant Ceiling Heating Systems for Renovated Buildings based on Thermal Comfort Criteria. In Proceedings of the 10th Windsor Conference: Rethinking comfort, Windsor, UK, 12–15 April 2018; pp. 128–142. [Google Scholar]
Figure 1. (a) Multi-family house constructed between 1958–1968 [18]; (b) Front side (left) and backside (right) of the building model used in simulations; (c) Home plan.
Energies 12 03437 g001
Figure 2. Presentation of all the considered renovation (left) and heating (right) scenarios for transient simulations.
Energies 12 03437 g002
Figure 3. Floor plan of a part of the multi-family house constructed between 1958–1968 [18].
Energies 12 03437 g003
Figure 4. Presentation of combinations of scenarios for the CFD–thermoregulation simulations.
Energies 12 03437 g004
Figure 5. Coupled CFD solver and thermophysiological model interface. Outputs from the CFD and the thermophysiological model are acquired after some internal iterations and convergences. In each iteration of the coupled model, the CFD and the thermophysiological model generate a new set of values for another model (Human icon made by Freepik from www.flaticon.com).
Energies 12 03437 g005
Figure 6. (a) CFD model layout and (b) fluid sub-domains and mesh elements.
Energies 12 03437 g006
Figure 7. Comparisons between the simulation results of the TRNBuild as well as CFD and the experimental data related to three radiant ceiling temperatures and three heights of sensors (10 cm, 60 cm, and 170 cm). The experimental data are shown in box plots, whereas the TRNBuild and CFD results are shown with triangle and circle symbols, respectively.
Energies 12 03437 g007
Figure 8. (a) Radiant ceiling temperatures, (b) Room air temperatures, and (c) Room operative temperatures associated with different supply water temperatures and different renovation scenarios on the first floor. The ceiling temperature depends on the control operation model in the way that the indoor operative temperature at the height of 60 cm (middle point of a sedentary person) lays between 19–21 °C. WR: Without renovation; PR: Partially renovated; AR: Ambitious renovation.
Energies 12 03437 g008
Figure 9. Heat losses through each surface of buildings with different renovation scenarios in a winter period in Potsdam. Ground: heat losses through the ground floor to ground; External walls: Heat losses through facades; Ground floor–First floor: heat exchange between the ground and first floor); First floor–Second floor: heat exchange between first and second floors; Second floor–Roof: Heat losses from the second/last floor to ambient through the roof. (a) Reference building: without renovation; (b) Partly renovation (EnEV standard); (c) Partly renovation (Passive House standard); (d) Ambitious renovation (EnEV standard); (e) Ambitious renovation (Passive House standard).
Energies 12 03437 g009
Figure 10. Temperature contour (x-y plane, z = 2 m) of the CFD simulations for the ceiling temperatures of 20 °C (a), 25 °C (b), 28 °C (c), 33 °C (d), 38 °C (e), and 45 °C (f) in the scenario with one low-performance façade.
Energies 12 03437 g010
Figure 11. Velocity contour (x-y plane, z = 2 m) of the CFD simulations for the ceiling temperatures of 20 °C (a), 25 °C (b), 28 °C (c), 33 °C (d), 38 °C (e) and 45 °C (f) in the scenario with one low-performance façade.
Energies 12 03437 g011
Figure 12. Air temperatures at selected body-limb locations in the middle room with one façade influenced by ceiling temperatures, quality of facades, and the position of the manikin.
Energies 12 03437 g012
Figure 13. Air temperatures at selected body limbs in the corner room with two facades influenced by the ceiling temperatures, quality of facades, and the position of the manikin.
Energies 12 03437 g013
Figure 14. Overall and local thermal sensation at selected body limbs in the middle room with one façade influenced by ceiling temperatures, quality of facades, and the position of the manikin. Nine-point thermal sensation scale: “very cold, −4”, “cold, −3”, “cool, −2”, “slightly cool, −1” to “neutral, 0” then to “slightly warm, +1”, “warm, +2”, “hot, +3” and “very hot, +4”.
Energies 12 03437 g014
Figure 15. Overall and local thermal sensation at selected body limbs in the corner room with two facades influenced by ceiling temperatures, quality of facades and the position of the manikin. Nine-point thermal sensation scale: “very cold, −4”, “cold, −3”, “cool, −2”, “slightly cool, −1” to “neutral, 0” then to “slightly warm, +1”, “warm, +2”, “hot, +3” and “very hot, +4”.
Energies 12 03437 g015
Figure 16. (a) Local thermal sensation state as a function of overall body thermal state and local skin temperature (°C) [26]. (b) Presentation of local skin temperatures at different ceiling temperatures as an example from other scenarios.
Energies 12 03437 g016
Figure 17. Overall and local thermal comfort at selected body limbs in the middle room influenced by ceiling temperatures, quality of facades, and the position of the manikin. Nine-point thermal comfort scale: “−4 = very uncomfortable”, “−2 = uncomfortable”, “0 = just uncomfortable”, “0+ = just comfortable”, “+2 = comfortable”, and “+4 = very comfortable”.
Energies 12 03437 g017
Figure 18. Overall and local thermal comfort at selected body limbs in the corner room influenced by ceiling temperatures, quality of facades, and the position of the manikin. Nine-point thermal comfort scale: “−4 = very uncomfortable”, “−2 = uncomfortable”, “0 = just uncomfortable”, “0+ = just comfortable”, “+2 = comfortable”, and “+4 = very comfortable”.
Energies 12 03437 g018
Figure 19. Local thermal sensation asymmetry between right and left sides of selected pairs of the body parts (a,b) and room surfaces’ temperatures (c,d) corresponding to four ceiling temperatures and the qualities of two façades in the corner room.
Energies 12 03437 g019
Table 1. Specifications of a radiant heating system that consists of capillary tubes.
Pipe Spacing (Center to Center)Pipe Outside DiameterPipe Wall ThicknessPipe Wall Thermal Conductivity
[m][m][m][W/(m·K)]
0.0250.0050.0010.35
Table 2. Input parameters for infiltration rate.
Without Renovation (Reference Building)Partly Renovation (EnEV 2016)Partly Renovation (Passive House)Ambitious Renovation (EnEV 2016)Ambitious Renovation (Passive House)
Infiltration rate [1/h]0.50.20.10.10.05
Table 3. U-values (W/m²·K) and heat capacities (kJ/kg·K) of the building envelope for different refurbishment scenarios [20]. EnEV: Energy Saving Ordinance is a regulation in Germany describing minimum requirements regarding energy use of new and renovated buildings.
Without Renovation (Reference Building)Partial Renovation (EnEV 2016)Partial Renovation (Passive House)Ambitious Renovation (EnEV 2016)Ambitious Renovation (Passive House)Heat Capacity
Roof0.60.60.60.20.111.25
Ceiling0.80.80.80.320.120.83
Floor1.01.01.00.320.231.05
External Wall1.40.250.140.250.140.77
Window2.831.260.891.260.89-

