Article

Development of Thermal Comfort-Based Controller and Potential Reduction of the Cooling Energy Consumption of a Residential Building in Kuwait

1
Energy Efficiency Building Materials Center, Energy Division, Korea Conformity Laboratories (KCL), 73 Yangcheong 3-gil, Ochang-eup, Cheongju-si, Chungbuk 28115, Korea
2
Department of Architecture & Architectural Engineering, Yonsei University, 50 Yonsei-ro, Seodaemun-gu, Seoul 03722, Korea
3
Future Agricultural Research Division, Korea Rural Research Institute, 870 Haean-ro, Sangnok-gu, Ansan-si, Gyeonggi-do 15634, Korea
*
Author to whom correspondence should be addressed.
Energies 2019, 12(17), 3348; https://doi.org/10.3390/en12173348
Submission received: 30 July 2019 / Revised: 15 August 2019 / Accepted: 28 August 2019 / Published: 30 August 2019

Abstract

:
In Kuwait, where the government subsidizes approximately 95% of residential electricity bills, most of the country’s energy consumption is for residential use. In particular, air-conditioning (AC) systems for cooling, which are used throughout the year, are responsible for residential electric energy consumption. This study aimed to reduce the amount of energy consumed for cooling purposes by developing a thermal comfort-based controller. Our study commenced by using a simulation model to investigate the possibility of energy reduction when using the predicted mean vote (PMV) for optimal control. The result showed that control optimization would enable the cooling energy consumption to be reduced by 33.5%. The influence of six variables on cooling energy consumption was then analyzed to develop a thermal comfort-based controller. The analysis results showed that the indoor air temperature was the most influential factor, followed by the mean radiant temperature, the metabolic rate, and indoor air velocity. The thermal comfort-based controller-version 1 (TCC-V1) was developed based on the analysis results and experimentally evaluated to determine the extent to which the use of the controller would affect the energy consumed for cooling. The experiments showed that the implementation of TCC-V1 control made it possible to reduce the electric energy consumption by 39.5% on a summer representative day. The results of this study indicate that it is possible to improve indoor thermal comfort while saving energy by using the thermal comfort-based controller in residential buildings in Kuwait.

1. Introduction

1.1. Background and Objective

As the amount of fossil fuel use increases, the amount of CO2 generated artificially increases greatly, and therefore many problems, such as global warming, are caused by the greenhouse effect [1]. Since most of these greenhouse gases are generated by energy use, active measures such as energy saving and energy efficiency improvement should be taken to reduce energy consumption, In the building sector, it consumed more than 40% of global energy mainly electricity and emit 1/3 of global greenhouse gas through combustion of fossil fuels for generating electricity [2,3].
Kuwait is one of the countries with the highest energy consumption in the world. According to the Kuwait Ministry of Energy and Water (MEW), Kuwait’s annual energy consumption per capita in 2014 was approximately 15,213 kWh, ranking seventh in the world. In addition, the power generation capacity of the power plant built in Kuwait is approximately 18,259 MW as of 2015 and the annual average increase in the power generation capacity has approximated 5% since 2000. Therefore, reducing the electric energy consumption is one of the country’s major challenges [4].
According to the MEW, the Kuwaiti sector with the highest energy consumption is residential buildings, as shown in Figure 1, and this sector accounts for approximately 49% of the country’s total energy consumption. Of this amount, the largest portion, approximately 60%, is used for air-conditioning (AC) in residential buildings. Therefore, at government level, it has become a matter of great urgency to reduce the energy consumed for cooling purposes in residential buildings in Kuwait.
Residential homes in Kuwait use large amounts of energy for cooling because Kuwait has the hottest weather in the Arabian Peninsula with its tropical desert climate. Moreover, residents receive a subsidy on electricity rates, use air-conditioning throughout the year, with few variations in the temperature during the year [5].
A study on the energy-consuming behavior of home occupants in Kuwait was carried out by Al-Mumin et al. [6]. Their investigation showed that excessive energy usage could be attributed to leaving on the lights or not controlling the air conditioners regardless of whether they were in the room. In addition, the possibility of energy reduction depending on occupant behavior was investigated by using simulation. Studies showed that turning on/off the lights according to the occupants’ schedule and lowering the cooling setpoint to 24 °C could reduce electrical energy consumption by approximately 36%.
Ameer and Krarti [7] explained why Kuwait was finding it difficult to meet the demand for electric energy during the summer season, namely, the fact that 95% of the electricity bill of each residential house is subsidized gives residents little incentive to conserve electricity. This subsidy places a significant financial burden on the government and ultimately affects all Kuwaitis negatively. This study suggested a solution to sustain the energy supply to all residential homes and to reduce government expenditure on energy subsidies. Their suggested approach would be to strengthen the building energy code issued by the MEW, implement a rebate policy, and increase the electricity bill gradually. This study determined that it would be possible to reduce the subsidy by up to 61% of the existing energy subsidy.
Kellow [8] pointed out that the MEW implemented building energy conservation standards as the problem of energy consumption became more serious. The standards cover building elements such as insulation, windows, and types of glass, and AC systems. According to their simulation results, these building standards would be able to reduce the growth rate of the peak electrical load by 25%. This would also stem the rate at which the annual electrical energy production would need to grow by 12%, which corresponds to a saving of approximately 65 million barrels of oil.
This means that automatic control is essential to reduce building energy consumption in Kuwait. The objective of automatic control is to reduce energy consumption while maintaining the occupants’ optimal thermal comfort. Thus far, indoor temperature control has been performed passively depending on the occupants’ temperature requirements. However, research showed this control method to be unsuitable to control the AC systems of residential buildings for the purpose of comfort, because it may not only result in an uncomfortable indoor thermal environment but could also waste cooling or heating energy [9].
In addition, temperature control is important in terms of reducing the energy consumption of a building and reducing device capacity. Sadineni and Boehm [10] investigated the potential of peak electrical load reduction in a climate dominated by the need for cooling. The simulation results showed that a 2.2 °C increase in thermostat temperature decreased the average demand for the peak period (1:00 p.m.–7:00 p.m.) by 69% of the demand of a standard home.
Li et al. [11] investigated the effect of optimizing the control of the indoor thermal environment for thermal comfort and energy saving based on online monitoring of thermal sensation. The results showed that thermal sensation-based control could adjust the temperature setting in a timely fashion according to the occupants’ integrated thermal sensations, although they do not necessarily state their subjective perception. Their work also revealed that thermal sensation-based control can achieve a more comfortable thermal environment than setpoint-based control. Furthermore, thermal sensation-based control saves 13.8% in daily energy consumption compared to the setpoint-based control method.
Given these conditions, a technical solution appears to be the most likely to reduce residential energy consumption effectively. The most realistic way to lower the energy consumption at present is to reduce energy wastage by appropriately adjusting the cooling setpoint temperature. That is, if the cooling temperature setting is appropriately adjusted such that it corresponds to the thermal comfort level experienced by the occupant, the amount of electric energy that is wasted can be reduced.
This motivated us to develop a thermal comfort-based controller (TCC) using the predicted mean vote (PMV) index, which is used to automatically control the setpoint temperature of the AC system to optimize the thermal comfort of the occupant. The optimal set temperature is automatically calculated based on the thermal comfort indicator measured in real time in the controller, and the set temperature is transmitted to the AC by the communication device to save electric energy. This study quantitatively compared the cooling energy consumption according to the application of the controller using a real-scale climatic environment chamber that can be tested using a real model.

1.2. Previous Work

According to the survey of Al-Mumin et al. [6], the AC temperature setpoint of most Kuwaiti houses was very low and was not controlled in correspondence with continuously changing indoor and outdoor environments. Generally, most Kuwaiti houses have central AC systems and all rooms are air-conditioned all day long throughout the summer season (mid-March until the end of November).
Previous research discovered that, if the AC set temperature is controlled such that it corresponds to the indoor and outdoor environment, the cooling energy consumption can be greatly reduced. Therefore, a strategy that minimizes the cooling energy consumption while optimizing the thermal comfort of residents is required. This study proposes the use of TCC using PMV [12,13], which is the most commonly used thermal comfort indicator. The PMV index, which is determined by four objective and two subjective variables, is expressed on a scale of −3 to 3 and the comfort level is expressed on a scale of −0.5 to 0.5.
Previous studies have shown that using the PMV index can reduce energy consumption without sacrificing thermal comfort [14]. For example, Yan et al. [15,16] found that when a fuzzy logic controller based on PMV is applied to a direct expansion type of AC in Hong Kong, their indoor experiment with small scale model showed that the electric energy consumption could be reduced by 4−7.6%.
Goyal et al. [17] analyzed the extent to which rule-based feedback control and model predictive control (MPC) algorithms, both of which used the PMV index, affected the energy consumption of AC systems in a commercial building in Florida, USA. Both algorithms reduced energy consumption by approximately 40% compared to conventional controllers without sacrificing thermal comfort. These results were similar to those of a simulation study by Goyal et al. [18]. To summarize, the use of rule-based feedback control algorithms is simpler than that of MPC algorithms and rule-based feedback control produced fewer errors. Therefore, because the performance difference between the two algorithms is not large, feedback control, which is a simpler control algorithm, is more economical. The main disadvantage of MPC is that substantial computational resources are required for model development and optimization [19].

2. Energy Saving Potential of Thermal Comfort-Based Control

This section describes the use of building energy simulation (BES) to investigate the energy saving potential of the thermal comfort-based control for houses in Kuwait. BES has been developed as a tool to assess the impact of energy conservation measures through complex calculations of the energy performance of existing buildings [20,21]. The BES has the capability of determining the effect of automatic control based on the thermal comfort of the occupants. To this end, we established a model to simulate a house in Kuwait by using the structure and occupancy information of buildings. The simulation model was then calibrated by conducting a comparison with the measured data. Ahmad et al. [22] showed that an uncalibrated simulation model produced a discrepancy between the monitored and calculated consumption levels in the ±30% range, and the discrepancy would rise to the ±90% range for end-use. Therefore, the simulation model was calibrated to ensure the reliability of the results. The reduction in cooling energy consumption was quantitatively derived using the calibrated model when the control method based on thermal comfort was applied.

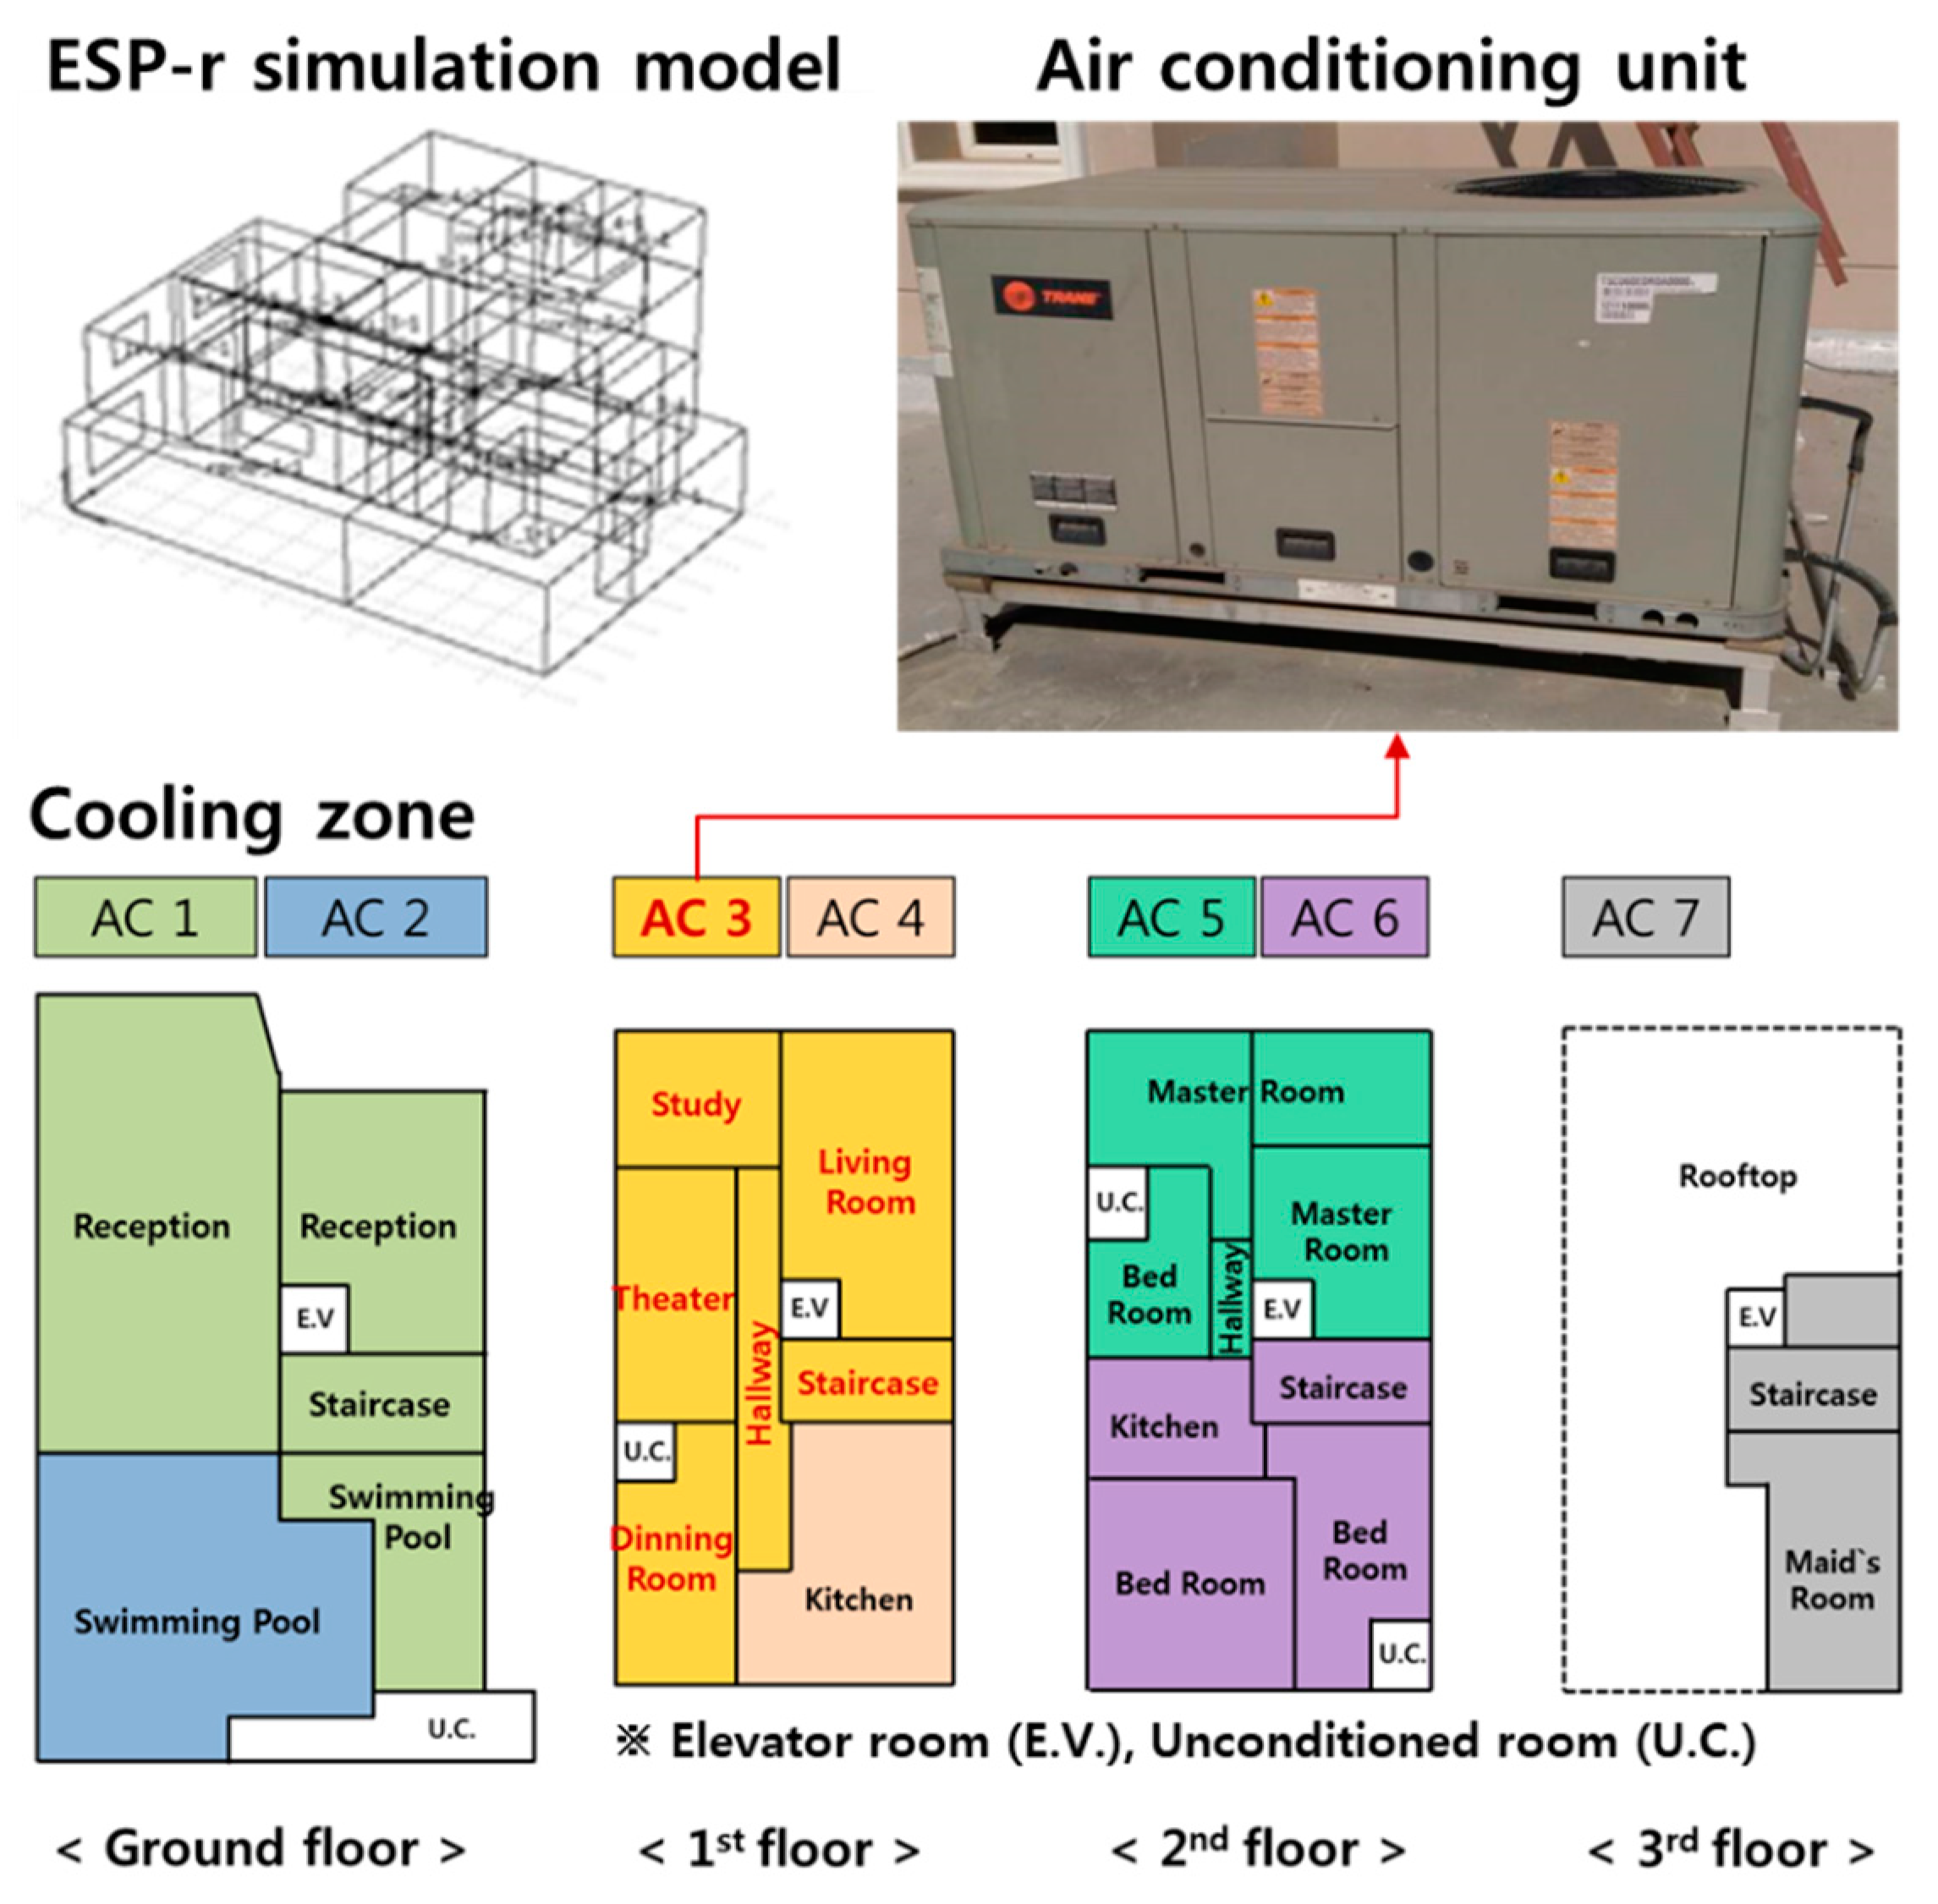
2.1. Establishment of a Simulation Model

Experiments using a simulation model contribute to decision-making because results are easily obtained and examined within a short duration [23]. To obtain reliable results, however, the simulation model must accurately simulate the thermal behavior of actual houses in Kuwait. Therefore, in this study, a typical Kuwaiti house, as shown in Table 1, was selected as the study target to establish an accurate simulation analysis model. In addition, information about the building such as its geometry, structure, occupancy, and operating information were mostly obtained from drawings (architectural, electric, and mechanical drawings) and interviews with the residents.
The target building was a typical three-story house occupied by six residents, including two maids. The building was constructed using reinforced concrete for the structure and soil cement blocks. Figure 2 shows the drawings that were provided of the configuration of building materials. The thermal performance of the wall, as calculated using the provided information, was found to be 0.579 W/m2K. The window consisted of an aluminum frame and double pane clear glazing, and its thermal performance was 3.299 W/m2K. The exterior of the window was fitted with an aluminum shutter to block solar radiation, a main cause of the rise in the indoor cooling energy consumption during the daytime. This is the typical structure of ordinary houses in Kuwait, and the structure is almost standardized. In addition, the thermal performance of roofs, interior walls, floors, slabs, and doors calculated by the drawings provided was 0.410 W/m2K, 1.186 W/m2K, 0.396 W/m2K, 2.296 W/m2K, and 3.316 W/m2K, respectively.
ESP-r was used as the simulation tool to investigate performance of thermal comfort-based controller. ESP-r provides dynamic simulation and the result of simulation is well-validated through many experiments and inter-program comparisons [24]. In addition, ESP-r enables code modification as an open-source-based tool and therefore provides extensive flexibility such as implementation of thermal comfort-based controller. To find the optimal set temperature in ESP-r, code that determines the temperature at which PMV is close to zero was added. Figure 3 shows the execution sequence. A subroutine LETDRIVR evaluates the physiological and sensory response of the human subject to the thermal environment and returns PMV using the array of set-temp. The optimal set temperature was computed iteratively at each simulation time step, hence, the value of setpoint, which is the optimal set temperature calculated based on the current time, becomes the set temperature of the next time step.
A simulation model was established based on the provided drawings and the information gathered during interviews, as shown in Figure 4. The AC installed in the building was the CAV rooftop package unit. Figure 4 shows the HVAC system zoning of the building on the mechanical drawing.

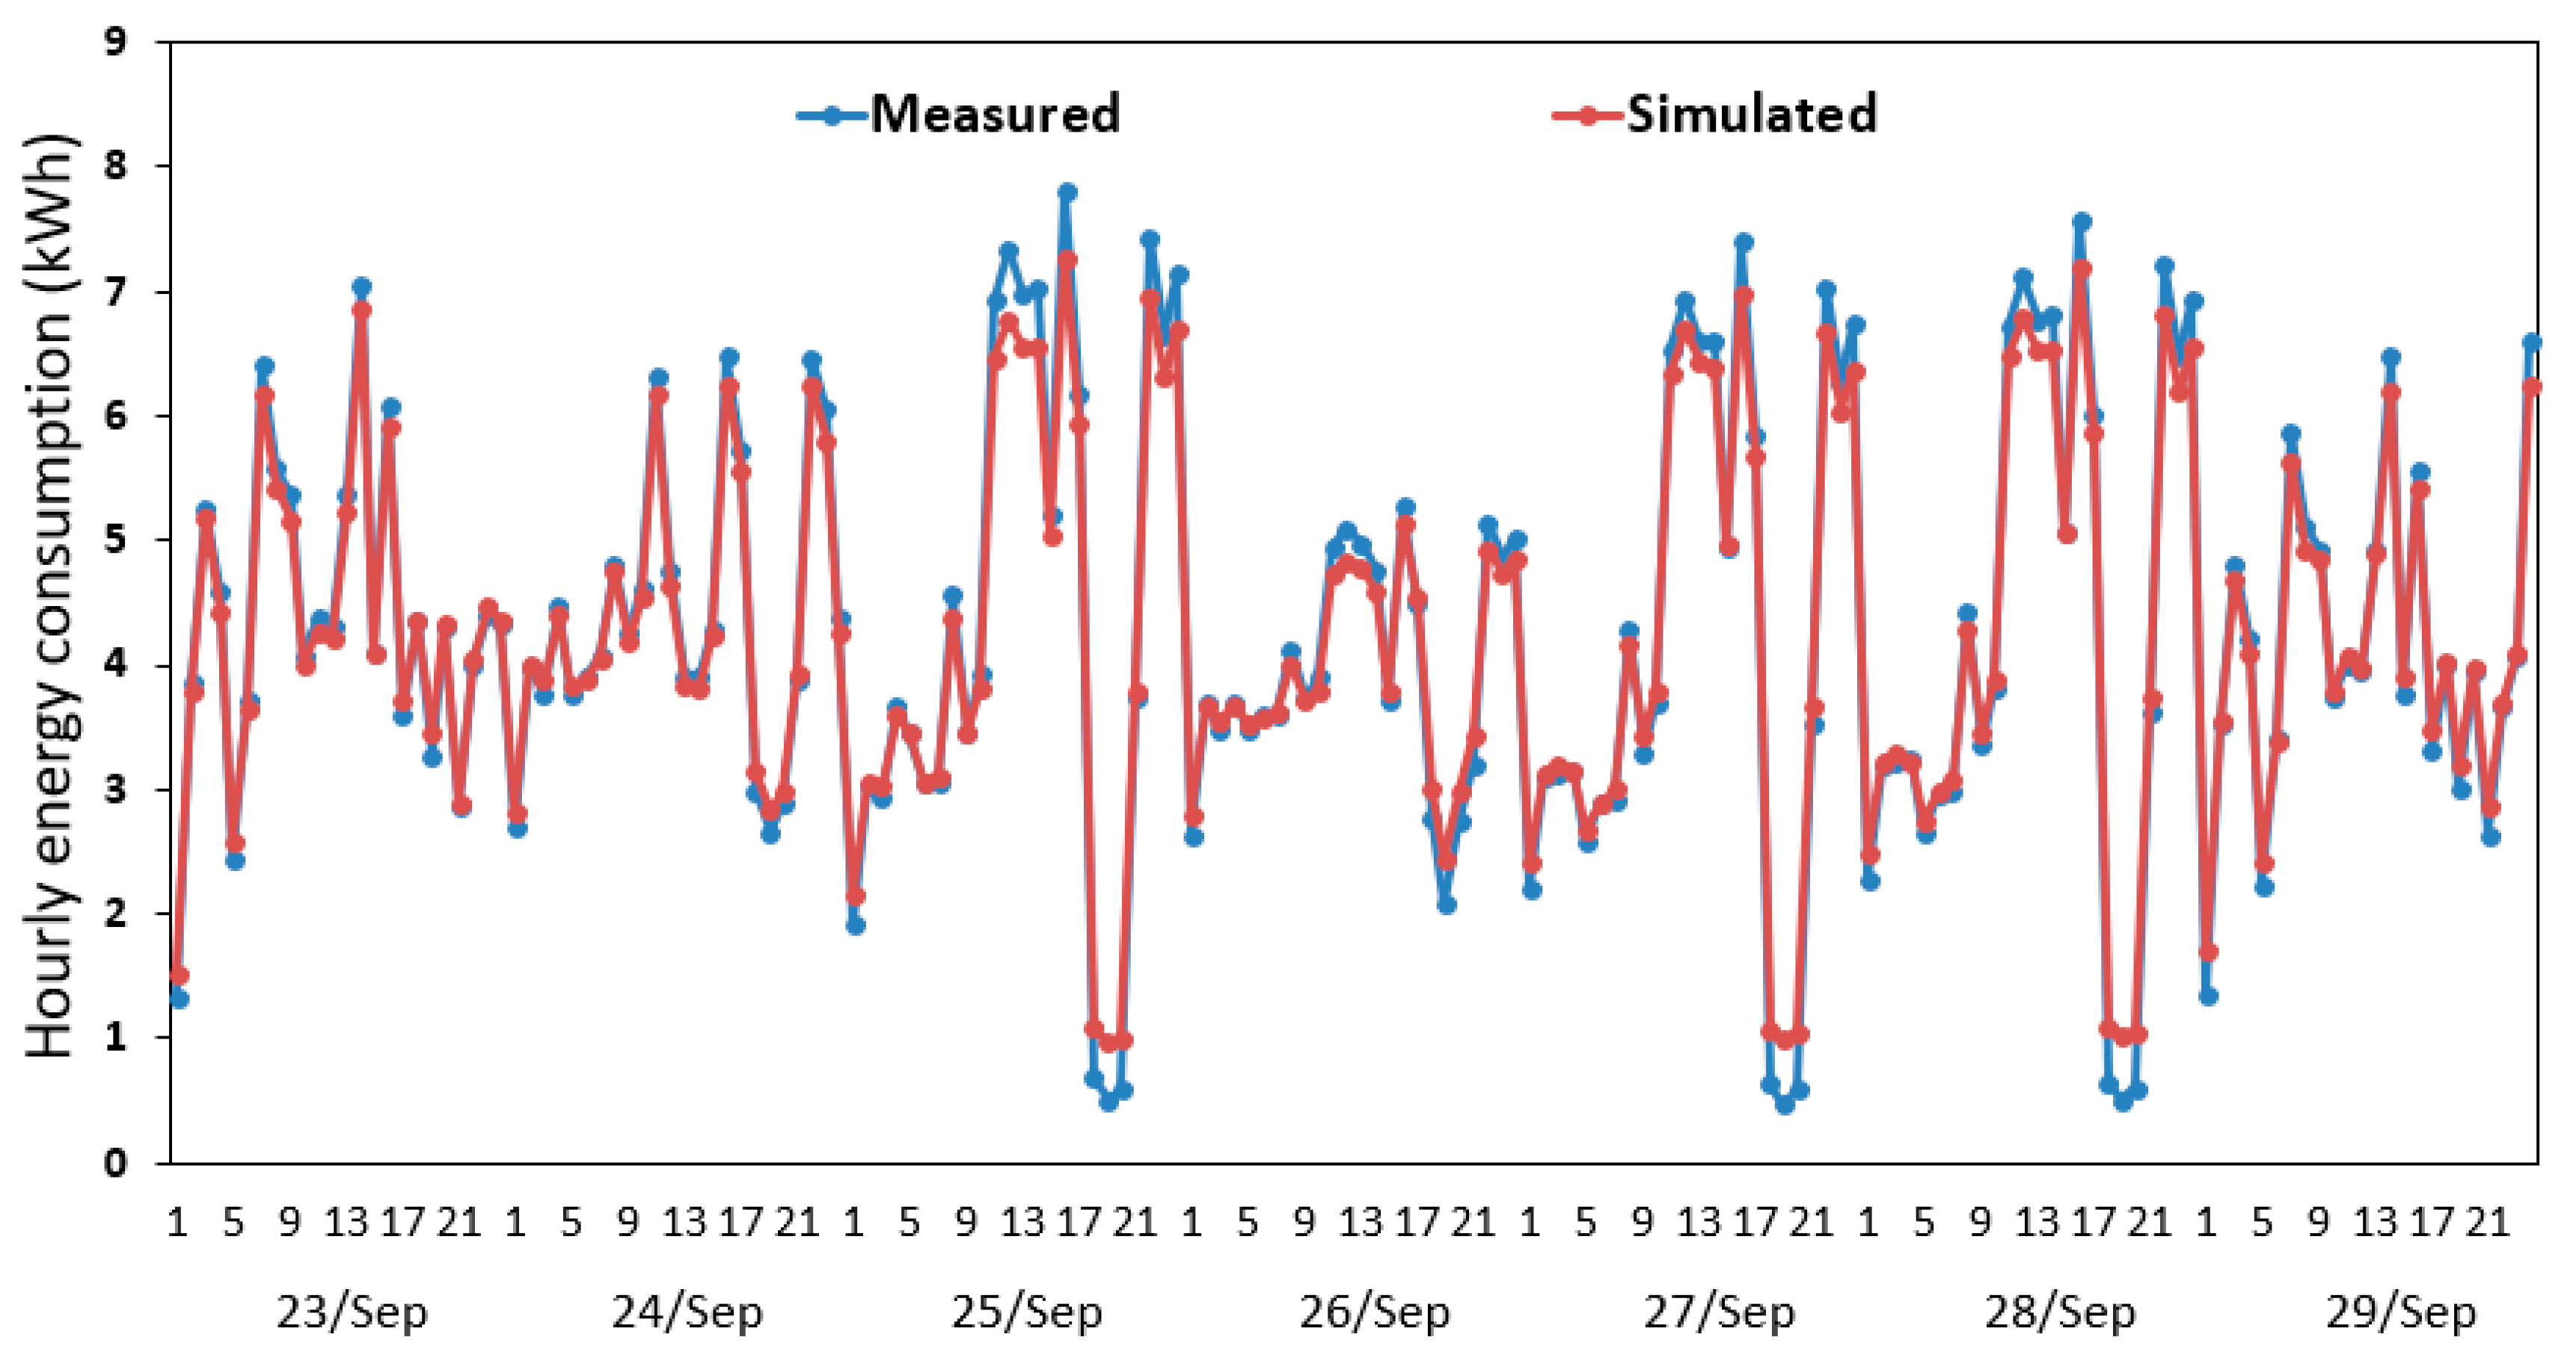
2.2. Calibration of Simulation Model

The simulation model was calibrated by collecting information on the external environment, electrical power consumption, and occupancy pattern of the target building in 2017. The hourly external environmental measurement items were air temperature, humidity, irradiance, wind direction, and wind speed, and were collected through weather station (DAVIS 6250) installed on the roof. The electrical energy consumption was collected from the distribution panel, and the occupancy pattern was collected by the infrared indoor motion detecting device on the ceiling. As the target building was an actual residential house, the possibilities of performing experiments and evaluations for the entire house were limited. Therefore, only the AC3 zone on the 1st floor, which was the space shared by the family members, was available for correcting the simulation results and for verifying the PMV-based controller to be developed. In addition, the electrical power consumption and occupancy pattern of the AC3 zone were monitored. As the simulation calibration for the AC3 zone involved significantly large errors while the building was being used by the occupants, it was not possible to secure reliable data for the simulation correction. Therefore, a more accurate simulation calibration was performed using the data collected from September 23 to 29 when none of the occupants were at home.
Figure 5 shows the corrected results of the simulation model as well as the daily errors during the calibration period. In terms of the calibration of the simulation model, the ASHRAE guideline 14 [25] specifies a coefficient of variation of root-mean-squared error (CV-RMSE) of 30% or less and a mean bias error (MBE) of ±15% for hourly data. The corrected MBE of the model based on hourly data was found to be -13%, but the calculated RMSE was approximately 36%, which slightly exceeded the ASHRAE guideline 14 criterion of 30%. As mentioned above, data collection and calibration were performed under limited conditions, which limited the accuracy of the simulation model. Therefore, when the calibration of the simulation model was made based on measured data, it was not easy to meet the CV-RMSE requirement of 30% or less considering the uncertainty of variables due to various constraints. Therefore, the simulation was performed after deciding that 6% would not significantly affect the results of the simulation. According to the calibration results, the difference between the simulation results and the measured hourly energy consumption was up to about 5.6 kWh.

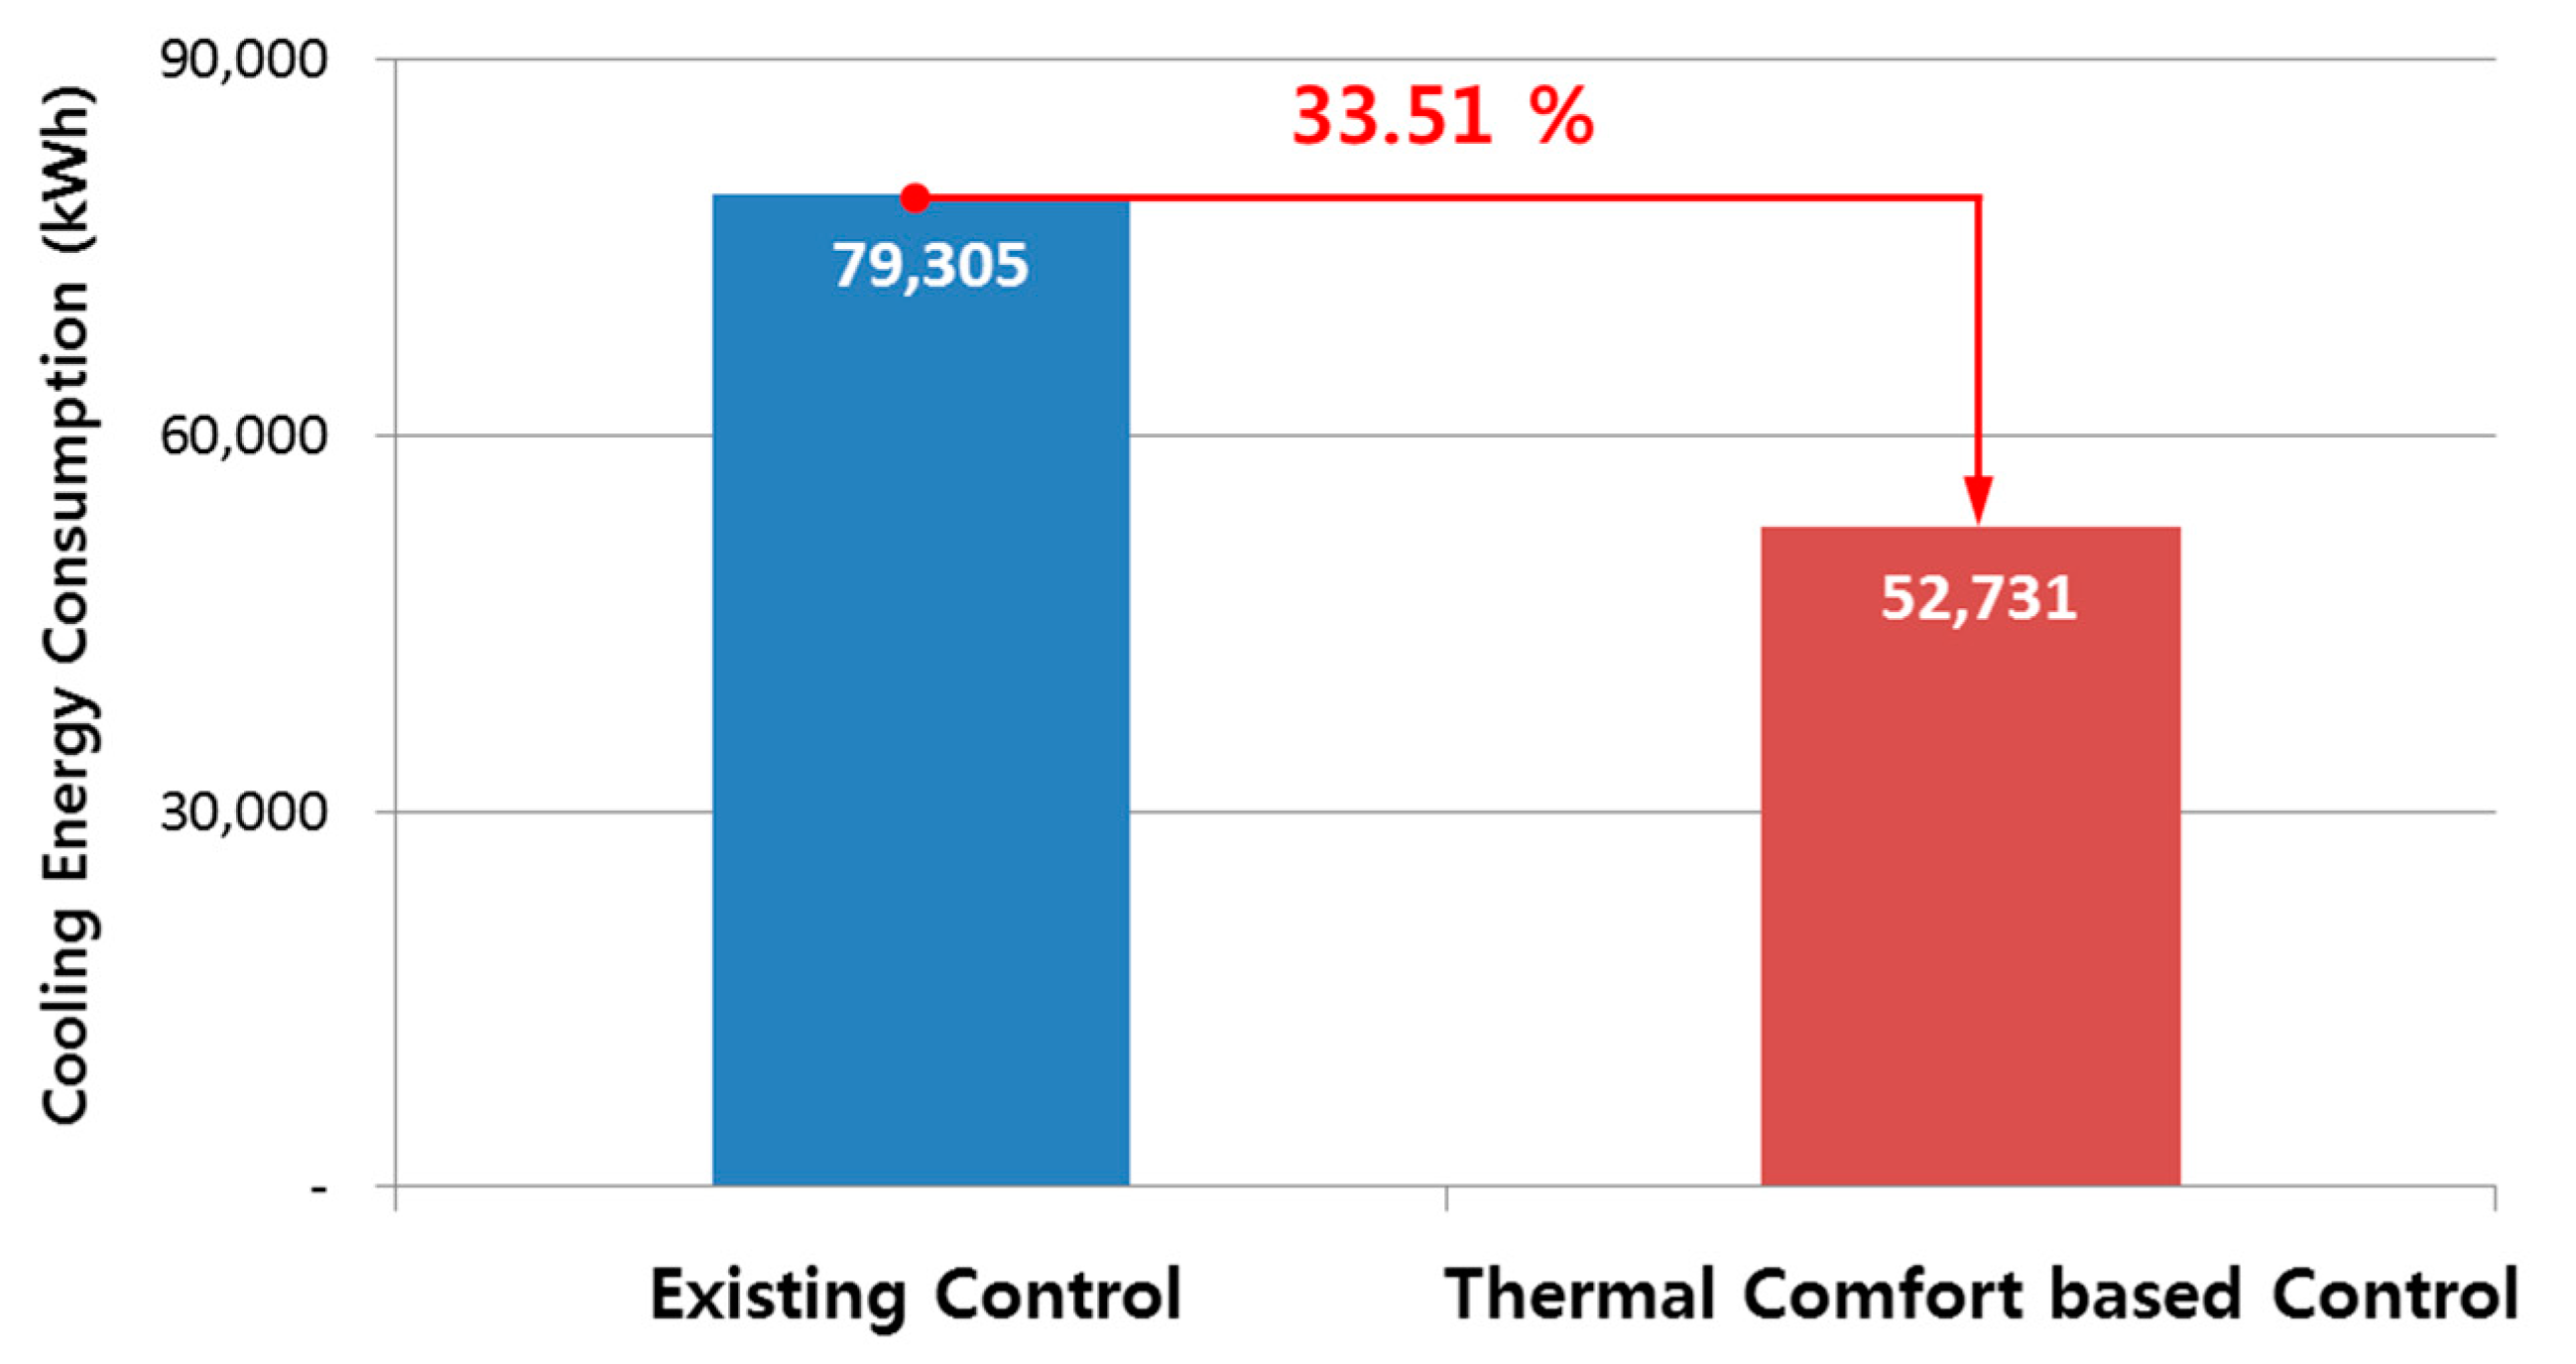
2.3. Implementation of Simulation and Result Analysis

Among the data required for PMV calculation, the temperature, mean radiant temperature (MRT), humidity, and the airflow velocity, which are objective indicators, are calculated with the simulation tool. However, the metabolic rate of people (MET) and cloth value of people (CLO), which are subjective indicators, must be provided separately. Therefore, the value of MET was assumed to be 90 W/m2 in this study. The value of CLO was assumed to be 0.5 for summer and 1.0 for intermediate and winter seasons by referring to ASHRAE standard 55 [25]. For the target building, the annual indoor set temperatures, which were manually set by the occupants, were examined by interviewing the residents, and the results are shown on the left in Table 2. The change in the optimal set temperature (PMV = 0) of the AC3 zone obtained by simulation is shown in Table 2 on the right. The set temperature optimized using PMV sharply changed on May 1 and October 1 because of the change in the CLO value. Al-Mumin et al [6] investigated occupancy patterns and operation schedules of electrical appliances in Kuwait house, and their survey results were applied to the simulation model.
The reduction in the annual cooling energy consumption in the AC3 zone was calculated by implementing thermal comfort-based AC control in the simulation, and the results are shown in Figure 6. According to the simulation results, the annual cooling energy consumption was 79,305 kWh when manually controlled by the occupants but it decreased to 52,731 kWh under automatic thermal comfort-based control. In other words, the cooling energy consumption was reduced by 33.5% by using thermal comfort-based control. Therefore, the simulation confirmed that a considerable amount of cooling energy could be saved by appropriately controlling the AC set temperature alone in Kuwaiti houses.

3. Development of Thermal Comfort-Based Controller

The simulation results in Section 2 showed that the cooling energy consumption can be greatly reduced by using a thermal comfort-based controller. Based on this possibility, this study developed TCC suitable for a residential house in Kuwait. Existing developments and applications of a temperature controller using the PMV index are first discussed. Then, our approach to developing TCC for a Kuwaiti residential house based on sensitivity analysis and measured data is presented. Finally, the method for the configuration and control of the TCC that was developed based on the results of the study is introduced.

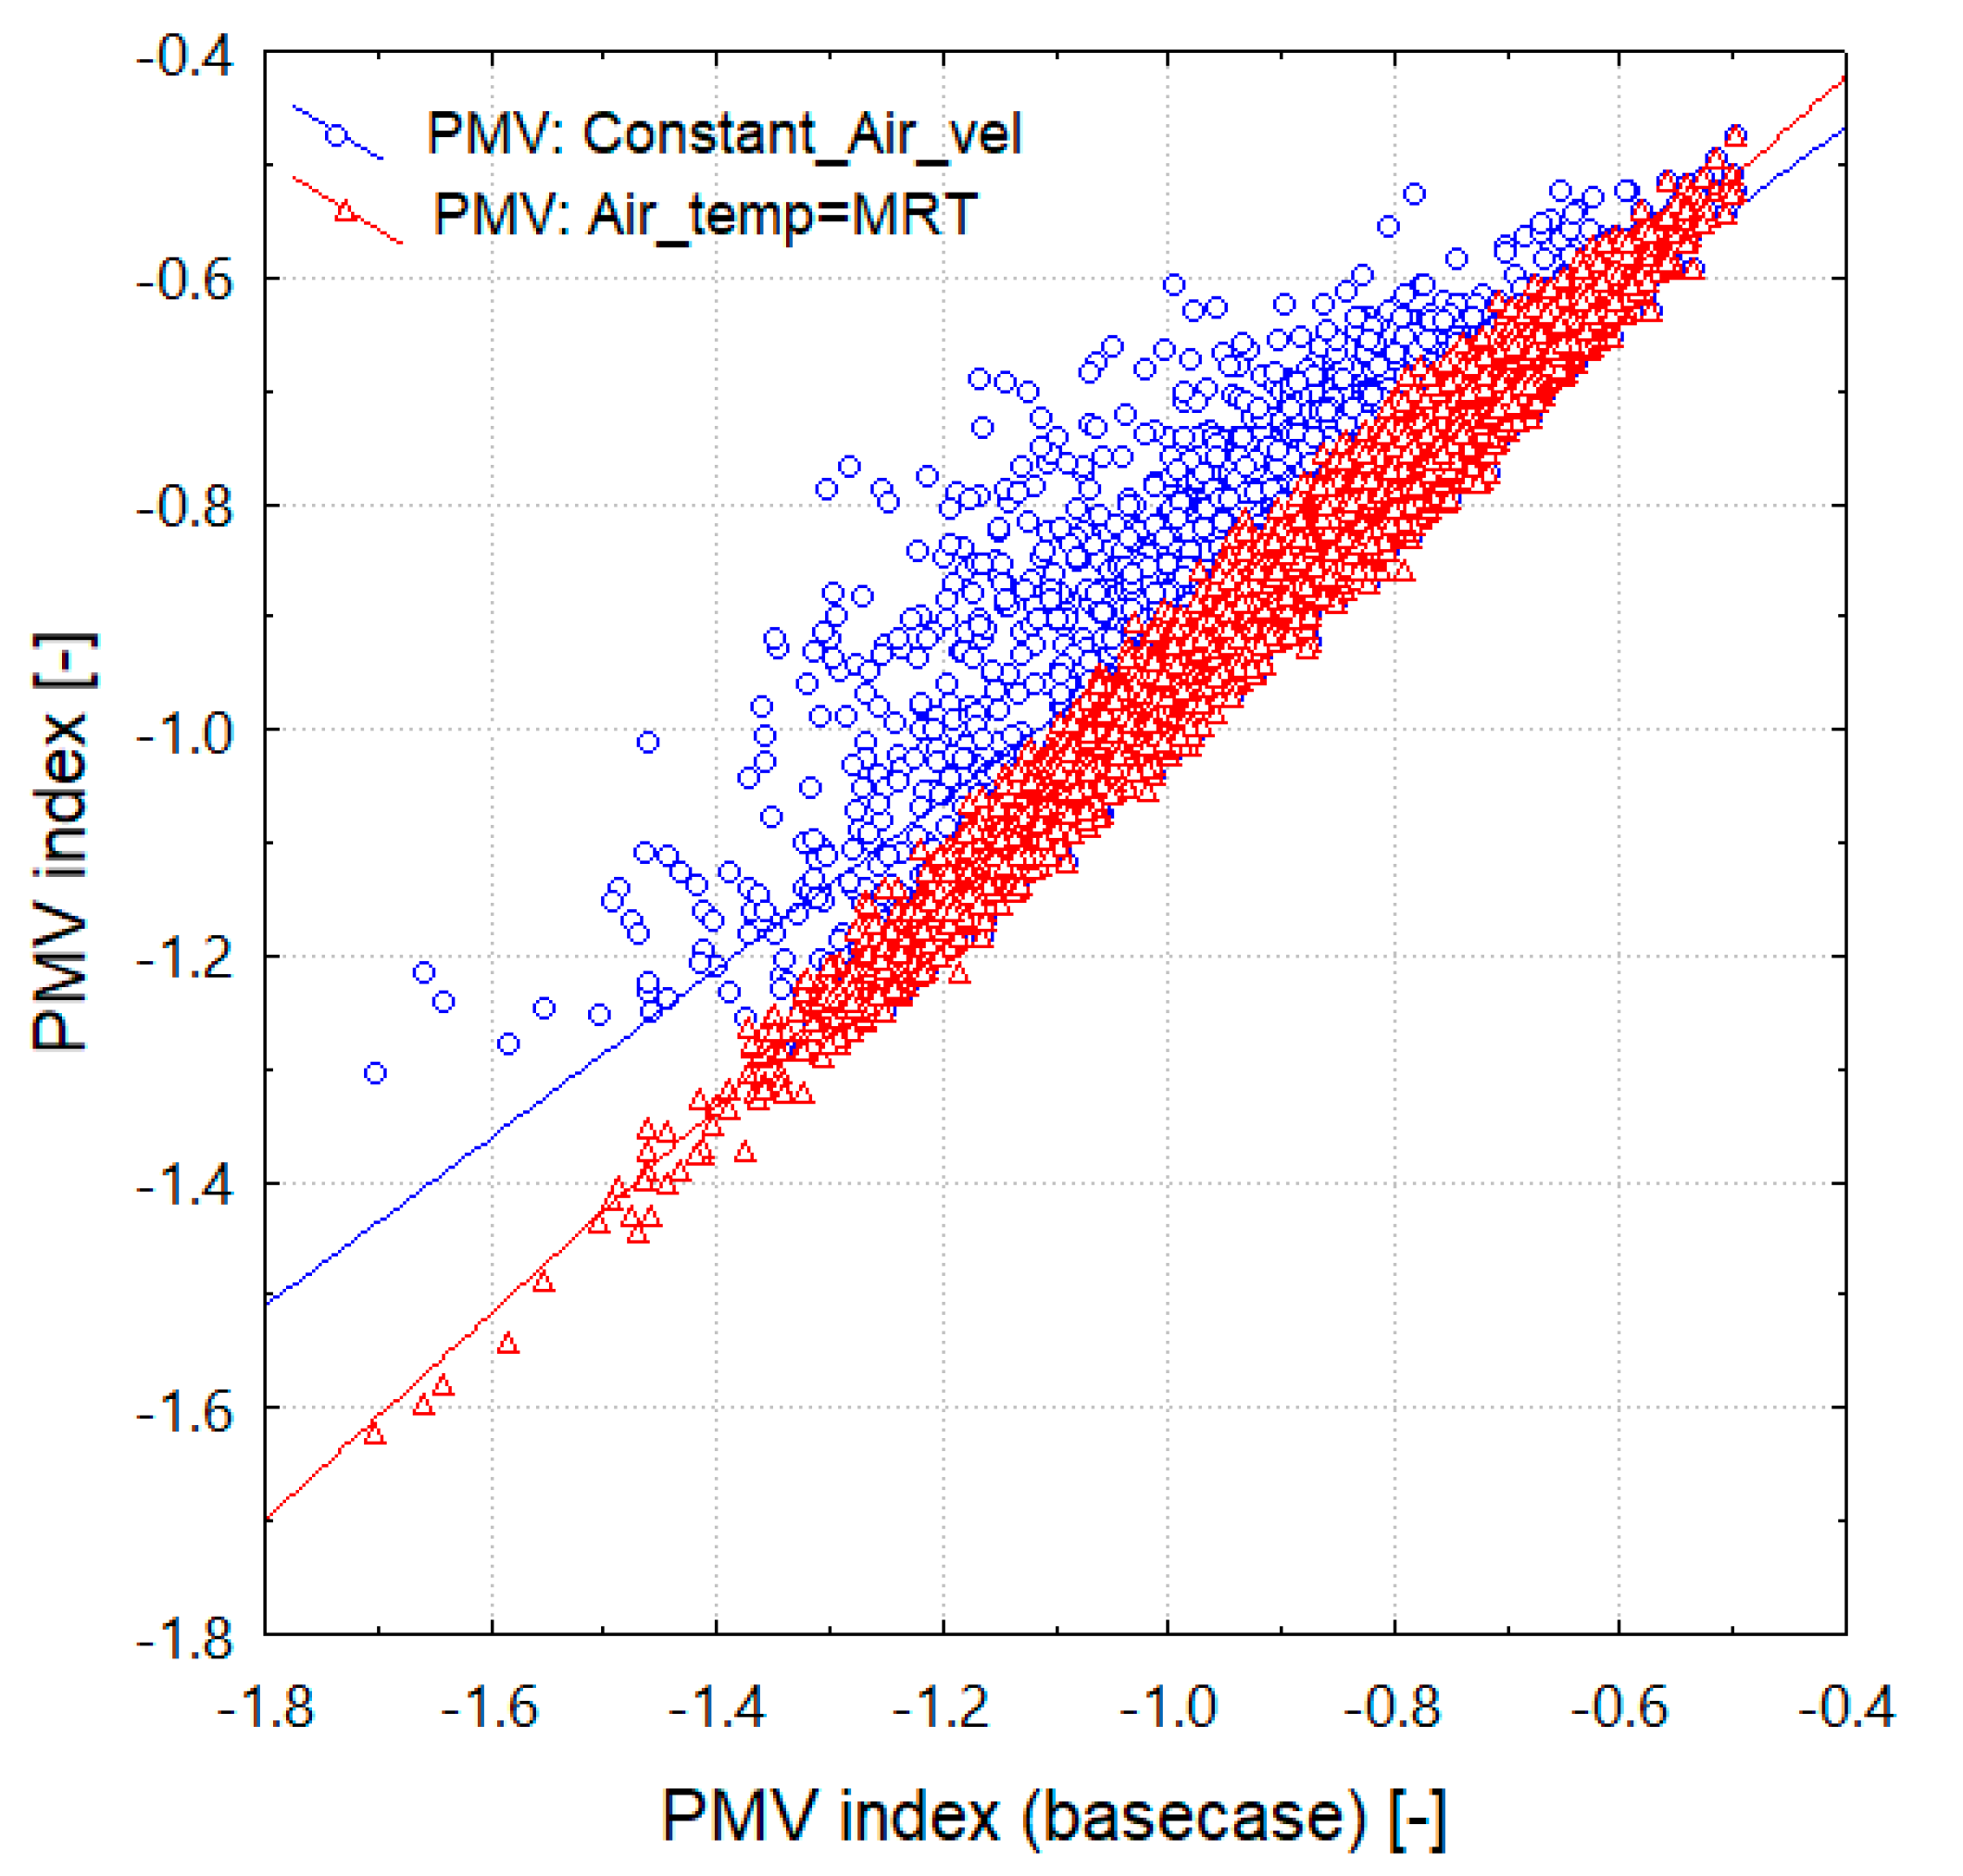
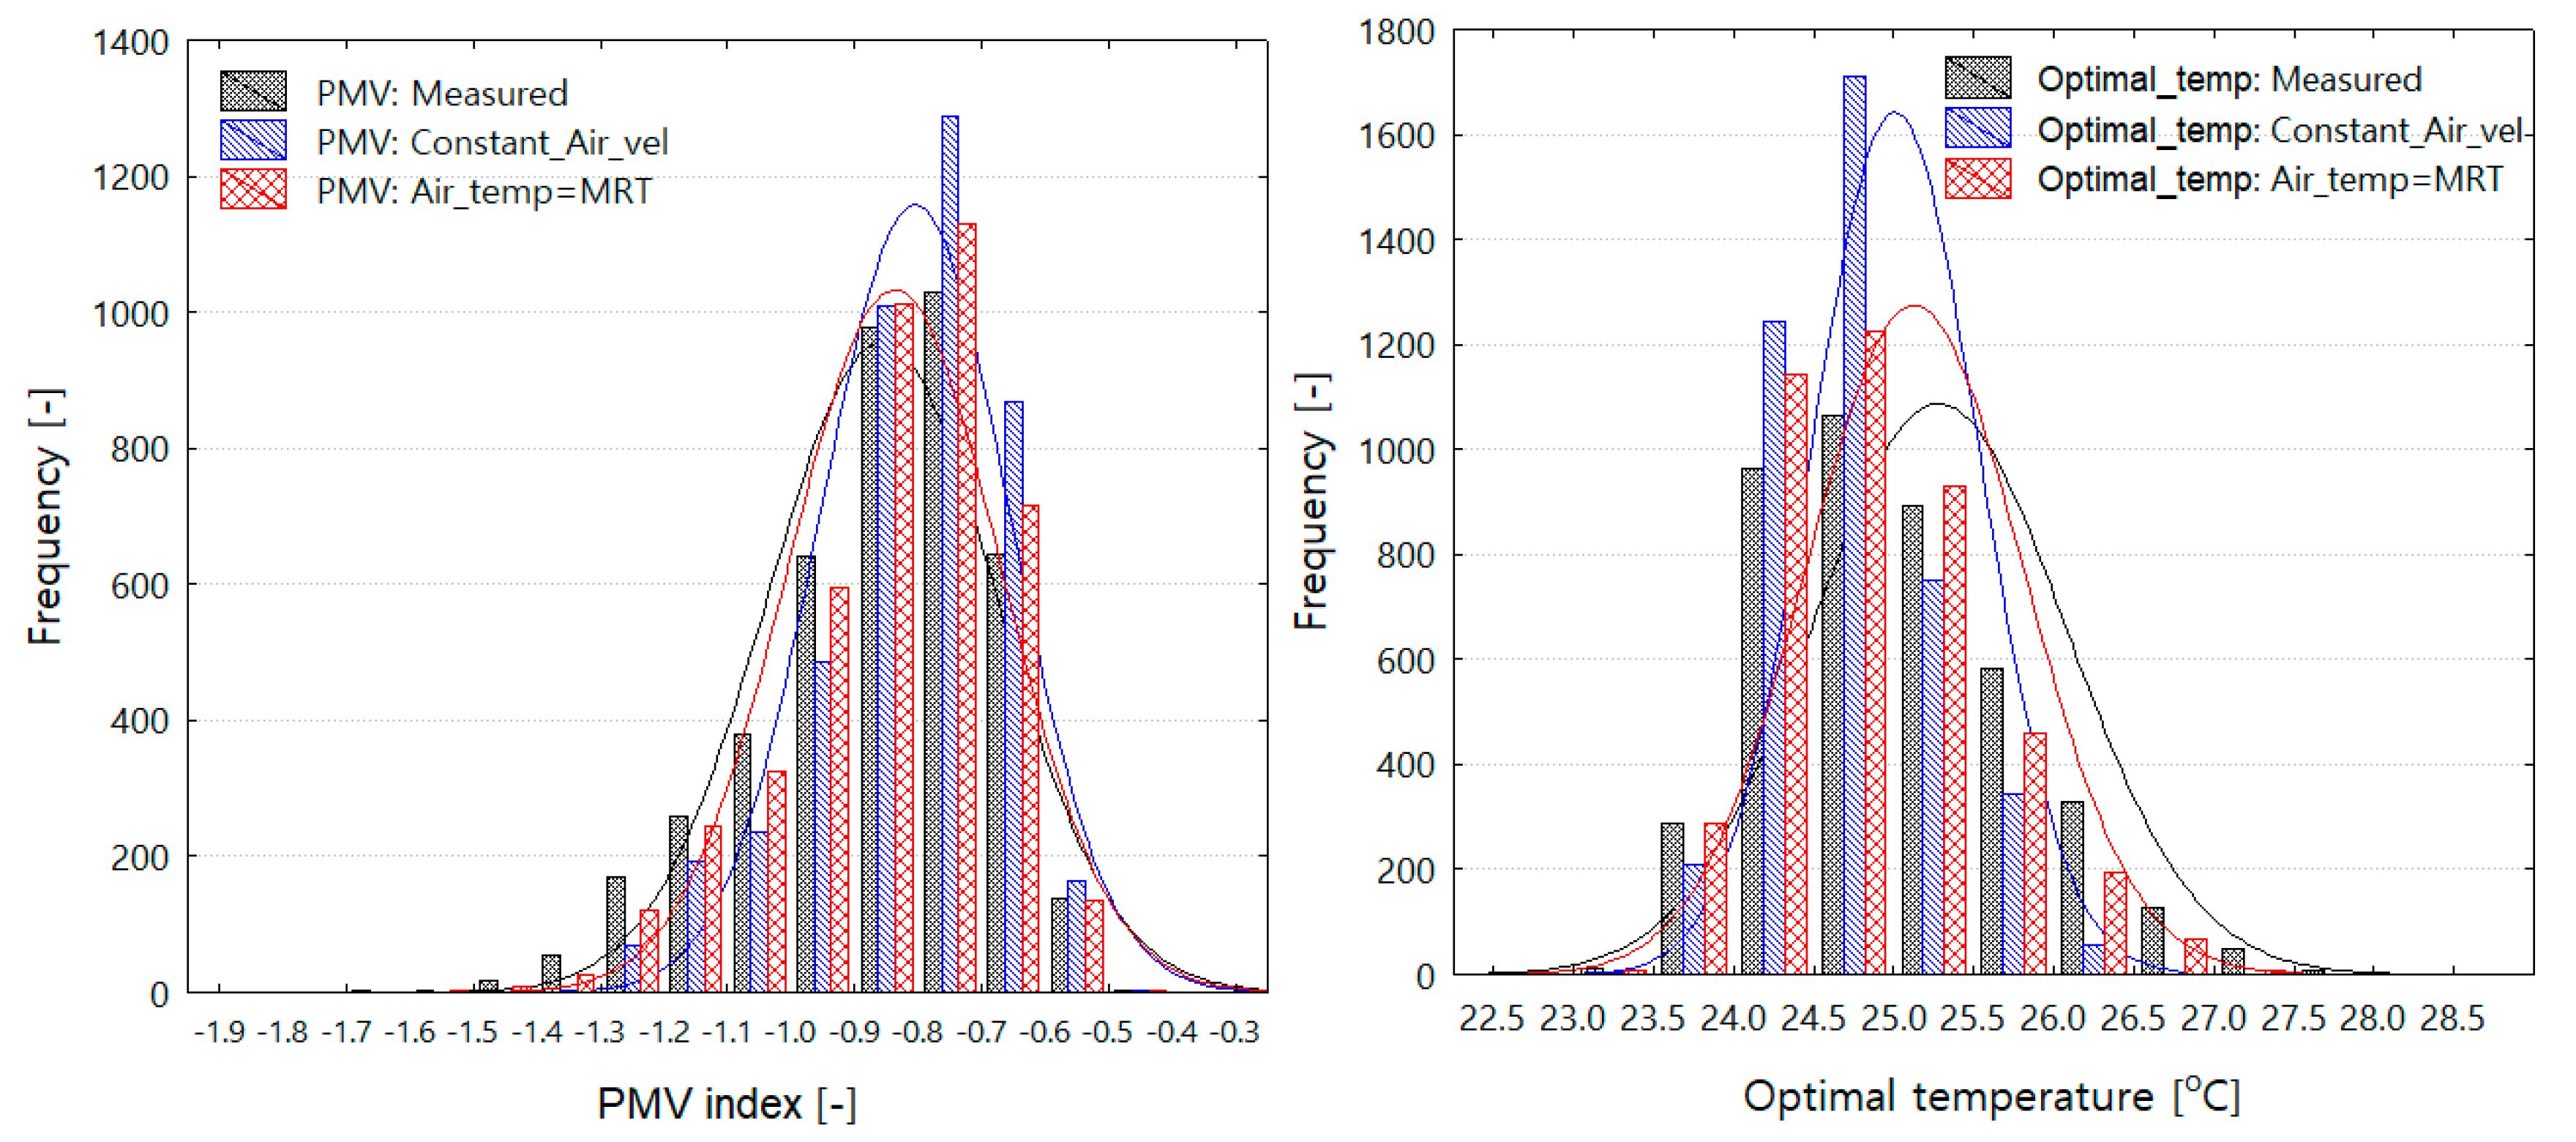
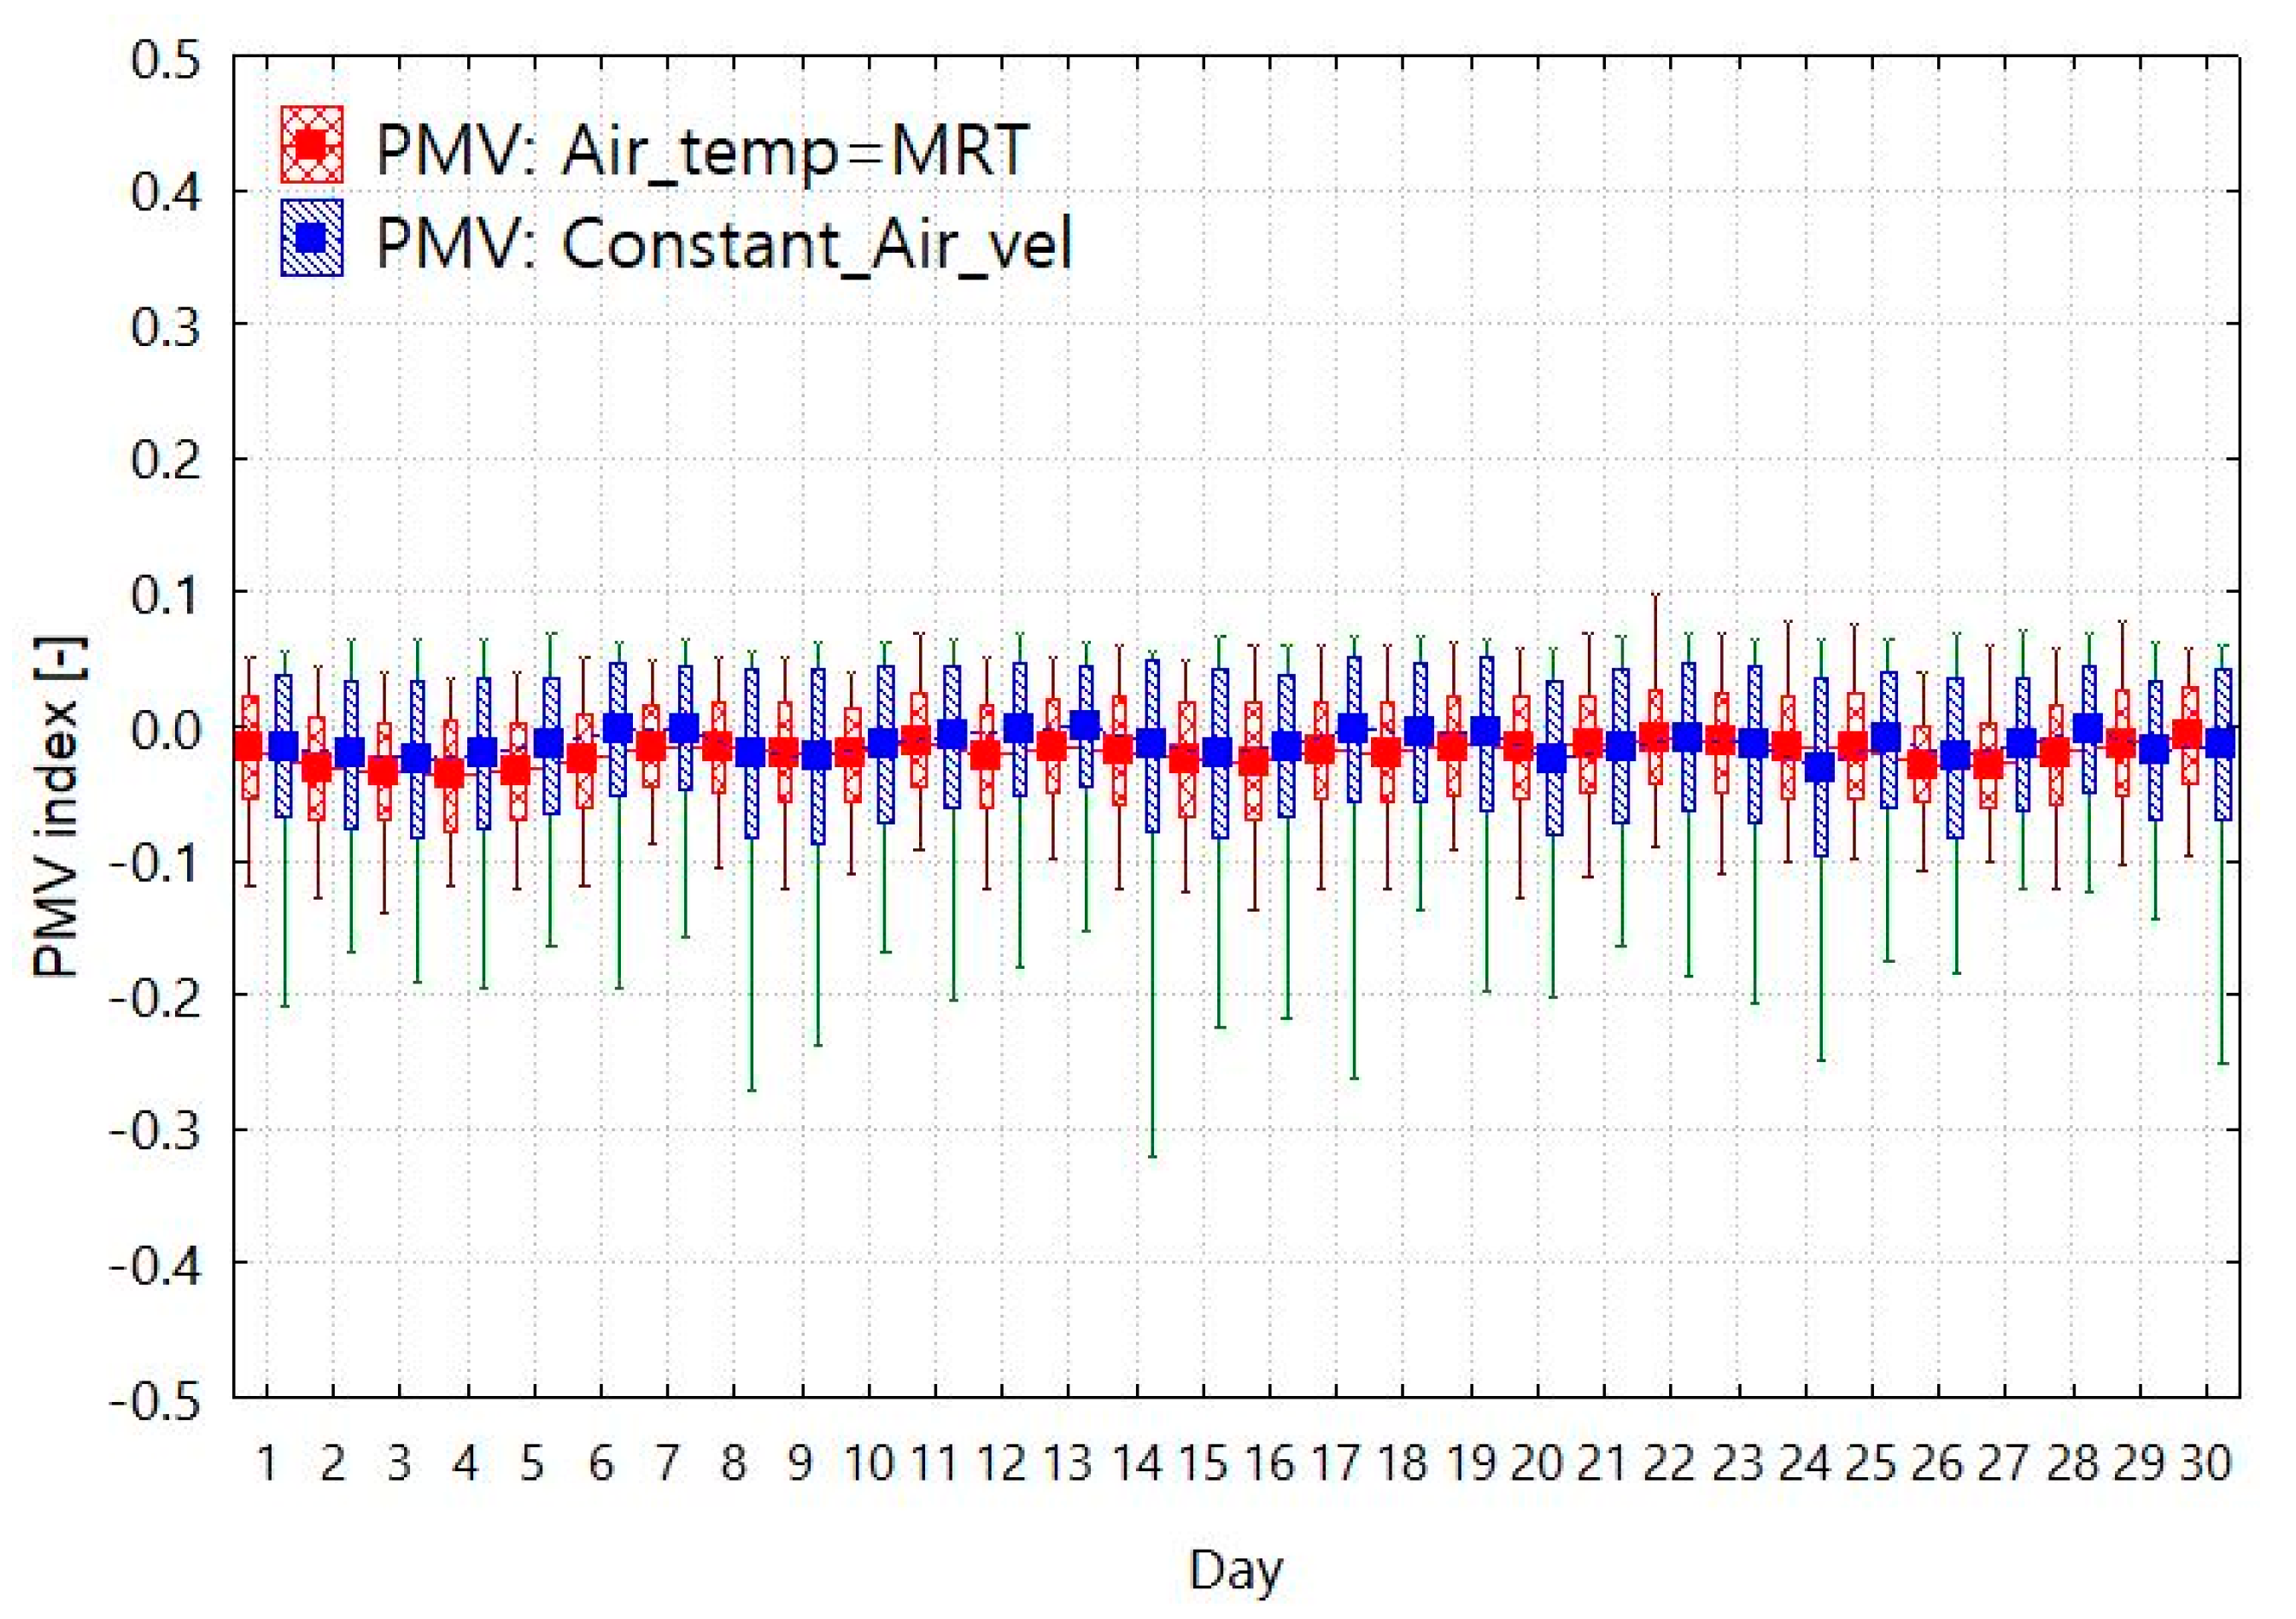
3.1. Sensitivity Analysis of Variables

PMV calculations are performed on four types of objective data, air temperature, MRT, relative humidity (RH), and air velocity, and two types of subjective data, CLO and MET. However, these variables do not have an equal influence on the PMV. This section describes the sensitivity analysis conducted to determine the effect of these six variables on the PMV in the subject residence.
Hawila et al. [26] investigated the impact of PMV-based thermal comfort control during the heating period in a highly glazed room. According to the study, the energy consumption in a comfort-controlled space was highly sensitive to occupant-related parameters (metabolic rate and clothing level) and the mean radiant temperature compared to other parameters such as the relative humidity. Zhang et al. [11] used the PMV index to optimize the control of thermal comfort and energy saving by monitoring the thermal sensation online. The study concluded that the PMV model has limitations in terms of its practical application. More precisely, selected PMV variables are difficult to monitor accurately and continuously owing to the limitations of experimental facilities. Therefore, providing accurate data to TCC sensors is the first step to ensure accuracy and reliability.
The accuracy of the data input into the controller is critical for developing the TCC for a Kuwaiti residential house. In addition, optimization of the TCC development necessitates identifying which data should be collected more accurately for this purpose. This was achieved by conducting a global sensitivity analysis using ASHRAE standard 55 [27] coded in Python and using Latin hypercube sampling (LHS). The PMV sensitivity index was calculated using the standardized rank regression coefficient (SRRC). SRRCs can be estimated from a regression analysis, which is standardized to the variances of dependent and independent variables are 1. The sensitivity index makes it easy to interpret quantitative measurements of the influence of input parameters on model outputs (Figure 7). The sensitivity index indicates the degree of influence of the six variables on the PMV, and the sign (+ or −) of the sensitivity index indicates the correlation between the variable and the PMV index. Separate sensitivity analyses were conducted for when the PMV was greater than or less than zero. The analyses were divided in this way because the sign of the correlation for each factor switches when PMV = 0. If the sensitivity analysis were conducted for all PMV values, the resulting sensitivity of each factor would be inaccurate.
The results of the sensitivity analyses showed that air temperature had the greatest influence on the PMV when PMV > 0, followed by MRT, MET, and air velocity in descending order. This result indicates that air temperature is the most important factor when setting the target temperature during the summer. However, when PMV < 0, MET had the greatest influence on PMV, followed in decreasing order by the air temperature, CLO value, and MRT. This result indicates that MET is the most important factor when setting the target temperature during the winter. Since houses in Kuwait are not heated, it is pointless to focus on PMV values less than zero. Therefore, accurate calculation of the AC setpoint temperature by the TCC in Kuwaiti residential houses requires accurate real-time data on the air temperature, MRT, MET, and air velocity.
On the other hand, two significant matters need to be taken into consideration when installing the TCC, namely the application of a sensor and the installation location for measurements of the four objective variables. It is preferable to install the TCC units on the same wall as existing thermostats in a residential house. Therefore, it is necessary to compare the MRT and airflow measurements along the wall with those in the center of the room among the four objective items. The position of the sensor should be defined more clearly if the difference in the MRT and air velocity in the PMV results is large between measurements along the wall and in the center of the room.
The characteristics of black bulb thermometers used to measure the MRT and air velocity sensors must be considered. The temperature and humidity sensors are robust and well understood, and, therefore, their use in the TCC was not expected to cause significant problems. However, the black bulb thermometers and air velocity sensors may be difficult to physically incorporate into the unit and may cause it to become prohibitively expensive. The sensitivity analysis in this study determined that the MRT and air velocity affect the PMV calculations. However, the air velocity sensors detect lower air speeds when they are installed on walls than when they are in the center of rooms. Furthermore, the problems associated with the size and installation location of the black bulb thermometers for measuring the MRT also have to be solved.
Consequently, it is necessary to analyze the effect of MRT and air velocity in detail when calculating the optimal temperature using PMV. In this regard, sensors were installed in the center of a cooling zone during August in a residential building in Kuwait (the residential house in Table 1). The data showed that the average indoor air temperature was 18.8 °C, the average MRT was 18.6 °C, the average RH was 54.6%, and the average air velocity was 0.09 m/s. The difference between the actual indoor air temperature as measured at the center of the cooling zone and the MRT was only 0.2 °C (Figure 8).
The following scenarios were analyzed to determine whether the black bulb thermometer and air velocity sensor should be included in the TCC. Based on the data measurements for the month of August, the PMV calculation of the following two scenarios were compared to basecase, the calculated PMV from the measured data.
Scenario (1) indoor air velocity = 0.09 m/s (the constant average value in August).
Scenario (2) indoor air temperature = MRT.
The optimal target temperature was determined by recursively calculating the PMV for each scenario using ASHRAE standard 55 coded in Python. Figure 5 shows the correlation between the two scenarios and the basecase. The larger the degree of scattering, the larger the error of the calculated PMV is when a scenario is applied. The figure shows that Scenario 2 has less impact on the actual PMV calculation than Scenario 1. The results also showed that the PMV for Scenario 1 had an average difference of 0.4 and the average PMV for Scenario 2 was 0.1 (Figure 9). Given these results, the optimal setpoint temperature differed by 4 °C for Scenario 1 and 1 °C for Scenario 2 (Figure 10).
The distribution of the PMV values and target temperatures of the base case (Measured) and two scenarios were analyzed (Figure 11). The PMV values were distributed between −2 and −0.2 in all the scenarios but had the highest frequency between −1.7 and −0.4. The optimal setpoint temperature had the highest frequency between 24 °C and 25 °C. It was found that the occupants’ thermal comfort was predicted to be at a higher temperature when Scenario 1 and Scenario 2 were applied as compared to the base case. This showed that the frequency of the PMV index in both scenarios is higher at −0.8 and −0.7 in Figure 11, such that the frequency of the optimal set temperature also has a lower temperature distribution at 24 °C. The difference in the frequency of the two scenarios showed that Scenario 1 is predicted to be warmer than Scenario 2. This result indicates that an indoor air velocity of 0.09 m/s had a greater influence on the PMV and target temperature calculations than when the indoor air temperature was equal to the MRT. Therefore, to maintain the optimal PMV, the optimal setpoint temperature was lower in Scenario 1 than in Scenario 2.
Next, the hourly PMV distribution was analyzed for the month of August by controlling the indoor temperature by using the two scenarios. Here, it should be noted that the PMV is always 0 when the temperature is optimally controlled, and thus the PMV range shown in Figure 12 is an error because of the assumptions on which the two scenarios are based. If the indoor setting temperature is controlled by these two scenarios and the PMV is in the thermal comfort range, the two scenarios do not have a significant effect on the indoor thermal comfort. As shown in Figure 12, the daily PMV of both scenarios is in the range of −0.5 to 0.5. Therefore, even if the PMV is controlled by the optimal setpoint temperature by using the two scenarios, the influence of these two scenarios is within the thermal comfort range. In other words, occupants would feel comfortable regardless of whether the temperature was controlled as in either scenario.

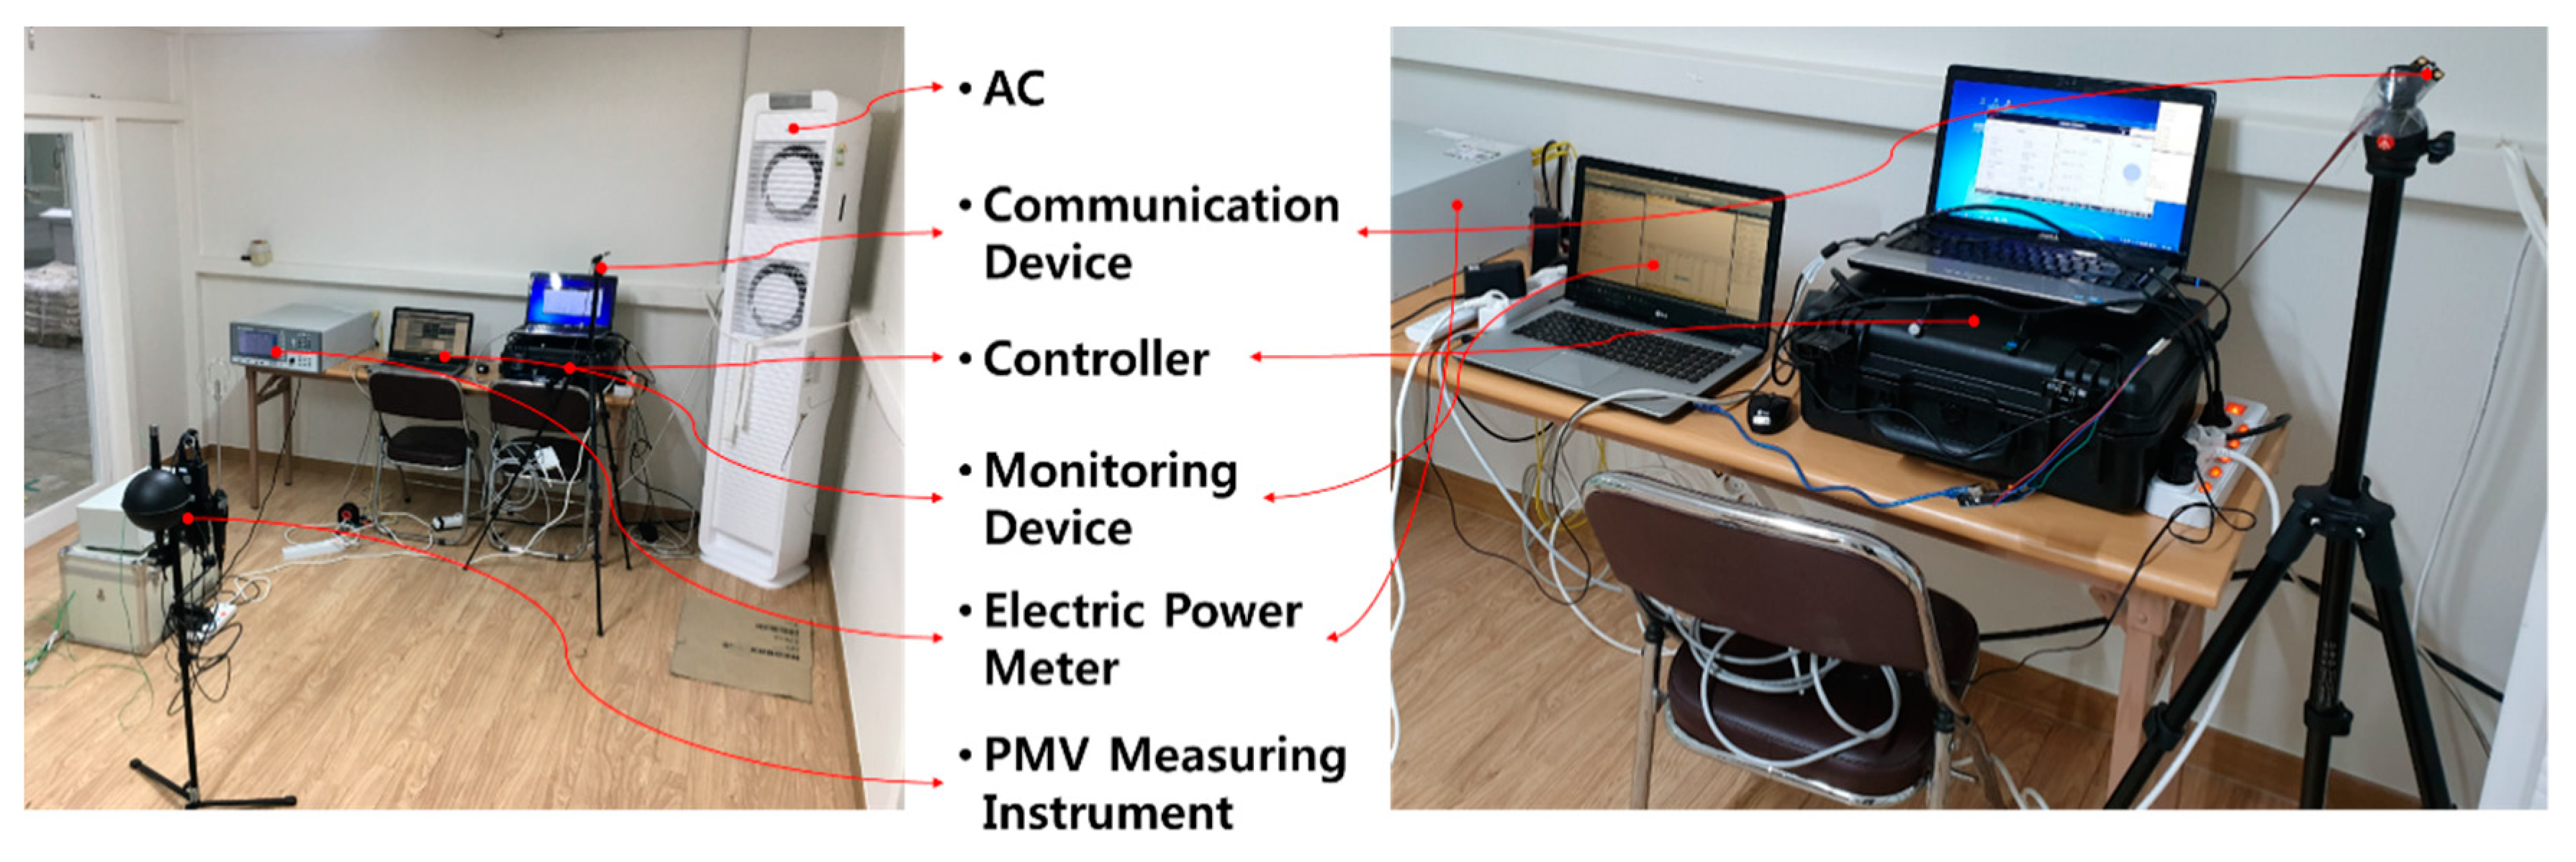
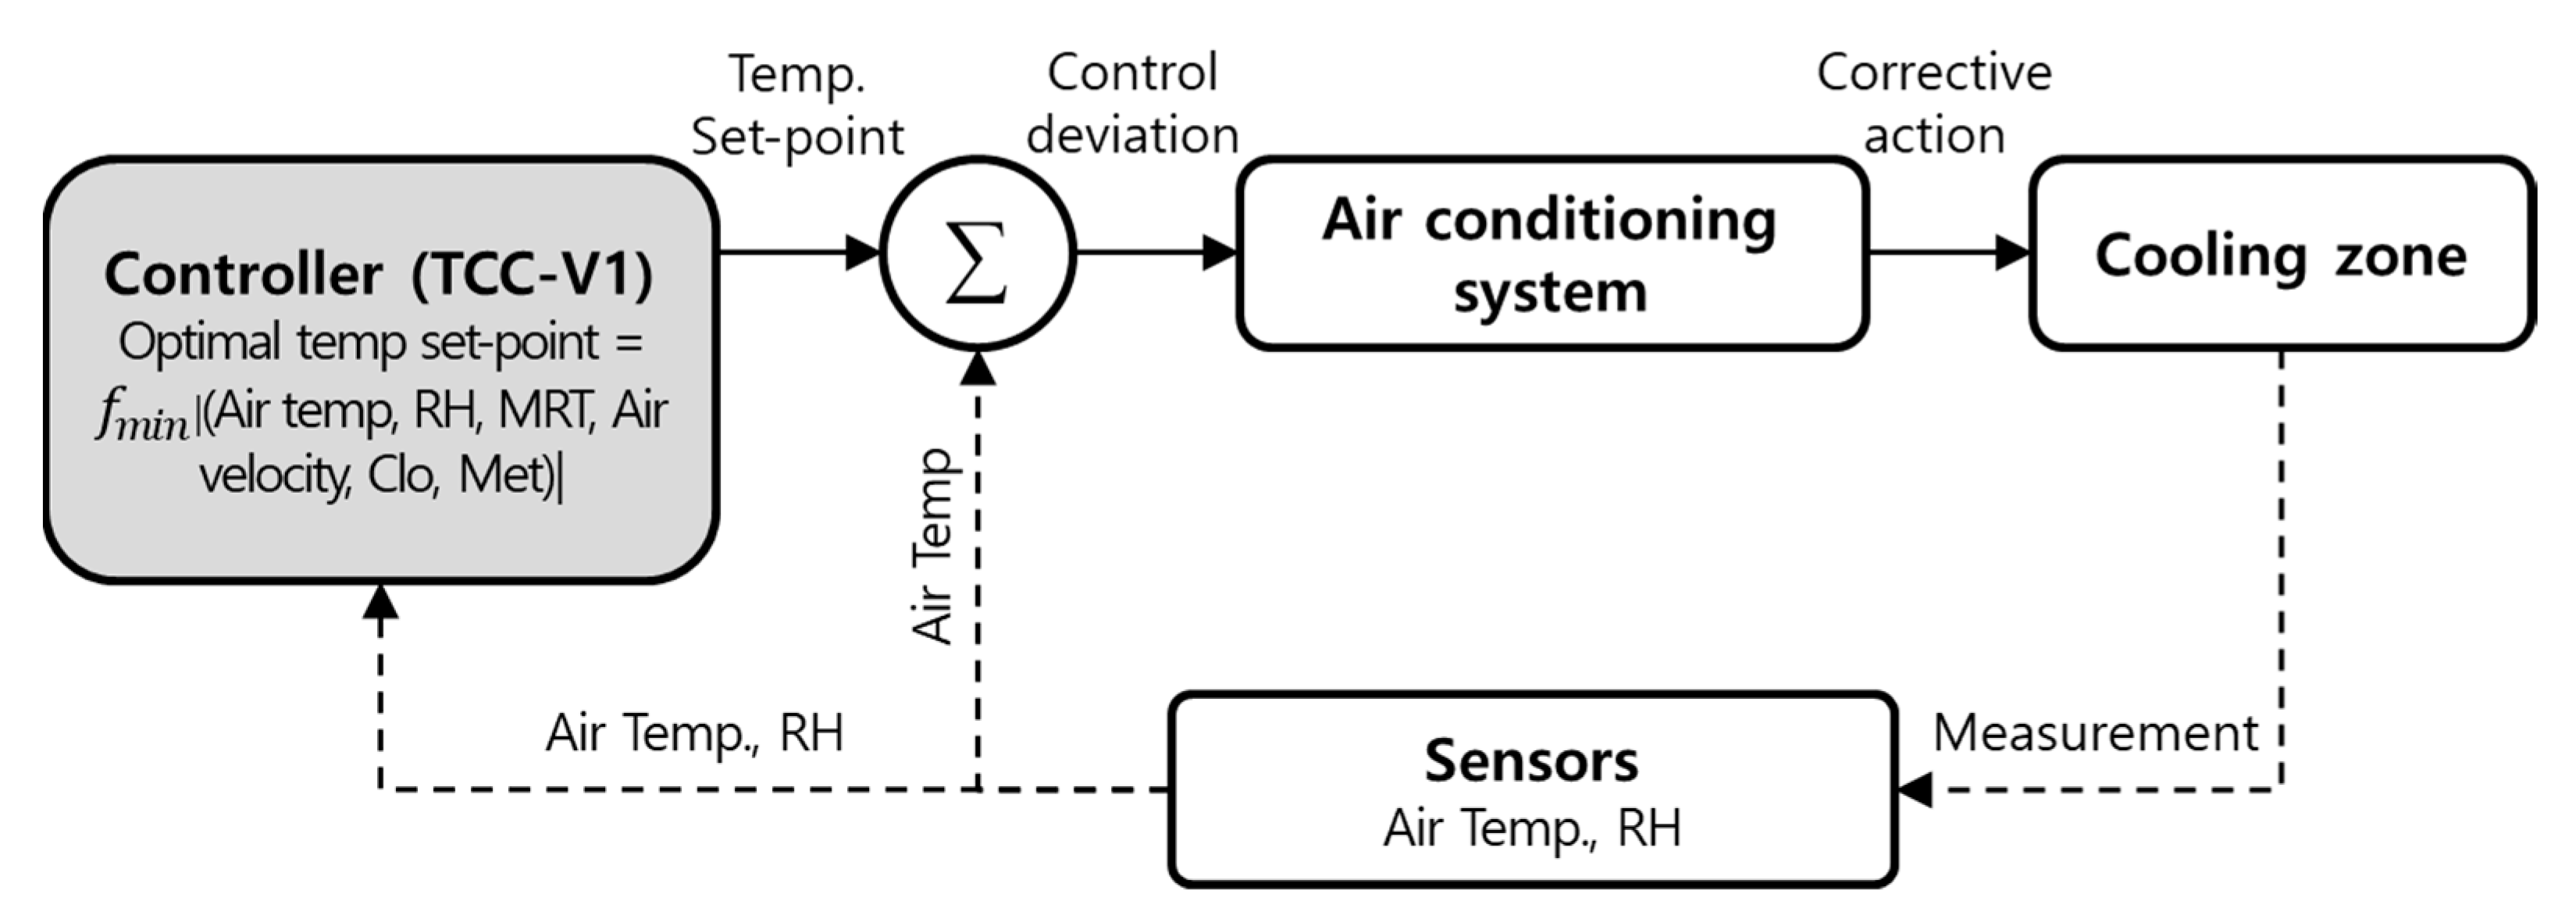
3.2. Development of Controller and Composition

The thermal comfort-based controller-version 1 (TCC-V1) was developed based on the results of the sensitivity analysis and the thermal comfort range analysis for each scenario in Section 3.2. At constant indoor air velocity of an average value and for an MRT value equal to that of the indoor air temperature, the PMV range was acceptable. Therefore, based on the results of the scenario analysis, the ability to measure the air velocity and the MRT were not considered when the TCC-V1 was designed. As such, the TCC-V1 was neither equipped with a black bulb thermometer nor an air velocity sensor for the present study.
The TCC-V1 we developed contained a controller, a communications unit, a monitoring device, and sensors. Their respective functions are as follows (Figure 13):
  • Controller: the core of the TCC-V1. The controller computes the PMV index and the target temperature in real time based on data collected by the sensors.
  • Communication device: enables communication between the controller and the AC unit.
  • Monitoring device: confirms controller computational results by sending data to the controller. Although this function can be performed by the controller, the monitoring device acts as a data backup.
  • Sensors: measure temperature, humidity and whether the room is occupied and then sends the data to the controller.
Most Kuwait houses use traditional on/off controllers. The control sensor usually takes the form of an on/off thermostat and humidistat. On/off control is a simple and inexpensive way but is not accurate and quality [22].
In this study, the PMV index was obtained from the ASHRAE standard 55 [28] and a feedback method was used for temperature control in the TCC-V1 control. Feedback temperature control is an operation method that corrects the control amount to match the target temperature by returning the output signal to its input signal. The control method used in this study controlled the value of a variable by varying the target temperature with time to ensure that PMV = 0.
Operation of the TCC-V1 involved data communication between its individual devices (Figure 14). The controller acted as the brain of the TCC-V1 by computing the PMV in real time based on data collected by the sensors. In this study, PMV was computed based on the temperature, humidity, MRT, air velocity, cloth value of people (CLO), and metabolic rate of people (MET). The target temperature was set such that PMV = 0, which is achieved by iterative calculation using the ASHRAE standard 55 and then transmitted to the AC unit. This process was continually repeated while the system was being operated. If the target temperature were to be adjusted manually, this value was sent to the controller and set as the target temperature. However, manual control was not tested in this study.

4. Experimental Performance Evaluation of TCC-V1

4.1. Experimental Scope and Method

The goal of this study is to determine the effectiveness of the TCC-V1 at reducing AC electric energy consumption while maintaining the user’s thermal comfort. This study was conducted in the following stages:
  • Develop the TCC-V1 device such that it can compute the appropriate target temperature to maintain occupant comfort by iteratively computing the real-time PMV and communicate with the AC accordingly.
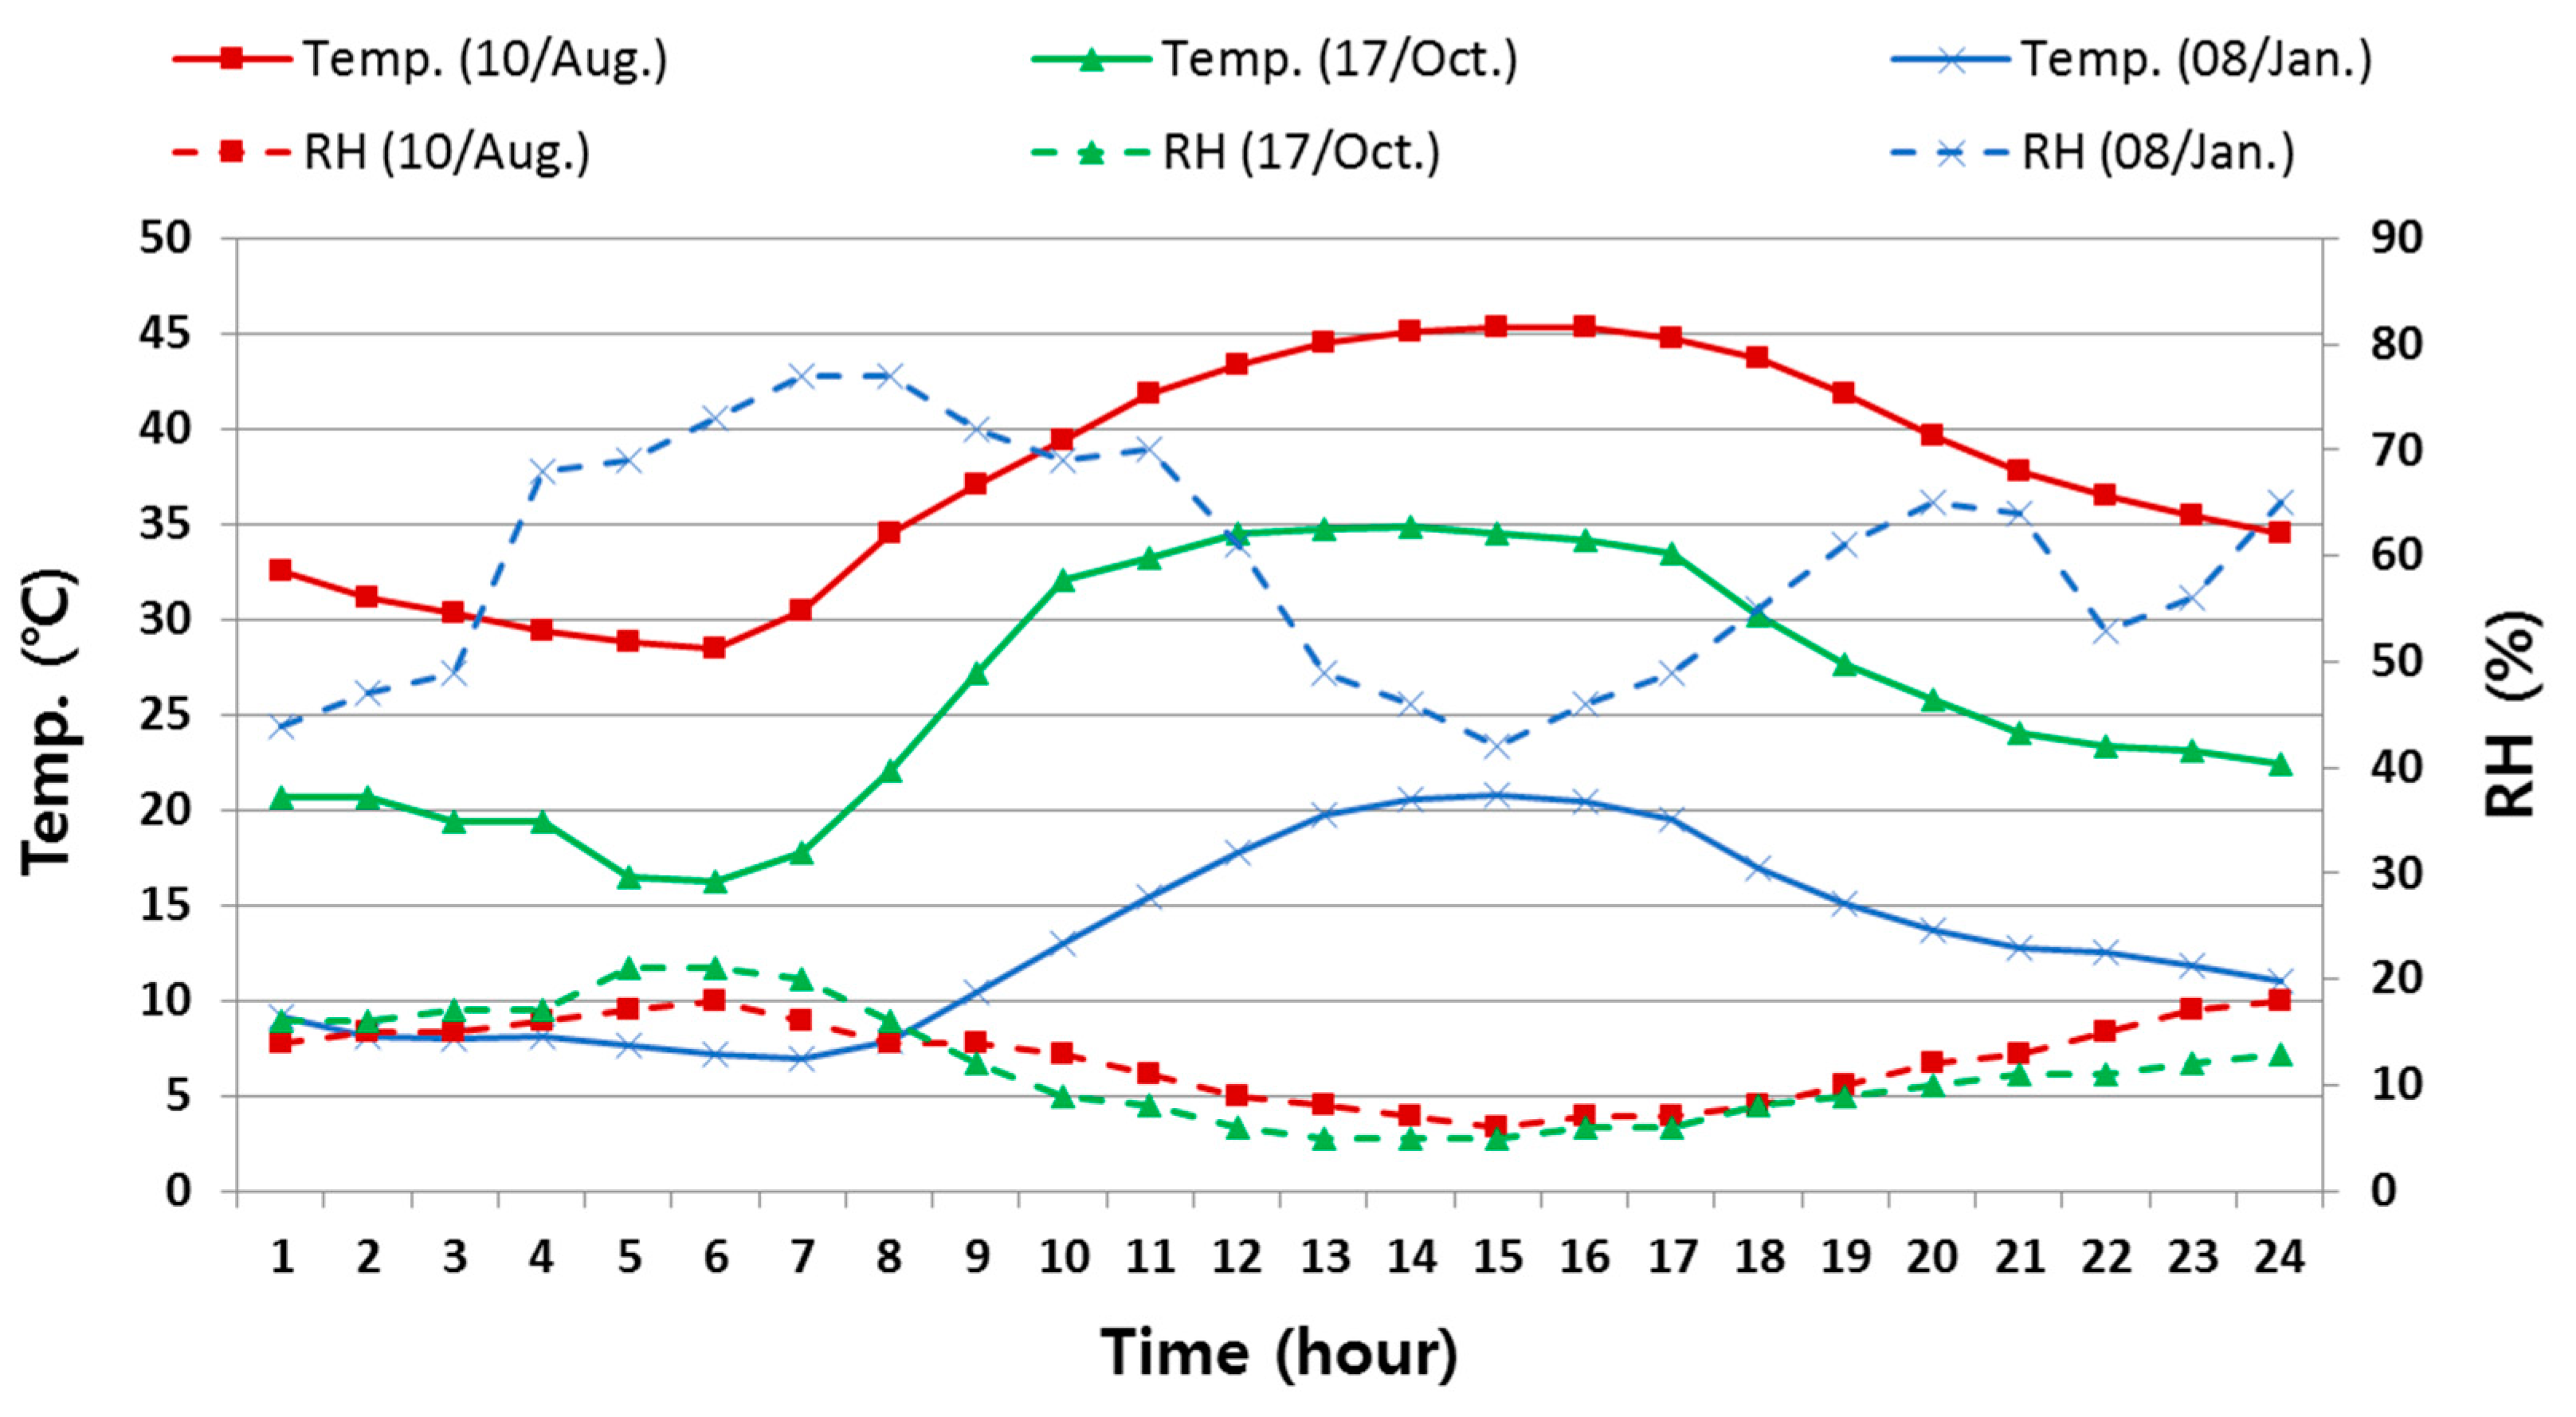
  • Use the analysis of the meteorological data of Kuwait to select a representative day from the summer (May–September), the intermediate seasons (March, April, October, and November), and winter (December–February).
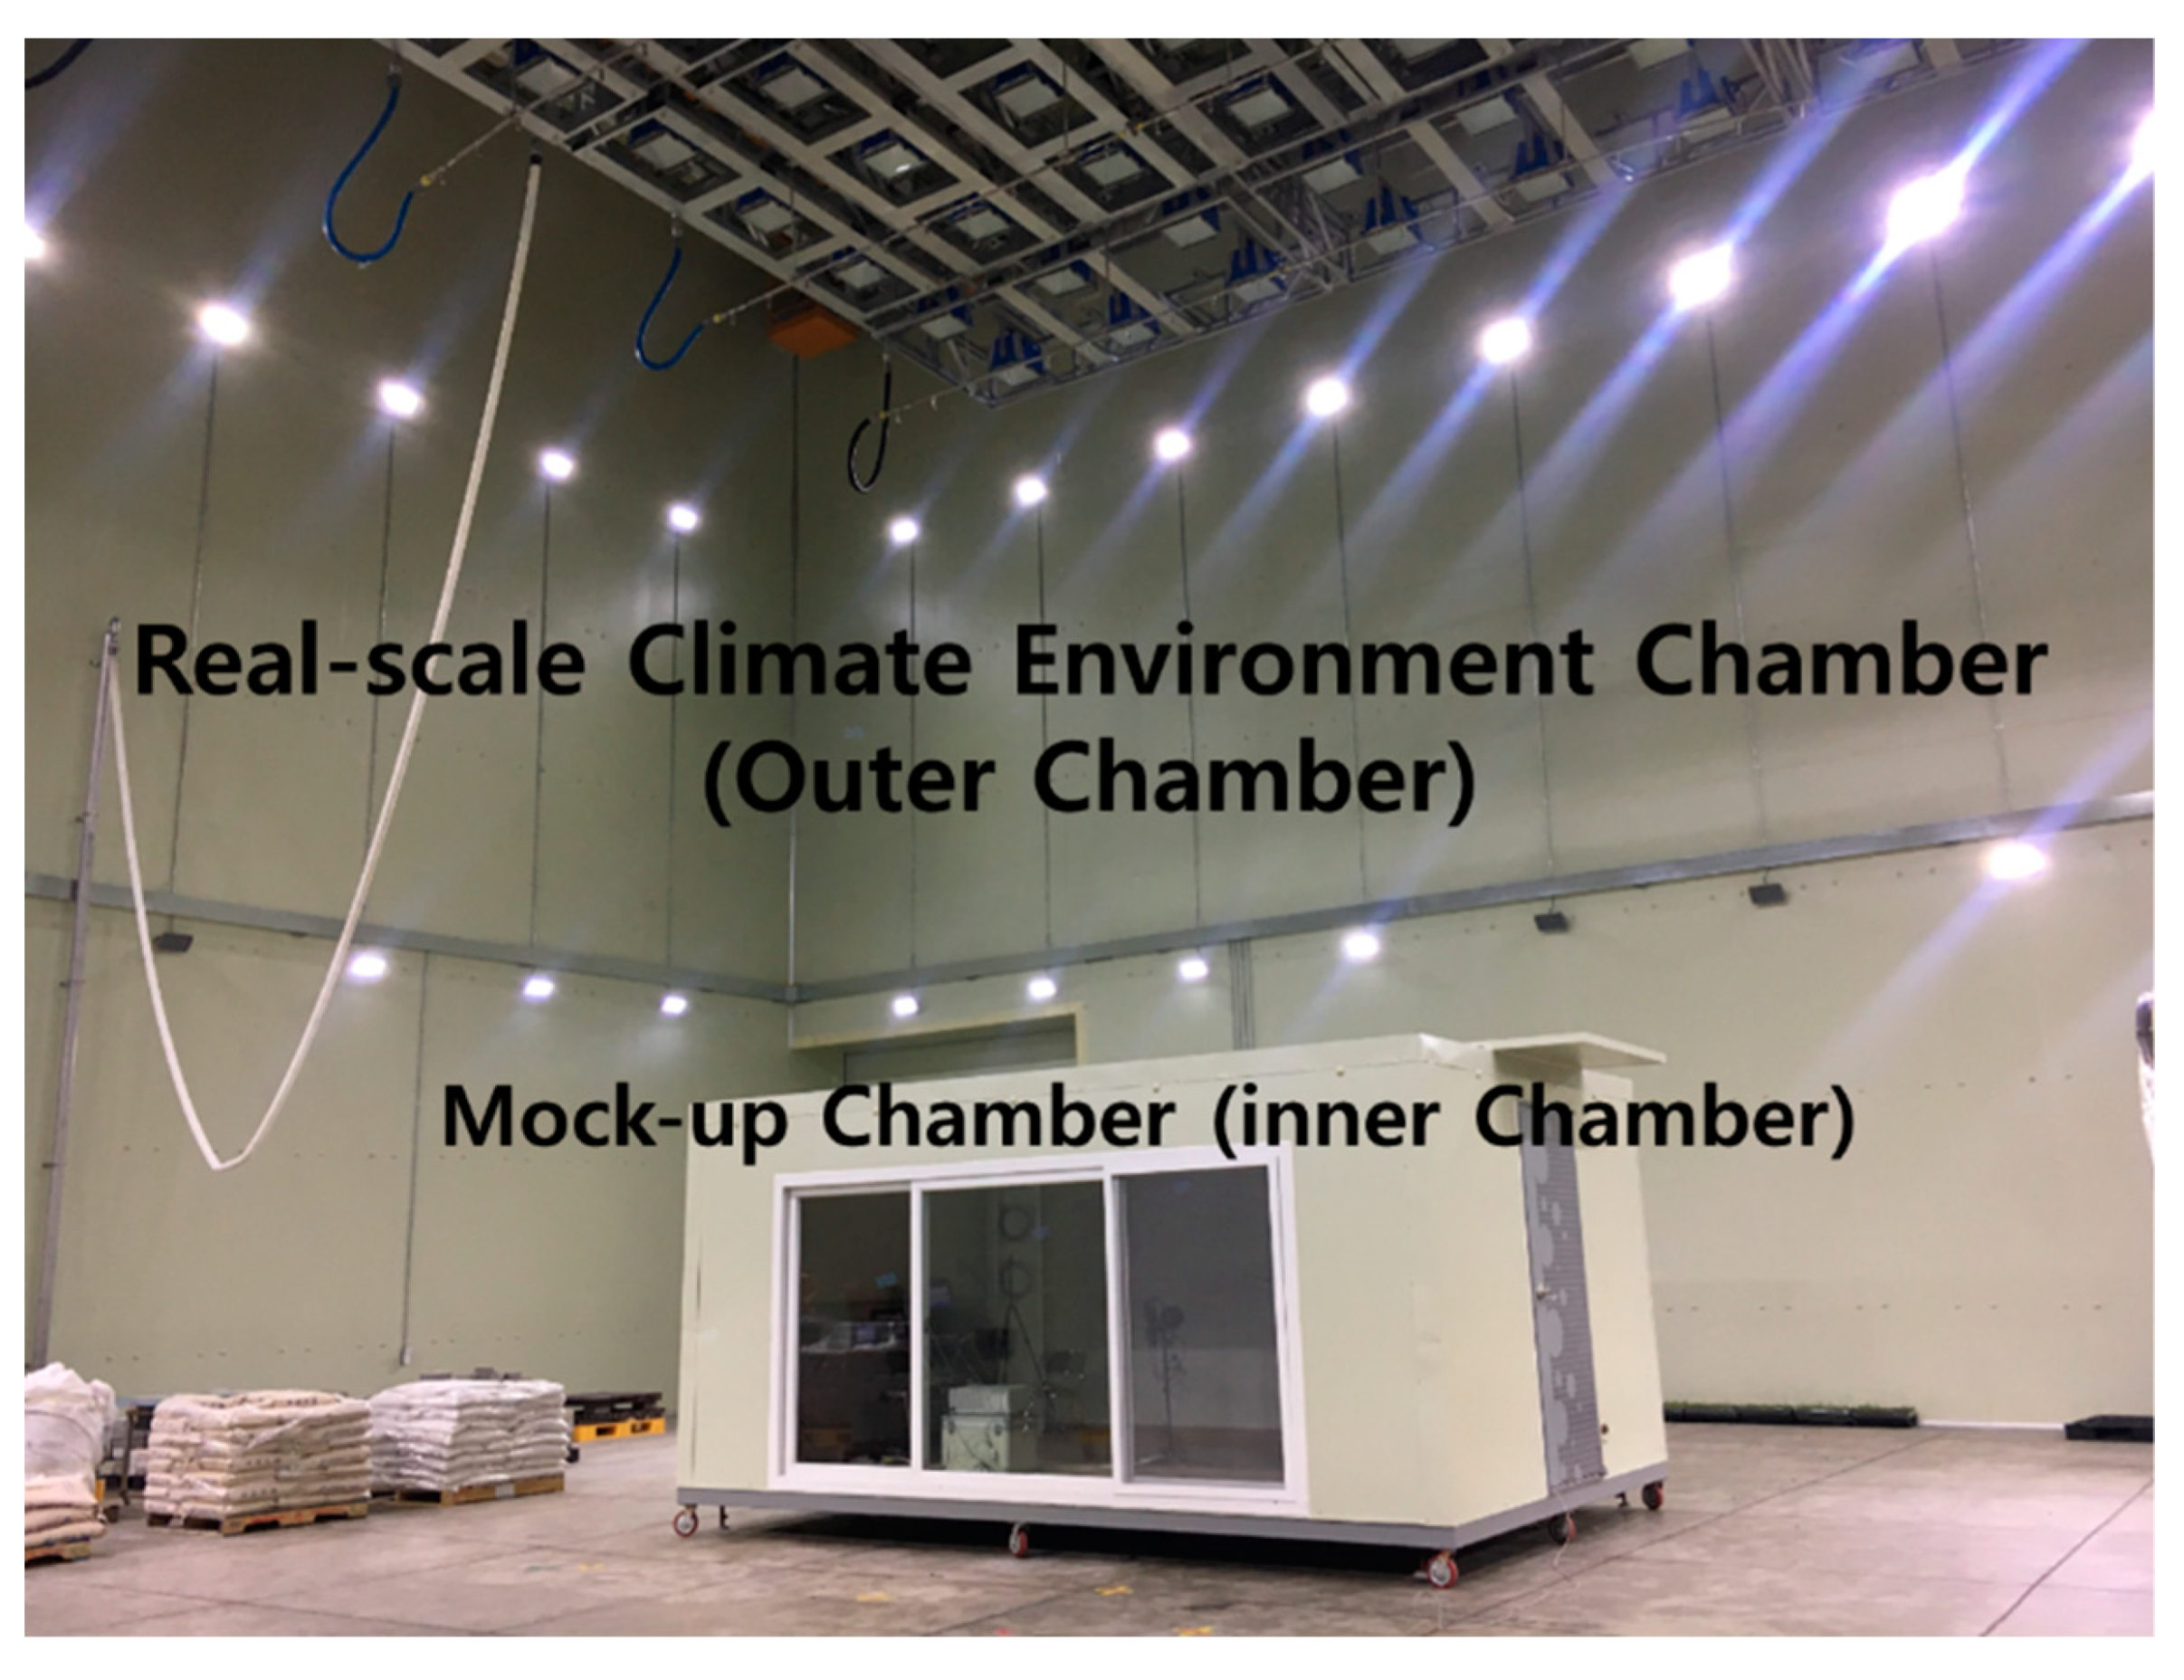
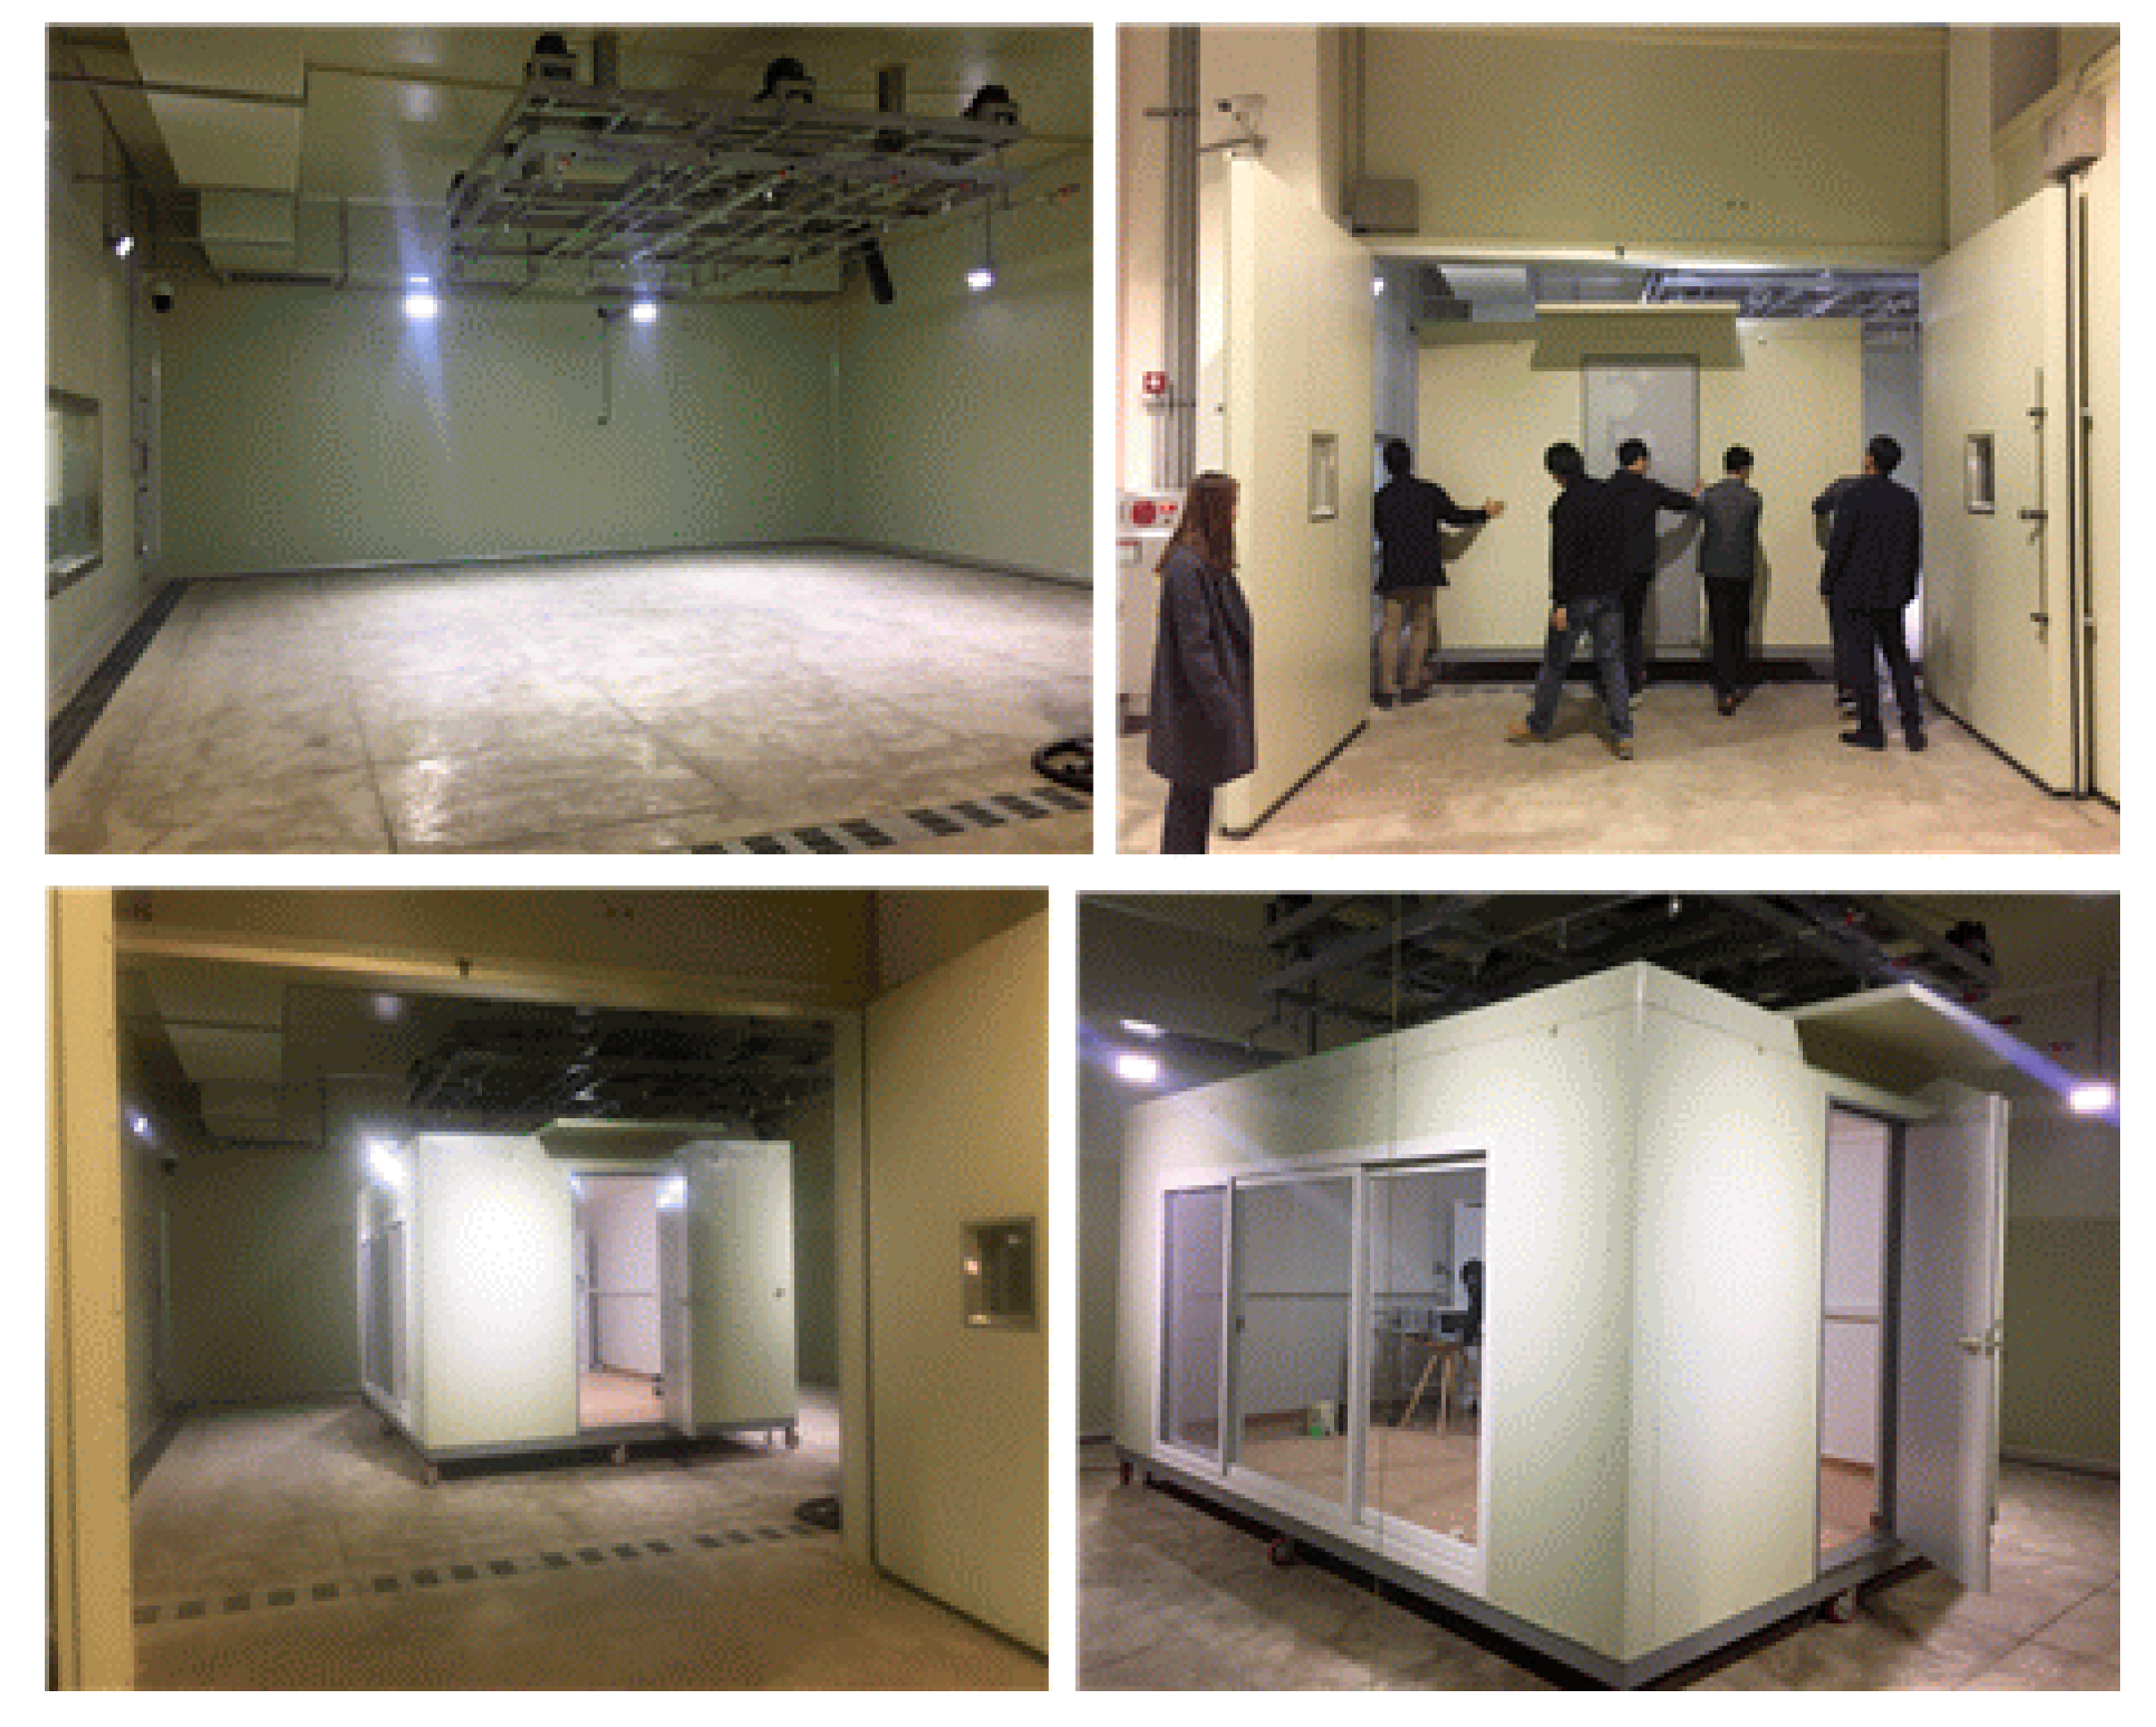
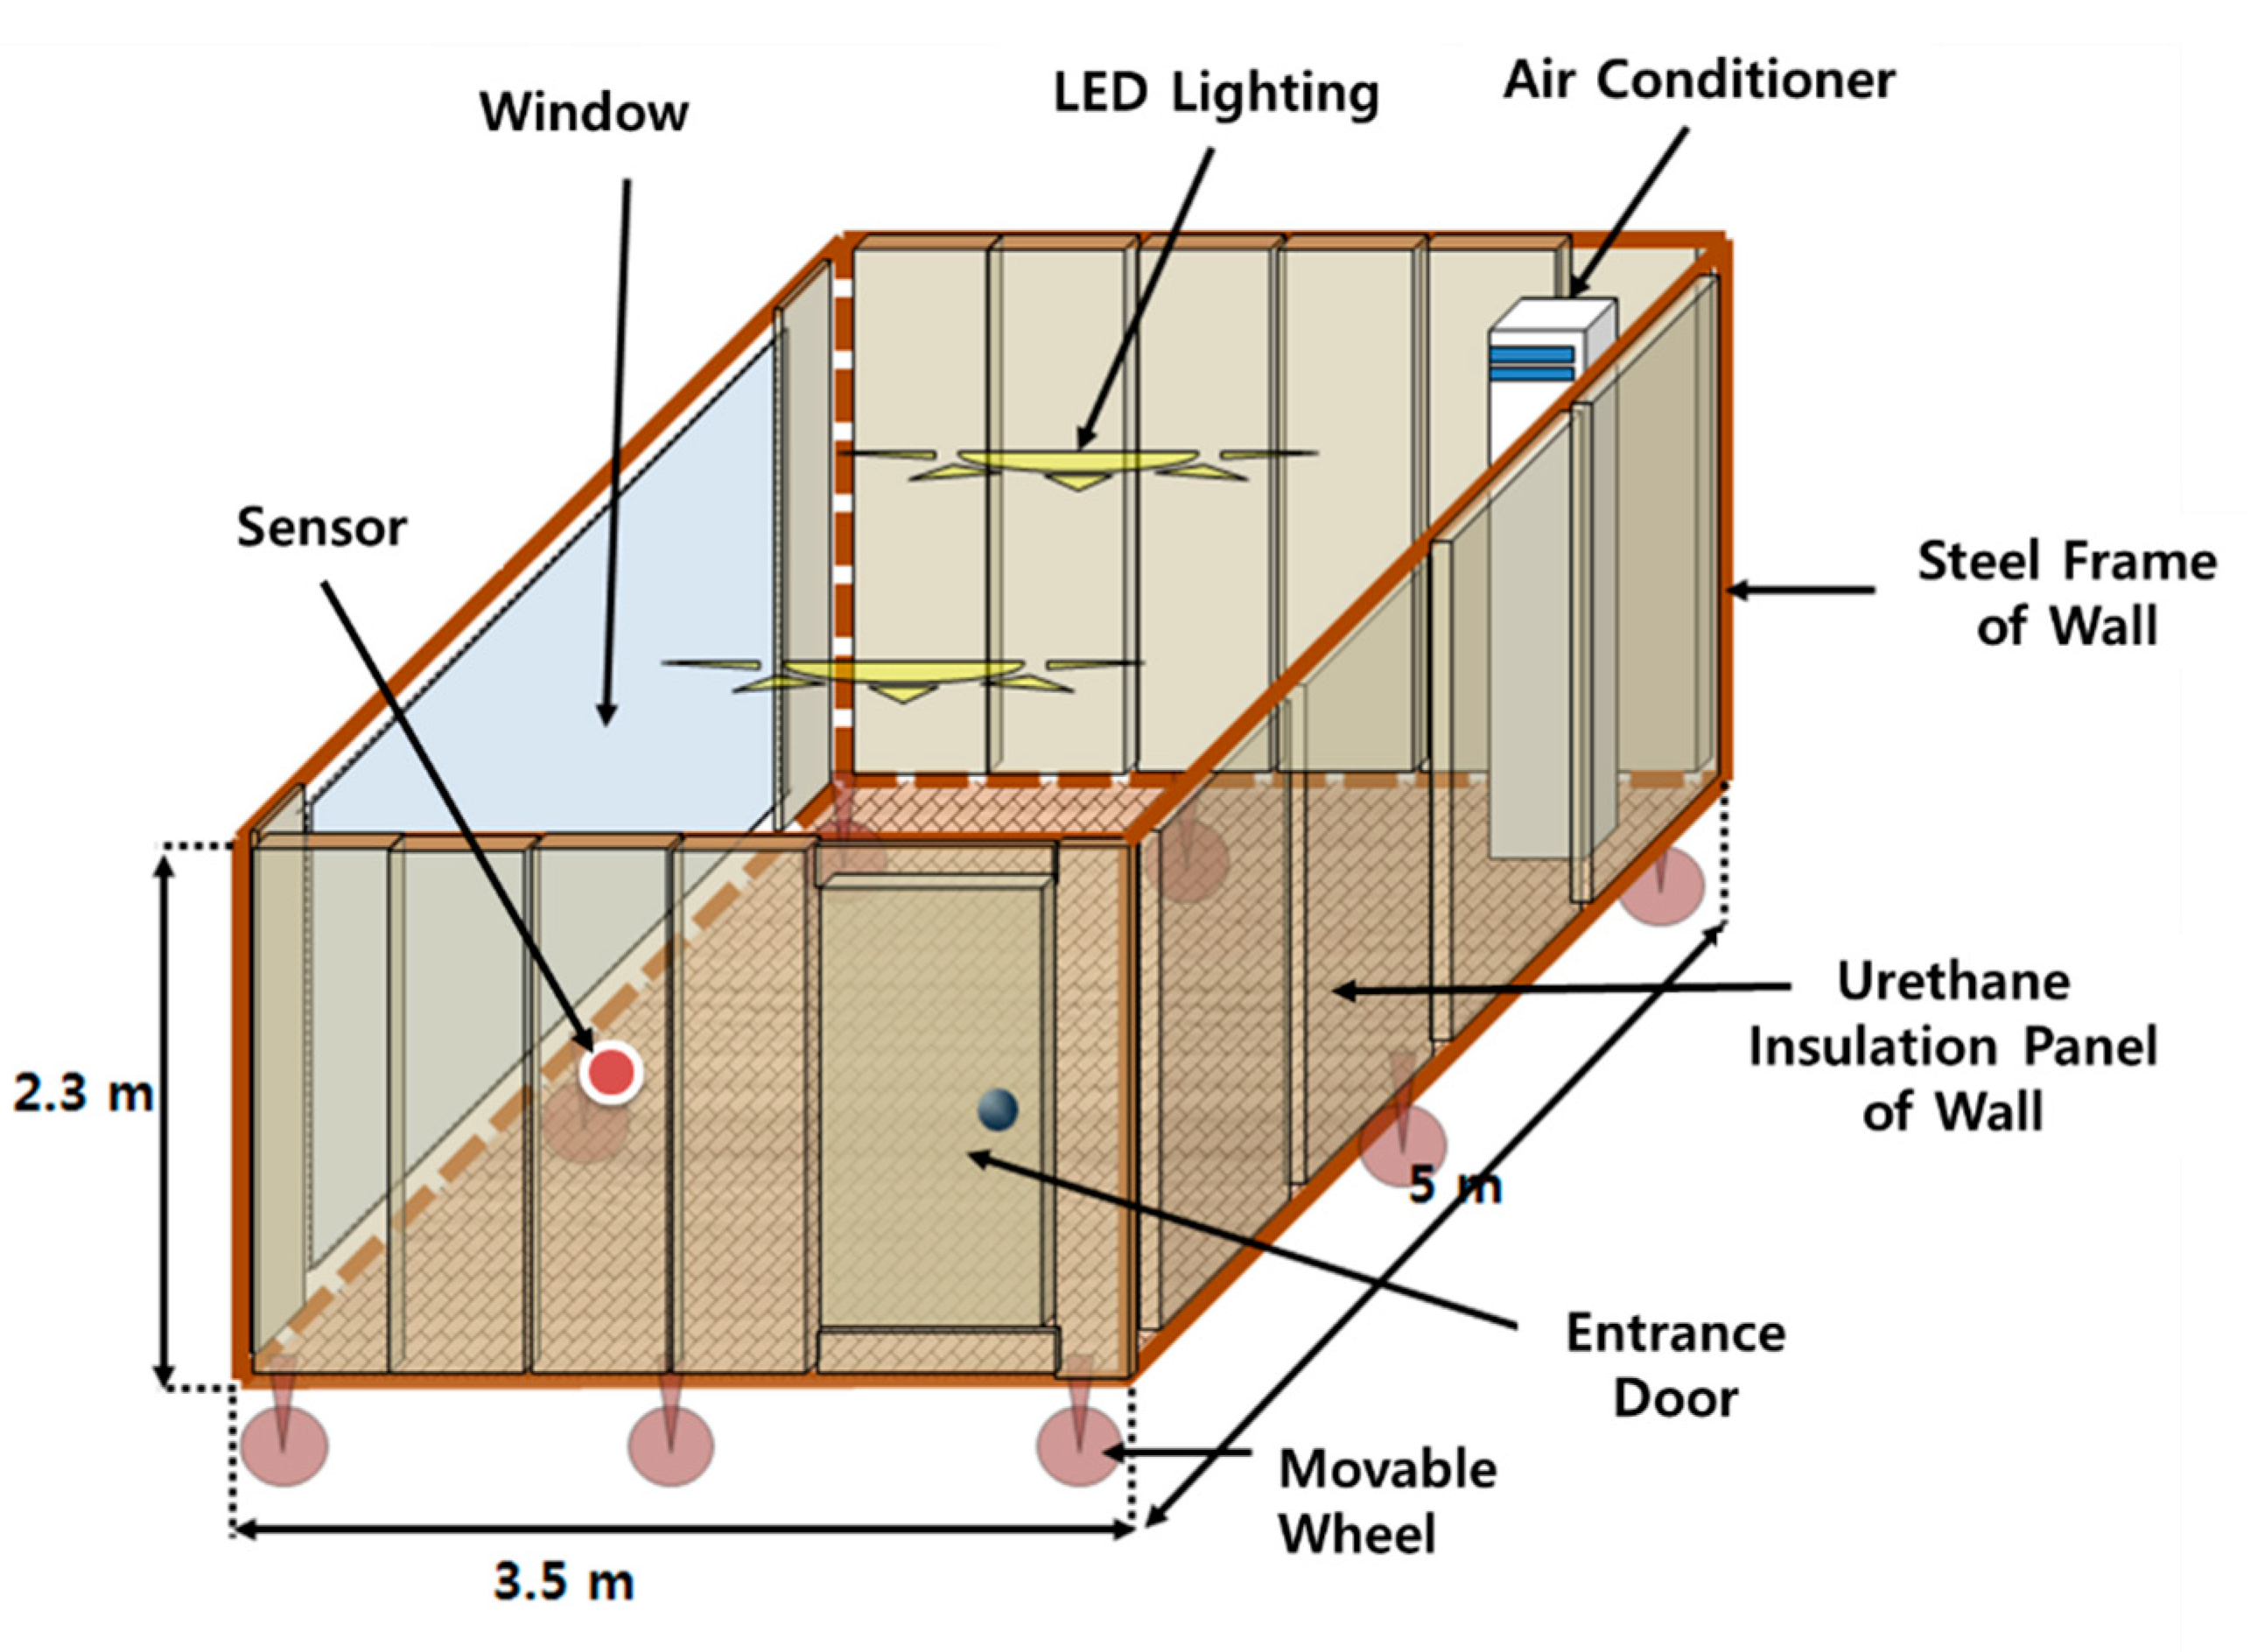
  • Install an inner chamber containing the AC and TCC-V1 device to mimic a residential house for one or two people inside of a real-scale climatic environment chamber (outer chamber in Figure 15).
  • Set the climatic condition (the temperature and humidity on each selected representative day) in the outer chamber and evaluate and compare the corresponding AC electric energy consumption according to the AC control with and without the TCC-V1 device.
The experimental AC conditions and their corresponding values are provided in Table 3. Since the TCC-V1 was not equipped with a black bulb thermometer and an indoor air velocity sensor, the indoor air velocity was set to 0.09 m/s and the MRT was set to the actual indoor air temperature. CLO was set to 0.5 for the summer season and 1.0 for the winter season and the value of MET was set to 90 W/m2 based on the interviews with the occupants of a residential house in Kuwait (Table 1).

4.2. Experimental Weather Conditions

The weather conditions of the outer chamber were set by selecting three representative days that are most similar to the seasonal averages based on the analysis of Typical Meteorological Year (TMY) weather data provided by the US Department of Energy (DOE). Representative days with the values closest to the average temperature and average relative humidity were selected (Table 4 and Figure 16).

4.3. Climatic Environment Chamber

The performance of the TCC-V1 was evaluated by using a Real-scale Climatic Environment Chamber (RCEC) as described in Section 4.1. The RCEC was manufactured in accordance with the Environmental Engineering Considerations and Laboratory Tests (MIL-STD-810G) specifications promulgated by the US Department of Defense. Various climatic conditions, including the temperature, humidity, rainfall, snowfall, and insolation can be controlled in these chambers (Table 5).

4.4. Manufacturing and Installing the Experimental Chamber

The inner chamber, shown in Figure 17 and Figure 18, was manufactured and installed to compare the energy consumption of the AC unit. The inner chamber was 5 m long, 3.5 m wide, and 2.3 m high, and was designed to be large enough to accommodate one or two people. The walls, ceiling, and floor were manufactured with 100-mm-thick thermally insulated urethane panels. LED lighting and a split-type AC unit were also installed in the chamber. PVC-framed sliding double-pane glass windows (3790 mm long, 1840 mm high, and 24 mm thick) were installed in the façade of the chamber. This inner chamber was installed in the RCEC.

5. Results and Discussion

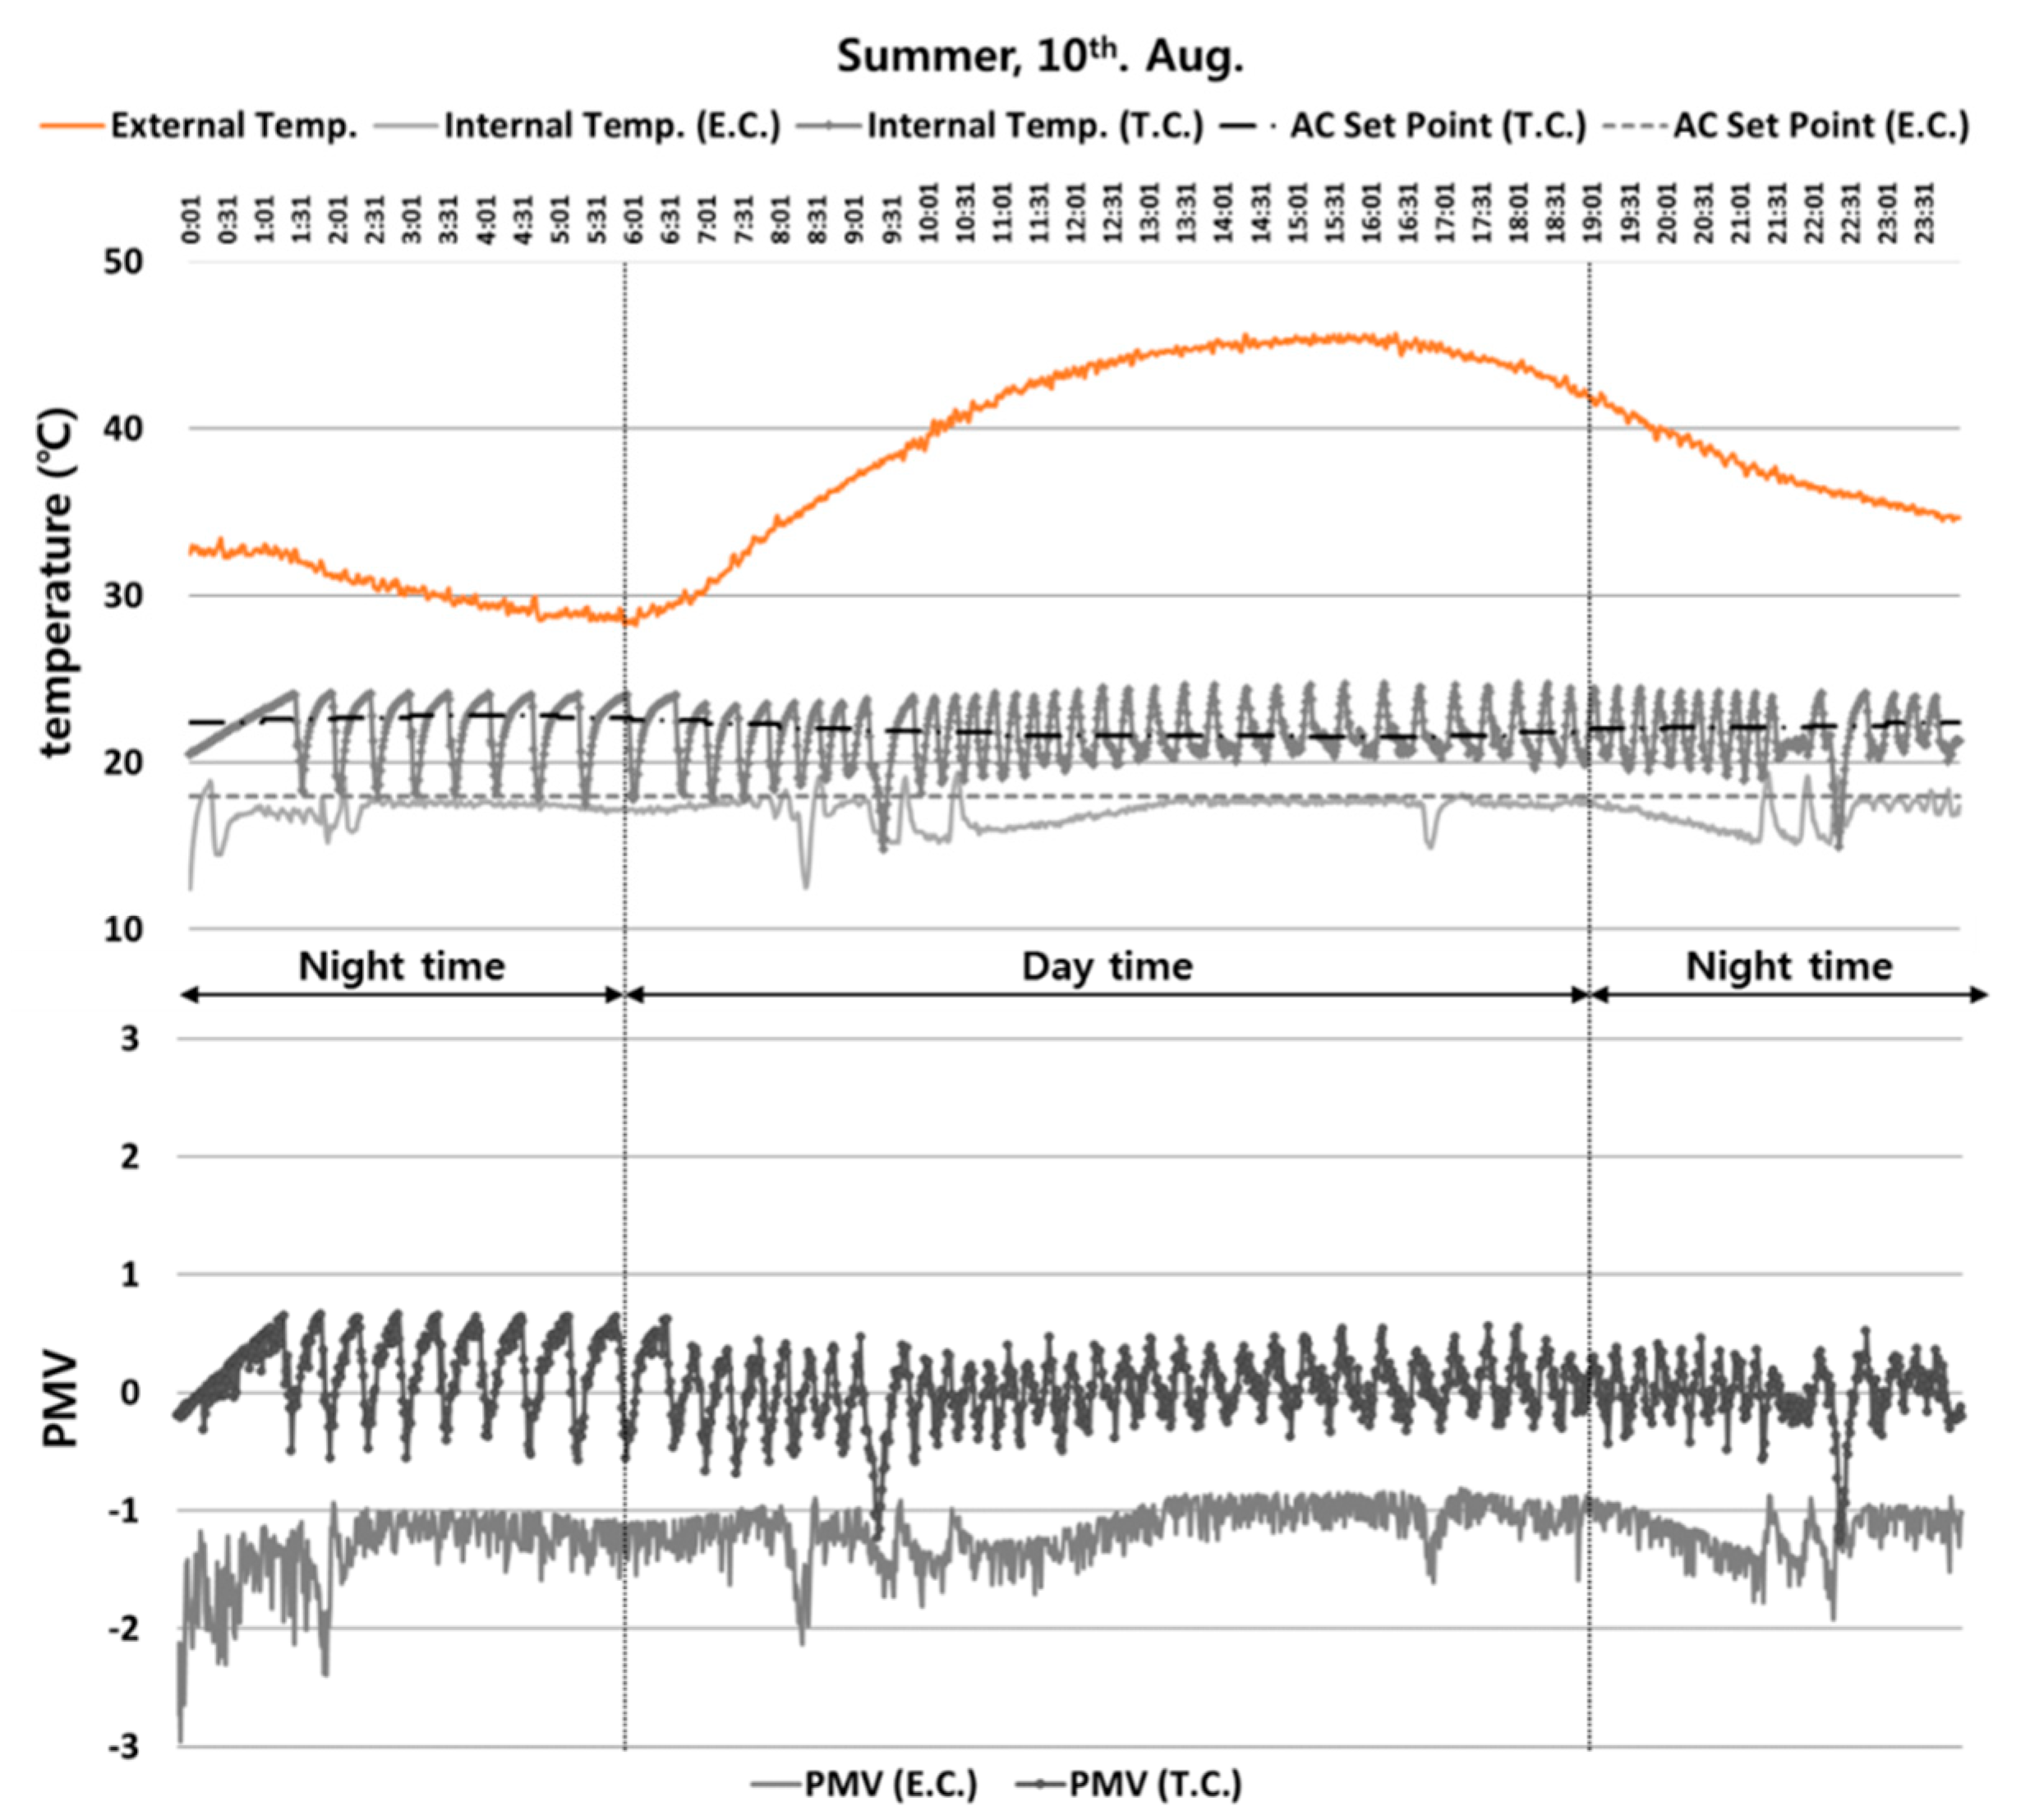
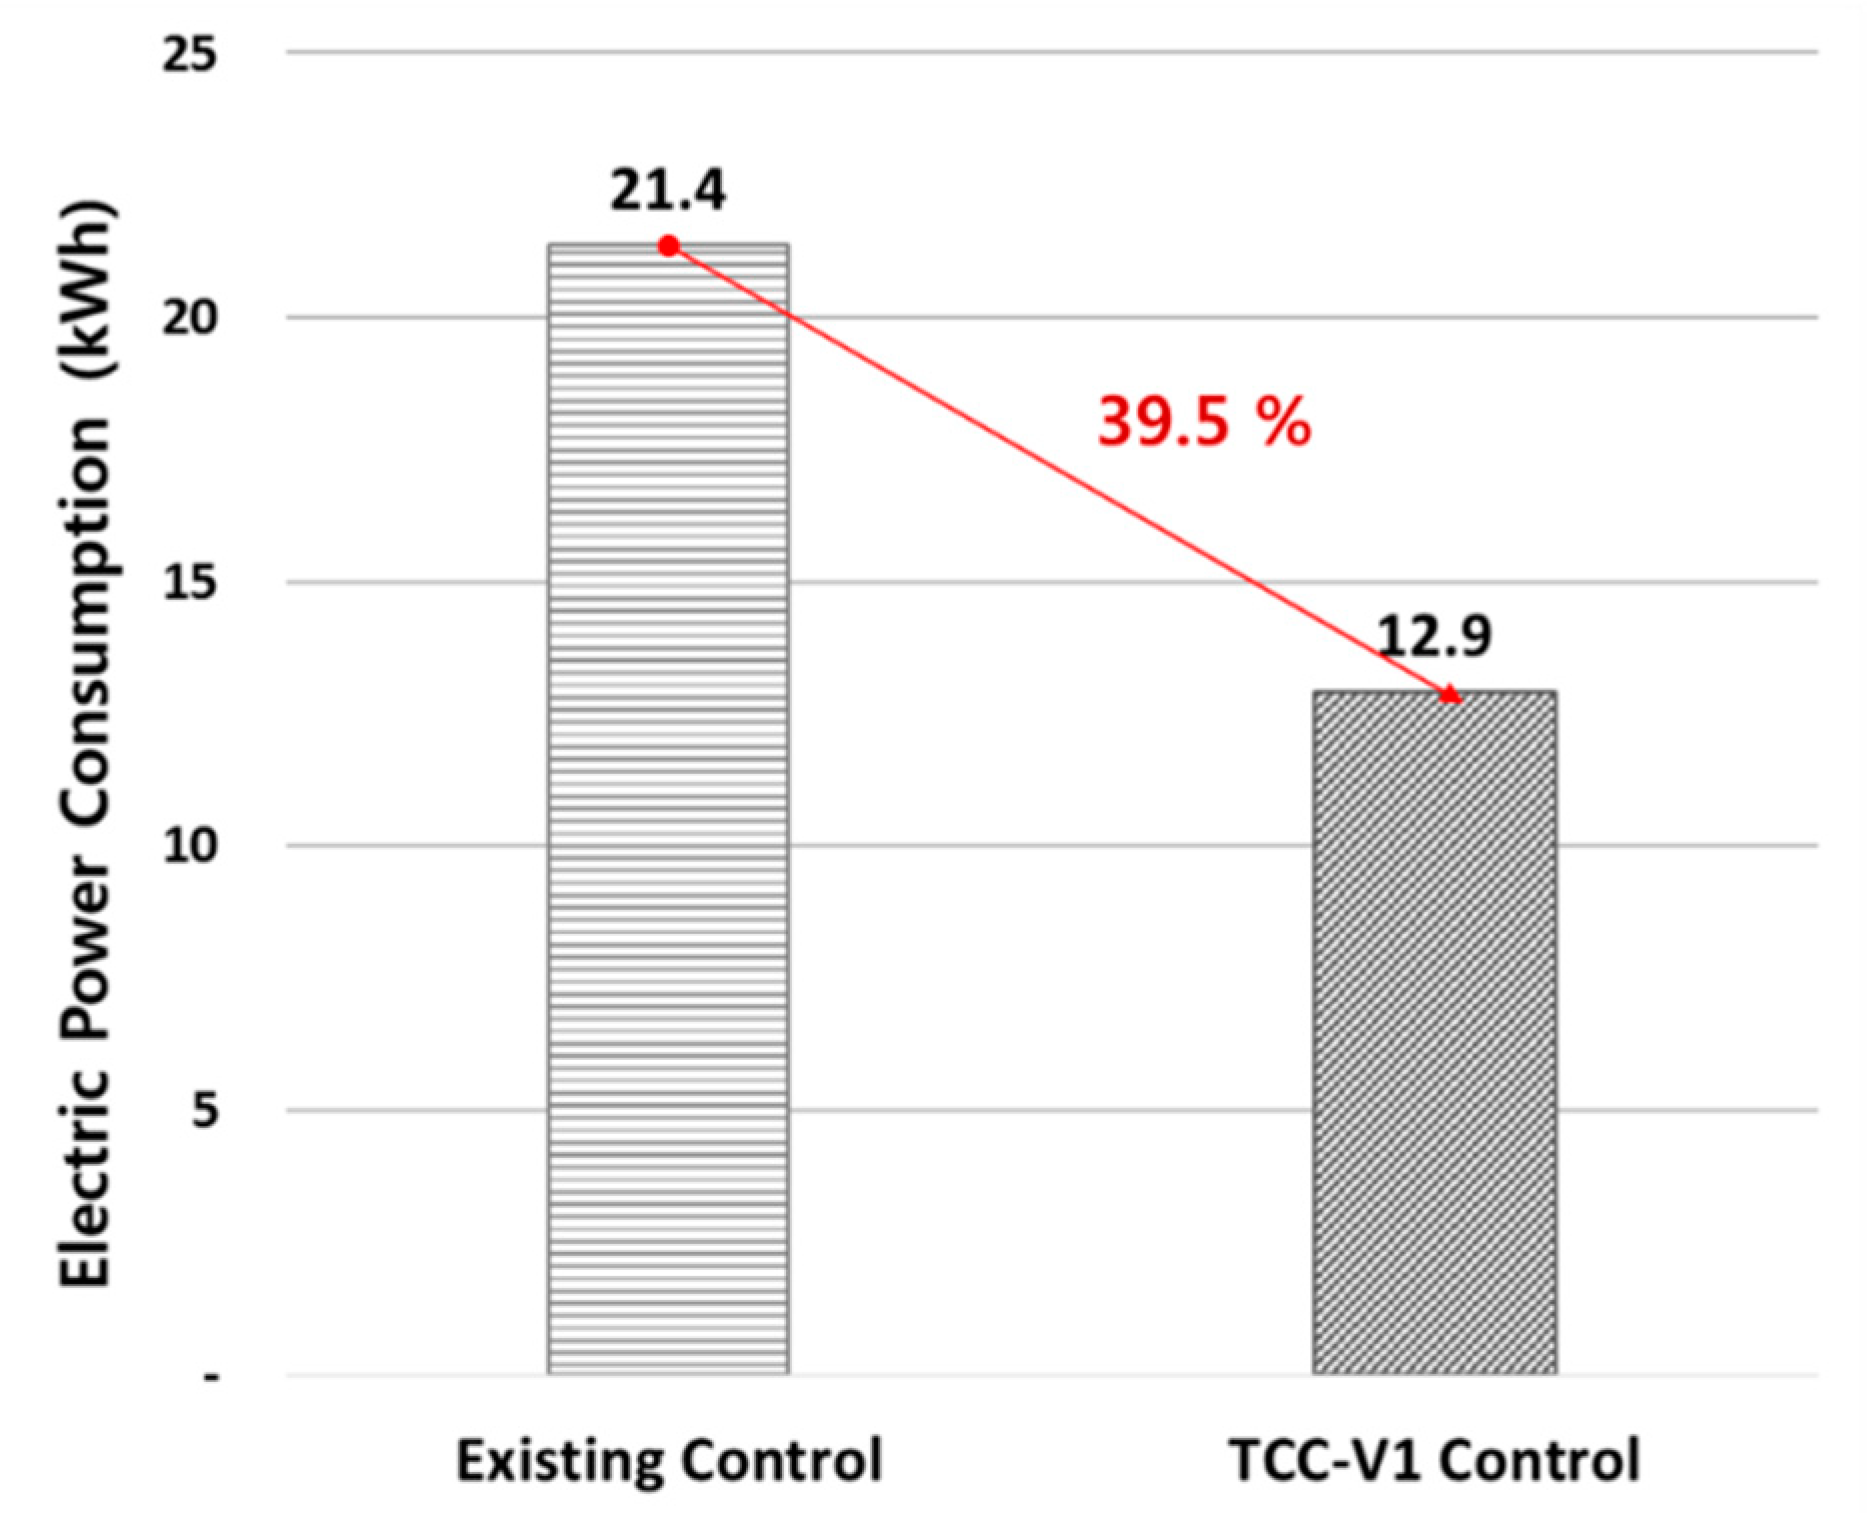
5.1. Summer Season—August 10

The AC temperature was set to 18 °C without implementing the TCC-V1 and the indoor average temperature of the inner chamber was 17.1 °C on Aug. 10, the representative day of the summer season. The difference between the AC setpoint temperature and the indoor average temperature was 0.9 °C, and the AC temperature was higher than the indoor average temperature. This was because the volume of air cooled by the AC was relatively large and covered the entire space, resulting from the large AC capacity compared to the space within the inner chamber.
On the other hand, the range within which the AC setpoint temperature was controlled by the TCC-V1 system was 21~23 °C and the indoor average temperature of the inner chamber was 19.9 °C. This was 2.8 °C higher than without using the TCC-V1 (Figure 19). These results, as stated previously [3], show that the indoor air temperature in a Kuwaiti house could be maintained at an even higher level.
Controlling the AC without using the TCC-V1 resulted in 21.38 kWh of electric energy being consumed, whereas using the TCC-V1 to control the AC consumed 12.93 kWh. Thus, the TCC-V1 reduced energy consumption by 39.5 % (Figure 20). The average PMV values were −1.21 and 0.06 without and with the TCC-V1, respectively. These results show that it is possible to save cooling energy and improve the indoor thermal comfort by using the TCC-V1 even in the intermediate seasons. This clearly indicates that the reduction in cooling energy and improvement in thermal comfort when using TCC-V1 would be great in the summer season, which is the longest season and extends over approximately six months in Kuwait.

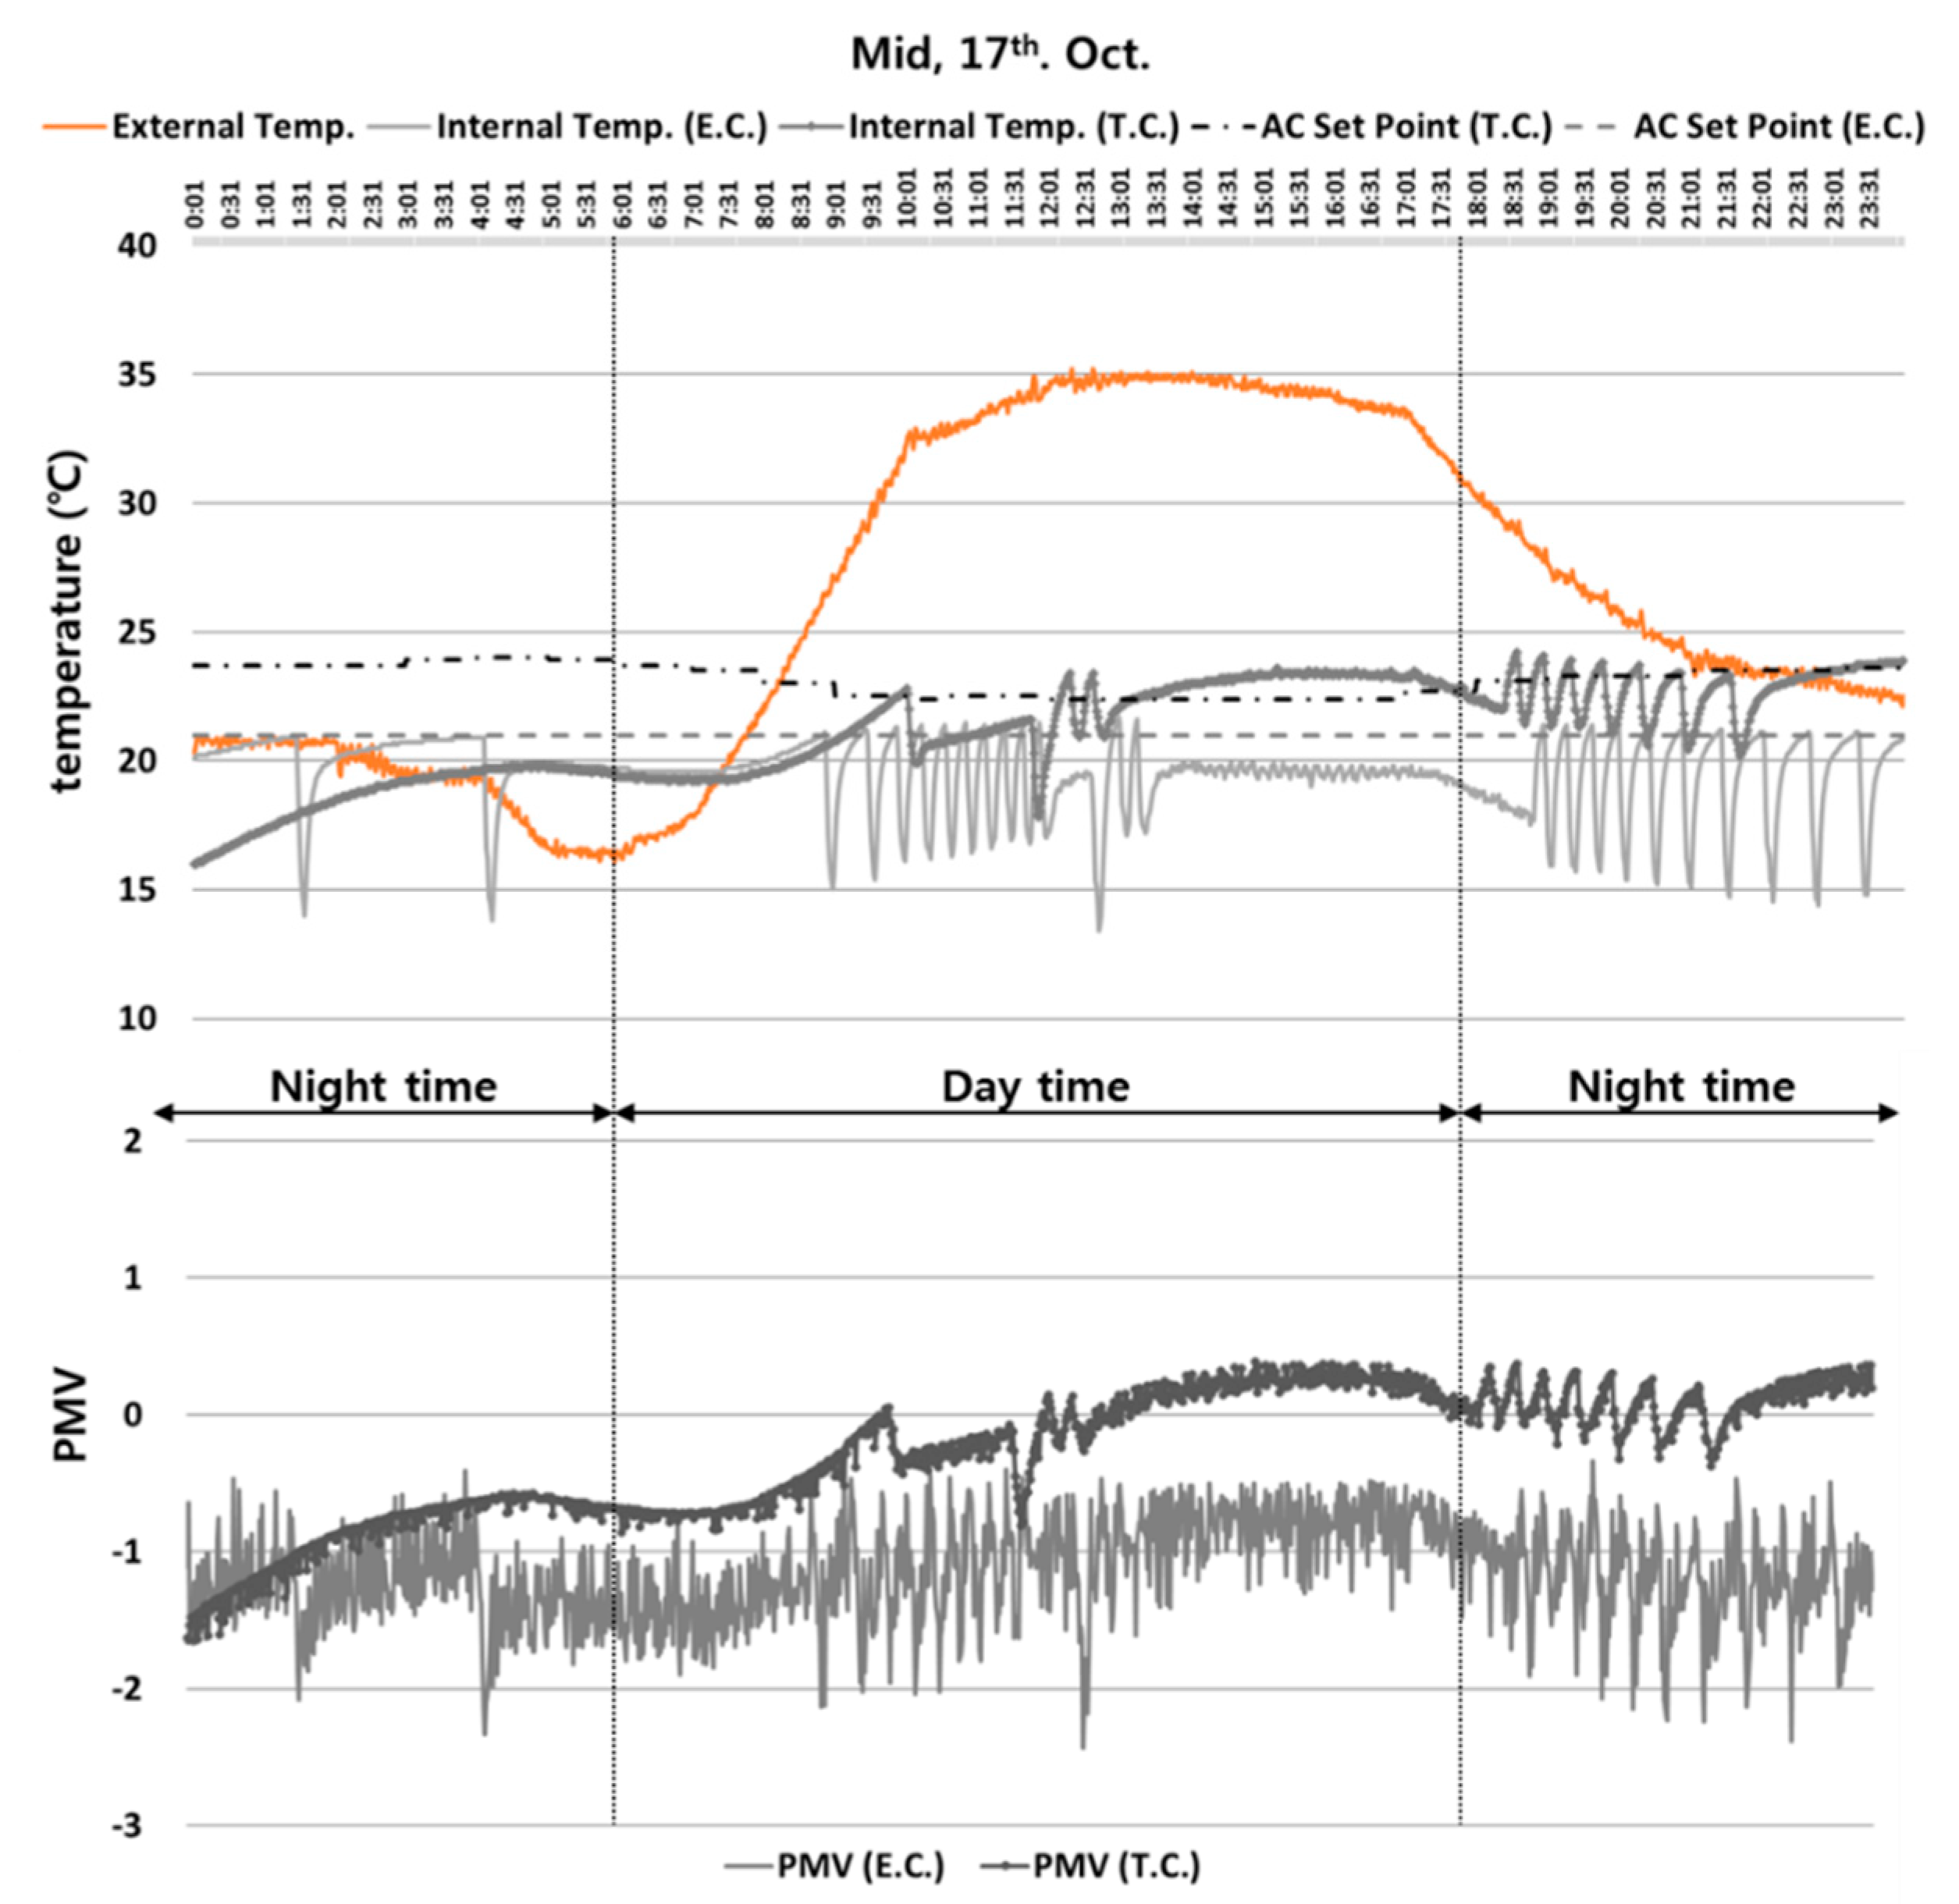
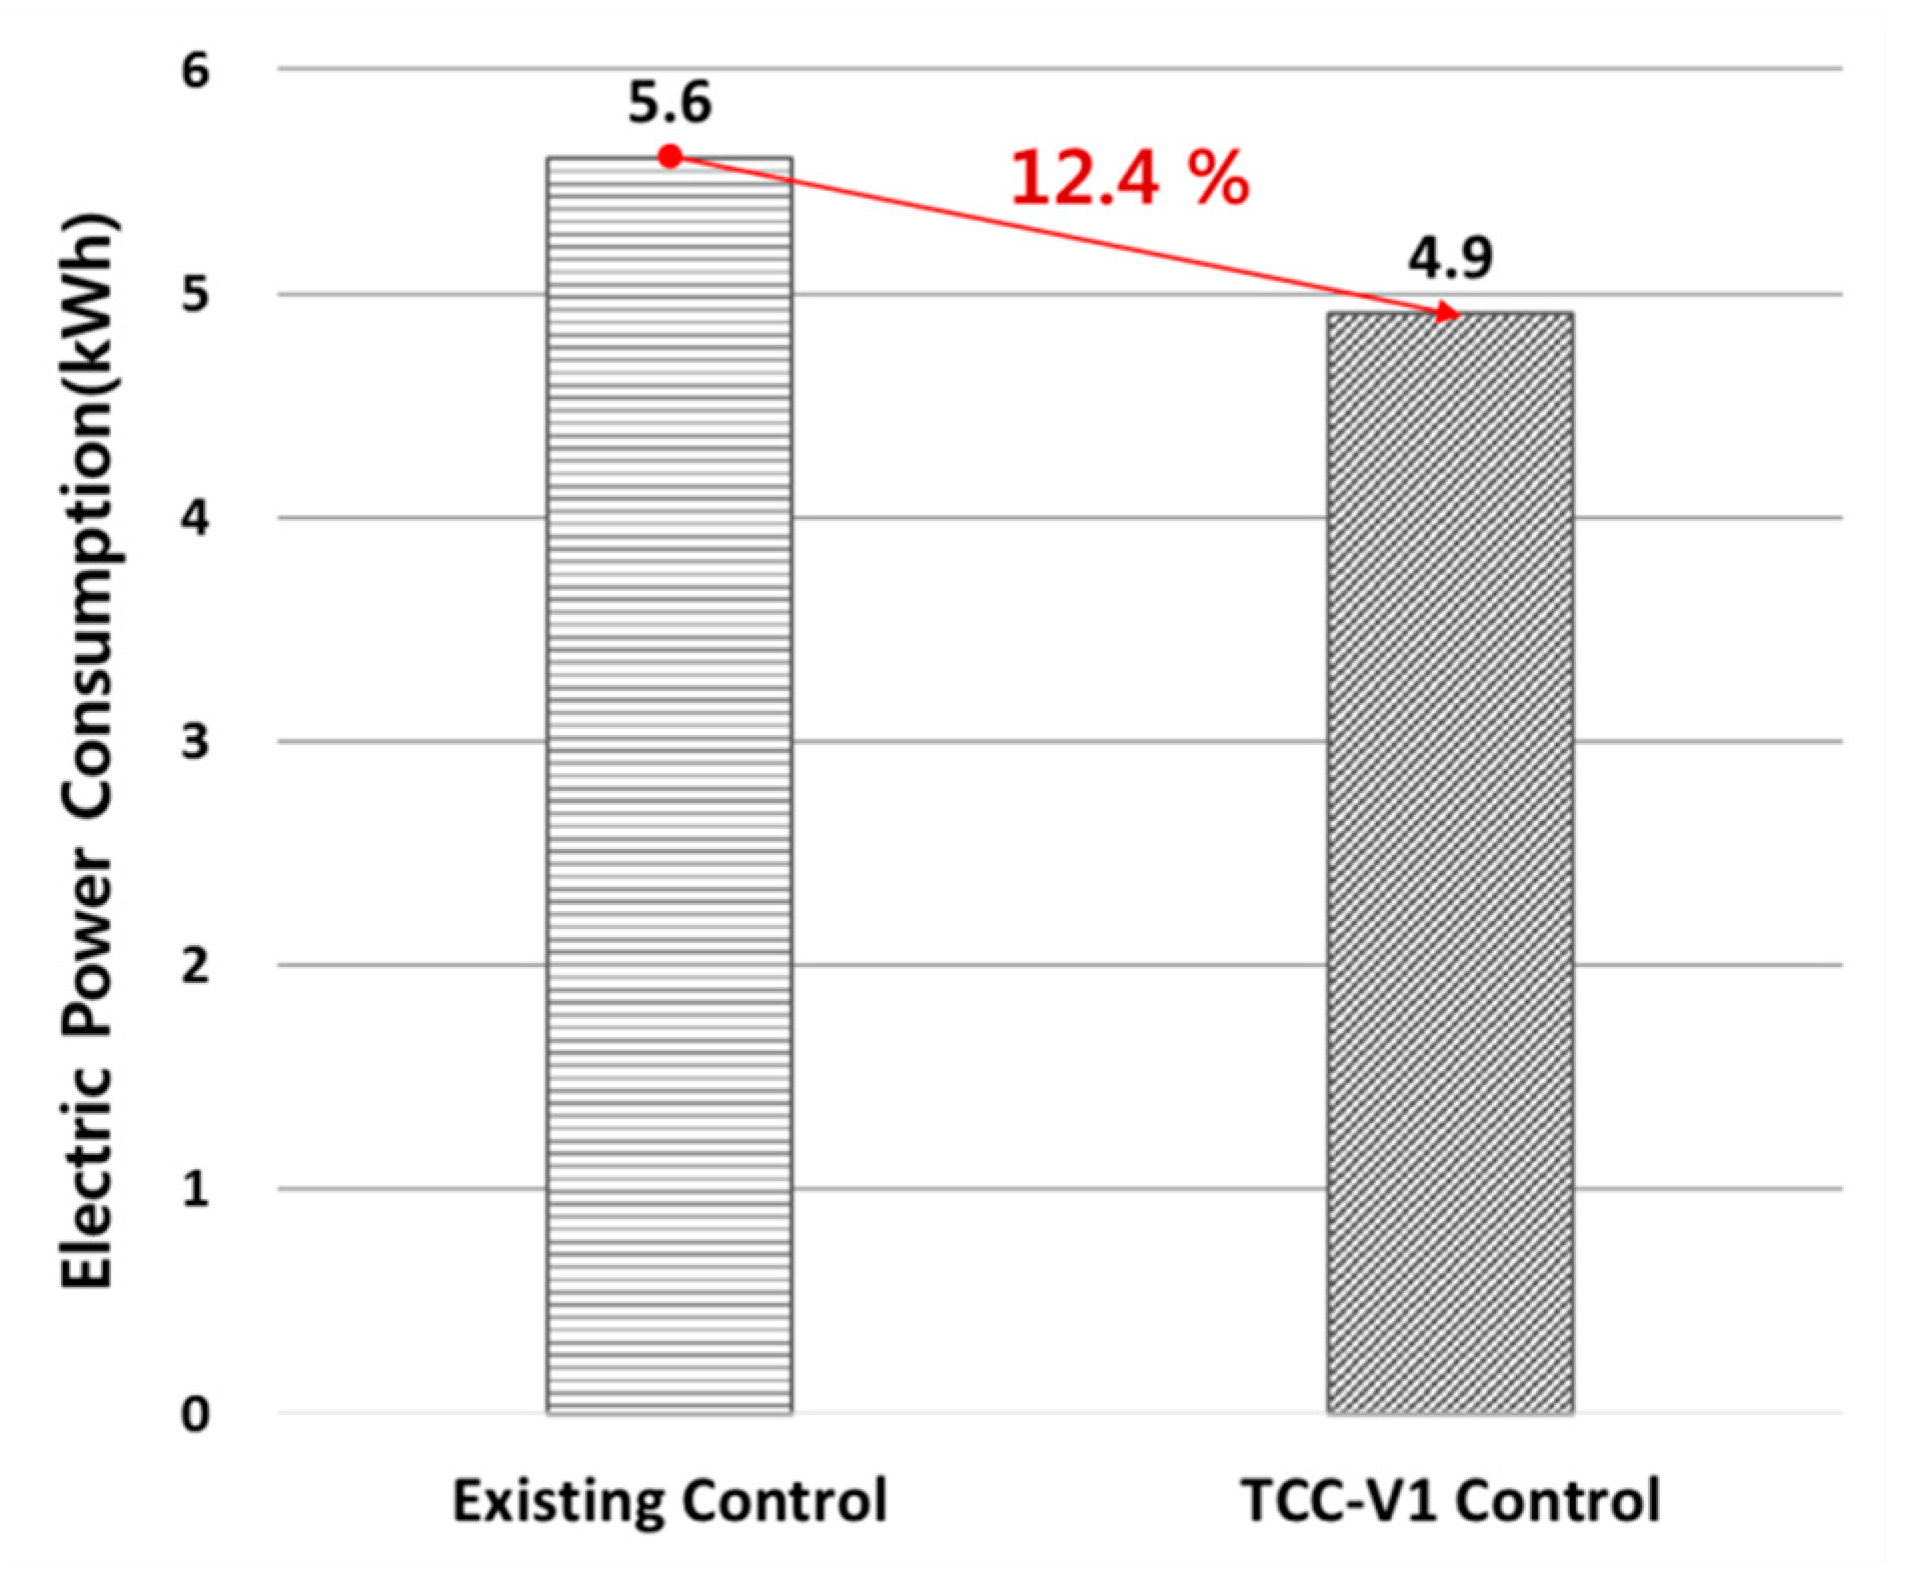
5.2. Intermediate Season—October 17

The range of AC temperature setpoints controlled by TCC-V1 was 22~24 °C on October 17, the representative day of the intermediate season and the indoor average temperature of the inner chamber was 21.2 °C. On the other hand, the AC temperature was set to 21 °C without using TCC-V1 and the indoor average temperature of the inner chamber was 19.5 °C. This was 1.7 °C higher than without using TCC-V1 (Figure 21). The temperature difference was attributable to the high AC capacity for the inner chamber space as described in Section 4.1.
Controlling the AC without using TCC-V1 consumed 5.6 kWh of electric energy, whereas using the TCC-V1 to control the AC consumed 4.91 kWh. Thus, the energy saving by employing the TCC-V1 was 12.4 % (Figure 22). The average PMV values were −1.15 and −0.28 without and with the TCC-V1, respectively. These results show that it is possible to save cooling energy and improve thermal comfort by using the TCC-V1 even in the intermediate season.

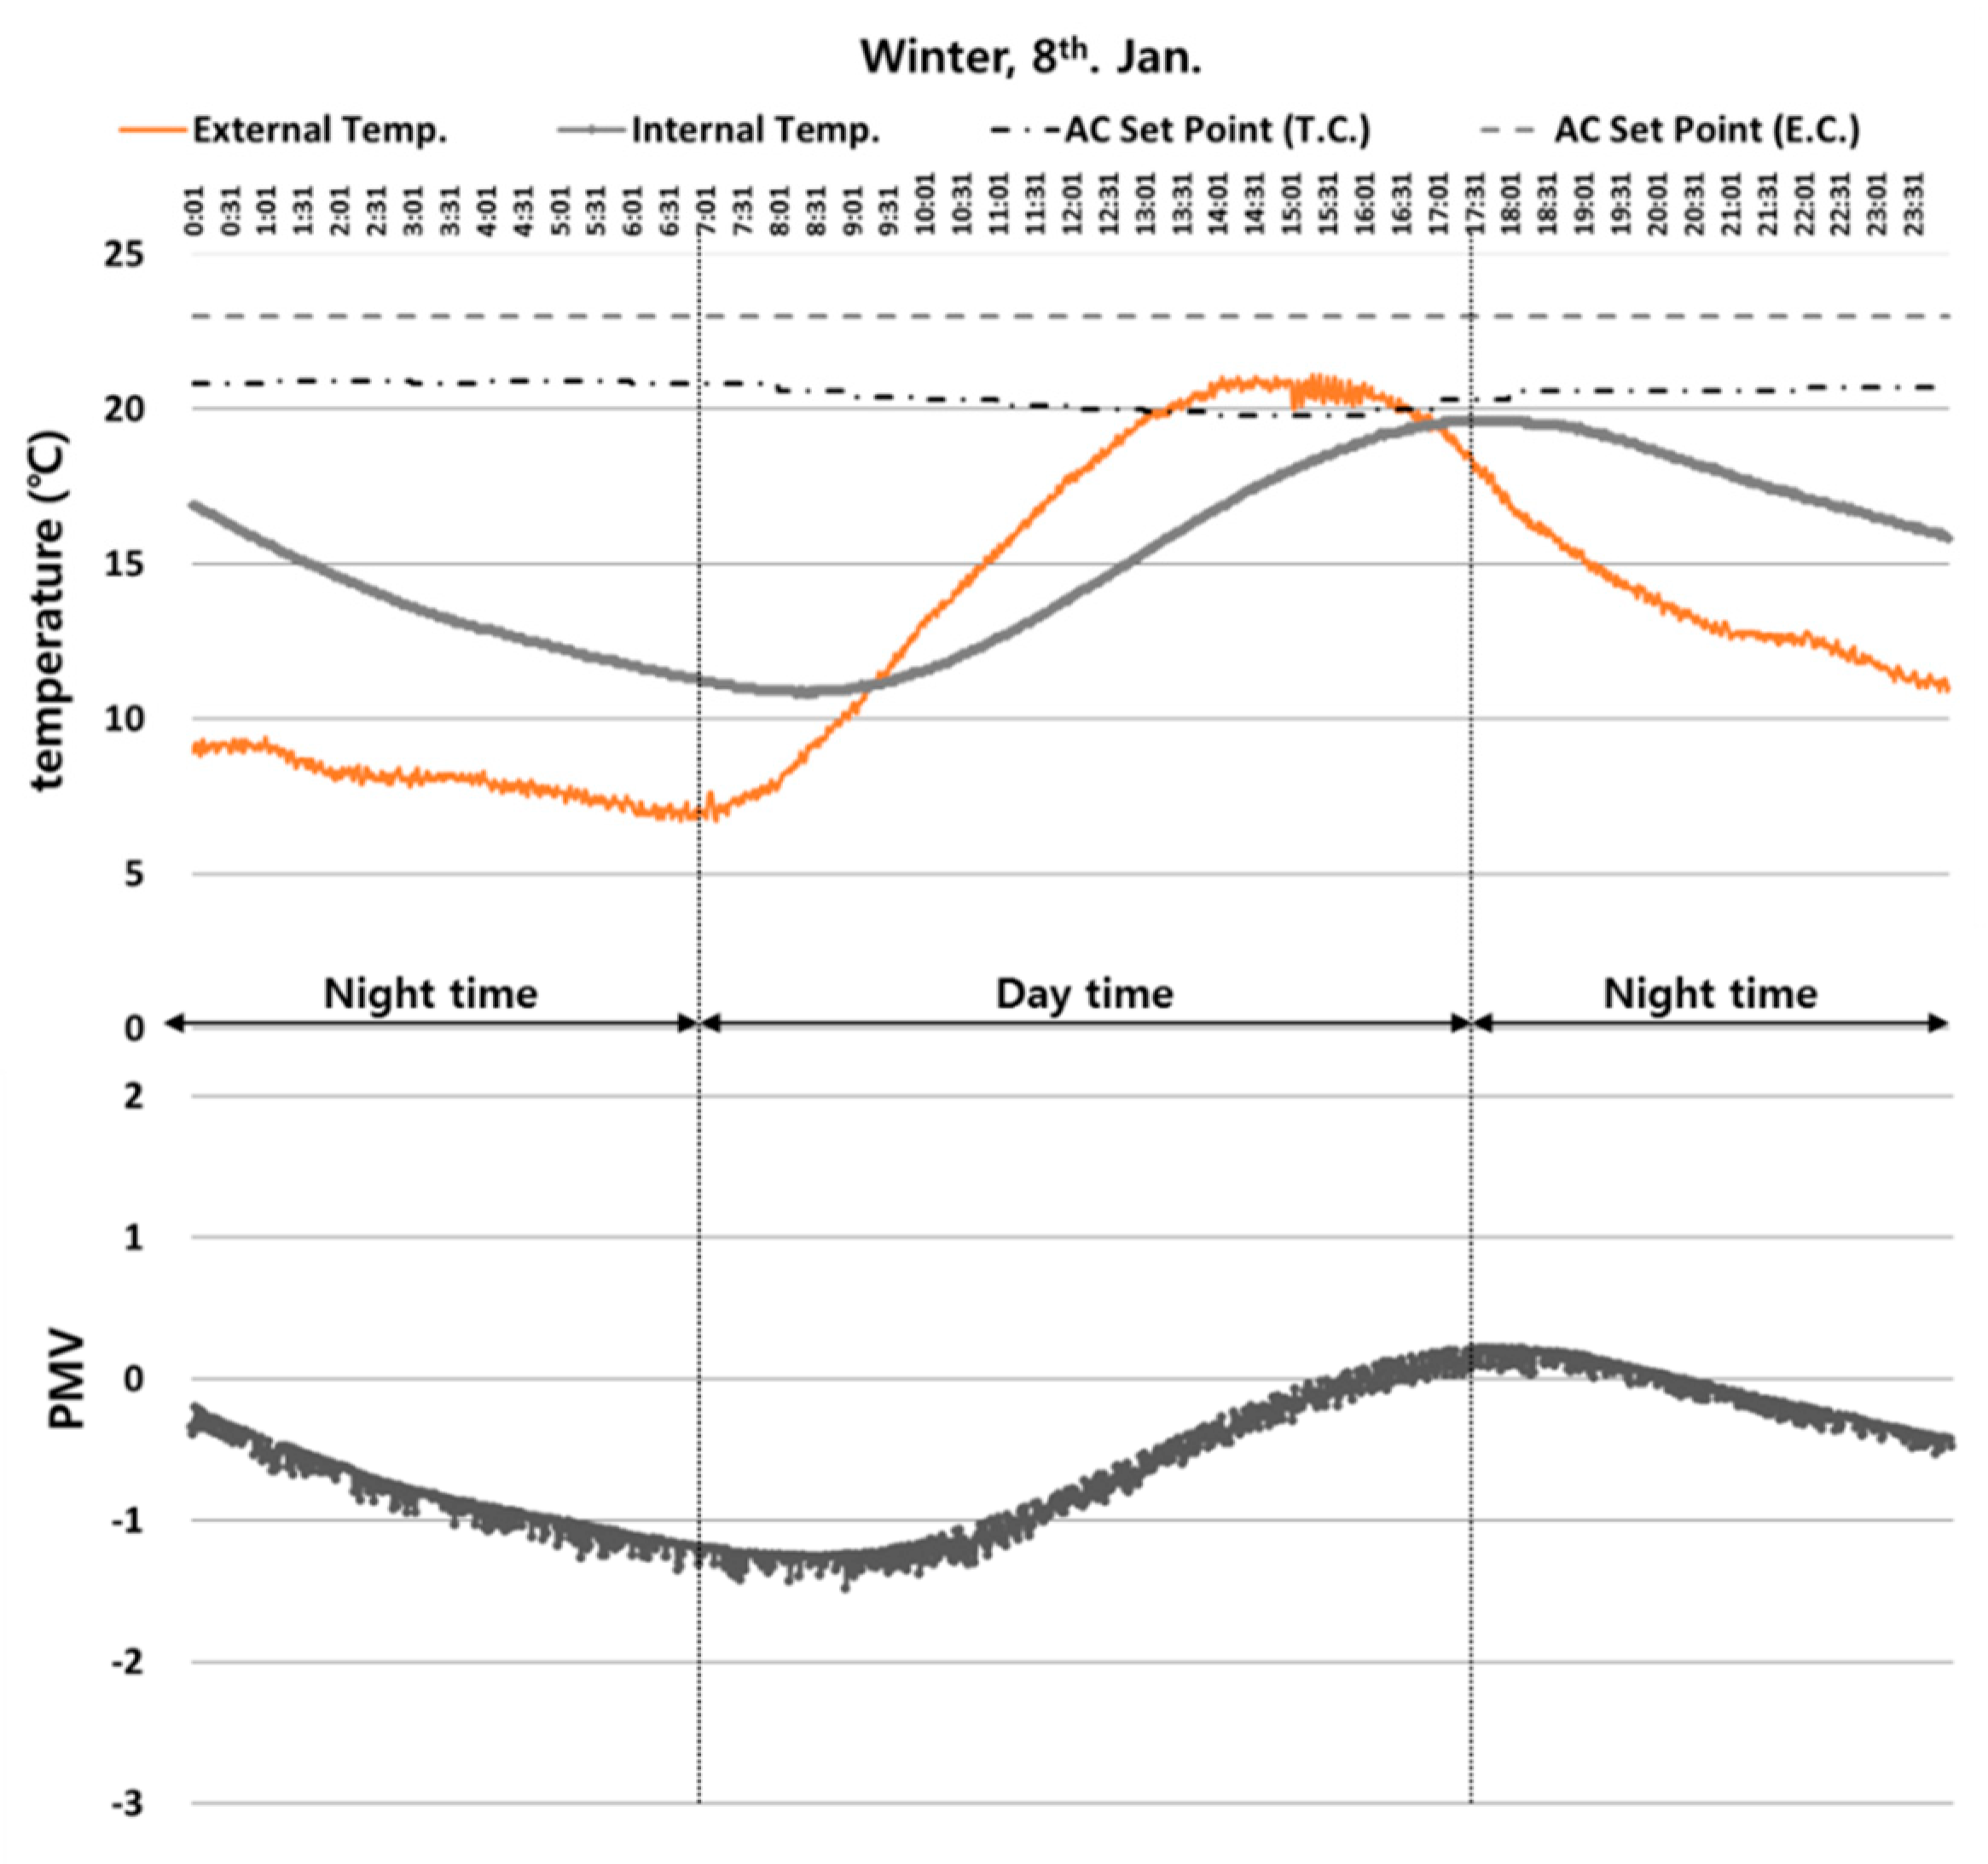
5.3. Winter Season—January 8

The AC was not operated on January 8, the representative day for the winter season, because the indoor temperature of the inner chamber remained below the AC setpoint temperature (Figure 23). However, the AC still consumed 0.43 kWh of electric energy both with and without the TCC-V1 because of its base load.
The outdoor average temperature on January 8 was 13.1 °C and the indoor average temperature was 15.3 °C. The average PMV value was −0.5 and this indicates that the indoor thermal comfort did not deteriorate, even though the AC was turned off in the winter season.

6. Conclusions

Saving the cooling energy consumption of residential houses is one of the key elements of energy demand management in Kuwait, and one way to solve this problem is to introduce automatic setpoint temperature control for AC systems. Our simulation results showed that the cooling energy consumption can be reduced by approximately 33.5% by using a thermal comfort-based controller. Based on this possibility, we developed an automatic temperature setpoint control system which is TCC-V1. The TCC-V1 automatically maintains the optimal indoor temperature by using the predicted mean vote (PMV) index, which is a well-known thermal comfort performance indicator. We demonstrated the applicability of TCC-V1 by running an empirical experiment using a real scale model. Development of the TCC-V1 included sensitivity analysis of the six variables in relation to the PMV to determine the influence of these variables on the PMV calculation.
The TCC-V1 uses real-time input from sensors to iteratively calculate the PMV and the optimal set temperature. The performance of the TCC-V1 was verified experimentally. The performance evaluation was carried out for August 10, October 17, and January 8 as meteorologically representative dates for the summer, intermediate, and winter seasons, respectively. These conditions were reproduced in the RCEC and measured comparatively. The performance evaluation using the real scale model and RCEC confirmed that the cooling energy consumption can be greatly reduced by implementing TCC-V1. The main experimental results are as follows.
  • On August 10, a representative day of the summer season, the TCC-V1 reduced the electric energy consumption by 39.5% and the PMV was improved from −1.21 to 0.06.
  • On October 17, a representative day of the intermediate season, the TCC-V1 reduced the electric energy consumption by 12.4% and the PMV was improved from −1.15 to −0.28.
  • The results of the experiment conducted on January 8, a representative day of the winter season, showed that the AC was not in operation because the indoor temperature of the inner chamber was always below the setpoint temperature of the AC unit.
The results showed that a TCC-V1 automatic AC control system can greatly reduce the electrical power consumption of AC units in Kuwaiti residences. Further enhancement of the performance of the control device would require the optimization and reliability of the device to be secured. One of the most important components of the control device is the sensors that produce the input information. This study investigated the necessity of applying the MRT and air velocity sensors. Based on two scenarios with measured data, this study omitted these two sensors in the PMV calculation of the residence in Kuwait. However, application of the TCC-V1 developed in this study would require more detailed experimentation and analysis of the sensor configuration.
A future study of the effectiveness of the TCC-V1 would have to be conducted in an actual residential house in Kuwait. This would necessitate the development of the TCC-V2 model with more precise control, and the optimal position of each PMV sensor would need to be determined. In addition, future development of the final version of the TCC would need to consider the impact of the uncertainty surrounding the subjective thermal comfort [29], and the applicability of advanced control techniques such as a data-driven approach [28].

Author Contributions

Conceptualization, J.P. and T.K.; methodology, T.K. and C.-s.L.; validation, J.P. and C.-s.L.; formal analysis, J.P.; investigation, J.P. and C.-s.L.; data curation, T.K. and C.-s.L.; writing—original draft preparation, J.P.; writing—review and editing, T.K. and C.-s.L.; visualization, J.P.; supervision, T.K.

Funding

This research was funded by the Korea Institute of Energy Technology Evaluation and Planning and the Republic of Korea Ministry of Trade, Industry & Energy (grant number 20168510011550).

Conflicts of Interest

The authors declare no conflict of interest.

Nomenclature

ACAir conditioner
ASHRAEAmerican society of heating, refrigerating and air-conditioning engineers
CAVConstant air volume
CLOCloth value of people
CV-RMSECoefficient of variation of root mean-squared error
DOEDepartment of energy
HVACHeating, ventilation and air conditioning
MBEmean bias error
METMetabolic rate of people
MEWMinistry of energy and water
MPCModel predictive control
MRTMean radiant temperature
PMVPredicted mean vote
RCECReal-scale climatic environment chamber
RHRelative humidity
TCCThermal comfort-based controller
TMYTypical meteorological year

References

  1. Kondratyev, K.Y.; Varotsos, C. Atmospheric greenhouse effect in the context of global climate change. Nuovo Cim. C 1995, 18, 123–151. [Google Scholar] [CrossRef]
  2. Cao, X.; Dai, X.; Liu, J. Building energy-consumption status worldwide and the state-of-the-art technologies for zero-energy buildings during the past decade. Energy Build. 2016, 128, 198–213. [Google Scholar] [CrossRef]
  3. Hassan, R.J.; Zin, R.M.; Majid, M.A.; Balubaid, S.; Hainin, M.R. Building Energy Consumption in Malaysia: An Overview. J. Teknol. 2014, 707, 2180–3722. [Google Scholar] [CrossRef]
  4. Ministry of Electricity and Water. Available online: https://www.mew.gov.kw/ (accessed on 13 April 2019).
  5. Jaffar, B.; Oreszczyn, T.; Raslan, R. Empirical and modelled energy performance in Kuwaiti villas: Understanding the social and physical factors that influence energy use. Energy Build. 2019, 188–189, 252–268. [Google Scholar] [CrossRef]
  6. Al-Mumin, A.; Khattab, O.; Sridhar, G. Occupants’ behavior and activity patterns influencing the energy consumption in the Kuwaiti residences. Energy Build. 2003, 35, 549–559. [Google Scholar] [CrossRef]
  7. Ameer, B.; Krarti, M. Impact of subsidization on high energy performance designs for Kuwaiti residential buildings. Energy Build. 2016, 116, 249–262. [Google Scholar] [CrossRef]
  8. Kellow, M. Kuwait’s approach to mandatory energy-conservation standards for buildings. Energy 1989, 14, 491–502. [Google Scholar] [CrossRef]
  9. Han, D.; Li, R.; Wang, F.; Sun, Z.; Moon, S.; Gong, Z.; Yu, W.; Zhang, Y. Study on Indoor Thermal Environment Control Based on Thermal Sensation Prediction. Procedia Eng. 2017, 205, 3072–3079. [Google Scholar] [CrossRef]
  10. Sadineni, S.B.; Boehm, R.F. Measurements and simulations for peak electrical load reduction in cooling dominated climate. Energy 2012, 37, 689–697. [Google Scholar] [CrossRef]
  11. Li, W.; Zhang, J.; Zhao, T. Indoor thermal environment optimal control for thermal comfort and energy saving based on online monitoring of thermal sensation. Energy Build. 2019, 197, 57–67. [Google Scholar] [CrossRef]
  12. Fanger, P.O. Calculation of Thermal Comfort—Introduction of a Basic Comfort Equation. ASHRAE Trans. 1967, 73, III4.1–III4.20. [Google Scholar]
  13. Shaw, E.W. Thermal Comfort: Analysis and applications in environmental engineering, by P. O. Fanger. 244 pp. DANISH TECHNICAL PRESS. Copenhagen, Denmark, 1970. Danish Kr. 76, 50. R. Soc. Health J. 1972, 92, 164. [Google Scholar] [CrossRef]
  14. Conceição, E.Z.E.; Gomes, J.M.M.; Ruano, A.E. Application of HVAC Systems with Control Based on PMV Index in University Buildings with Complex Topology. IFAC-PapersOnLine 2018, 51, 20–25. [Google Scholar] [CrossRef]
  15. Yan, H.; Niu, J.; Deng, S. A Thermal Comfort based Controller for a Direct Expansion Air Conditioning System. Energy Procedia 2017, 142, 1817–1822. [Google Scholar] [CrossRef]
  16. Yan, H.; Pan, Y.; Li, Z.; Deng, S. Further development of a thermal comfort based fuzzy logic controller for a direct expansion air conditioning system. Appl. Energy 2018, 219, 312–324. [Google Scholar] [CrossRef]
  17. Goyal, S.; Ingley, H.A.; Barooah, P. Occupancy-based zone-climate control for energy-efficient buildings: Complexity vs. performance. Appl. Energy 2013, 106, 209–221. [Google Scholar] [CrossRef]
  18. Goyal, S.; Ingley, H.A.; Barooah, P. Zone-level control algorithms based on occupancy information for energy efficient buildings. In Proceedings of the 2012 American Control Conference (ACC), Montreal, QC, Canada, 27–29 June 2012; pp. 3063–3068. [Google Scholar]
  19. Park, J.Y.; Nagy, Z. Comprehensive analysis of the relationship between thermal comfort and building control research—A data-driven literature review. Renew. Sustain. Energy Rev. 2018, 82, 2664–2679. [Google Scholar] [CrossRef]
  20. Coakley, D.; Raftery, P.; Keane, M. A review of methods to match building energy simulation models to measured data. Renew. Sustain. Energy Rev. 2014, 37, 123–141. [Google Scholar] [CrossRef] [Green Version]
  21. Royapoor, M.; Roskilly, T. Building model calibration using energy and environmental data. Energy Build. 2015, 94, 109–120. [Google Scholar] [CrossRef] [Green Version]
  22. Ahmad, M.; Culp, C.H. Uncalibrated Building Energy Simulation Modeling Results. HVAC R Res. 2006, 12, 1141–1155. [Google Scholar] [CrossRef]
  23. Clarke, J. Energy Simulation in Building Design, 2nd ed.; Butterworth-Heinemann: Oxford, UK, 2001; pp. 1–21. ISBN 0-7506-5082-6. [Google Scholar]
  24. Strachan, P.A.; Kokogiannakis, G.; Macdonald, I.A. History and development of validation with the ESP-r simulation program. Build. Environ. 2008, 43, 601–609. [Google Scholar] [CrossRef] [Green Version]
  25. ASHRAE Guideline 14-2014: Measurement of Energy, Demand, and Water Savings. Available online: https://webstore.ansi.org/standards/ashrae/ashraeguideline142014 (accessed on 30 August 2019).
  26. Hawila, A.A.-W.; Merabtine, A.; Chemkhi, M.; Bennacer, R.; Troussier, N. An analysis of the impact of PMV-based thermal comfort control during heating period: A case study of highly glazed room. J. Build. Eng. 2018, 20, 353–366. [Google Scholar] [CrossRef]
  27. ASHRAE Standard 55-2017: Thermal Environmental Conditions for Human Occupancy; ASHRAE: Atlanta, GA, USA, 2017.
  28. Lu, S.; Wang, W.; Lin, C.; Hameen, E.C. Data-driven simulation of a thermal comfort-based temperature set-point control with ASHRAE RP884. Build. Environ. 2019, 156, 137–146. [Google Scholar] [CrossRef]
  29. Wang, J.; Wang, Z.; de Dear, R.; Luo, M.; Ghahramani, A.; Lin, B. The uncertainty of subjective thermal comfort measurement. Energy Build. 2018, 181, 38–49. [Google Scholar] [CrossRef]
Figure 1. Energy consumption by type of building (left) and energy consumption in residences for specific purposes (right).
Energies 12 03348 g001
Figure 2. Exterior wall and window structures of actual houses.
Energies 12 03348 g002
Figure 3. Analysis sequence in ESP-r for the calculation of the optimal temperature.
Energies 12 03348 g003
Figure 4. ESP-r simulation model and classification of cooling zones.
Energies 12 03348 g004
Figure 5. Calibration of simulation model with measurements conducted in the AC3 zone of the target house in Kuwait.
Energies 12 03348 g005
Figure 6. Cooling energy consumption depending on the temperature control method.
Energies 12 03348 g006
Figure 7. Sensitivity analysis results to determine the impact of factors affecting thermal comfort.
Energies 12 03348 g007
Figure 8. The data of four variables measured in the center of a cooling zone in August for demonstration of two scenarios.
Energies 12 03348 g008
Figure 9. Predicted mean vote (PMV) error between the basecase and two scenarios.
Energies 12 03348 g009
Figure 10. Optimal setpoint temperature error between the basecase and two scenarios.
Energies 12 03348 g010
Figure 11. PMV frequency distributions in measurement and two scenarios.
Energies 12 03348 g011
Figure 12. Daily PMV error in two scenarios with optimal setpoint of base case.
Energies 12 03348 g012
Figure 13. Air conditioner (AC) unit, TCC-V1, PMV meter installation status in the inner chamber.
Energies 12 03348 g013
Figure 14. Operational flowchart of TCC-V1.
Energies 12 03348 g014
Figure 15. View of real-scale climate environment chamber and mock-up chamber for experiment.
Energies 12 03348 g015
Figure 16. Temperature and RH distribution of each representative day.
Energies 12 03348 g016
Figure 17. View of RCEC and installation of inner chamber for experiment.
Energies 12 03348 g017
Figure 18. Size and configuration of inner chamber, location of air conditioner and sensor.
Energies 12 03348 g018
Figure 19. Experimental results recorded on August 10.
Energies 12 03348 g019
Figure 20. Comparison of electric energy consumption with and without TCC-V1 control on August 10.
Energies 12 03348 g020
Figure 21. Experimental results recorded on October 17.
Energies 12 03348 g021
Figure 22. Comparison of electric energy consumption without and with TCC-V1 on October 17.
Energies 12 03348 g022
Figure 23. Experimental results recorded on January 8.
Energies 12 03348 g023
Table 1. Overview of the house to be simulated.
ItemsContentsRemarksExterior View
LocationAqaila, KuwaitSingle Family (6 people) Energies 12 03348 i001
Completion2013-
Stories4 floors-
StructureR.C.R.C., Cement Block, Fiber Glass, Cement Mortar
Plot Area375 m2-
Gross Area879.22 m2-
Gr. Floor Area319.75 m22 Reception Areas, Swimming Pool
1st Floor Area255.12 m2Living Room, Kitchen, Dining Room, Study, Theater
2nd Floor Area255.12 m21 Master Bedroom, 3 Bedrooms, Kitchen
3rd Floor Area70.7 m2Maid’s Room, Laundry Room
Table 2. Annual changes in the indoor set temperature by each control method.
Manual Control by OccupantThermal Comfort Based Control
Energies 12 03348 i002 Energies 12 03348 i003
Table 3. Conditions for experimental performance evaluation.
ItemsWithout TCC-V1With TCC-V1
AC Temperature setpointAugust 10: 18 °CAutomatically set
October 17: 21 °C
January 8: 23 °C
Input data (fixed value)CLO: 0.5 (August 10 and October 17), 1.0 (January 8)
MET: 90 W/m2
Air velocity: 0.09 m/s
Measurement ValueReal-time AC electric energy consumption
Air temperature and RH of inner and outer chamber
AC temperature setpoints controlled by TCC-V1
PMV index
Table 4. Average temperature and humidity of each representative day.
ItemsSummer SeasonIntermediate SeasonWinter Season
PeriodMay–SeptemberMarch, April, October, and NovemberDecember–February
Representative dateAugust 10October 17January 8
Average temperature and RHTemp.RHTemp.RHTemp.RH
37.58 °C12.5%26.18 °C11.67%13.10 °C59.46%
Table 5. Specifications of real-scale climatic environment chamber.
Internal volume10 m × 10 m × 4.5 m Energies 12 03348 i004
Temperature−30–80 °C
Humidity10–90%
Insolation800–1200 W/m2
HVAC system530 m3/minute
Cooling system123 kW
Heating system240 kW
Rainfalleach module set of 150, 40 and 25 mm/h
Snowfall50 mm/h through movable gun

