Article

Intelligent Classification Method for Grid-Monitoring Alarm Messages Based on Information Theory

1
College of Energy and Electrical Engineering, Hohai University, Nanjing 210098, China
2
Nanjing Power Supply Company of State Grid Jiangsu Electric Power Co., Ltd., Nanjing 210019, China
*
Author to whom correspondence should be addressed.
Energies 2019, 12(14), 2814; https://doi.org/10.3390/en12142814
Submission received: 31 May 2019 / Revised: 13 July 2019 / Accepted: 16 July 2019 / Published: 22 July 2019
(This article belongs to the Special Issue Electric Power Systems Research 2019)

Abstract

:
Alarm messages for grid monitoring are an important way to supervise the operation of power grids. Since the use of alarm messages is increasing exponentially due to the continuous expansion of the scale of power grids, a processing method for alarm messages based on statistics is proposed in this study. Entropy theory in information theory is introduced into the calculation of information value in power-grid alarming. By means of multiple entropy definitions, an evaluation index system for information value is constructed. Based on the analytic hierarchy process (AHP), various alarm-message entropies are used as indices to comprehensively assess the information value and level of each alarm message. Finally, an example is given to illustrate the effectiveness and practicality of the proposed method. This study provides a new idea for the intelligent classification of alarm messages.

1. Introduction

Using alarm messages for grid monitoring, Supervisory Control and Data Acquisition (SCADA) systems display the operation of power grids to supervisors, and alarm messages also constitute a data basis for fault diagnosis and decision analysis [1,2]. With renewable energy and electric vehicles now connected to power grids, power data are becoming more abundant, and such data are highly valuable [3,4,5]. These data are stored in databases in the form of audio, text, and images [6]. The scale of power grids is gradually expanding, and the number of alarm messages as text data is also growing exponentially. Take a provincial electric power company as an example: The company serves more than 40 million electricity customers in the province. Until September 2017, more than 3500 substations with a voltage of 35–500 kV were connected, and the electricity consumption of the province exceeded 600 billion kWh. According to statistics, over 1700 alarm messages are processed by each person on duty per day on average, i.e., every 50 s, one alarm message has to be analyzed, judged, and processed, thus posing a tremendous challenge to the dispatch and operations personnel. Therefore, faced with a massive number of alarm messages for grid monitoring, the classification and processing of messages can help the operations personnel effectively improve the efficiency and precision of monitoring and develop intelligent alarms.
Intelligent alarms provide functions such as the comprehensive compression of alarms, the priority classification of alarms, and the delivery of fault diagnosis results through comprehensive analysis of alarm messages when a power grid fails [7]. Intelligent alarm systems are an important way for supervisors to monitor the safety and stability of the operation of a power grid. In order to accelerate the development of intelligent monitoring system, scholars have conducted in-depth research on intelligent alarm technology [8].
In Reference [9], an integrated fuzzy expert system is presented to diagnose various faults that may occur in a regional transmission network and substations. Using the fuzzy discriminant method, the problem of discriminating malfunction is solved. Silva et al. [10] introduced a new expert system framework which includes two applications to meet the daily needs of control centers: An alarm processing system and a power system recovery support system. This framework can improve the rules of expert systems. In Reference [11], a novel power-system alarm processing and fault diagnosis expert system (AFDES) is presented. Backus–Naur Form (BNF) is used to design a kind of expert rule framework which can filter and classify alarm messages according to their priority and comprehensive level. Although expert systems are constantly improving with the advancement of research, they still have some shortcomings, such as incompleteness of knowledge base rules, slow diagnosis speed, and poor fault tolerance.
In order to improve the fault tolerance of monitoring and alarm systems, alarm methods based on artificial neural networks have gradually started to be applied. Souza et al. [12] proposed a hybrid model based on a rule-based system and an artificial neural network for intelligent substation alarm processing and fault location. The rule-based system can selectively process alarm messages, and the artificial neural network can further classify the selected alarm messages. Fritzen et al. [13] used an artificial neural network (ANN) and a genetic algorithm (GA) for alarm processing and fault diagnosis, which improves the diagnosis speed and generalization ability of the alarm system. Although such methods can improve the fault tolerance of alarm systems, they have problems, such as poor interpretation ability and difficulty in sample acquisition.
Additionally, scholars have proposed many other intelligent alarm methods, for example involving Petri nets and information fusion. For example, in Reference [14], an enhanced fuzzy Petri net (based on an existing fuzzy Petri net) embedded with temporal constraints of alarm messages is proposed for power-system fault diagnosis. However, the Petri net method is too complex for the modeling of large-scale power grids, and the model versatility is poor when the grid topology changes. In References [15,16], the authors use multi-source information fusion to diagnose and analyze power-grid faults. Their methods can improve the accuracy and fault-tolerance of intelligent alarms to some extent, however information completeness cannot be guaranteed, and the redundancy of information will reduce the speed of analysis. Therefore, this kind of method needs to be studied further.
The abovementioned alarm methods can realize intelligent fault diagnosis in [9,10,11,12,13,14,15,16]. Alarm classification functions have also been used, for example in [10,11,12]. However, such alarm methods with a classification function are all filtered according to established rules in expert systems. In Reference [17], alarm messages were automatically associated with an alarm knowledge base using a fuzzy matching and reasoning method in order to improve the flexibility of alarm systems. However, it is first necessary to establish an alarm-message matching rule table. In Reference [18], a knowledge mining method for association rules based on ontology is proposed for the intelligent analysis of substation alarm messages. A data-mining method is adopted to generate rules instead of artificially making rules, however, this does not remove the constraints of the rules.
In summary, on the one hand, there are some problems with existing fault diagnosis methods. However, on the other hand, alarm-classification methods are mainly based on rules. Although the Chinese State Grid Corporation has developed a relevant classification standard for alarm messages [19], artificial marking is still needed when entering alarm messages into the database, which entails a very large amount of work. Moreover, there is confusion regarding the classification. For example, “accident”, “abnormal”, and “notification” indicate the severity of the alarm, whereas “off-limit” and “displacement” are the content of the alarm and cannot be used to determine its severity. With the increasing complexity of power-grid architecture, the connection modes and configuration of primary and secondary equipment in substations have diversified, which affects the applicability of conventional rules and methods.
For the whole of a complex power system, it is uncertain whether the failure or abnormality of primary and secondary equipment will occur, or which failure or abnormality will occur. Additionally, the reflection of the real-time status of equipment by the alarm message is also subject to great uncertainty. All of these factors add to the difficulty of precise monitoring and early warning. Therefore, the quantitative characterization of the importance of information carries great engineering value for improving the pertinence of information processing and the accuracy and efficiency of monitoring operators. Based on the information theory method, we can effectively address the uncertainty of an alarm system from the perspective of probability and statistics. The method based on information theory is widely used in wind speed forecasting [20], probabilistic load flow modeling [21], electric energy procurement in smart grids [22], fault prediction in power transformers [23], the evaluation of generation reserve margins in power systems with renewable sources [24], and other areas of power systems.
Therefore, faced with the rapid increasing of alarm messages, this paper proposes a new intelligent alarm method which can automatically classify alarm messages based on information theory. The main contributions of this paper are as follows:
  • We build a multi-dimensional evaluation index system based on information theory and determine the information value of monitoring alarm messages from a statistical viewpoint. Thus, we overcome the barrier of set rules and reduce the workload of the supervisors.
  • The analytic hierarchy process (AHP) is used to comprehensively evaluate alarm messages. It can realize the automatic classification and intelligent marking of large numbers of monitoring alarm messages. The disposal pattern can be transformed from the passive response to a single record to active perception hierarchically.

2. Quantitative Calculation of the Information Value of Alarm Messages Based on Information Theory

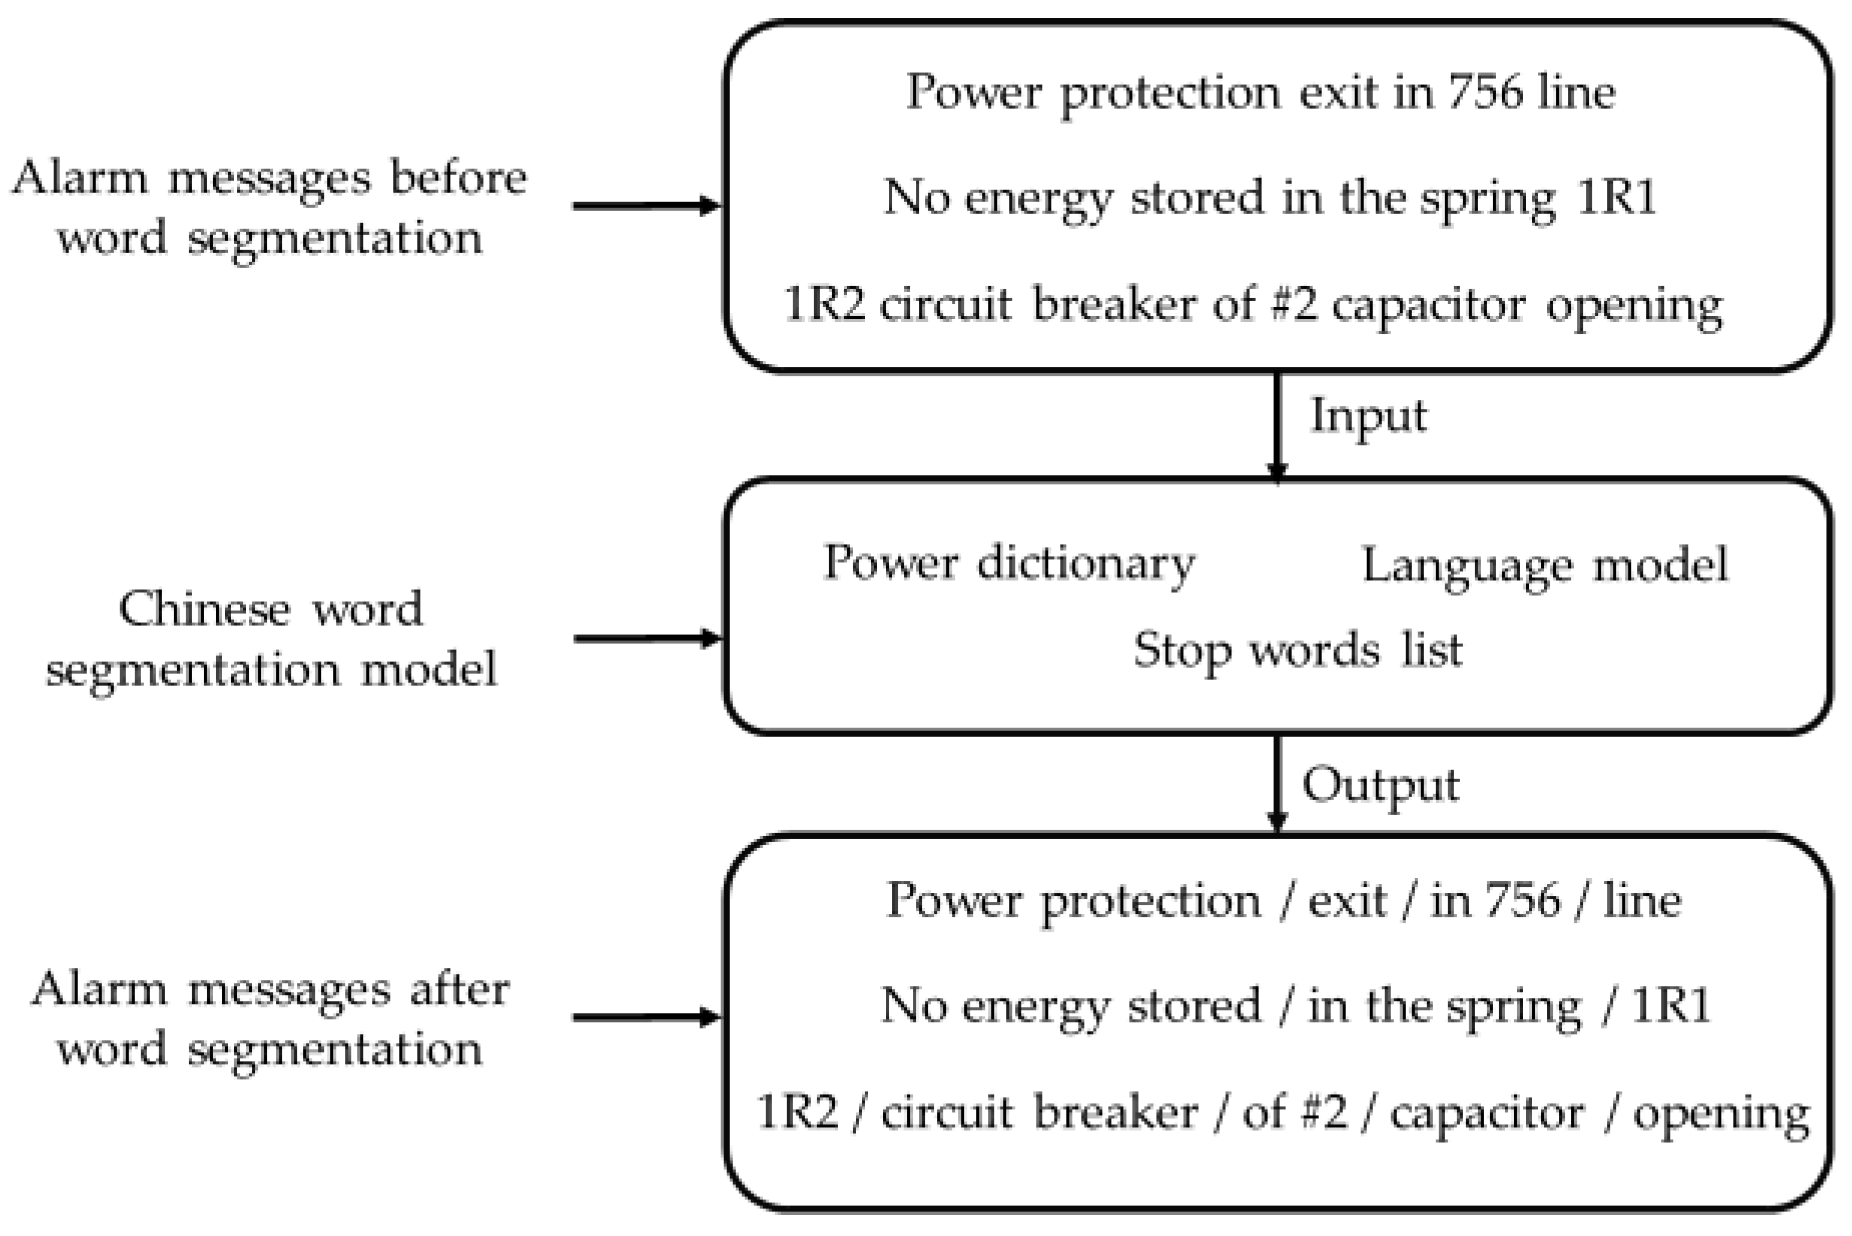
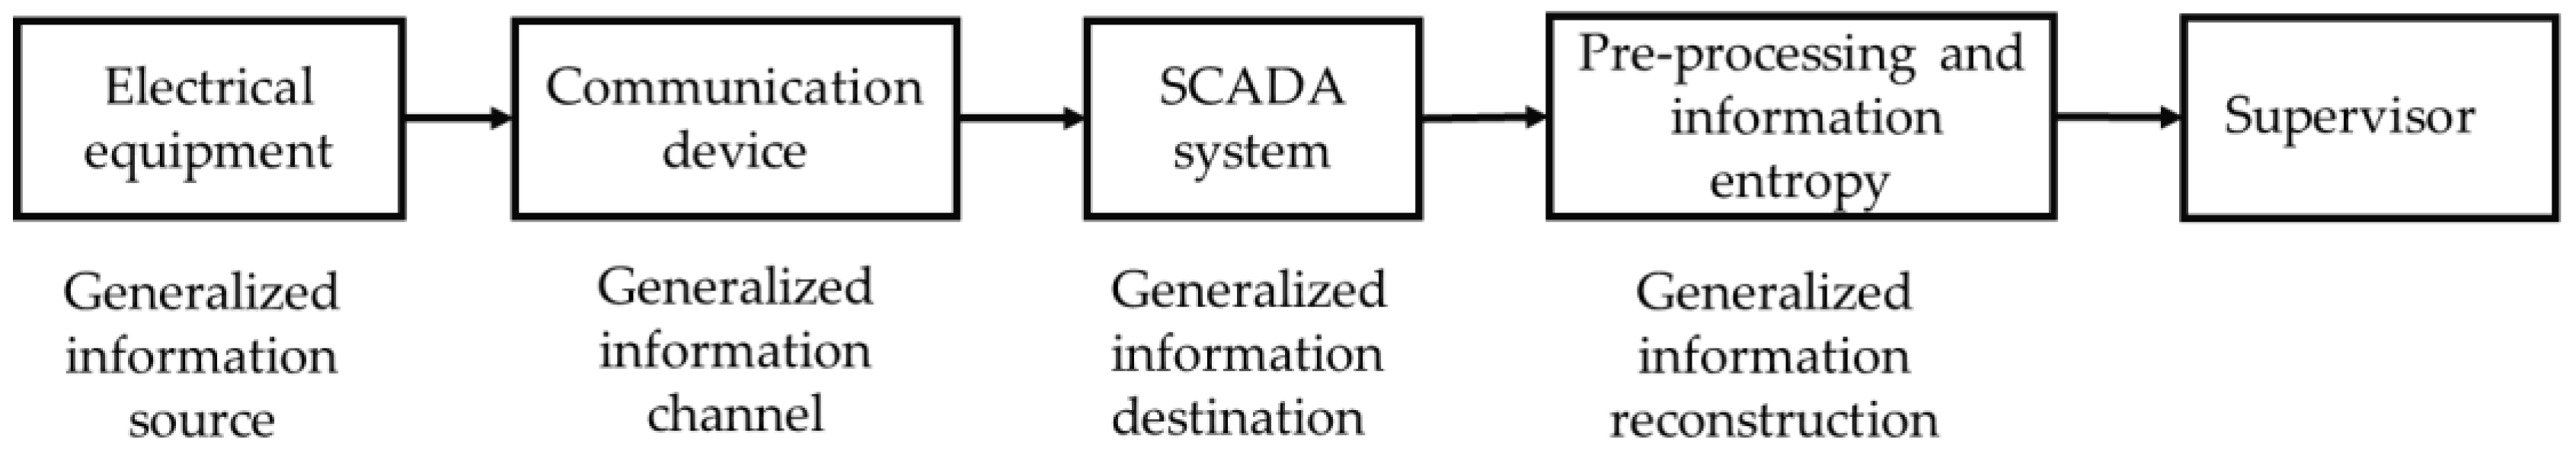
2.1. Pre-Processing of Alarm Messages

Grid-monitoring alarm messages consist of text information, and are transmitted from electrical equipment to a supervisor. If the objective features of the text could be excavated using a text-mining method and an automatic processing approach could be generated, it would be possible to change the current mode of analyzing monitoring alarm messages one by one, therefore, greatly reducing the pressure and work intensity experienced by supervisors and, thus, greatly increasing the safety of power-grid operation. Therefore, in this study, text-mining, such as word segmentation and removing stop words, is employed to pre-process monitoring alarm messages. The process is shown in Figure 1.

2.2. Alarm Messages and Information Theory

Information theory is based on mathematical statistics, and is used to study the quantification of information, communication of information, and the rule of transformation of information. It has been widely used in fields such as computer science and communication. In the mid-18th century, the German physicist Rudolf Clausius first introduced the concept of entropy, and explained that, in thermodynamics, entropy is used to describe the distribution homogeneity of any energy in space. The more homogeneous the energy distribution, the greater the entropy. Entropy has been extensively used in various areas of research, such as cosmology (i.e., the entropy of black holes [25]) and environmental science [26]. In 1948, Shannon creatively introduced entropy into information theory, and proposed the concept of information entropy [27,28]. Information entropy can be used to express the expected value of a random variable, that is, the average amount of information produced by the information source. Information entropy can be used to quantitatively characterize the statistical property of an information source as a whole. The value of information entropy indicates the average degree of uncertainty of the information source.
Assuming that a discrete random variable X may take n states, x 1 , x 2 , , x n , if p ( x i ) represents the probability value of x i , then the information entropy of the random variable and the self-information of x i can be defined as:
H ( X ) = i = 1 n p ( x i ) log ( p ( x i ) )
I ( x i ) = log ( p ( x i ) )
where 0 p ( x i ) 1 and i = 1 n p ( x i ) = 1 .
The amount of information in a piece of alarm message is directly related to the uncertainty of the message [29]. Every piece of a monitoring alarm message carries various elements, such as scene, voltage level, equipment name, property of behavior, and behavior. The random combination of these elements with different probabilities constitutes a complete alarm message [30], which displays the specific failure or abnormality of the power system to the supervisor. As the monitoring alarm message triggered by the grid operation is highly complex and uncertain, the degree of uncertainty can be measured through information entropy. The more homogeneous the probability distribution of the occurrence of the elements is, the longer the information will be and the greater the uncertainty and the information entropy will be. Therefore, more information will be uploaded to the supervisor when the alarm is triggered.
In this paper, the concepts of information source, channel, and destination in information theory are introduced into the information transmission process of a power system [31], as shown in Figure 2. In the cases of operation of the equipment, off-limit status, failure, etc., protection and control devices will be triggered and send out messages. A monitoring alarm message will then be uploaded to the SCADA system of the main station through the communication device, and will finally form short-text series in temporal order. Then, the short-text series will generate a short text separated into Chinese words by spaces using word segmentation technology. After the word segmentation, the entropy of the monitoring alarm message is calculated with the alarm-message entropy defined below, and the distribution of alarm-message entropies is obtained. In this way, we evaluate the potential value of the alarm message and provide support for the decision-making of the supervisor.

2.3. Definition of Alarm-Message Entropies

Based on entropy-related theories, we define various entropies, such as absolute alarm-message entropy, Term Frequency-Inverse Document Frequency (TF-IDF) alarm-message entropy, relative alarm-message entropy, self-information of monitoring alarm message, and average alarm-message entropy [32] to measure the importance of every piece of alarm message in order to obtain an overall picture of the content of the message. The absolute alarm-message entropy is defined from the perspective of the word frequency of a single sentence, while the TF-IDF alarm-message entropy and relative alarm-message entropy are defined considering the overall message base. The self-information of a monitoring alarm message describes the sentence level. The definition of these four entropies is demonstrated in Table 1. The average alarm-message entropy also considers the length of the message.

2.3.1. Absolute Alarm-Message Entropy

If we assume that M is the given monitoring alarm message base, then the i -th monitoring alarm message can be expressed as m i = { w i 1 , w i 2 , , w i n } , where w i j represents the occurrence of the word j in the i -th monitoring alarm message. Through the normalization of m i , that is, m i = { p i 1 1 , p i 2 1 , , p i n 1 } , and p i j 1 = w i j / k = 1 n w i k , the absolute alarm-message entropy of a single piece of alarm message can be expressed as follows:
H 1 ( m i ) = j = 1 n p i j 1 log ( p i j 1 )
where p i j 1 indicates the probability of occurrence of the word j in the i -th alarm message. Absolute alarm-message entropy is used to assess the uncertainty of the message from the perspective of word frequency in a single record of message. From the calculation formula above, we find that long messages embody a higher entropy value than short messages; therefore, long messages will give out more information to the supervisor, such as equipment status, protection signals, and operation modes.

2.3.2. Average Absolute Alarm-Message Entropy

Here, we introduce the average absolute alarm-message entropy to eliminate the absolute deviation caused by the length of a message. The calculation formula of the average absolute alarm-message entropy is as follows:
H 2 ( m i ) = H 1 ( m i ) l e n ( m i )
where l e n ( m i ) stands for the length of message m i . The average absolute alarm-message entropy is the ratio of the absolute alarm-message entropy to the length of alarm message. The average absolute alarm-message entropy takes into consideration the word frequency and the message length, thus providing a more reasonable description of the entropy of the alarm message.

2.3.3. Term Frequency-Inverse Document Frequency (TF-IDF) Alarm-Message Entropy

The word occurrence probability in absolute alarm-message entropy only applies to the current monitoring alarm message. In order to comprehensively assess the contribution of words in the entire monitoring alarm message base, we introduce TF-IDF in information retrieval to the definition of alarm-message entropy. TF-IDF is a commonly used weighting technique for information retrieval and data mining [33], where TF refers to the frequency of the term in the document and IDF is the logarithm of the ratio of the total number of documents to the number of documents containing the term. The TF-IDF alarm-message entropy can be defined in the following way: TF represents the contribution of a word to the monitoring alarm message, and IDF shows the frequency of the word in the entire monitoring alarm message base. If we assume that M is the given monitoring alarm message base, then the i -th monitoring alarm message can be expressed as: m i = { v i 1 , v i 2 , , v i n } , where vij represents the quasi-TF-IDF value of the word in the monitoring alarm message and can be calculated in the following way:
v i j = w i j k = 1 n w i k · log ( S N S i j + 1 )
where w i j indicates the frequency of word j in monitoring alarm message i, S N represents the total number of monitoring alarm messages in the base, and S i j is the number of alarm messages in the base which are found to contain word j as in alarm message i.
To introduce information entropy, we normalize the single piece of monitoring alarm message, m i = { p i 1 3 , p i 2 3 , , p i n 3 } , p i j 3 = v i j / k = 1 n v i k , so the TF-IDF alarm-message entropy is calculated as follows:
H 3 ( m i ) = j = 1 n p i j 3 log ( p i j 3 )
where p i j 3 is the normalization frequency of the quasi-TF-IDF value of a word in that alarm message.
Compared with the absolute alarm-message entropy, the TF-IDF alarm-message entropy considers not only the frequency of a word in a specific monitoring alarm message, but also the frequency of the word in the alarm message base, which better distinguishes the alarm message with different values of information. The TF-IDF alarm-message entropy allows the evaluation of the message uncertainty not only from the perspective of word frequency in a single piece of message and the sentence frequency in the entire base, but also from the perspective of the newness of the word, i.e., its low occurrence in the base.

2.3.4. Average TF-IDF Alarm-Message Entropy

As does the absolute message entropy, the TF-IDF alarm-message entropy has the problem of unbalanced calculation results due to the message length. Hence, we introduce the concept of the average TF-IDF alarm-message entropy, which is calculated as follows:
H 4 ( m i ) = H 3 ( m i ) l e n ( m i )

2.3.5. Relative Alarm-Message Entropy

Information theory has been used to prove that the self-information of a word is only related to its probability of occurrence in a document. The smaller the probability is, the bigger the information value will be. We consider that the amount of information in one piece of message is only related to the number of different words it contains. Repeating a word does not increase the amount of information in a sentence. Inspired by the TF-IDF alarm-message entropy, we calculate the word frequency based on the entire alarm message base in order to improve the estimation of the absolute alarm-message entropy. If we assume that M represents the given monitoring alarm message base, the i -th alarm message can be m i = { u i 1 , u i 2 , , u i n } , where u i j indicates the relative frequency of word j in the i -th monitoring alarm message. The formula for u i j is as follows:
u i j = k = 1 S N w k j l = 1 T N k = 1 S N w k l
where w k j is the number of occurrences of word j in alarm message k , S N is the total number of alarm messages, and T N is the word count of the entire alarm message base. The self-information of word j in the i-th message, expressed by variable I ( t i j ) , is first calculated as follows:
I ( t i j ) = log ( u i j )
Then, the relative alarm-message entropy of the alarm message is calculated as follows:
H 5 ( m i ) = j = 1 n I ( t i j )
From the formula, we can see that its physical meaning lies in the measurement of the message uncertainty from the perspective of the word frequency in the entire alarm message base. Thus, alarm messages with more accidental equipment malfunctions and names of protections have more value.

2.3.6. Average Relative Alarm-Message Entropy

Here, we introduce the concept of average relative alarm-message entropy as follows:
H 6 ( m i ) = H 5 ( m i ) l e n ( m i )

2.3.7. Self-Information of the Alarm Message

The above methods use the word level to calculate the entropy of all the alarm messages. However, the frequency of the complete alarm message in the alarm message base can also be used, to some extent, to determine the value of the information. As in our intuitive perception, alarm messages with more value occur less frequently. Self-information is used to measure the uncertainty of a message from the perspective of sentence frequency in the entire alarm message base. Here, we define the self-information of a monitoring alarm message as follows:
I ( m i ) = log ( p ( m i ) )
where p ( m i ) is the frequency of alarm message m i in the alarm message base.

3. Comprehensive Evaluation of Alarm Messages Based on the Analytic Hierarchy Process

In order to combine the features of various entropies and provide supervisors with an ultimate overall index, we introduced the AHP to comprehensively assess the alarm message value obtained through multi-dimensional calculation. The AHP is an analytical technique which is used to decompose the target into a hierarchy of indices and then evaluate the indices to obtain a comprehensive evaluation [34]. The AHP provides a comprehensive framework for various indices of monitoring alarm messages, which obtains more rational and effective results. In this paper, seven alarm message entropies were used as indices to comprehensively assess the information value of different alarm messages. The target layer O = {comprehensive score for monitoring alarm message}, index layer Q = {average relative alarm-message entropy, self-information of monitoring alarm message, average TF-IDF alarm-message entropy, average absolute alarm-message entropy, TF-IDF alarm-message entropy, relative alarm-message entropy, absolute alarm-message entropy}. Then we define the index layer Q = { f 1 , f 2 , f 3 , f 4 , f 5 , f 6 , f 7 } for convenience.
The evaluation of a monitoring alarm message based on AHP can be carried out by the following steps [35]:
Step 1: Compare the importance of each index of the same layer to a certain target and construct a judgment matrix.
Step 2: Check the consistency of the judgment matrix. If the consistency is not met, go to Step 3; otherwise, go to Step 4.
Step 3: Modify the inconsistent judgment matrix.
Step 4: Calculate the weight vector of the layer based on the judgment matrix.
Step 5: Conduct a comprehensive evaluation of monitoring alarm messages.

3.1. Construction of the Judgment Matrix

We compared the importance of the index f i to that of the index f j to the upper target, that is, f i j = cmp ( f i , f j ) . We use a scale of 1–9 and the reciprocal to quantify f i j , as shown in Table 2 The value of the result is represented by the notation d i j .
Then, we have the judgment matrix D , where the elements are defined as follows:
{ d i j = cmp ( f i , f j ) , i j d j i = 1 d i j , i j d i j = 1 , i = j
where d i j > 0 ; 1 i n ; 1 j n .

3.2. Hierarchical Ranking and Consistency Check

After the judgment matrix was constructed, we calculated the maximum eigenvalue λ max and eigenvector x of the judgment matrix, and then normalized the eigenvector to obtain the weight ranking of the importance of the indices to the target layer, that is, the hierarchical single arrangement. As there is only one index layer in the scene, hierarchical total arrangement is not necessary.
The consistency ratio of the judgment matrix C R = C I / R I . The consistency index C I = ( λ max n ) / ( n 1 ) and the random consistency index on the average RI can be determined from the table in [36]. When C R < 0.1 , the consistency of the judgment matrix is acceptable; otherwise, modification is needed.

3.3. Comprehensive Evaluation

We used the min-max normalization method to convert the index values to the range of 0–1. The normalization formula is shown as follows:
s i n o r m = s i s min s max s min
where s i n o r m is the normalized value, s i is the original value, and s max and s min represent the maximum and minimum values of the original dataset, respectively.
Then, according to the normalization state values of the index S = ( s 1 , s 2 , , s n ) and the rank weight of the overall index obtained X = ( x 1 , x 2 , , x n ) T , we calculated the overall evaluation value of each index as follows:
Y = S X = i = 1 n s i x i

4. Results

To verify the validity of the proposed method, we referred to the corpus of a company’s monitoring alarm messages from 2017. First, nearly six million pieces of alarm message from about 300 substations were pre-processed and segmented using Jieba toolkit [37]. The frequency (at the minute level) of messages of different lengths is shown in Figure 3. Then, we analyzed the alarm messages using the above formulas, and obtained a 3D probability density map of the alarm message entropies for messages of different lengths by fitting using the kernel density estimation method.

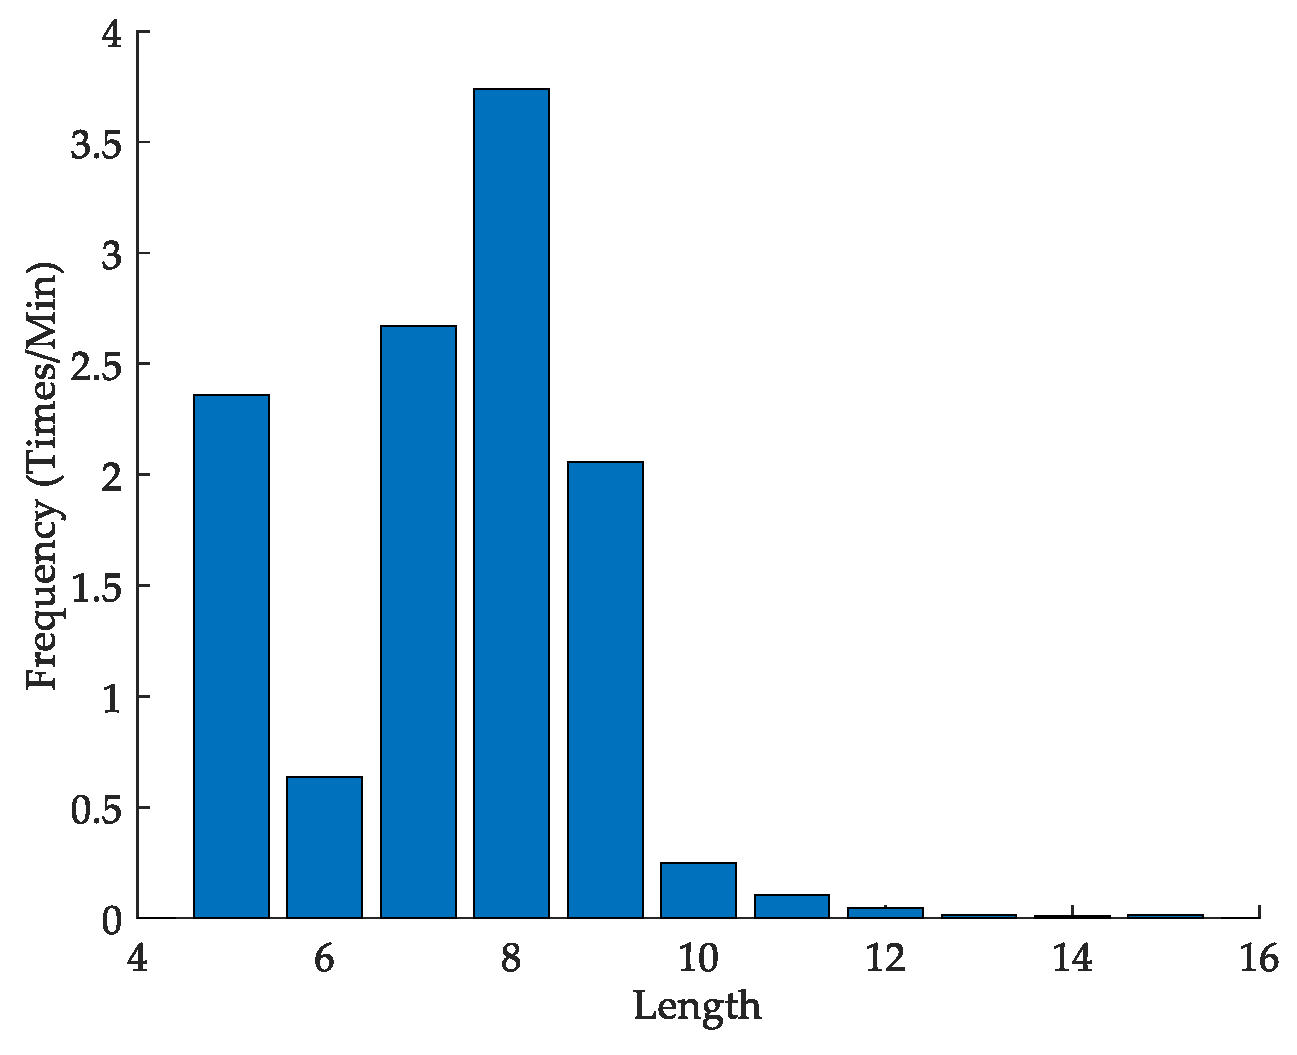
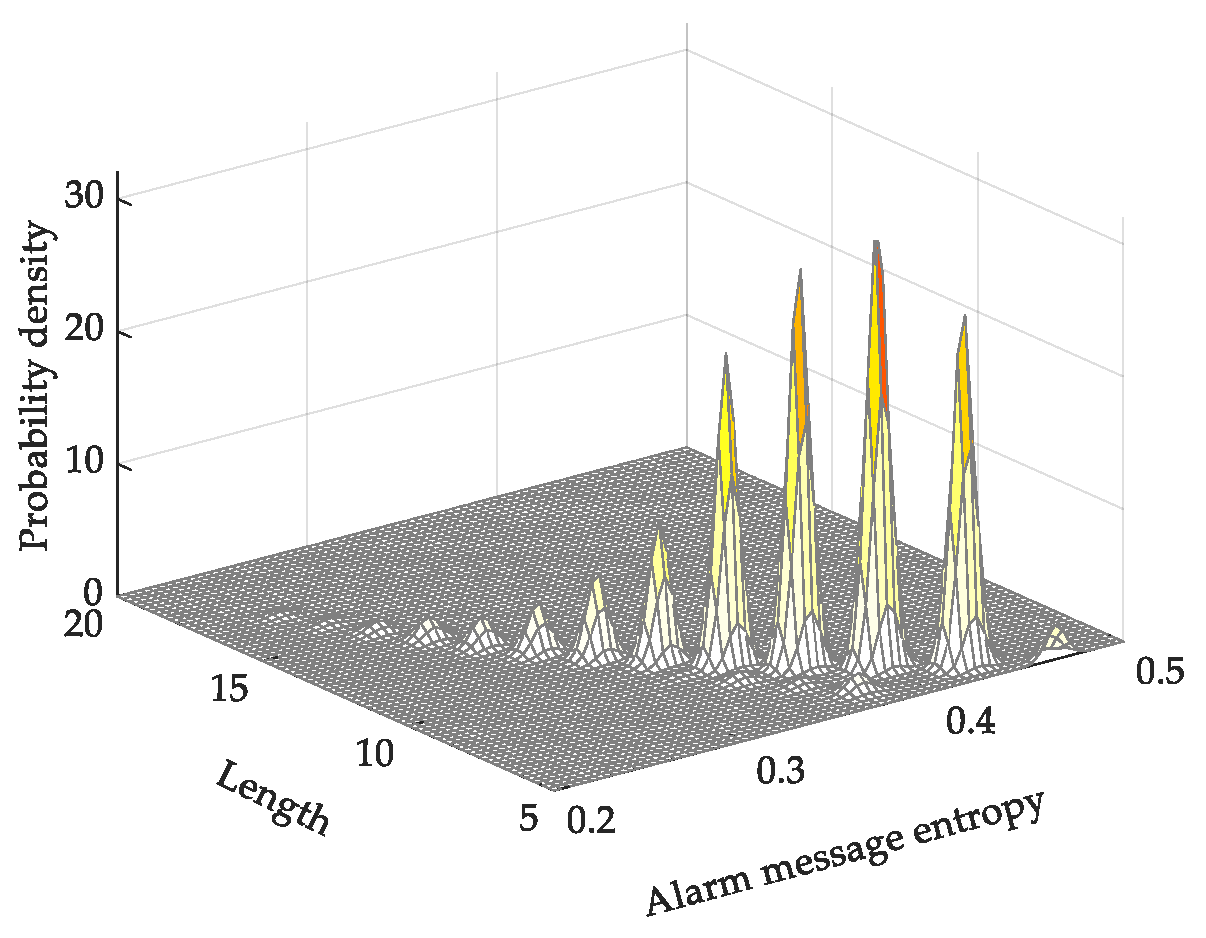
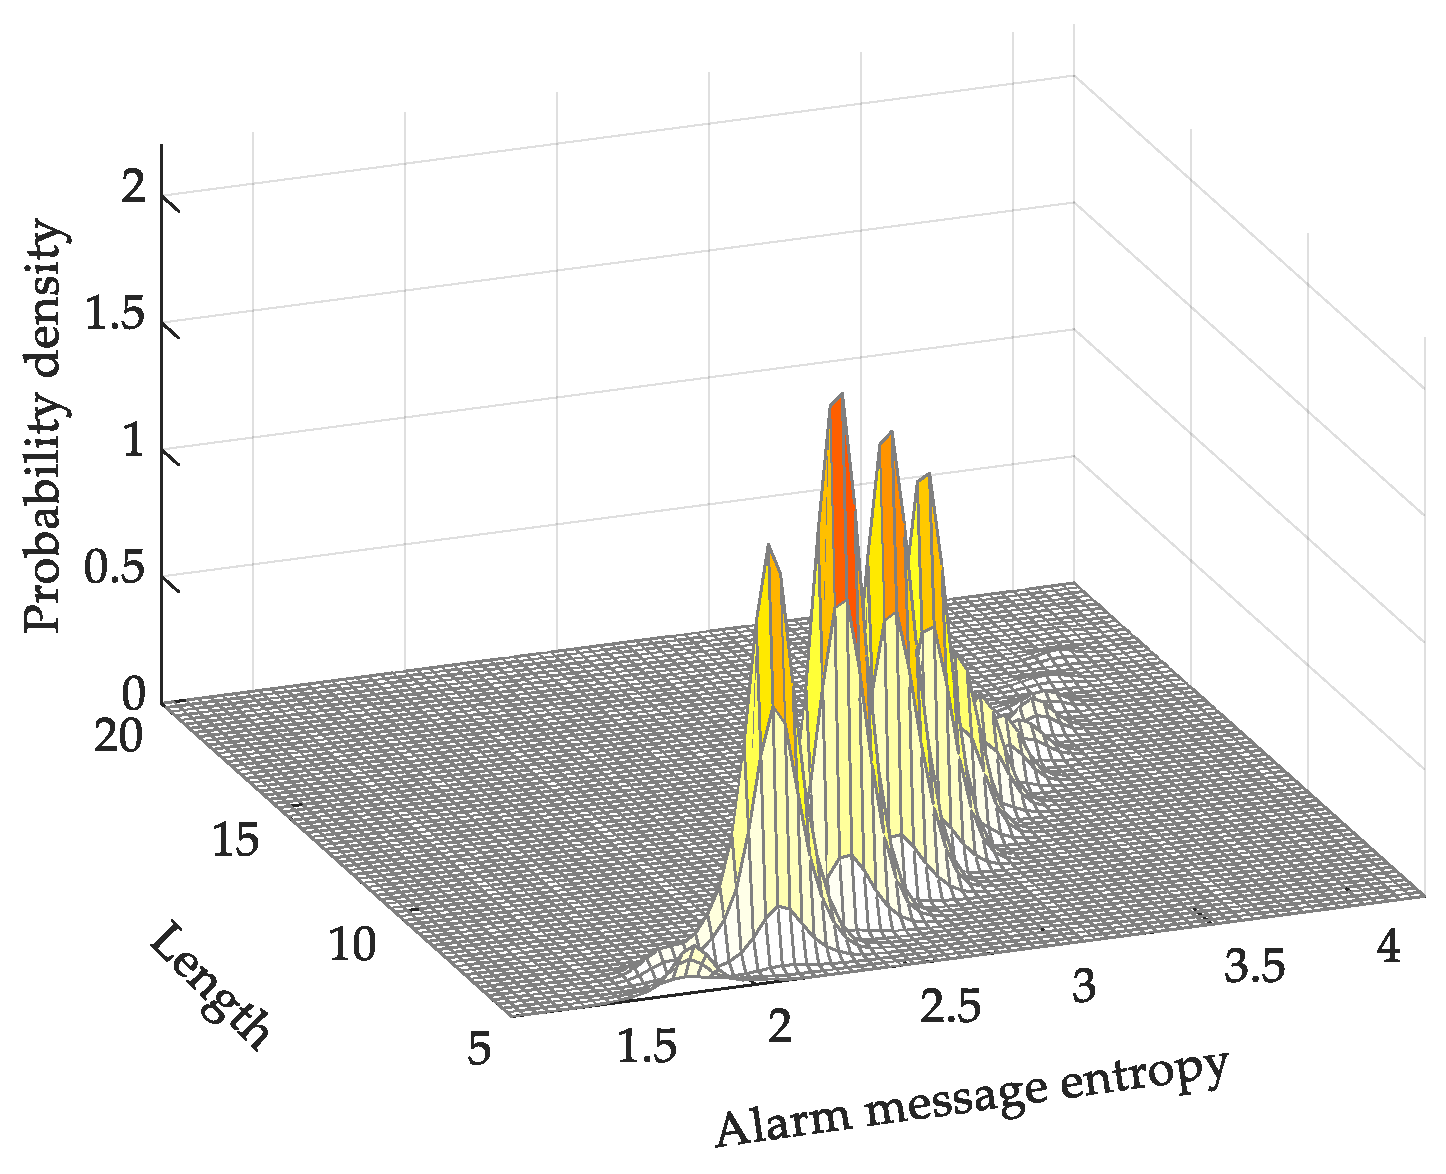
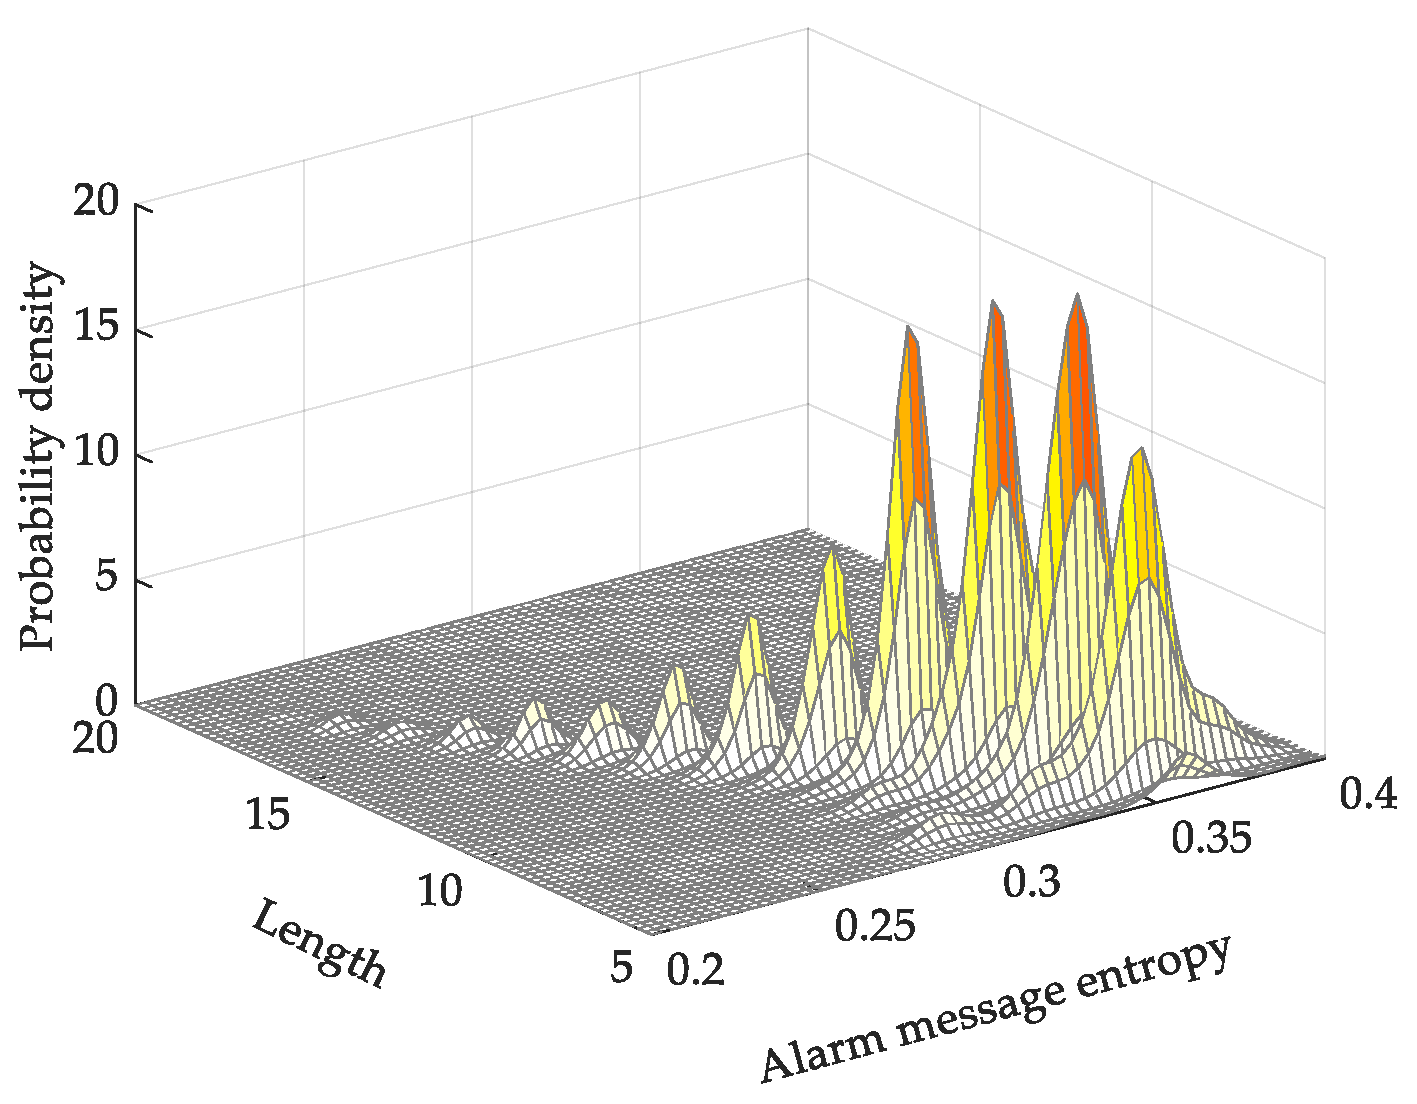
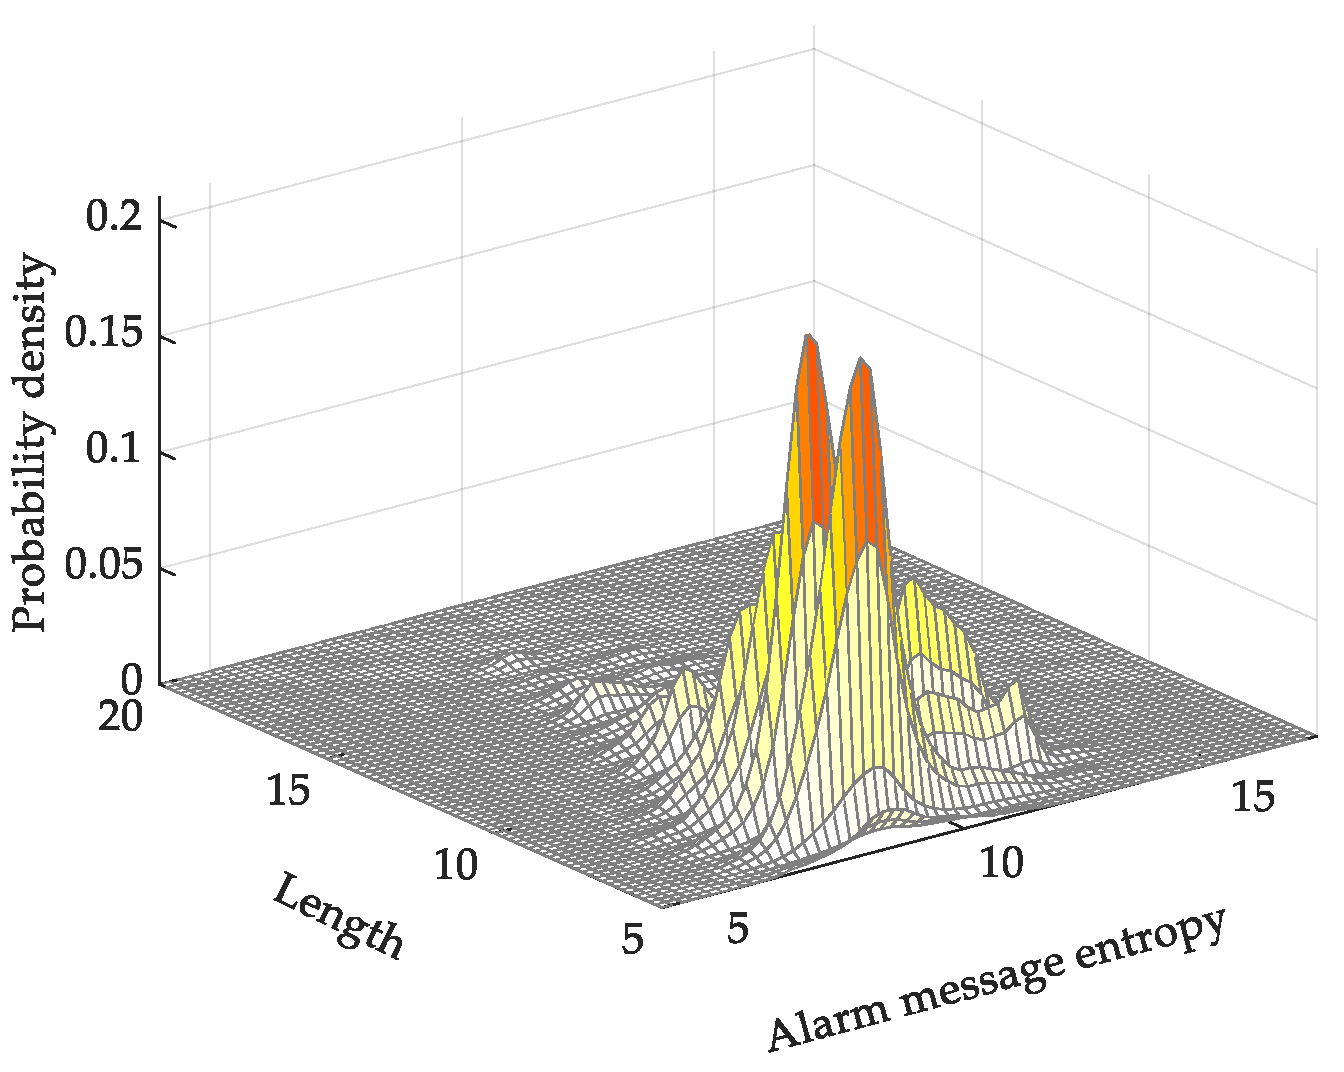
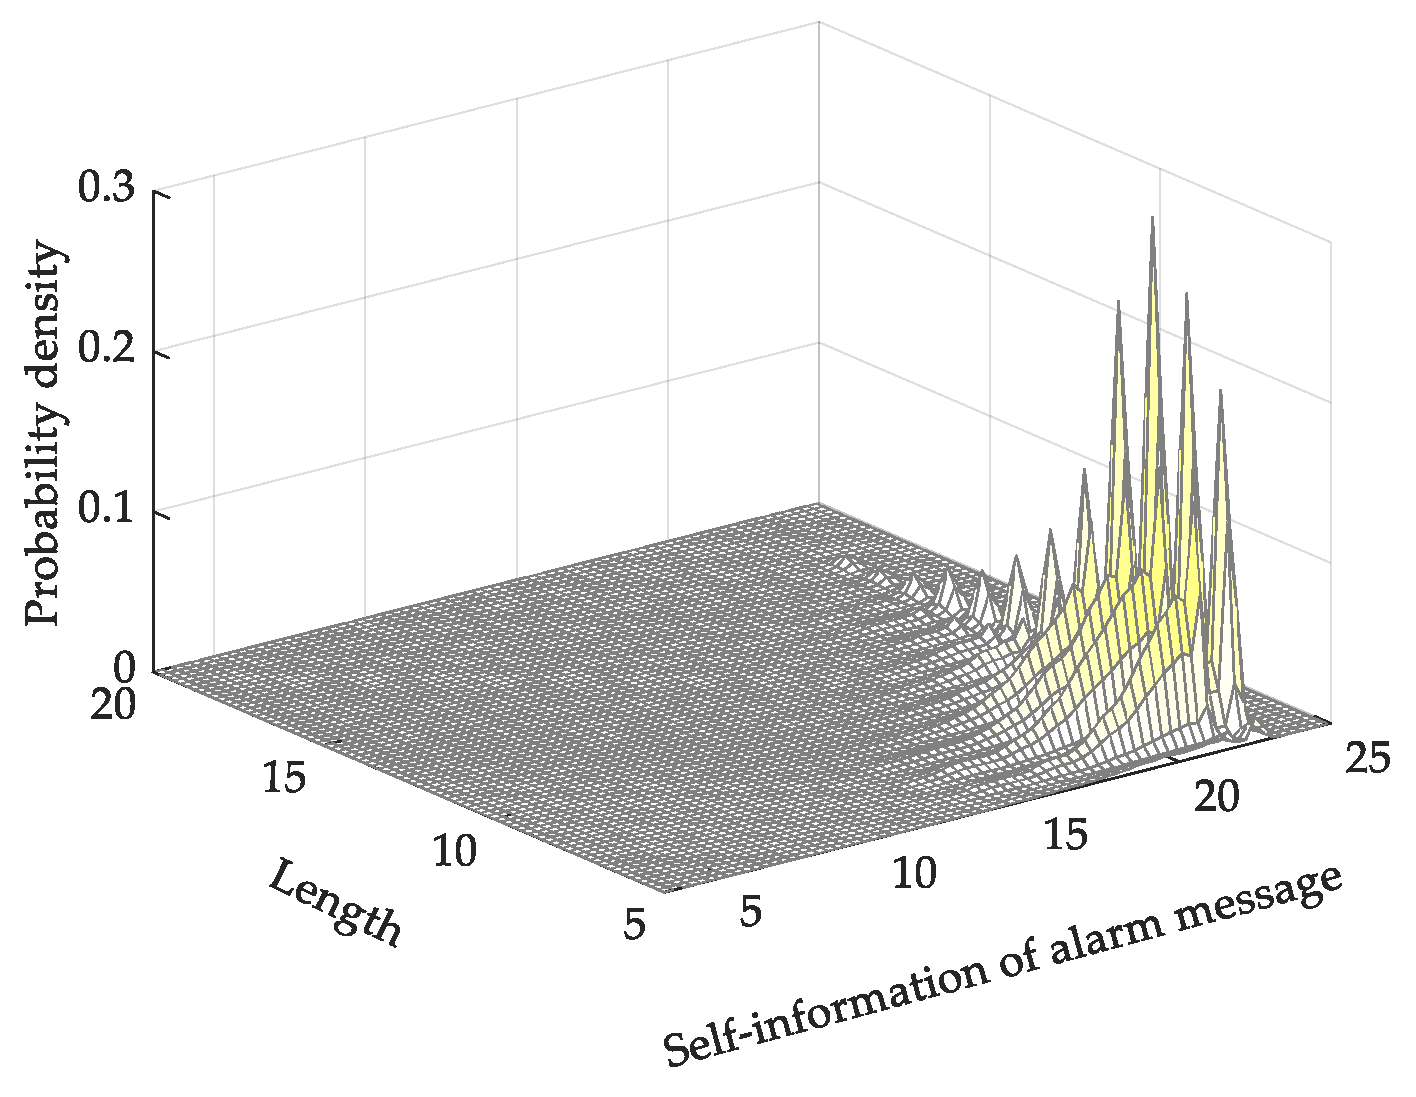
4.1. Analysis of Multiple Alarm-Message Entropies

1.
Absolute alarm-message entropy
As the words in the monitoring alarm messages analyzed in this study mostly occur only once, the value of the absolute alarm-message entropy is positively correlated to the message length, as shown in Figure 4. From the figure, it can be seen that the distribution of entropy is relatively concentrated. Additionally, long messages have a higher absolute alarm-message entropy than short messages, which indicates that long messages are more important.
2.
Average absolute alarm-message entropy
Compared with the absolute alarm-message entropy, the average absolute alarm-message entropy is mainly concentrated in the area with higher values of alarm-message entropy. However, the distribution is still relatively concentrated. As shown in Figure 5, short messages have a higher average absolute alarm-message entropy than long messages. The method used in this study tends to rate short messages as more important. As can be seen in the description of actual monitoring alarm messages, important messages, such as those related to “protection behavior”, “general fault signal”, and “on-off operation”, are relatively short. Therefore, average absolute alarm-message entropy is more practical than absolute alarm-message entropy.
3.
TF-IDF alarm-message entropy
As shown in Figure 6, compared with the absolute alarm-message entropy, the TF-IDF alarm-message entropy is relatively dispersed, which makes it easier to identify single pieces of alarm message. As the alarm-message entropy is the sum of words, long alarm messages still have higher information entropy than short alarm messages. However, the TF-IDF alarm-message entropy considers the inverse frequency. Thus, the entropy of short alarm messages including low-frequency words, such as “general fault signal”, will increase, and that of long alarm messages with high-frequency words will decrease. Thus, we managed to separate the messages in the base by entropy value (information value).
4.
Average TF-IDF Alarm-Message Entropy
As a length penalty is introduced to the average TF-IDF alarm-message entropy, the distribution will be more uniform, as shown in Figure 7. The entropy of short messages with low word frequency is higher than that of long messages with high word frequency, which adequately depicts the differences between monitoring alarm messages and is more realistic.
5.
Relative alarm-message entropy
Contrary to the average TF-IDF alarm-message entropy, for the relative alarm-message entropy, most of the alarm messages have a lower entropy value, as shown in Figure 8. The relative alarm-message entropy of short messages is lower than that of long messages. As the entropy value of long messages composed of low-frequency words is higher, this method adequately separates long messages from other messages.
6.
Average relative alarm-message entropy
The probability density curve of the average relative alarm-message entropy varies smoothly and is not obviously related to the message length. The entropy value of alarm messages composed of low-frequency words is higher, which indicates that the average relative alarm-message entropy highlights new alarm messages, as shown in Figure 9.
7.
Self-information of monitoring alarm messages
The self-information of monitoring alarm messages is calculated at the sentence level. As shown in Figure 10, the higher the frequency of the sentence, the lower the self-information value. From the figure, it can be seen that the sentence frequency of most alarm messages is relatively low. Alarm messages with high sentence frequency only represent a small proportion of the total number of alarm messages, and through the calculation of the self-information, a large number of alarm messages with a high frequency—that is, a low information value—were able to be filtered out.
Summary of the characteristic and feature of each alarm-message entropy mentioned above is shown in Table 3.
In summary, the average TF-IDF alarm-message entropy is relatively dispersed and could help to better identify alarm messages. The average relative alarm-message entropy could help to identify new messages with low frequency, while the self-information of monitoring alarm messages could be used to separate frequent alarm messages and to facilitate the monitoring and analysis work of supervisors.

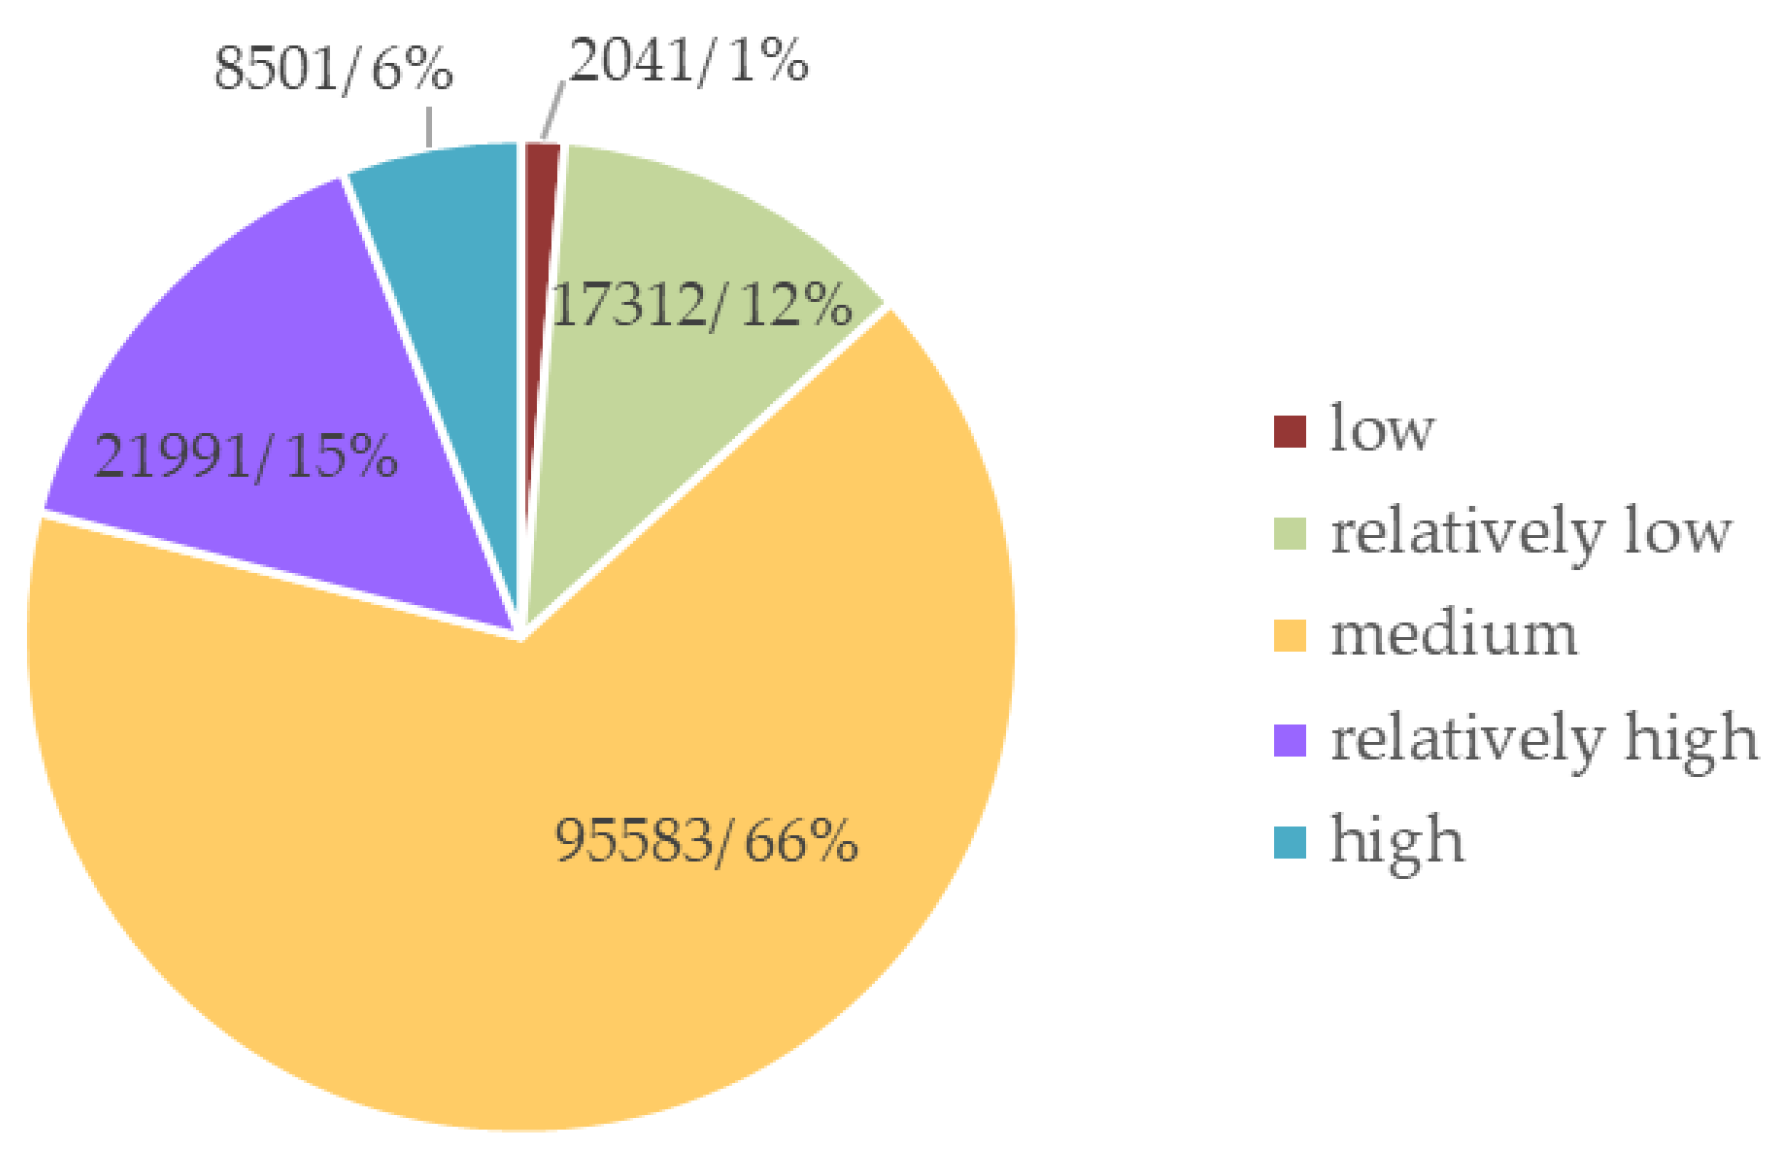
4.2. Analysis of Comprehensive Evaluation

Finally, using the AHP, we managed to conduct an overall analysis of the seven entropies and obtain a more effective evaluation result. We calculated the single ranking weight of the index layer using AHP, as shown in Table 4. Additionally, we determined the values of the indices CI (0.0328) and RI (1.32) by calculating and by consulting the Table 2-2 in [37]. The value of the consistency ratio CR verifies that the consistency of the judgment matrix is acceptable. Using the index status value and single ranking weight, we were able to calculate the comprehensive scores of different types of alarm messages. The probability density map of the comprehensive scores for alarm messages is shown in Figure 11.
From Figure 11, it can be seen that, compared with other alarm-message entropy indices, the comprehensive scores for alarm messages are evenly distributed, which allows the different alarm messages to be adequately separated. Moreover, the distributions of the comprehensive scores of alarm messages of different lengths are similar to each other. Based on project experience and the features of the messages, the scores were divided into five grades: low, relatively low, medium, high, and relatively high. The number of classified alarm messages and the percentage of messages in each grade are shown in Figure 12. From the figure, it can be seen that most monitoring alarm messages occupy the medium grade (66%), the high and relatively high grades account for a combined total of about 21% of the alarm messages, and the low and relatively low grades account for a combined total of about 13% of the alarm messages. It is concluded that the proportion of relatively important messages basically satisfies the “80/20 rule”, i.e., around 20% of the messages are relatively important.
After checking the grades of the alarm messages, the probabilities of correct classification for the alarm messages in each grade were calculated, as shown in Table 5. From the table, it can be seen that the probability of correct classification for high and low grades is relatively high, while that for the other three grades is relatively low. This is due to the fact that the statistical characteristics of messages in high and low grades are more obvious than those of messages in the other three grades. When we subjectively checked the classification result, we are more certain about the actual categories of the alarm messages distributed in high and low grades. In general, the classification achieved by this method is acceptably accurate and efficient.
Based on the AHP, we carried out a comprehensive evaluation of the monitoring alarm messages using a method which integrates the advantages of multiple alarm message entropies, and classified the messages according to their comprehensive scores. If compared with the single entropy of an alarm message, the score of an alarm message after the comprehensive evaluation is no longer related to its length. The low-frequency alarm messages and the alarm messages with low word-frequency were usually found to occupy the high grade, indicating the occurrence of more important messages that require attention. For example, for a message containing the text, “power protection exit in 756 line of XX substation in XX City”, the dispatch log shows that the message was caused by a tripping operation. Protection action triggered by a fault in the 110 kV line is deemed to be a serious accident which might entail great losses. Therefore, this message was rated in the high grade. However, high-frequency alarm messages and alarm messages containing high word-frequency occupy the low grade, indicating that such messages could be screened; in such cases, alarm screening analysis is not necessary. For example, the maintenance personnel found that an alarm message containing the text, “abnormal voltage of #2 AC bus in the XX substation in XX province”, is frequently triggered by equipment failure which only affects the power consumption below 400 V in the substation. Therefore, such messages are rated in the low grade, as the impact of such equipment failure is small. Typical alarm messages for each grade are shown in Table 6.

5. Discussion

The classification of monitoring alarm messages enables supervisors to conduct more targeted alarm screening analysis and formulate a processing plan. The method proposed in this paper, which is designed for practical applications, incorporates the classification standard of the Chinese State Grid Corporation for messages reporting accidents, abnormality, off-limit alarm, displacement, and notification, and provides double validation to determine the risk level of an alarm message and the according processing method. This method could assist in decision-making and allow more accurate, reliable, and evidence-based message monitoring. This method could provide advance warning of equipment faults, so that equipment that frequently triggers a high-risk alarm could be repaired or tested in advance. The double verification of monitoring alarm messages is shown in Table 7, and the processing methods for alarm messages of each risk level are shown in Table 8.
From the above analysis of the results and the discussion for practical application, it can be seen that the proposed method can improve upon the traditional method by statistically analyzing monitoring alarm messages, which allows the automatic classification of messages. Using this method, workloads could be greatly reduced compared with the traditional expert system and artificial classification. Moreover, accurate monitoring of alarm messages would be possible by combining the new method with the existing classification standard of the Chinese State Grid Corporation. In engineering applications, this new method could serve as a new means for evaluating the information value of alarm messages and for alarm message pre-processing, thus providing a new perspective and support for intelligent alarms and decision-making.
In this study, we propose only a means of information quantification and message grading. Future research will focus on the application of this method to the accurate classification of alarm messages and fault diagnosis, as well as the correlation between alarm messages and electrical equipment.

6. Conclusions

Since grid monitoring is increasing rapidly, a processing method for alarm messages based on information theory is proposed in this paper, and its effectiveness and applicability are verified through an example. The conclusions obtained are as follows:
  • The proposed method is based on information theory and can quantify the value of alarm messages at the sentence and word levels. It can achieve the automatic classification of alarm messages.
  • Based on the analytic hierarchy process (AHP), this method combines the advantages of the measurement of various kinds of entropy, and can be used to carry out accurate and overall classification of alarm messages.

Author Contributions

G.S. and X.D. conceived and designed the experiments and wrote the paper; Z.W. and P.S. performed the experiments; Y.Z. and Q.H. analyzed the data; L.Z. and H.Z. contributed reagents/materials/analysis tools.

Funding

The research is supported by Science and Technology project of State Grid Corporation of China: Research and application of event processing technology for power grid monitoring business based on machine learning (SGJSNJ00FCJS1800810).

Conflicts of Interest

The authors declare no conflict of interest.

References

  1. Yu, C.; Yi, W.; Yunlong, D.; Ning, X.; Tianxia, Z.; Limin, W. Application of Alarm Message Statistical Analysis Based on Protection and Fault Information System. In Proceedings of the 2018 IEEE International Conference of Safety Produce Informatization (IICSPI), Chongqing, China, 10–12 December 2018; pp. 719–722. [Google Scholar]
  2. Li, Z.X.; Yin, X.G.; Zhang, Z.; He, Z. Wide-Area Protection Fault Identification Algorithm Based on Multi-Information Fusion. IEEE Trans. Power Deliv. 2013, 28, 1348–1355. [Google Scholar]
  3. Zang, H.; Cheng, L.; Ding, T.; Cheung, K.W.; Liang, Z.; Wei, Z.; Sun, G. Hybrid Method for Short-Term Photovoltaic Power Forecasting Based on Deep Convolutional Neural Network. IET Gener. Transm. Distrib. Inst. Eng. Technol. 2018, 12, 4557–4567. [Google Scholar] [CrossRef]
  4. Bayati, M.; Abedi, M.; Gharehpetian, G.B.; Farahmandrad, M. Short-term interaction between electric vehicles and microgrid in decentralized vehicle-to-grid control methods. Prot. Control Mod. Power Syst. 2019, 4, 42–52. [Google Scholar] [CrossRef]
  5. Zang, H.; Cheng, L.; Ding, T.; Cheung, K.W.; Wang, M.; Wei, Z.; Sun, G. Estimation and Validation of Daily Global Solar Radiation by Day of the Year-Based Models for Different Climates in China. Renew. Energy 2019, 135, 984–1003. [Google Scholar] [CrossRef]
  6. Hu, Z.; He, T.; Zeng, Y.; Luo, X.; Wang, J.; Huang, S.; Liang, J.; Sun, Q.; Xu, H.; Lin, B. Fast image recognition of transmission tower based on big data. Prot. Control Mod. Power Syst. 2018, 3, 149–158. [Google Scholar] [CrossRef]
  7. Aida, A.M.; Haidar, S.; Teymoor, G. K-NN Based Fault Detection and Classification Methods for Power Transmission Systems. Prot. Control Mod. Power Syst. 2017, 2, 359–369. [Google Scholar]
  8. Wang, J.; Yang, F.; Chen, T.; Shah, S.L. An Overview of Industrial Alarm Systems: Main Causes for Alarm Overloading, Research Status, and Open Problems. IEEE Trans. Autom. Sci. Eng. 2016, 13, 1045–1061. [Google Scholar] [CrossRef]
  9. Lee, H.J.; Park, D.Y.; Ahn, B.S.; Park, Y.M.; Park, J.K.; Venkata, S.S. A fuzzy expert system for integrated fault diagnosis. IEEE Trans. Power Deliv. 2000, 15, 833–838. [Google Scholar]
  10. Silva, V.N.; Linden, R.; Ribeiro, G.F. A Framework for Expert Systems Development Integrated to a SCADA/EMS Environment. In Proceedings of the International Conference on Intelligent Systems Applications to Power Systems, Niigata, Japan, 5–8 November 2007; pp. 1–4. [Google Scholar]
  11. Zhao, W.; Bai, X.; Wang, W.; Ding, J. A Novel Alarm Processing and Fault Diagnosis Expert System Based on BNF Rules. In Proceedings of the 2005 IEEE/PES Transmission & Distribution Conference & Exposition: Asia and Pacific, Dalian, China, 18 August 2005; pp. 1–6. [Google Scholar]
  12. Souza, J.C.; Filho, M.B.; Freund, R.S. A Hybrid Intelligent System for Alarm Processing in Power Distribution Substations. Int. J. Hybrid Intell. Syst. 2010, 7, 125–136. [Google Scholar] [CrossRef]
  13. Fritzen, P.C.; Cardoso, G.; Zauk, J.M.; De Morais, A.P.; Bezerra, U.H.; Beck, J.A. Integrated Use of Artificial Neural Networks and Genetic Algorithms for Problems of Alarm Processing and Fault Diagnosis in Power Systems. In Proceedings of the ACIIDS’10 Second International Conference on Intelligent Information & Database Systems: Part I, Hue City, Vietnam, 24–26 March 2010; pp. 370–379. [Google Scholar]
  14. Zhang, Y.; Zhang, Y.; Wen, F.; Chung, C.Y.; Tseng, C.L.; Zhang, X.; Zeng, F.; Yuan, Y. A Fuzzy Petri Net Based Approach for Fault Diagnosis in Power Systems Considering Temporal Constraints. Int. J. Electr. Power Energy Syst. 2016, 78, 215–224. [Google Scholar] [CrossRef]
  15. Zhang, Z.; Gao, Z.; Li, S.; Zhao, Y. The Method of Distribution Network Fault Location Based on Improved Dempster-Shafer Theory of Evidence. In Proceedings of the IEEE PES Asia-Pacific Power and Energy Engineering Conference (APPEEC), Bangalore, India, 8–10 November 2017; pp. 1–3. [Google Scholar]
  16. Li, W.; Chen, W.; Guo, C.; Zhu, B.; Xu, L. Fault Diagnosis Method for Power Distribution Systems Based on Multi-Source Information. In Proceedings of the IECON 2017—43rd Annual Conference of the IEEE Industrial Electronics Society, Beijing, China, 29 October 2017; pp. 1–4. [Google Scholar]
  17. Yang, X.; Sun, S.M. Construction of Regional Grid Intelligent Alarm System. In Proceedings of the International Conference on Smart Grid and Clean Energy Technologies (ICSGCE), Offenburg, Germany, 20–23 October 2015; pp. 144–147. [Google Scholar]
  18. Liao, Z.W.; Liu, S. Substation Alarm Information Processing Based on Ontology Theory. In Proceedings of the 2015 5th International Conference on Electric Utility Deregulation and Restructuring and Power Technologies (DRPT), Changsha, China, 26–29 November 2015; pp. 2377–2382. [Google Scholar]
  19. State Grid Corporation of China. Information Specification for Supervision and Control of Substation Devices; State Grid Corporation of China: Beijing China, 2015. [Google Scholar]
  20. Qin, Q.; Lai, X.; Zou, J. Direct Multistep Wind Speed Forecasting Using LSTM Neural Network Combining EEMD and Fuzzy Entropy. Appl. Sci. 2019, 9, 126. [Google Scholar] [CrossRef]
  21. Williams, T.; Crawford, C. Probabilistic Load Flow Modeling Comparing Maximum Entropy and Gram-Charlier Probability Density Function Reconstructions. IEEE Trans. Power Syst. 2013, 28, 272–280. [Google Scholar] [CrossRef]
  22. Gao, B.; Wu, C.; Wu, Y.; Tang, Y. Expected Utility and Entropy-Based Decision-Making Model for Large Consumers in the Smart Grid. Entropy 2015, 17, 6560–6575. [Google Scholar] [CrossRef] [Green Version]
  23. Zheng, Y.; Sun, C.; Li, J.; Yang, Q.; Chen, W. Entropy-Based Bagging for Fault Prediction of Transformers Using Oil-Dissolved Gas Data. Energies 2011, 4, 1138–1147. [Google Scholar] [CrossRef]
  24. da Silva, A.M.L.; da Costa Castro, J.F.; Billinton, R. Probabilistic Assessment of Spinning Reserve via Cross-Entropy Method Considering Renewable Sources and Transmission Restrictions. IEEE Trans. Power Syst. 2017, 33, 4574–4582. [Google Scholar] [CrossRef]
  25. Bekenstein, J.D. Black Holes and Entropy. Phys. Rev. D Part. Fields 1973, 7, 2333–2346. [Google Scholar] [CrossRef]
  26. Mahbub, M.S.; Souza, P.D.; Williams, R. Understanding Environmental Changes Using Statistical Mechanics. Ann. Data Sci. 2019, 1–13. [Google Scholar] [CrossRef]
  27. Shannon, C.E. A Mathematical Theory of Communication. Bell Labs Tech. J. 1948, 27, 379–423. [Google Scholar] [CrossRef] [Green Version]
  28. Barnum, H.; Barrett, J.; Clark, L.O.; Leifer, M.; Spekkens, R.; Stepanik, N.; Wilce, A.; Wilke, R. Entropy and Information Causality in General Probabilistic Theories. New J. Phys. 2010, 3, 033024. [Google Scholar] [CrossRef]
  29. Wu, J. Beauty of Mathematics; Posts and Telecom Press: Beijing, China, 2012; pp. 59–60. [Google Scholar]
  30. Zhang, Y.; Chung, C.Y.; Wen, F.; Zhong, J. An Analytic Model for Fault Diagnosis in Power Systems Utilizing Redundancy and Temporal Information of Alarm Messages. IEEE Trans. Power Syst. 2016, 31, 4877–4886. [Google Scholar] [CrossRef]
  31. Hongbin, S.; Boming, Z.; Lei, T.; Feng, G.; Chendong, W. A Novel Optimal Decision-Making Principle Based on Minimization of Information Loss as Applied to Power System. Autom. Electr. Power Syst. 2002, 26, 9–13. [Google Scholar]
  32. Luo, W.J.; Ma, H.F.; He, Q.; Shi, Z.Q. Leveraging Entropy and Relevance for Document Summarization. J. Chin. Inf. Process. 2011, 25, 9–11. [Google Scholar]
  33. Zhu, Z.; Liang, J.; Li, D.; Yu, H.; Liu, G. Hot Topic Detection Based on a Refined TF-IDF Algorithm. IEEE Access 2019, 7, 26996–27007. [Google Scholar] [CrossRef]
  34. Gan, L.; Xu, D.; Hu, L.; Wang, L. Economic Feasibility Analysis for Renewable Energy Project Using an Integrated TFN–AHP–DEA Approach on the Basis of Consumer Utility. Energies 2017, 10, 2089. [Google Scholar] [CrossRef]
  35. Chen, F.; Guo, S.; Gao, Y.; Yang, W.; Yang, Y.; Zhao, Z.; Ehsan, A. Evaluation Model of Demand-Side Energy Resources in Urban Power Grid Based on Geographic Information. Appl. Sci. 2018, 8, 1491. [Google Scholar] [CrossRef]
  36. Du, D.; Pang, T.H.; Wu, Y. Modern Comprehensive Evaluation Method and Case Selection; Tsinghua University Press: Beijing, China, 2008; pp. 14–15. [Google Scholar]
  37. Lin, B.S.; Wang, C.M.; Yu, C.N. The Establishment of Human-Computer Interaction Based on Word2Vec. In Proceedings of the 2017 IEEE International Conference on Mechatronics and Automation, Takamatsu, Japan, 6–9 August 2017; pp. 1698–1703. [Google Scholar]
Figure 1. Block diagram of pre-processing for monitoring alarm messages.
Energies 12 02814 g001
Figure 2. Information transmission in a power system. SCADA: Supervisory Control and Data Acquisition.
Energies 12 02814 g002
Figure 3. Bar chart of length-frequency distribution for alarm messages.
Energies 12 02814 g003
Figure 4. Probability density map of absolute alarm-message entropy.
Energies 12 02814 g004
Figure 5. Probability density map of average absolute alarm-message entropy.
Energies 12 02814 g005
Figure 6. Probability density map of Term Frequency-Inverse Document Frequency (TF-IDF) alarm-message entropy.
Energies 12 02814 g006
Figure 7. Probability density map of average TF-IDF alarm-message entropy.
Energies 12 02814 g007
Figure 8. Probability density map of relative alarm-message entropy.
Energies 12 02814 g008
Figure 9. Probability density map of average relative alarm-message entropy.
Energies 12 02814 g009
Figure 10. Probability density map of self-information of alarm messages.
Energies 12 02814 g010
Figure 11. Probability density map of the comprehensive scores for alarm messages.
Energies 12 02814 g011
Figure 12. Pie chart of grade distribution of alarm messages.
Energies 12 02814 g012
Table 1. Definitions of different alarm message entropies.
EntropyDefinition
From the Perspective of WordsFrom the Perspective of Sentences
Absolute alarm-message entropy
TF-IDF alarm-message entropy 1
Relative alarm-message entropy
Self-information of monitoring alarm message
1 TF-IDF: Term Frequency-Inverse Document Frequency.
Table 2. Meaning of the analytic hierarchy process (AHP) scale.
f i j Meaning
1 f i is as important as f j
3 f i is slightly more important than f j
5 f i is obviously more important than f j
7 f i is much more important than f j
9 f i is of the utmost importance to the target compared with f j
2, 4, 6, 8Middle values between the adjacent values
ReciprocalImportance of f j to the target compared with f i : f j i = cmp ( f j , f i )
Table 3. Summary of the characteristic and feature of each alarm-message entropy mentioned above.
EntropyCharacteristicFeature
Absolute alarm-message entropyConcentratedFavors long messages
Average Absolute alarm-message entropyConcentratedFavors short messages; realistic
TF-IDF alarm-message entropyDispersedFavors long messages with low word frequency; partially separates the alarm messages
Average TF-IDF alarm-message entropyDispersedFavors short messages with low word frequency; separates the alarm messages well; realistic
Relative alarm-message entropyDispersed, concentrated in the mid-to-low entropy areaFavors long messages with low word frequency
Average relative alarm-message entropyDispersedFavors messages with low word frequency
Self-information of monitoring alarm messageConcentrated in high-Entropy areaFavors messages with low sentence frequency
Table 4. Single ranking weights of the index layers.
Index f 1 f 2 f 3 f 4 f 5 f 6 f 7
Weight0.35040.23750.15900.10560.06960.04620.0318
Table 5. The probabilities of correct classification for alarm messages.
GradeHighRelatively HighMediumRelatively LowLow
Probability (%)99.198.0995.5997.9598.82
Table 6. Typical alarm messages for each classification grade.
GradeTypical Alarm Message
HighForbidden reclosure action caused by 2Y26PRC31A02DL low pressure in XX substation
Power protection exit in 756 line of XX substation
B-phase closing of 220 kV Xijin 4Y22 circuit breaker of XX substation
Relatively high1n GOOSE chain rupture of 102B smart terminal of XX substation
AC air switch jump-off action of 172 of XX substation
High-temperature alarm of the body winding of #2 main transformer in XX substation
MediumOverloaded #2 main transformer protection blocked on-load voltage Regulation in XX substation
290 control circuit broken of XX substation
Alarm of 710 Integrated Smart Terminal in XX substation
Relatively lowNo energy stored in the spring 1R1of XX substation
Unqualified bus voltage in 10 kV line in XX substation
1R2 circuit breaker opening of #2 capacitor of XX substation
LowOn-load voltage regulation on-off operation of #1 main transformer of XX substation
Abnormal voltage of #2 AC bus of the transformer in XX substation
142 earthing of XX substation in XX City
Table 7. Double validation of monitoring alarm messages.
ClassificationGrade
HighRelatively HighMediumRelatively LowLow
Alarm (accident, abnormal, off-limit, displacement)High riskMedium risk
Notification (notification)Medium riskLow risk
Table 8. The processing method for alarm messages of every risk level.
SeverityWay of AlarmProcessing
High riskVoice message, ringImmediate processing (within 1 h)
Medium riskRingTimely processing (within 1–4 h)
Low riskDelay or no alarmProcessing in 4 h or more

