Article

On Blockage Effects for a Tidal Turbine in Free Surface Proximity

Department of Mechanical Engineering and Mechanics, Lehigh University, Bethlehem, PA 18015, USA
*
Author to whom correspondence should be addressed.
Energies 2019, 12(17), 3325; https://doi.org/10.3390/en12173325
Submission received: 7 August 2019 / Revised: 26 August 2019 / Accepted: 27 August 2019 / Published: 28 August 2019
(This article belongs to the Special Issue Fluid Dynamics in Marine and Hydrokinetic Energy System)

Abstract

:
Experiments with a three-bladed, constant chord tidal turbine were undertaken to understand the influence of free surface proximity on blockage effects and near-wake flow field. The turbine was placed at various depths as rotational speeds were varied; thrust and torque data were acquired through a submerged sensor. Blockage effects were quantified in terms of changes in power coefficient and were found to be dependent on tip speed ratio and free surface to blade tip clearance. Flow acceleration near turbine rotation plane was attributed to blockage offered by the rotor, wake, and free surface deformation. In addition, particle image velocimetry was carried out in the turbine near-wake using time- and phase-averaged techniques to understand the mechanism responsible for the variation of power coefficient with rotational speed and free surface proximity. Slower wake propagation for higher rotational velocities and increased asymmetry in the wake with increasing free surface proximity was observed. Improved performance at high rotational speed was attributed to enhanced wake blockage, and performance enhancement with free surface proximity was due to the additional blockage effects caused by the free surface deformation. Proper orthogonal decomposition analysis revealed a downward moving wake for the turbine placed in near free surface proximity.

1. Introduction

Axial flow tidal turbines are installed near the free surface of a channel/river to take advantage of maximum volumetric flux available near the free surface [1]. The turbine is subjected to cyclic variations in flow velocity and flow level above the turbine rotation disc, which affect the performance [2,3,4]. It is thus crucial to understand the complex flow physics that play a role in performance characteristics as well as flow around the turbine for efficient deployment strategies. The restriction offered by the turbine rotor to the freestream flow, often referred to as solid blockage, results in flow acceleration around the turbine. Also, a wake blockage, caused by flow obstruction imposed by a counter-rotating wake that expands and dissipates behind the turbine is believed to add to the solid blockage [3,5,6,7]. Though the solid blockage is constant for a turbine in its deployed channel (cross-section) area, the extent of wake blockage varies with flow speed and turbine rotation speed [3].
Many researchers have investigated the effect of blockage on turbine performance; the majority of the early experimental work was done either in wind [8,9] or water tunnels [10,11,12,13] with the aim of validating and verifying simple physics-based models of such flows. Analytical models for characterizing the turbine performance in the blocked environment are based on linear momentum theory [13,14]. Several experimental studies have been carried out to quantify blockage effects and the resulting wake structure modifications [8,15,16]. Experimental investigations by Chen and Liou [8] concluded that the wind tunnel blockage factor was strongly related to solid blockage, tip speed ratio (TSR = ratio of the speed of blade tip to channel flow speed), and blade pitch angle. Higher blockage effects were observed at higher values of solid blockage and TSR. Experimental investigations by Whale et al. [16] on a lab-scale wind turbine reported high blockage at large TSR values due to the obstruction offered by a slow-moving (stream-wise) wake to the free stream flow (wake blockage). Experimental and computational investigations of Medici et al. [9] show the influence of blockage on flow up to three turbine diameters upstream of the rotor plane. Near upstream flow showed three-dimensional flow structures indicating the effect of wind turbine geometry on incoming flow, similar to near wake flow. McTavish et al. [15] studied the effect of blockage on initial wake expansion for different sized rotors in a water channel using a dye visualization technique; higher blockage was found to narrow down the wake expansion and modify the vortex pairing behind the turbine. Chamorro et al. [17,18] performed a three-dimensional particle image velocimetry (PIV) study in the wake of a deeply submerged miniature axial-flow hydrokinetic turbine and reported wake expansion proportional to the one-third power of the stream-wise distance. Lust et al. [19] studied the tip vortex structure in the near wake of a 1:25 scale turbine model; they observed vortex filament interactions at downstream distances greater than a rotor diameter and reported these to be suggestive of the process of vortex breakdown and wake re-energization. Eriksen et al. [20] reported a complete breakdown of tip vortices by a downstream distance of three rotor diameters in their experiments with a wind turbine model. The flow depth to rotor diameter ratio has been shown to have a considerable influence on the evolution of downstream wake characteristics [21,22]. Aghsaee et al. [21] showed that at a given inflow velocity and turbulence intensity, the deeper the flow, the faster the recovery of wake mean velocity, and the slower the recovery of wake turbulence intensity.
Along with solid and wake blockages, when a tidal turbine is installed in a near-free surface environment, it may be subjected to an additional blockage due to the free surface deformation [3]. Several studies have also been performed to analyze the effect of free surface proximity on turbines [3,10,11,23]. Bahaj et al. [23] performed experiments in a cavitation tunnel and a towing tank; their experimentation resulted in a reduction in turbine power with a decrease in blade tip-free surface clearance. Experimental investigations by Birjandi et al. [11] with a vertical axis hydrokinetic turbine reported improved performance with increasing free surface proximity. Kolekar and Banerjee [3] performed computational fluid dynamics (CFD) studies to investigate the effect of free surface proximity on tidal turbines’ performance characteristics and reported enhanced performance with increasing proximity. The transient CFD analysis revealed faster bypass flow (flow region outside the wake) and free surface deformation behind the turbine rotation plane whose magnitude varied with free surface proximity. Manar et al. [24], through an experimental study on a rotating wing in a confined space, concluded that the magnitude of measured blade forces was dependent on Reynolds number and blade-to-wall tip clearance. The measured lift coefficients were highest for the tip clearance of 0.5 c (c = chord length = 0.2 R, R = rotor radius). A stronger wall-to-tip vortex interaction was observed for the 0.5 c case which entrained the dye off the wall into the tip vortex path. When operating in a near free surface environment similar phenomena are expected to lead to increased blade forces. The majority of the reported experimental investigations available in the literature that quantify the effect of blockage on turbine performance are limited to turbines operating at a single depth of immersion; very little is known about the effect of free surface proximity on the turbine performance and the dynamics of the downstream wake.
This work is the first detailed experimental study to explore the effects of free-surface proximity on the near-wake characteristics of a tidal turbine model. It adds to the data reported in a previous publication by the authors [3] that focused on the effects of free surface proximity on the performance characteristics the turbine model. Flow-field visualization using stereoscopic PIV technique was performed to identify the principle flow mechanisms that are responsible for variation in performance characteristics with rotational speed and free surface proximity. The free surface proximity was quantified by a non-dimensional tip clearance ratio, δhU = hU/D (where hU represents water depth between turbine rotation disc and free surface and D represents turbine diameter). The turbine was subjected to various rotational speeds to achieve 1 ≤ TSR ≤ 8 at various depths of immersion 0.05 ≤ δhU ≤ 0.55.

2. Materials and Methods

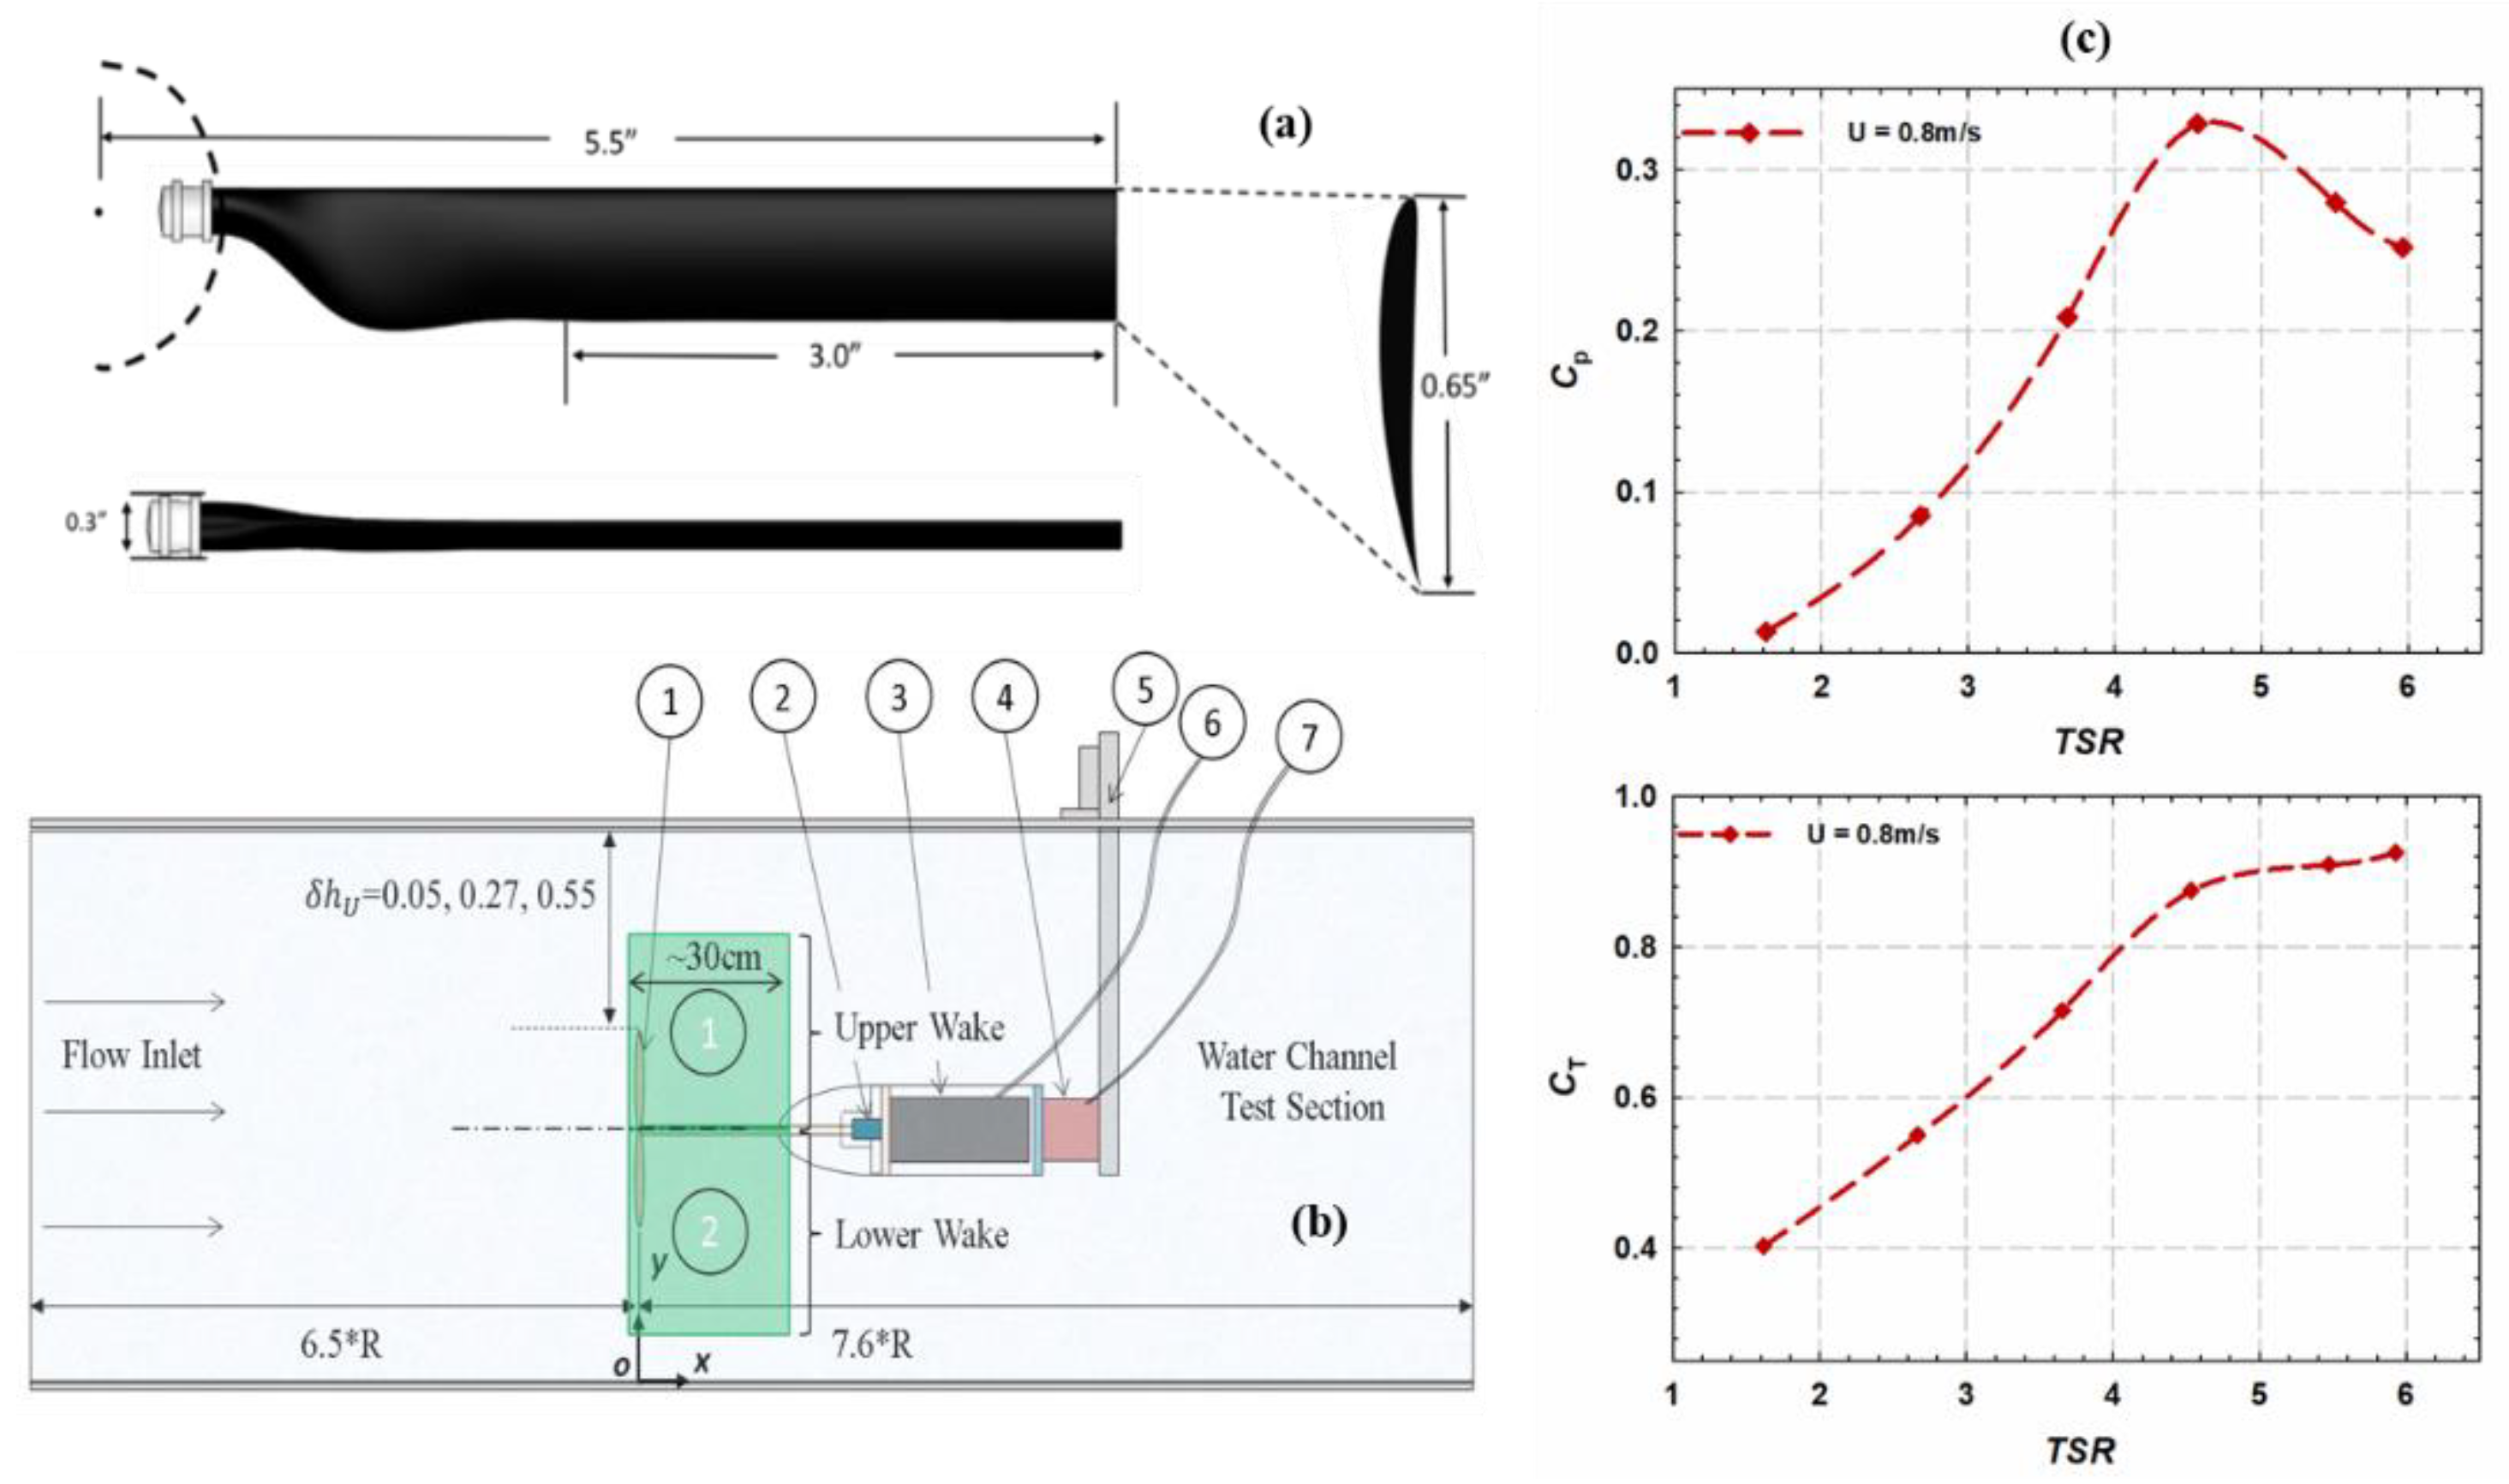
2.1. Flow Channel Conditions and Turbine Assembly

All experiments were performed using an open surface recirculating water channel at Lehigh University with a test cross-section size of 0.61 m × 0.61 m and length of 1.98 m (Engineering Laboratory Design, USA). This facility is equipped with a 19 kW single-stage axial-flow propeller pump with a maximum discharge of 0.35 m3/s. The propeller pump RPM and, hence, the test section flow velocity is controlled and regulated through a transistor inverter type, variable frequency controller (Toshiba Model VFAS1-2185PM-HN). Flow velocity can be varied from 0.03 m/s to 0.94 m/s and can be measured within an accuracy of ±2%. The flow quality is such that the turbulence intensity is maintained to a value of ~2% [25].
A three-bladed tidal turbine model (1:20 scale) with a diameter (D) of 0.2794 m was used for the current experiments. The turbine design was developed in house and used in previous studies [3,26]; the rotor blades were made of corrosion-resistant aluminum alloy with an SG6043 hydrofoil cross-section having a constant chord (c = 0.0165 m), the pitch angle of 10°, and no twist (see Figure 1a). The turbine operated at a blockage ratio of 16.5% in our water tunnel; however, even though it has a simpler blade profile, the results obtained using the rotor are applicable to tidal turbines in general. The model hydrokinetic turbine is attached to a horizontal shaft, and is driven by a stepper motor which maintains a precise rotational velocity through a micro-stepping driver and controller mechanism. The stepper motor used for the current study (Anaheim Automation, Model 23MDSI) was a NEMA23 series, 24 Volt DC (Direct Current) motor with a resolution of 1600 micro-steps per revolution. The stepper motor was connected to the turbine shaft through a flexible coupling. The motor and flexible coupling were enclosed inside a watertight acrylic cylinder, which was then connected to a thrust torque sensor (Model #TFF400, Futek Inc.). The acrylic cylinder was continuously pressured/purged to avoid water leakage into the system. Figure 1b shows a schematic of the experimental setup. The reaction torque-thrust sensor used for rotor load measurements was fixed to a vertical post, which was connected to a horizontal frame supported at the channel top. The vertical post can be raised/lowered inside the water channel to vary the free surface proximity of the turbine. During the experimental run, data from the torque-thrust sensor were continuously monitored and acquired on a desktop computer at a high sampling rate of 500 Hz for further analysis. The turbine performance was characterized using the non-dimensional parameters, the coefficient of power (CP), the coefficient of thrust (CT), and tip speed ratio (TSR) defined as:
C P = Q Ω 0.5 ρ A U 3 ,   C T = T 0.5 ρ A U 2 ,   T S R = R Ω U
where Q is the torque (N·m) on the turbine, T is the thrust on the assembly (N), Ω is the angular velocity of the rotor (rad/s), U is the area-averaged freestream velocity (m/s), ρ is the density of water (kg/m3), and A is the area of the rotor (m2). According to the manufacturer’s specifications, the torque/thrust sensor was accurate to within ±1% for the current measurement range, which was also confirmed by in-house calibration. A single sample uncertainty analysis for U, RPM, and torque, based on Kline and McClintock [27], showed a maximum uncertainty of 1% on the TSR and 3% on the CP calculations. The experimental data were corrected using a blockage correction methodology (based on the actuator disc theory coupled with free surface effects) developed by combining methods suggested by Bahaj et al. [10] and Whelan et al. [13] (see Appendix A for a summary of derivation).
The first set of experiments were aimed at exploring the Reynolds number dependence of the turbine performance curve. Experiments were conducted over a range of inflow velocities and TSRs for an immersion depth of δhU = 0.55, which corresponded to the placement of the rotor hub at the center of the water channel test section. It was observed that beyond an inflow velocity of 0.7 m/s, the variation in the performance curve was negligible. Therefore, all experiments reported in this paper were performed at an inflow velocity of 0.8 m/s, that corresponded to a diameter-based Reynolds number, ReD of 2.24 × 10⁵. However, we do not claim that our results are completely independent of Reynolds number effects. The CP and CT of the turbine evaluated at 0.8 m/s over a range of TSR’s is plotted in Figure 1c. A near bell-curve-like variation of CP with TSR is clearly observable in the figure; the maximum value of CP attained was 0.33 at a TSR of 4.6. As expected, the measured CT was observed to increase with TSR. The CT corresponding to peak performance was estimated to be 0.88, whereas peak CT observed at a TSR of 5.9 was found to be 0.9.

2.2. Stereoscopic-Particle Imaging Velocimetry (PIV) System

A high-resolution, two-dimensional, three-component digital stereo-PIV system (TSI Inc.) [28] was used for flow-field investigations during the current study to characterize wake structures, vortex structures, and flow in upper and lower bypass regions. The PIV system consists of three main components: (1) imaging subsystem which includes a laser, a beam delivery system, and light optics; (2) image capture subsystem which is composed of CCD (Charge Coupled Device) cameras, camera interface, and a synchronizer-master control unit; and (3) analysis and display subsystem which consists of INSIGHT4G software for image processing and data analysis. The flow medium was seeded with 13 µm diameter, hollow glass spheres (Potter Industries SH400S20) that were illuminated with a 100 mJ pulse, 100 Hz, 532 nm wavelength dual Nd: YAG (Neodymium-doped Yttrium Aluminum Garnet) laser. The light sheet optics consisted of a cylindrical lens which diverged the light in one direction and a spherical lens which waisted the laser light into a thin sheet with ~2 mm thickness at the waist. During the present study, the laser source was positioned such that the light sheet (~2 mm thick at the waist) was parallel to the XY plane; however, at an offset from the origin at Z = 0.1 R (R is the turbine radius). The image capture subsystem consisted of two high-resolution digital cameras placed in an angular displacement configuration (12° stereo half-angle for the current study). The Scheimpflug condition was satisfied with tilt-axis mounts capable of adjusting lenses and camera bodies. A synchronizer unit communicating with the host computer through INSIGHT4G software controls the timings of laser pulses for illumination and camera trigger for image captures. In situ calibration was performed with a dual-plane target to determine the mapping functions between image planes and actual measurement plane in the flow. The mapping function used was a third-order polynomial in the X and Y directions parallel to the laser sheet plane and a first-order polynomial in the Z direction normal to the laser sheet plane. A multi-pass frame-to-frame cross-correlation technique was employed to obtain 2D displacements in each image plane of the two cameras. A recursive Nyquist grid involving initial spot dimensions of 64 pixels × 64 pixels and final spot dimensions of 32 pixels × 32 pixels was employed for this purpose leading to a 4.5 × 4.5 mm2 interrogation region size. An effective overlap of 50% of the interrogation windows was employed in the PIV image processing. The 3D flow velocity vectors were then reconstructed using the mapping functions obtained by the in situ calibration procedure and the 2D displacements from each camera. The PIV measurements were carried out for a flow speed of 0.8 m/s and rotational speeds of 180 RPM (TSR = 3.29) and 270 RPM (TSR = 4.94). Free-run PIV measurements consisted of taking a series of 2000 images at a capture rate 72 Hz to determine the ensemble-averaged statistics of various flow quantities. In addition to free-run PIV, phase-locked PIV measurements were carried out in the near-wake region to study transient phenomena like wake development and propagation, tip and hub vortices formation and propagation, and to understand the dynamic interactions of wake with bypass flow regions.
Uncertainty and error estimates for velocity measurements [29] carried out in the current study showed a random error of less than 1% and a systematic error of ~2% of effective blade-tip velocity (Utip = 3 m/s that corresponds to U = 0.8 m/s and RPM = 180). The stereo-camera arrangement was such that the half stereo angle was approximately 12°, which led to an out-of-plane to in-plane RMS displacement error ratio of ~4.5. A convergence study was performed to understand the effect of number of realizations on averaged statistics. Time-averaged statistics showed less than 1% variation in averaged velocity beyond 1400 realizations. Hence, during the current study, time-averaging was performed over 2000 realizations that corresponded to 83 and 125 turbine rotations for TSR values of 3.29 and 4.94, respectively. On the other hand, for phase-averaged statistics, convergence was observed beyond 350 realizations. Hence, averaging was performed over 500 instantaneous images.

3. Results and Discussion

Results from the experimental study carried out with a constant chord, untwisted three-bladed turbine model are discussed at various depths of immersion 0.05 ≤ δ h U ≤ 0.55.

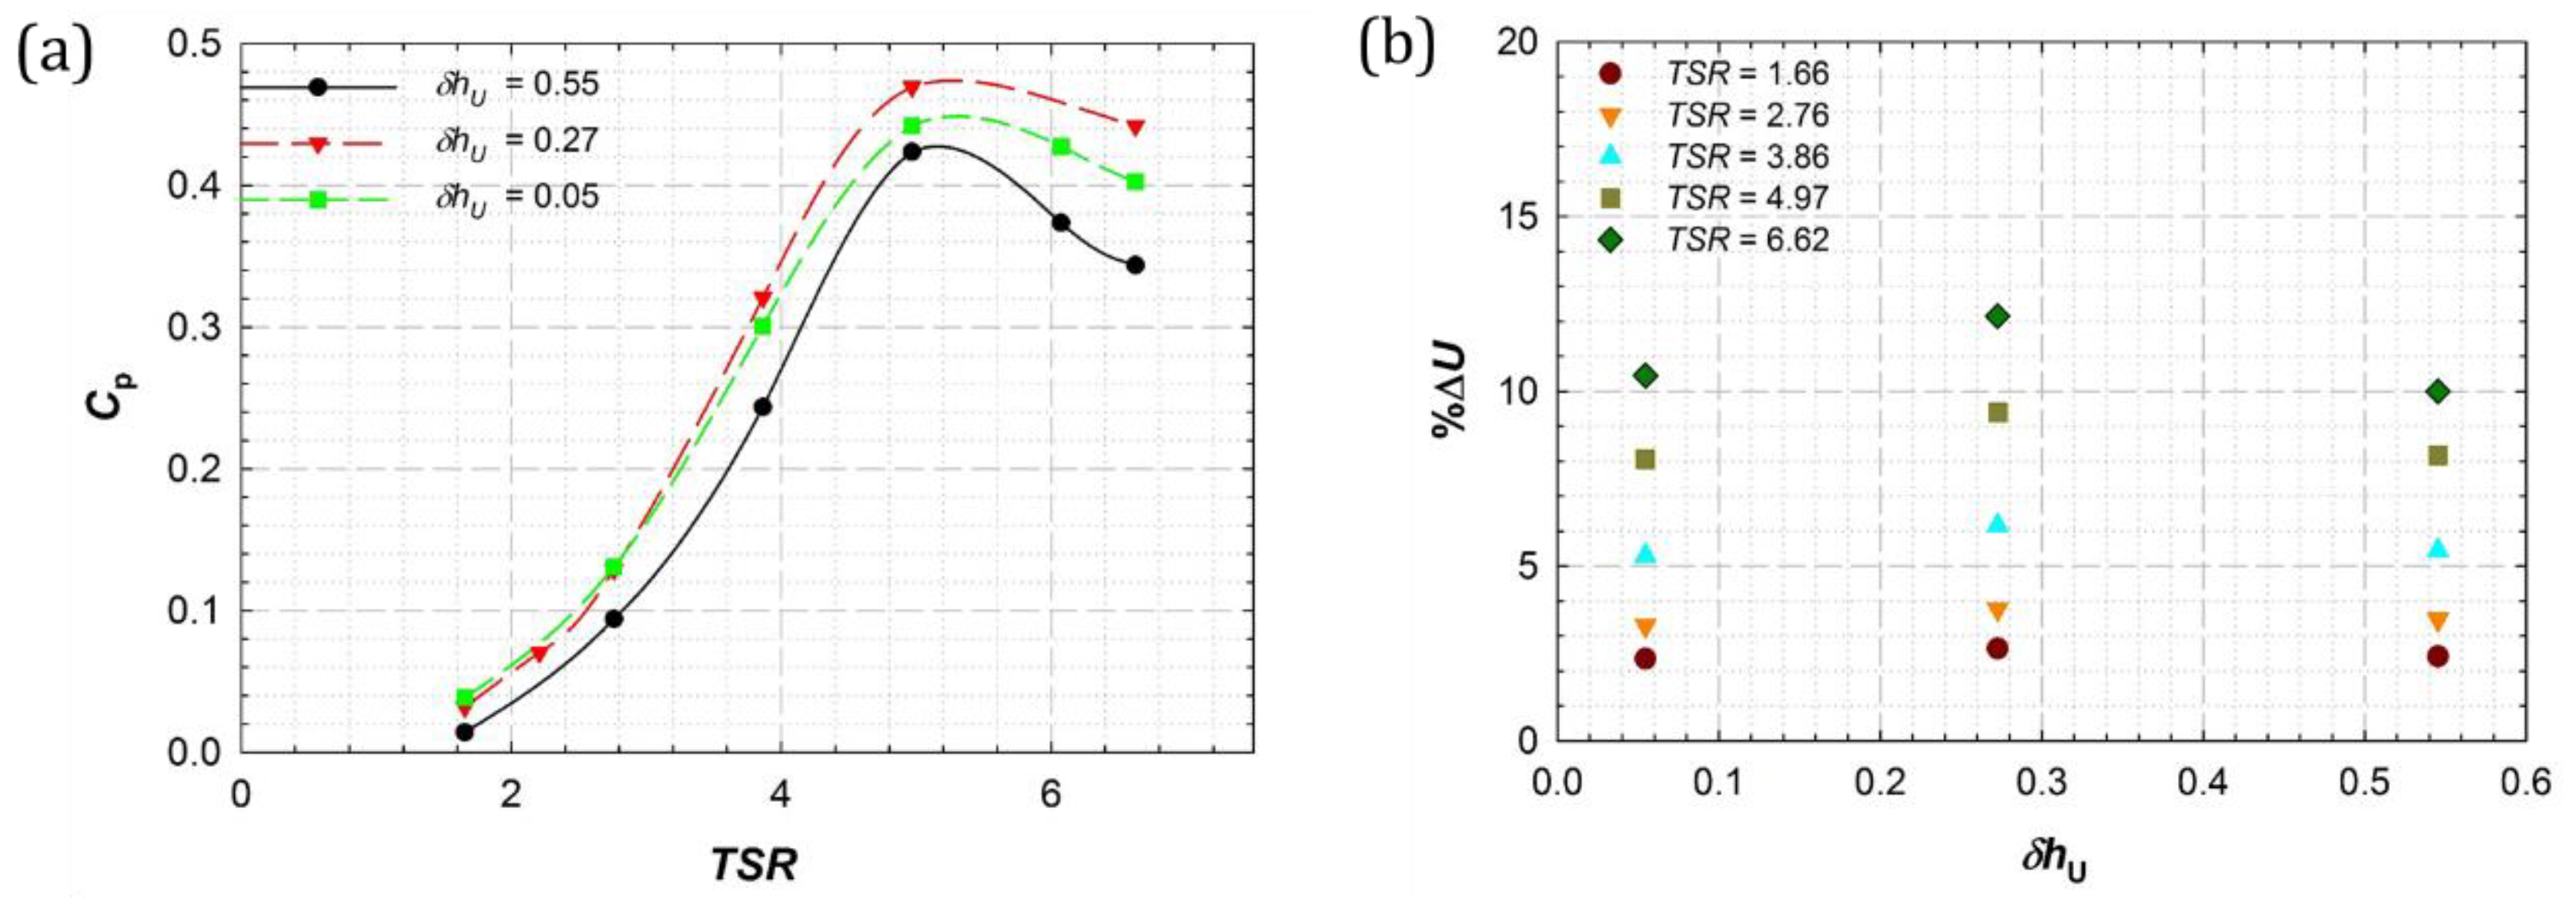
3.1. Effect of Free Surface Proximity on Blockage

During the experiments, the turbine depth of submersion was varied to achieve three different tip clearance ratios of δ h U = 0.55, 0.27, and 0.05; Figure 2a compares the results of the measured experimental data for these three cases. On comparison of the performance curves for δ h U = 0.55 and 0.27, it was observed that moving the turbine closer to the free surface resulted in higher power coefficients. For δ h U = 0.27, the turbine was submerged such that its rotation disc was 0.076 m away from the free surface which corresponds to a tip clearance distance of ~0.5 R. At this depth of immersion, free surface deformation was observed at approximately one radial distance behind the turbine rotation plane. When the turbine was moved further closer to the free surface ( δ h U = 0.05), performance degradation was observed compared to the δ h U = 0.27 case. The appearance of a power enhancement zone posed important questions as similar phenomenon have not been reported before. We hypothesize this to be an artefact of flow acceleration in the upper bypass region and the inherent three-dimensional nature of the free-surface that was observed in our previous work [3]. The flow mechanism that leads to these findings is decoupled using flow visualization carried out in the near-wake of the turbine and are discussed in Section 3.2.
A blockage formulation that accounts for free surface deformation in terms of Froude number was used to quantify percentage increases in the flow velocity and power coefficient due to the presence of a turbine in a free surface proximity environment. Figure 2b plots variation of the percentage change in effective channel velocity [ % U = ( U 1 U ) / U × 100 ] as a function of δ h U for various TSR values, where, U1 is the equivalent free stream velocity that will produce the same CP as measured in blockage environment, and U is the specified channel velocity. At low TSR values (1.66 2.76), when rotational speeds were low, the tip clearance ratio did not have any effect on the percentage increase in flow velocity. However, at larger TSR values (>3.86), %∆U started varying with the depth of immersion. The largest increment in the flow velocity was observed for δ h U = 0.27 at the highest TSR plotted in Figure 2b. For the data in Figure 2b, it is interesting to note that the comparison of data points for a constant value of δ h U demonstrated a wake blockage effect, while a comparison at a constant value of TSR demonstrated the effect of blockage due to the fact of free surface deformation. Lower TSR values led to smaller wake blockage while maximum free surface blockage was observed for δ h U = 0.27. The actuator disc theory and the blockage correction methodology, applied during the current study, assume a stream tube (control volume) passing through the edge of the disc with uniform loading on the disc, steady-state flow, and no flow across the control surfaces [30,31]. During the present study, for a turbine operating in close proximity of the free surface, the deformation of the free surface was expected to change the shape of this stream tube behind the turbine rotation plane (this is illustrated in Section 3.2 from our flow visualization). However, this did not invalidate the use of the actuator disc model, as a deforming stream tube will modify both thrust and torque field on turbine blades. As the correction was based on measured thrust data (which reflects the deformation effects), it was expected to account for modifications in disc loading due to the variation of stream tube shape.

3.2. Effect of Blockage and Free Surface Proximity on the Near-Wake Flow: Free-Run PIV

Flow visualization measurements using the stereo-PIV technique were subsequently carried at different depths of immersion and rotational speeds to understand flow features in the wake and bypass regions that were responsible for improved performance in the free surface-blocked environment (Figure 2). For each rotational speed and tip clearance ratio, two sets of PIV measurements were carried out: first in the upper wake and second in the lower wake of the turbine. Images from these two measurements were stitched together to visualize the complete near-wake flow, and bypass flows up for −0.5 R ≤ X ≤ 1.5 R, as presented in Figure 3.

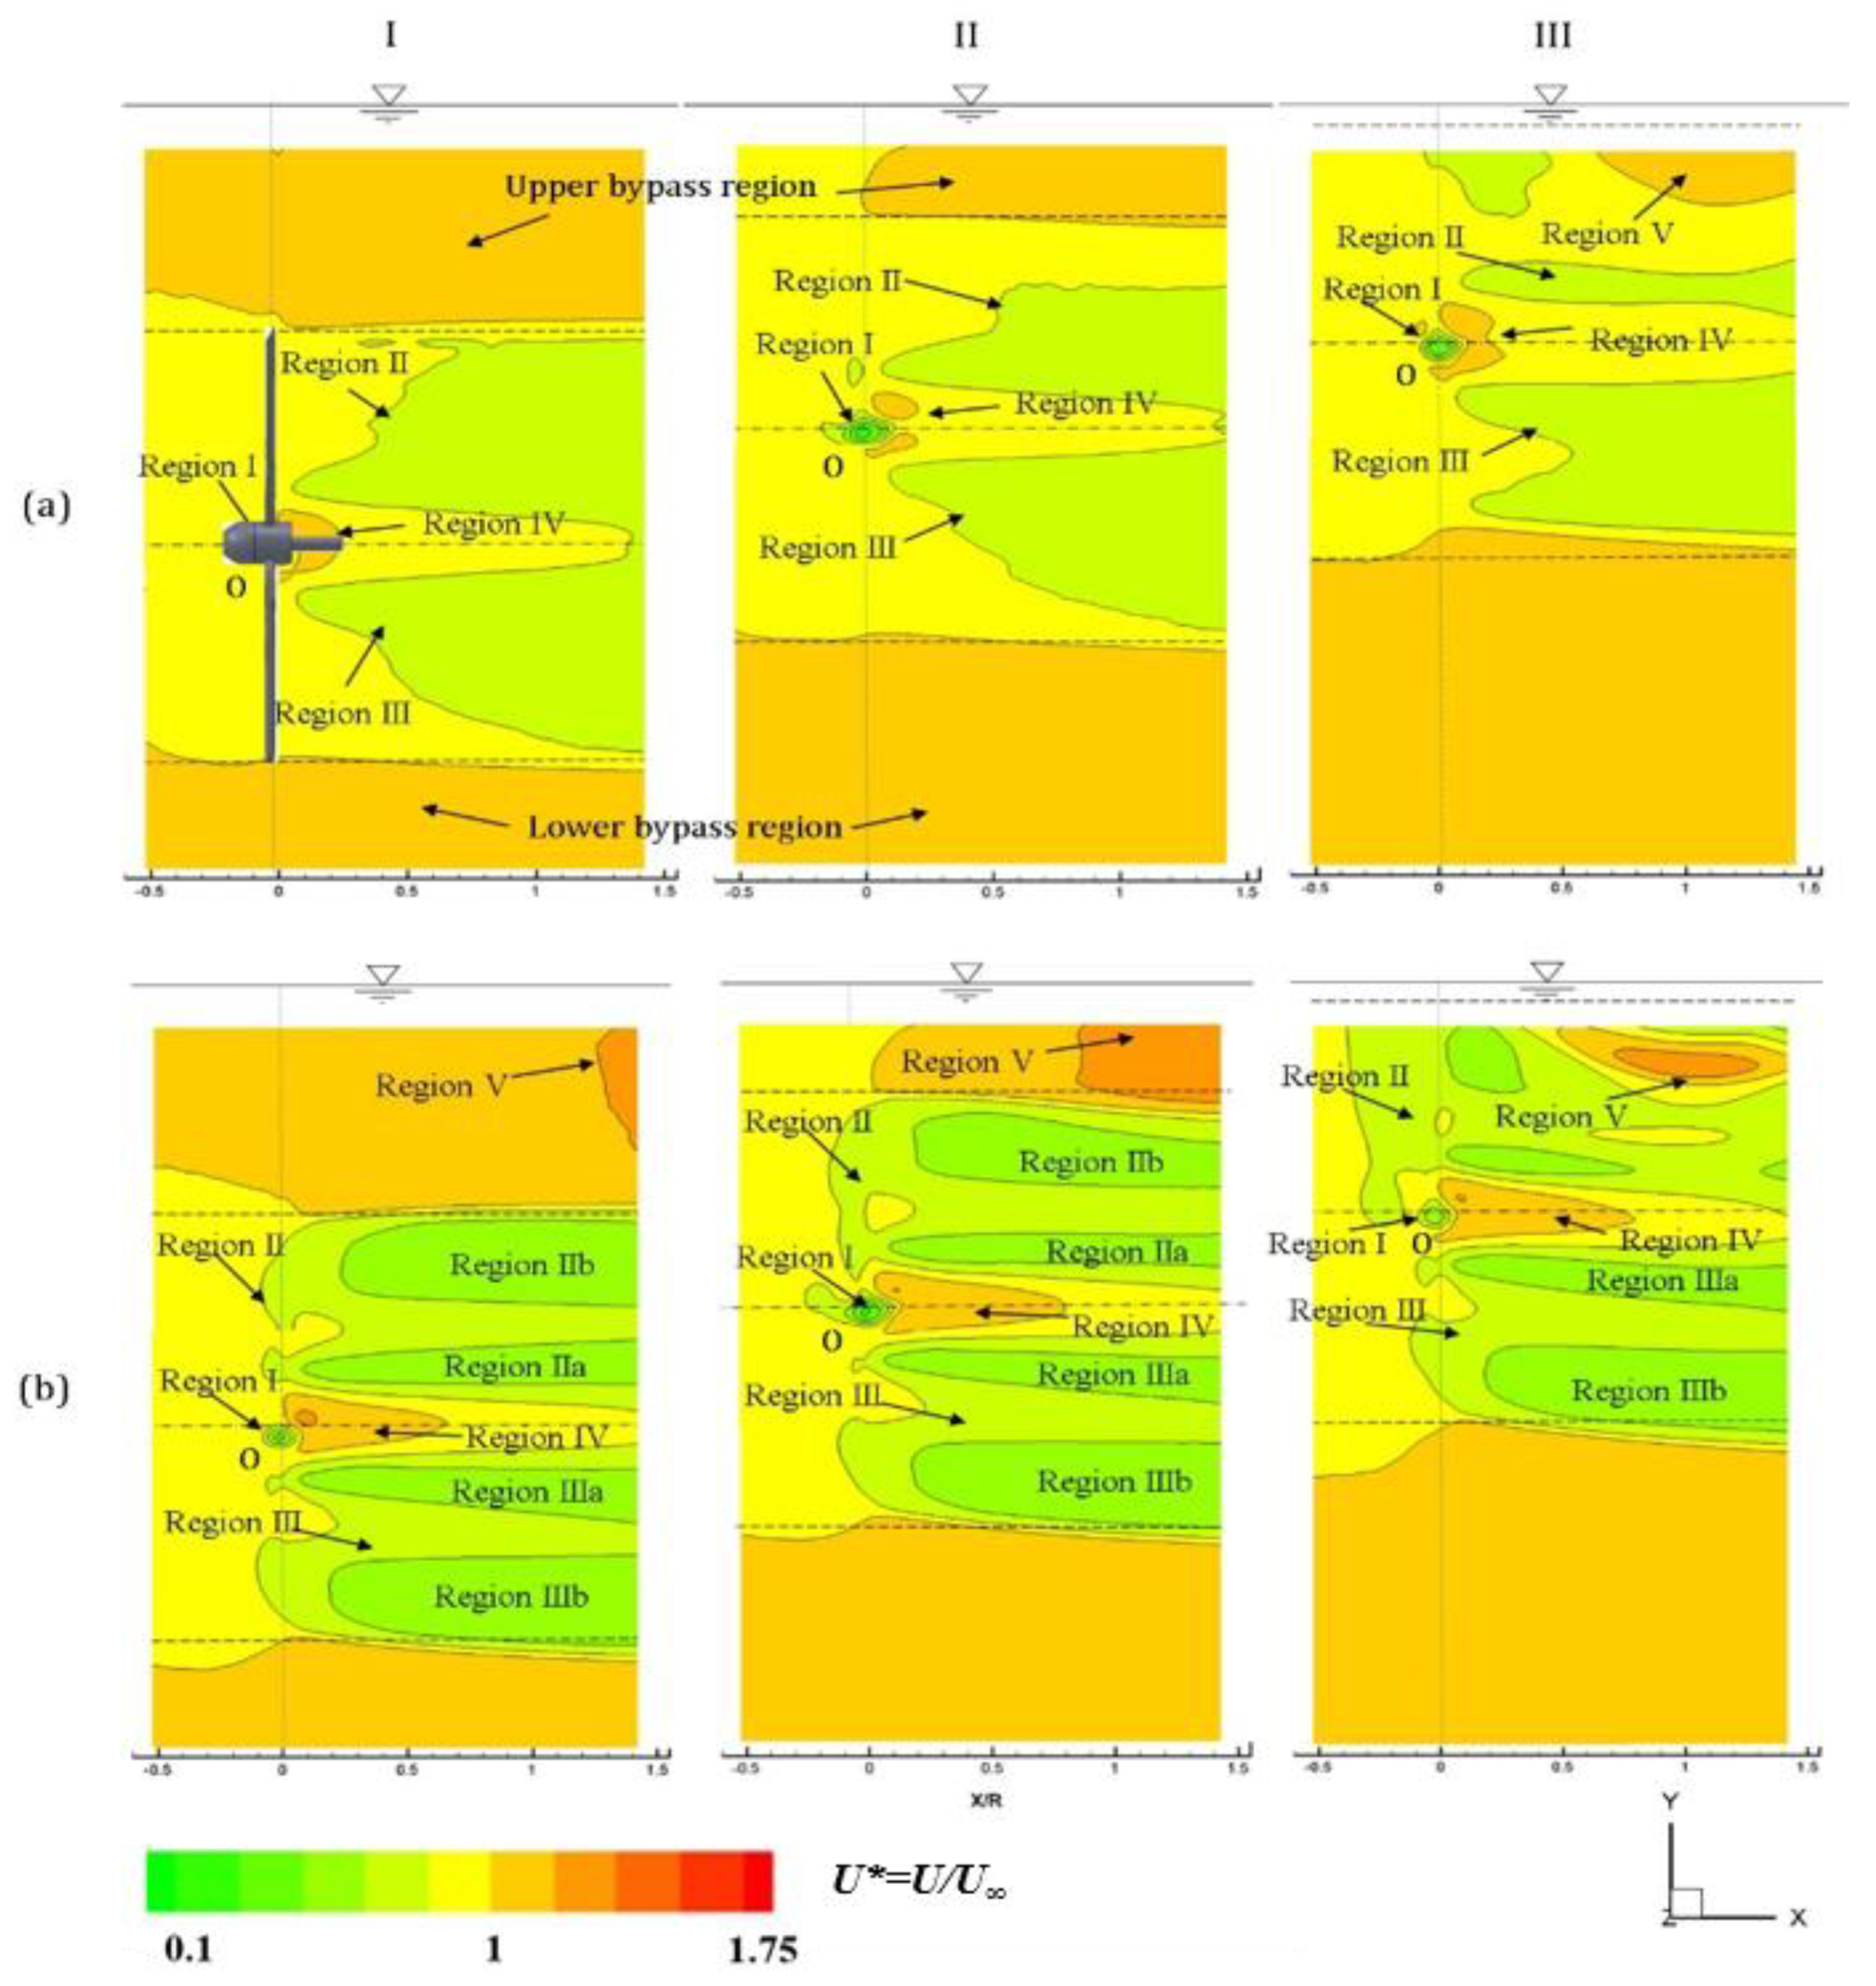
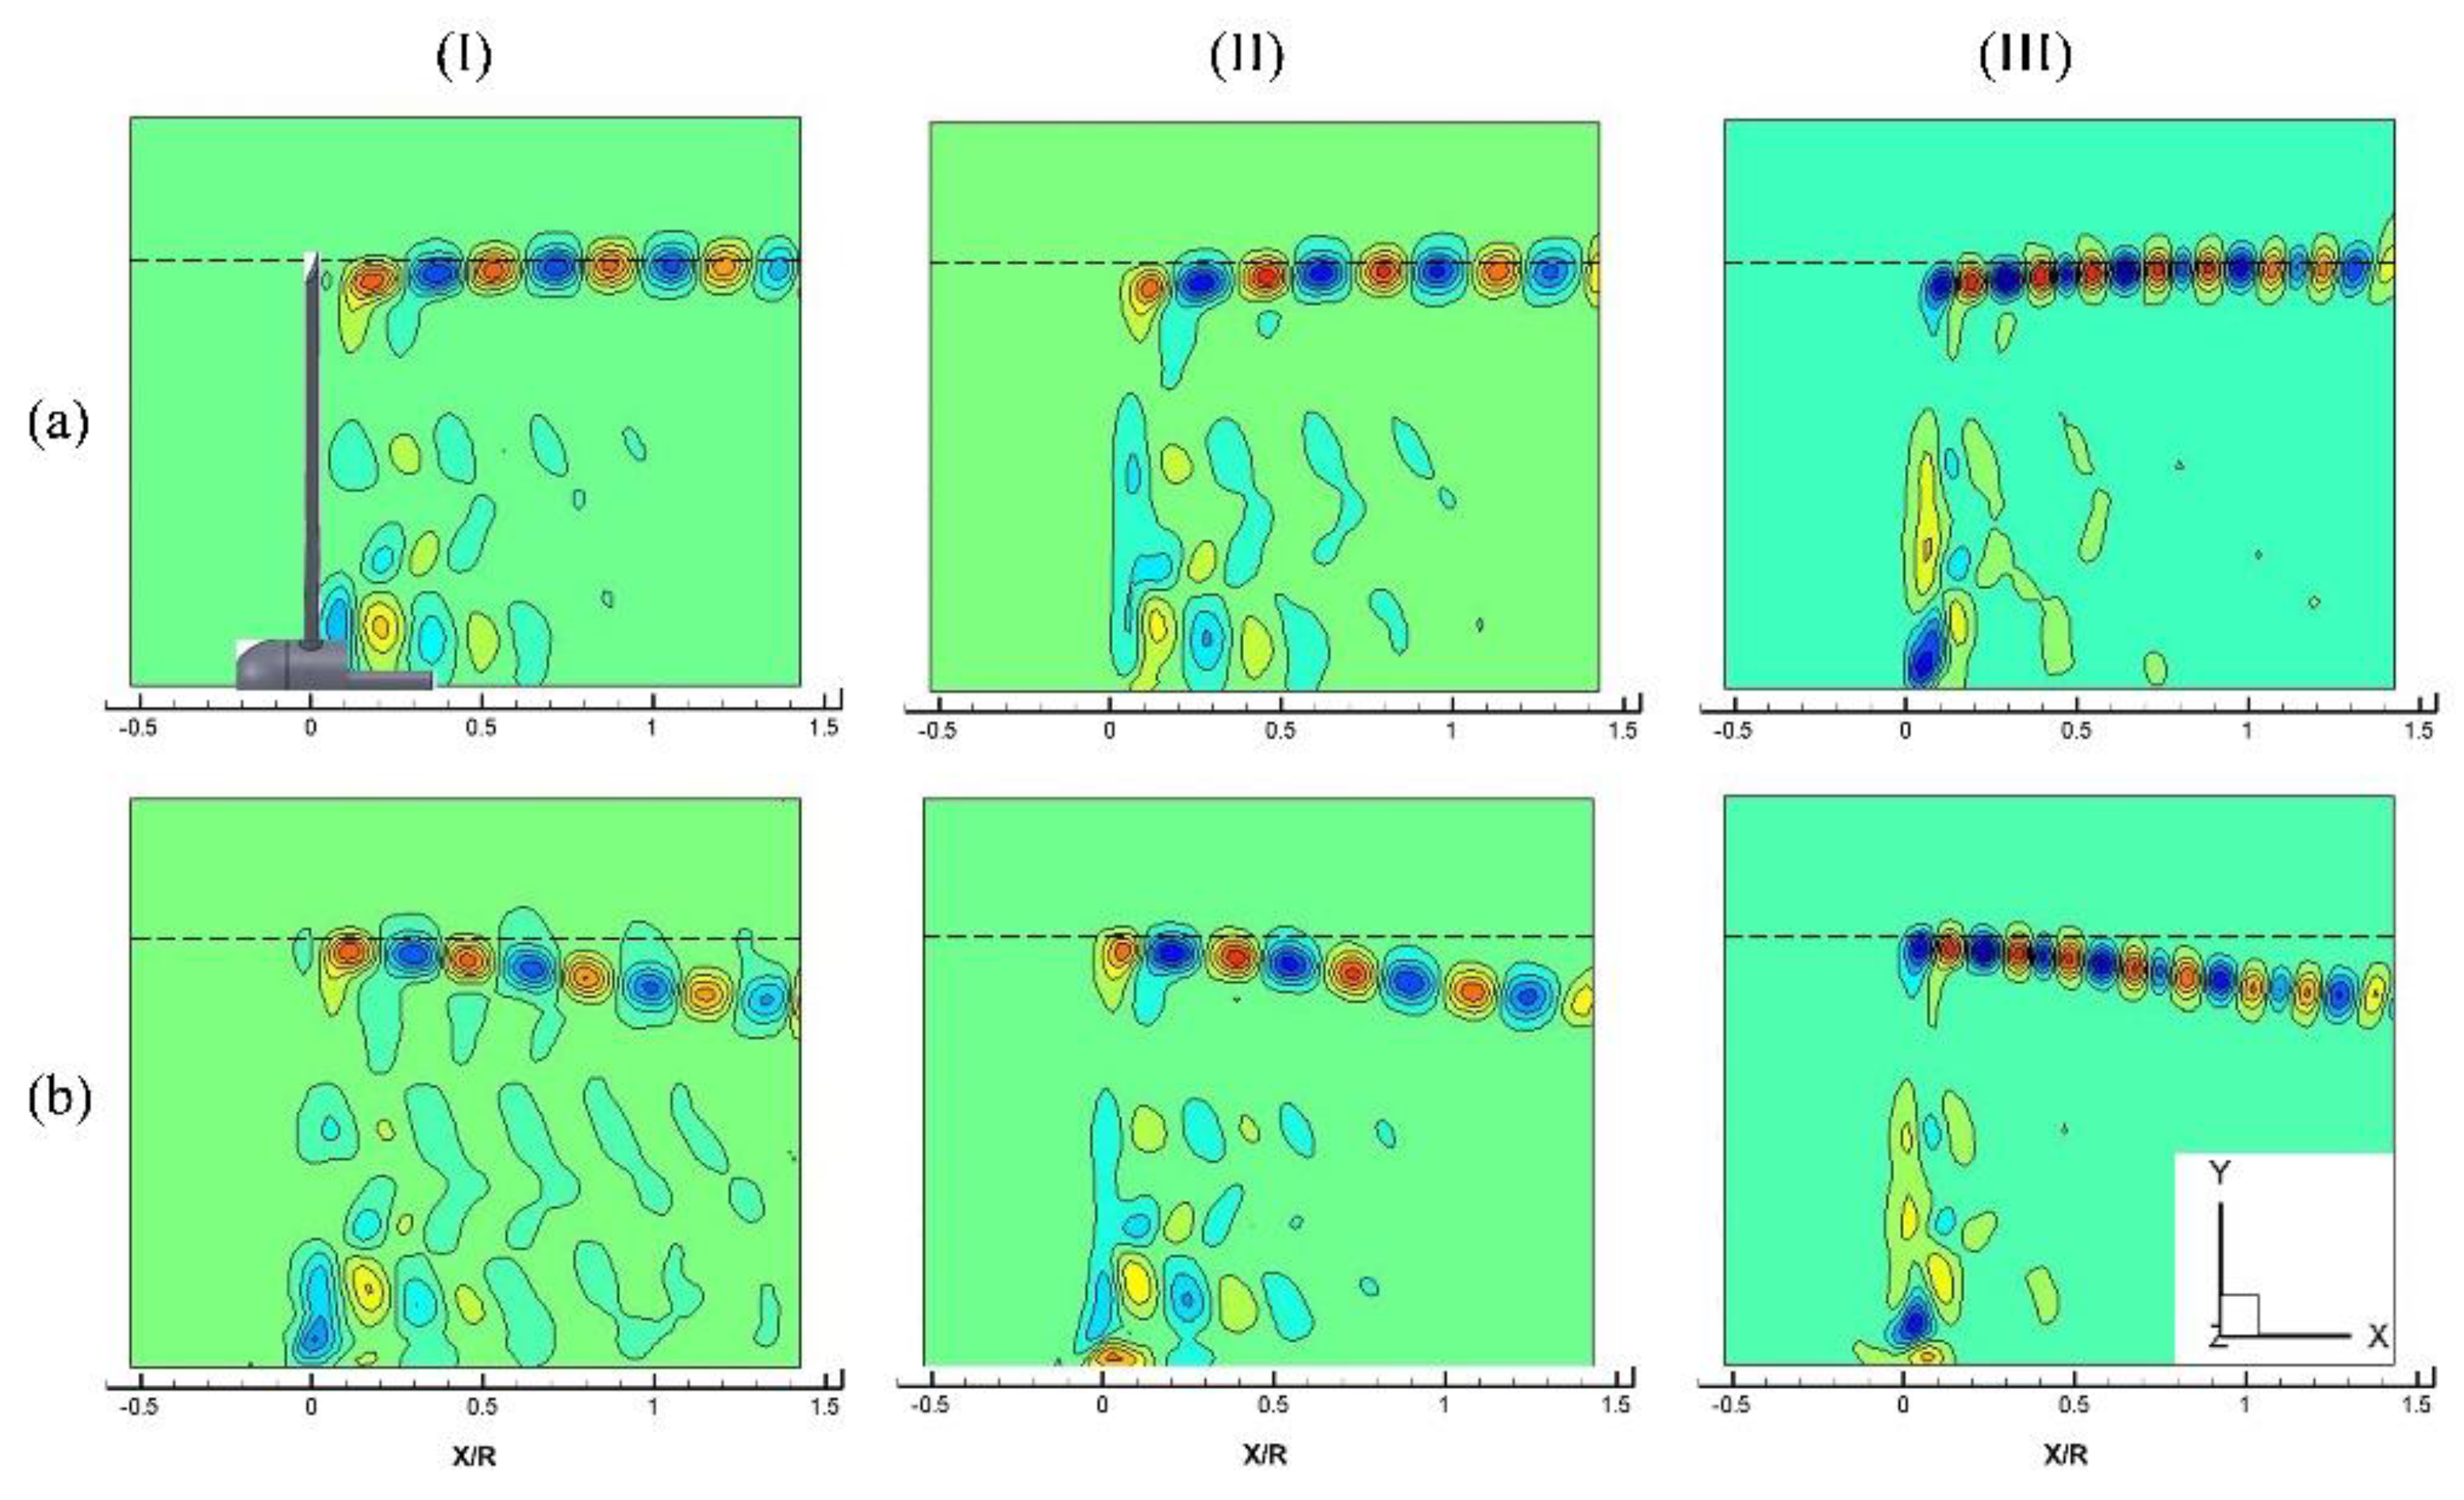
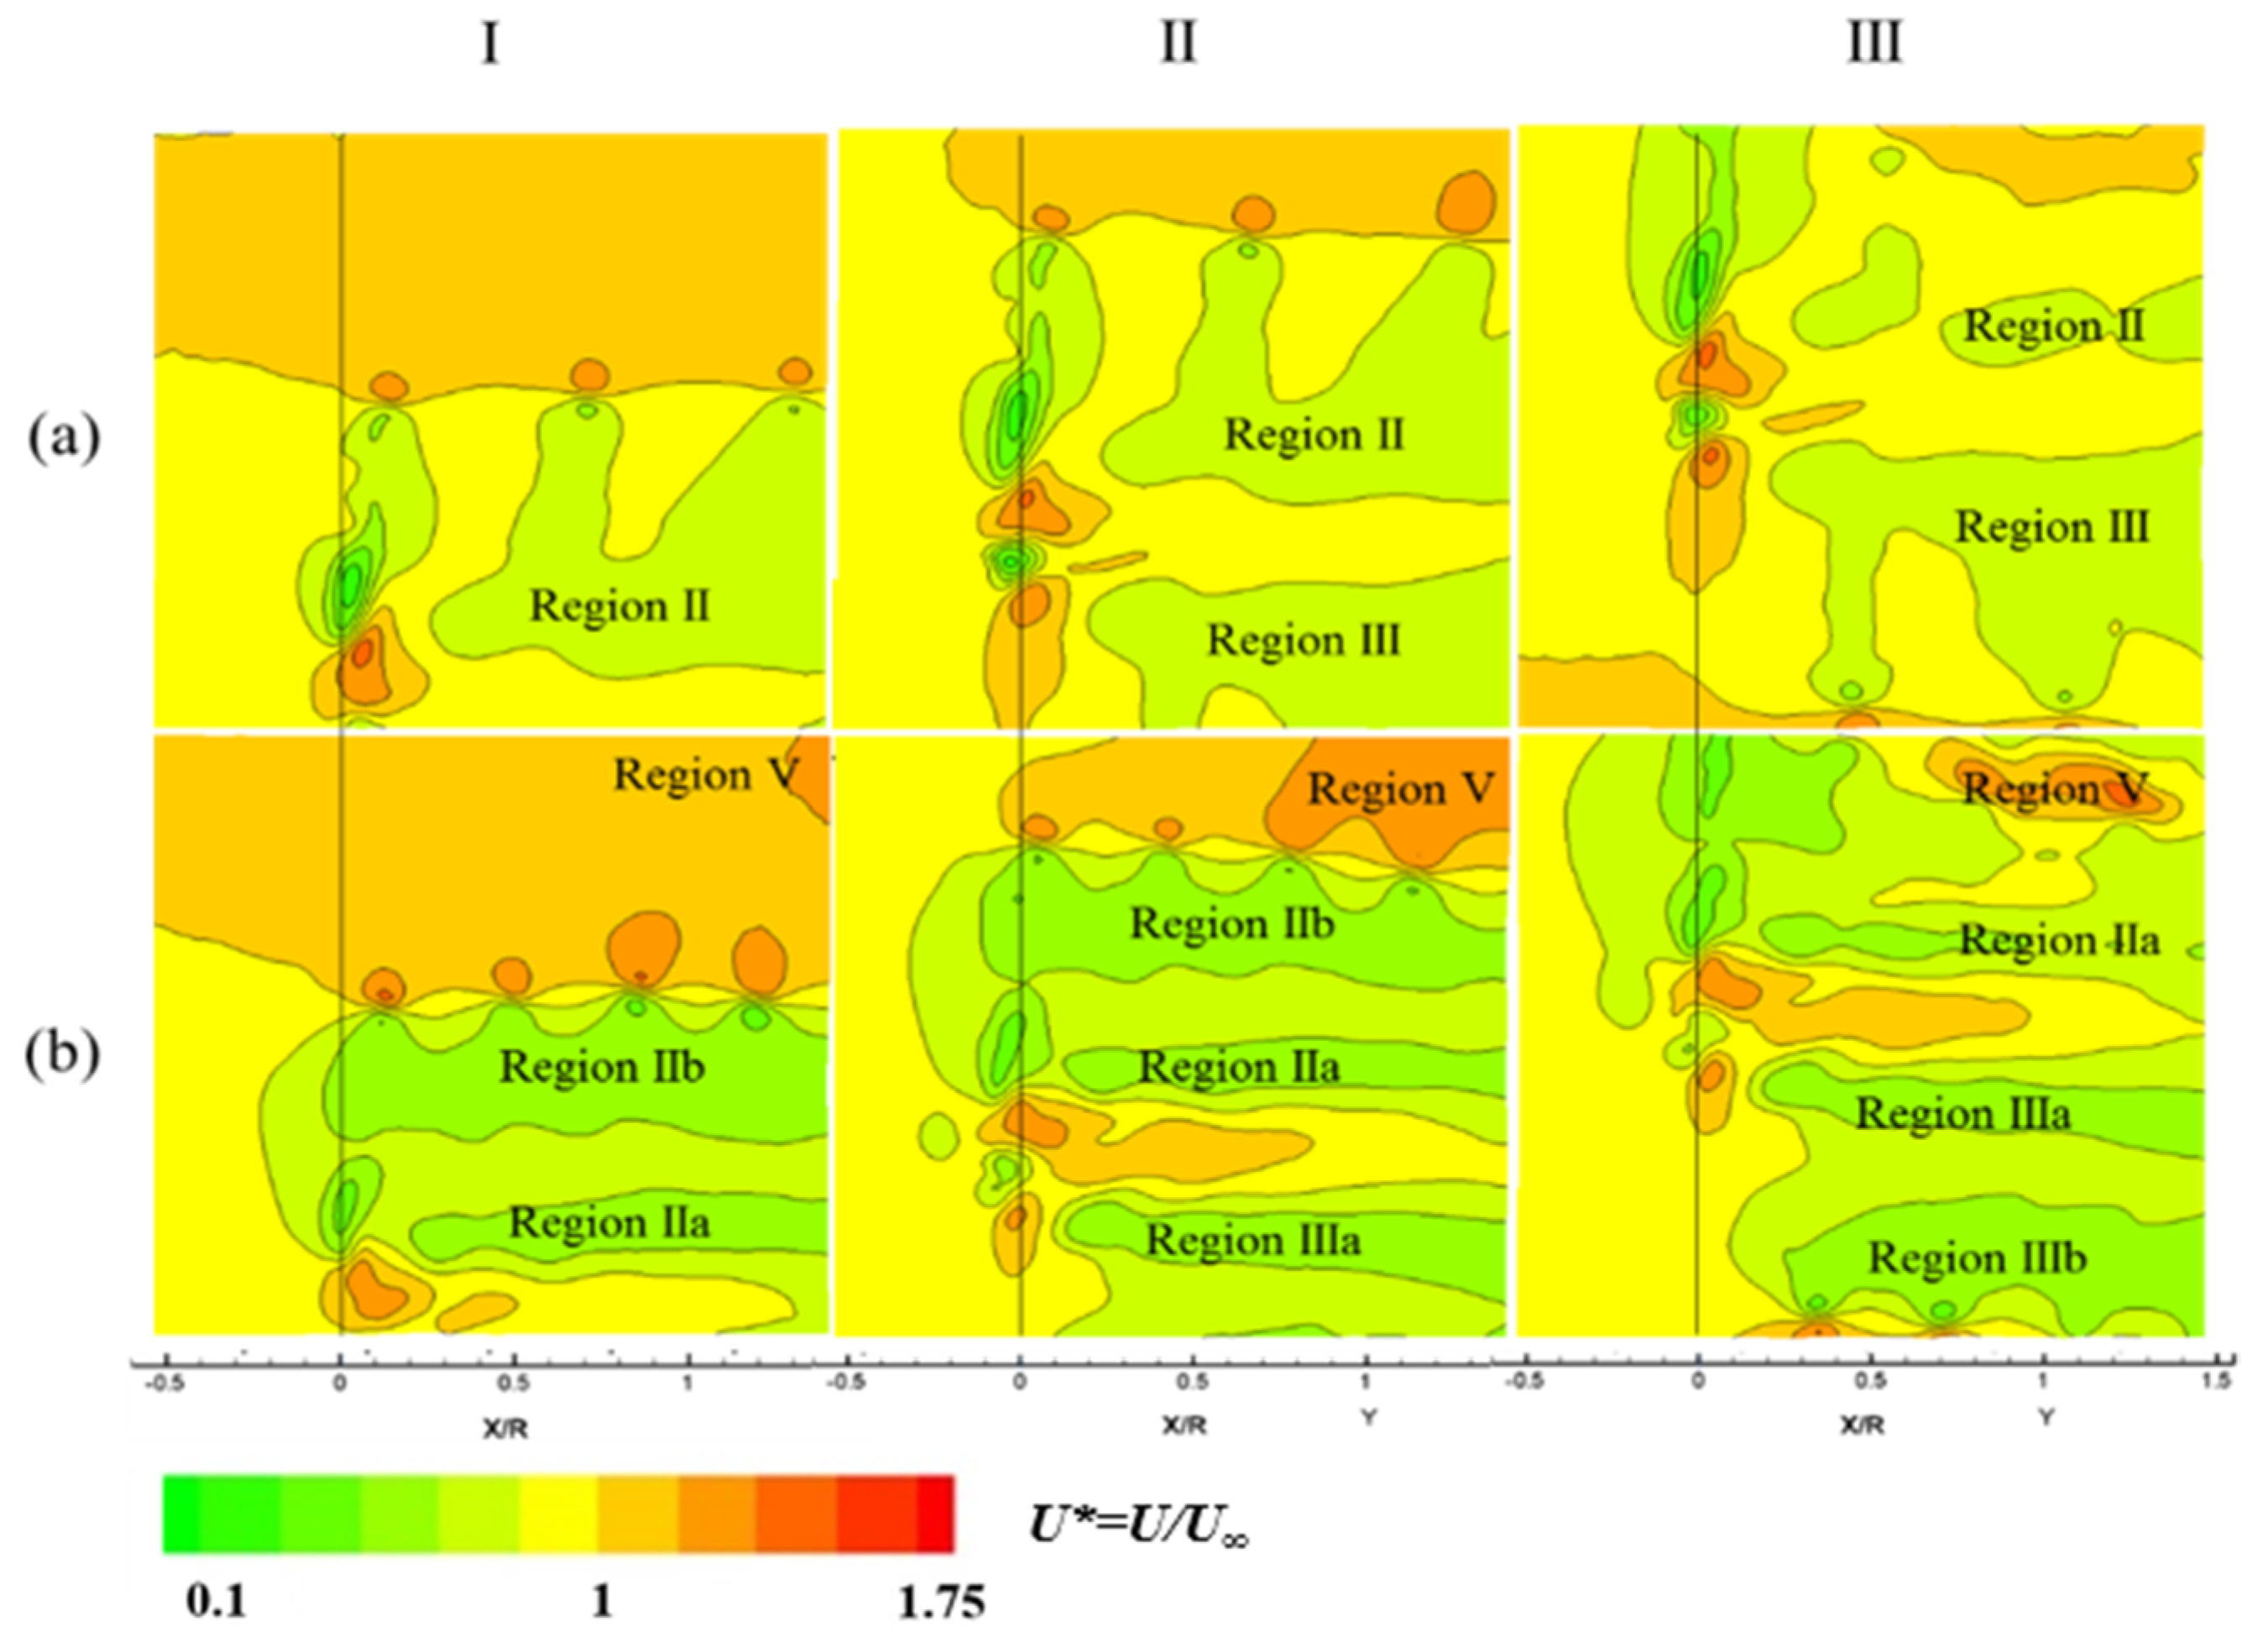
3.2.1. Contours of Stream-Wise Velocity

Figure 3(a-I–a-III) show contours of normalized stream-wise velocity U* = U/U (where U represents local stream-wise velocity) for the rotational speed of 180 at δ h U of 0.55, 0.27, and 0.05 respectively. Horizontal, dashed lines represent the position of the turbine tip, and vertical solid lines correspond to the turbine rotation plane. For depth of immersion δ h U   = 0.55, free the surface is seen to have no effect on near-wake development behind the turbine resulting in more or less symmetric structures about the turbine rotation axis. At the blade root position, a circular localized low-velocity region (region I) was observed, the size of which was of the order of blade root diameter. For this low rotation speed (180 RPM), wake starts to develop behind the turbine rotation plane as a conical structure (regions II and III above and below the turbine axis, respectively) that expands downstream of the turbine as depicted in Figure 3(a-I). A localized high-velocity region developed right behind the blade root (region IV) due to the flow acceleration that occurred due to the presence of a smaller blockage near the blade root that had a diameter smaller than the blade chord. Region IV was followed by a region of comparatively lower velocity but still higher than the rest of the wake. It is interesting to note that in this region, the flow velocity was comparable to the free stream velocity upstream of the turbine (implying a faster wake core). For the case of δ h U = 0.55, no significant differences were observed between the flow structures in the upper bypass and lower bypass regions. An increase in rotational speed to 270 RPM for δ h U = 0.55 led to higher effective blockage developing recess-like structures in the upper and lower parts of the wake, as shown in Figure 3(b-I). This resulted in the formation of additional low-velocity structures in the upper and lower parts of the wake near the blade root and blade tip—regions IIa, IIIa, and IIb, IIIb. Regions IIa and IIIa started closer to the rotor plane compared to regions IIb and IIIb due to the fact of their smaller radius of rotation. In addition, regions IIa and IIIa were observed to expand faster than regions IIb and IIIb. With the increase in rotational speed, a localized high-velocity region (IV) was observed to elongate further and extend downstream of the turbine as can be seen in Figure 3(b-I).
Contours of stream-wise velocity for the case of δ h U = 0.27 for rotational speeds of 180 and 270 RPM are plotted in column (II) of Figure 3. Similar to the observations in the δ h U = 0.55 case, increasing the rotational speed of the turbine resulted in modification of wake flow with additional flow structures at larger rotational speeds. However, in this case, the flow was no more symmetric about the turbine axis; different flow structures were observed in the upper and lower portions of the wake (regions II and III). At the rotational speed of 180 RPM, higher proximity to free surface resulted in limiting the radial wake expansion leading to a thinner upper wake compared to the lower wake, as shown when comparing Figure 3(a-I,a-II). However, the shape of the lower portion of the wake (region III) was similar. At this low rotational speed, wake expansion in the upper portion of the wake was limited by the faster-moving upper bypass region. The free surface being deformable, drops behind the turbine rotation plane and leads to flow structure modifications, particularly in the upper bypass and upper wake regions. Increasing turbine rotation speed to 270 RPM led to a higher wake blockage and a stronger wake that extended the entire turbine rotation disc behind the turbine (Figure 3(b-II)). Further, a low-velocity region was observed upstream of the rotor plane, indicating inflow modifications. Wake modification effects due to the free surface proximity can be visualized by comparing the upper wake and upper bypass regions for the different cases shown in Figure 3. A radially expanding wake for both the upper and lower wake regions was observed for δ h U = 0.55; however, in the case of δ h U = 0.27, this radial expansion behavior was restricted to the lower wake region only. For the upper wake, where the flow was restricted by free surface deformation and associated faster-moving bypass fluid, the wake expansion process was not just inhibited but, in fact, reversed leading to wake compression. This is illustrated by the shape of the upper wake with respect to the dashed line (corresponding to blade tip height) in column II (both rows). In addition, the faster the rotation speed, the higher the free surface drop that led to progressively faster upper bypass flow and higher wake compression, as is observed when comparing rows a and b for column II which corresponds to the δ h U = 0.27 case. The upper wake compression led to an asymmetric wake with narrower IIa and IIb regions in the upper wake compared to IIIa and IIIb regions in the lower wake. Faster bypass flow and higher wake compression were the primary driving mechanisms for the high-power coefficient of this case when compared to δ h U = 0.55.
For δ h U = 0.05 (column III), at a rotational speed of 270 RPM (row b), the lower wake region exhibited flow structures similar to the δ h U = 0.27 case; however, the upper wake was significantly different due to the free surface drop that penetrated into the upper wake region. For all depths of immersion, at a higher rotational speed of 270 RPM, a secondary region of higher flow velocity (region V) was observed in the upper bypass region whose magnitude increased with increasing free surface proximity (see Figure 3). For deeper submersion depth, the high velocity region V of only a marginal strength was observed near the upper right corner of the region of interest. However, for the case of δ h U = 0.27, a stronger and larger high-velocity region was observed in the upper right corner of the region of interest. For the case of δ h U = 0.05 (column III), a second region of high velocity, region V, developed for all rotational speeds and was closer to the turbine rotation plane as compared to the case of δ h U = 0.27 (column II); increasing rotation speeds moved this region closer to the turbine and deep into the upper wake region. It is also of interest to note the shape of the incoming stream-tube near the turbine rotation plane. An increase in rotational speed led to higher wake blockage to incoming flow that resulted in a bulge in the stream-tube just before the rotation plane (compare rows a and b for columns I and II). The bulge was more pronounced near the upper bypass region compared to a lower bypass region due to the upward deflection of flow as it approached the rotation plane. Further, the shape of the upper bypass and its interface with wake varied significantly with tip clearance distances. For the case of δ h U = 0.55, the stream-tube containing the turbine rotation disc was found to be enclosed by upper bypass and lower bypass regions. However, a reduction in the depth of immersion (columns II and III) modified the incoming stream-tube that extended well into the upper bypass region. This delayed the inception of the upper bypass region to the turbine rotation plane.

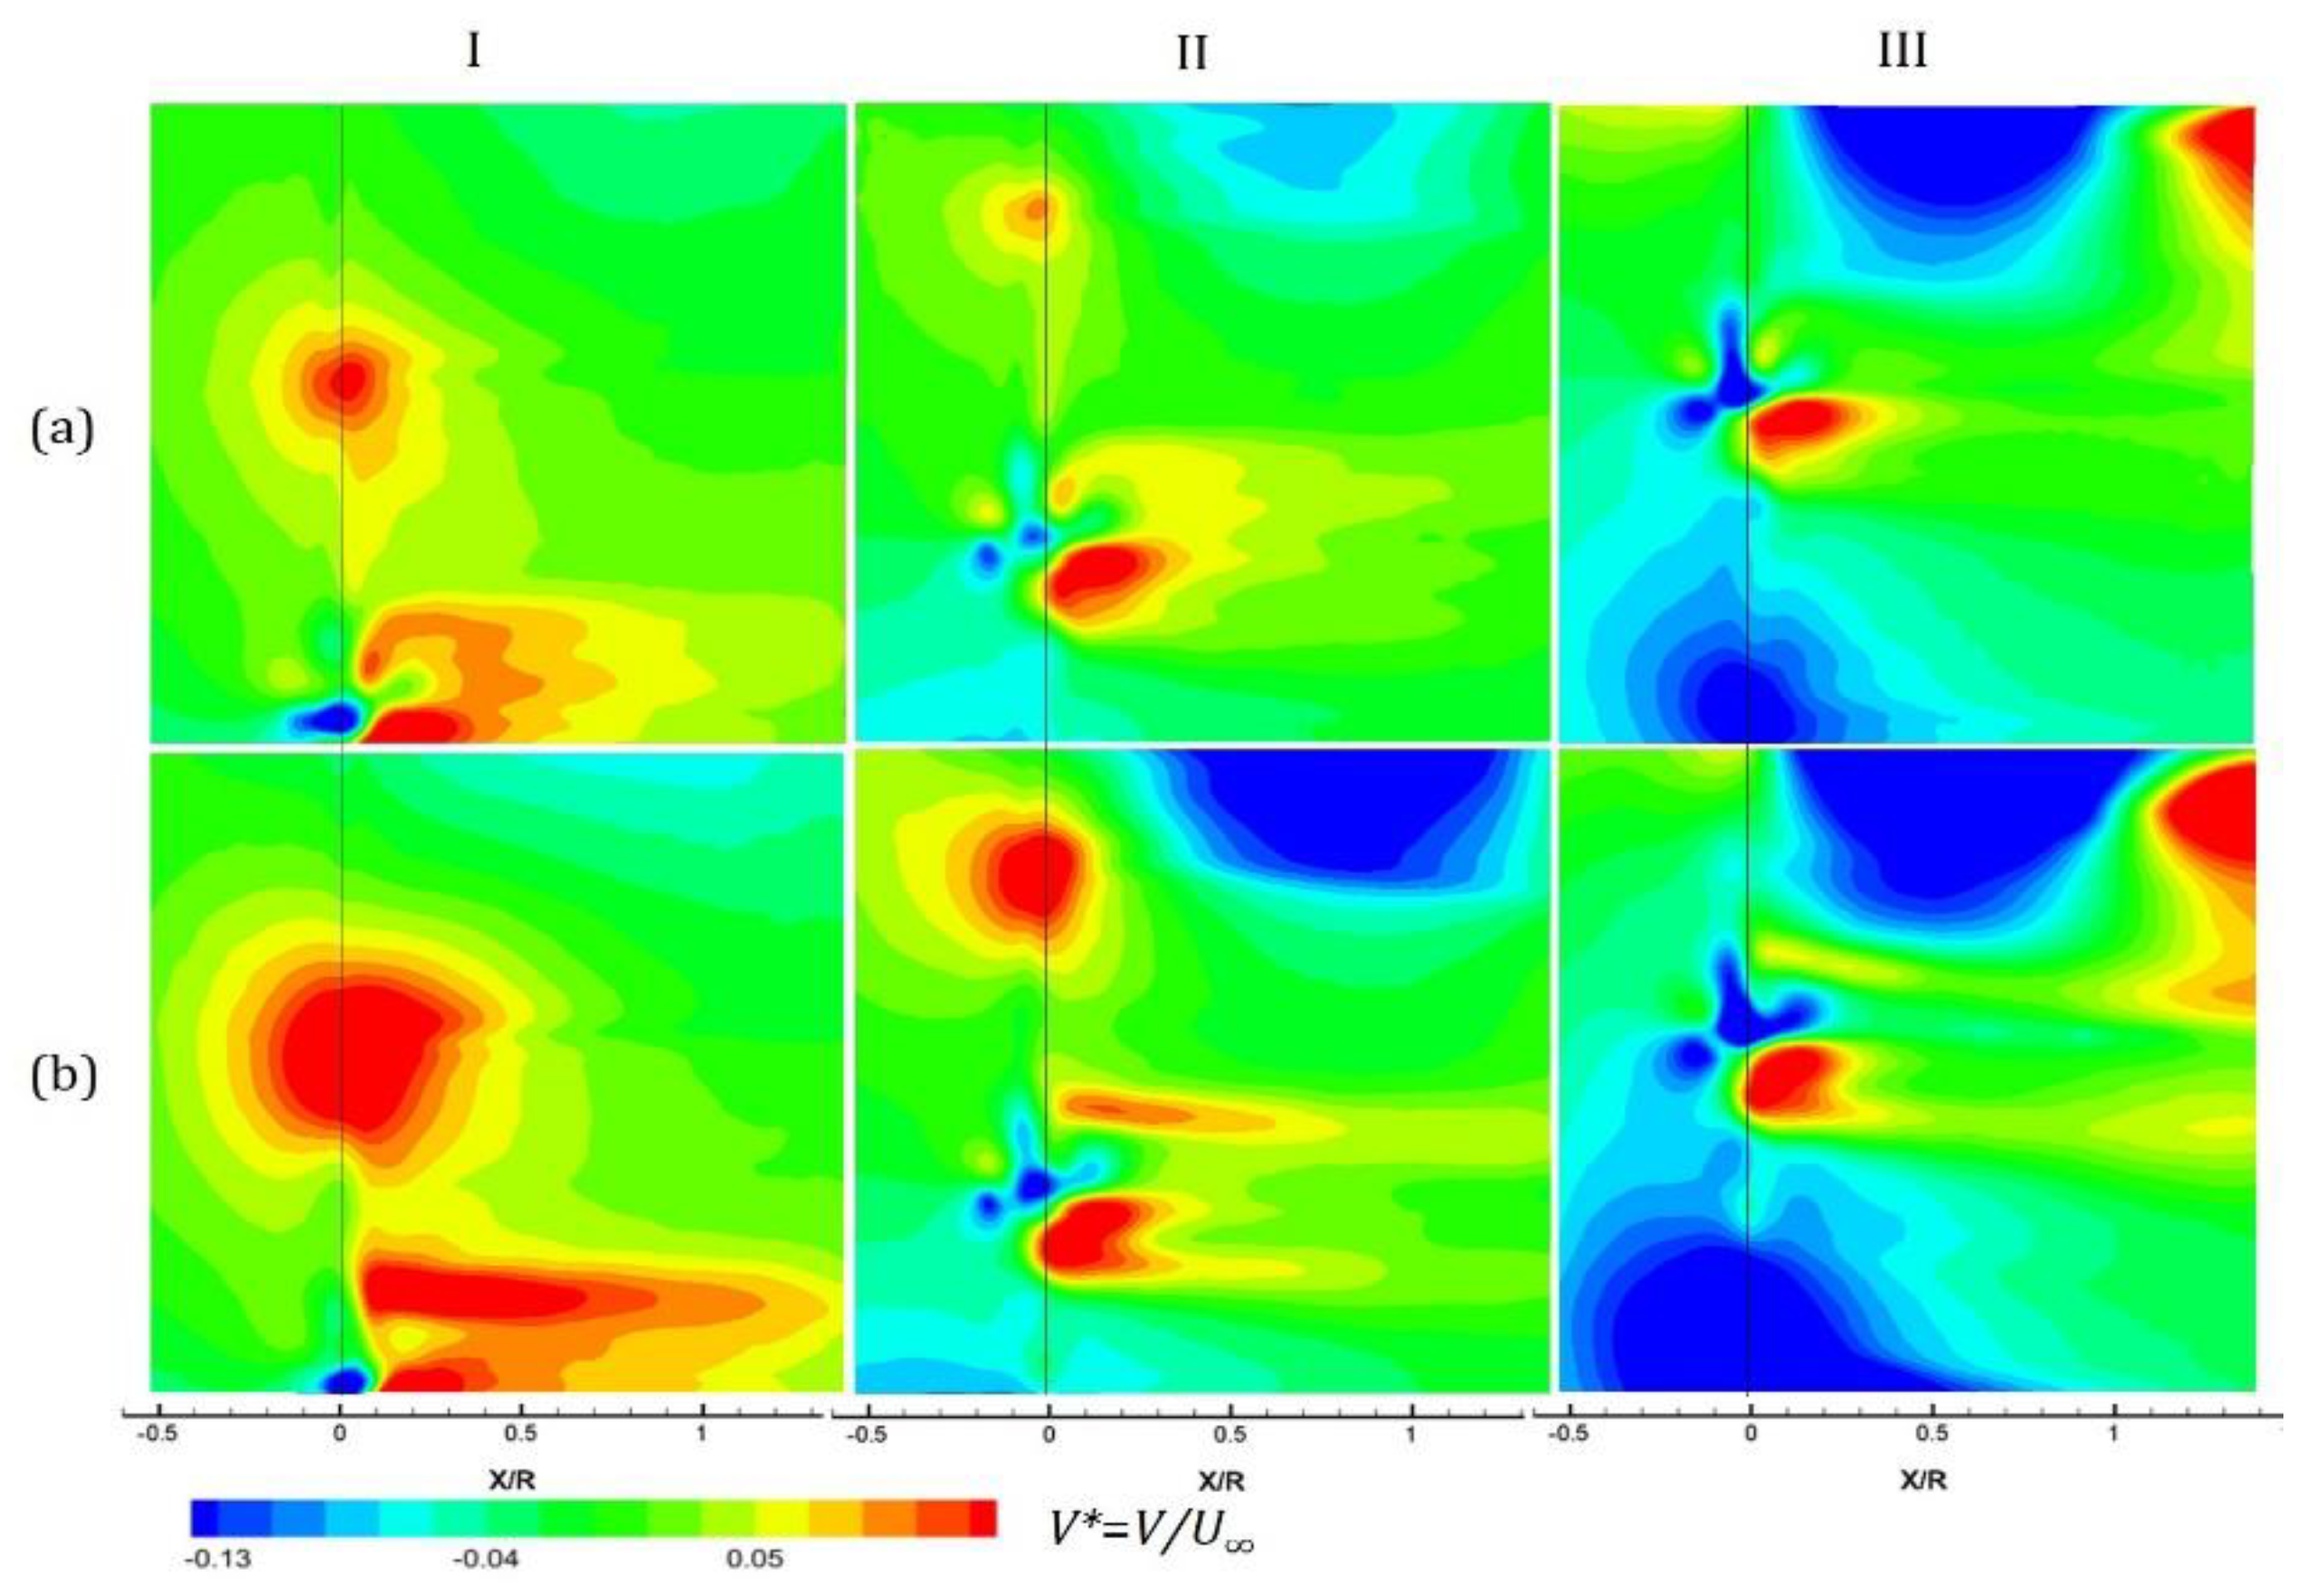
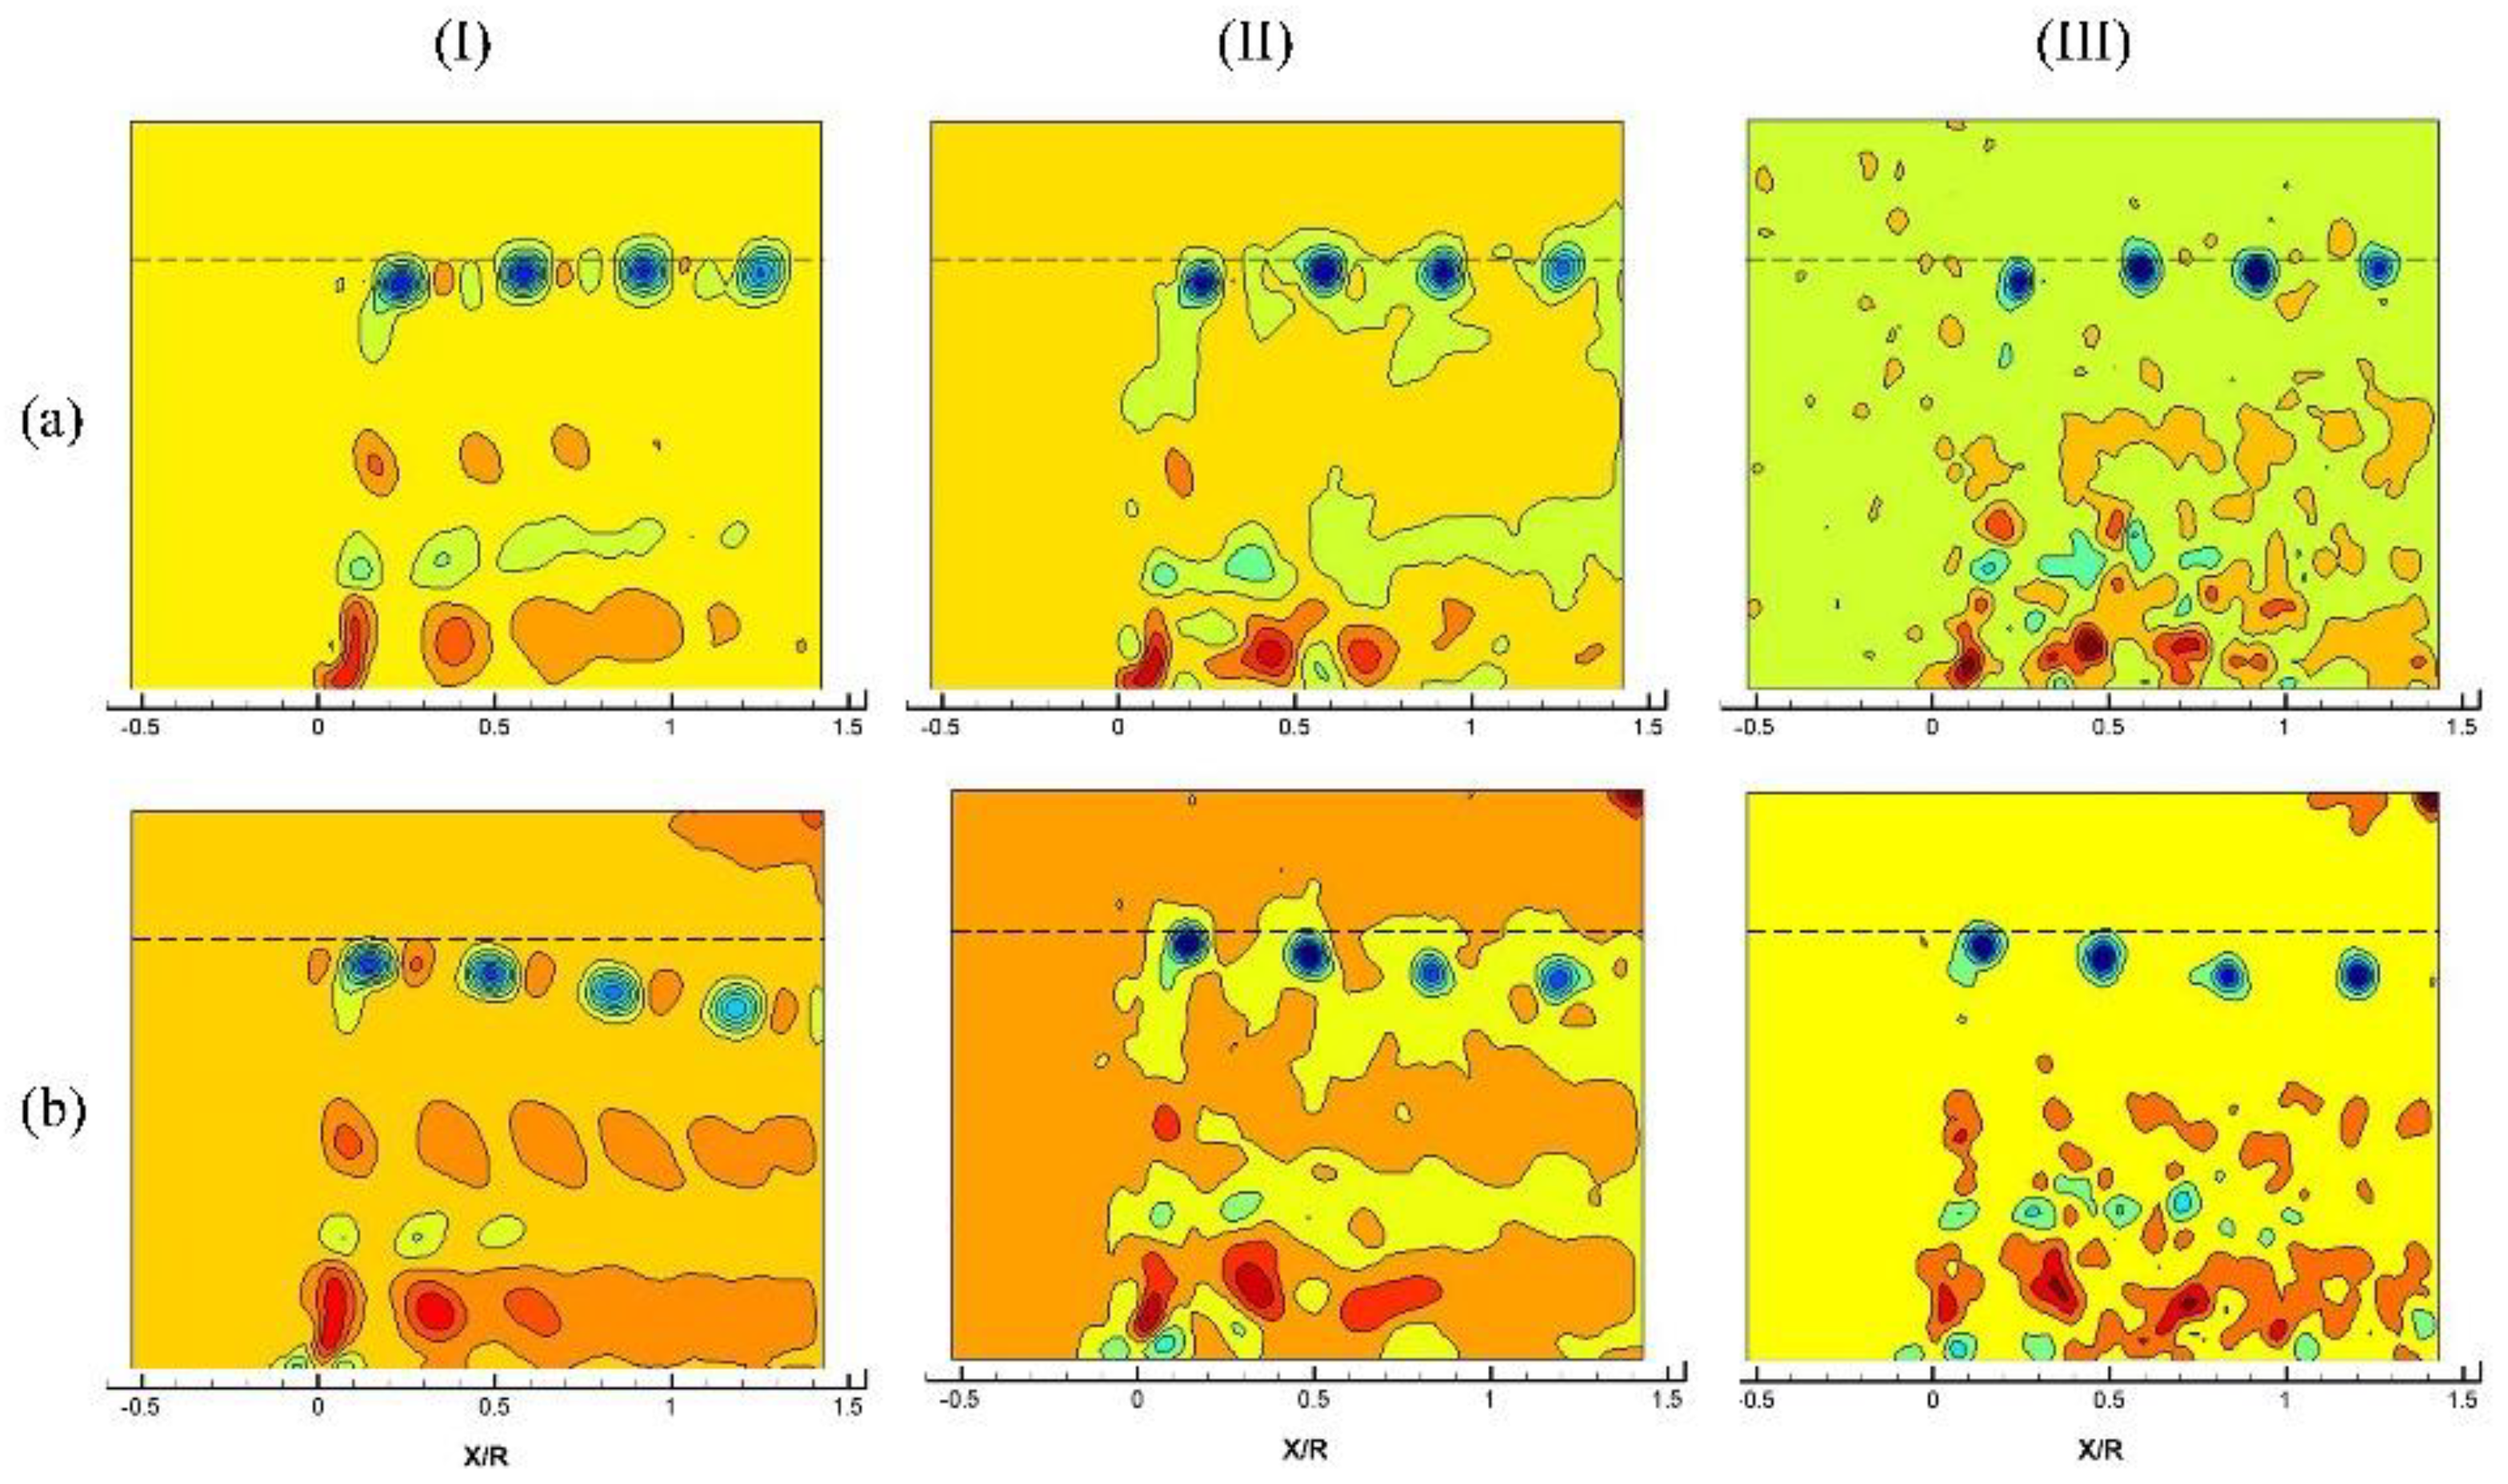
3.2.2. Contours of Vertical Velocity

Free surface deformation, which causes accelerated bypass flow, is also associated with a vertical (downward) fluid motion with an intensity which is expected to be a function of rotational speed and free surface proximity. To elucidate the effect of rotational speed and free surface proximity on vertical velocity variation, in Figure 4, we plotted contours of vertical velocity normalized by freestream velocity V* = V/U for the two rotational speeds: 180 RPM (row a), 270 RPM (row b), and three different tip clearance ratios ( δ h U = 0.55, 0.27, and 0.05). For all cases, regions of high vertical velocity were observed at blade tip locations near the turbine rotation plane. The intensity of this high vertical velocity region increased with increasing rotational speed—compare the first row (180 RPM) to the second row (270 RPM). Additional regions of high velocity were observed behind the hub, indicating flow deflection as it passed over the hub. In general, the lower submersion depth ( δ h U = 0.27, column II) resulted in lower vertical velocities compared to the case of the deeply submerged turbine ( δ h U = 0.55, column I). Moreover, for δ h U = 0.27, a region of negative localized vertical velocity was observed behind the turbine rotation plane whose intensity increased with an increase in rotational speed (column II). This region of downward velocity is indicative of bulk downward motion of fluid due to the free surface deformation that occurred at approximately 0.3 R ≤ x ≤1.3 R downstream of the turbine. This is indicative of the earlier mentioned radial compression of the upper wake leading to an asymmetric wake and a faster upper bypass region. Higher free surface proximity ( δ h U = 0.05) resulted in even stronger bulk downward motion of fluid leading to wake penetration, as shown in Figure 4, column III. Similar to the case with δ h U = 0.27, an increase in rotational speed resulted in higher downward velocity that spanned over a larger depth. In addition, in the case of ( δ h U = 0.05), the bulk downward motion in the near-wake region was followed by an upward-moving fluid, as elucidated in the upper right corner of Figure 4(a-III,b-III). This is indicative of free surface waves with small wavelengths and large amplitudes which were observed behind the turbine rotation plane during experimental runs.

3.2.3. Proper Orthogonal Decomposition Analysis for Free-Run PIV Data

To identify dominant energy-containing structures and their variation with depth of immersion, proper orthogonal decomposition (POD) was performed on the PIV data. Proper orthogonal decomposition expands a random function into a series of orthogonal deterministic functions with random coefficients that allow separating the deterministic part from the random part [32,33,34]. Eigenvalues and eigenfunctions are computed to understand the energy contributions of POD modes towards the total energy. During the current study, POD analysis was performed for the instantaneous PIV datasets, and the results are plotted in Figure 5 and Figure 6. Proper orthogonal decomposition analysis was performed for the near-wake region above the turbine axis (0 ≤ Y≤ 1.3 R) for δ h U = 0.55 and 0.27 only; the case with δ h U = 0.05 was excluded from POD analysis for which the PIV region of interest was limited to Y ≤ 0.9 R (see Figure 3). The color maps (not shown in the figure) for Figure 5 and Figure 6 are relative only, and the purpose of these figures was not to quantify but only to demonstrate the effect of free surface proximity on dominant flow structures. Figure 5 plots vorticity contours for first POD mode (column I), second POD mode (column II), and third POD mode (column III). The depth of immersion was found to have no effect on the energy distribution among the modes, with the first POD mode (most energetic mode) showing ~22% of total energy. Regions with high vorticity were observed along the helical tip vortex path and near the blade root–hub interface (root vortex). Additional vortical structures were observed at ~0.5 R, approximately at the location where regions II and III (refer to Figure 3) interact with each other.
For both depths of immersions, first, two modes were associated with four pairs of counter-rotating vortical structures along the tip vortex path, while the third mode exhibited eight pairs of vortical structures as shown in Figure 5. Comparison of vortex streaks in row a with row b clearly demonstrates the wake compression process for δ h U = 0.27. In Figure 6, the data from POD analysis were processed to reconstruct vorticity contours with the first 5 (column I), first 50 (column II), and all 2000 (column III) POD modes. This corresponds to 50%, 75%, and 100% of total energy, respectively. The tip vortex path was associated with clockwise rotating vortical structures (blue), while the wake core consisted of counter-clockwise rotating structures (red). Further, the case with δ h U   = 0.27 was found to exhibit stronger wake core (counter-clockwise rotating region in Figure 6b) compared to the δ h U = 0.55 case.

3.3. Variation of Flow Velocities Along Wake Propagation Direction (Along Constant Y)

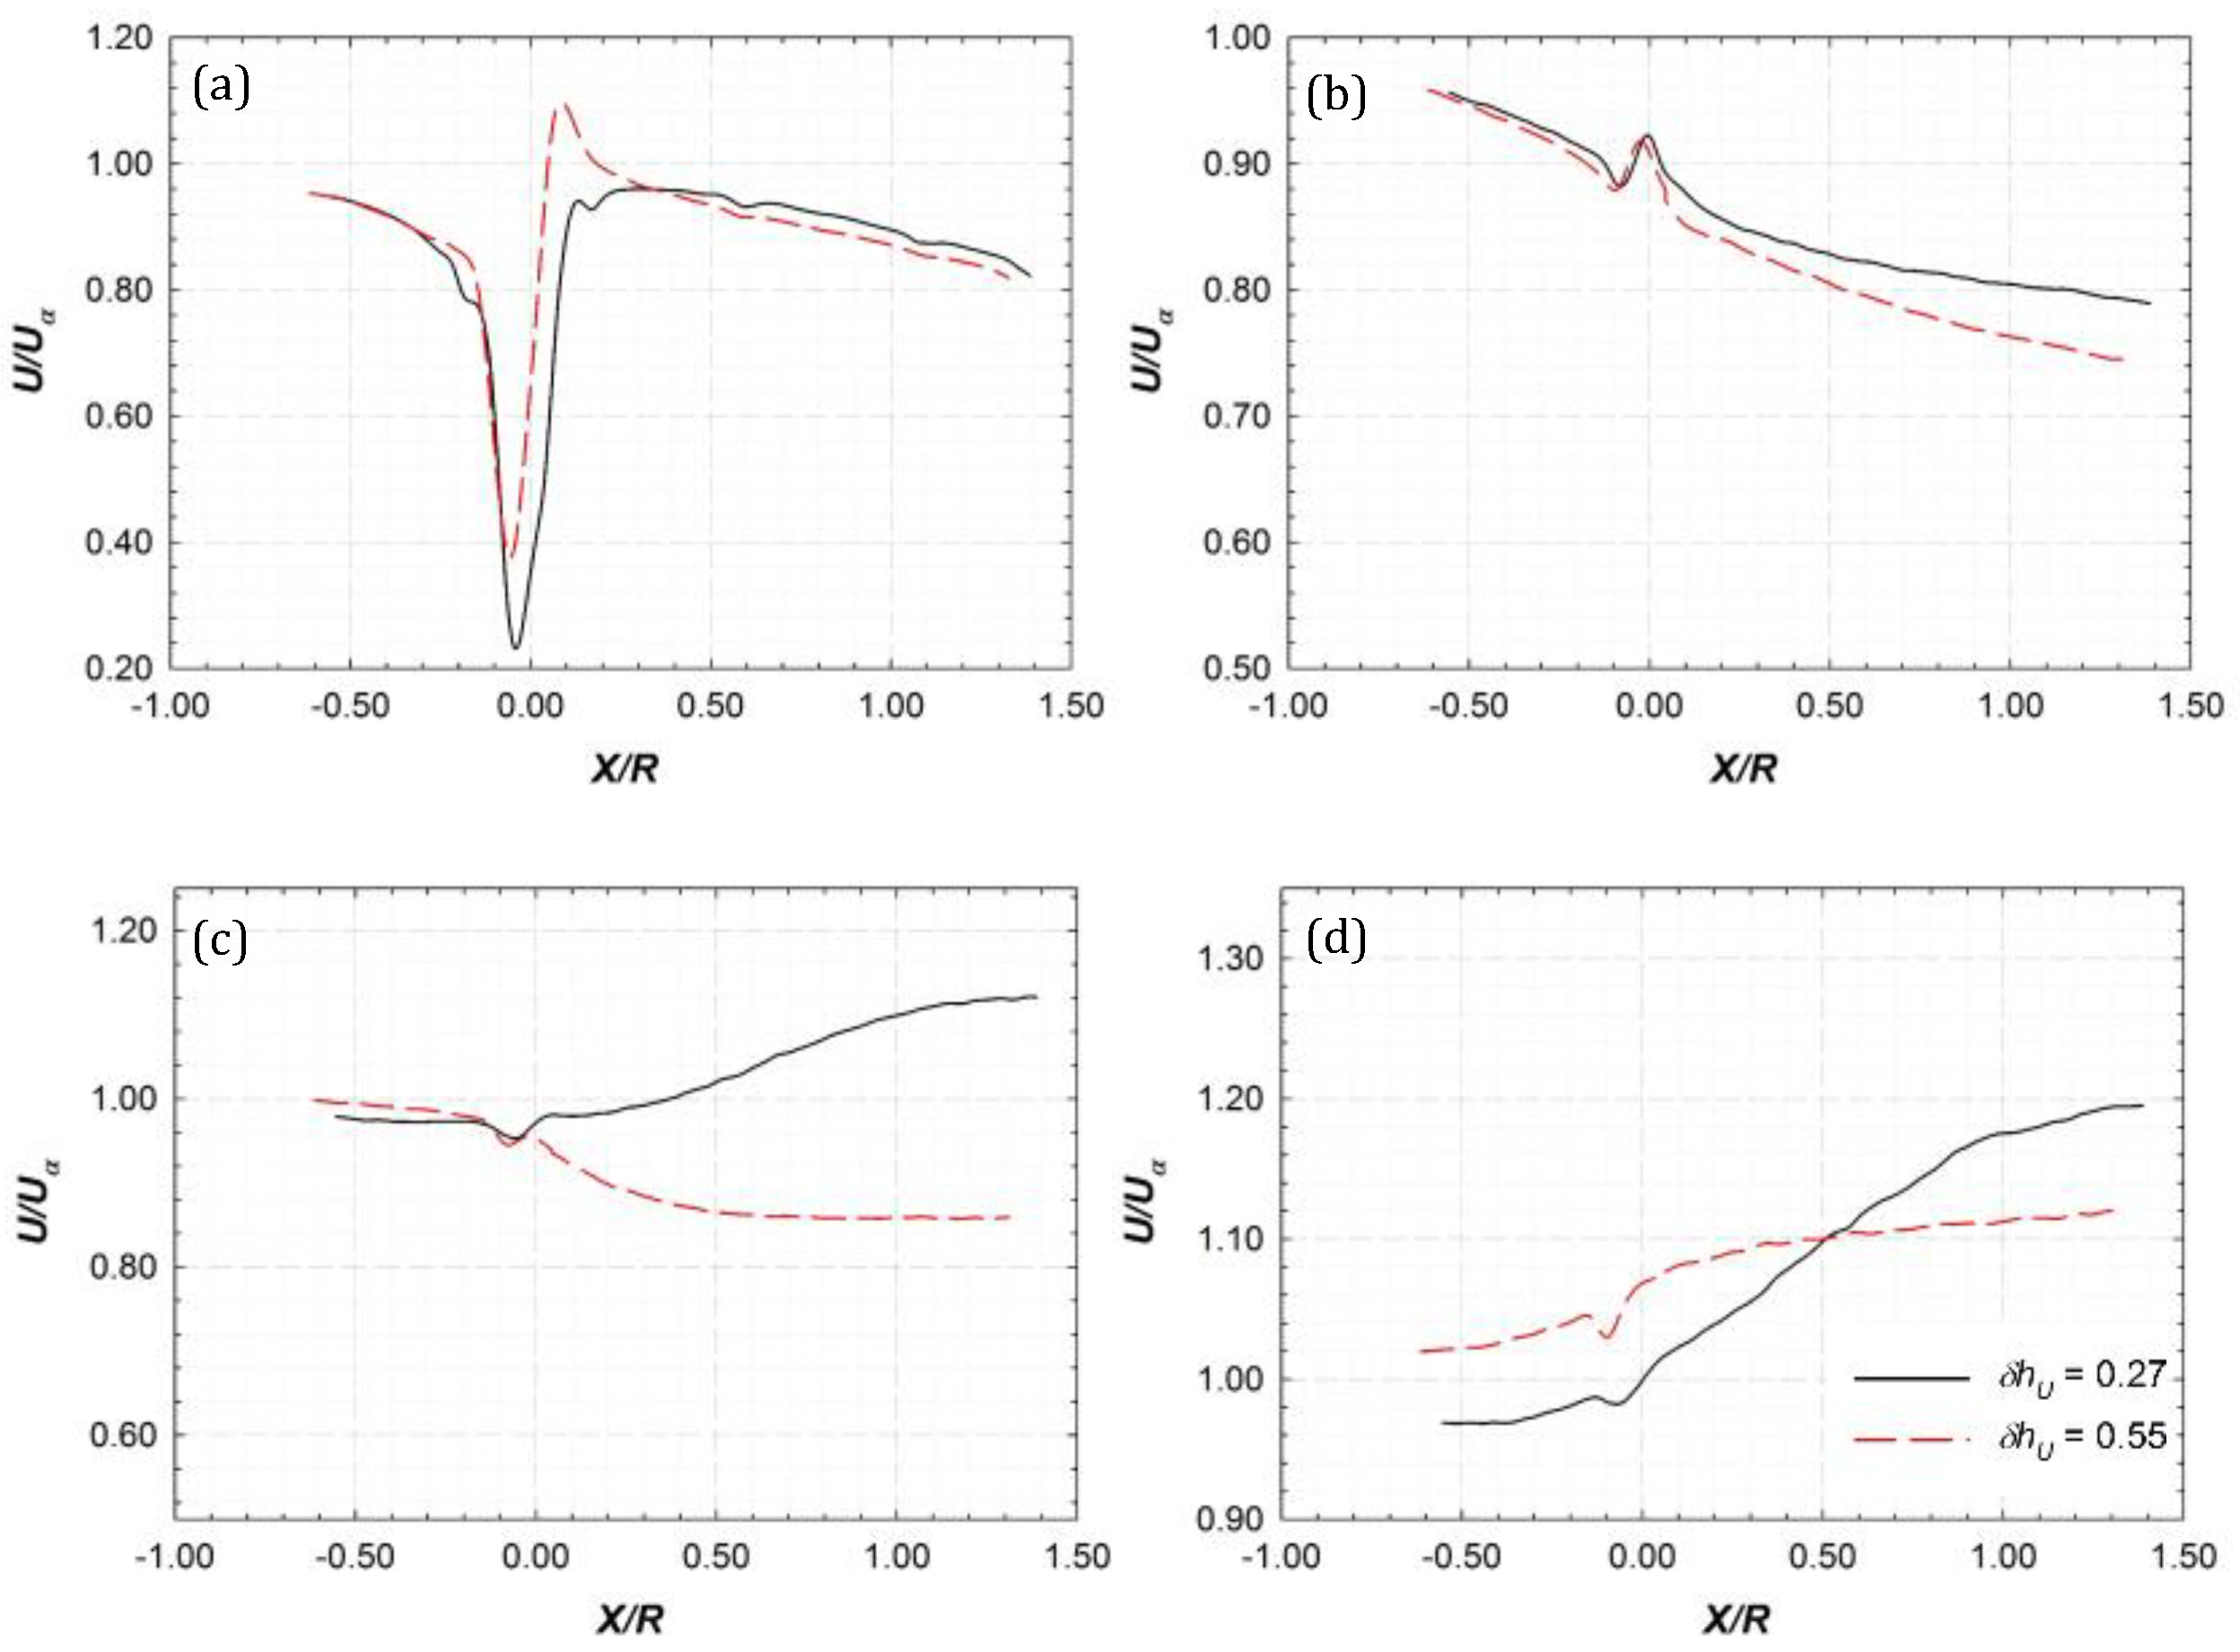
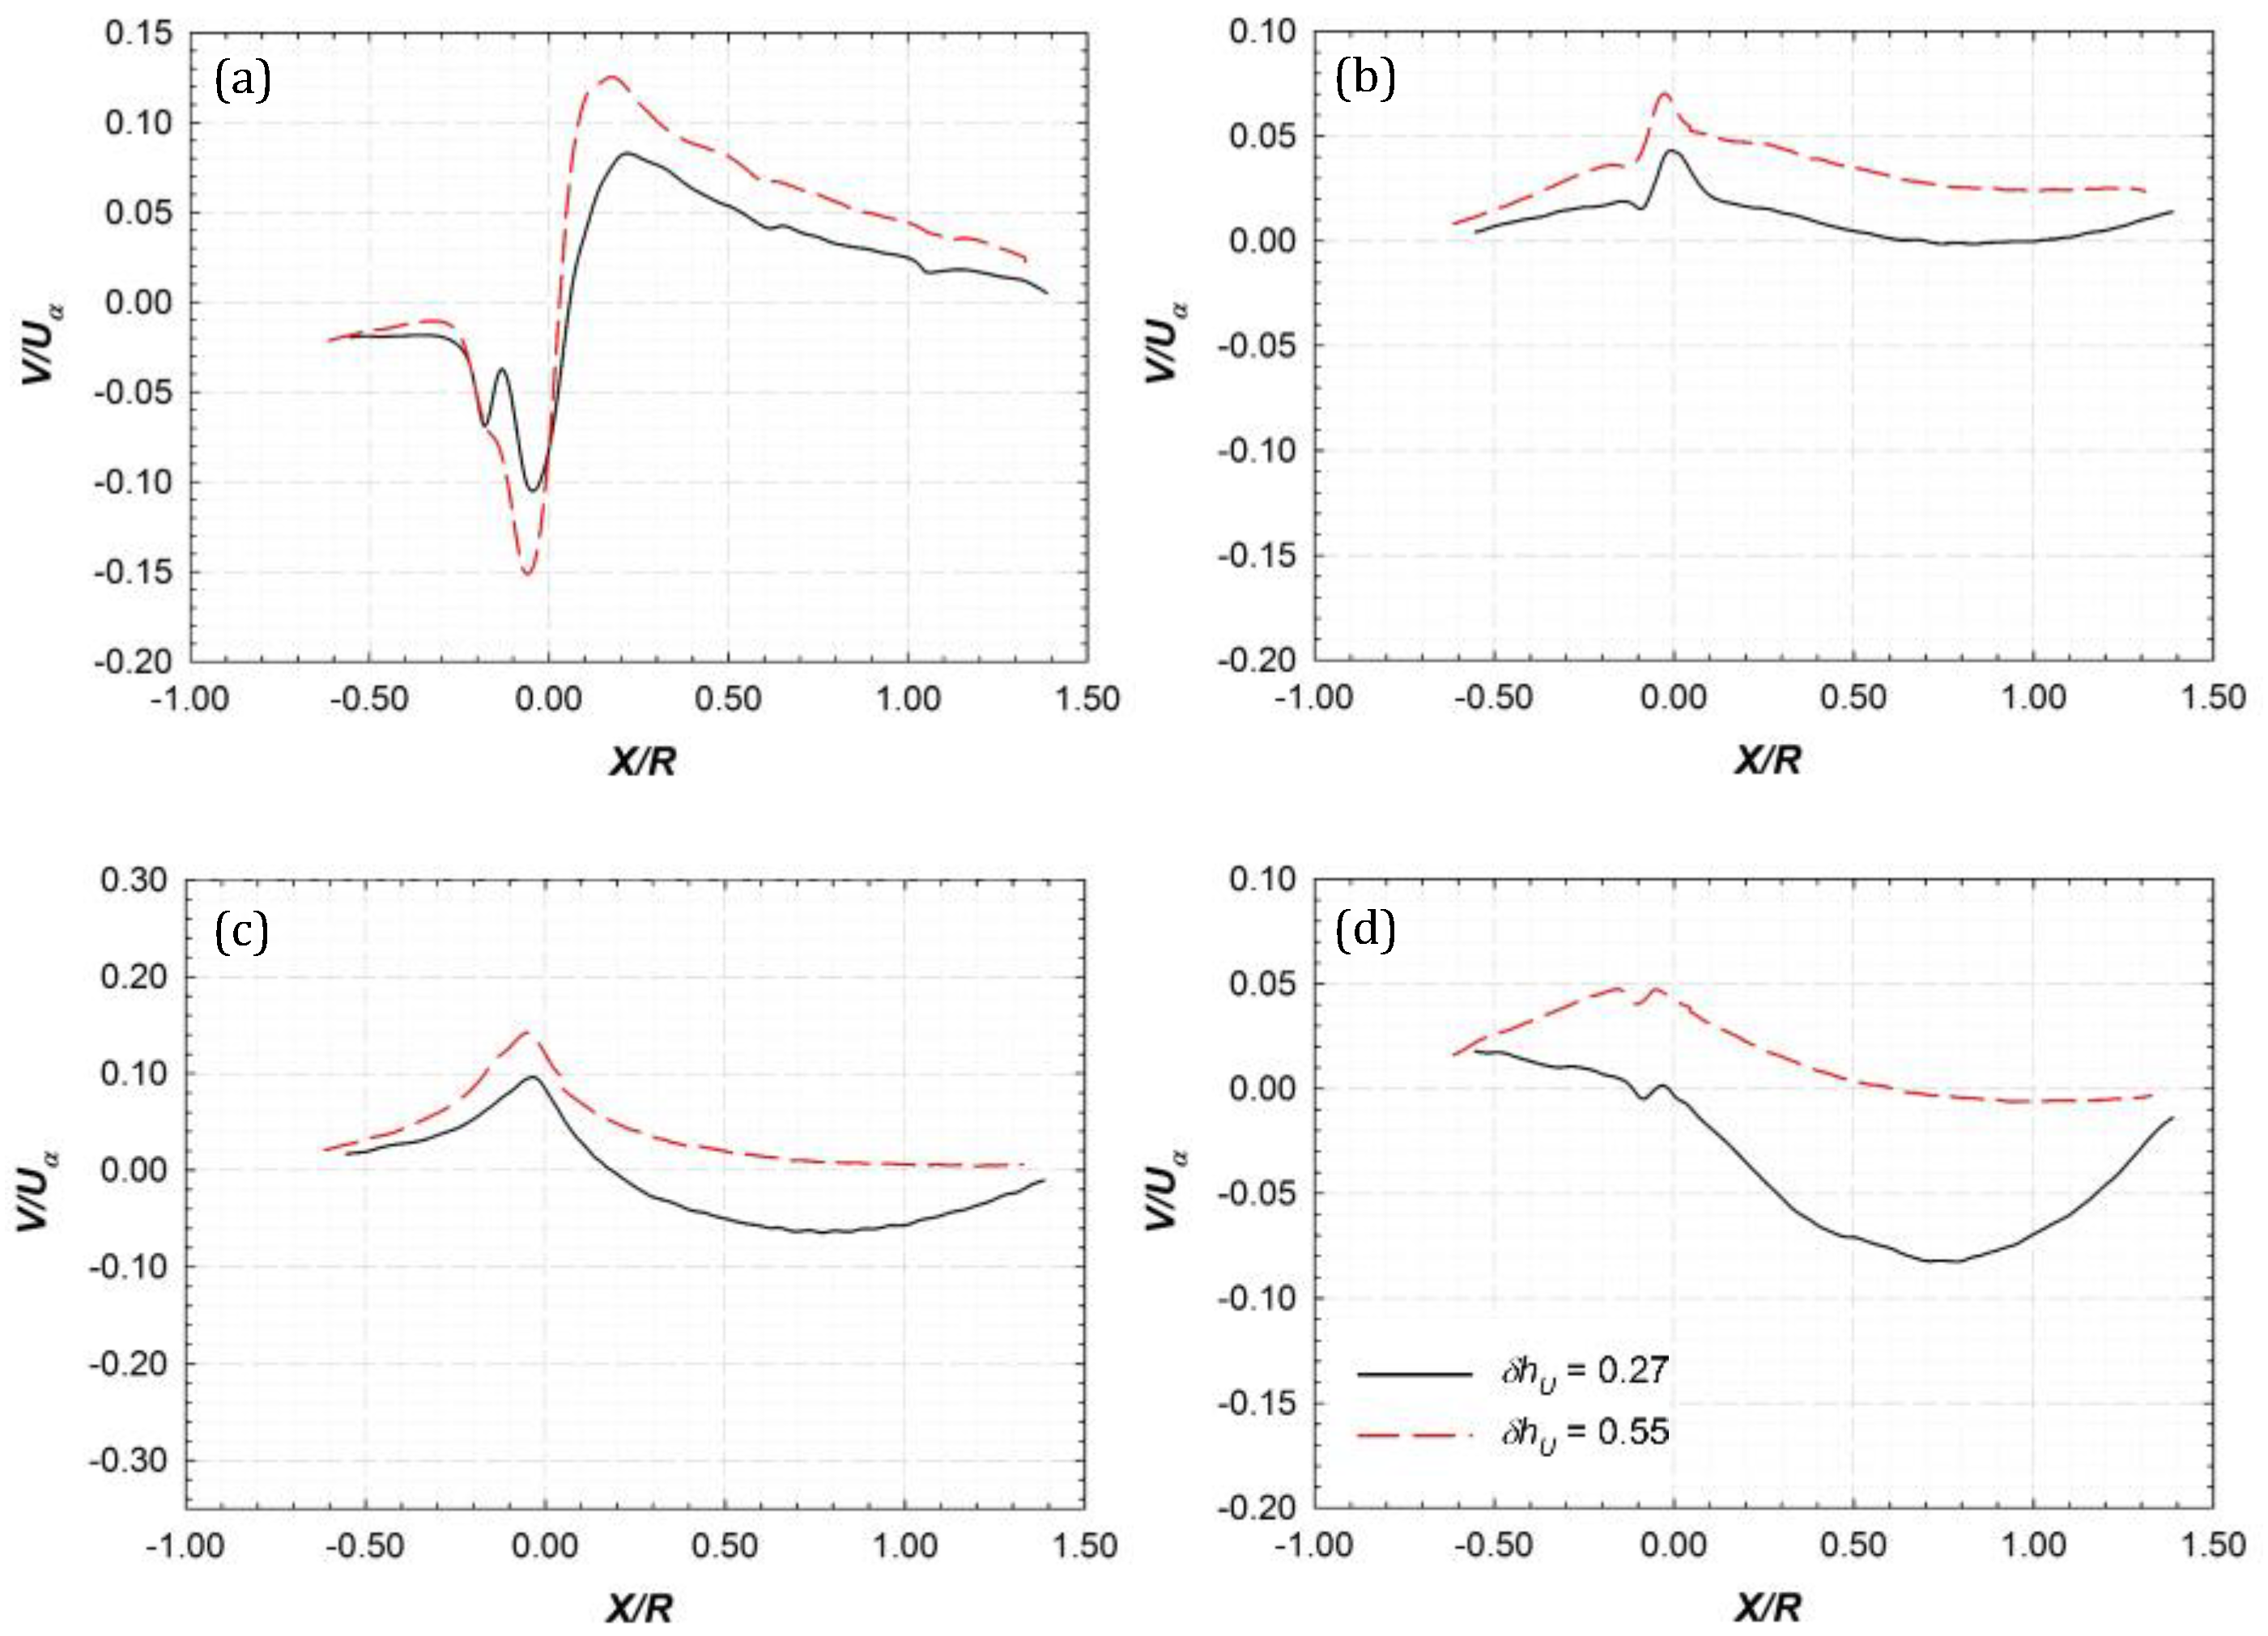
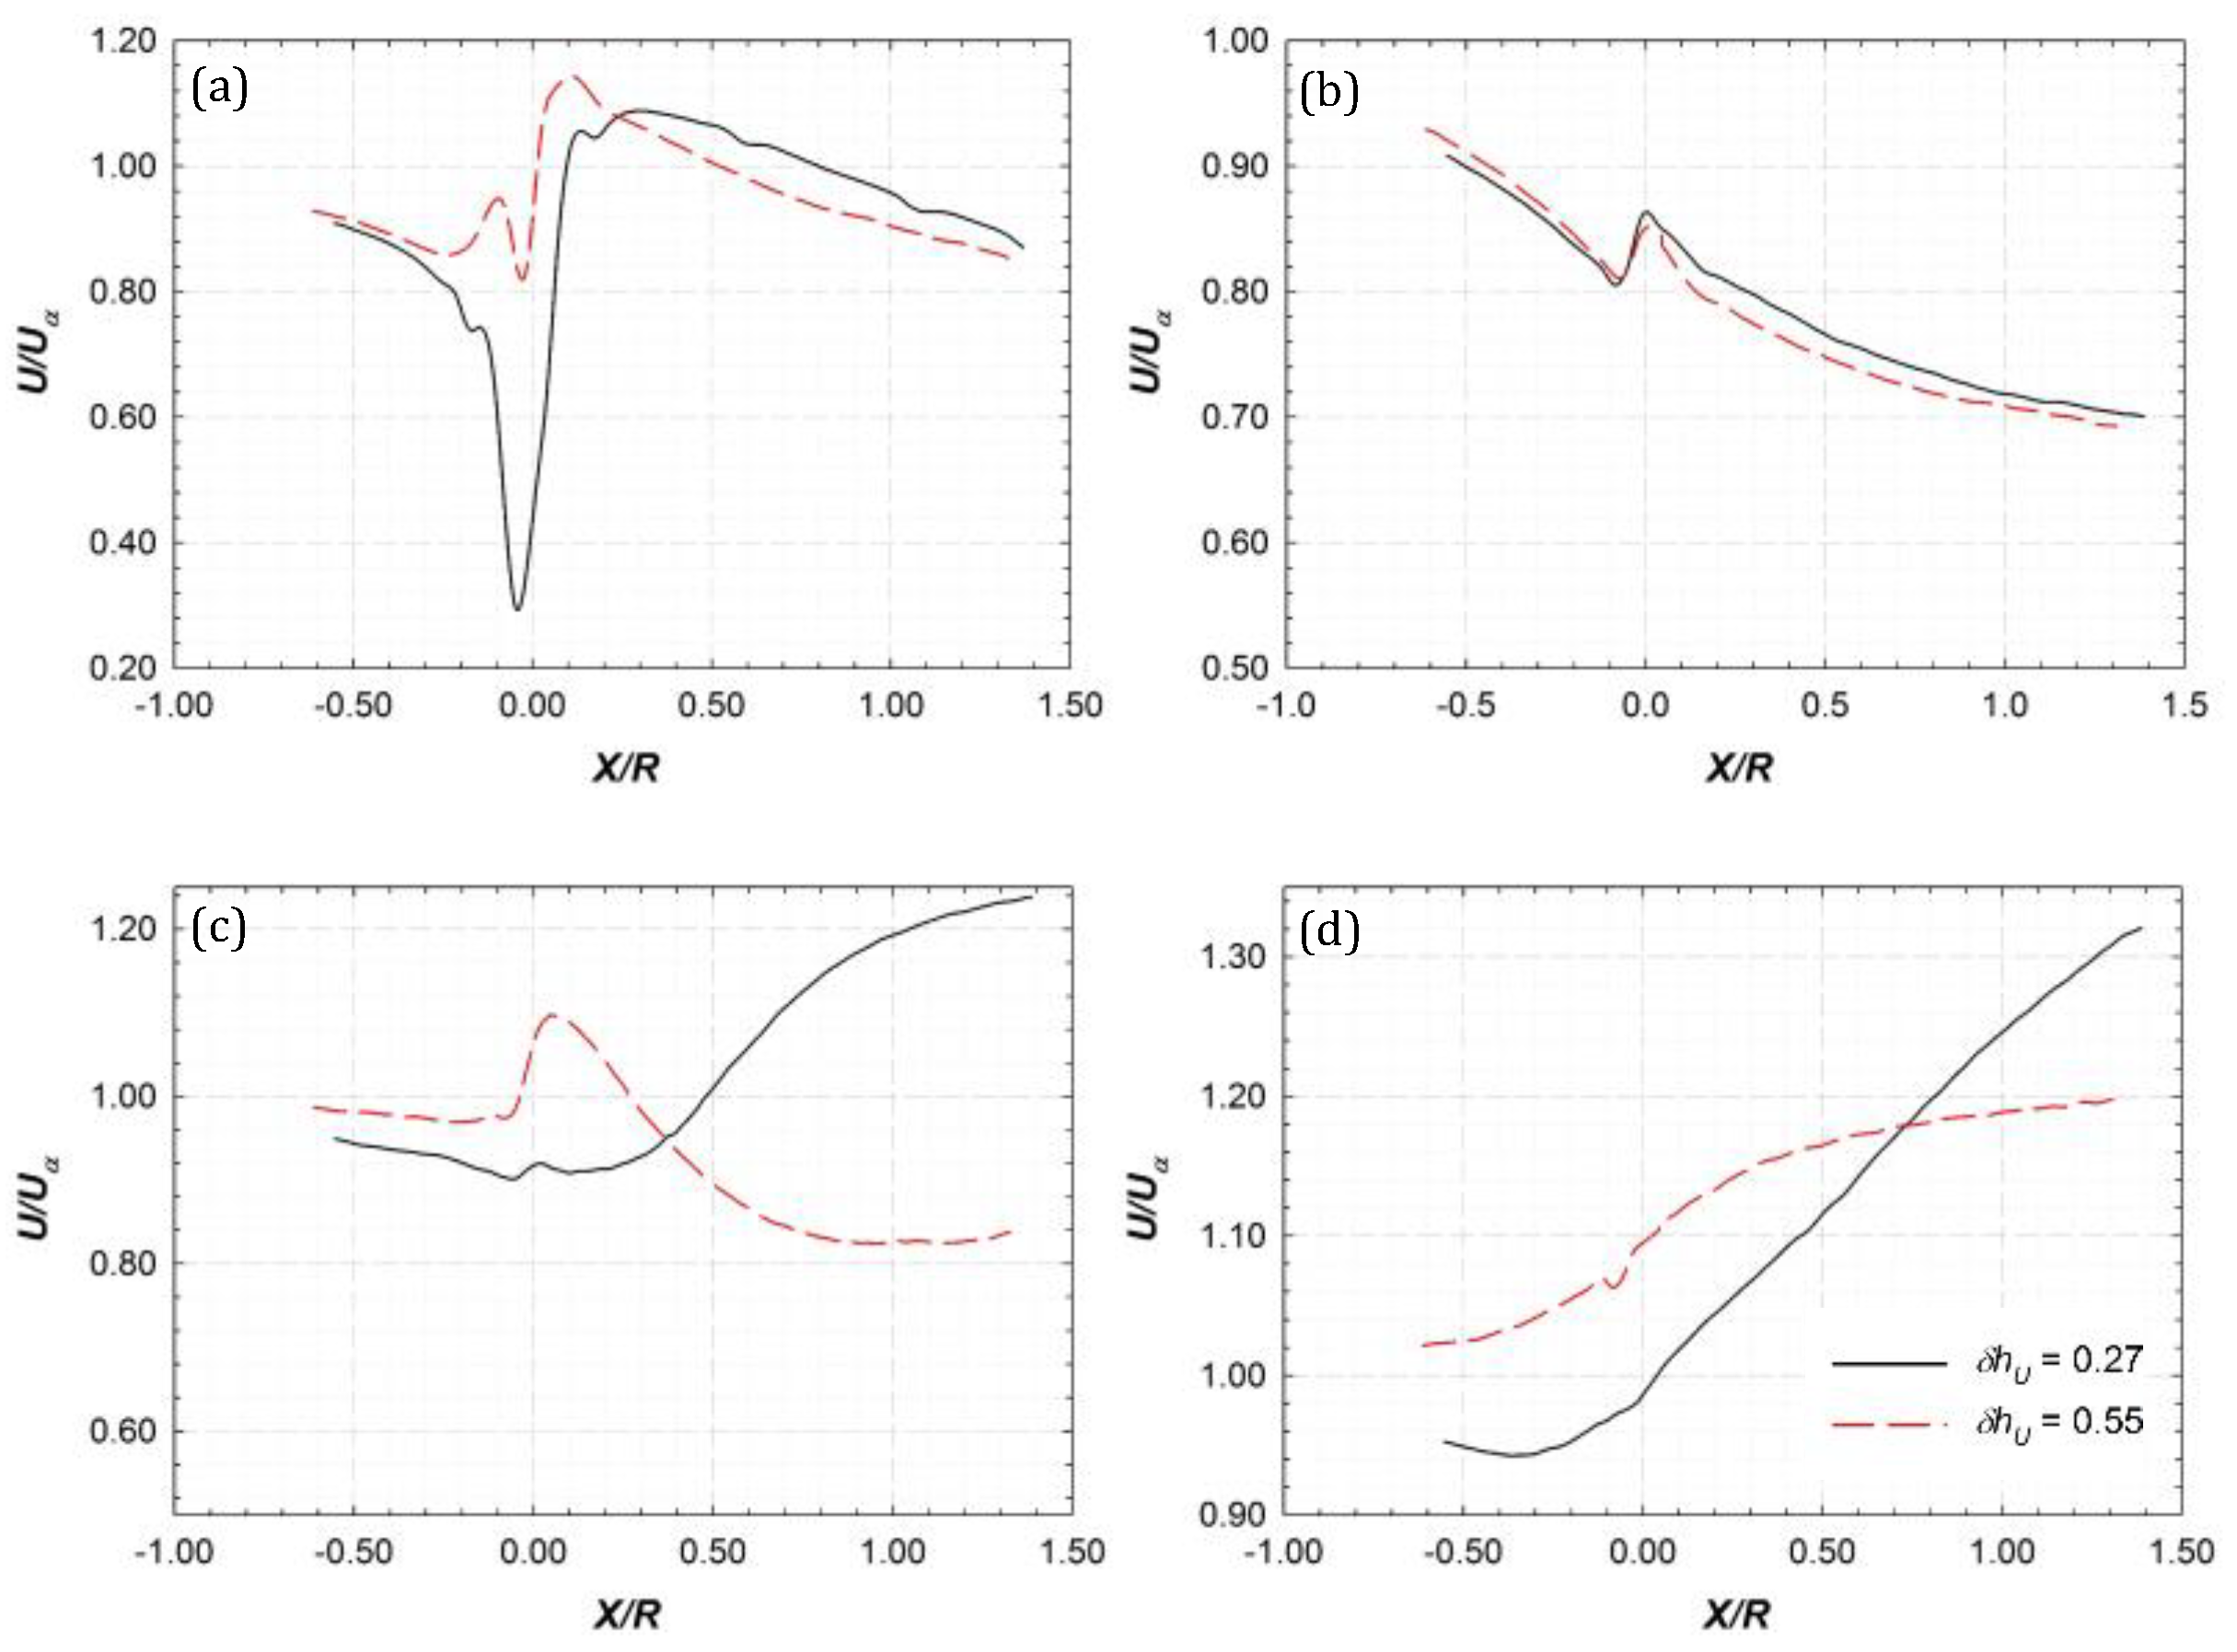
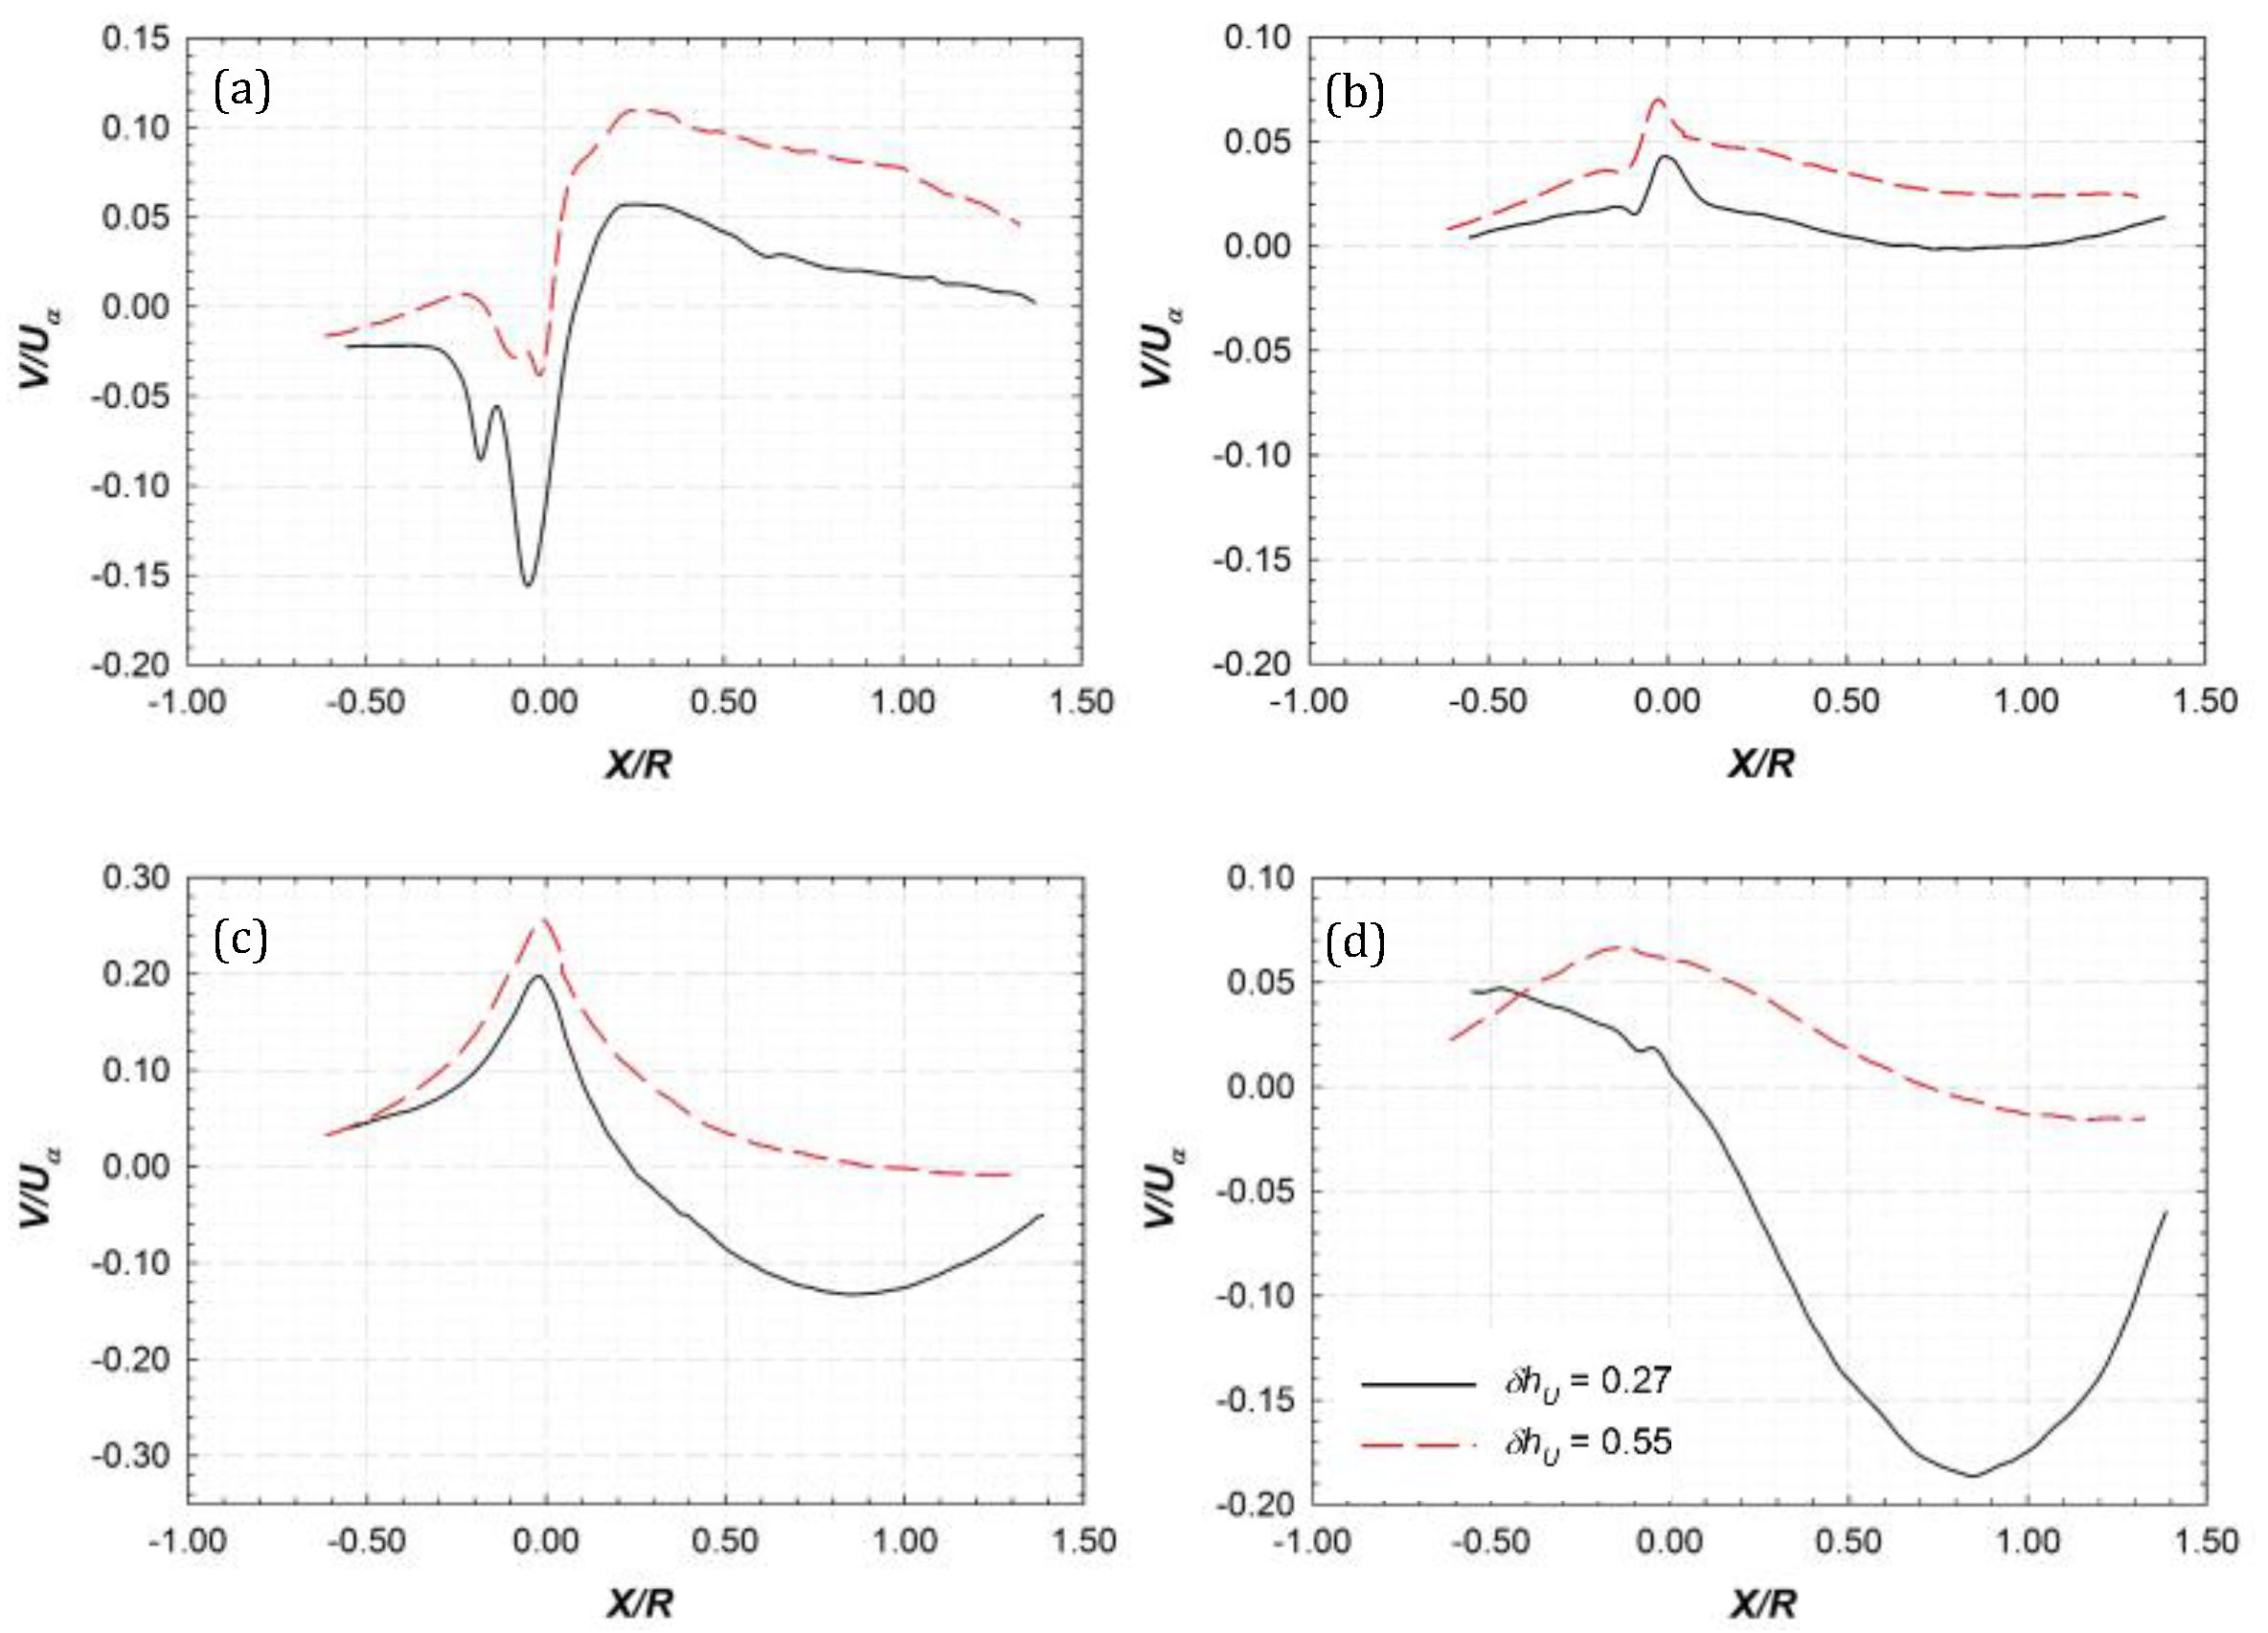
3.3.1. Profiles of Streamwise and Vertical Velocity

To quantify the near wake development associated with performance improvement (from a turbine immersion depth corresponding to δ h U = 0.55 to δ h U = 0.27), profiles of normalized stream-wise and vertical velocities are plotted in Figure 7 and Figure 8 for the rotational speed of 180 RPM. Profiles are plotted along horizontal lines at different heights measured from the turbine axis that corresponds to Y/R = 0, 0.5, 1, and 1.3. Data were extracted from ensemble-averaged PIV images for respective experimental runs. For the low rotational speed of 180 RPM, no significant variation was observed between δ h U = 0.55 and 0.27 cases at hub height (Y/R = 0), except for the near-hub region (−0.3 < X/R < 0.3), in which the δ h U = 0.55 case showed consistently higher stream-wise velocities than the δ h U = 0.27 case (Figure 7). A spike in U at X/R =~ 0.15 corresponded to a high-velocity region that developed behind the hub due to the flow acceleration that occurred around the hub (see Figure 7a). At Y/R = 0.5 (Figure 7b), stream-wise velocity for both the δ h U = 0.55 and 0.27 cases showed similar trends up to X/R of 0.15, beyond which, higher velocities were observed for the δ h U = 0.27 case. An interesting phenomenon was observed at Y/R = 1, which elucidated wake compression and faster bypass velocity behavior (Figure 7c). At location X = 1.4 R downstream from the turbine, the case with δ h U = 0.55 exhibited normalized velocity, U* = 0.87.
However, at the same location, the δ h U = 0.27 case showed a significantly higher (normalized) flow velocity of 1.12, which implies that fluid in this region was moving faster than the incoming flow and was not a part of the wake but of the upper bypass flow. The flow deceleration for the case of δ h U = 0.55 tended to asymptote at X/R of 0.7, while flow acceleration for the δ h U = 0.27 case continued beyond X/R = 1.4; however, this occurred with a progressively lower slope. Further, away from the turbine axis, at Y/R = 1.3 (Figure 7d), the flow belonged to the upper bypass region for both δ h U = 0.55 and 0.27 cases. At this elevation, the δ h U = 0.55 case exhibited a higher flow velocity than that of the δ h U = 0.27 case up to X/R =~ 0.5, beyond which a faster bypass region was observed for the δ h U = 0.27 case. The incoming flow behavior at the chosen elevations is also worth noting. The incoming flow (at X/R = −0.5) for both depths was of the same magnitude at Y/R = 0 and 0.5, but in regions away from the turbine axis, faster incoming flow was observed for the δ h U = 0.55 case. To understand the effect of free surface proximity on vertical velocities (signifying free surface drop) in the near-wake region, Figure 8 plots the downstream evolution profiles of normalized vertical velocities at various depths of immersions for the rotational speed of 180 RPM. Vertical velocities in the +XY quadrant, (the laser sheet is in a plane parallel to the XY plane but offset from the origin at Z   0.1 R) were expected to be positive due to the clockwise rotational motion of the turbine. For the wake region, at a constant (X,Y) position, a high value of vertical velocity indicated faster rotating fluid signifying wake expansion process. For all Y locations, the δ h U = 0.55 case showed higher vertical velocities compared to the δ h U = 0.27 case. Higher vertical velocities of the δ h U = 0.55 case indicated a faster rotating and expanding wake region compared to the δ h U = 0.27 case. The vertical velocity profiles at Y/R = 1 indicated the vertical transfer of momentum flux between the upper wake and upper bypass regions. At this height, for the δ h U = 0.27 case, a downward vertical velocity was observed at X/R ≥ 0.2 behind the turbine, which reached a minimum (−6.5U) at X/R ~0.8 downstream of the turbine rotation plane. This downward motion caused wake compression yielding higher stream-wise velocities for X/R = 1 in Figure 7. At Y/R = 1.3, even higher downward velocities (up to −8.2U) were observed at a similar downstream distance of X/R = 0.8. This downward flux from the upper bypass to wake region will result in faster wake recovery and is a very important consideration in designing a farm layout.

3.3.2. Effect of Rotational Speed on Velocity Profiles

As demonstrated in Section 3.3.1, wake flow exhibited significant variations in flow velocities with a depth of immersion, especially in the regions at the interface of upper wake and upper bypass (Y/R = 1, 1.3). In this sub-section, we discuss the effect of rotational speed on flow velocities in this interfacial region that showed significant effects of free surface proximity. The following discussion compares respective profiles for the 180 RPM (Figure 7 and Figure 8) and 270 RPM (Figure 9 and Figure 10) conditions.
For the δ h U = 0.55 case, higher rotational speed resulted in a slower wake at Y/R = 1 with stream-wise velocity ~5% lower than the 180 RPM case (compare Figure 7c and Figure 9c). However, for a turbine operating at the δ h U = 0.27 case, increasing rotational speed to 270 RPM led up to a 6% faster flow (at Y/R = 1) compared to the 180 RPM case. Comparing Figure 8c and Figure 10c shows that the vertical velocity profiles at Y/R = 1 exhibit maxima near X = 0 similar to the 180 RPM case; however, maximum value increased from 0.095 (Figure 8c) to 0.2 (Figure 10c) for the δ h U = 0.27 case and 0.14 (Figure 8c) to 0.24 (Figure 10a) for the δ h U = 0.55 case (higher % change for δ h U = 0.27 depth). The minima of the vertical profile line for Y/R = 1 was observed at X/R = 0.8 (Figure 10c) with a magnitude −0.13 compared to −0.06 at X = 0.74 R of the 180 RPM case (Figure 8c). Further away from the rotational axis (Y/R = 1.3), a faster-rotating turbine led to reduced stream-wise velocities for both depths (compare Figure 7d and Figure 9d) and higher vertical (downward) velocities for the δ h U = 0.27 case (compare Figure 8d and Figure 10d). While no significant variation was observed for the δ h U = 0.55 case, minima for normalized vertical velocity changed from −0.085 to −0.185 for the δ h U = 0.27 case. This implies that higher rotational speeds lead to higher downward velocities, meaning higher wake compression effects.

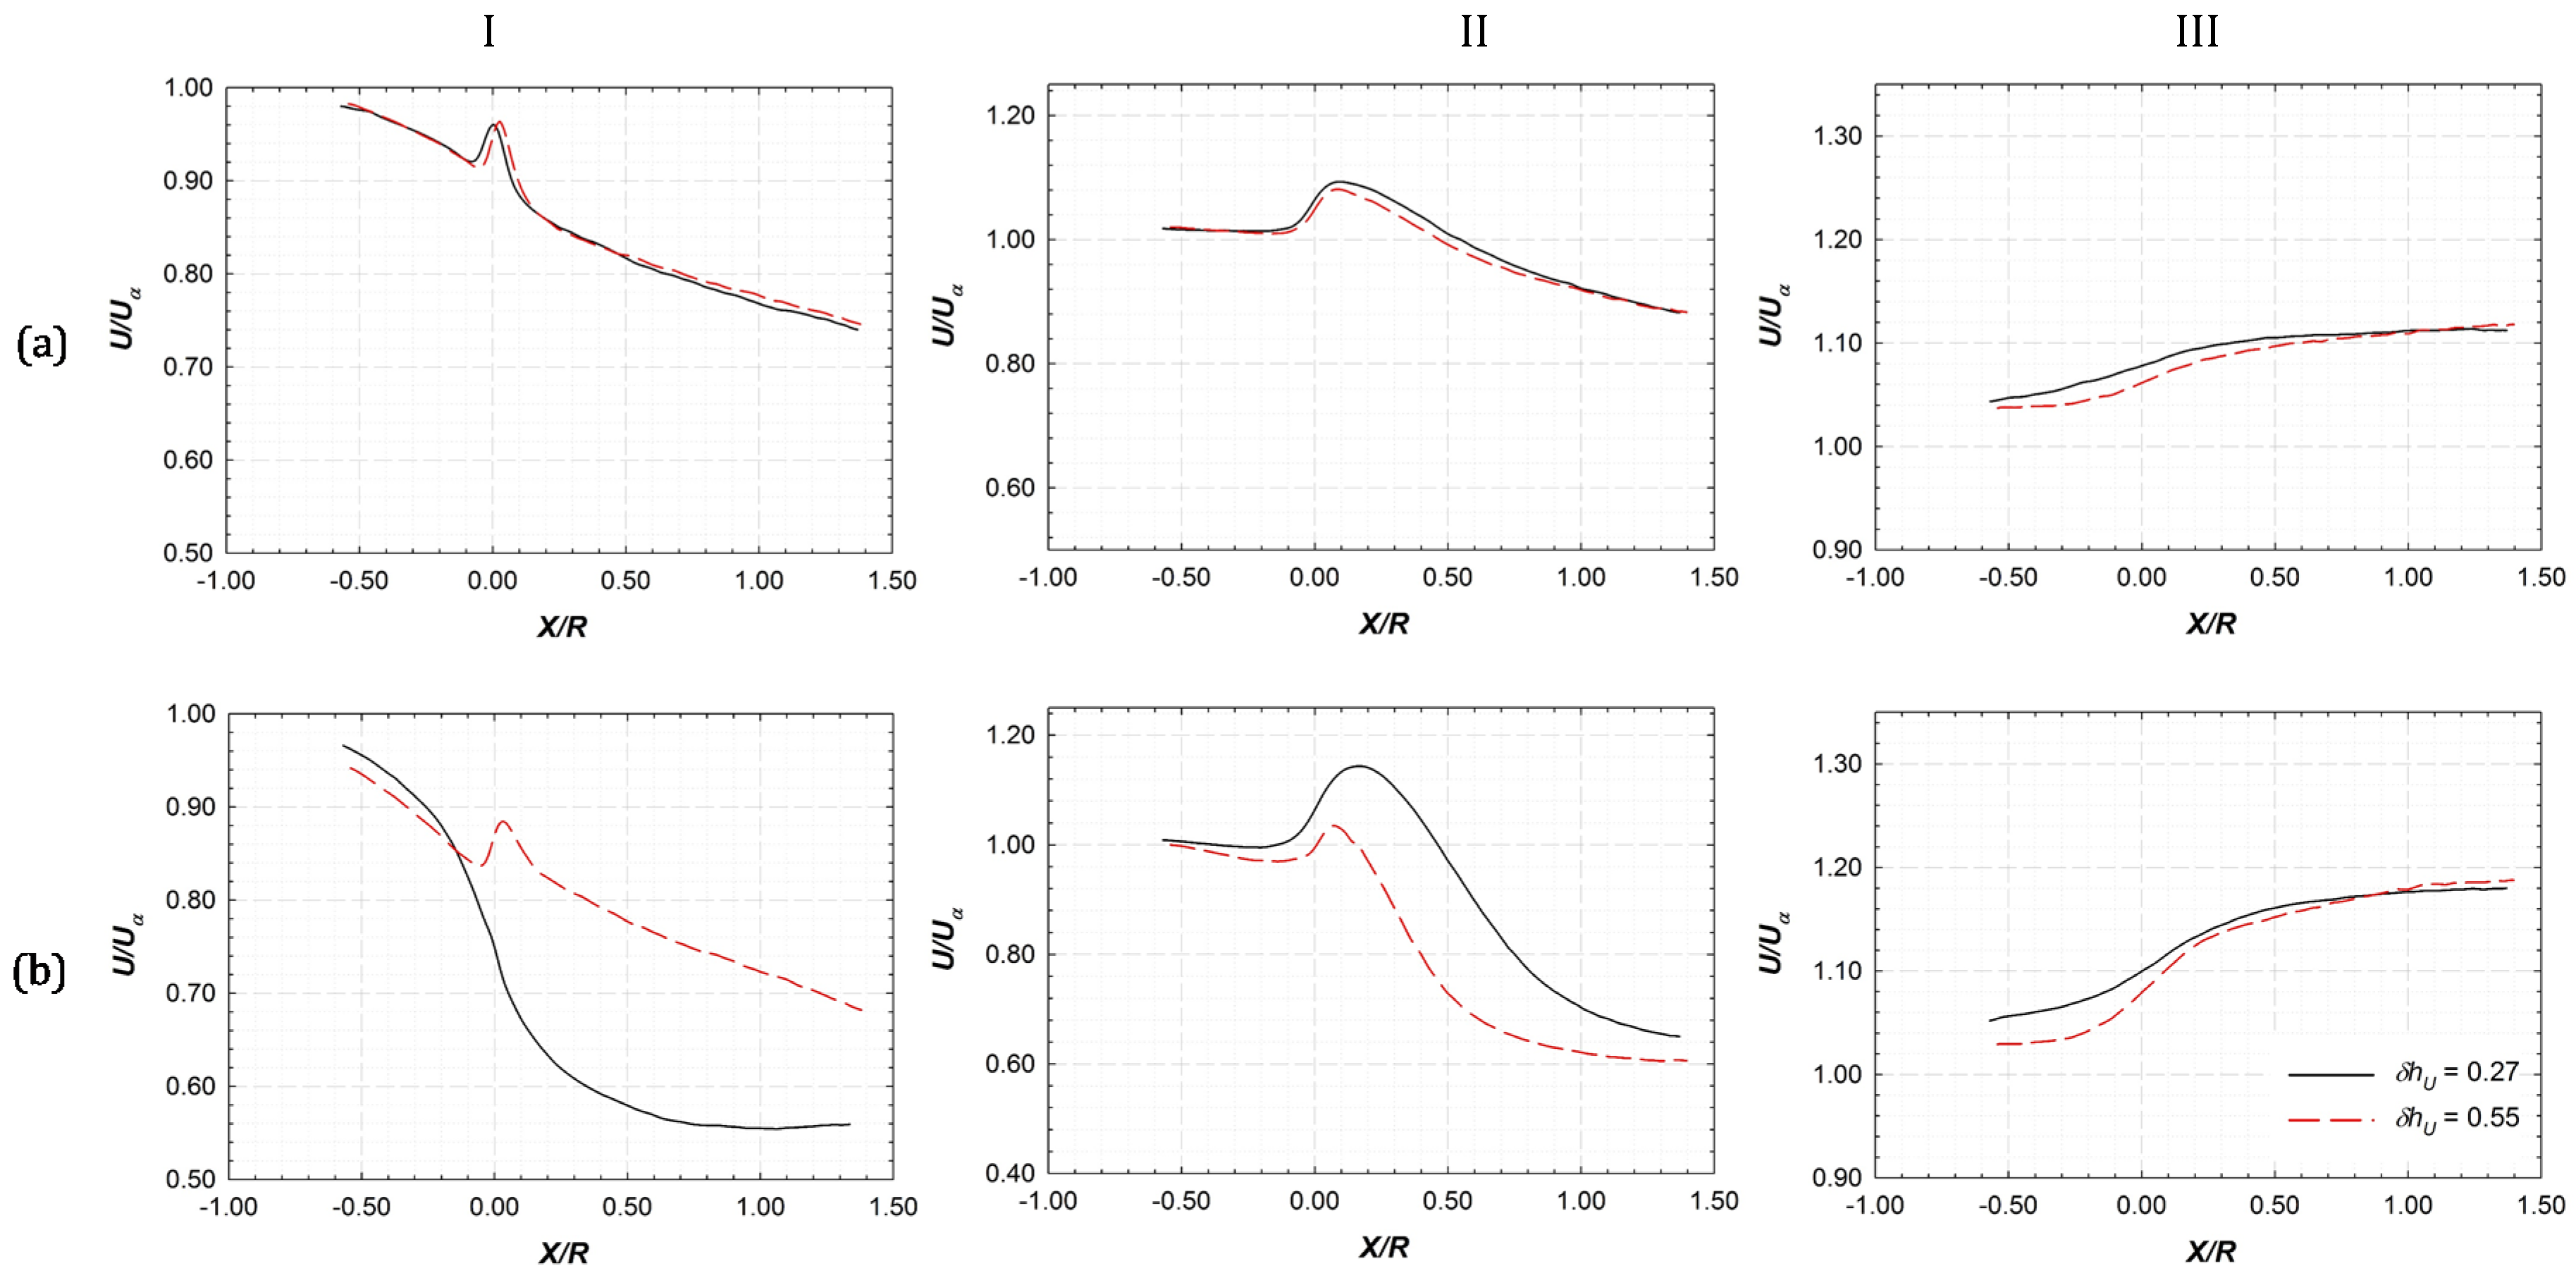
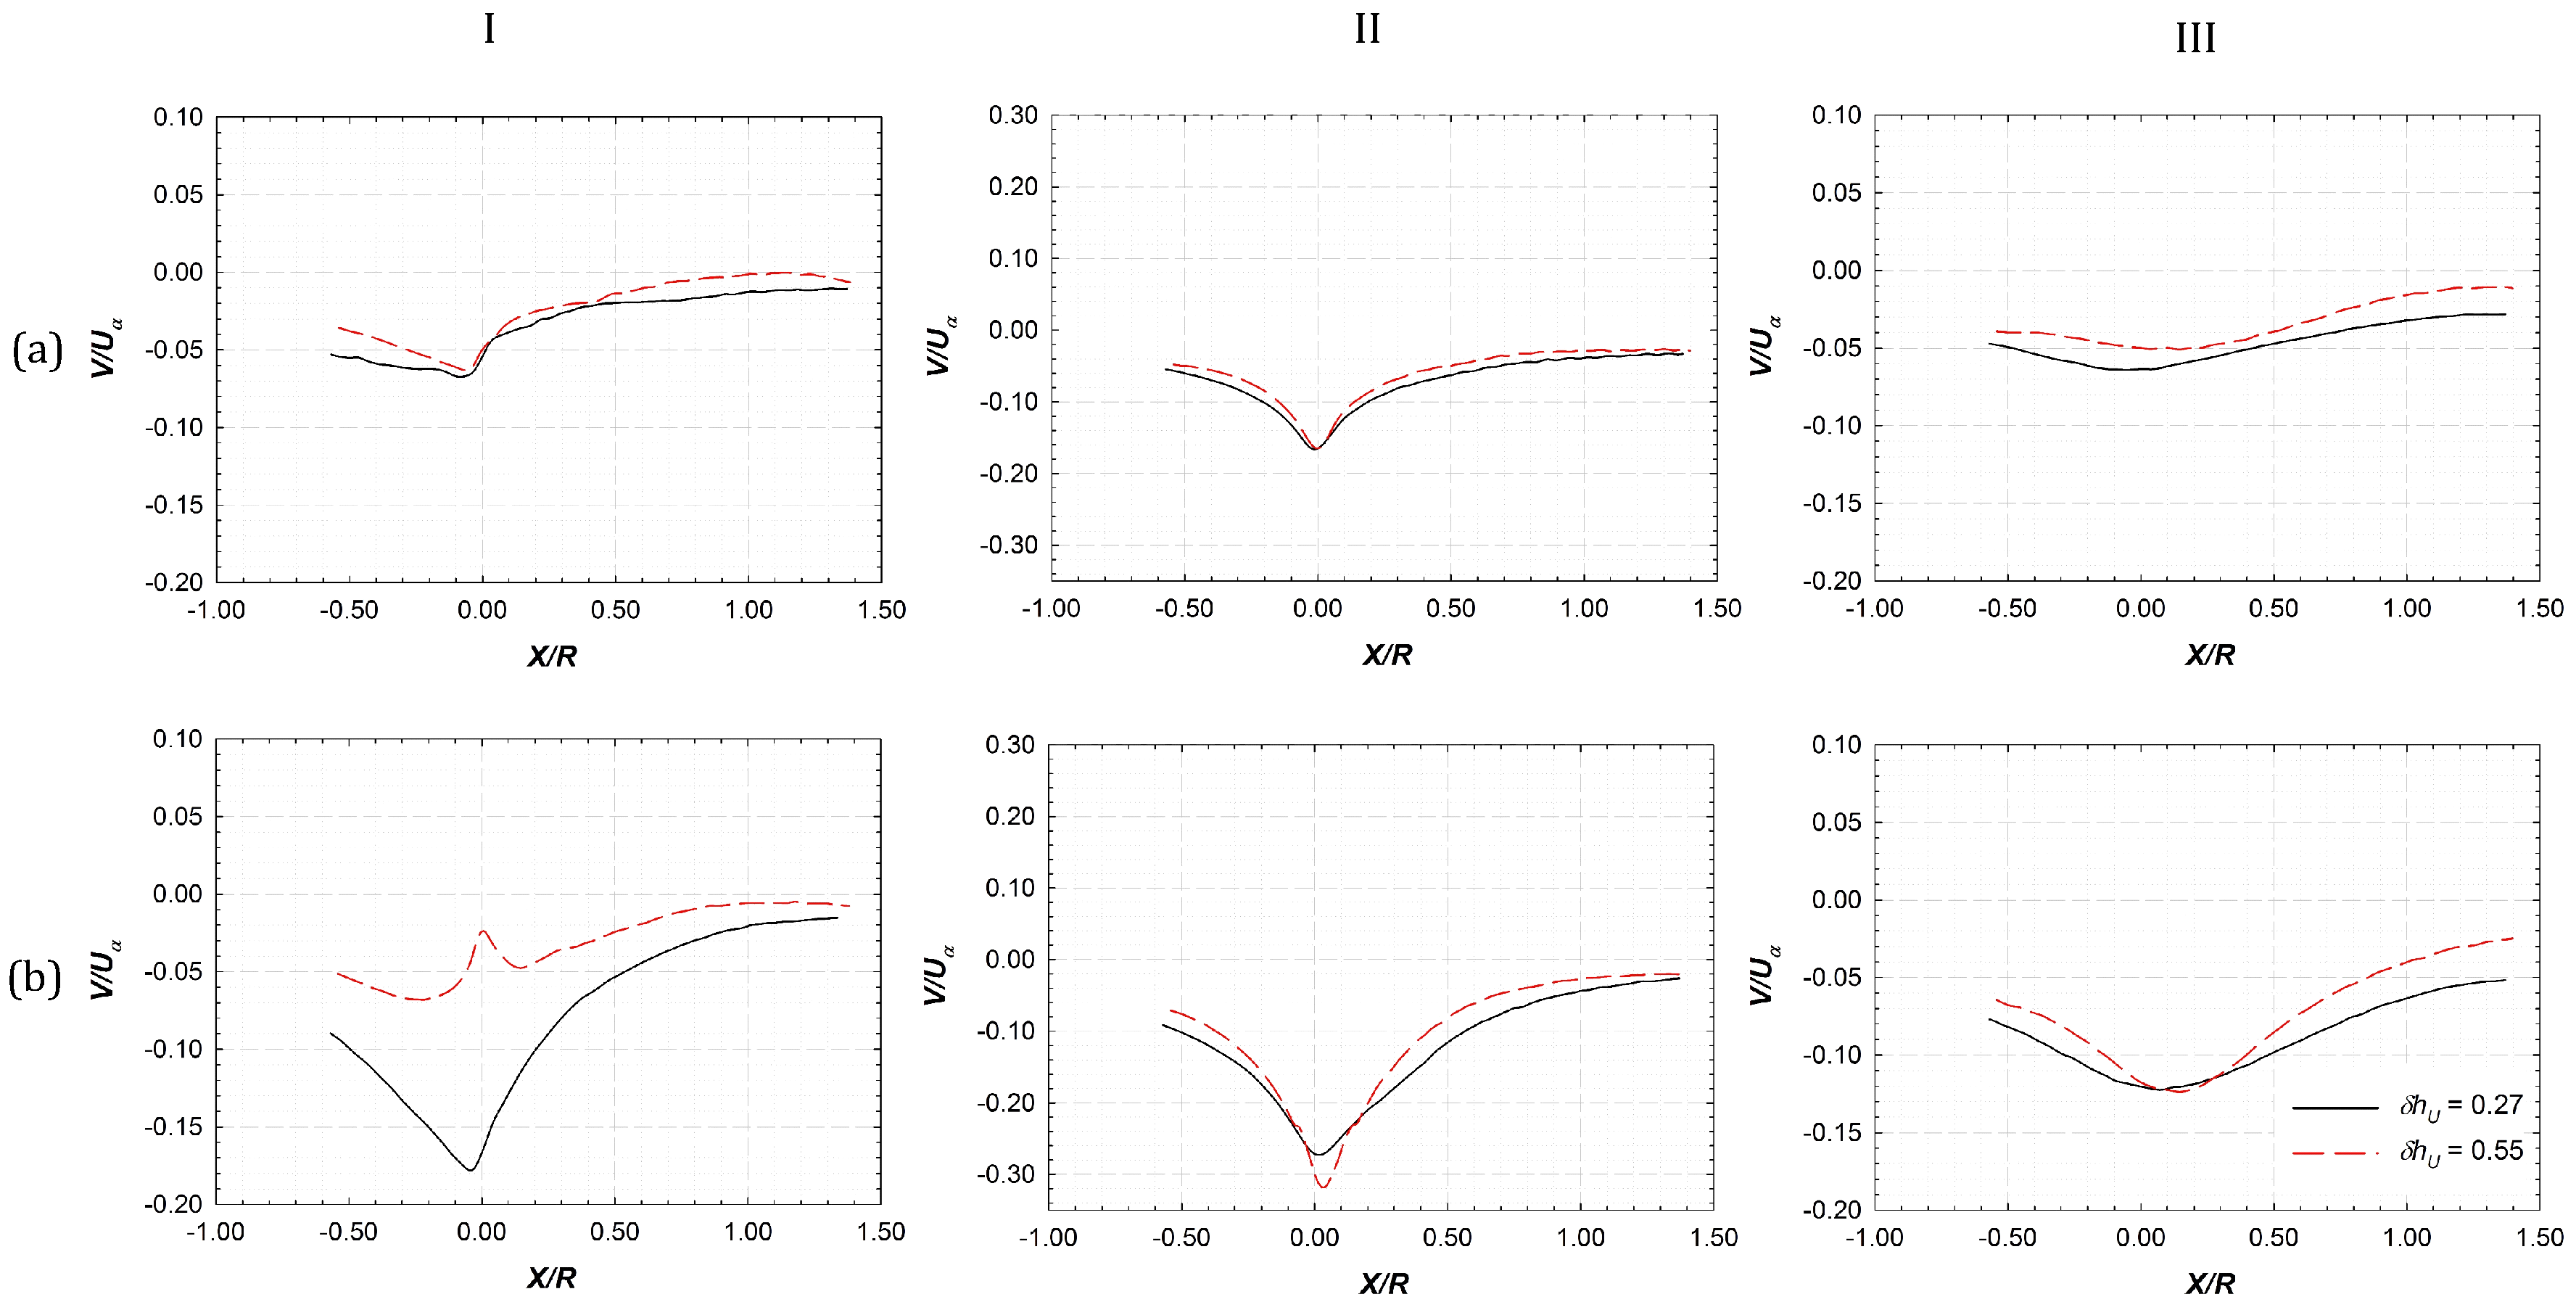
3.3.3. Comparison of Flow in the Regions Above and Below the Turbine Axis

Figure 11 and Figure 12 present profiles of normalized stream-wise and vertical velocities in the lower wake and bypass region for δ h U = 0.55 and 0.27 and rotational speeds of 180 RPM (row a) and 270 RPM (row b). For a rotational speed of 180 RPM, both the δ h U = 0.55 and 0.27 cases exhibited similar stream-wise velocity behavior at Y/R = −0.5, −1, and −1.3, with δ h U = 0.27 cases showing slightly (up to 2%) faster flow. However, as rotational speed increased to 270 RPM (Figure 11, row b), a larger variation was observed among the two depths of immersions. Compared to the δ h U = 0.55 case, the case with δ h U = 0.27 exhibited lower stream-wise velocity at Y/R = −0.5 (slower inner wake) but higher stream-wise velocities at Y/R = −1 and −1.3 (faster outer wake). This is in contrast to higher stream-wise velocities for the δ h U = 0.27 case (in comparison with the δ h U = 0.55 case) in the entire upper region (Figure 7). Further, a comparison of Figure 7 and Figure 11 also shows higher stream-wise velocities in the lower wake compared to the upper wake for both the δ h U = 0.55 and 0.27 cases. In addition, a significant difference between velocity profiles at Y/R = ±1 indicates that the point Y/R=−1 corresponds to the lower wake region, while Y/R = +1 is a point outside the upper wake and belongs to a faster upper bypass region. This shows the presence of asymmetric wake with a smaller radius for the upper wake compared to the lower wake. Farther away from the turbine axis, U profiles appeared to fall on each other for the lower bypass (Figure 11, column III), while the upper bypass region showed appreciable variation (Figure 7d). It is worth noting the incoming flow behavior at X/R = −0.5. For the upper wake region (Y/R = +0.5, +1, and +1.3), the case with δ h U = 0.55 showed higher stream-wise velocities compared to the δ h U = 0.27 case (Figure 7). On the other hand, for the lower wake (Y/R = −0.5, −1, and −1.3), the case with δ h U = 0.27 showed faster incoming flow compared to the case with δ h U = 0.55. Figure 12 presents a variation of normalized vertical velocity for two rotational speeds (180 RPM, row a, and 270 RPM, row b) and two depths of immersions ( δ h U = 0.55 and 0.27). Higher rotational speed led to larger values of vertical velocity, as depicted in Figure 12. Further, a low proximity case ( δ h U = 0.27) exhibited higher vertical (downward) velocities compared to a deeply submerged turbine case.

3.4. Phase-Averaged Statistics for Bypass and Wake Regions

To identify the transient phenomena of wake development, tip vortex formation, and propagation, the phase-averaged stream-wise velocity contours in the region above the turbine axis are presented in Figure 13. A total of 500 images were averaged per run which were captured every time a pre-marked turbine blade reached a horizontal position on the side away from the laser sheet. Figure 13 compares the upper-bypass and upper-wake regions for the rotational speeds of 180 RPM (Figure 13a) and 270 RPM (Figure 13b). At the low rotational speed of 180 RPM and δ h U = 0.55, three (circular) high-velocity regions were observed approximately at blade tip height that was representative of tip vortices. An increase in rotation speed to 270 RPM resulted in faster rotating wake with four vortices observed within the same downstream distance (X = 1.4 R). This also led to the formation of additional low-velocity structures IIa,b and IIIa,b, as discussed earlier for time-averaged statistics in Figure 3. The second column of Figure 13 presents contours of stream-wise velocity in upper-bypass and upper-wake regions for the case with δ h U = 0.27, which is associated with the highest performance due to the free surface deformation and wake compression effects. Comparison of columns I and II in Figure 13 show stronger wake and faster upper bypass regions at these low depths of immersion. Compression of the upper wake by a faster upper bypass region is more evident at higher rotational speeds, as elucidated in Figure 13b. The upper-wake region, which was expected to expand with its propagation downstream the turbine (as in column I), was actually observed to compress in this case (see column II). The downward movement of tip vortices (that bound the wake region) with their downstream propagation was indicative of the wake compression process. Thus, the wake flow during its rotation cycle undergoes cyclic variation in its shape and interact with upper bypass flow which will lead to faster wake recovery and shorter wake propagation distances. Third and fourth tip vortices were found to be merging with the upper-bypass region developing faster secondary flow in the upper bypass region that was also observed in the time-averaged statics of Figure 3. The third column of Figure 13 presents contours of stream-wise velocity for δ h U = 0.05 at rotational speeds of 180 and 270 RPM in the upper region of interest. Even at a low rotational speed of 180 RPM, traces of the upper-bypass region penetrating into the upper wake can be seen in Figure 13(a-III). The bypass region showed the presence of only two vortical structures (tip vortices) compared to three vortical structures for δ h U = 0.55 for the same rotational speed. The higher rotational speed of 270 RPM (Figure 13(b-III)) led to the formation of IIIa and IIIb regions in the lower wake simultaneously increasing the strength of high-velocity region V in a combined upper-bypass and upper-wake region. The high-velocity region was not just stronger but penetrated deeper into the upper wake indicating the higher amplitude of free surface wave caused by a faster rotating turbine. Further, the upper wake lacked the presence of an outer wake core (region IIb) which was washed away by the faster upper bypass region.

4. Conclusions

The results of experimental investigations to quantify the effect of free surface proximity and associated blockage effects on the performance and flow-field of a horizontal axis tidal turbine were presented. Experiments were carried out with a turbine operating at various flow velocities and immersion depths over a range of TSR values. The experimental datasets were corrected to find the contribution of the blockage effect towards measured power using an open-surface blockage correction formulation. An increase in flow velocity and rotational speed was found to increase the blockage effect resulting in accelerated flow, improved power, and thrust loading on the turbine. Increased rotational speed resulted in a faster rotating wake that had lower stream-wise velocity leading to higher wake blockage. Additionally, an experimental investigation with stereo-PIV to understand the influence of free surface proximity on the blockage effects revealed free surface deformation behind the turbine rotational plane leading to an asymmetric wake. The shape and intensity of free surface drop were found to be dependent on the flow velocity, rotational speed, and tip clearance distance. Free surface deformation resulted in accelerated bypass flow and radial compression of wake, causing additional blockage effects. The magnitude of this additional blockage was higher at higher rotational speeds. Further, flow visualization also revealed negative vertical velocity at the upper-wake–bypass interface and cyclic variation in wake structures during its propagation, implying faster wake recovery process. In addition, POD analysis performed to identify dominant flow structures revealed identical kinetic energy but different near-wake flow features for δ h U = 0.55 and 0.27 cases. Dominant POD modes, as well as reconstructed flow fields, exhibited downward-moving tip-vortex streak for δ h U = 0.27 confirming wake compression effects in the presence of free surface proximity. The presented results highlight the impact of free-surface proximity on the performance characteristics and the process of turbine wake evolution. An optimal distance from the free surface was not only found to improve turbine performance, but also quicken the process of wake re-energization. This observation implies that in addition to extracting more energy from a single turbine unit, farm layouts devised to operate in free surface proximity could be arranged in a denser fashion thereby augmenting the energy yield per unit area.

Author Contributions

Conceptualization, A.B. and N.K.; methodology, N.K. and A.V.; validation, A.V.; formal analysis, N.K.; investigation, N.K. and A.V.; resources, A.B.; data curation, N.K. and A.V.; writing—original draft preparation, N.K.; writing—review and editing, A.B. and A.V.; supervision, project administration, and funding acquisition, A.B.

Funding

This research was funded by the US National Science Foundation, grant number 1706358 from CBET-Fluid Dynamics.

Conflicts of Interest

The authors declare no conflict of interest.

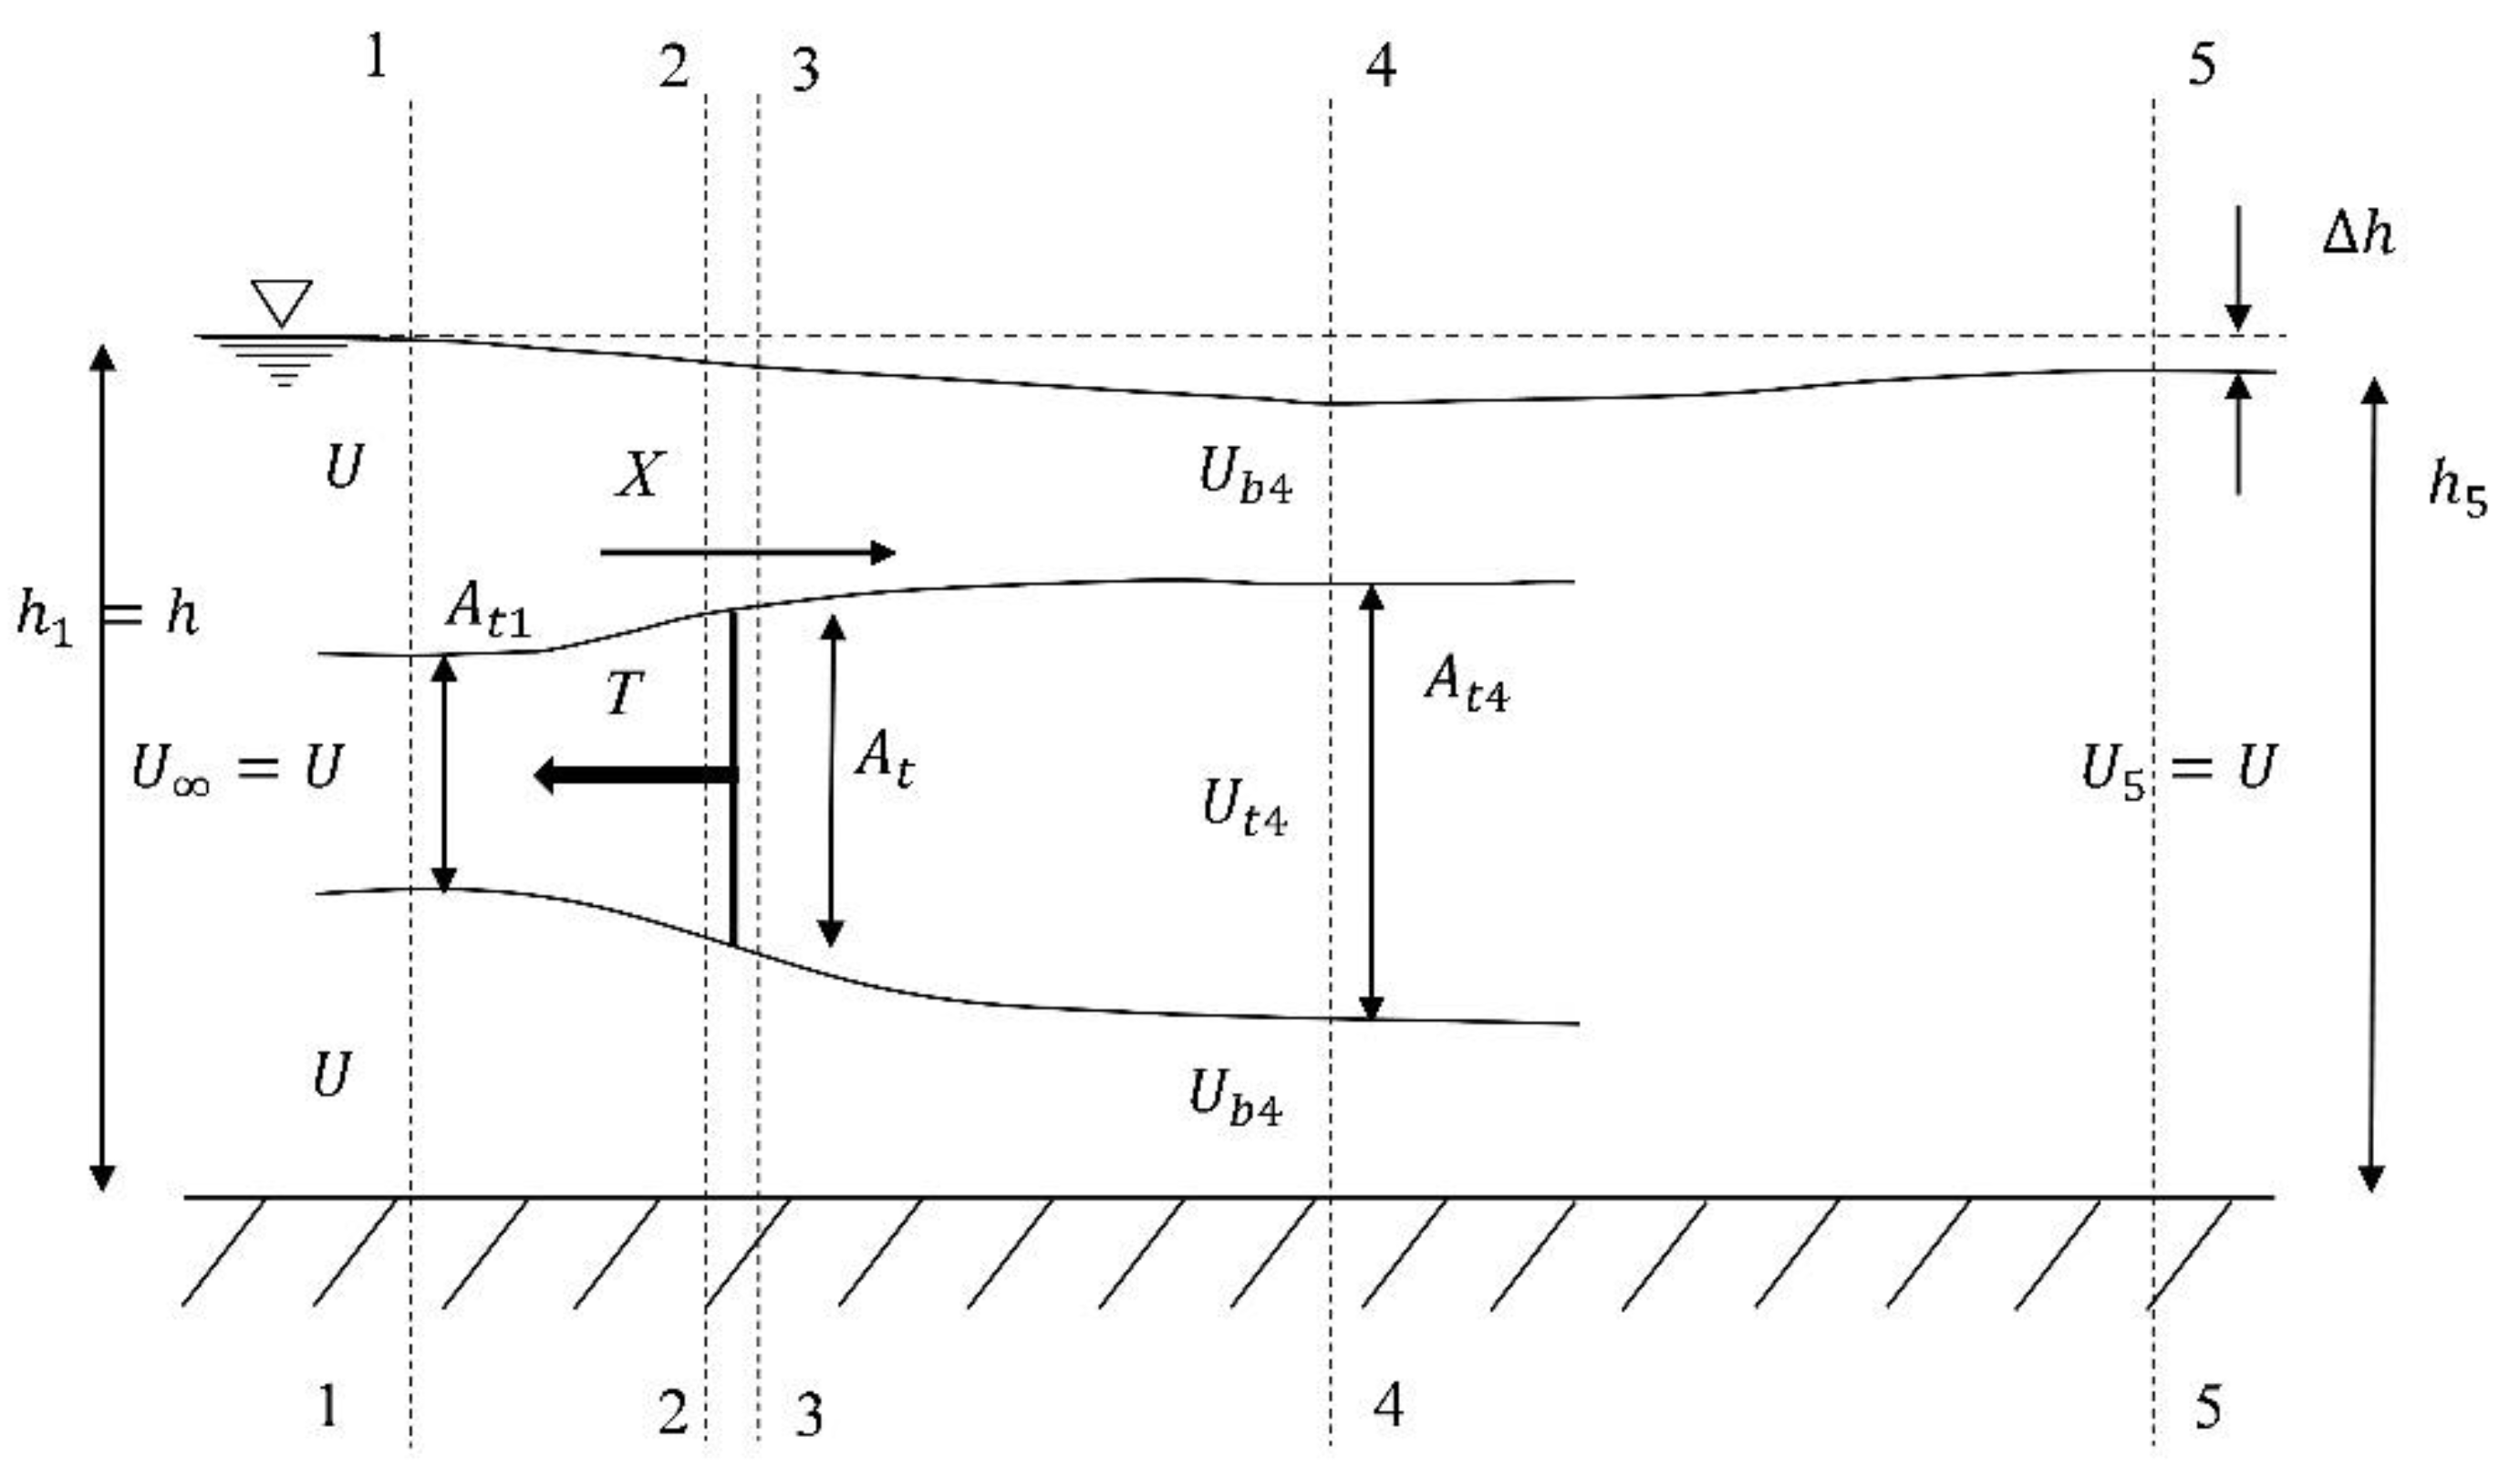
Appendix A. Blockage Correction for Experimental Data

Measured experimental data were corrected to take into account the effect of flow acceleration around the turbine due to the blockage offered by the turbine to the channel flow. For a turbine operating in the vicinity of the free surface, the wake re-energization and expansion processes are expected to be affected by the free surface drop behind the turbine [11,23,35]. Hence, it is necessary to incorporate the effect of the free surface drop in the blockage correction formulation (see Figure A1). This was achieved by modeling the Froude number in the blockage correction formulation (Figure 3). Froude number ( F r ) characterizes a ratio of the characteristics flow velocity ( U ) and gravitational flow velocity ( g H ), for a channel h (m) deep upstream the turbine. The flow domain of interest consists of a stream-tube that passes through the edge of actuator disc, representing the turbine, and subsequently expands behind the turbine rotation plane forming a wake region. The flow outside the stream-tube is described as the bypass flow in which flow acceleration takes place.
Figure A1. Blockage correction: Schematic of a tidal turbine in an open surface water channel environment.
Energies 12 03325 g0a1
For an actuator disc of area A t that is placed in a channel of the cross-sectional area A c , the blockage ratio is defined as: B = A c / A t . Consider five locations along the length of the channel: far upstream the turbine, 2–2 and 3–3 immediately before and after the turbine, 4–4 in the far wake, and 5–5 far downstream the turbine, where mixing has already occurred, and velocity is uniform across the depth of the channel. Location 4–4 is characterized by a uniform pressure but varying velocity across the depth of the channel. Let T be the thrust force from the actuator disc on the fluid and F S h e a r be a shear force between the turbine flow and the bypass flow. Subscripts t and b denote the turbine flow and the bypass flow. Let α and β denote flow coefficients inside the stream-tube turbine flow region and bypass flow region, respectively, and represent ratios of local flow velocity to tunnel flow velocity. The pressure head at various channel sections can be expressed in terms of hydrostatic pressure. Applying Bernoulli’s equation to the bypass flow, between sections 1–1 and 2–2 and sections 3–3 and 4–4 we obtain:
h 2 t h 3 t = U 1 t 2 2 g ( β 4 4 α 4 2 ) = T ρ g A
where h 2 t and h 3 t are water heights at sections 2–2 and 3–3. Please note that, at the location 1–1, U 1 t = U 1 b = U . Finally, applying momentum conservation across the turbine gives:
F s h e a r T = ρ q 4 t U 4 t ρ q 1 t U 1 t + ρ q 4 b U 4 b ρ q 1 b U 1 b
where q represents volumetric flow at respective locations. Using Equation (A1) and expressing volumetric flow (q) and flow velocity at various locations in terms of U, we get:
1 2 g ( h 2 h 4 2 ) B b u 2 2 g ( β 4 2 α 4 2 ) = U 2 h B α 2 ( α 4 1 ) + U 2 h ( 1 B α 2 ) ( β 4 1 )
where b is the channel width. The water height at location 4–4 can be determined by applying continuity equations to bypass and turbine flow:
h 4 = A t 4 b + A b 4 b = B h 1 α 2 α 2 + h 1 ( 1 B α 2 ) β 4
Applying Bernoulli’s equation to the bypass flow and after some manipulations, h 4 and β 4 can be eliminated from Equations (A3) and (A4) and the following relation between turbine flow coefficients and the bypass flow coefficient can be derived:
α 2 = 2 ( β 4 + α 4 ) ( β 4 1 ) 3 B β 4 ( β 4 α 4 ) 4 + ( β 4 2 1 ) α 4 β 4
Equation (A3) can be rewritten using Equation (A5) and the definition of Froude number as follows:
F r 2 β 4 4 2 + 2 α 4 F r 2 β 4 3 ( 2 2 B + F r 2 ) β 4 2 ( 4 α 4 + 2 α 4 F r 2 4 ) β 4 + ( F r 2 2 + 4 α 4 2 B α 4 2 2 ) = 0
The thrust coefficient is then related to flow velocities as:
C T = T 0.5 ρ A U 2 = ( β 4 2 α 4 2 )
Equations (A5)–(A7) can be solved simultaneously for known values of B , F r , and C T . The equivalent open water velocity ( U 1 ,   in the absence of blockage) can then be obtained by relating thrust coefficient and turbine flow coefficient at section 2–2 as [10]:
U U 1 = α 2 α 2 2 + C T M e a s u r e d 4
Equation (A8) assumes that the turbine operates under identical conditions of the turbine disc flow velocity ( U 2 ), rotational speed (RPM), and thrust force (T) in both open water and the lab tunnel flows.
Equations (A5)–(A7) are then used to modify blocked condition quantities: C P M e a s u r e d , C T M e a s u r e d , and T S R M e a s u r e d to obtain unblocked metrics, namely, C P C o r r e c t e d , C T C o r r e c t e d , and T S R C o r r e c t e d , respectively.
C P C o r r e c t e d = C P M e a s u r e d ( U U 1 ) 3
C T C o r r e c t e d = C T M e a s u r e d ( U U 1 ) 2
T S R C o r r e c t e d = T S R M e a s u r e d ( U U 1 )
Equations (A9)–(A11) can be used to quantify an increase in flow velocity and power coefficient due to the blockage effects as functions of flow velocity, RPM, and tip clearance distance. The blockage method discussed above can be directly applied to BEM models to predict performance in the blocked environment or can be used with experimental data to determine unblocked datasets, provided that the thrust data are available.

References

  1. Neary, V.S. Reference Inflow Characterization for River Resource Reference Model (RM2); No. ORNL/TM-2011/360; Oak Ridge National Lab (ORNL): Oak Ridge, TN, USA, 2011.
  2. Goundar, J.N.; Ahmed, M.R. Marine current energy resource assessment and design of a marine current turbine for Fiji. Renew. Energy 2014, 65, 14–22. [Google Scholar] [CrossRef]
  3. Kolekar, N.; Banerjee, A. Performance characterization and placement of a marine hydrokinetic turbine in a tidal channel under boundary proximity and free surface effects. J. Appl. Energy 2015, 148, 121–133. [Google Scholar] [CrossRef]
  4. Guo, X.; Yang, J.; Gao, Z.; Moan, T.; Lu, H. The surface wave effects on the performance and the loading of a tidal turbine. Ocean Eng. 2018, 156, 120–134. [Google Scholar] [CrossRef]
  5. Maskell, E.C. A Theory of the Blockage Effects on Bluff Bodies and Stalled Wings in a Closed Wind Tunnel; Defense Technical Information Center: Ft. Belvoir, VA, USA, 1963.
  6. Gould, R.W.F. Wake Blockage Corrections in a Closed Wind Tunnel for One or Two Wall-mounted Models Subject to Separated Flow; HMSO: London, UK, 1969. [Google Scholar]
  7. Pope, A. Wind-Tunnel-Boundary Corrections, in Wind-tunnel Testing; John Wiley & Sons Inc.: Hoboken, NJ, USA, 1954; pp. 268–344. [Google Scholar]
  8. Chen, T.Y.; Liou, L.R. Blockage corrections in wind tunnel tests of small horizontal-axis wind turbines. Exp. Therm. Fluid Sci. 2011, 35, 565–569. [Google Scholar] [CrossRef]
  9. Medici, D.; Ivanell, S.; Dahlberg, J.Å.; Alfredsson, P.H. The upstream flow of a wind turbine: Blockage effect. Wind Energy 2011, 14, 691–697. [Google Scholar] [CrossRef]
  10. Bahaj, A.S.; Molland, A.F.; Chaplin, J.R.; Batten, W.M.J. Power and thrust measurements of marine current turbines under various hydrodynamic flow conditions in a cavitation tunnel and a towing tank. Renew. Energy 2007, 32, 407–426. [Google Scholar] [CrossRef]
  11. Birjandi, A.H.; Bibeau, E.L.; Chatoorgoon, V.; Kumar, A. Power measurement of hydrokinetic turbines with free-surface and blockage effect. Ocean Eng. 2013, 69, 9–17. [Google Scholar] [CrossRef]
  12. Consul, C.A.; Willden, R.H.J.; McIntosh, S.C. Blockage effects on the hydrodynamic performance of a marine cross-flow turbine. Philos. Trans. R. Soc. A 2013, 371, 20120299. [Google Scholar] [CrossRef]
  13. Whelan, J.I.; Graham, J.M.R.; Peiro, J. A free-surface and blockage correction for tidal turbines. J. Fluid Mech. 2009, 624, 281–291. [Google Scholar] [CrossRef]
  14. Garrett, C.; Cummins, P. The efficiency of a turbine in a tidal channel. J. Fluid Mech. 2007, 588, 243–251. [Google Scholar] [CrossRef] [Green Version]
  15. McTavish, S.; Feszty, D.; Nitzsche, F. An experimental and computational assessment of blockage effects on wind turbine wake development. Wind Energy 2014, 17, 1515–1529. [Google Scholar] [CrossRef]
  16. Whale, J.; Anderson, C.G.; Bareiss, R.; Wagner, S. An experimental and numerical study of the vortex structure in the wake of a wind turbine. J. Wind Eng. Ind. Aerody. 2000, 84, 1–21. [Google Scholar] [CrossRef]
  17. Chamorro, L.P.; Troolin, D.; Lee, S.-J.; Arndt, R.E.A.; Sotiropoulos, F. Three-dimensional flow visualization in the wake of a miniature axial-flow hydrokinetic turbine. Exp. Fluids 2013, 54, 1–12. [Google Scholar] [CrossRef]
  18. Chamorro, L.P.; Hill, C.; Morton, S.; Ellis, C.; Arndt, R.E.A.; Sotiropoulos, F. On the interaction between a turbulent open channel flow and an axial-flow turbine. J. Fluid Mech. 2013, 716, 658–670. [Google Scholar] [CrossRef]
  19. Lust, E.E.; Flack, K.A.; Luznik, L. Survey of the near wake of an axial-flow hydrokinetic turbine in quiescent conditions. Renew. Energy 2018, 129, 92–101. [Google Scholar] [CrossRef]
  20. Eriksen, P.E.; Krogstad, P.Å. An experimental study of the wake of a model wind turbine using phase-averaging. Int. J. Heat Fluid Flow 2017, 67, 52–62. [Google Scholar] [CrossRef]
  21. Aghsaee, P.; Markfort, C.D. Effects of flow depth variations on the wake recovery behind a horizontal-axis hydrokinetic in-stream turbine. Renew. Energy 2018, 125, 620–629. [Google Scholar] [CrossRef]
  22. Chen, Y.; Lin, B.; Sun, J.; Guo, J.; Wu, W. Hydrodynamic effects of the ratio of rotor diameter to water depth: An experimental study. Renew. Energy 2019, 136, 331–341. [Google Scholar] [CrossRef]
  23. Bahaj, A.S.; Myers, L.E.; Rawlinson-Smith, R.I.; Thomson, M. The Effect of Boundary Proximity upon the Wake Structure of Horizontal Axis Marine Current Turbines. J. Offshore Mech. Arct. Eng. 2011, 134, 021104. [Google Scholar] [CrossRef]
  24. Manar, F.; Medina, A.; Jones, A. Tip vortex structure and aerodynamic loading on rotating wings in confined spaces. Exp. Fluids 2014, 55, 1–18. [Google Scholar] [CrossRef]
  25. Vinod, A.; Banerjee, A. Performance and near-wake characterization of a tidal current turbine in elevated levels of free stream turbulence. Appl. Energy 2019, 254, 113639. [Google Scholar] [CrossRef]
  26. Vinod, A.; Lawrence, A.; Banerjee, A. Effects of Free Stream Turbulence on Tidal Turbines. Part II-Turbine Performance and Near Wake Characteristics. In Proceedings of the 12th European Wave and Tidal Energy Conference, Cork, Ireland, 27 August–1 September 2017. [Google Scholar]
  27. Kline, S.J.; McClintock, F.A. Describing Uncertainties in Single-Sample Experiments. Mech. Eng. 1953, 75, 3–8. [Google Scholar]
  28. INSIGHT4G Data Acquisition, Analysis, and Display Software Platform-Users Guide; TSI Inc.: Shoreview, MN, USA, 2011.
  29. Adrian, R.J.; Westerweel, J. Particle Image Velocimetry; Cambridge University Press: Cambridge, MA, USA, 2011. [Google Scholar]
  30. Manwell, J.F.; McGowan, J.G.; Rogers, A.L. Wind Energy Explained: Theory, Design and Application, 2nd ed.; John Wiley and Sons: New York, NY, USA, 2009. [Google Scholar]
  31. Van Kuik, G.A.M.; Sørensen, J.N.; Okulov, V.L. Rotor theories by Professor Joukowsky: Momentum theories. Prog. Aerosp. Sci. 2015, 73, 1–18. [Google Scholar] [CrossRef]
  32. Berkooz, G.; Holmes, P.; Lumley, J.L. The Proper Orthogonal Decomposition in the Analysis of Turbulent Flows. Ann. Rev. Fluid Mech. 1993, 25, 539–575. [Google Scholar] [CrossRef]
  33. Lumley, J.L. The structure of inhomogeneous turbulent flows. In Atmospheric Turbulence and Radio Propagation; Yaglom, A.M., Tatarski, V.I., Eds.; Nauka: Moscow, Russia, 1967; pp. 166–178. [Google Scholar]
  34. Lumley, J.L. Coherent Structures in Turbulence. Transition and Turbulence; Academic Press: New York, NY, USA, 1981; pp. 215–242. [Google Scholar]
  35. Myers, L.; Bahaj, A.S. Wake Studies of a 1/30th Scale Horizontal Axis Marine Current Turbine. Ocean Eng. 2007, 34, 758–762. [Google Scholar] [CrossRef]
Figure 1. (a) Blade profile (SG-6043) of the (1:20) model turbine rotor. (b) Schematic of experimental set-up (Key: 1—Turbine, 2—Flexible Coupling, 3—Motor, 4—Thrust-Torque Sensor, 5—Support Structure, 6—To Motor Controller, 7—To Data Logging). (c) CP and CT versus TSR curve for the turbine at an inflow velocity of 0.8 m/s.
Energies 12 03325 g001
Figure 2. Effect of tip clearance ratio on (a) power coefficient and (b) percent change in effective channel velocity as a function of TSR for U = 0.8 m/s.
Energies 12 03325 g002
Figure 3. Time-averaged contours of normalized stream-wise velocity (U* = U/U) for δ h U = 0.55 (column I), 0.27 (column II), and 0.05 (column III) at rotational speeds of 180 RPM (row a) and 270 RPM (row b). The center line represents the turbine axis location while the dotted lines represent blade tip location.
Energies 12 03325 g003
Figure 4. Time-averaged contours of normalized vertical velocity (V* = V/U) for rotational speeds of 180 RPM (row a) and 270 RPM (row b) for δ h U 0.55 (column I), 0.27 (column II), and 0.05 (column III).
Energies 12 03325 g004
Figure 5. Proper orthogonal decomposition (POD) analysis for time-averaged data: Vorticity contours showing (I) first mode (22% of total energy), (II) second mode, and (III) third POD modes for different tip clearance ratios ( δ h U = 0.55, row a, and δ h U = 0.27, row b).
Energies 12 03325 g005
Figure 6. (POD) analysis for time-averaged data: Vorticity contours reconstructed using (I) first 5 POD modes (50% of total energy), (II) first 50 POD modes (75% of total energy), and (III) all 2000 POD modes for different tip clearance ratios ( δ h U = 0.55, row a, and δ h U = 0.27, row b).
Energies 12 03325 g006
Figure 7. Variation of normalized stream-wise velocities of the upper-wake bypass region for a rotational velocity of 180 RPM and tip clearance ratios of 0.55 and 0.27 on horizontal lines at depths of (a) Y/R = 0, (b) Y/R = 0.5, (c) Y/R = 1, and (d) Y/R = 1.3.
Energies 12 03325 g007
Figure 8. Variations of normalized vertical velocities in the upper-wake bypass region for the rotational velocity of 180 RPM and tip clearance ratios of 0.55 and 0.27 on horizontal lines at depths of (a) Y/R = 0, (b) Y/R = 0.5, (c) Y/R = 1, and (d) Y/R = 1.3.
Energies 12 03325 g008
Figure 9. Variation of normalized stream-wise velocities in the upper-wake bypass region for rotational velocity of 270 RPM and tip clearance ratios of 0.55 and 0.27 on horizontal lines at various depths: (a) Y/R = 0, (b) Y/R = 0.5, (c) Y/R = 1, and (d) Y/R = 1.3.
Energies 12 03325 g009
Figure 10. Variation of normalized vertical velocities in the upper-wake bypass region for the rotational velocity of 270 RPM and tip clearance ratios of 0.55 and 0.27 on horizontal lines at various depths: (a) Y/R = 0, (b) Y/R = 0.5, (c) Y/R = 1, and (d) Y/R = 1.3.
Energies 12 03325 g010
Figure 11. Variation of normalized stream-wise velocities in the lower bypass region for rotational velocity of 180 (row a) and 270 RPM (row b) and tip clearance ratios of 0.55 and 0.27 on horizontal lines at various depths: Y/R = −0.5 (column I), Y/R = −1 (column II), and Y/R = −1.3 (column III).
Energies 12 03325 g011
Figure 12. Variation of normalized vertical velocities in the lower bypass region for the rotational velocity of 180 (row a) and 270 RPM (row b) and tip clearance ratios of 0.55 and 0.27 on horizontal lines at various depths: Y/R = −0.5 (column I), Y/R = −1 (column II), and Y/R = −1.3 (column III).
Energies 12 03325 g012
Figure 13. Contour plot of normalized stream-wise velocity (U* = U/U) for δ h U of 0.55 (column I), 0.27 (column II), and 0.05 (column III) at different rotational velocities (180 RPM, row a; 270 rpm, row b).
Energies 12 03325 g013

