Article

Sustainability Assessment of Alternative Strip Clear Cutting Operations for Wood Chip Production in Renaturalization Management of Pine Stands

by
Janine Schweier
1,2,*,
Boško Blagojević
3,
Rachele Venanzi
4,
Francesco Latterini
4 and
Rodolfo Picchio
4
1
Swiss Federal Institute for Forest, Snow and Landscape Research (WSL), Zürcherstrasse 111, 8903 Birmensdorf, Switzerland
2
Chair of Forest Engineering, University of Freiburg, Werthmannstrasse 6, 79085 Freiburg, Germany
3
Department of Forest Biomaterials and Technology, Swedish University of Agricultural Sciences (SLU), Skogsmarksgränd, 901 83 Umeå, Sweden
4
Department of Agriculture and Forest Sciences (DAFNE), Tuscia University, Via S. Camillo de Lellis, 01100 Viterbo, Italy
*
Author to whom correspondence should be addressed.
Energies 2019, 12(17), 3306; https://doi.org/10.3390/en12173306
Submission received: 19 July 2019 / Revised: 15 August 2019 / Accepted: 19 August 2019 / Published: 27 August 2019

Abstract

:
In Mediterranean regions, afforested areas were planted to ensure the permanence of land cover, and to protect against erosion and to initiate the vegetation processes. For those purposes, pine species were mainly used; however, many of these stands, without silvicultural treatments for over fifty-sixty years, were in a poor state from physical and biological perspective, and therefore, clear-cutting on strips was conducted as silvicultural operation with the aim to eliminate 50% of the pine trees and to favor the affirmation of indigenous broadleaves seedlings. At the same time, the high and increasing demand of the forest based sector for wood biomass related to energy production, needs to be supplied. In a modern and multifunctional forestry, in which society is asking for sustainable forestry and naturalistic forest management, forestry operations should ideally be carried out in a sustainable manner, thus support the concept of sustainable forest management. All these aspects are also related to the innovation in forestry sector for an effective energetic sustainability. Three different forest wood chains were applied in pine plantations, all differing in the extraction system (animal, forestry-fitted farm tractor with winch, and double drum cable yarder). The method of the sustainability impact assessment was used in order to assess potential impacts of these alternative management options, and a set of 12 indicators covering economic, environmental, and social dimensions was analyzed. Further, to support decision makers in taking informed decisions, multi-criteria decision analysis was conducted. Decision makers gave weight towards the indicators natural tree regeneration and soil biological quality to support the achievement of the forest management goal. Results showed that first ranked alternative was case 2, in which extraction was conducted by a tractor with a winch. The main reason for that lies in the fact that this alternative had best performance for 80% of the analyzed criteria.

1. Introduction

Mediterranean pines play a key role in the vegetation dynamics of the Mediterranean regions [1]. This group of species includes Pinus nigra Arnold, Pinus brutia Ten., Pinus halepensis Mill., and others such as Pinus pinaster Aiton, as the main representatives. These trees are well adapted to the fire regime that characterizes the area; they have a rapid and early growth and a general colonizing capacity; which all might explain why they have been traditionally used for afforestation projects and today often form extensive plantations in the overall Mediterranean basin. Afforestation was conducted mainly since the second half of the 19th century, aiming to improve protection functions (e.g., catchment hydrology and soil erosion) and socioeconomic functions [2,3,4] after centuries of forest exploitation and conversion to agricultural areas [5]. The total surface occupied by these pine plantations is estimated at 13 million ha, or 25% of the total forest area of the Mediterranean basin.
As many afforestation efforts lacked any kind of management, today, two main problems can be observed: First, many stands are in a poor physical and biological state with no dynamic processes [6]. This is due to several factors (i.e., biotic and environmental adversity and the inadequate treatment). As one consequence, forest health will decline, the stability of forests will be reduced [7], thus the permanence of land cover cannot be ensured.
Second, from a management perspective the pine-dominated vegetation is an intermediate step in succession to a climax state dominated by broadleaved trees [3]. However, due to climate change, many stands expand far beyond the limits of their natural ranges [7]. These changes are accompanied by a loss of biodiversity, a shift to non-site adapted tree species and a reduction of the resistance against climate inducted fluctuations, such as droughts, storms, insects and fungi [7,8,9], and an active forest management is urgently necessary.
Consequently, in order to redirect plantations toward more natural densities, there is a strong need for silvicultural treatments, such as thinning [10,11,12]. Different strategies exist to manage the pine plantations. They are mainly linked to renaturalization of artificial pine stands and consist generally in medium-high intensity thinning followed by a clear-cut after the affirmation of indigenous broadleaves seedlings [13,14,15].
In all case, the thinning approach should be chosen carefully as, e.g., a selective thinning might cause a higher risk of crown fire when overtopped trees remain untouched [16,17].
Additionally, forest operations (FO) to implement this renaturalization strategy could have important impacts on environmental, economic, and/or social performances, hence on all pillars of sustainability [18]. Forest Operations might affect carbon dioxide efflux [19], porosity, bulk density, shear strength [20], tree growth rate [21] soil horizon mixing and topsoil removal [22], and mineral soil respiration [23].
In particular, extraction processes, such as forwarding and skidding, have a high potential for soil compaction [24,25,26]. Further, damages to remaining stands might occur [27] and lead to negative impacts on regeneration [28].
It is well-known that fuel consumption is the most relevant contributor to greenhouse gas (GHG) emissions which cause global warming and thus, should be reduced [29,30]. Potential impacts in other environmental categories, such as the eutrophication potential (EP) and the acidification potential (AP) might be of particular interest when stands are included within natural reserves and underlie special conservation rules.
Further, with regard to social aspects, FO, especially when deployed on a low level of mechanization, is associated with a high risk of fatal accidents [31,32], particularly in felling and extracting operations.
Although in recent times there have been significant technological innovations in FO [33], felling and extracting in Italy, also in many other countries of Europe, are often deployed by traditional methods; i.e., motor-manual felling with chainsaws and the use of mules and/or agricultural tractors for extraction (e.g., [34,35]). Cable yarding systems might be another suitable extraction method [36].
To conclude, from a management perspective, there is an urgent need to apply silvicultural management strategies that support vegetation dynamics and enhance stand ecology, like the renaturalization concept. At the same time, the high and increasing demand of the forest based sector for wood biomass, related to energy productions, needs to be supplied.
The increasing global energy demand; the increasing fuel prices; the environmental impacts and the limited availability of fossil fuels; the aim to reduce emissions of greenhouse gases and to become more independent from fossil fuels, are some of the drivers why biomass resources are increasingly demanded for the production of renewable and sustainable energy. In contrast to wind and solar, biomass can provide base load capacity to the grid. In particular, the versatility of wood chips allows its flexible use in large heating plants, small combustion units and domestic boilers.
In a modern and multifunctional forestry, in which society is asking for sustainable forestry and naturalistic forest management [7], FO should ideally be carried out in a sustainable manner and thus, support the concept of Sustainable Forest Management (SFM) [18,37,38]. It aims to improve economic, but also environmental and social performances of forest processes, products and/or ecosystem services. All these aspects are also related to the innovation in forestry sector for an effective energetic sustainability. Indeed, renewable energy sources and the rational use of energy represent an important forestry resource in a local and global context against climate change.
It is a major challenge for decision makers (DMs) to consider the manifold consequences of decisions and to estimate the economic, environmental, and social performances of different alternatives before an action is carried out. Different indicators might have conflicting results and potential consequences should be known and taken into account in order to improve the silvicultural management strategies and respective methods of FO.
Therefore, the aim of this study was to assess possible impacts on sustainability that are related to FOs and resulting forest wood chains supporting the renaturalization strategy in typical afforested pine plantations in the Mediterranean basin. To be more concrete, we aimed to (i) identify alternative FOs that are suitable silvicultural actions for renaturalization of the pine stands, thereby putting a special emphasis to the extraction process; (ii) assess the potential impacts on all three pillars of sustainability; and (iii) make comprehensive evaluations of the alternative forest wood chains in order to support DMs. To do so, the method of sustainability impact assessment (SIA) was used. It supports assessing economic, environmental and social dimensions of forest processes, products and/or ecosystem services aiming to improve them [39].
In addition, a multi-criteria decision analysis (MCDA) was applied to support DMs. Forestry decision making is a very complex issue that requires consideration of trade-offs among different criteria (or indicators) [40]. MCDA is described by Belton and Stewart 2002 [41] “as an umbrella term to describe a collection of formal approaches, which seek to take explicit account of multiple criteria in helping individuals or groups explore decisions that matter.” In other words, MCDA handles the process of making decisions in the presence of multiple, usually conflicting, criteria and provides a formal model to compare a finite number of alternatives on a one-dimensional preference scale [42]. MCDA has been widely used as decision-support tool in forest management [40,43] and FO [44,45].

2. Materials and Methods

2.1. Case Study Site

The Abruzzo region in Italy accounts for about 4% of the entire Italian forest surface. This region is quite representative for Mediterranean regions. There are about 19,000 ha of coniferous plantations, and of these, black pine (Pinus nigra Arnold subsp. nigra var. italica Villetta Barrea) afforestation covers approximately 13,000 ha [46]. The afforestation was conducted aiming to provide soil protection and to initiate new vegetation processes.
In this typical Mediterranean region, a case study fostering thinning operations supporting the renaturalization of the stands was carried out. Comparative trials were conducted in a 60 year old black pine (Pinus nigra Arnold subsp. nigra var. italica Villetta Barrea) plantation located near Passo delle Capannelle Municipality of Pizzoli (AQ 42°26′49, N 13°20′1) in the Abruzzo region. The studied afforestation covers about 27 ha along the middle mountain slope [46].
Planting was carried out with bare root black pine transplants at a distance of 1 m in the step [46]. It was a homogeneous and pure stand, with poor social differentiation and a high slenderness ratio. The degree of coverage was 90–100%. No significant meteoric damage had occurred, there were no obvious signs of fungal and insect attacks; dead wood snags were substantially absent, and logs were not consistent. None thinning had been applied since the establishment. Thus, the results of this study refer to operations being carried out at the stand age of 60 years. The average tree diameter at breast height was between 18 cm and 24 cm and the average tree height was between 13.2 m and 14.4 m. Further information regarding site characteristics, temperature and precipitation values were reported in Picchio et al. [46].

2.2. System Description

The forest management goal was to ensure the partial permanence of land cover, with the gradual replacement of pine with late successional tree species that are typical of more mature stages of evolution. Clear-cutting (dismantling cutting) on strips was conducted as silvicultural operation with the aim to eliminate 50% of the surface of the pine plantations.
Three different forest wood chains were applied (Figure 1), which are called case 1, case 2 and case 3 hereafter. In all cases, trees were felled motor-manually by using a chainsaw. Felling was conducted by a team of two workers; the first operated with the chainsaw and the second supported directing trees and cleaned stumps before cutting.
After felling, different extraction processes were applied: In case 1, extraction was conducted by animal (heavy rapid skidding horse, TPR-horse) (Figure 2a); in case 2 extraction was conducted by forestry-fitted farm tractor with a winch (Figure 2b); and in case 3 extraction was conducted by double drum cable yarder (Figure 2c).
Depending on the extraction, felling also differed: Since for the areas extracted by horses no directional felling was required (traditional practice) a simple directional felling (in winching area) and herringbone directional felling (in yarding area) was performed.
Transport and further processing did not differ between the cases: After extraction, trees were transported by using the same tractor with winch that was used earlier during extraction. The average transport distance was 400 m (SD ± 38 m). At the landing site trees were chipped for energy purposes by using a mobile chipper. It is common that the total harvesting material of these stands is chipped and used as biofuel. Table 1 shows assessment relevant machinery and animal data.

2.3. Experimental Design of the Trials

As reported in Picchio et al. [46], the plantation was divided into two experimental blocks (replicates) being located on the southeastern slope in the altitudinal range 1200–1300 m a.s.l. (above sea level), with an average slope of about 50%. The first experimental block, which was at an altitude of 1200 m a.s.l. (east–southeast), consisted of 12 strips that were 100 m long (according to the lines of maximum slope) and 15 m wide. This block was surrounded on all sides, excluding the track, with a protection buffer that was a minimum of 20 m wide. The second block, with similar characteristics, was realized slightly lower, at an altitude of 1100 m a.s.l. (southeast).
The experimental design of the study considered three alternatives, derived from the three extractions methods (Figure 2). A randomized block design was assigned for the extraction methods, while the silvicultural operations were systematically assigned (one uncut strip and one clear-cut strip). Each extraction method was replicated two times in each block, thus, four times in total.

2.4. Methodological Approach

The method of SIA was used to assess the impact of the three alternatives on sustainability. It´s unique feature is that the economic, energetic, environmental and social dimensions of forest processes, products and/or ecosystem services can be addressed, thus it is a powerful concept to implement SFM. This method was proposed by [39,47] who suggest the following rules: (i) Supply chains are described as a set of processes; (ii) each process is characterized by a set of sustainability indicators; (iii) the total amount of material flowing through the processes is the basis for assessing the overall sustainability impact and (iv) an analysis of trade-offs between the characteristics is carried out to assess holistically the impact of changes between proposed alternatives.

2.5. Modelling and System Boundaries

The three alternatives were modelled as forest wood chains using the software Umberto (v 5.6), developed by IFU Hamburg GmbH. With Umberto, material flow networks are created allowing to model material and energy flows occurring in the system. The so-called “cradle-to-gate” approach was applied, meaning that the analysis was restricted to a selected life cycle stage [48]. In our case, the study concentrated on the felling, extracting, transporting and chipping of trees, as shown in Figure 1.
According to the modelling rules [47] in each process, the wood material changes its appearance and/or moves to another location. Thus, the SIA builds on the conceptual representation of forest wood chains as chains of value-adding production processes [49]. System boundaries were designated to be from where machines/animals, personnel and equipment were brought to the working sites to where the produced wood chips were at landing (Figure 1). For all processes, impacts due to direct (e.g., fuels) and indirect inputs (e.g., machinery) were considered.
The transportation of the chips to the final destination was not considered. Further, the building of roads and road maintenance, the disposal of machines and horse manure, the CO2 uptake due to tree growth, and its release to the environment after biomass oxidation at the end of the life cycle, were not considered. Neither were changes in the soil organic matter stocks—all due to rare data.

2.6. Selection of Sustainablility Indicators

The sustainability indicators (SIs) selected for the calculation were relevant and balanced with regard to economic, environmental, and social sustainability, as well as feasibility in terms of data availability and quality [50]. A set of 12 SIs was chosen (Table 2) to be analyzed based on existing indicator sets (e.g., [51,52]).
The most relevant economic SIs are (#1) productivity (PROD), (#2) costs (COST), and (#3) working delays (DELAY). Productivity was described as machine performance per productive machine hour; production costs include personnel costs and fix and variable machine costs; and delays express nonproductive working times caused by mechanical, personal or operational issues.
As the environmental SI, the (#4) cumulated energy demand (CED) of fossil energy was calculated. Further, impacts in the well-known category (#5) global warming potential (GWP) were assessed, as well as in the following environmental impacts categories: (#6) Eutrophication potential (EP) and (#7) acidification potential (AP). All of them are important categories for biomass cultivation and distribution and are highly influenced by nitrous and carbon oxides, which are of special interest to coastal pine plantations along the Tyrrenian coast and generally in Central Italy, where most such stands are included within natural reserves, under special conservation rules (e.g., Gran Sasso and Monti della Laga National Park, Abruzzo National Park, and Majella National Park).
When it comes to social SI, attention was put on (#8) employment (EMP). The amount of fatal accidents was not included due to missing reliable data. Statistical data are neither available for the accidents occurring during the thinning of Italian coastal pine plantations, nor for working accidents in Italian forestry in general, since the Italian work accident statistics lump forestry and agriculture together.
As the provision of ecosystem services, in this case, the prevention against erosion and the initiation of the vegetation processes, and the increase in tree biodiversity, directly impact societal and living conditions; the SI (#9) tree regeneration density (TRD), (#10) tree species diversity (TSD), (#11) soil biological quality (QBS-ar), and (#12) soil microarthropod community density (SMD) were considered as social indicators. Tree regeneration was estimated according to the phytosociological method applied by Pourbabaei et al. and Picchio et al. [53,54]. The Shannon index was used to estimate floristic biodiversity [55]. It is a model that measures species diversity and the degree of homogeneity in species abundance. It is sensitive to changes in rare species, it clearly discriminates, and is well represented in the literature [56,57]. To analyze the impact on soil and short-term recovery the arthropod-based soil biological quality index (known as QBS-ar index) was used (e.g., [58,59]). It is a valuable tool in ecosystem restoration programs for monitoring the development of soil functions and biodiversity and is based on the following concept: The higher soil quality, the higher the number of microarthropod groups well adapted to soil habitats will be [1]. The organisms belonging to each biological taxon were counted in order to estimate their density at the sampled depth (0–10 cm) and ratio of the number of individuals (IND), and the sample area to 1 dm2 of the surface (IND dm−2) [60,61]. This indicator, called soil microarthropod community density, it has been validly applied as a further quantitative biological soil index by [28,59].

2.7. Indicator Calculation

Machine costs referred to Euros (€) per productive machine hour (PMH15), meaning that delays up to 15 min were included. Costs (#2) were calculated according to Picchio [62]. Delay (#3) time was reported separately in order to calculate delay factors [63]; i.e., the ratio of delay time to productive working time. Data related to time input and machine productivity (#1) were determined with a time study. Data about utilization and maintenance of machines and value recovery were obtained directly from the machine owners and from the consultation of machine data sheets.
The analysis of the CED (#4) as well as environmental impacts in the categories GWP (#5), EP (#6) and AP (#7) focused on technical aspects of the alternative FO and followed the ISO 14040-44 guidelines which prescribes the inclusion of direct (e.g., use of fuel) and indirect (e.g., use of machines) impacts. Respective data of direct fuel inputs were shown in Table 3. Fuel consumption was determined by measurements during FO. In particular, data with regard to fuel and oil use were collected for all machines involved.
The feed and water requirements of the horse belong to both categories, direct and indirect inputs. According to Engel et al. [64], the lifespan for a horse was set at 20 years. It can be assumed that their training requires 5 years. For the residual 15 years, a constant work performance of 1200 productive working hours (PWH) per year was assumed, which is equal to 7 PWH per day on 171 days per year [64]. The feed and water requirements on these 2565 working days (171 days per year × 15 years) were considered as direct inputs. Data refer to a daily feedstuff of 72 kg water, 7 kg hay, 5 kg straw, and 9 kg barley [64,65]. Barley was used for calculation instead of oats due to missing emission data of oats in the database. The feed and water requirements for the first 5 years of life (365 days × 5 years = 1825 days) as well as for the non-working days (194 days per year × 15 years = 2910 days) were considered as indirect inputs.
The production and maintenance of the chainsaw and the harvesting machines belong to indirect inputs, too. Data represent an average value and were taken from literature [66,67,68], including a repair factor of 50%.
Further, the transportation of the machines and the horse to the forest stand and the daily transportation of the forest workers to the stand were considered. The machines and the horse stayed in the forest during the overall FO. The transport distance of the horse and of all machines to the forest stand was 40 km for one way, except the yarder, where it was 350 km per way. The forest workers used a car to get to the stand every day and the transport distance was 35 km per way.
The modelling software Umberto [69] and the database Ecoinvent (vs. 2.3) [70] were used to conduct the life cycle inventory. In Ecoinvent, emission data for several materials (e.g., oil) can be found. They were connected to the material’s specific use (e.g., required diesel in a process) and then in the life cycle impact assessment linked to the contributing environmental categories (e.g., CO2 to GWP).
The effect on EMP was calculated from the productivity data observed in the study, considering 1500 h per year as full employment of one worker unit, according to Italian National Collective Agreement for FO.
The TRD was assessed via systematically accounting for each species according to literature [60,71]. The Shannon index was calculated as reported in Picchio et al. [46]. The QBS-ar index was calculated according to Venanzi et al. [59] and the SMD was assessed as reported in Marchi et al. [60]. Both, the impact of the silvicultural management on natural tree regeneration and on soil have been analyzed in a previous study; methods were reported in detail in Picchio et al. [46].
Indicator results were reported per ton dry matter (td.m.) of wood chips and on a per hectare basis. Total indicator results refer to 27 ha. However, the studied area region, there are about 19,158 ha of coniferous plantations, and of these, black pine afforestation covers about 13,000 ha [72].

2.8. Multi-Criteria Decision Analysis

For ranking the presented three alternatives two fundamental MCDA methods were used: Multi-attribute utility theory (MAUT) [73] and the PROMETHEE method [74].
MAUT belongs to Value Measurement group of methods [75]. MAUT is compensatory and thereby produces complete rankings of alternatives. In MAUT [73], the preferences of DMs are represented by sub-utility function for each criterion. This sub-function (s) must be constructed by the DM(s). In that way, different criteria (e.g., employment, tree species diversity, etc.) are transformed into one common utility scale (with range 0–10) [76]. Summing the products of the sub-utilities multiplied with the corresponding weights of the criteria—which are defined by DMs—the final utility of each alternative is obtained. The alternative with the highest utility value is the first ranked alternative (the best one). A detailed description of MAUT can be found in Keeney and Raiffa [73]. In this paper, MAUT analysis was done with Simple Value Tree software.
In contrast, the PROMETHEE I and PROMETHEE II methods belong to group of outranking methods. They are based on the pairwise comparison of alternatives for every selected criterion using preference function which translates this comparison into one common scale (from zero to one) [77]. Brans et al. [74] proposed six criteria functions (usual, U-shaped, V-shaped, level, linear and Gaussian). In the PROMETHEE method, DMs need to define: (i) weights of criteria; and (ii) the shapes of preference functions and corresponding indifference, and/or preference thresholds. After that, positive and negative preference flows for each alternative are calculated using previously obtained values. PROMETHEE I will produce full ranking of alternatives only in situations when one alternative is better than another with respect to both positive and negative flow, otherwise they are incomparable. In PROMETHEE II, the difference between positive and negative flow (net flow) is used; therefore, results will always be complete ranking of alternatives [45,78,79]. A thorough description of PROMETHEE is given in Brans et al. [74]. In this paper, PROMETHEE analysis was done with Visual PROMETHEE software.
In this study, 10 relevant criteria (previously described as SI in Section 2.6) were used to rank the three alternatives. To avoid double counting, two criteria (productivity and delays) were excluded from the MCDA because they were included in costs criterion. Weights of criteria were obtained by two experts (or DMs) from forestry using the DIRECT method. In the DIRECT method, the DM allocates points to each criterion. For example, the DM is asked to distribute 100 points among the criteria. The DM is also allowed to distribute more (or less) than 100 points. The final weights are the points of each criterion divided by the sum of all points. The selection of utility functions, preference functions and thresholds for this study was based on previous studies [44,80], as well as the authors’ judgment. In MAUT method we used linear utility-function for all criteria while for PROMETHEE method, a V-shape preference function has been applied. The preference threshold (for V-shape preference function) was set to be 10% of the highest value for each SI [44].

3. Results

3.1. Economic Indicator Results

The average productivity of the process felling varied from 4.35 ± 0.52 td.m. PMH15−1 (case 2) to 4.69 ± 1.09 td.m. PMH15−1 (case 3). In case 1, results were slightly higher than in case 2, but showed higher standard deviation (4.40 ± 2.2 td.m. PMH15−1) (Figure 3).
In all cases, the most time-consuming process was bunching and skidding (Figure 3). On average, it reached highest productivities in case 2 (2.26 ± 0.31 td.m. PMH15−1), followed by case 1 (1.08 ± 0.12 td.m. PMH15−1), and case 3 (0.81 ± 0.10 td.m. PMH15−1).
Transport and chipping operations were carried out independently from the felling and extraction processes and did not differ between the cases. On average, the productivity of transport was 2.54 ± 0.37 td.m. PMH15−1. In case of chipping, it was 15.14 ± 3.57 td.m. PMH15−1.
The resulting average system productivity ranged from 0.52 ± 0.05 td.m. PMH15−1 (case 3) to 0.88 ± 0.05 td.m. PMH15−1 (case 2). In case 1, it was 0.62 ± 0.07 td.m. PMH15−1 on average. In all cases, a team consisting of 2 workers was necessary.
A more detailed look into the distribution of the net working time of the process felling showed that cutting was the most time-consuming working step (55.9% of the working time in case 1, 50.4% in case 2, and 51.4% in case 3; Table 4). The working step movement was significantly less time-consuming in case 1 (18.7%) compared to case 2 (27.8%) and case 3 (29.2%) (Table 4). It differed in the process bunching and skidding: in case 1, the empty movement was most time-consuming working step (41.2%), while it was bunching extraction in case 2 (38.8%) and hooking in case 3 (32.9%) (Table 4).
Resulting costs followed the same pattern we the system productivity (Table 5): lowest felling costs were reached in case 3 (€3.40 ± €0.81 td.m.−1) and lowest bunching and skidding costs were reached in case 2 (€12.05 ± €1.64 td.m.−1). The average transport costs were €8.41 ± €1.14 td.m.−1 and average chipping costs were €7.24 ± €1.69 td.m.−1. In sum, case 2 was cheapest (€31.34 ± €4.68 td.m.−1), while case 3 was most expensive one (€76.98 ± €10.50 td.m.−1).
The highest share of DELAY occurred in the motor-manual felling operations. On average, delay time was 51.3% (45.4–58.4%) of the total felling time. In bunching and extraction processes, the average delay time was 30.4% when extraction was conducted by using the tractor with a winch, 39.4% when using the horse, and 42.9% when using the cable yarder. Average delays accounted for 17.1% in transportation processes and 9.9% in chipping processes.
Resulting delay factors for the overall forest wood chains were on average 18.2 for the alternative forest wood chains in which extraction was conducted by using the tractor with the winch, 18.6 when extraction was conducted by using the cable yarder, and 19.9 in cases when extraction was conducted by horse.

3.2. Envionmental Indicator Results

The total CED varied between 423 ± 20 MJ td.m.−1 (case 1) and 499 ± 25 MJ td.m.−1 (case 3) (Table 6). The result in case 3 was mainly caused due to the more intensive energy requirement of the process bunching and skidding (169 ± 21 MJ td.m.−1). The process felling contributed 11.0% to 14.7% to the total CED (case 3 and case 1, respectively); bunching and skidding with 20.2% to 33.8% (case 1 and case 3, respectively); transport with 28.1% to 33.1% (case 3 and case 1, respectively) and chipping with 27.1% to 32.0% (case 3 and case 1, respectively).
The total GWP varied between 6.66 ± 0.27 kg CO2 td.m.−1 (case 2) and 9.10 ± 0.76 kg CO2 td.m.−1 (case 1) (Table 6). The process felling contributed with 11.1–16.7% to the total GWP (case 3 and case 2, respectively); bunching and skidding with 29.5% to 49.5% (case 2 and case 3, respectively); transport with 23.3–31.7% (case 1 and case 3, then case 2, respectively) and chipping with 16.2–22.1% (case 1 and case 3, then case 2, respectively).
The total EP varied between 0.0113 ± 0.0005 kg PO4-eq. td.m.−1 (case 2) and 0.0494 ± 0.0056 kg PO4-eq. td.m.−1 (case 1) (Table 6). The process felling contributed with 3.0–12.6% to the total EP (case 1 and case 2, respectively); bunching and skidding with 31.4%–84.2% (case 2 and case 1, respectively); transport with 7.7–33.3% (case 1 and case 2, respectively) and chipping with 5.2–15.0% (case 1 and case 3, respectively).
The total AP varied between 0.0527 ± 0.0018 kg SO2-eq. td.m.−1 (case 2) and 0.701 ± 0.0049 kg SO2-eq. td.m.−1 (case 1) (Table 6). The process felling contributed with 11.5–15.2% to the total AP (case 1 and case 2, respectively); bunching and skidding with 26.5–44.6% (case 2 and case 1, respectively); transport with 23.3–30.9% (case 1 and case 2, respectively) and chipping with 20.6–27.4% (case 1 and case 2, respectively).
Indirect inputs included the (i) production and maintenance of machines; (ii) transport of the machines to the forest stand; and (iii) daily transport of the forest workers to the stand. With regard to CED of fossil energy, on average, the share of indirect inputs was 13.2% in case 1; 8.8% in case 2 and 16.7% in case 3 (Figure 4). In the category GWP, on average, the share of indirect inputs was 51.5% in case 1, 37.4% in case 2, and 54.0% in case 3 (Figure 4). In the category EP, on average, the share of indirect inputs was 63.2% in case 1, 38.2% in case 2, and 59.0% in case 3 (Figure 4). In the category AP, on average, the share of indirect inputs was 35.8% in case 1, 16.6% in case 2, and 22.7% in case 3 (Figure 4). Among the indirect inputs, the daily transport of the workers to the stand contributed highest to that value. On average it was as follows: With regard to CED of fossil energy, it varied between 41.0% (case 3) and 53.6% (case 1); in the category GWP, it varied between 44.4% (case 1) and 57.1% (case 2); in the category EP it varied between 3.8% (case 1) and 18.5% (case 2); and in the category AP it varied between 27.9% (case 1) and 62.6% (case 3). It is worth mentioning that the process bunching and skidding caused high shares of indirect emissions in two cases. In case 3 (extraction by cable yarder), indirect emissions had an average share of 35.8% in CED; 76.6% in GWP; 81.0% in EP; and 41.3% in AP—mainly caused by the production and maintenance of the heavy yarder. In case 2 (extraction by horse), indirect emissions had an average share of 37.7% in CED; 72.3% in GWP; 69.1% in EP; and 63.6% in AP—mainly caused by the daily care for the horse (e.g., fodder).

3.3. Socio-Ecological Indicator Results

The total EMP was highest in case 3 (2.64 ± 0.26 FTE 1000 td.m.−1), followed by case 1 (2.60 ± 0.08 FTE 1000 td.m.−1) and case 2 (1.58 ± 0.11 FTE 1000 td.m.−1) (Figure 5). The process bunching and skidding differed most among the cases. On average, it was 1.66 ± 0.21 FTE 1000 td.m.−1 for extraction by yarder (case 3); 1.57 ± 0.20 FTE 1000 td.m.−1 for extraction by horse (case 1); and 0.60 ± 0.08 FTE 1000 td.m.−1 for extraction by tractor with winch (case 1) (Figure 5).
After a period of three years after the FO, the highest natural tree regeneration density was found in case 2 with an average of 21,018 ± 1399 trees ha−1 (Table 7). Case 1 and case 3 were on a similar level (18,737 ± 1204 trees ha−1 and 18,729 ± 1236 trees ha−1, respectively). These values were about twice as high compared to control areas (stand without FO) (data not shown). In a temporal trend of three years after the FO, case 1 had a considerable increase, while case 2 and case 3 showed slight decreases (data not shown).
After harvesting, a constant increase in species richness was determined [46]. In case 3, where extraction was conducted by using a cable yarder, the highest diversity was found. In particular, the applied extraction system more positively influenced the richness (data not shown) and marginally influenced the diversity. The cases 2 and cases 3 had higher richness values than case 1. These indexes were only marginally different respect to control areas (stand without FO) (data not shown) and their trend was positive during the three years after FO.
With regard to the QBS-ar index it turned out that case 1 showed higher, thus better, values than the other cases: 228 ± 9.1 in case 1, compared to 199 ± 13.4 in case 2, and 179 ± 13.2 in case 3 (Table 7).
However, as shown in Picchio et al. [46], the QBS-ar index showed significant differences only among treatments and years, with a positive trend during the three years after FO, but with values still lower than the control for case 2 and case 3 (data not shown).
Soil microarthropod community density showed statistically significant differences among treatments and years too [46]. In particular, in the harvested strips, the density values were lower than in the control, but the trends were positive. Three years after the FO, the density varied between 100 ± 6.6 million n° ha−1 (case 3), 124 ± 6.3 million n° ha−1 (case 1), and 161 ± 8.8 million n° ha−1 (case 2) (Table 7).
All indicator values were converted to the functional unit hectare, too, as this unit is more relevant for forest management (Table 8). The results per hectare were the basis for the subsequent MCDA.

3.4. Multi-Criteria Decision Analysis

Table 9 shows input data for MCDA. According to methodological approach, five criteria should be minimized and five should be maximized. Weights of criteria were obtained with DIRECT method and it can be seen that #9 (TRD) and #11 (QBS) were the most important criteria (0.200), while the least important criteria were #2 (COST), #8 (EMP), #10 (TSD), and #12 (SMD), with weights of 0.050. This decision was related to DMs intention to give higher priority to environmental criteria in mountain areas, closely related to land cover and soil biological quality.
Table 10 presents results of the MCDA when applying the MAUT method. When considering the DMs´ weighting of indicators, case 2 was the first ranked alternative, case 1 was second while last ranked alternative was case 3. It should be noticed that case 1 had utility of 8.3 (out of 10), meaning that this alternative was very dominant in comparison to others. Identical rankings were obtained when the different methods PROMETHEE I and II were applied (Table 11, not all data shown).
Case 2 had the best performance for eight (out of 10) criteria. Only for two criteria (#8 EMP and #11 QBS-ar), other alternatives had better performances. A sensitive analysis was conducted in order to analyze how much one need to change (increase) weights of these two criteria in order to change the first ranked alternative. When the weight of #8 (EMP) became higher than 0.34, case 1 became first ranked alternative instead of case 2 (when using MAUT method) (Figure 6a). For criterion #11 (QBS-ar), the value was even higher. It was necessary to increase weight of #11 to 0.54 in order to change first ranked alternative (Figure 6b). For PROMETHEE method results were similar. Case 2 was the first ranked alternative in the range from 0 to 0.427 (for #8 EMP, (Figure 7a) and in the range from 0 to 0.511 (for #11 QBS-ar, Figure 7b).

4. Discussion

This study showed results from a case study that was carried out in a 60 year old black pine stand in the Abruzzo region in Italy. The mainstream silvicultural prescription for these stands is two to four thinning operations, followed by clear-cutting and replanting or renaturalization.
In this case, the forest management goal was to ensure the partial permanence of land cover, with the gradual replacement of pine with late successional tree species that are typical of more mature stages of evolution. Clear-cutting on strips was conducted as silvicultural operation with the aim to eliminate 50% of the surface of the plantations, and thereby to support natural renaturalization.
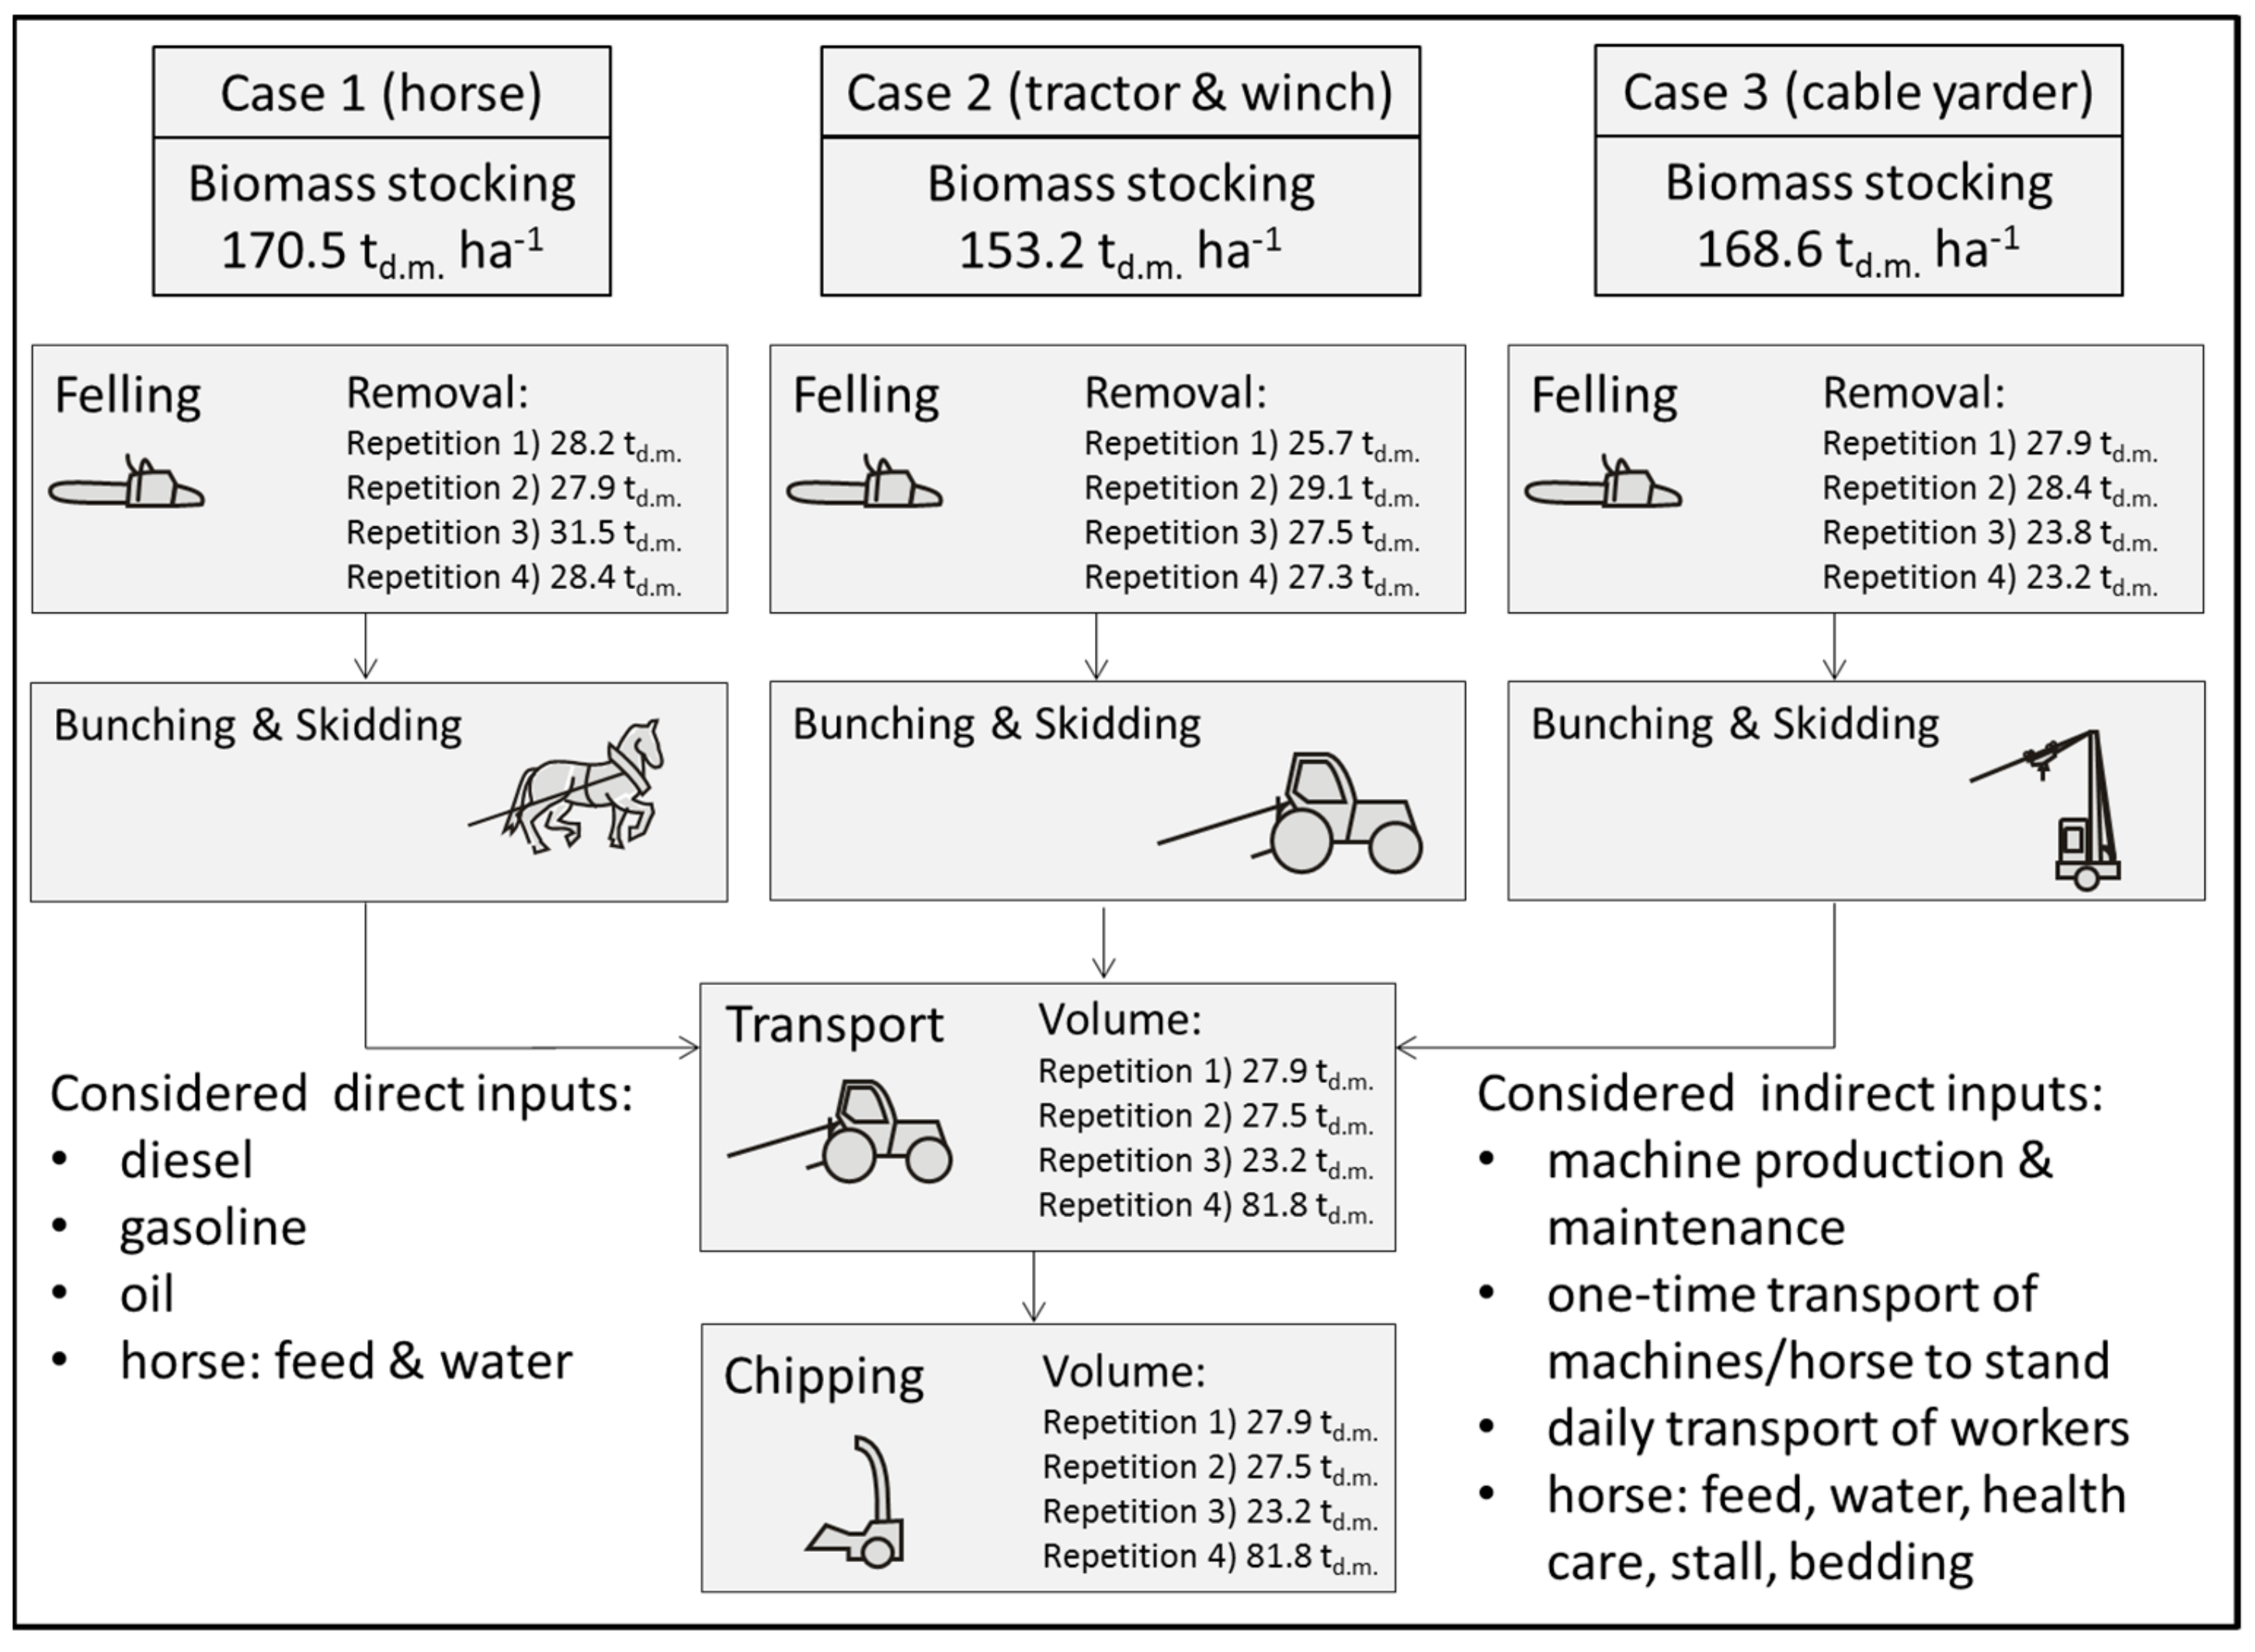
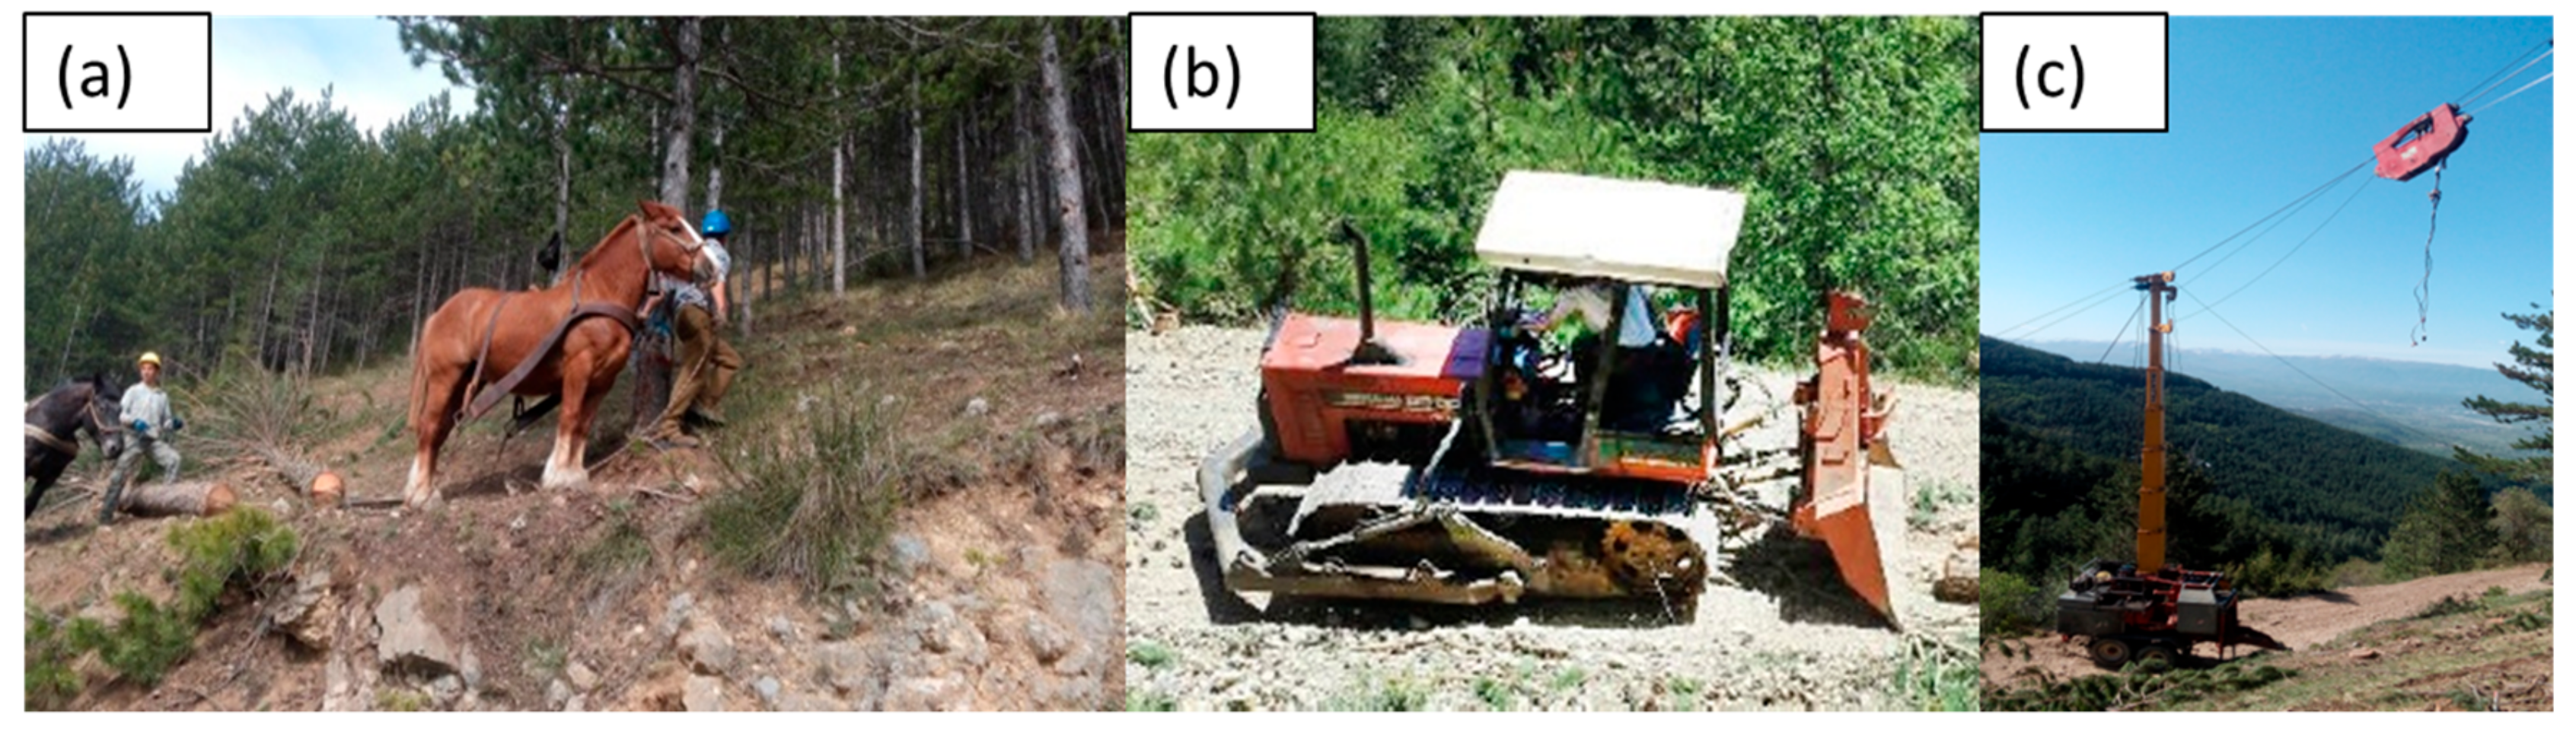
Thinning operations can be carried out by using many harvesting systems. The most popular are cut-to-length and whole-tree harvesting. The latter was applied in this study. However, different extraction processes were conducted (Figure 1 and Figure 2): In case 1, extraction was conducted by animal (heavy rapid skidding horse, TPR-horse), in case 2 extraction was conducted by, forestry-fitted farm tractor with winch, and in case 3 extraction was conducted by double drum cable yarder. After extraction, trees were transported to the landing, where the trees were chipped for energy purposes, which is a common procedure. All forest wood chains were repeated four times.
One of the most challenging tasks in forest management is to consider the consequences of different strategies or FO and to estimate the economic, environmental and social performance of each alternative before an action is carried out. It is important to consider different pillars of sustainability and to link environmental impacts to socio-economic activities in order to guide DMs in their actions and to ensure that the impacts of their decisions are measured.
Therefore, the aim of the study was to conduct a SIA aiming to assess potential impacts on sustainability that are related to FO being applied to support the renaturalization strategy in typical afforested pine plantations in the Mediterranean basin.
The system boundaries included all processes necessary for turning standing trees in the forest into whole-tree chips loaded on trucks and ready for delivery to the mill. Twelve indicators were considered to be important and feasible with regard to data collection.
Input data were gathered from field studies (as reported in [46]) and respective indicator values were calculated by the use of different tools; e.g., potential environmental impacts of exhaust gases under the use of the Ecoinvent database and Umberto, a tool for LCA.
Recent studies have shown that that there are few studies related to FO considering all pillars of sustainability [38]. Most studies are focused only on either environmental or on economic and environmental aspects. However, the use of several indicators and the combination of different methods to calculate indicator values leads to a strong analytical power for embracing financial, technological, environmental, and other aspects of a production system [30].
Different software tools exist to conduct a SIA [81], including within the context of forestry (e.g., TOSIA, as presented by [39,47,82]). We decided to use a LCA software tool for modelling and analysis, because the method of LCA was used to determine potential environmental impacts, and in the software used, SI other than environmental ones can be defined and added, too.
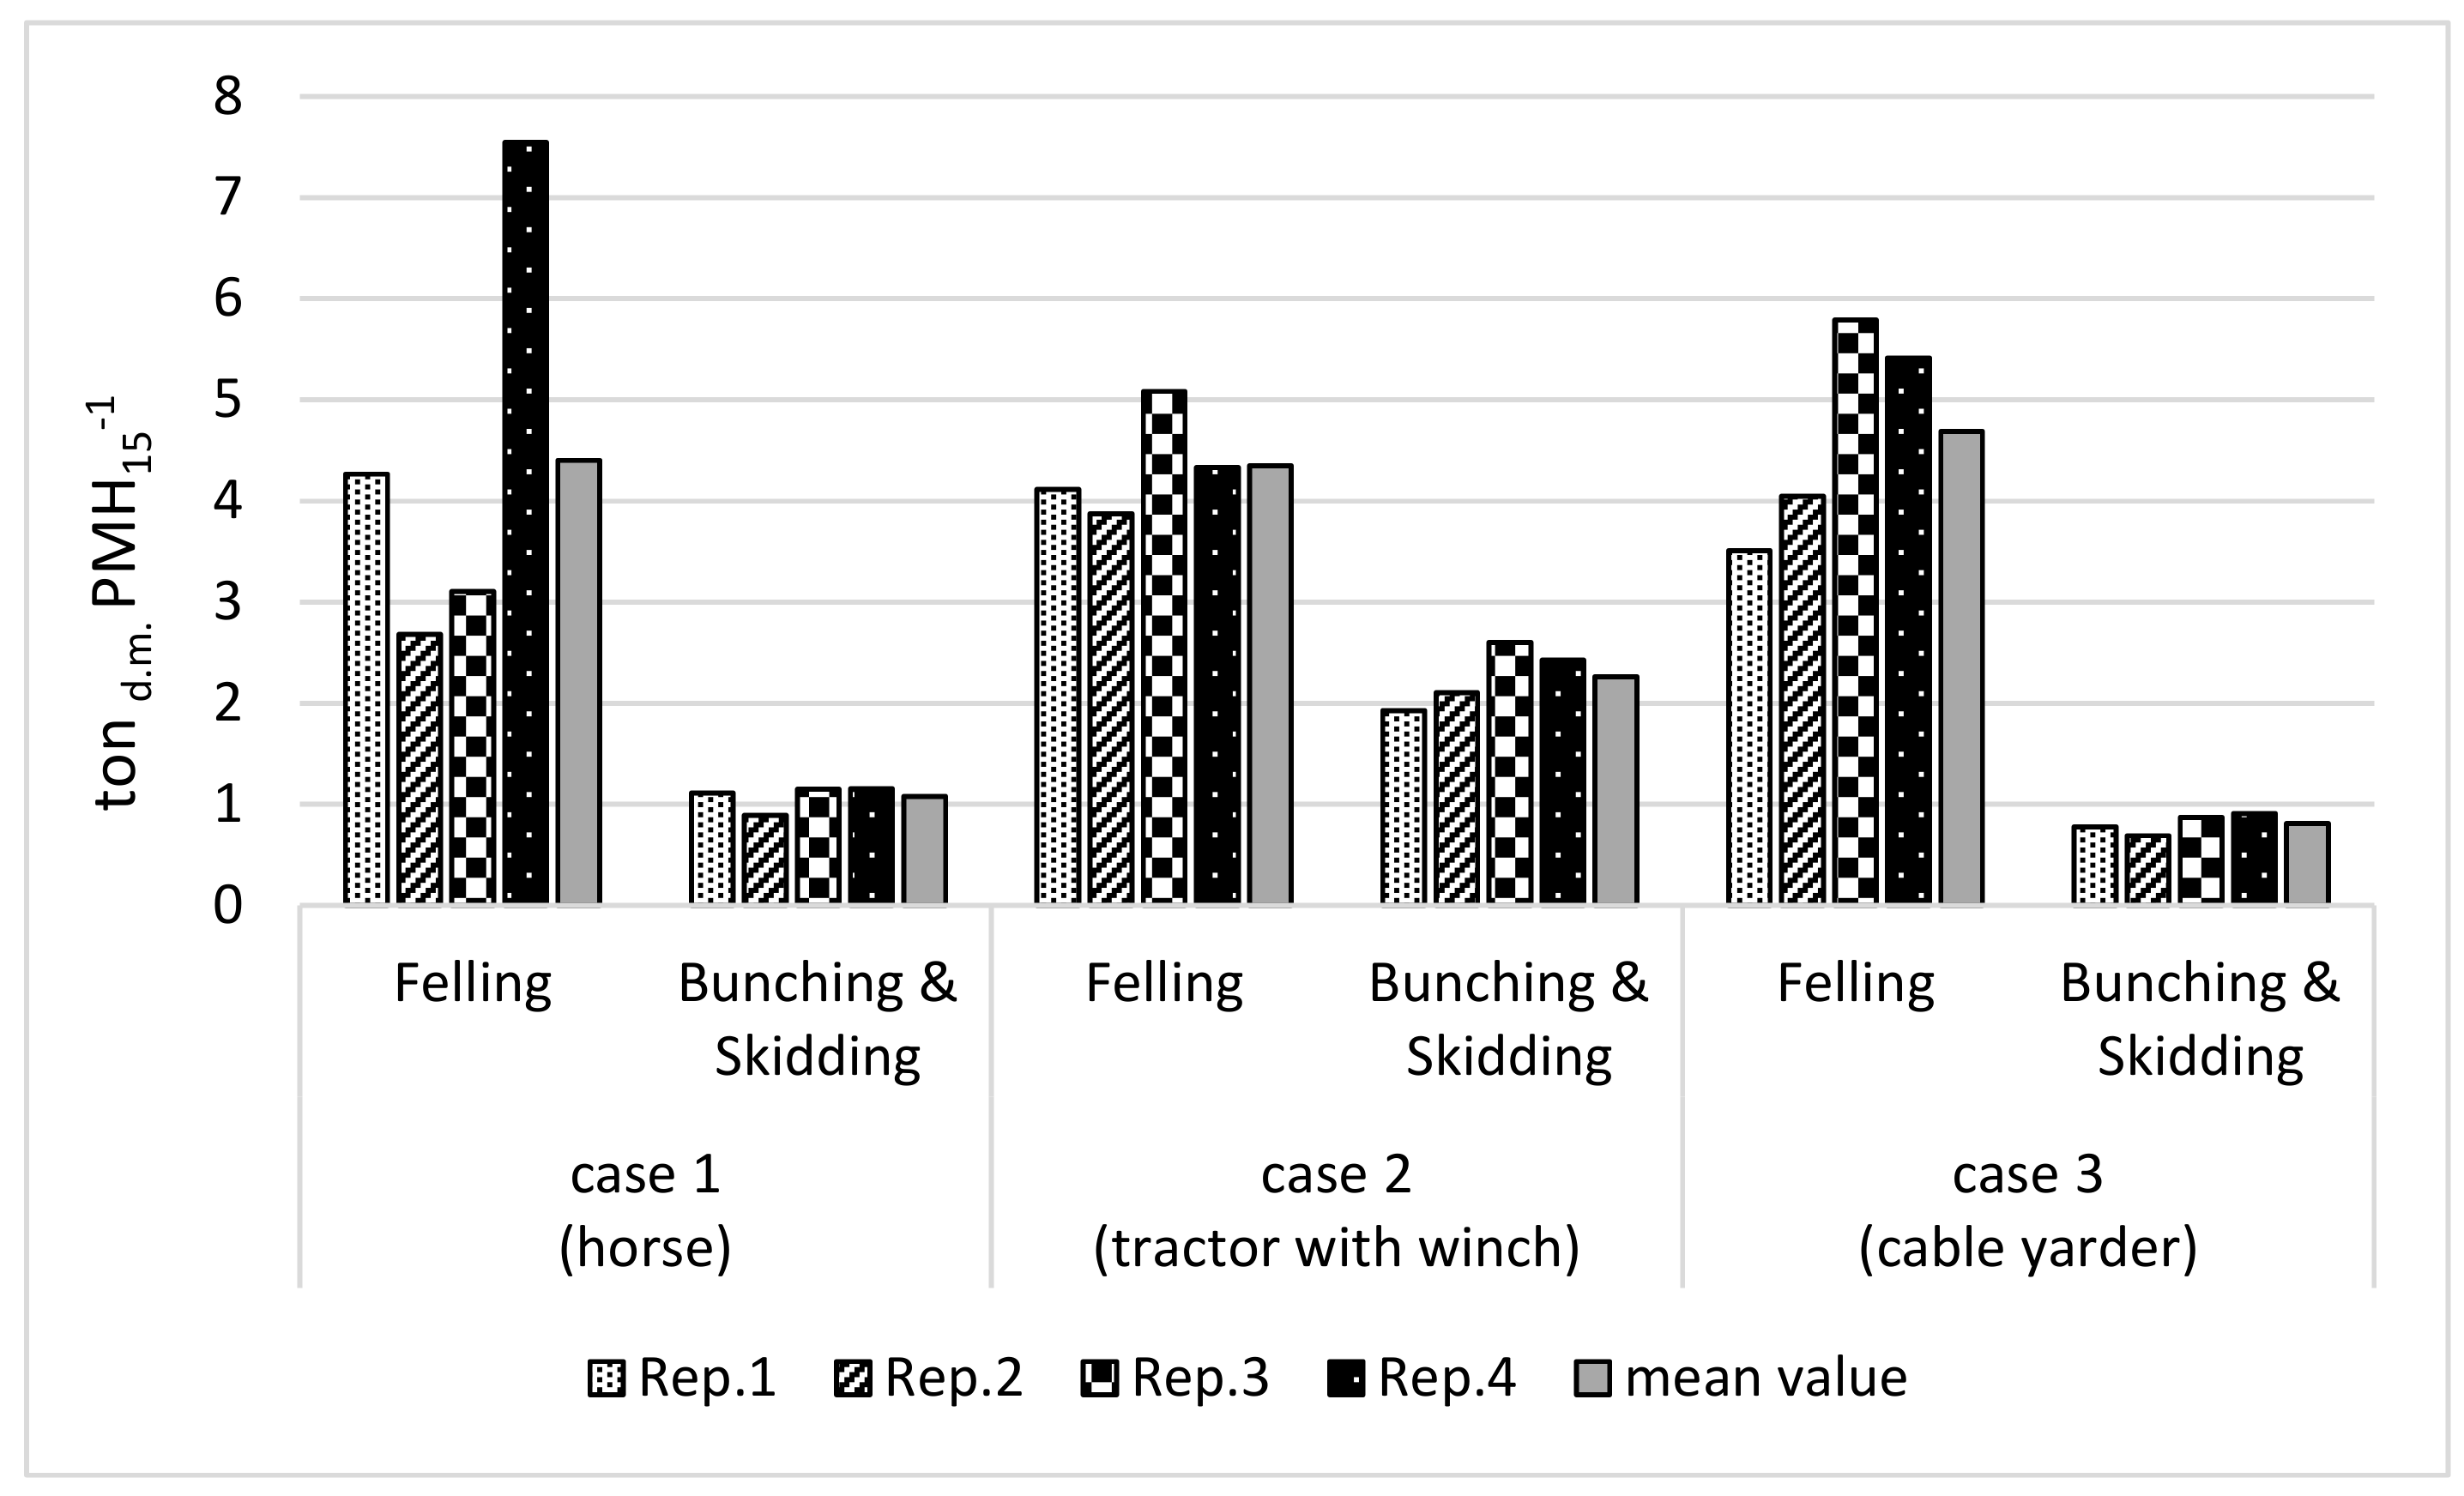
In all three cases, a team consisting of two workers was necessary to conduct the working processes. Resulting system productivity was highest in case 2. Felling was always conducted motor-manually; there were differences between the cases: The average cutting productivity was low in case 2, when trees could be felled non-accurate orientation. The reason was that the two workers struggled less as the trees were felled based on their natural inclination, but this led to a maze of crossed trees on the ground or situations of hanging trees. Therefore, materially, their proceedings were very often difficult and confusing. The result was higher working times than the oriented felling.
It turned out that the most time-consuming process was bunching and skidding. It reached the highest productivities in case 2, followed by case 1 and case 3 (Table 4). When considering average tree diameters (18–24 cm) and steepness of the terrain (50%) the delays in case 1 might be explained (39% of the total working time of bunching and skidding). In case 3, a high share of the total working of bunching and skidding time was spent on hooking and unhooking (34%) and the share of delays was quite high, too (43%). This could be related to the average tree low dimensions, that for yarder extraction needed mainly one chain for tree, with consequential hooking and unhooking time increasing. In contrast, using a tractor with a winch is a common method to extract trees in the case study region. Thus, operators were experienced and spent less working time on hooking and unhooking (24%) and had fewer delays (30%). More training with a yarder would probably lead to an increase in productivity, too.
Costs followed the same pattern and were almost 2.5 times lower in case 2 than in case 3. These figures are quite impressive when indicator results were scaled up to hectares (Table 8), and when considering that there are about 13,000 ha black pine plantations growing in the studied area. To give an example: Managing all plantations with the harvesting systems and machines presented in case 2 would result in total costs of million € 62.4 while it results in million 168.7 when choosing the harvesting systems and machines presented in case 3.
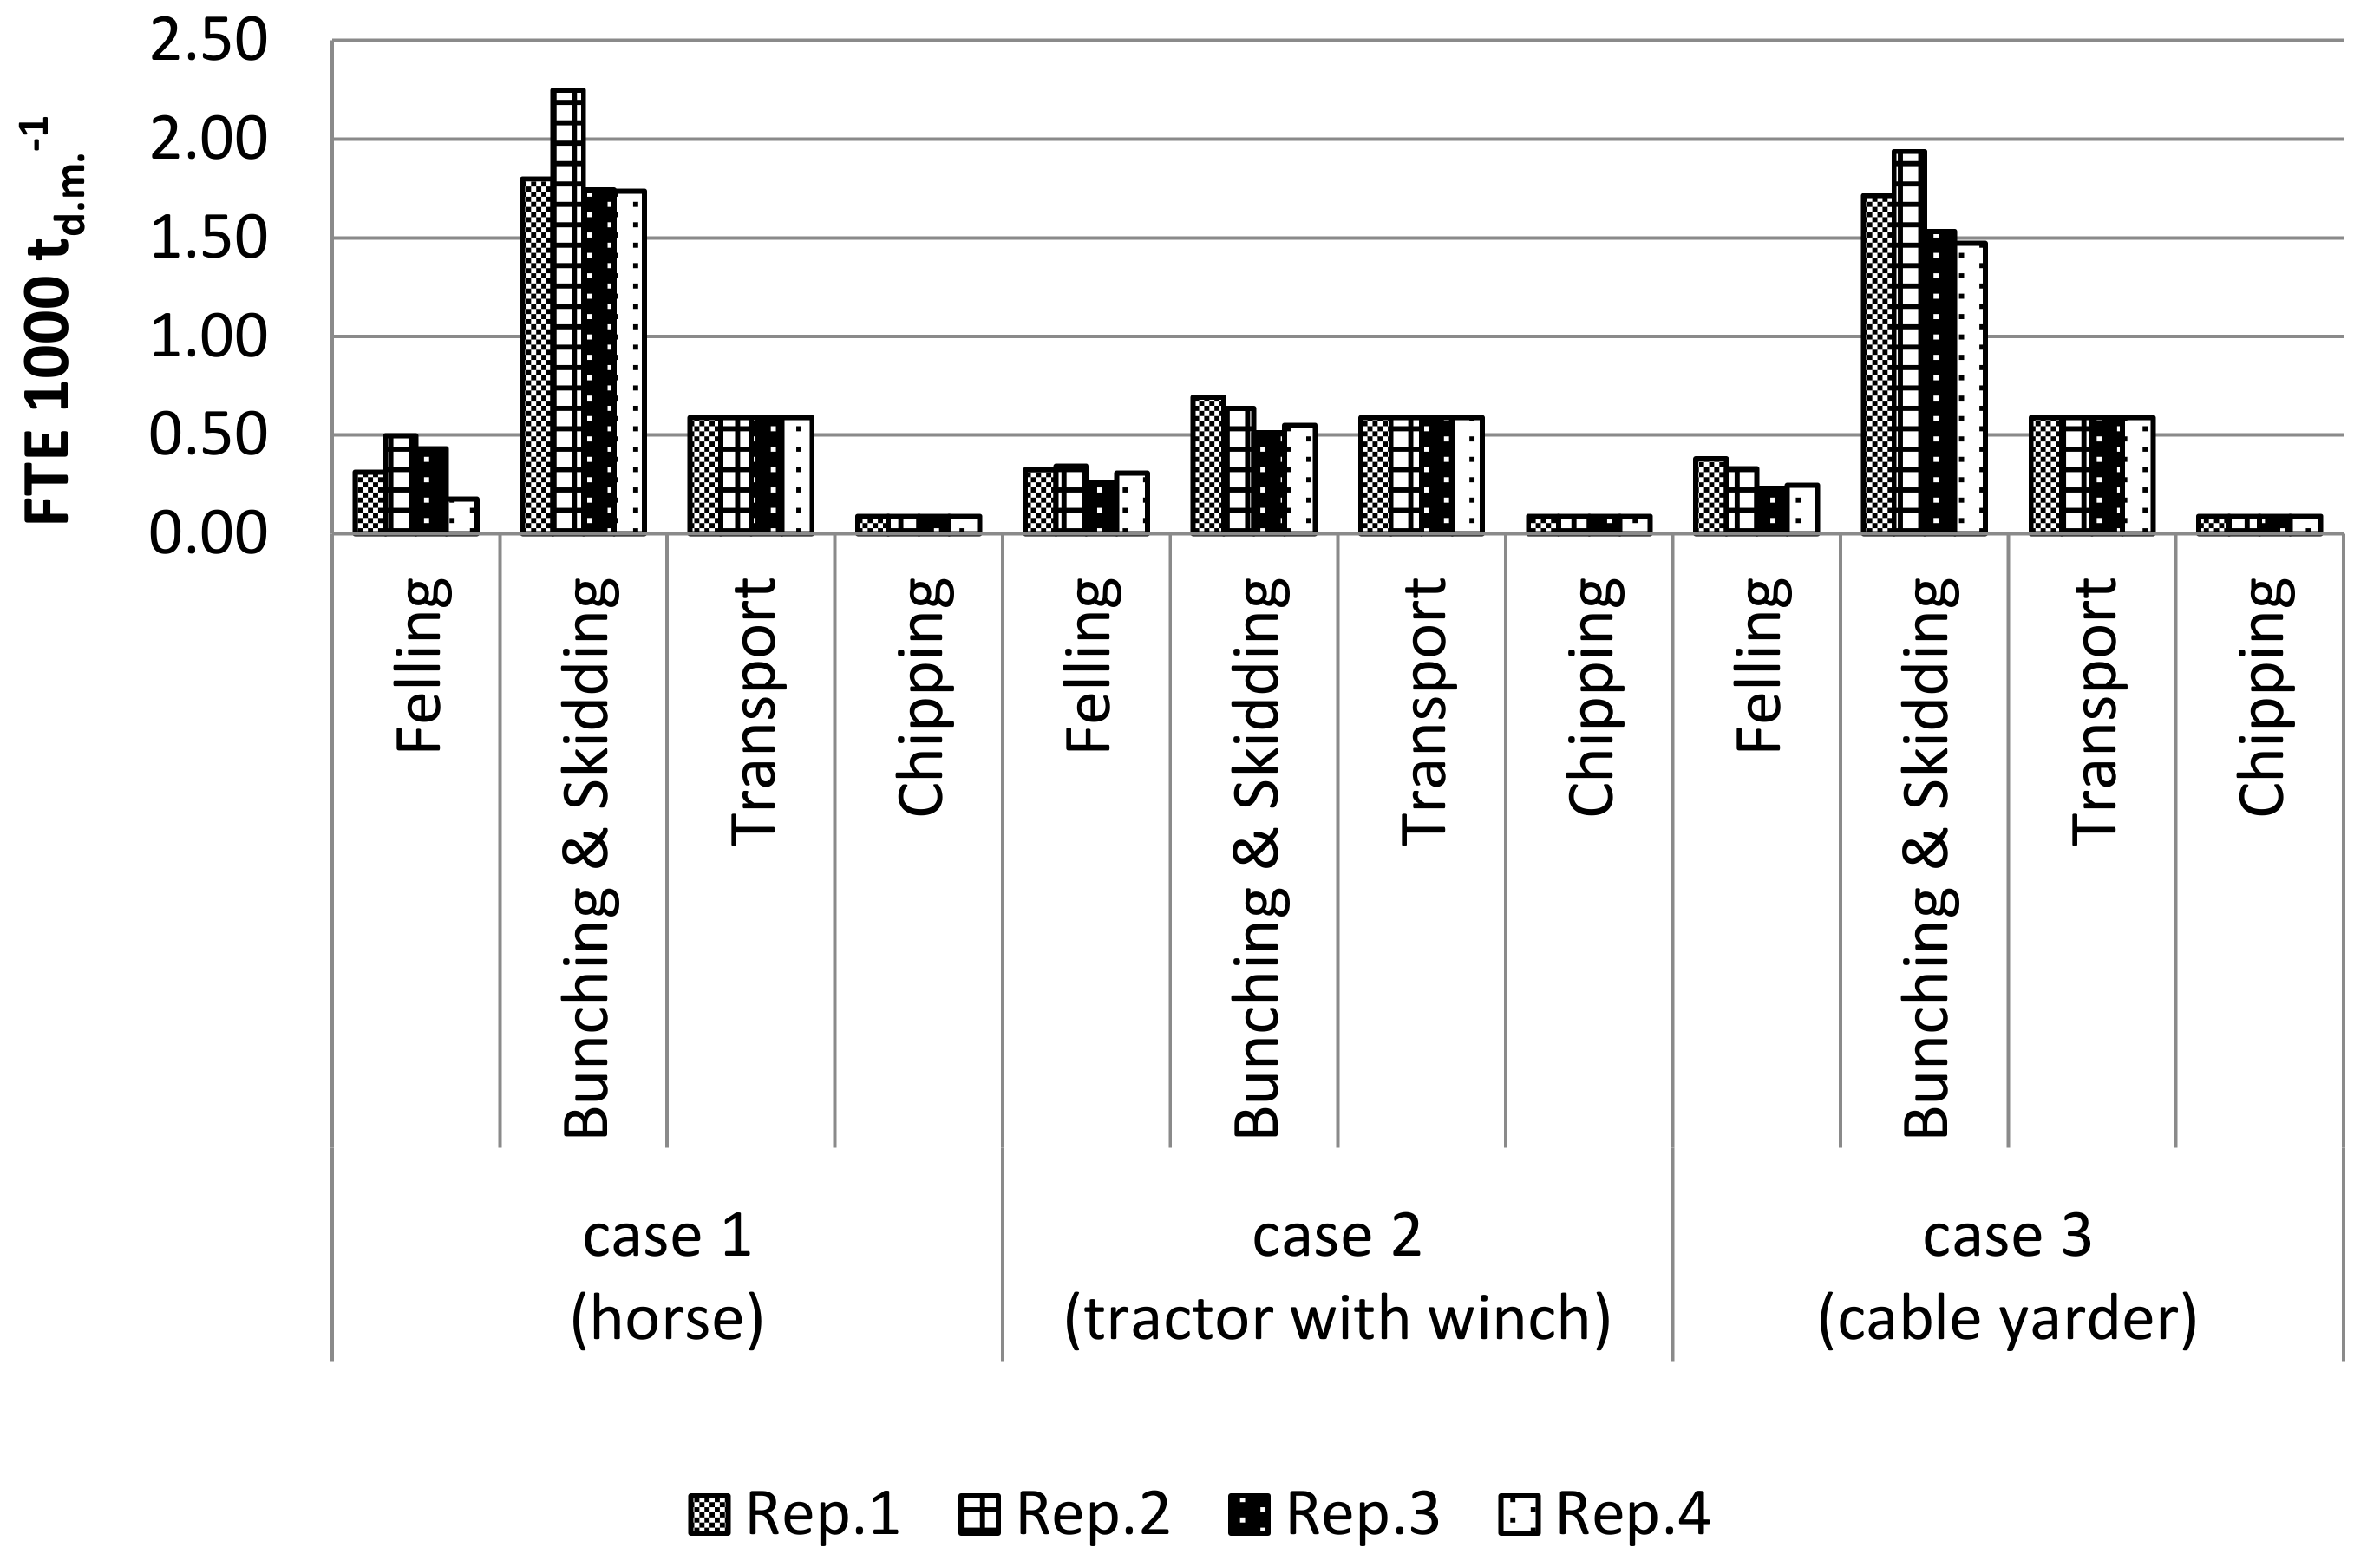
It has to be noted that, in contrast to productivity and costs, the employment (#8 EMP) was highest in case 3 due to the above-mentioned reasons, followed by case 1 and case 2 (Figure 5). Decision makers should have in mind (i) which infrastructure is given in a specific region (e.g., would a yarder be available?); (ii) that it is increasingly difficult to find skilled labor; and (iii) consideration for the question of which possibilities for rural development of an area there are.
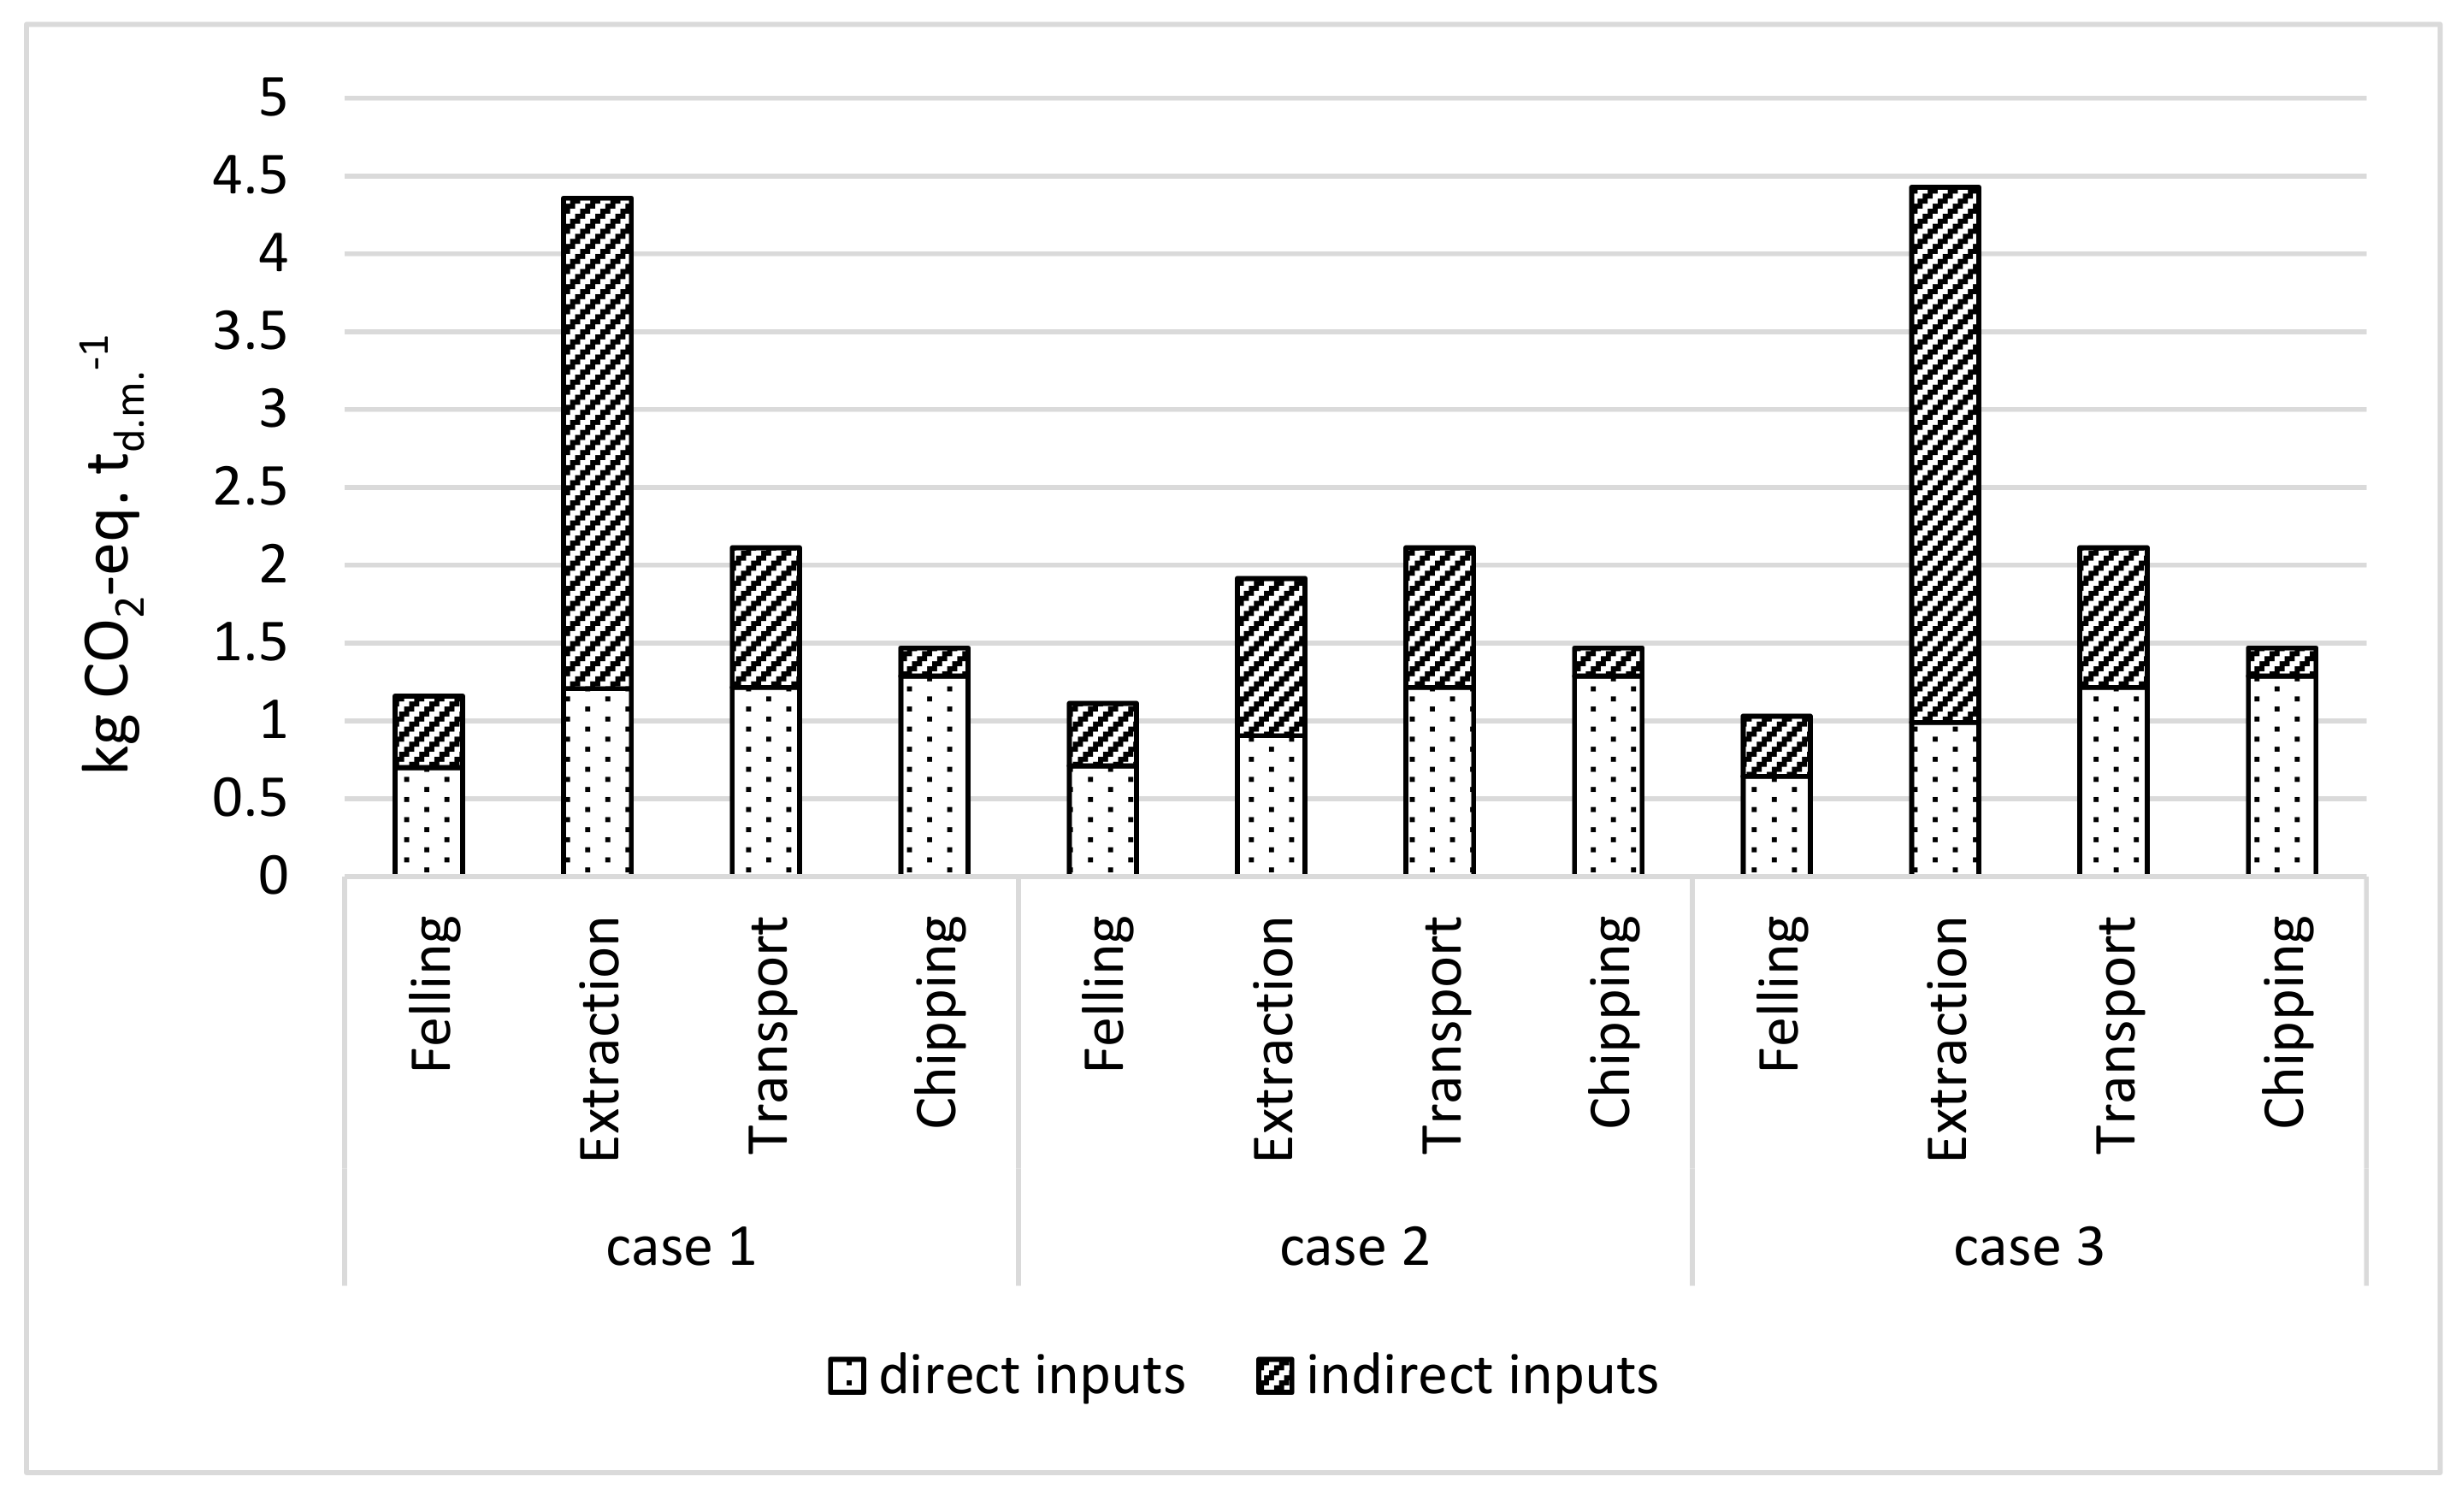
LCA results showed that the cumulated energy demand of fossil energy was lowest in case 1, followed by case 2 and case 3. This fact can be explained by the amount of fuels required by machines. However, surprisingly, the share of indirect emission was quite high (Table 6, Figure 4). For example, it was 38% in the process bunching and skidding in case 1, mainly caused by the daily transport of workers (35 km/way) and the “impact” of the horse on non-working days. It was also high in case 3 (36%) due to the production and maintenance of the yarder.
The potential impacts in the environmental categories global warming potential, eutrophication potential, and acidification potential all followed the same trend (Table 6): Extraction by tractor with a winch resulted in lowest impacts. As inputs were not exclusively, but mainly, fuels we can ascribe to facilitating high productivity and thus, lower fuel consumption reached in case 2.
In mountains areas, the plantations and treatment operations related to re-forestation, had strong and variable effects on plant species occurrence and diversity due to the alteration of ecological processes [83]. However, these plantations contributed to biodiversity conservation in various ways, as found by Poorbabaei and Poorrahmati [84]: A high similarity in species composition between plantation and the adjacent natural forest, which is the main source of seed in plantations, was present. The actual necessity of an active management of pine plantations could have strong and variable effects on plant species’ occurrence and diversity due to treatment operations and canopy cover changes.
As found by Picchio et al. [46], both silvicultural treatment and FO applied in this research, showed changes on density, richness, and biodiversity of tree species in only three years after harvesting. The good density and richness of tree species in this pine plantation indicate the high potential reached by the stand for biodiversity restoration, following what was found in other studies [85,86].
Referring to stand regeneration, different taxonomic compositions of the tree forest community among the cases are shown, in particular in the percentage of distribution, showing a simplification in case 1 with respect to the others. In general, in the cases 1 and 2 (ground-based logging) allowed for the presence of Robinia pseudoacacia and only marginal Pinus nigra regeneration.
The treatments applied showed a positive effect to the SI tree regeneration density, with greater consistency in the cases 2 and 3; compared to the control, they showed increases of 85% and 72%, respectively. The case 1 showed a positive trend, with an increase of about 69% compared to the control.
Other important ecological aspects were assessed, such as the tree richness and diversity of tree species; in particular the tree species diversity was chosen. The case 2 had higher richness values than the control and the cases 1 and 3. However, it is important to note that the data presented so far concern a limited period of time; more time is needed to further evaluate whether the cutting effect on biodiversity will last long [87,88].
Indicator values of the SI soil biological quality showed for the three cases an impact, and the observed variation is explained by the different degrees of soil compaction and the abundance of litter associated with sudden stand removal [59,89]. The QBS-ar values were lowest in the case 3, followed by the case 1. The best situation was found for case 2. In addition, the SI soil microarthropod community density was assessed, and, as can be observed from the data gathered, it was impacted by FOs. Case 2 had higher values than the cases 1 and 3.
To help DMs judging these results, a MCDA was conducted. Weights of criteria were obtained using the DIRECT method. As shown in Table 9, the SI tree regeneration density and soil biological quality were set as most important criteria, because they support the achievement of the forest management goal, followed by the environmental criteria cumulated energy demand, global warming potential, eutrophication potential and acidification potential, while the least important criteria were tree species diversity, soil microarthropod community density, employment, and COSTs (with a weight of 0.050). This decision was related to DMs’ intention to give higher priority to environmental criteria. The two SIs productivity and delay were excluded from the MCDA because they were included in other SI, e.g., in Costs.
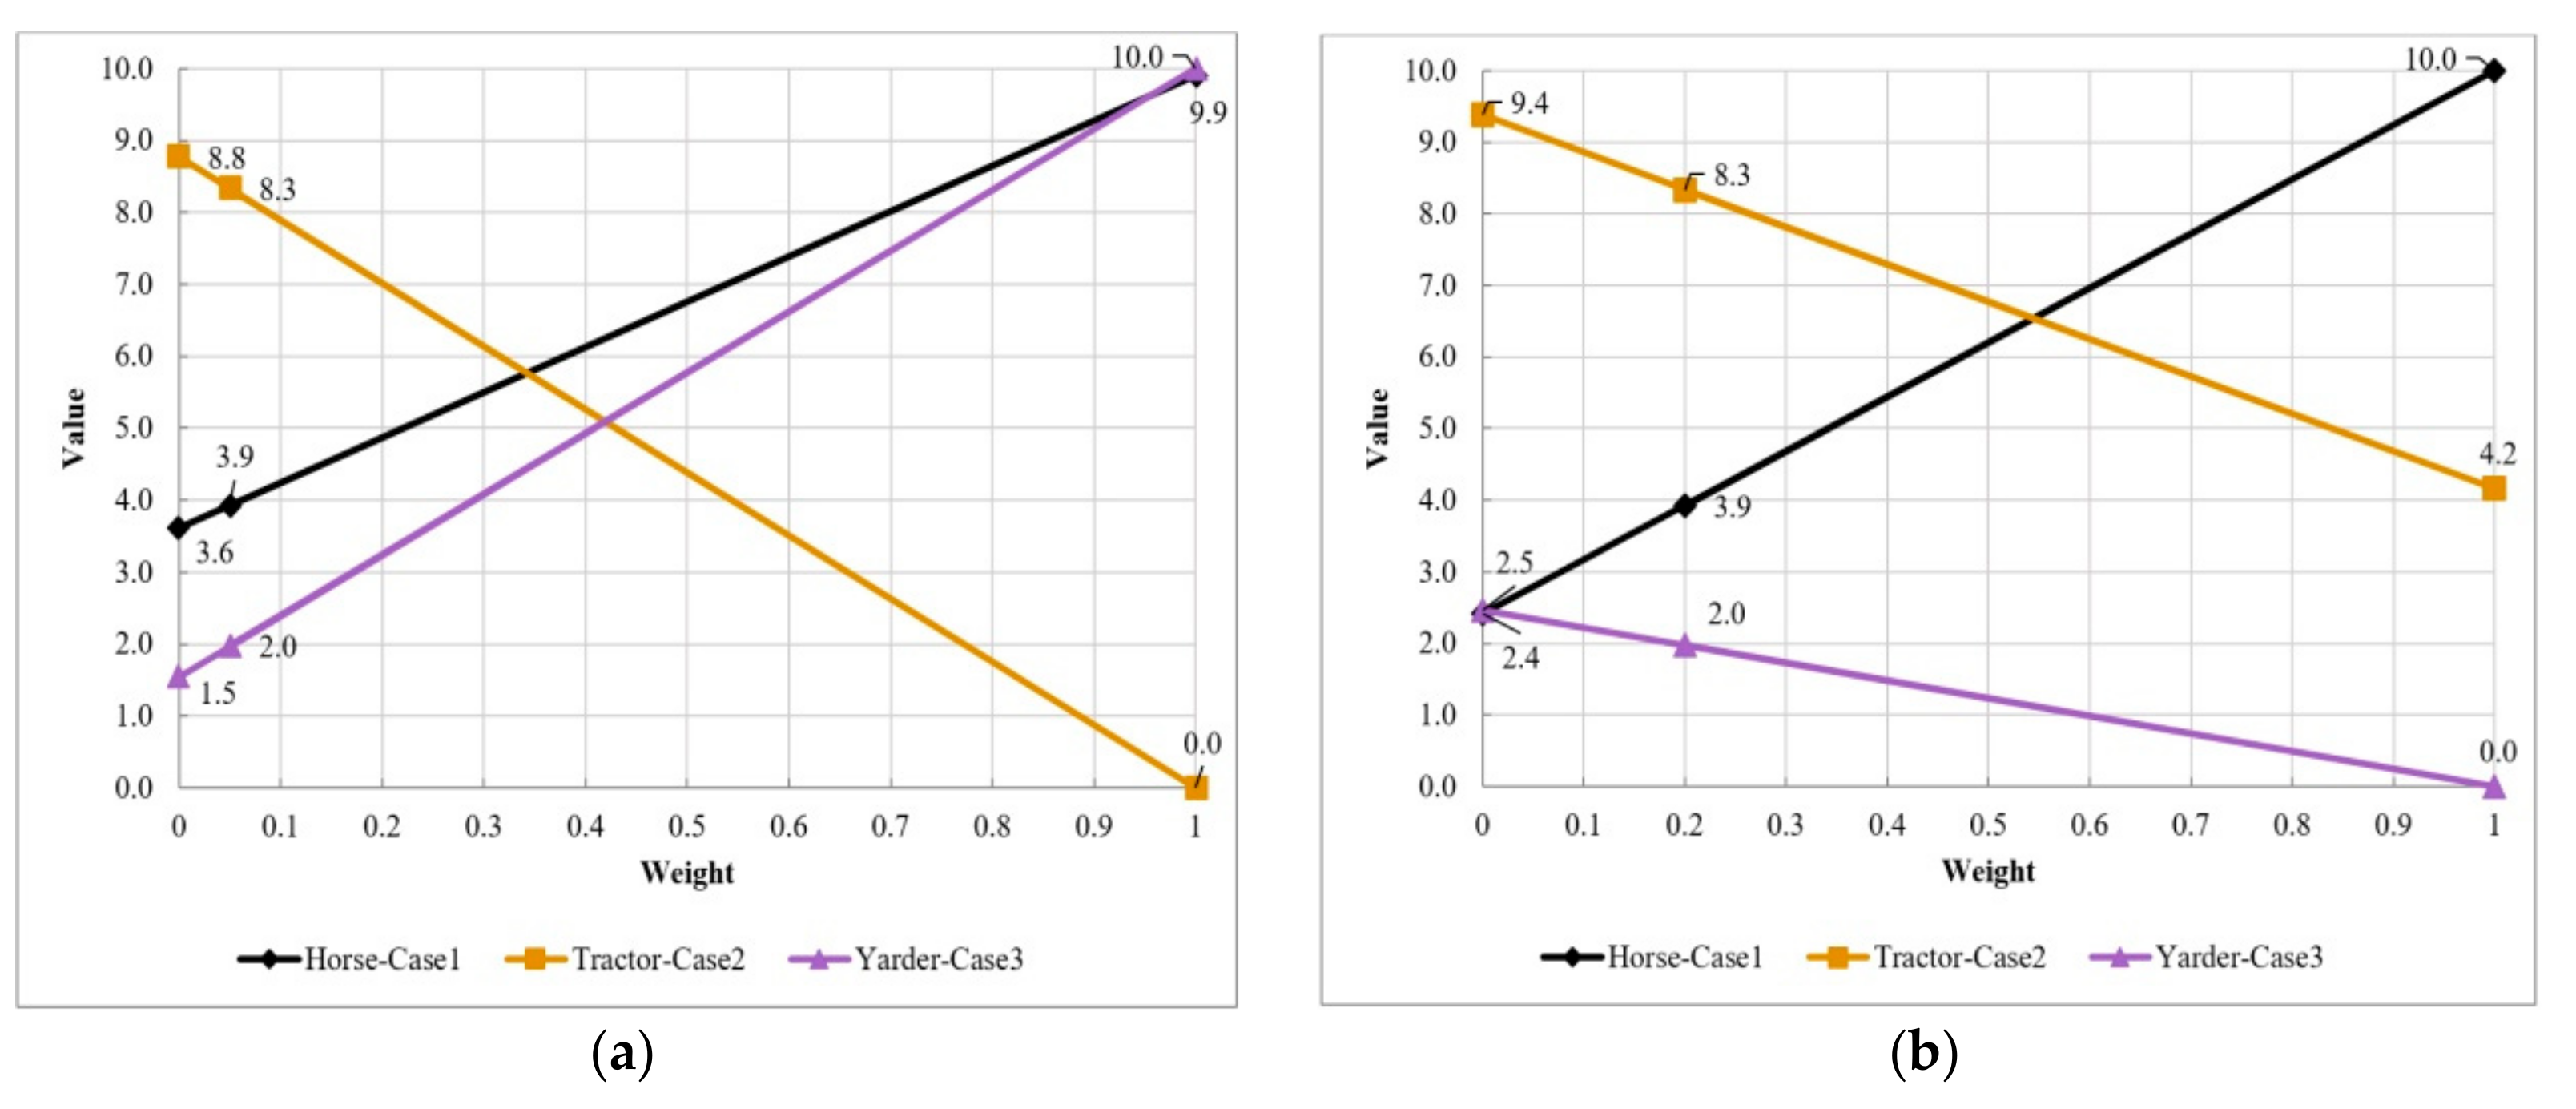
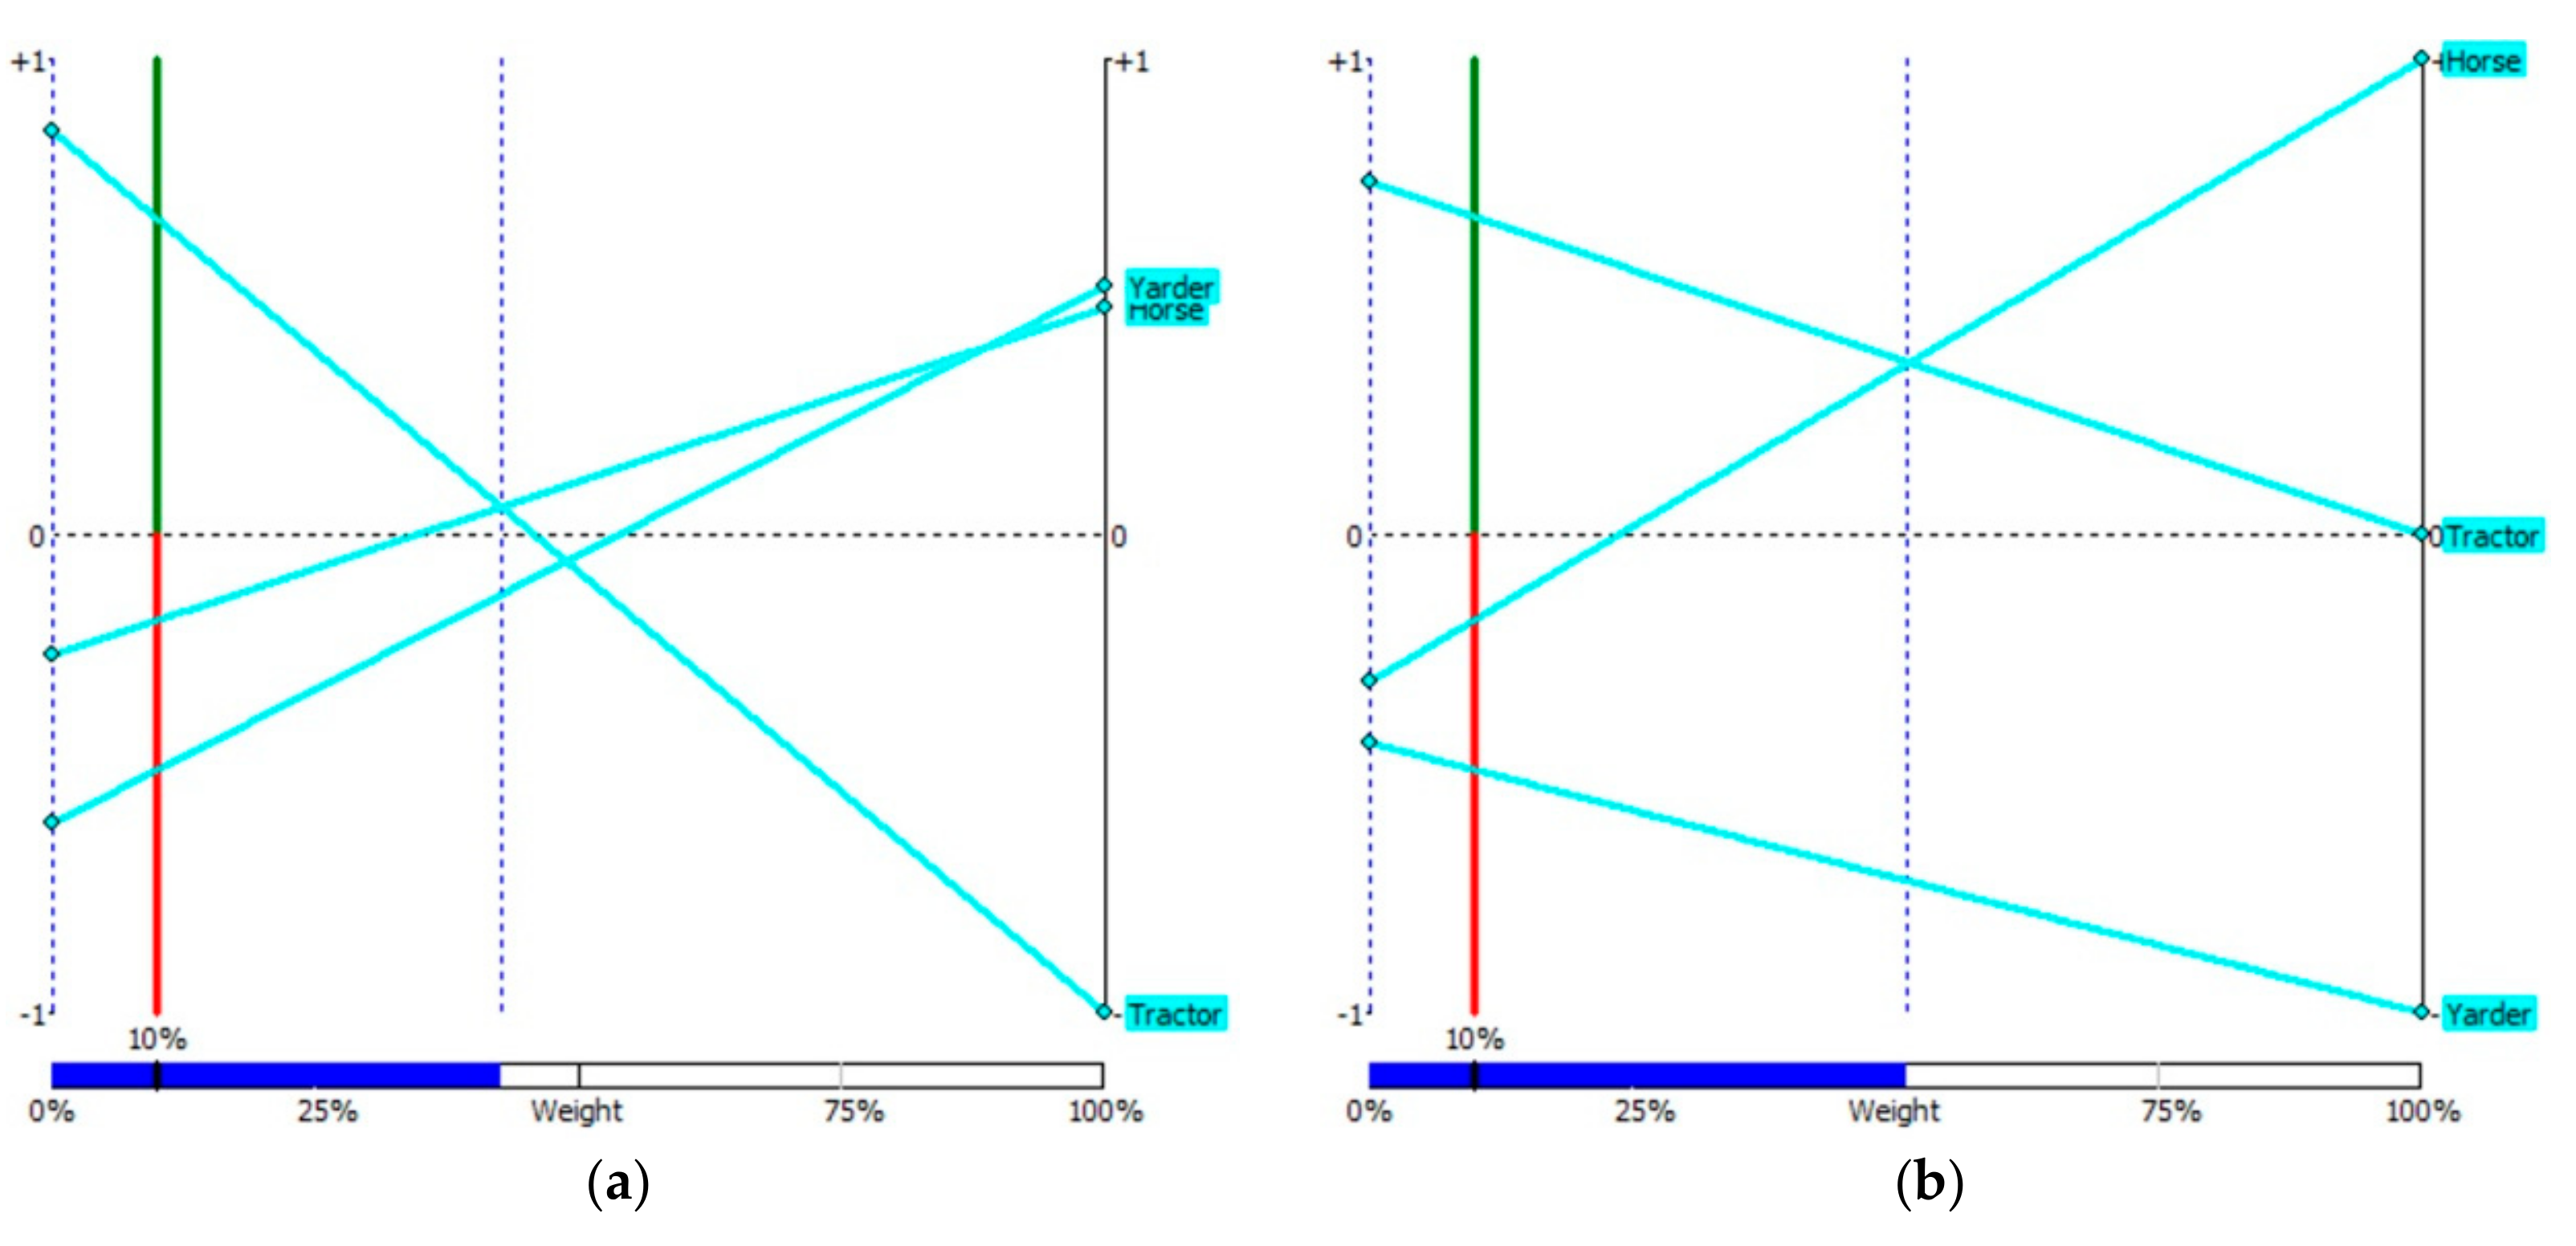
For the ranking of alternatives (cases), two different MCDA methods were applied, namely MAUT and PROMETHEE. They have different philosophies, and therefore often produce different results (rankings), but here, this was not the case. The main reason for that lies in a fact that first ranked alternative (case 2) had best performance for eight (out of 10) criteria. Only for the two criteria, employment and soil biological quality, other alternatives had better performances. Because of that, a sensitive analysis was carried out aiming to estimate how much one needs to change (increase) the weights of those two criteria—employment and soil biological quality—in order to change first ranked alternative (Figure 6 and Figure 7). From the results of the sensitive analysis, we can conclude that case 2 is a very stable first ranked alternative and can be selected as the best one for this case study. Worthy of mention is that the results of the MCDA process were presented to participating individuals; i.e., DMs. No significant complaints by DMs were made about the ranks of analyzed alternatives. Overall, presented approach can improve (and simplify) decision making process and may help experts (or DMs) to select the best alternative for given context.

5. Conclusions

In the preceding years, several changes were ongoing the forest world; for example, the growing interest in sustainability, due to the new awareness of people about the importance of forests from environmental and social points of view, which increased the need of having strong and reliable instruments for decision makers (DMs) to optimize choices in order to satisfy all forests’ stakeholders and interests.
From this perspective, this paper was born with the aim to assess possible impacts on sustainability that were related to FO and the resulting forest wood chains to support the renaturalization strategy in typical. afforested pine plantations in the Mediterranean basin. In detail, three main topics were studied in order to: (i) Identify alternative FO concerning silvicultural actions suitable for renaturalization of the pine stands, thereby putting a special emphasis to the extraction process; (ii) assess the potential impacts on all three pillars of sustainability; and (iii) make comprehensive evaluations of the alternative forest wood chains in order to support DMs.
In order to reach aim the first aim, a SIA and a MCDA were conducted for three different extraction methods in pine stands thinning operations, considering Mediterranean setting. In particular, the analyzed extraction systems were: TPR horse, forestry-fitted farm tractor with a winch, and double drum cable yarder. Obtained results showed that a tractor with a winch was clearly the best alternative, since it showed the best performance for eight out of 10 investigated variables. Thus, it can be said that a forestry-fitted farm tractor with a winch was the best alternative from an economic, environmental, and social point of view. This result was reached setting the SIA and MCDA with particular attention to the environmental aspects, considering that study area is located in a Natural Reserve and that the most important aim of the silvicultural intervention was not economic gain but renaturalization.
The specific result focused on the second aim showed a detailed assessment of FO consequences on all three pillars of sustainability. From economic point of view, only cable yarder showed no positive results, more related to the silvicultural treatment applied. TPR-horses and a tractor with a winch, instead, reached good economic performance. About environmental pillar, all FO applied in this research showed changes on density, richness, and biodiversity of tree species in only three years after harvesting. Indicator values of the QBS-ar showed an impact for the three cases, so one might say that soil ecosystem restoration, in this case, is slower than forest stand one. However, for all these parameters, tractors with winches showed the best values. Concerning the social point of view, it can be said that all three extraction methods had the same labor requirements. In central Italy’s context a TPR-horse and the tractor with a winch are the best-known extraction methods, and this partially explains the cheap results of a cable yarder from economic point of view. In this context, an improvement in cable yarder use, linked to workers’ proper formation, should be recommended; however, that should consider the conditions of high slopes and lack of viability of central Italy forest, in particular, pine stands.
These are important results that fit with one of the major challenges of forest management, regarding the consequences of different management strategies or FOs, by assessing the economic, environmental, and social performance of each individual option before an action is carried out.
Focusing around the third aim, it was possible to affirm that tractor with winch resulted to have the best performance from all point of views, and it represented the best choice for pine stands renaturalization interventions. In fact, it combined good productivity and so quite low costs, contained environmental impacts and good recovery capacity of pre-intervention conditions, and optimum knowledge of its functioning and safety rules of work by central Italy forest workers.
In relation to cable yarder it was important to underline how the poor performances were mainly linked to the silvicultural treatment design (strips of 100 m length were a limit for this equipment).
On the other hand, obtained results confirmed what detected in other previous studies about extraction with animals. The general performances of this extraction methodology were often worse than mechanical ones, not only related to productivity aspects but also to environmental impacts. Even though in this study a TPR-horse resulted to be a good alternative to cable yarder.
Finally, it was possible to say that SIA and MCDA showed satisfying performance in analyzing FO alternatives and thus they resulted to be strong instruments to support DM; and this is very important in the perspective of reaching a sustainable forest management, which leads to satisfy all three pillars of sustainability.

Author Contributions

R.P., R.V. and F.L. performed the field experiments and calculated economic and social indicators; J.S. conducted the LCA; B.B. ran the MCDA; J.S. wrote the manuscript with contributions from R.P. and B.B.

Funding

This research received no external funding.

Acknowledgments

This work was supported by the Italian Ministry for education, University and Research (MIUR) for financial support (Law 232/2016, Italian University Departments of excellence)—UNITUS-DAFNE WP3. While working at the University of Freiburg, J.S. was supported by the European Social Fund and by the Ministry of Science, Research and Arts Baden-Württemberg.

Conflicts of Interest

The authors declare no conflict of interest. The founding sponsors had no role in the design of the study; the collection, analyses, or interpretation of data; the writing of the manuscript, or in the decision to publish the results.

Abbreviations

Sustainability impact assessment (SIA), sustainable forest management (SFM), sustainable development (SD), sustainability indicators (SI), life cycle assessment (LCA), forest operations (FO), heavy rapid skidding horse (TPR-horse), productive machine hours (PMH), productive working hours (PWH), productive machine hours (PMH), greenhouse gas (GHG), global warming potential (GWP), eutrophication potential (EP), acidification potential (AP), employment (EMP), tree regeneration density (TRD), tree species diversity (TSD), soil biological quality index (QBS-ar), soil microarthropod density (SMD), multi-criteria decision analysis (MCDA), multi-attribute utility theory (MAUT), decision makers (DMs), individuals (IND).

References

  1. Tapias, R.; Climent, J.; Pardos, J.A.; Gil, L. Life histories of Mediterranean pines. Plant Ecol. 2004, 171, 53–68. [Google Scholar] [CrossRef]
  2. Peñuelas, J.L.; Ocaña, L. Cultivo de Plantas Forestales en Contenedor; Pesca y Alimentación & Mundi-Prensa: Madrid, Spain, 1996. [Google Scholar]
  3. Barbéro, M.; Loisel, R.; Quézel, P.; Richardson, D.M.; Romane, F. Pines of the Mediterranean Basin. In Ecology and Biogeography of Pinus; Richardson, D.M., Ed.; Cambridge University Press: Cambridge, UK, 2000; pp. 153–170. [Google Scholar]
  4. Maestre, F.T.; Cortina, J. Are Pinus halepensis plantations useful as a restoration tool in semiarid Mediterranean areas? For. Ecol. Manag. 2004, 198, 303–317. [Google Scholar] [CrossRef]
  5. Pausas, J.G.; Bladé, C.; Valdecantos, A.; Seva, J.P.; Fuentes, D.; Alloza, J.A.; Vilagrosa, A.; Bautista, S.; Cortina, J.; Vallejo, R. Pines and oaks in the restoration of Mediterranean landscapes of Spain: New perspectives for an old practice—A review. Plant Ecol. 2004, 171, 209–220. [Google Scholar] [CrossRef]
  6. Marchi, M.; Paletto, A.; Cantiani, P.; Bianchetto, E.; de Meo, I. Comparing thinning system effects on ecosystem services provision in artificial black pine (Pinus nigra J. F. Arnold). Forests 2018, 9, 188. [Google Scholar] [CrossRef]
  7. Spiecker, H. Silvicultural management in maintaining biodiversity and resistance of forests in Europe—Temperate zone. J. Environ. Manag. 2003, 67, 55–65. [Google Scholar] [CrossRef]
  8. Moriondo, M.; Good, P.; Durao, R.; Bindi, M.; Giannakopoulos, C.; Côrte-Real, J. Potential impact of climate change on fire risk in the Mediterranean area. Clim. Res. 2006, 31, 85–95. [Google Scholar] [CrossRef]
  9. Sarris, D.; Christodoulakis, D.; Körner, C. Impact of recent climatic change on growth of low elevation eastern Mediterranean forest trees. Clim. Chang. 2011, 106, 203–223. [Google Scholar] [CrossRef]
  10. Gómez-Aparicio, L.; Zavala, M.A.; Bonet, F.J.; Zamora, R. Are pine plantations valid tools for restoring Mediterranean forests? An assessment along gradients of climatic conditions, stand density and distance to seed sources. Ecol. Appl. 2009, 19, 2124–2141. [Google Scholar] [CrossRef]
  11. Jiménez, M.N.; Spotswood, E.N.; Cañadas, E.M.; Navarro, F.B. Stand management to reduce fire risk promotes understorey plant diversity and biomass in a semi-arid Pinus halepensis plantation. Appl. Veg. Sci. 2015, 18, 467–480. [Google Scholar] [CrossRef]
  12. Navarro-Cerrillo, R.M.; Sánchez-Salguero, R.; Rodriguez, C.; Duque Lazo, J.; Moreno-Rojas, J.M.; Palacios-Rodriguez, G.; Camarero, J.J. Is thinning an alternative when trees could die in response to drought? The case of planted Pinus nigra and P. Sylvestris stands in southern Spain. For. Ecol. Manag. 2019, 433, 313–324. [Google Scholar] [CrossRef]
  13. Ciancio, O.; Mercurio, R.; Nocentini, S. First thinnings of young conifer stands: Strategy and perspectives. In Proceedings of the IUFRO XX World Congress, Tampere, Finland, 6–12 August 1995; pp. 61–66. [Google Scholar]
  14. De Meo, I.; Cantiani, P.; Becagli, C.; Bianchetto, E.; Cazau, C.; Mocali, S.; Salerni, E. Thinnings to enanche biodiversity in black pine stands: A case study in Italian Appennine. In Proceedings of the Forestry: Bridge to the Future Conference, Sofia, Bulgaria, 6–9 May 2015. [Google Scholar]
  15. Muscolo, A.; Settineri, G.; Bagnato, S.; Mercurio, R.; Sidari, M. Use of canopy gap openings to restore coniferous stands in Mediterranean environment. iForest Biogeosci. For. 2017, 10, 322–327. [Google Scholar] [CrossRef] [Green Version]
  16. Pollet, J.; Omi, P.N. Effect of thinning and prescribed burning on crown fire severity in ponderosa pine forests. Int. J. Wildland Fire 2002, 11. [Google Scholar] [CrossRef]
  17. Crecente-Campo, F.; Pommerening, A.; Rodríguez-Soalleiro, R. Impacts of thinning on structure, growth and risk of crown fire in a Pinus sylvestris L. plantation in northern Spain. For. Ecol. Manag. 2009, 257, 1945–1954. [Google Scholar] [CrossRef]
  18. Marchi, E.; Chung, W.; Visser, R.; Abbas, D.; Nordfjell, T.; Mederski, P.S.; McEwan, A.; Brink, M.; Laschi, A. Sustainable Forest Operations (SFO): A new paradigm in a changing world and climate. Sci. Total Environ. 2018, 634, 1385–1397. [Google Scholar] [CrossRef] [PubMed] [Green Version]
  19. Olajuyigbe, S.; Tobin, B.; Saunders, M.; Nieuwenhuis, M. Forest thinning and soil respiration in a Sitka spruce forest in Ireland. Agric. For. Meteorol. 2012, 157, 86–95. [Google Scholar] [CrossRef]
  20. Cambi, M.; Certini, G.; Neri, F.; Marchi, E. The impact of heavy traffic on forest soils: A review. For. Ecol. Manag. 2015, 338, 124–138. [Google Scholar] [CrossRef]
  21. Grigal, D.F. Effects of extensive forest management on soil productivity. For. Ecol. Manag. 2000, 138, 167–185. [Google Scholar] [CrossRef]
  22. Korb, J.E.; Fulé, P.Z.; Gideon, B. Different Restoration Thinning Treatments Affect Level of Soil Disturbance in Ponderosa Pine Forests of Northern Arizona, USA. Ecol. Restor. 2007, 25, 43–49. [Google Scholar] [CrossRef]
  23. Petrenko, C.L.; Friedland, A.J. Mineral soil carbon pool responses to forest clearing in Northeastern hardwood forests. GCB Bioenergy 2015, 7, 1283–1293. [Google Scholar] [CrossRef]
  24. Frey, B.; Niklaus, P.A.; Kremer, J.; Lüscher, P.; Zimmermann, S. Heavy-Machinery Traffic Impacts Methane Emissions as Well as Methanogen Abundance and Community Structure in Oxic Forest Soils. Appl. Environ. Microbiol. 2011, 77, 6060–6068. [Google Scholar] [CrossRef] [Green Version]
  25. Picchio, R.; Neri, F.; Petrini, E.; Verani, S.; Marchi, E.; Certini, G. Machinery-induced soil compaction in thinning two pine stands in central Italy. For. Ecol. Manag. 2012, 285, 38–43. [Google Scholar] [CrossRef]
  26. Tavankar, F.; Bonyad, A.E.; Majnounian, B. Affective factors on residual tree damage during selection cutting and cable-skidder logging in the Caspian forests, Northern Iran. Ecol. Eng. 2015, 83, 505–512. [Google Scholar] [CrossRef]
  27. Picchio, R.; Magagnotti, N.; Sirna, A.; Spinelli, R. Improved winching technique to reduce logging damage. Ecol. Eng. 2012, 47, 83–86. [Google Scholar] [CrossRef]
  28. Cambi, M.; Hoshika, Y.; Mariotti, B.; Paoletti, E.; Picchio, R.; Venanzi, R.; Marchi, E. Compaction by a forest machine affects soil quality and Quercus robur L. seedling performance in an experimental field. For. Ecol. Manag. 2017, 384, 406–414. [Google Scholar] [CrossRef]
  29. Đuka, A.; Vusić, D.; Horvat, D.; Šušnjar, M.; Pandur, Z.; Papa, I. LCA Studies in Forestry—Stagnation or Progress? Croat. J. For. Eng. 2017, 38, 311–326. [Google Scholar]
  30. Schweier, J.; Molina-Herrera, S.; Ghirardo, A.; Grote, R.; Díaz-Pinés, E.; Kreuzwieser, J.; Haas, E.; Rennenberg, H.; Schnitzler, J.-P.; Becker, G.; et al. Environmental impacts of bioenergy wood production from poplar short-rotation coppice grown at a marginal agricultural site in Germany. GCB Bioenergy 2017, 9, 1207–1221. [Google Scholar] [CrossRef] [Green Version]
  31. Albizu-Urionabarrenetxea, P.M.; Tolosana-Esteban, E.; Roman-Jordan, E. Safety and health in forest harvesting operations. Diagnosis and preventive actions. A review. For. Syst. 2013, 22, 392–400. [Google Scholar] [CrossRef]
  32. Laschi, A.; Marchi, E.; González-García, S. Forest operations in coppice: Environmental assessment of two different logging methods. Sci. Total Environ. 2016, 562, 493–503. [Google Scholar] [CrossRef]
  33. Lindroos, O.; La Hera, P.; Häggström, C. Drivers of Advances in Mechanized Timber Harvesting—A Selective Review of Technological Innovation. Croat. J. For. Eng. 2017, 38, 243–258. [Google Scholar]
  34. Laschi, A.; Marchi, E.; Foderi, C.; Neri, F. Identifying causes, dynamics and consequences of work accidents in forest operations in an alpine context. Saf. Sci. 2016, 89, 28–35. [Google Scholar] [CrossRef]
  35. Spinelli, R.; Magagnotti, N.; Schweier, J. Trends and perspectives in coppice harvesting. Croat. J. For. Eng. 2017, 38, 219–230. [Google Scholar]
  36. Enache, A.; Kühmaier, M.; Visser, R.; Stampfer, K. Forestry Operations in the European Mountains: A study of current practices and efficiency gaps. Scand. J. For. Res. 2016, 31, 1–39. [Google Scholar] [CrossRef]
  37. Siry, J.P.; Cubbage, F.W.; Potter, K.M.; McGinley, K. Current Perspectives on Sustainable Forest Management: North America. Curr. For. Rep. 2018, 4, 138–149. [Google Scholar] [CrossRef]
  38. Schweier, J.; Magagnotti, N.; Labelle, E.R.; Athanassiadis, D. Sustainability Impact Assessment of Forest Operations: A Review. Curr. For. Rep. 2019, 1–13. [Google Scholar] [CrossRef]
  39. Lindner, M.; Suominen, T.; Palosuo, T.; Garcia-Gonzalo, J.; Verweij, P.; Zudin, S.; Päivinen, R. ToSIA—A tool for sustainability impact assessment of forest-wood-chains. Ecol. Model. 2010, 221, 2197–2205. [Google Scholar] [CrossRef]
  40. Diaz-Balteiro, L.; Romero, C. Making forestry decisions with multiple criteria: A review and an assessment. For. Ecol. Manag. 2008, 255, 3222–3241. [Google Scholar] [CrossRef]
  41. Belton, V.; Stewart, T. Multiple Criteria Decision Analysis: An Integrated Approach; Springer: Norwell, MA, USA, 2002; p. 372. [Google Scholar]
  42. Triantaphyllou, E.; Shu, B.; Nieto Sanchez, S.; Ray, T. Multi-Criteria Decision Making: An Operations Research Approach. In Encyclopedia of Electrical and Electronics Engineering; John Wiley & Sons: New York, NY, USA, 2015; Volume 15, pp. 175–186. [Google Scholar]
  43. Acosta, M.; Corral, S. Multicriteria Decision Analysis and Participatory Decision Support Systems in Forest Management. Forests 2017, 8, 116. [Google Scholar] [CrossRef]
  44. Schweier, J.; Spinelli, R.; Magagnotti, N.; Wolfslehner, B.; Lexer, M.J. Sustainability Assessment of Alternative Thinning Operations in Mediterranean Softwood Plantations. Forests 2018, 9, 375. [Google Scholar] [CrossRef]
  45. Blagojević, B.; Jonsson, R.; Björheden, R.; Nordström, E.-M.; Lindroos, O. Multi-Criteria Decision Analysis (MCDA) in Forest Operations—An Introductional Review. Croat. J. For. Eng. 2019, 40, 191–205. [Google Scholar]
  46. Picchio, R.; Mercurio, R.; Venanzi, R.; Gratani, L.; Giallonardo, T.; Monaco, A.L.; Frattaroli, A.R. Strip Clear-Cutting Application and Logging Typologies for Renaturalization of Pine Afforestation—A Case Study. Forests 2018, 9, 366. [Google Scholar] [CrossRef]
  47. Päivinen, R.; Lindner, M.; Rosén, K.; Lexer, M.J. A concept for assessing sustainability impacts of forestry-wood chains. Eur. J. For. Res. 2012, 131, 7–19. [Google Scholar] [CrossRef]
  48. European Commission; Joint Research Centre; Institute for Environment and Sustainability (Eds.) International Reference Life Cycle Data System (ILCD) Handbook—General Guide for Life Cycle Assessment—Detailed Guidance, 1st ed.; Publications Office of the European Union: Luxembourg, 2010. [Google Scholar]
  49. Päivinen, R.; Lindner, M. Assessment of Sustainability of Forest Wood Chains; Cesaro, L., Gatto, P., Pettenella, D., Eds.; European Forest Institute: Joensuu, Finland, 2008; pp. 153–160. [Google Scholar]
  50. Pülzl, H.; Prokofieva, I.; Berg, S.; Rametsteiner, E.; Aggestam, F.; Wolfslehner, B. Indicator development in sustainability impact assessment: Balancing theory and practice. Eur. J. For. Res. 2012, 131, 35–46. [Google Scholar] [CrossRef]
  51. OECD. Environmental Indicators. Towards Sustainable Development; OECD Publications: Paris, France, 2001. [Google Scholar]
  52. MCPFE. Improved Pan-European Indicators for Sustainable Forest Management; MCPFE Liaison Unit: Vienna, Austria, 2003; Available online: http://www.foresteurope.org/documentos/improved_indicators.pdf (accessed on 18 October 2017).
  53. Pourbabaei, H.; Haddadi-Moghaddam, H.; Begyom-Faghir, M.; Abedi, T. Theinfluence of gap size on plant species diversity and composition in beech (Fagus orientalis) forests, Ramsar, Mazandaran Province, North of Iran. Biodiversitas 2013, 14, 89–94. [Google Scholar] [CrossRef]
  54. Picchio, R.; Tavankar, F.; Venanzi, R.; Lo Monaco, A.; Nikooy, M. Study of forest road effect on tree community and stand structure in three Italian and Iranian temperate forests. Croat. J. For. Eng. 2018, 39, 57–70. [Google Scholar]
  55. Pielou, E. The measurement of diversity in different types of biological collections. J. Theor. Boil. 1966, 13, 131–144. [Google Scholar] [CrossRef]
  56. Burton, P.J.; Balisky, A.C.; Coward, L.P.; Kneeshaw, D.D.; Cumming, S.G. The value of managing for biodiversity. For. Chron. 1992, 68, 225–237. [Google Scholar] [CrossRef]
  57. Begehold, H.; Rzanny, M.; Winter, S. Patch patterns of lowland beech forests in a gradient of management intensity. For. Ecol. Manag. 2016, 360, 69–79. [Google Scholar] [CrossRef]
  58. Parisi, V.; Menta, C.; Gardi, C.; Jacomini, C.; Mozzanica, E. Microarthropod communities as a tool to assess soil quality and biodiversity: A new approach in Italy. Agric. Ecosyst. Environ. 2005, 105, 323–333. [Google Scholar] [CrossRef]
  59. Venanzi, R.; Picchio, R.; Piovesan, G. Silvicultural and logging impact on soil characteristics in Chestnut (Castanea sativa Mill.) Mediterranean coppice. Ecol. Eng. 2016, 92, 82–89. [Google Scholar] [CrossRef]
  60. Marchi, E.; Picchio, R.; Mederski, P.S.; Vusi´c, D.; Perugini, M.; Venanzi, R. Impact of silvicultural treatment and forest operation on soil and regeneration in Mediterranean Turkey oak (Quercus cerris L.) coppice with standards. Ecol. Eng. 2016, 95, 475–484. [Google Scholar] [CrossRef]
  61. Blasi, S.; Menta, C.; Balducci, L.; Delia Conti, F.; Petrini, E.; Piovesan, G. Soil microarthropod communities from Mediterranean forest ecosystems in Central Italy under different disturbances. Environ. Monit. Assess. 2013, 185, 1637–1655. [Google Scholar] [CrossRef] [PubMed]
  62. Picchio, R.; Spina, R.; Maesano, M.; Carbone, F.; Monaco, A.L.; Marchi, E. Stumpage value in the short wood system for the conversion into high forest of an oak coppice. For. Stud. China 2011, 13, 252–262. [Google Scholar] [CrossRef]
  63. Spinelli, R.; Visser, R. Analyzing and Estimating Delays in Harvester Operations. Int. J. For. Eng. 2008, 19, 36–41. [Google Scholar] [CrossRef]
  64. Engel, A.-M.; Wegener, J.; Lange, M. Greenhouse gas emissions of two mechanised wood harvesting methods in comparison with the use of draft horses for logging. Eur. J. For. Res. 2012, 131, 1139–1149. [Google Scholar] [CrossRef]
  65. Picchio, R.; Maesano, M.; Savelli, S.; Marchi, E. Productivity and energy balance in conversion of a Quercus cerris L. coppice stand into high forest in Central Italy. Croat. J. For. Eng. 2009, 30, 15–26. [Google Scholar]
  66. Knechtle, N. Materialprofile von Holzerntesystemen—Analyse Ausgewählter Beispiele als Grundlage für ein Forsttechnisches Ökoinventar; ETH Zürich: Zürich, Switzerland, 1997. [Google Scholar]
  67. Athanassiadis, D.; Lidestav, G.; Nordfjell, T. Energy use and emissions due to the manufacture of a forwarder. Resour. Conserv. Recycl. 2002, 34, 149–160. [Google Scholar] [CrossRef]
  68. Timberjack. Green Forests Machines for Sustainable Development. Environmental Declaration; Timberjack: Tampere, Finland, 2002. [Google Scholar]
  69. Institut für Umweltinformatik. Umberto; Institut für Umweltinformatik: Hamburg, Germany, 2011. [Google Scholar]
  70. Ecoinvent. Swiss Center for Life Cycle Inventories: St Gallen, Switzerland. 2010. Available online: https://www.ecoinvent.org/ (accessed on 20 May 2019).
  71. Tavankar, F.; Majnounian, B.; Bonyad, A. Felling and skidding damage to residual trees following selection cutting in Caspian forests of Iran. J. For. Sci. 2013, 59, 196–203. [Google Scholar] [CrossRef] [Green Version]
  72. INFC. Inventario Nazionale Delle Foreste E Dei Serbatoi Forestali Di Carbonio [Forest Area Estimates 2005—Section 1. MiPA—Corpo Forestale Dello Stato—Ispettorato Generale, CRA-ISAFA, Trento, Italy. Italian National Forest Inventory, INFC]; INFC: Trento, Italy, 2007; pp. 1–413. (In Italian) [Google Scholar]
  73. Keeney, R.; Raiffa, H. Decision with Multiple Objectives: Preferences and Value Tradeoffs; Wiley: New York, NY, USA, 1976; p. 569. [Google Scholar]
  74. Brans, J.; Vincke, P.; Mareschal, B. How to select and how to rank projects: The Promethee method. Eur. J. Oper. Res. 1986, 24, 228–238. [Google Scholar] [CrossRef]
  75. Ishizaka, A.; Nemery, P. Multi-Criteria Decision Analysis: Methods and Software; John Wiley & Sons: Chichester, UK, 2013; p. 310. [Google Scholar]
  76. Linkov, I.; Varghese, A.; Jamil, S.; Seager, T.P.; Kiker, G.M.; Bridges, T. Multi-criteria decision analysis: A framework for structuring remedial decisions at contaminated sites. In Comparative Risk Assessment and Environmental Decision Making; Springer: Dordrecht, The Netherlands, 2004; pp. 15–54. [Google Scholar]
  77. Behzadian, M.; Kazemzadeh, R.; Albadvi, A.; Aghdasi, M. PROMETHEE: A comprehensive literature review on methodologies and applications. Eur. J. Oper. Res. 2010, 200, 198–215. [Google Scholar] [CrossRef]
  78. Hokkanen, J.; Salminen, P. Choosing a solid waste management system using multicriteria decision analysis. Eur. J. Oper. Res. 1997, 98, 19–36. [Google Scholar] [CrossRef]
  79. Kangas, A.; Kurttila, M.; Hujala, T.; Eyvindson, K.; Kangas, J. Decision Support for Forest Management, 2nd ed.; Springer: Berlin, Germany, 2015; p. 307. [Google Scholar]
  80. Sultana, A.; Kumar, A. Ranking of biomass pellets by integration of economic, environmental and technical factors. Biomass Bioenergy 2012, 39, 344–355. [Google Scholar] [CrossRef]
  81. Taisch, M.; Sadr, V.; May, G.; Stahl, B. Sustainability Assessment Tools—State of Research and Gap Analysis. In Advances in Production Management Systems. Sustainable Production and Service Supply Chains; Prabhu, V., Taisch, M., Kiritsis, D., Eds.; Springer: Berlin/Heidelberg, Germany, 2013; pp. 426–434. [Google Scholar]
  82. Rosén, K.; Lindner, M.; Nabuurs, G.J.; Paschalis-Jakubowicz, P. Challenges in implementing sustainability impact assessment of forest wood chains. Eur. J. For. Res. 2012, 131, 1–5. [Google Scholar] [CrossRef]
  83. Brosofske, K.; Chen, J.; Crow, T. Understory vegetation and site factors: Implications for a managed Wisconsin landscape. For. Ecol. Manag. 2001, 146, 75–87. [Google Scholar] [CrossRef]
  84. Poorbabaei, H.; Poorrahmati, G. Plant species diversity in loblolly pine (Pinus taeda L.) and sugi (Cryptomeria japonica D. Don.) plantations in the western Guilan, Iran. Int. J. Biodvers. Conserv. 2009, 1, 38–44. [Google Scholar]
  85. Carnevale, N.J.; Montagnini, F. Facilitating regeneration of secondary forests with the use of mixed and pure plantations of indigenous tree species. For. Ecol. Manag. 2002, 163, 217–227. [Google Scholar] [CrossRef]
  86. Gratani, L.; Frattaroli, A.R.; Console, C. Regeneration of the undergrowth in reafforested areas with Pinus nigra, in the High Aterno Valley (Italy). Belg. J. Bot. 1994, 127, 61–66. [Google Scholar]
  87. Lust, N.; Muys, B.; Nachtergale, L. Increase of biodiversity in homogeneous Scots pine stands by an ecologically diversified management. Biodivers. Conserv. 1998, 7, 249–260. [Google Scholar] [CrossRef]
  88. Götmark, F.; Paltto, H.; Nordén, B.; Götmark, E. Evaluating partial cutting in broadleaved temperate forest under strong experimental control: Short-term effects on herbaceous plants. For. Ecol. Manag. 2005, 214, 124–141. [Google Scholar] [CrossRef]
  89. Picchio, R.; Spina, R.; Calienno, L.; Venanzi, R.; Lo Monaco, A. Forest operations for implementing silvicultural treatments for multiple purposes. Ital. J. Agron. 2016, 11, 156–161. [Google Scholar]
Figure 1. Schematic presentation of the four analyzed forest wood chains that differ in the extraction processes and amount of biomass removal, in tons dry matter (td.m.).
Energies 12 03306 g001
Figure 2. Extraction of whole trees in Mediterranean black pine plantations by (a) heavy rapid skidding horse; (b) forestry-fitted farm tractor with winch; and (c) double drum cable yarder.
Energies 12 03306 g002
Figure 3. Resulting working productivity for the processes felling and bunching and skidding, per case and in td.m. PMH15−1. Note: productivity results were shown in td.m. PMH15−1; and not in the functional unit (PMH15 td.m.−1) in order to make findings comparable to other studies.
Energies 12 03306 g003
Figure 4. Resulting environmental impacts per process and case in the category global warming potential, distributed with regard to direct and indirect inputs, in kg CO2-eq. td.m.−1.
Energies 12 03306 g004
Figure 5. Resulting employment rate per process and case, in FTE 1000 td.m.−1. Note: FTE = full time equivalent (1500 h year−1 for workers and 1200 h year−1 for horse).
Energies 12 03306 g005
Figure 6. Results of sensitivity analysis using MAUT method when changing weight of #8 employment (EMP) (a) and #11 soil biological quality (QBS-ar) (b).
Energies 12 03306 g006
Figure 7. Results of sensitivity analysis using PROMETHEE method when changing weight of #8 EMP (0–0.427) (a) and #11 QBS-ar (0–0.511) (b).
Energies 12 03306 g007
Table 1. Inventory relevant machinery and animal data.
MachineBrandTypePower [kW]Lifetime [h]Mass [kg]
ChainsawStihlMS441 C-M4.220006.6
HorseTPRn.a.n.a.18,000 a1200
TractorNew Holland88–85 M62.510,0004000
WinchFarmi7 tonsn.a. b10,000600
Cable yarderValentiniV600/317517,00012,000
ChipperPezzolatoPTH 700/66012914,0008200
Notes: n.a. = not applicable; a = referring to productive working hours; b = depending on tractor power take-off; TPR = heavy rapid skidding horse.
Table 2. Applied sustainability indicators.
#No.IndicatorAbbreviationUnitDescription
#1ProductivityPRODPMH15 td.m.−1Rate of product output per unit of time for a production system including delays up to 15 min. A productivity ratio may also be calculated for resources other than time.
#2CostsCOST€ td.m. −1Sum of production costs (fixed costs accruing regardless the rate of activity inclusive personnel costs as well as variable costs that vary with quantity of production).
#3DelaysDELAYMinutes td.m. −1Interruptions of the work process that can be related back to the organization of the work; commonly subdivided into the categories mechanical (e.g., repair), personal (e.g., rest breaks) and operational delays (e.g., waiting times).
#4Cumulated energy demand of fossil energyCEDMJ td.m. −1The cumulative energy demand of fossil energy investigates the energy use throughout the overall life cycle, including the use of direct and indirect consumption of energy.
#5Global warming potentialGWPkg CO2-eq. td.m. −1The potential of global warming is mainly caused by the release of greenhouse gas emissions due to anthropogenic activities such as fossil fuel combustion and transportation.
#6Eutrophication potentialEPkg PO4-eq. td.m. −1Potential eutrophication due to some substances, calculated through the conversion factor of phosphorous and nitrogen compounds into phosphorous equivalents.
#7Acidification potentialAPkg SO2-eq. td.m. −1Potential acidification due to atmospheric deposition of sulfur and nitrogen.
#8EmploymentEMPFTE 1000 td.m. −1Rate of full-time employments related to forest operations.
#9Tree regeneration densityTRDn° td.m. −1Number of individuals of tree seedlings per area referred to harvested biomass.
#10Tree species diversityTSDShannon IndexDegree of uncertainty of predicting the species of a random sample is related to the diversity of a community and is based on measuring uncertainty.
#11Soil biological qualityQBS-arQBS-ar indexEcological index which joins the biodiversity of soil microarthropods community with the degree of soil vulnerability.
#12Soil microarthropod community densitySMDn° ind t td.m. −1Quantitative biological indicator of soil microarthropod community, expressed as number of individuals per area, and referred to harvested biomass.
Note: gt = green tonne (fresh weight); Min = minutes; MJ = megajoule; EE = energy efficiency; CO2 = carbon dioxide; PO4 = phosphate; SO2 = sulfur dioxide; FTE = full-time equivalent.
Table 3. Inventory data of direct inputs, in kg per ton d.m.
Case No.ProcessFellingSkidding & BunchingTransportChipping
Input MaterialGasolineOilDieselOilHayStrawBarleyWaterDieselOilDieselOil
Case 1Repetition 10.730.240.910.060.970.701.2529.542.120.152.250.15
Repetition 20.760.250.980.070.780.561.0036.912.120.152.250.15
Repetition 30.690.230.730.051.000.721.2928.612.120.152.250.15
Repetition 40.610.200.640.041.010.721.3028.522.120.152.250.15
Average0.700.230.820.060.940.671.2130.902.120.152.250.15
Case 2Repetition 10.630.211.890.130.000.000.000.002.120.152.250.15
Repetition 20.720.241.920.130.000.000.000.002.120.152.250.15
Repetition 30.800.261.400.100.000.000.000.002.120.152.250.15
Repetition 40.700.231.470.100.000.000.000.002.120.152.250.15
Average0.710.231.670.110.000.000.000.002.120.152.250.15
Case 3Repetition 10.620.201.920.130.000.000.000.002.120.152.250.15
Repetition 20.680.232.130.150.000.000.000.002.120.152.250.15
Repetition 30.600.201.680.120.000.000.000.002.120.152.250.15
Repetition 40.580.191.630.110.000.000.000.002.120.152.250.15
Average0.620.201.840.130.000.000.000.002.120.152.250.15
Table 4. Resulting average distribution of net working time per working step of the processes felling and bunching and skidding.
ProcessWorking StepCase 1 (Horse)Case 2 (Winch)Case 3 (Yarder)
Min td.m. −1SDMin td.m. −1SDMin td.m. −1SD
FellingMovement1.07±0.102.11±0.301.91±0.18
Preparation1.08±0.101.66±0.180.95±0.21
Cutting3.20±0.263.83±0.433.36±0.57
Tree grounding0.37±0.210.00±0.000.32±0.08
Bunching &Empty Movement14.11±2.245.08±1.035.69±0.96
SkiddingHooking4.40±1.292.96±0.3014.09±2.12
Bunching extraction13.04±3.057.28±1.1611.76±2.39
Unhooking2.71±0.453.44±0.9911.31±1.95
Table 5. Resulting production €s per process and case, in € per ton d.m.
CaseProcess€ t.d.m.−1SD
Case 1 (extraction by horse)Felling4.33±1.72
Bunching & Skidding16.65±2.17
Transport8.41±1.14
Chipping7.24±1.69
Sum36.63±5.66
Case 2 (extraction by tractor with winch)Felling3.64±0.41
Bunching & Skidding12.05±1.64
Transport8.41±1.14
Chipping7.24±1.69
Sum31.34±4.68
Case 3 (extraction by cable yarder)Felling3.40±0.81
Bunching & Skidding57.93±7.31
Transport8.41±1.14
Chipping7.24±1.69
Sum76.98±10.50
Table 6. Results table of life cycle impact assessment, in kg per ton d.m.
Input t d.m. -1ProcessFellingExtractionTransportChippingSum Impact
Case no./ICCEDGWPEPAPCEDGWPEPAPCEDGWPEPAPCEDGWPEPAPCEDGWPEPAP
Dieselcase 10.00000.00000.00000.000043.84540.41780.00070.0046114.07331.08690.00190.0119120.84351.15150.00200.0126278.76222.65620.00460.0291
case 20.00000.00000.00000.000089.67890.85450.00150.0094114.07331.08690.00190.0119120.84351.15150.00200.0126324.59563.09290.00530.0339
case 30.00000.00000.00000.000098.75960.94100.00160.0103114.07331.08690.00190.0119120.84351.15150.00200.0126333.67643.17940.00550.0348
Gasolinecase 139.49860.49740.00070.00500.00000.00000.00000.00000.00000.00000.00000.00000.00000.00000.00000.000039.49860.49740.00070.0050
case 240.20700.50630.00070.00510.00000.00000.00000.00000.00000.00000.00000.00000.00000.00000.00000.000040.20700.50630.00070.0051
case 334.96500.44030.00060.00450.00000.00000.00000.00000.00000.00000.00000.00000.00000.00000.00000.000034.96500.44030.00060.0045
Oilcase 117.16880.20410.00030.00184.17570.04960.00010.000410.81210.12850.00020.001111.48320.13650.00020.001243.63980.51880.00090.0045
case 217.44840.20740.00030.00188.50050.10100.00020.000910.81210.12850.00020.001111.48320.13650.00020.001248.24420.57350.00100.0049
case 315.21150.18080.00030.00169.41400.11190.00020.001010.81210.12850.00020.001111.48320.13650.00020.001246.92070.55780.00090.0048
Foddercase 10.00000.00000.00000.00005.34050.73950.01200.00640.00000.00000.00000.00000.00000.00000.00000.00005.34050.73950.01200.0064
case 20.00000.00000.00000.00000.00000.00000.00000.00000.00000.00000.00000.00000.00000.00000.00000.00000.00000.00000.00000.0000
case 30.00000.00000.00000.00000.00000.00000.00000.00000.00000.00000.00000.00000.00000.00000.00000.00000.00000.00000.00000.0000
impact machine/horsecase 10.79720.12570.00020.000113.60261.84880.02800.01557.47320.35920.00140.00151.59530.07670.00030.000323.46822.41040.02980.0175
case 20.69750.11000.00020.00018.49800.40850.00160.00177.47320.35920.00140.00151.59530.07670.00030.000318.26400.95440.00340.0037
case 30.66810.10530.00020.000136.36191.74800.00670.00237.47320.35920.00140.00151.59530.07670.00030.000346.09852.28920.00860.0042
daily transportcase 14.72330.33170.00020.001116.73911.17550.00070.00397.00990.49230.00030.00161.17530.08250.00000.000329.64762.08190.00120.0070
case 24.13300.29020.00020.00107.97120.55980.00030.00197.00990.49230.00030.00161.17530.08250.00000.000320.28931.42480.00080.0048
case 33.95840.27800.00020.000922.22691.56080.00090.00527.00990.49230.00030.00161.17530.08250.00000.000334.37042.41360.00140.0081
one-time transportcase 10.00000.00000.00000.00001.91770.12630.00010.00040.61850.04370.00000.00010.30920.02180.00000.00012.84540.19180.00010.0006
machine/horsecase 20.00000.00000.00000.00000.61850.04370.00000.00010.61850.04370.00000.00010.30920.02180.00000.00011.54620.10920.00010.0003
case 30.00000.00000.00000.00001.80400.12740.00010.00040.61850.04370.00000.00010.30920.02180.00000.00012.73170.19300.00010.0006
SUMcase 162.18791.15880.00150.008085.62104.35760.04160.0313139.98692.11070.00380.0163135.40651.46900.00260.0145423.20239.09610.04940.0700
case 262.48601.11390.00140.0080115.26711.96750.00360.0139139.98692.11070.00380.0163135.40651.46900.00260.0145453.14646.66110.01130.0527
case 354.80301.00440.00130.0071168.56634.48920.00950.0192139.98692.11070.00380.0163135.40651.46900.00260.0145498.76279.07330.01720.0570
Note: IC = impact category; CED = cumulative energy demand (of fossil energy), reported in MJ ton d.m.−1; GWP = global warming potential, reported in kg CO2-eq. ton d.m.−1; EP = eutrophication potential, reported in kg PO4-eq. ton d.m.−1; AP = acidification potential, reported in kg SO2-eq. ton d.m.−1. Indirect inputs are marked in grey color.
Table 7. Resulting indicator values of tree regeneration density (TRD), floristic diversity (Shannon index), Soil Biological Quality (QBS-ar index) and soil microarthropod community density (SMD), per ha.
CaseRep. No.TRD Shanon IndexQBS-ar IndexSMD
[n° ha−1][Million n° ind ha−1]
Case 1Rep. 119,9501.55233132
(horse)Rep. 217,6501.69223126
Rep. 317,7561.49238120
Rep. 419,5921.59218118
average18,7371.58228124
Case 2Rep. 122,6001.89213163
(tractor & winch)Rep. 219,6001.87187170
Rep. 320,1141.83188149
Rep. 421,7561.89208162
average21,0181.87199161
Case 3Rep. 120,1001.5916591
(cable yarder)Rep. 217,5001.59172105
Rep. 317,8891.53195105
Rep. 419,4251.6118499
average18,7291.58179100
Note: Rep. = Repetition; TRD = Tree Regeneration Density; SMD = Soil Microarthropod community Density.
Table 8. Resulting average indicator values per hectare.
SIUnitCase Resulting Value
ProductivityPMH15 ha−1Case 17.4123
Case 26.3102
Case 37.2864
COST€ ha−1Case 16244.5625
Case 24800.9050
Case 312,978.4065
DelayMinutes ha−1Case 163.15
Case 255.04
Case 362.77
CEDMJ-eq. ha−1Case 172,155.9898
Case 269,422.0291
Case 384,091.3891
GWPKg CO2-eq. ha−1Case 11550.8824
Case 21020.4863
Case 31529.7583
EPKg PO4-eq. ha−1Case 18.4206
Case 21.7384
Case 32.8931
APKg SO2-eq. ha−1Case 111.9496
Case 28.0750
Case 39.6135
EMPFTE ha−1Case 10.4430
Case 20.2426
Case 30.4447
TRDn° ha−1Case 118,737.0000
Case 221,017.5000
Case 318,728.5000
TSDShannon-IndexCase 11.5800
Case 21.8700
Case 31.5800
QBS-arQBS-ar-IndexCase 1228.0000
Case 2199.0000
Case 3179.0000
SMDMillion n° ha−1Case 1124.0000
Case 2161.0000
Case 3100.0000
Table 9. Input data (decision matrix) for multi-criteria decision analysis (MCDA).
CriteriaCOSTCEDGWPEPAPEMPTRDTSDQBSSMD
Min/MaxMinMinMinMinMinMaxMaxMaxMaxMax
Shape of FunctionVVVVVVVVVV
Preference threshold (p)129884091550.8421.190.04421020.1872.2816.1
Weights of criteria0.0500.1000.1000.1000.1000.0500.2000.0500.2000.050
Case 1 (horse)624572,15615518.4211.950.44318,7371.580228124
Case 2 (tractor with winch)480169,42210201.748.070.24321,0181.870199161
Case 3 (cable yarder)12,97884,09115302.899.610.44518,7291.580179100
Table 10. MCDA results for application of MAUT method.
AlternativesUtilityRanks
Case 1 (horse)3.92
Case 2 (tractor with winch)8.31
Case 3 (cable yarder)23
Table 11. MCDA results for application of PROMETHEE method.
AlternativesPhiPhi+Phi−Ranks
Case 1 (horse)−0.1240.3250.4492
Case 2 (tractor with winch)0.6660.8160.1501
Case 3 (cable yarder)−0.5430.1330.6753

