Article

Influence of Partial Arc on Electric Field Distribution of Insulator Strings for Electrified Railway Catenary

1
School of Automation & Electrical Engineering, Lanzhou Jiaotong University, Anning District, Lanzhou 730070, China
2
Rail Transit Electrical Automation Engineering Laboratory of Gansu Province, Lanzhou Jiaotong University, Anning District, Lanzhou 730070, China
*
Author to whom correspondence should be addressed.
Energies 2019, 12(17), 3295; https://doi.org/10.3390/en12173295
Submission received: 14 August 2019 / Revised: 24 August 2019 / Accepted: 25 August 2019 / Published: 27 August 2019
(This article belongs to the Section B: Energy and Environment)

Abstract

:
The occurrence of a partial arc can affect insulation properties of the insulator by different types of flashover. In order to investigate the influence of a partial arc on electric field distribution along the catenary insulator string, a three-dimensional model of the cap-pin insulator string with partial arc was established in this paper. The electric field distribution along the insulator string when the arc extended on the insulator surface and bridged sheds was investigated based on the electric field analysis using the finite element method. The results showed that the occurrence of a partial arc caused obvious distortion of the electric field, which was a two-dimensional axis symmetrical field before arcing to a three-dimensional field. In the case of arc extension, the sudden rise of field intensity was mostly at the rib and the shed edge, which had the local maximum field intensity. The rib and the shed edge played a certain hindrance role in the extension of the arc. The main reason for promoting the development of the arc can be attributed to thermal ionization. In the case of arc bridge sheds, the highest field intensity appeared at the edge of the last bridged shed. As the number of sheds arc-bridged increased, the maximum field intensity also increased. As the arc length increased, the electric field intensity of the arc head also increased, which resulted in an accelerated arc development. The main factor to promote the development of the arc can be attributed to electrical breakdown. The measures to hinder the rapid development of partial arcs were proposed.

Graphical Abstract

1. Introduction

As a special high-voltage transmission line, the electrified railway catenary is installed above rails and transmits electric energy to electric locomotives or motor train units by making contact with pantographs [1]. The catenary insulator not only maintains the electrical insulation of the catenary electrified body and the grounded body, but also withstands the mechanical load. Since the insulator is exposed outdoors, it can easily be affected by the atmospheric environment, resulting in the surface of the insulator becoming contaminated and wet. Therefore, a partial arc will occur when the local electrical field intensity of the insulator exceeds the ionization threshold of air. If the partial arc continues to develop, a complete flashover may occur [2,3,4]. As the catenary has no redundancy, the flashover may cause serious consequences to the operation of the electrified railway [5].
Generally, the electric field characteristics can reflect the insulation condition and electrical performance of insulators to some extent. Nowadays, there have been many studies on the electric field distribution characteristics of insulators. For example, considering the factors such as the tower and the different phase conductors, a full-scale simulation model was established to study the electric field distribution characteristics of insulators, and the calculation results were closer to the real condition [6]. The influence of corona rings with different structural parameters on the electric field distribution of insulators was studied, and the parameters of corona rings were optimized to make the electric field along the insulators uniform [7]. The influences of the operating environment on the electric field distribution of insulators were studied, such as icing [8], sand dust [9], bird droppings [10], surface contamination layer [11], dry zone [12], separated globules [13], and so on. It was further clarified that the operating environment plays an important role in the safe operation of insulators.
The key reason for the occurrence and development of partial arcs can be attributed to the distortion of the electric field. With the rapid development of partial arcs, it is difficult to measure the electric field intensity dynamically. Gu Leguan proposed using the charge simulation method to simulate the electric field along the surface of the smooth cylindrical insulator when the partial arc was at different locations, and analyzed the influence of the partial arc forward extension on the electric field distribution [14]. However, the electric field distribution of the smooth cylindrical insulators is different from that of the practical insulators. Sima Wenxia calculated the relationship between the development of partial arc and the electric field distribution of single cap-pin insulators. The cap-pin insulators in transmission lines are connected in series, and the calculation results are not entirely applicable to the insulator strings [15]. S.M. Ale-Emran proposed using a high-speed camera to observe the characteristics of the partial arc on the ice-covered post insulator with booster sheds, and simulated the electric field distribution of the insulator when a partial arc occurred based on the finite element method [16]. However, the simulation analysis was carried out in two-dimensional axisymmetric state, which is different from the three-dimensional electric field of insulators after the partial arc occurrence.
Previous studies mainly focused on the smooth cylinder insulator, post insulator, and single cap-pin insulator. The electric field analysis of cap-pin insulator strings after partial arc occurrence, however, has rarely been reported. The cap-pin insulators can be connected in series according to the operating voltage level, which are widely used. The partial arc of cap-pin insulator strings can also occur under adverse conditions such as overvoltage, surface contamination, and moisture [17], and the arc discharge process is shown in Figure 1. The numerical analysis of electric fields is an important means to study the occurrence and development of partial arc. In this paper, the electric field characteristics of the cap-pin insulator string for the electrified railway catenary was investigated. Based on the discharge process of the insulator string, the influence of the arc extension and bridge sheds on the electric field distribution characteristics of the insulator string was studied. The influence of the partial arc on the electric field of the insulator string was summarized, and the measures to hinder the development of the arc were proposed. This paper has important guiding significance for improving the study of the insulator discharge mechanism. The research results can be used in the design and selection of external insulation for high-speed electrified railways and help to prevent flashover accidents.

2. Simulation Model

2.1. Calculation Principle

Since the wavelength of the alternating voltage is much larger than the length of the insulator string, the electric field at any instant can be considered to be approximately stable. In the model, the influence of conductivity on the electric field distribution had to be considered, and the quasi-static electric field was used for numerical analysis [18]. In this paper, the finite element method was used to build a simulation model of the insulator string in the software.

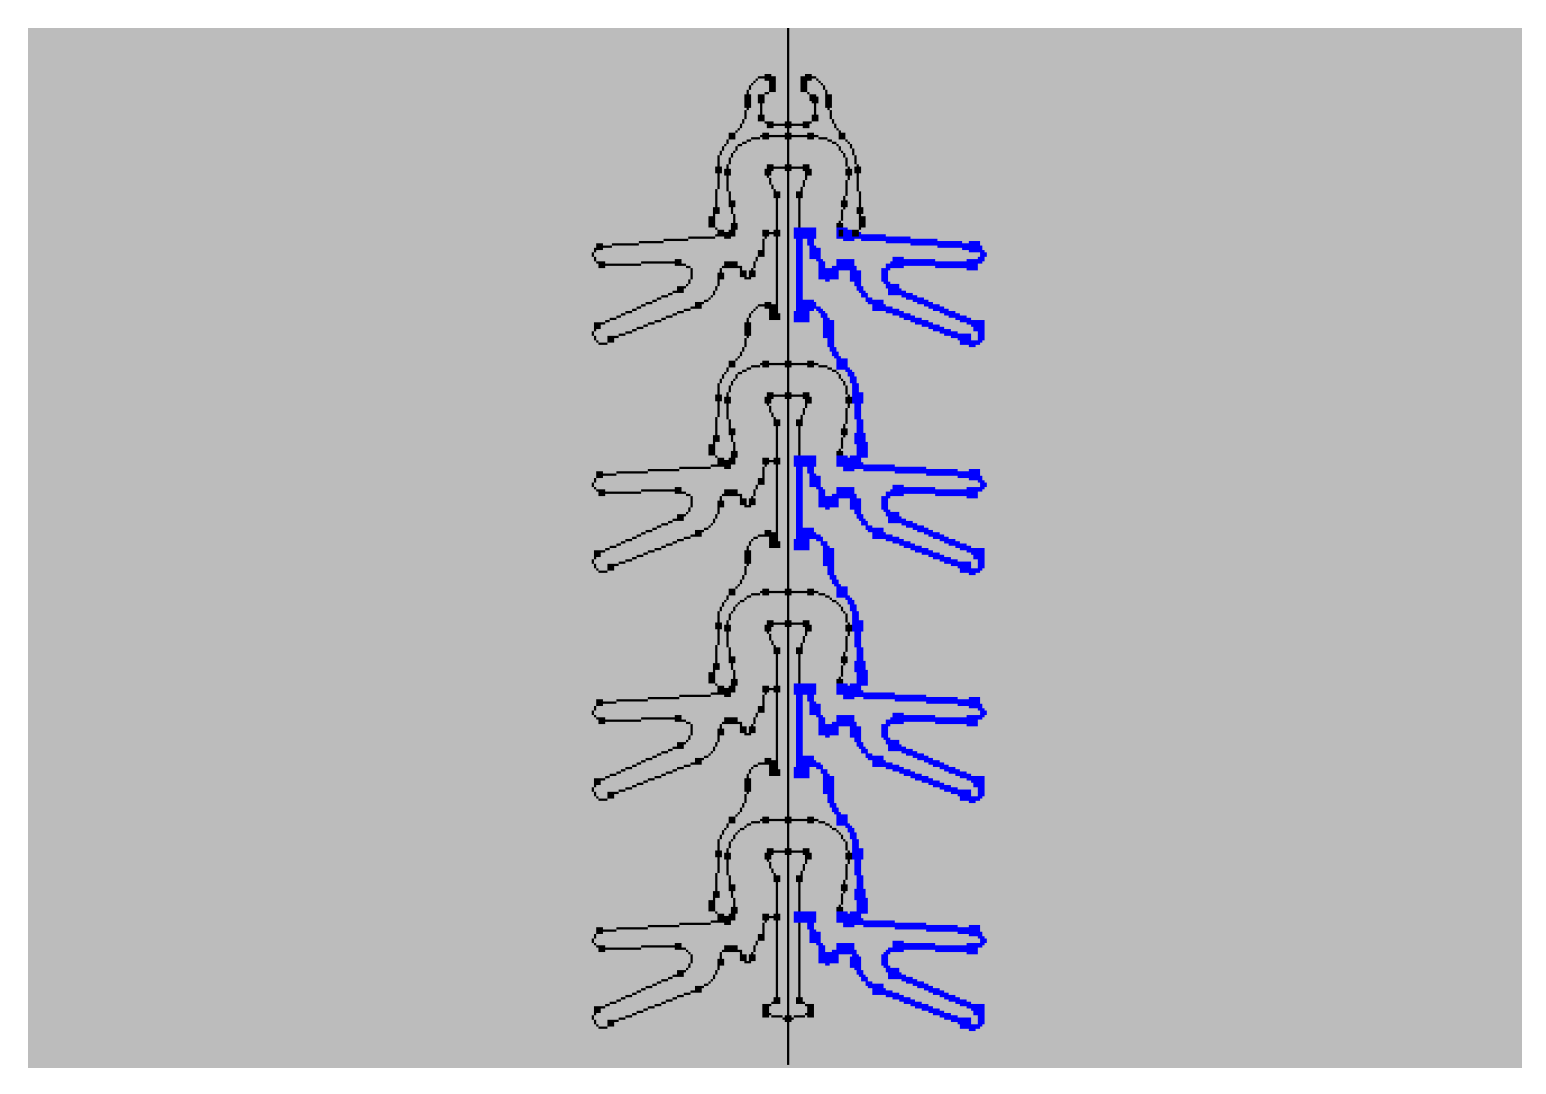
2.2. Establishment of Calculation Model

The cap-pin insulator string of an electrified railway catenary is shown in Figure 2, and is formed by connecting four insulators in series. The electrified railway adopts the autotransformer power supply mode, and the catenary structure is shown in Figure 3. The lower end of the insulator string suspends the feeder wire (high-voltage), and the upper end is connected to the bracket (ground) of the column [19].
The cap-pin insulator used for modeling refers to type U70BL, and the main technical parameters of the insulator are shown in Table 1 [20]. The double-shed porcelain insulator is mainly composed of steel cap, steel pin, and electric porcelain. In order to facilitate the analysis, the specific position values of the insulator surface, the feature points of #1–6, are defined as shown in Figure 3.
A three-dimensional model of insulator string was established based on SolidWorks, as shown in Figure 4. The insulator string was placed in a cylindrical air domain by artificial truncation to simulate its working conditions in the atmosphere. Since the size of the air domain affects the calculation efficiency and the accuracy of the calculation results, the height and diameter of the cylinder were set to three times the length of the insulator string. For convenience of explanation, the insulators were numbered No.1–4 from the high-voltage end (lower end) to the ground end (upper end) of the insulator string.
The COMSOL Multiphysics software was used to calculate and analyze the electric field distribution of the insulator string. The setting parameters of each material in the model are shown in Table 2 [21]. The potential of the high-voltage end fitting of the insulator string was set to the peak value of 27.5 kV of the catenary operating voltage [22], which was about 38.89 kV ( 27.5 2 kV). The potential of the ground end fitting was grounded. In order to improve the calculation accuracy of the electric field distribution, the mesh of the insulator string surface was subjected to tetrahedral refinement, as shown in Figure 5. The number of mesh was 1.26 million.

3. Electric Field Distribution of Insulator Strings without Partial Arc

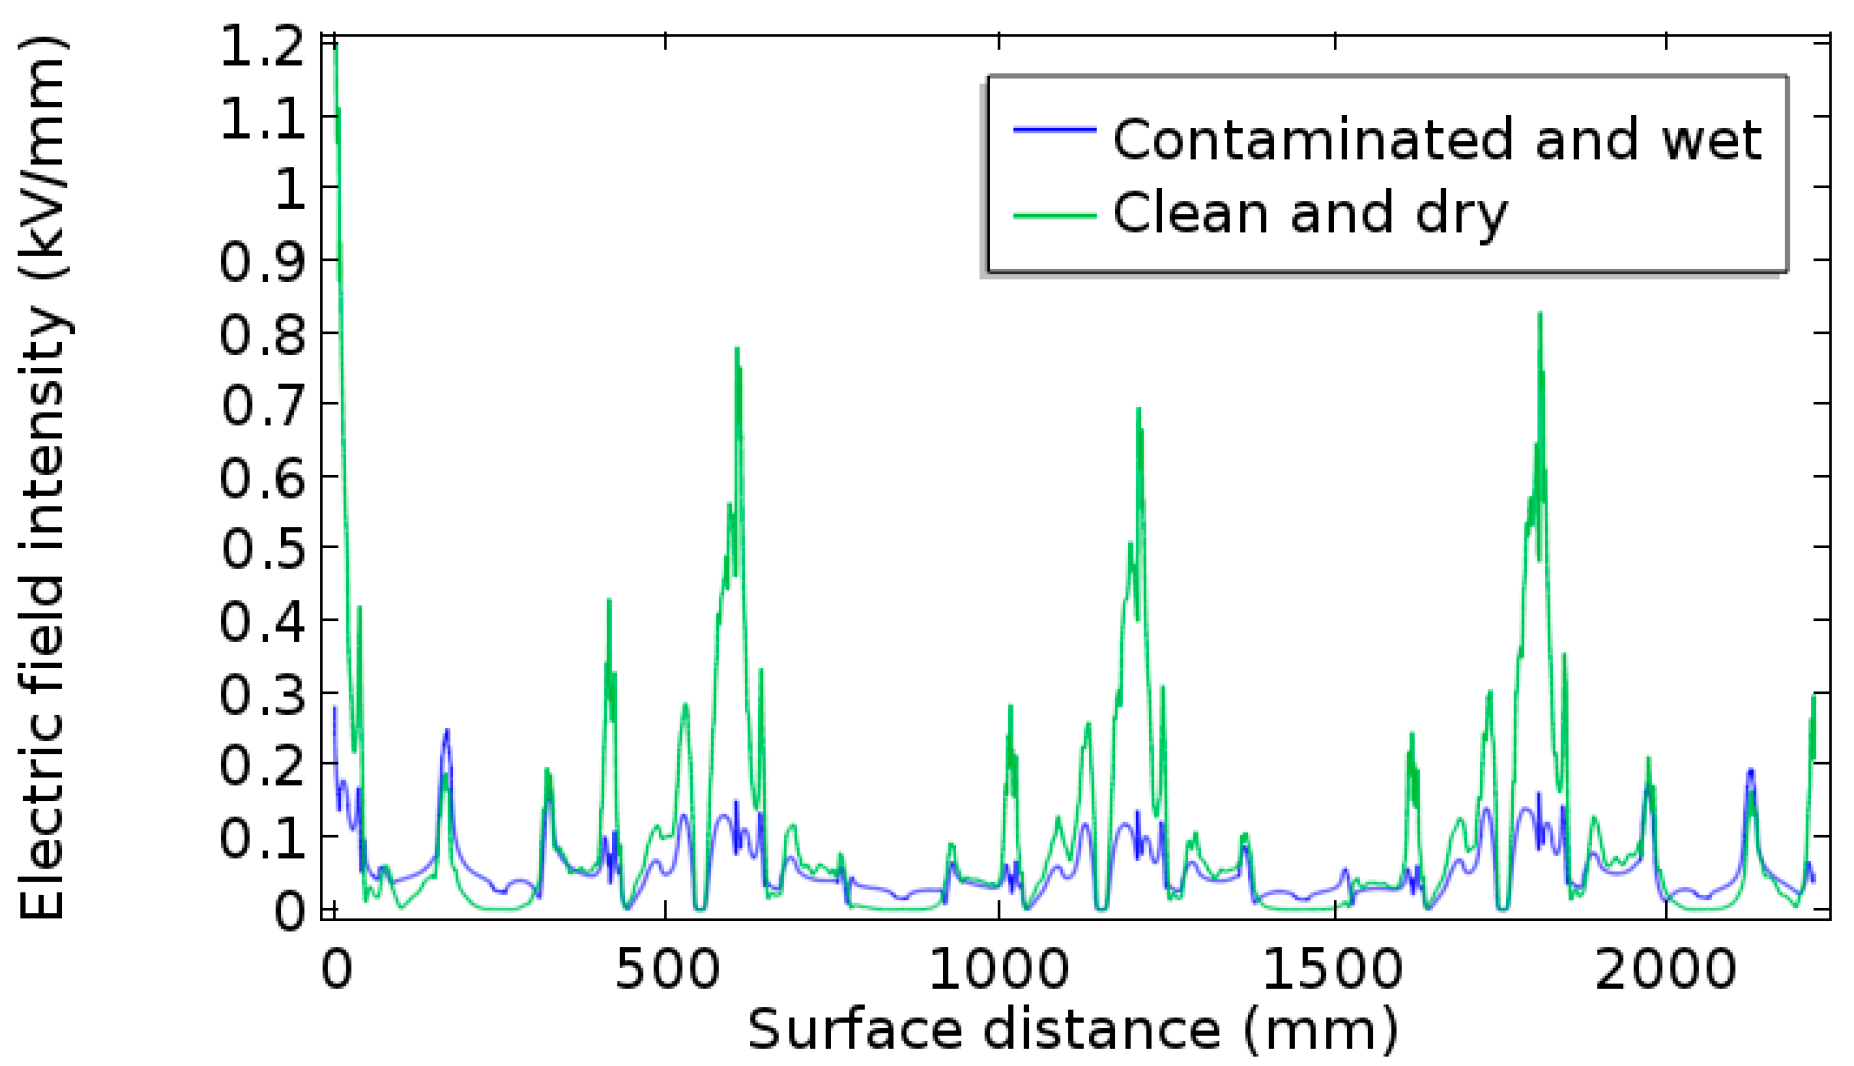
3.1. Electric Field Distribution of Insulator String under Clean and Dry Conditions

The potential and electric field distribution of insulator strings under clean and dry conditions were calculated. The equipotential line distribution of the insulator string is shown in Figure 6. The potential gradient near the hardware fittings was relatively high. On the same insulator, the potential gradient of the insulation part near the steel pin was higher than that near the steel cap. The electric field distribution of the insulator string is shown in Figure 7. The field intensity near the high-voltage end of the insulator string was the highest.
The shortest distance curve connecting the high-voltage end and the ground end fittings along the surface of the insulator string was defined as the surface distance, which included the insulation portion and the intermediate conductor portion of the insulator string. The surface distance of the insulator string is shown in Figure 8. Corresponding surface distance of each part of the insulator string is shown in Table 3. The potential distribution of the insulator string surface distance (from high-voltage end to ground end) is shown in Figure 9. As there were three intermediate fittings in the insulator string, the potential along the insulator string showed ladder-like distribution. The shape of the potential distribution of each insulator was similar, and the insulating portion near the steel pin withstood a higher potential difference.
Considering the close relationship with the partial arc, the electric field norm value along the insulator string was calculated. As shown in Figure 10a, the field intensity curves of the insulation parts of the four insulators are similar, and the electric field distribution is generally U-shaped. The protrusion positions (points #2, #4, #5, #6) where the insulator surface with large curvature has a relatively high field intensity are indicated by the black arrows. The surface structure of insulators has an effect on electric field distribution, which is more obvious in the No. 1 and No. 4 insulators, but not apparent in the No. 2 and No. 3 insulators. On each insulator, the junction of air, steel pin, and electric porcelain (red arrow), and the junction of air, steel cap, and electric porcelain (green arrow) have the local maximum field intensity. For a single insulator, the field intensity at the steel pin is higher than that at the steel cap. The electric field intensity of the No. 1 insulator steel pin (high-voltage end) is the highest, reaching 1.2 kV/mm, as shown in Figure 10b. The corona is more likely to occur near the steel pin.

3.2. Electric Field Distribution of Insulator String under Contaminated and Wet Conditions

Contamination and moisture of insulators are important prerequisites for pollution flashover. In order to simulate the electric field distribution of insulator strings under contaminated and wet conditions, a uniform contaminated wet layer with a thickness of 0.2 mm was set on the porcelain surface of the insulator in the model. The relative dielectric constant of the contaminated wet layer was set to 20 [23]. In this paper, the relationship between the surface conductivity of the contaminated wet layer and the equivalent salt deposit density of insulator strings was used, as shown in Equation (1) [24,25].
ρ s = 822.8 × 1 0 6 × E S D D
where ρs in S is the contaminated wet layer conductivity and ESDD in mg/cm2 is the equivalent salt deposit density. It was calculated that when the ESDD of the insulator string was 0.4 mg/cm2, the surface conductivity of the contaminated wet layer was 3.2912 × 10⁻⁴ S. The relationship between the surface conductivity and the volume conductivity of the contaminant wet layer of insulator strings was used, as shown in Equation (2) [26].
ρ γ = ρ s h
where ργ in S/m is the contaminant volume conductivity, h in m is the thickness of the contaminant wet layer. In the simulation, the volume conductivity of the insulator string’s contaminated wet layer was set to 1.6456 S/m. Because the breakdown field intensity of air was lower than that of the contaminated wet layer, the field intensity of the interface between the contaminated wet layer and air was mainly calculated. The simulation results are shown in Figure 11.
The occurrence of the contaminated wet layer weakened the high field intensity at the high-voltage and ground ends, and the U-shaped distribution of the electric field was disrupted. The overall electric field distribution was flatter than that under clean and dry conditions. The relationship between the electric field distribution and the shape of insulators was also obvious under contaminated and wet conditions. The electric field intensity of insulators at the #2, #4, #5, #6 points was more prominent. The electric field along the clean, dry insulators was an electrostatic field generated by capacitive coupling, while the electric field along the contaminated wet insulators included not only the component of the electrostatic field, but also the component of resistance produced by the contaminated wet layer with high conductivity. The distance between the steel pin and the central axis of the insulator was small, and the current density near the steel pin was high. The current density of the No.1 insulator is shown in Figure 12. The current thermal effect tended to create a dry zone near the steel pin. In addition, the electric field intensity at the junction of air, steel pin, and electric porcelain of the No. 1 insulator was strong, and the partial arc easily occurred here.

4. Electric Field and Potential Distribution of Insulator Strings after Partial Arc Occurrence

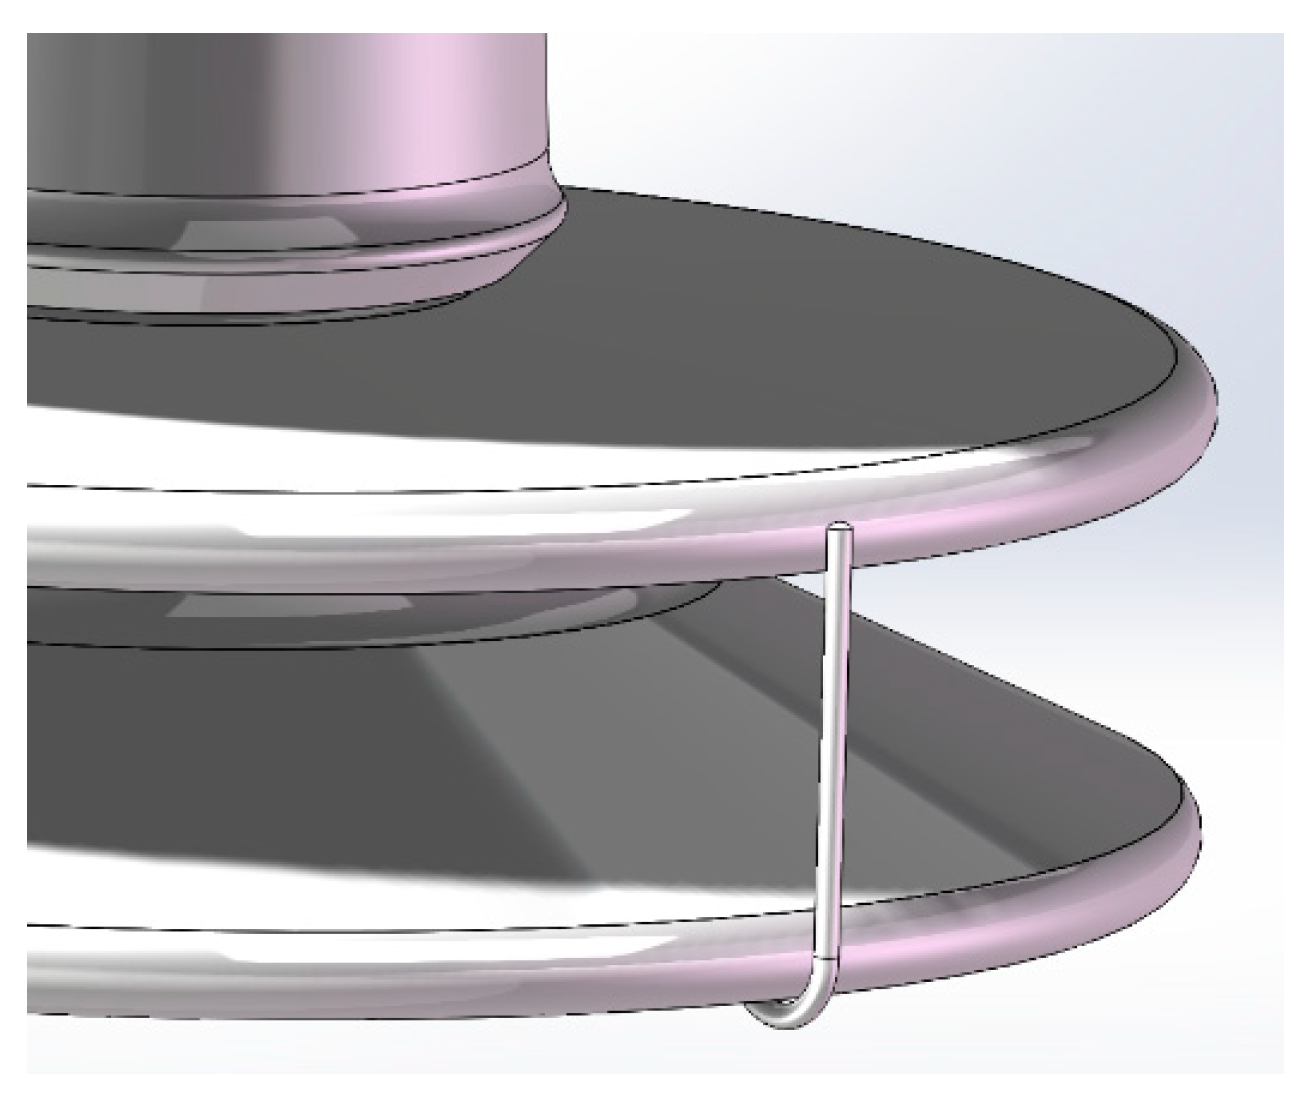
4.1. Partial Arc Setting

It can be seen that the radius of the partial arc depends on the current flowing through the partial arc. For the electric field calculation model to be more realistic, an artificial pollution experiment was carried out in the artificial climate chamber of the high-voltage laboratory in Lanzhou Jiaotong University. The wiring principle diagram is shown in Figure 13. All the test equipment met the requirements of the IEC 60507 for AC pollution test power supply [27]. The test power supply and leakage current acquisition device are shown in Figure 14. The mixed solution of sodium chloride and diatomite had been evenly brushed on the surface of the insulator string before the experiment started and then the insulator string underwent standing suspension for 24 h to dry naturally. The equivalent salt deposit density (ESDD) of the insulator string was 0.4 mg/cm2, and the nonsoluble deposit density (NSDD) was 1.5 mg/cm2. After the contaminated layer was saturated wet, a voltage of 27.5 kV was applied to the insulator string. The leakage current was collected when the partial arc occurred on the insulator string surface, and the leakage current was about 100 mA.
It is generally considered that the partial arc in the flashover process is cylindrical. The relationship between the partial arc radius and the leakage current is shown in Equation (3) [28].
r 0 = I 1.45 π
where r0 in mm is the partial arc radius and I in mA is the leakage current of the insulator string. The radius of the partial arc was calculated to be 1.48 mm.
In reality, the shape and development direction of the partial arc on the surface of the insulator string are complex and have a strong randomness. The partial arc in the model was simplified as follows:
(1)
The arc was approximately a cylinder with a hemispherical dome on its head.
(2)
Considering a single arc condition, the partial arc extended forward along the surface of the insulator string.
(3)
The trajectory of the partial arc was in the same plane as the central axis of the insulator string.
(4)
The partial arc occurred from the high-voltage end.
The partial arc in the model is shown in Figure 15. The electric field characteristics of the insulator string in the cases of the partial arc extending on the insulator surface and bridging the sheds were simulated.

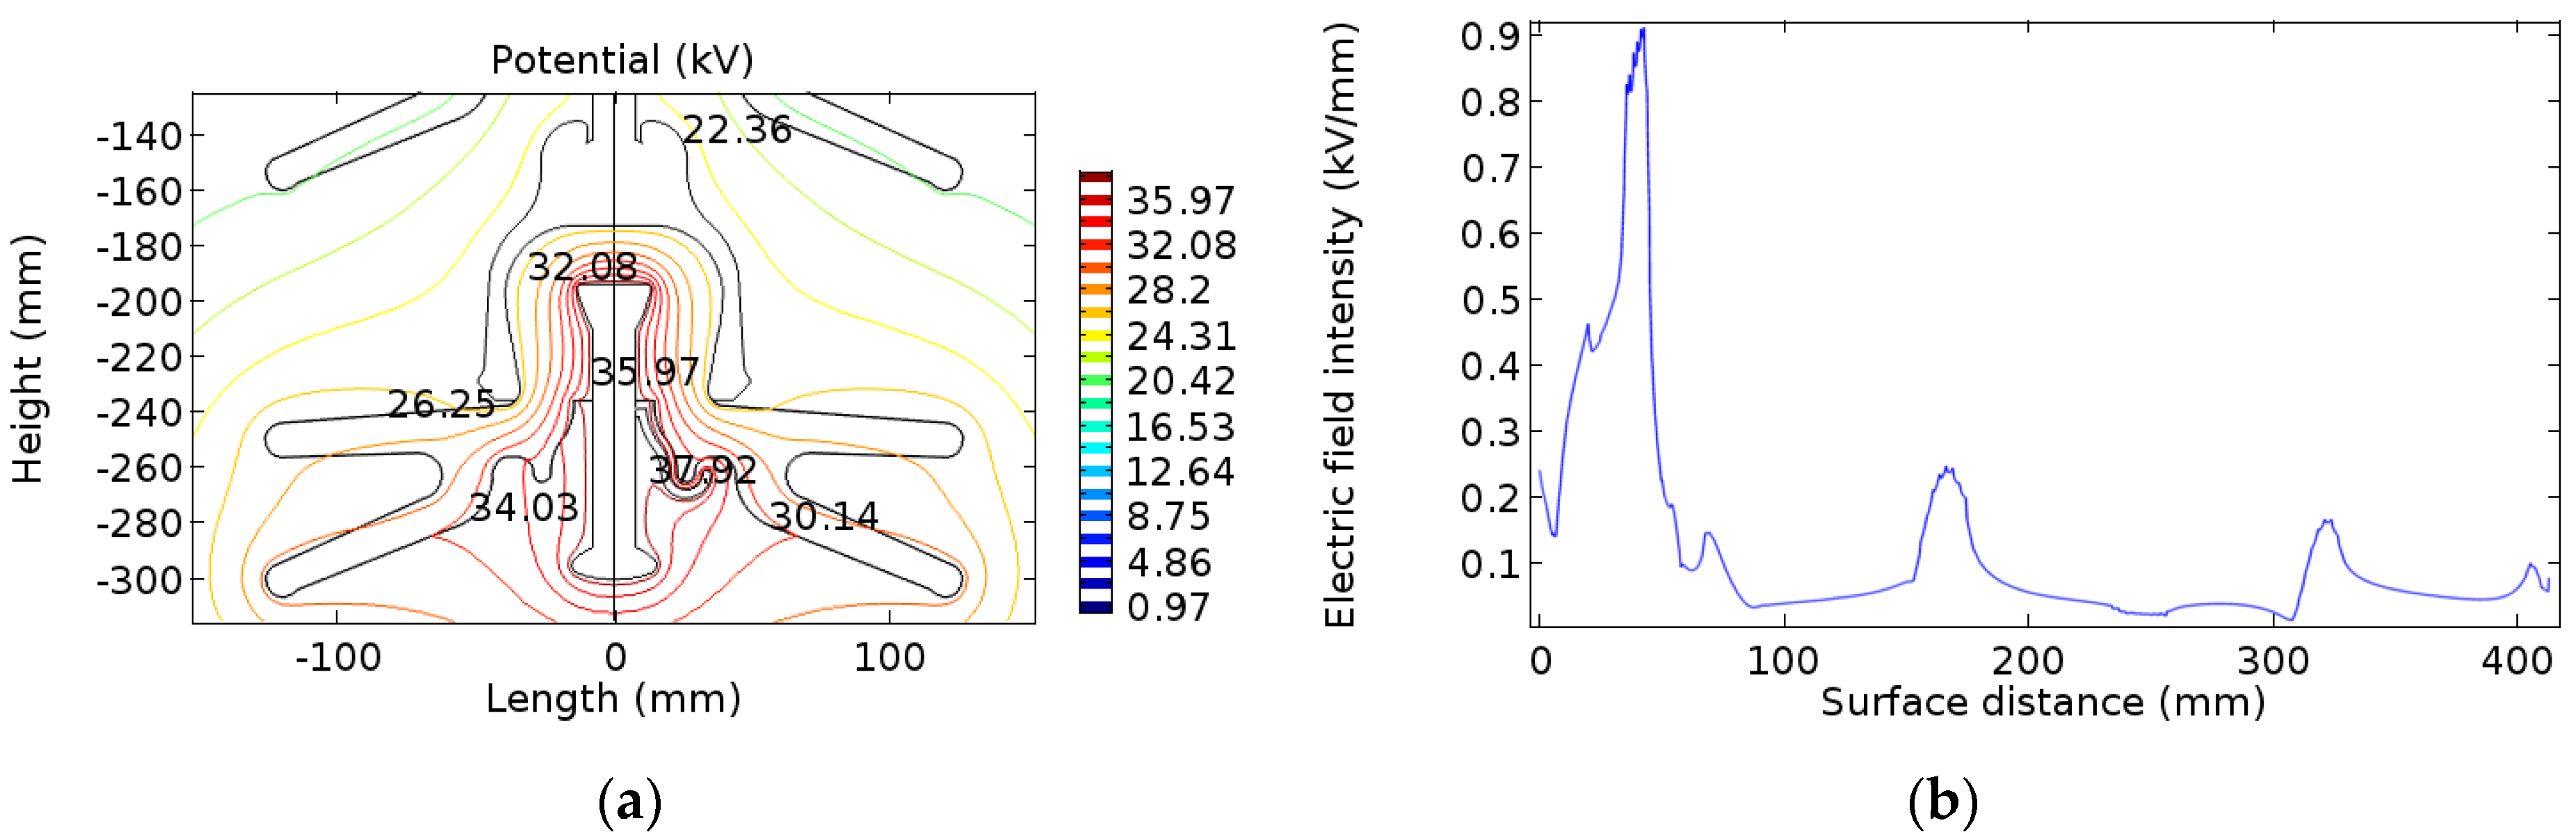
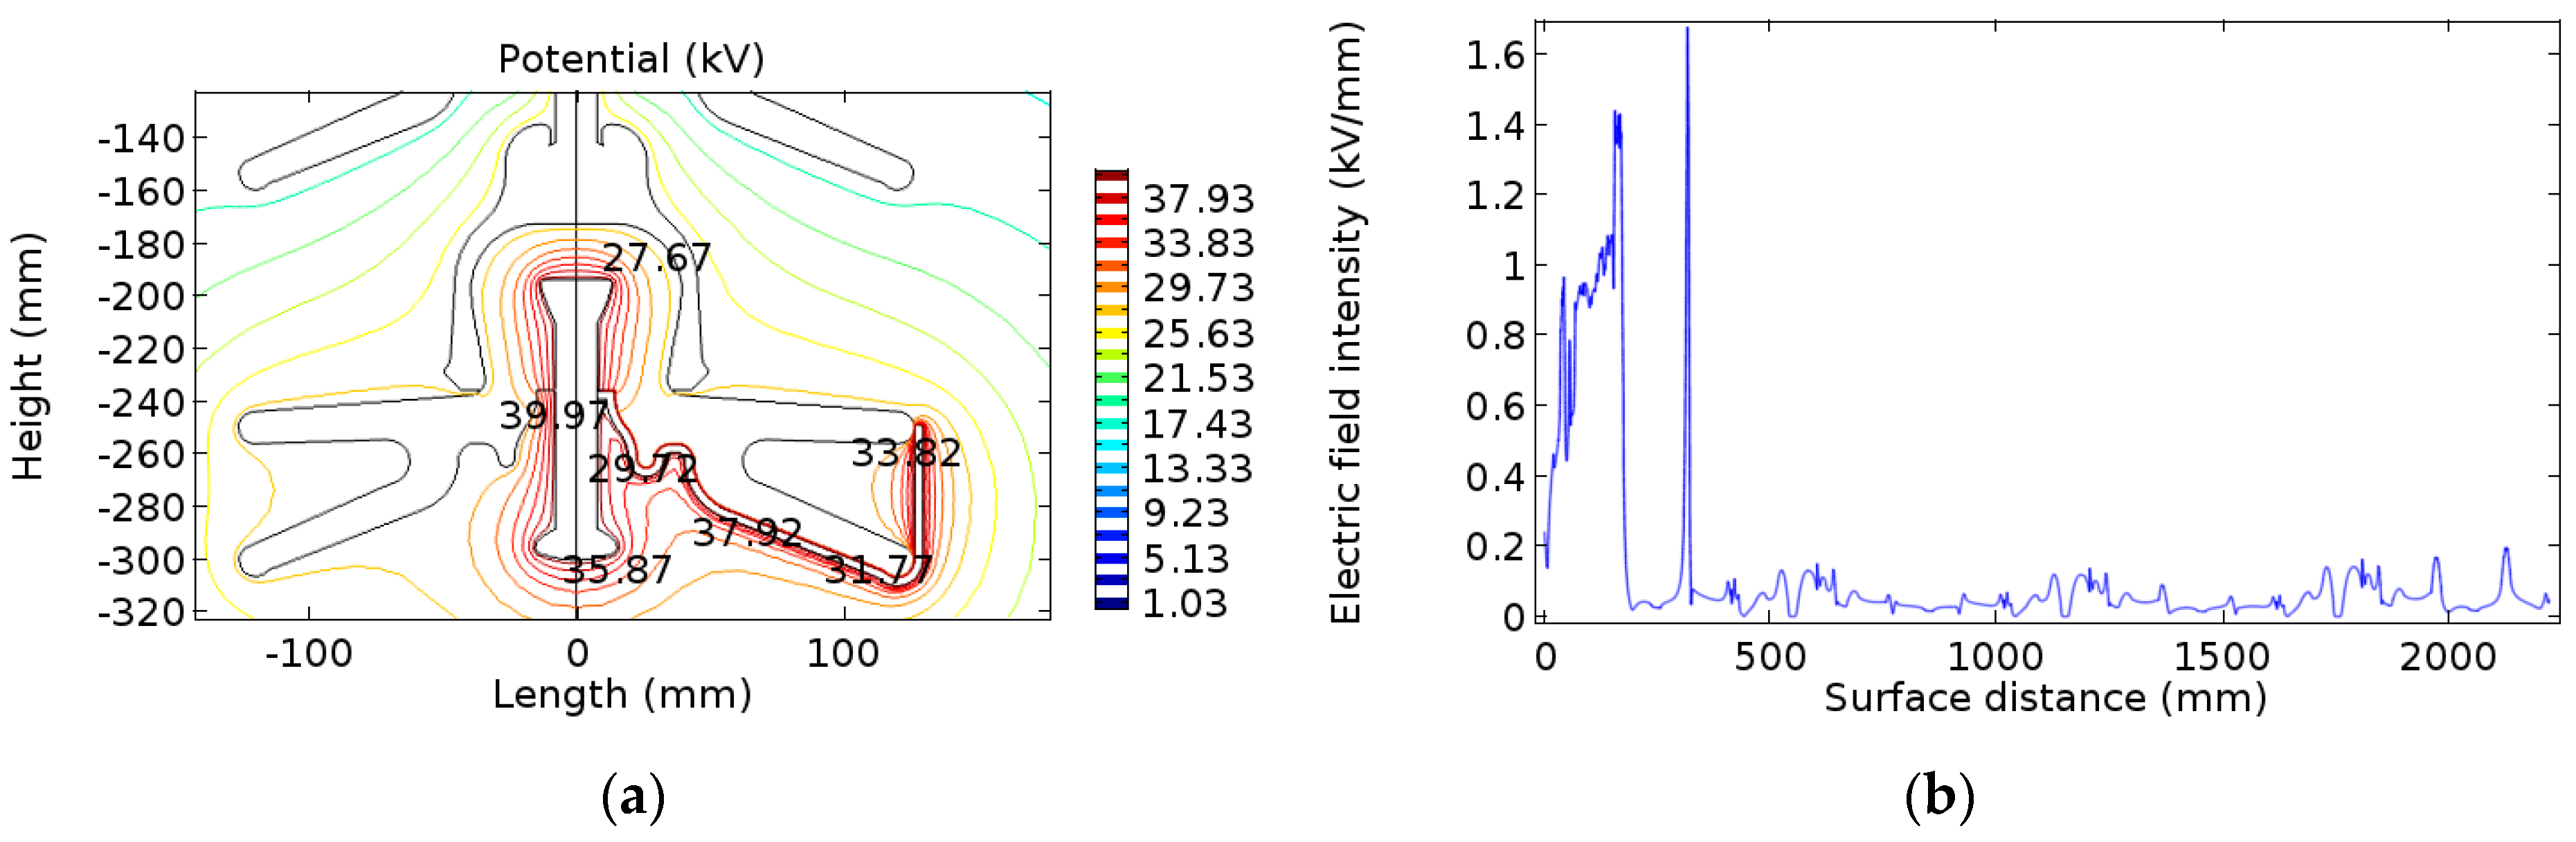
4.2. Electric Field Distribution of Partial Arc Extension on Insulator String Surface

The partial arc in the model occurred at the junction of air, steel pin, and electric porcelain of the No. 1 insulator, and developed on the surface of the No. 1 insulator. The process of the arc extending on the surface of the No. 1 insulator was divided into five cases. The length of the arc extension increased in turn, which was defined as Extension 1 to Extension 5. The five arc extension cases were sequentially simulated. At the same time, the electric field intensity of the projection of the partial arc on the insulator string surface was calculated. As the field intensity of the arc head had great influence on the development of the arc, the field intensity of the arc head was also calculated.
Extension 1 refers to the case where the partial arc passes through #1 point and extends to a position between #1 point and #2 point of the No. 1 insulator. The simulation results are shown in Figure 16. The occurrence of the partial arc caused obvious distortion of the electric field, which was a two-dimensional axis symmetrical field before arcing to a three-dimensional field. The electric field intensity at the high voltage end decreased to 0.24 kV/mm. The equipotential lines near the partial arc were very dense. The electric field intensity inside the insulator rib was high, and the highest field intensity reached 0.50 kV/mm. The rib was the bulge on the lower surface of the insulator shed. At this time, the field intensity of the arc head was about 1.72 kV/mm.
Extension 2 refers to the case where the partial arc has just passed through #2 point of the No. 1 insulator, and the simulation results are shown in Figure 17. The electric field intensity around the head of the rib was higher. The #2 point of the No. 1 insulator appeared as a maximum field intensity along the surface, which was about 0.91 kV/mm. After the arc passed through the rib, the electric field intensity of the arc head decreased obviously, about 0.87 kV/mm, which led to the slow development of the arc.
Extension 3 refers to the case where the partial arc passes through #3 point and extends before #4 point of the No. 1 insulator. The simulation results are shown in Figure 18. For the depression below the insulator shed, the electric field intensity was higher on the side away from the fitting. The #3 point of the No. 1 insulator (the bottom of the depression) had the local maximum of field intensity, about 0.79 kV/mm. At this time, the arc head field intensity increased obviously, about 2.09 kV/mm, which promoted the arc to develop forward.
Extension 4 refers to the case where the arc passes through #4 point and extends before #5 point of the No. 1 insulator, and the simulation results are shown in Figure 19. On the lower surface of the insulator lower shed, the electric field intensity was high, and the maximum field intensity was up to 1.08 kV/mm. At this time, the field intensity of the arc head was about 2.24 kV/mm.
Extension 5 refers to the case where the arc has just passed through #5 point of the No. 1 insulator, and the simulation results are shown in Figure 20. At the edge of the lower shed, the equipotential lines were denser and the field intensity was higher. The #5 point of the No. 1 insulator appeared as a maximum field intensity along the surface, which was about 1.48 kV/mm. The field intensity of the arc head was significantly reduced, about 1.98 kV/mm, which led to the slow development of the arc.
The occurrence of the partial arc causes obvious distortion of the electric field, which was a two-dimensional axis symmetrical field before arcing to a three-dimensional field. The arc extends from the high-voltage end to different lengths, and the field intensity changes differently. The field intensity also has a great relationship with the electric porcelain structure of the insulator. The sudden rise of field intensity is mostly at the rib and the shed edge, which has the local maximum field intensity. The electric field intensity of the arc head changes with the development of the arc length, but it does not always increase with the increase of arc length. In the case of arc extension, the electric field intensity of both the arc head and the insulator surface does not exceed that of air breakdown. The main reason for promoting the development of the arc can be attributed to thermal ionization. In the case of arc Extension 2 and Extension 5, the field intensity of the arc head is significantly reduced, and the rib and the shed edge create a certain hindrance to the arc extension. Therefore, appropriately setting the rib near the insulator’s high-voltage end and increasing the number of sheds are helpful in hindering the development of the arc.

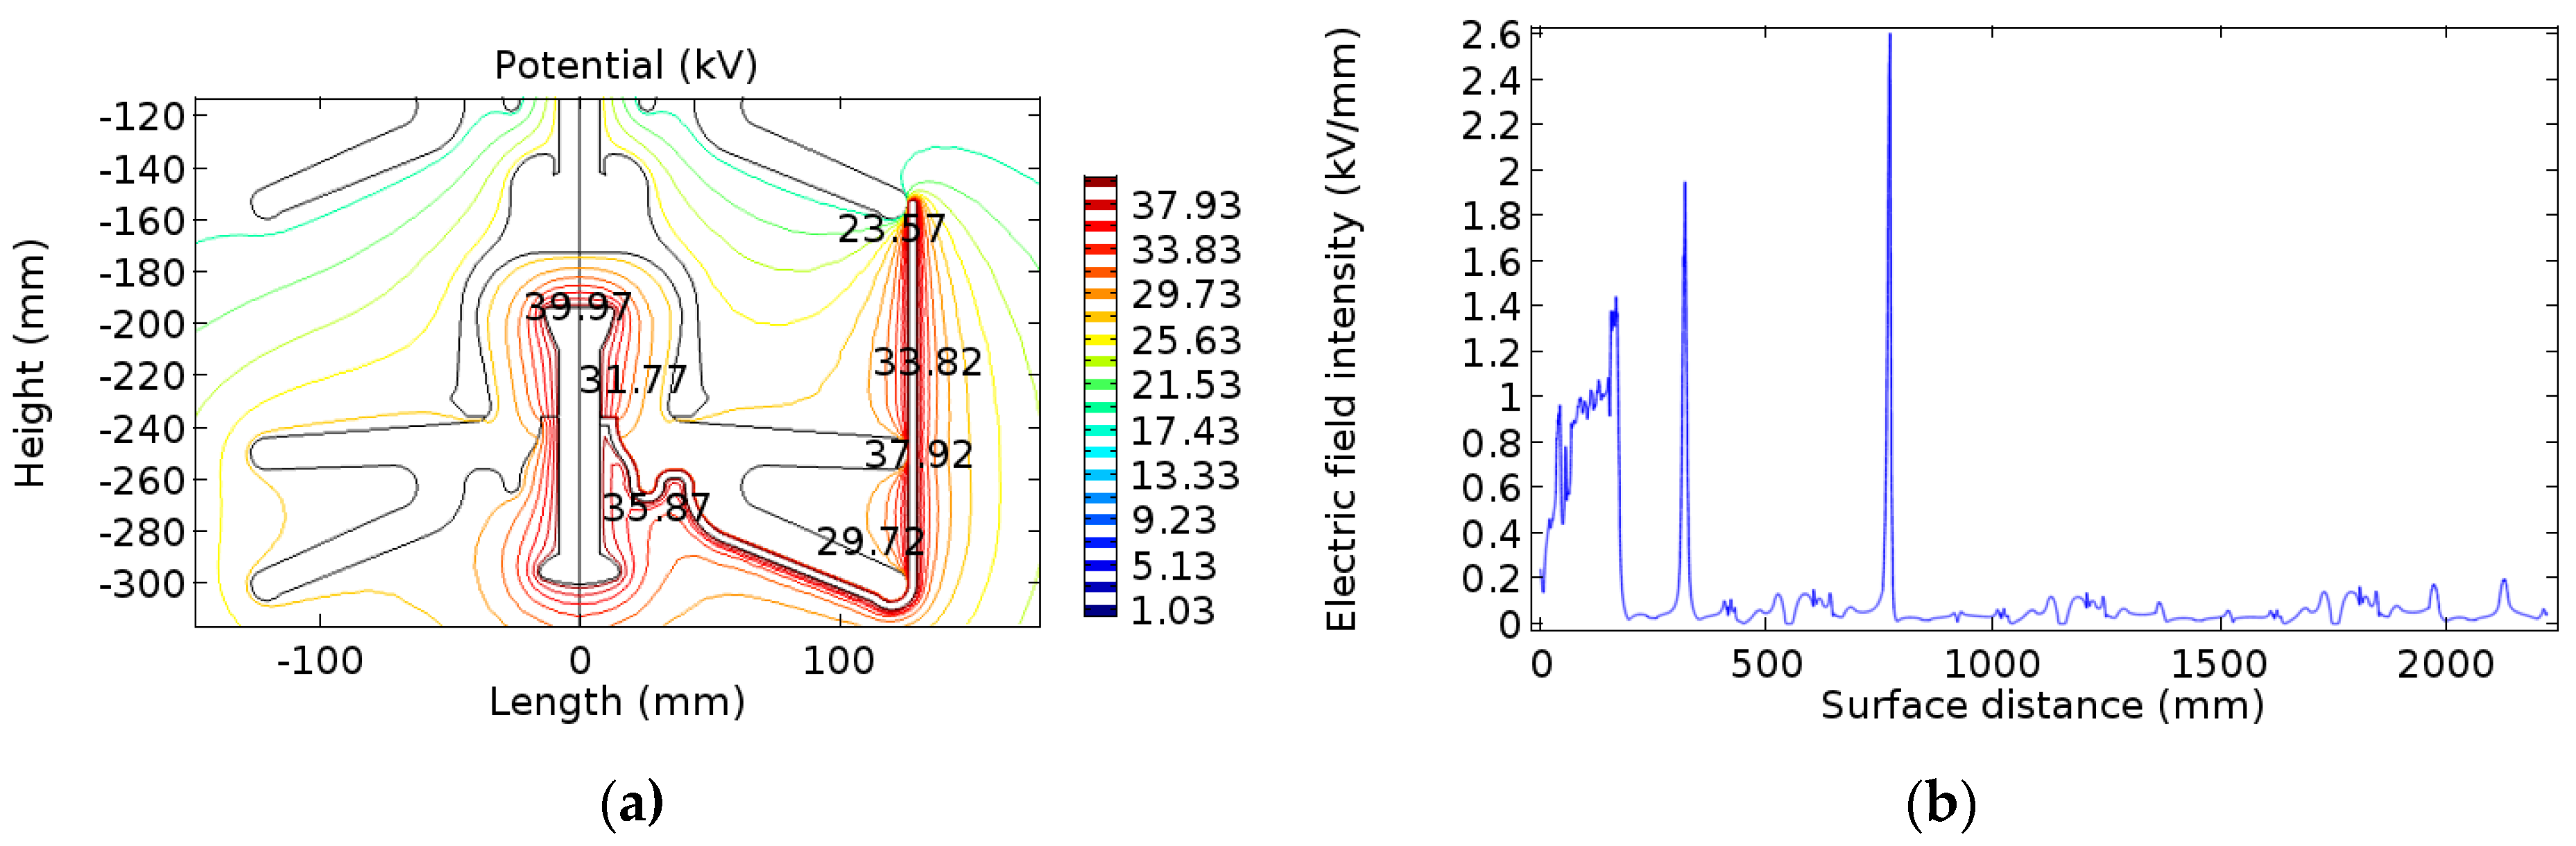
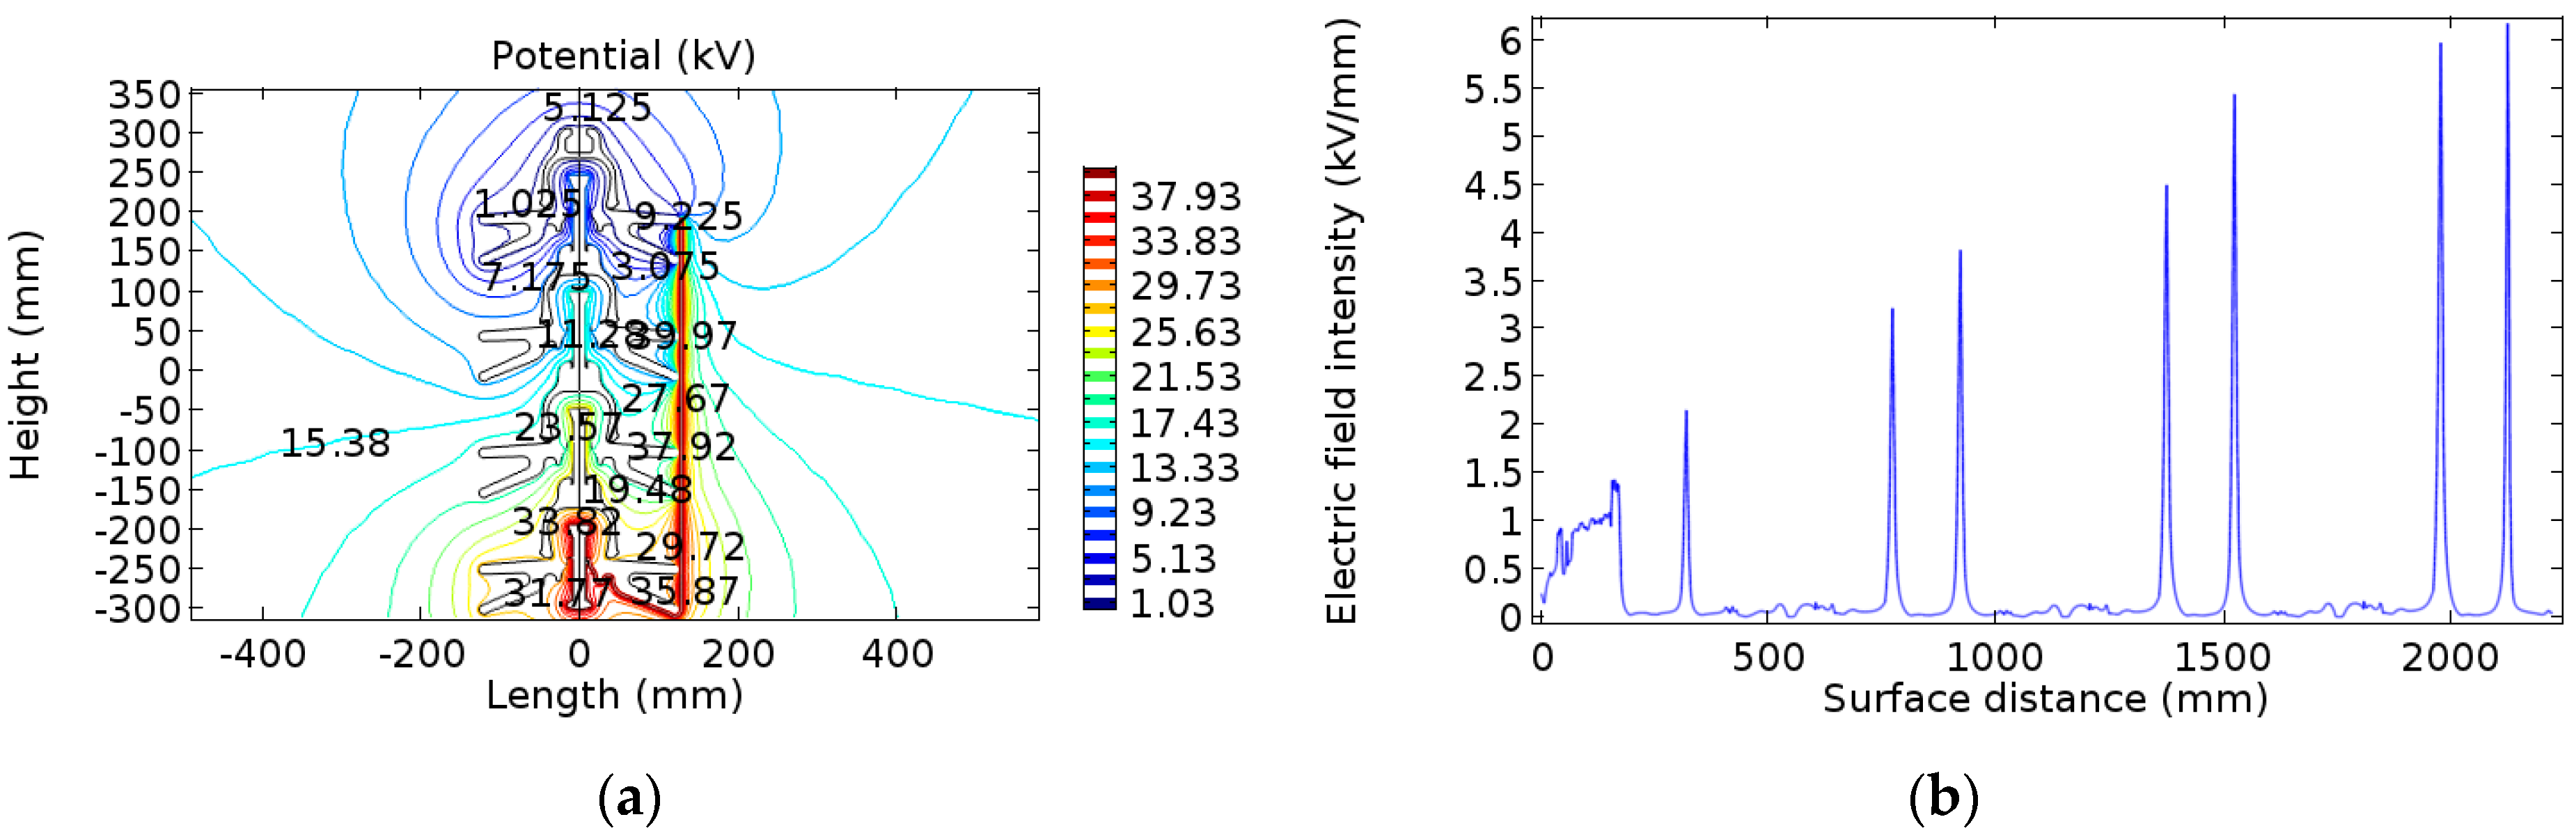
4.3. Electric Field Distribution of Partial Arc Bridge Sheds of Insulator String

Considering the development of a partial arc, the trajectory of the arc was not completely along the surface of the insulator string. The partial arc extended to #5 point on the surface of the No. 1 insulator and began to develop vertically upward, thus bridging the upper sheds. According to the increase of the number of sheds arc-bridged, four cases were defined as Bridge 1 to Bridge 4. The four arc bridge sheds cases were sequentially simulated.
Bridge 1 refers to the case where the arc passes through #5 point and bridges the upper shed of the No. 1 insulator. The simulation results are shown in Figure 21. The electric field of the insulator string was obviously distorted by the arc bridge sheds, and the degree of distortion was more serious than that of the arc extension along the insulator. Since the arc occurred from the high-voltage end and extended through the #1–5 points of the No. 1 insulator, the electric field distortion of the No. 1 insulator was caused by both the arc extension and the arc bridge sheds. The equipotential lines of #5 point and #6 point of the No. 1 insulator were dense; these two points had the local maximum field intensity. The field intensity of the No. 1 insulator #6 point reached the highest, which was about 1.68 kV/mm. The #6 point was located at the edge of the upper shed of the No. 1 insulator. At this time, the field intensity of the arc head was about 3.88 kV/mm, which aggravated the ionization of air and promoted the rapid development of the arc.
Bridge 2 refers to the case where the partial arc bridges to the lower shed of the No. 2 insulator, and the simulation results are shown in Figure 22. The equipotential lines of the edges of the sheds arc-bridged are very dense. The #5 point of the No. 2 insulator appeared as a maximum field intensity along the surface, which was about 2.61 kV/mm. In contrast to Bridge 1, the electric field intensity at the feature points the arc passed through was higher, such as #2, #5, #6 points of the No. 1 insulator and #5 point of the No. 2 insulator. At this time, the field intensity of the arc head was about 5.15 kV/mm.
Bridge 3 refers to the case where the partial arc bridges to the upper shed of the No. 2 insulator, and the simulation results are shown in Figure 23. On the insulator surface where the arc had not passed, there was no obvious change in the equipotential line. The maximum electric field intensity appeared at the No. 2 insulator #6 point, which was about 3.37 kV/mm. The electric field intensity at this position exceeded the air breakdown field intensity, which promoted the rapid development of the arc. For the same insulator, the field intensity at #6 point was always higher than that at #5 point. The sheds where these two points were located were different in shape and had different angles with the arc. The shed where #6 point was located (upper shed) was almost perpendicular to the arc. For the same feature point (#5 point or #6 point) of different insulators, the field intensity was different, and that at the edge of the bridged shed near the ground end was higher. At this time, the field intensity of the arc head was about 6.19 kV/mm.
Bridge 4 is that the partial arc bridges to the upper shed of the No. 4 insulator, and the simulation result is shown in Figure 24. At this time, all sheds of the insulator string were bridged by the arc. The distinct local maximum field intensity appeared at the edges of the bridged sheds, and the field intensity at the edge of the bridged shed near the ground end was higher. The maximum electric field intensity appears at the No. 4 insulator #6 point, which was about 6.18 kV/mm. At this time, the field intensity of the arc head was about 9.62 kV/mm.
The electric field of the insulator string is obviously distorted by the arc bridge sheds, and the degree of distortion is more serious than that of the arc extension along the insulator. In the case of arc bridge sheds, the distinct local maximum field intensity appears at the edges of the bridged sheds. The field intensity at the edge of the bridged shed near the ground end is higher. The highest field intensity appears at the edge of the last bridged shed. As the number of sheds arc-bridged increases, the maximum field intensity also increases. Starting from the arc bridging the upper shed of the No. 2 insulator, the electric field intensity at the upper shed edge of the No. 2 insulator exceeds that of air breakdown. The electric field intensity of the arc head has always exceeded the air breakdown field intensity, which promotes the rapid development of the arc. As the arc length increases, the electric field intensity of the arc head also increases, which results in an accelerated arc development. In the case of arc bridge sheds, the main factor to promote the development of the arc can be attributed to electrical breakdown, and the development speed is gradually accelerating. In view of the problem that the arc development speed is too fast after the arc bridges the sheds, the insulators with different diameter sheds can be used, and a booster shed can be attached to the top of the insulator string to increase the difficulty of the arc bridging sheds, thereby reducing the occurrence of flashover.

5. Conclusions

According to the above results, the following conclusions can be obtained:
(1)
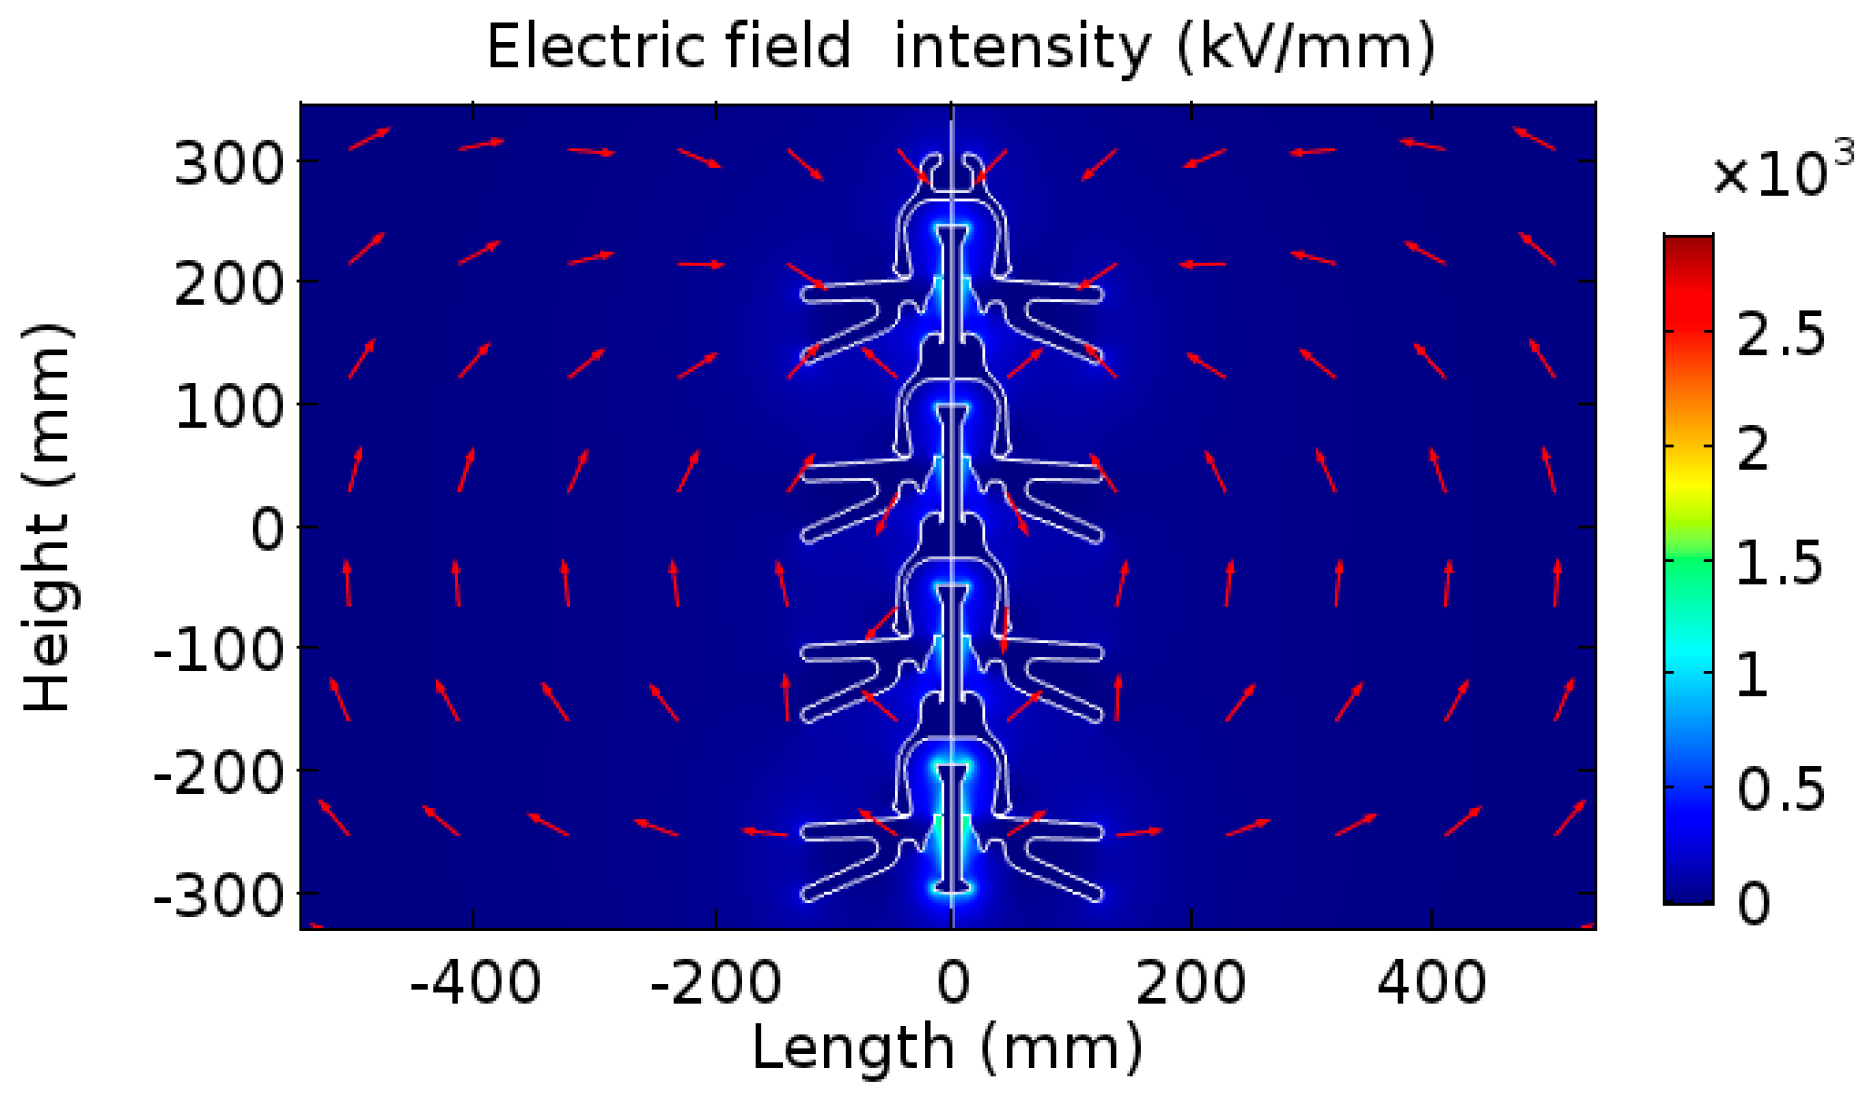
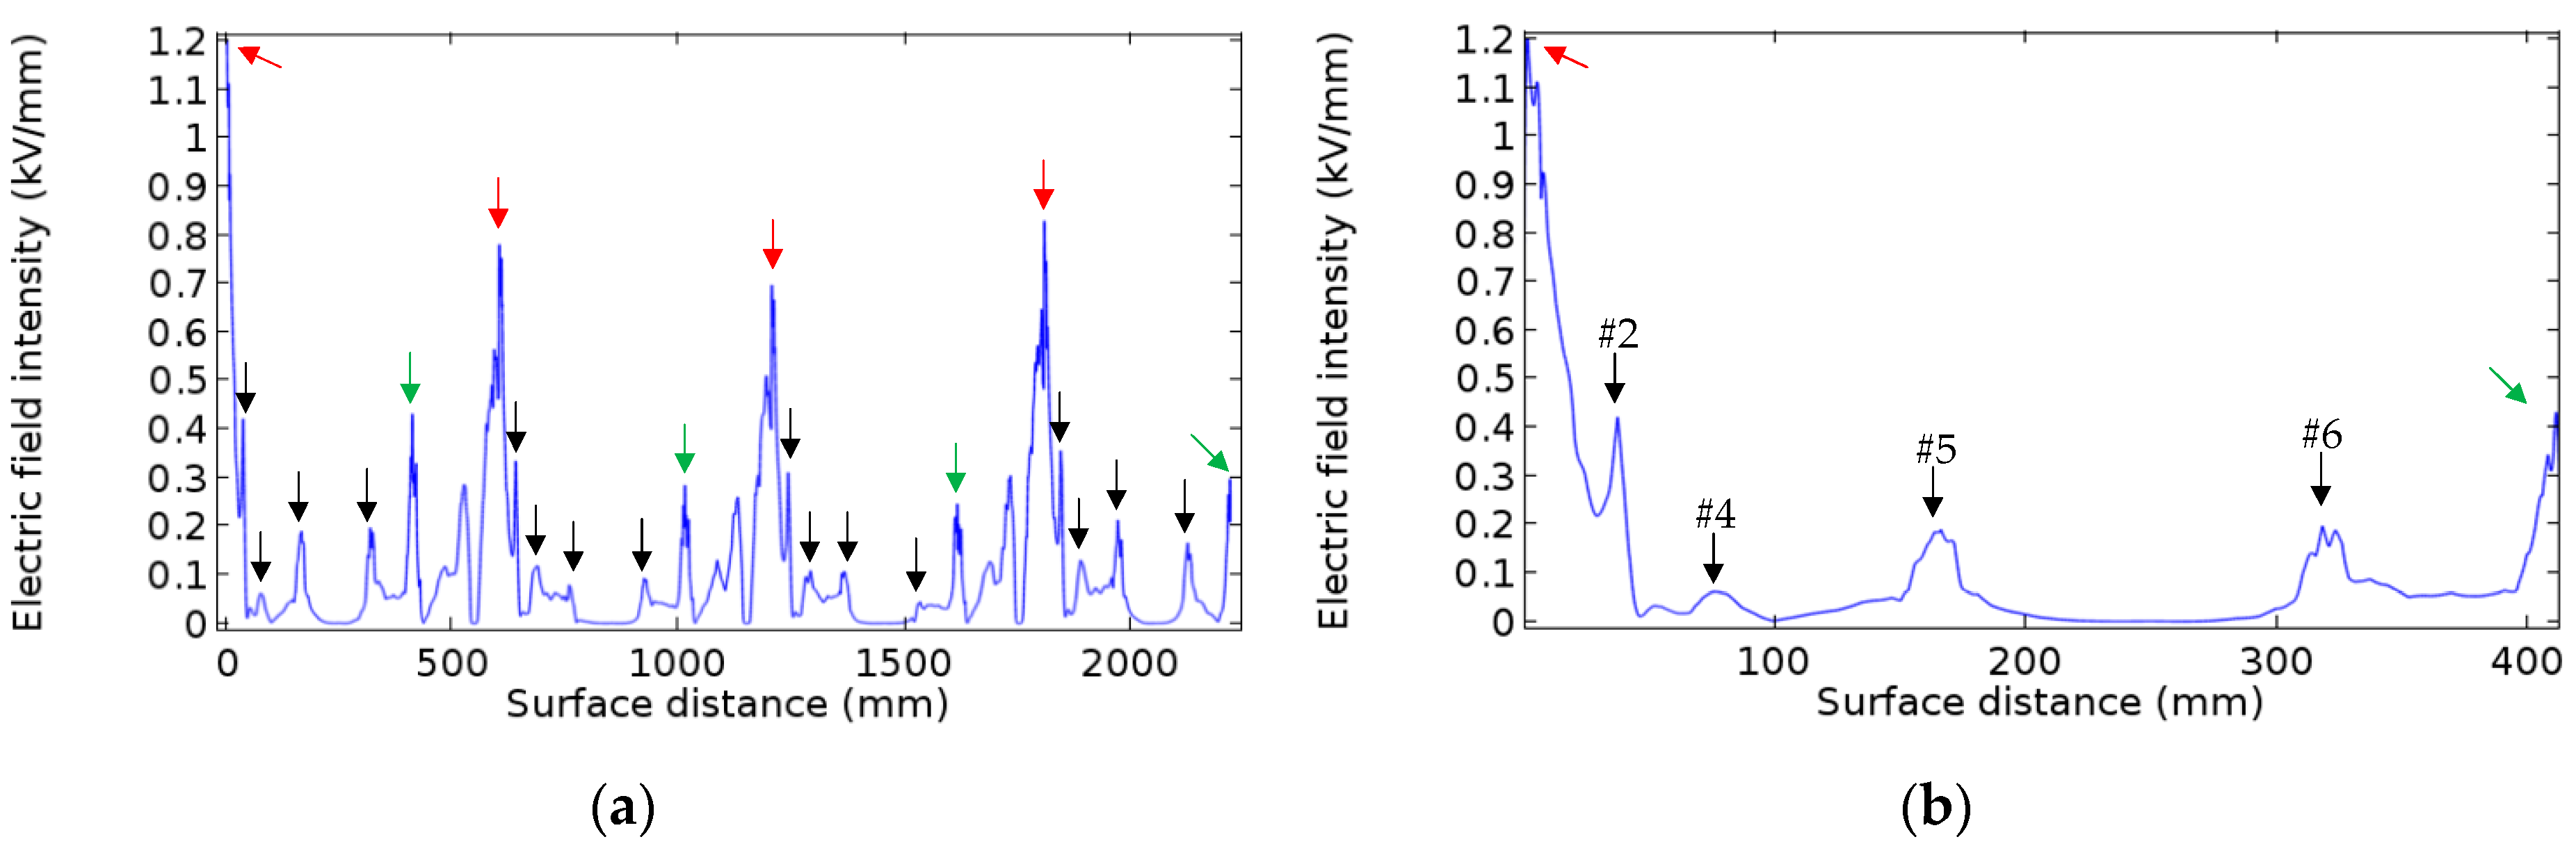
The appearance of a contaminated wet layer weakened the field intensity at the high-voltage and ground ends, and the U-shaped distribution of electric field was disrupted. The overall electric field distribution was flatter than that under the clean and dry conditions. The relationship between the electric field distribution and the shape of insulators was also obvious. The electric field intensity and the current density at the high-voltage end (No. 1 insulator steel pin) were the highest, and the partial arc was apt to occur at the high-voltage end.
(2)
The occurrence of a partial arc caused obvious distortion of the electric field, which was a two-dimensional axis symmetrical field before arcing to a three-dimensional field. In the case of arc extension, the sudden rise of field intensity was mostly at the rib and the shed edge. The rib and the shed edge performed a certain hindrance to the extension of the arc. In the case of arc extension, the electric field intensity of both the arc head and the insulator surface did not exceed that of air breakdown. The main reason for promoting the development of the arc can be attributed to thermal ionization. Setting the rib near the insulator’s high-voltage end and increasing the number of sheds are helpful in hindering the development of the arc.
(3)
In the case of arc bridge sheds, there appeared a distinct local maximum field intensity at the edge of the bridged shed. The maximum field intensity appeared at the edge of the last bridged shed. As the number of sheds arc bridged increased, the maximum field intensity also increased. As the arc length increased, the electric field intensity of the arc head also increased, which resulted in an accelerated arc development. The main factor to promote the development of the arc can be attributed to electrical breakdown. In view of the problem that the arc development speed is too fast after the arc bridges sheds, the insulators with different diameter sheds can be used, and a booster shed can be attached to the top of the insulator string to increase the difficulty of the arc bridging sheds, thereby reducing the occurrence of flashover.
(4)
Different factors have different influences on the electric field. Considering the influence of different arc starting positions, multiple partial arcs, different arc shapes and paths, different conductivities of the contaminated layer, dry zone, and environment around the insulator string on the electric field characteristics, this paper will focus on more influencing factors in future research.

Author Contributions

Research concepts were proposed by S.Z. and C.Z. Data processing and the manuscript preparation were conducted by Y.Z. and S.W. Data analysis and interpretation were implemented by S.Z. Manuscript editing was performed by S.Z. and C.Z.

Funding

This work was financially supported by the Natural Science Foundation of China (51567014; 51767014; 51867013).

Conflicts of Interest

The authors declare no conflict of interest.

References

  1. China Railway Corporation. The Technology of High-speed Railway Catenary; China Railway Press: Beijing, China, 2014; pp. 1–6. [Google Scholar]
  2. Zhang, Z.; You, J.; Wei, D.; Jiang, X.; Zhang, D. Investigations on AC pollution flashover performance of insulator string under different non-uniform pollution conditions. IET Gener. Transm. Distrib. 2016, 10, 437–443. [Google Scholar] [CrossRef]
  3. Xu, J.; Yin, F.; Li, L.; Wen, Q.; Wang, H.; Liu, S.; Jia, Z.; Farzaneh, M. Wet Snow Flashover Characteristics of 500-kV AC Insulator Strings with Different Arrangements. Appl. Sci. 2019, 9, 930. [Google Scholar] [CrossRef]
  4. Jiang, X.; Wang, Q.; Zhang, Z.; Hu, J.; Hu, Q.; Zhu, C. Ion migration in the process of water freezing under alternating electric field and its impact on insulator flashover. Energies 2017, 10, 61. [Google Scholar] [CrossRef]
  5. Yu, W. Overhead Contact System of High Speed Electrified Railway; Southwest Jiaotong University Press: Chengdu, China, 2003; pp. 193–196. [Google Scholar]
  6. Zhao, S.; Zhang, Y.; Yao, X.; Wang, S.; Liu, J.; Zhang, W. Modeling and Simulation of Electric Field Distribution of Cantilever Insulators for Catenary. J. Rail. 2017, 39, 59–66. [Google Scholar]
  7. M’hamdi, B.; Teguar, M.; Mekhaldi, A. Optimal design of corona ring on HV composite insulator using PSO approach with dynamic population size. IEEE Trans. Dielectr. Electr. Insul. 2016, 23, 1048–1057. [Google Scholar] [CrossRef]
  8. Yin, F.; Jiang, X.; Farzaneh, M. Electrical performance of composite insulators under icing conditions. IEEE Trans. Dielectr. Electr. Insul. 2014, 21, 2584–2593. [Google Scholar] [CrossRef]
  9. Zhang, Y.; Zhao, S.; Chen, Z. Influence of Suspended Sand Particles on Potential and Electric Field Distribution Along Long Rod Insulator. High Volt. Eng. 2014, 40, 2706–2713. [Google Scholar]
  10. Wang, H.; Wang, S.; Deng, C.; Yang, G.; Lv, F. Study on the flashover characteristics of bird droppings along 110kV composite insulator. In Proceedings of the 2018 International Conference on Power System Technology (POWERCON), Guangzhou, China, 6–8 November 2018; pp. 2929–2933. [Google Scholar]
  11. Skopec, A.; Wankowicz, J.G.; Sikorski, B. Electric field calculation for an axially-symmetric insulator with surface contamination. IEEE Trans. Dielectr. Electr. Insul. 1994, 1, 332–339. [Google Scholar] [CrossRef]
  12. Bo, L.; Gorur, R.S. Modeling flashover of AC outdoor insulators under contaminated conditions with dry band formation and arcing. IEEE Trans. Dielectr. Electr. Insul. 2012, 19, 1037–1043. [Google Scholar] [CrossRef]
  13. Xu, Z.; Lu, F.; Li, H. Influence of Separated Globules on Post Insulator Electric Field Distribution. High Volt. Eng. 2010, 2278–2284. [Google Scholar]
  14. Gu, L.; Zhang, J.; Sun, C. Influence of surface electric field distribution along polluted cylindrical insulator on flashover process. Process 1993, 13, 70–76. (In Chinese) [Google Scholar]
  15. Sima, W. Study on Electric Field Distribution and Flashover Mechanism of Polluted Suspension Insulator Surface. Ph.D. Thesis, Chongqing University, Chongqing, China, 1 July 1994. [Google Scholar]
  16. Ale-Emran, S.; Farzaneh, M. Flashover performance of ice-covered post insulators with booster sheds using experiments and partial arc modelling. IEEE Trans. Dielectr. Electr. Insul. 2016, 23, 979–986. [Google Scholar] [CrossRef]
  17. Zhang, Z. Study on Pollution Flashover Performance and DC Discharge Model of Insulator (Long) Strings at Low Air Pressure. Ph.D. Thesis, Chongqing University, Chongqing, China, 1 October 2007. [Google Scholar]
  18. Xu, Z.; Lu, F.; Li, H. Influencing Factors of Insulator Electric Field Analysis by Finite Element Method and its Optimization. High Volt. Eng. 2011, 37, 944–951. [Google Scholar]
  19. Yu, X. Practical Technical Guide of Electrified Railway Catenary; China Railway Press: Beijing, China, 2011; pp. 269–315. (In Chinese) [Google Scholar]
  20. IEC 60305:1995. Insulators for Overhead Lines with a Nominal Voltage Above 1000V-Ceramic or Glass Insulator Units for A.C. Systems-Characteristics of Insulator Units of the Cap and Pin Type; International Electrotechnical Commission: Worcester, MA, USA, 1995. [Google Scholar]
  21. Xu, Z.; Lu, F. Influence of insulating materials and their parameters on surface electric field strength and potential distribution of insulators. Power Syst. Tech. 2011, 32, 152–157. [Google Scholar]
  22. GB/T 1402-2010 Railway Applications Supply Voltages of Traction Systems; China Standard Press: Beijing, China, 2010. (In Chinese)
  23. Xu, Z.; Lu, F.; Li, H. Influence of Dry Band on Electric Field Distribution of Polluted Post Insulator. High Volt. Eng. 2011, 37, 276–283. [Google Scholar]
  24. Wang, L.; Li, X.; Cao, B.; Guo, C. Influence of Partial Arc on Leakage Current and Surface Conductivity of Insulators. High Volt. Eng. 2019, 45, 1624–1629. [Google Scholar]
  25. Zhang, R.; Guan, Z.; Xue, J.; Shuang, M. Conductivity of Partial Surface—A New Method to Describe Contaminated Degree of Insulator. High Volt. Eng. 1990, 22–28. [Google Scholar]
  26. Tang, Q. Contamination characteristics and electric field distribution of high voltage insulators. Master’s Thesis, Suzhou University, Suzhou, China, 1 May 2017. [Google Scholar]
  27. IEC 60507:2013. Artificial Pollution Tests on High-Voltage Insulators to Be Used on a.c. Systems; International Electrotechnical Commission: Worcester, MA, USA, 2013. [Google Scholar]
  28. Wilkins, R.; Al-Baghdadi, A. Arc propagation along an electrolyte surface. Proc. Inst. Electr. Eng. 1971, 118, 1886–1892. [Google Scholar] [CrossRef]
Figure 1. Discharge process of insulator string.
Energies 12 03295 g001
Figure 2. Insulator string of electrified railway catenary: (a) insulator string in working state; (b) catenary structure chart.
Energies 12 03295 g002
Figure 3. Structural characteristics of insulators.
Energies 12 03295 g003
Figure 4. Insulator string simulation model.
Energies 12 03295 g004
Figure 5. Mesh of insulator string model.
Energies 12 03295 g005
Figure 6. Equipotential line distribution of insulator string under clean and dry conditions.
Energies 12 03295 g006
Figure 7. Electric field distribution of insulator string under clean and dry conditions.
Energies 12 03295 g007
Figure 8. Surface distance of insulator string.
Energies 12 03295 g008
Figure 9. Potential distribution along insulator string.
Energies 12 03295 g009
Figure 10. Electric field distribution along insulator string under clean and dry conditions: (a) insulator string; (b) No.1 insulator porcelain surface.
Energies 12 03295 g010
Figure 11. Electric field distribution along insulator string under contaminated and wet condition.
Energies 12 03295 g011
Figure 12. Current density along No.1 insulator under contaminated and wet condition.
Energies 12 03295 g012
Figure 13. Schematics of the artificial pollution test.
Energies 12 03295 g013
Figure 14. Test power supply and data acquisition device.
Energies 12 03295 g014
Figure 15. Partial arc in model.
Energies 12 03295 g015
Figure 16. Simulation results of Extension 1: (a) equipotential line distribution; (b) electric field distribution along No. 1 insulator.
Energies 12 03295 g016
Figure 17. Simulation results of Extension 2: (a) equipotential line distribution; (b) electric field distribution along No. 1 insulator.
Energies 12 03295 g017
Figure 18. Simulation results of Extension 3: (a) equipotential line distribution; (b) electric field distribution along No. 1 insulator.
Energies 12 03295 g018
Figure 19. Simulation results of Extension 4: (a) equipotential line distribution; (b) electric field distribution along No. 1 insulator.
Energies 12 03295 g019
Figure 20. Simulation results of Extension 5: (a) equipotential line distribution; (b) electric field distribution along No. 1 insulator.
Energies 12 03295 g020
Figure 21. Simulation results of Bridge 1: (a) equipotential line distribution; (b) electric field distribution along insulator string.
Energies 12 03295 g021
Figure 22. Simulation results of Bridge 2: (a) equipotential line distribution; (b) electric field distribution along insulator string.
Energies 12 03295 g022
Figure 23. Simulation results of Bridge 3: (a) equipotential line distribution; (b) electric field distribution along insulator string.
Energies 12 03295 g023
Figure 24. Simulation results of Bridge 4: (a) equipotential line distribution; (b) electric field distribution along insulator string.
Energies 12 03295 g024
Table 1. Main technical parameters of U70BL insulator.
ProjectMechanical Failure Load (kN)Nominal Diameter (mm)Nominal Structure Height (mm)Creepage Distance (mm)
Parameters70255146413
Table 2. Material parameters of U70BL insulator.
MaterialAirHardware FittingsPorcelain
Relative Dielectric Constant εr110106
Conductivity γ/(S·m−1)10−151.15 × 10710−10
Table 3. Corresponding surface distance of each part of the insulator string.
ComponentStarting Point (mm)Terminal Point (mm)
Insulating part of No.1 insulator 0413
Fitting between No.1 insulator and No.2 insulator413604
Insulating part of No.2 insulator 6041017
Fitting between No.2 insulator and No.3 insulator10171208
Insulating part of No.3 insulator 12081621
Fitting between No.3 insulator and No.4 insulator13511812
Insulating part of No.4 insulator 18122225

