Article

Enhanced CO2 Conversion to Acetate through Microbial Electrosynthesis (MES) by Continuous Headspace Gas Recirculation

1
Chemical and Environmental Bioprocess Engineering Group, Natural Resources Institute (IRENA), Universidad de León, Av. de Portugal 41, 24009 León, Spain
2
Department of Electrical Engineering and Automatic Systems, Universidad de León, Campus de Vegazana s/n, 24071 León, Spain
*
Author to whom correspondence should be addressed.
Energies 2019, 12(17), 3297; https://doi.org/10.3390/en12173297
Submission received: 23 July 2019 / Revised: 16 August 2019 / Accepted: 19 August 2019 / Published: 27 August 2019
(This article belongs to the Special Issue Microbial Electrosynthesis)

Abstract

:
Bioelectrochemical systems (BESs) is a term that encompasses a group of novel technologies able to interconvert electrical energy and chemical energy by means of a bioelectroactive biofilm. Microbial electrosynthesis (MES) systems, which branch off from BESs, are able to convert CO2 into valuable organic chemicals and fuels. This study demonstrates that CO2 reduction in MES systems can be enhanced by enriching the inoculum and improving CO2 availability to the biofilm. The proposed system is proven to be a repetitive, efficient, and selective way of consuming CO2 for the production of acetic acid, showing cathodic efficiencies of over 55% and CO2 conversions of over 80%. Continuous recirculation of the gas headspace through the catholyte allowed for a 44% improvement in performance, achieving CO2 fixation rates of 171 mL CO2 L−1·d−1, a maximum daily acetate production rate of 261 mg HAc·L−1·d−1, and a maximum acetate titer of 1957 mg·L−1. High-throughput sequencing revealed that CO2 reduction was mainly driven by a mixed-culture biocathode, in which Sporomusa and Clostridium, both bioelectrochemical acetogenic bacteria, were identified together with other species such as Desulfovibrio, Pseudomonas, Arcobacter, Acinetobacter or Sulfurospirillum, which are usually found in cathodic biofilms. Moreover, results suggest that these communities are responsible of maintaining a stable reactor performance.

1. Introduction

Anthropogenic greenhouse gas emissions—among which CO2 occupies a preeminent position—are widely considered as the main contributors to the global rise in temperature [1]. Thus, not surprisingly, increasing worldwide CO2 emissions and their impact on climate change have become one of the main public concerns, and great efforts and investments are being made in the fields of science and engineering to reverse this situation [2].
In the last few years, the concept of carbon capture and utilization has become of great interest for the chemical industry as it represents a technological solution that aims to prevent CO2 emissions by converting them into value-added chemicals [3,4]. Exploring ways to give added value to this CO2 has gained attention during the last few years, and a wide range of chemical and biological methods have already been put forward for its valorization [5]. However, CO2 is a highly oxidized molecule and its conversion into valuable molecules (e.g., fuels, solvents, precursors, etc.) requires a chemical reductant to provide the necessary electrons. Alternatively, an electrode (cathode) can also serve as an electron donor, thus avoiding the need for a chemical reductant [6]. This is the case for microbial electrosynthesis (MES), a relatively recent technology which makes use of a bioelectrode to provide electrons for CO2 reduction and generate multicarbon organics [7,8]. MES is rooted on the capability of some types of bacteria to electrically interact with a solid surface (cathode) that acts as an electron donor for their metabolism [9]. Several studies have been published in the last few years studying different aspects of CO2 bioelectroreduction, targeting acetate as an end-product [8,10,11], and using both mixed- and pure-culture electroactive biofilms. For instance, pure cultures of homoacetogenic bacteria such as Sporomusa sp. [12] or Clostridium sp. [13] have been used to understand and overcome fundamental challenges (e.g., characterizing electron transfer mechanisms), while enriched acetogenic biocathodes seem to be the key to achieving robust and inexpensive scalable systems [14,15]. Nevertheless, MES technology and bioelectrochemical systems are, in general, still far from practical application, and further research into basic operational variables, long-term stability, continuous production, modelling, repeatability, and scalability is still necessary [16,17,18]. The need to improve CO2 availability to microorganisms is particularly important; in this regard, CO2 solubility issues play a vital role. To date, this problem has mainly been solved by sparging excess quantities of CO2 in the culture medium [14], or directly adding inorganic carbon in the form of bicarbonate [19]. However, these approaches have some drawbacks: in the sparging method, most of the CO2 is lost to the atmosphere, while pH must be continuously adjusted if bicarbonate is used as the substrate.
The present study aims to gain knowledge on how improving CO2 availability to the microbial communities of an MES system, by continuous CO2 recirculation, impacts on MES system performance in terms of current density and product (acetic acid) formation. We also try to elucidate which microorganisms are responsible for the process and how their temporal evolution correlates with the overall MES performance.

2. Materials and Methods

2.1. MES Reactor Setup

Two identical two-chambered cells built in a modified 500 mL Duran® bottle were constructed and named MES1 and MES2. The anodic chamber consisted of a 20 mL semi-cylindrical glass chamber containing a platinum counter electrode (CE) placed in the center of the bottle, and opened to the atmosphere through a multiconnection plastic cap. The rest of the bottle (effective volume: 450 mL) acted as the cathodic chamber in which a cylindrical graphite felt electrode (apparent area: 176 cm2; thickness: 0.5 cm) was fixed to the bottle wall and connected to the outside through a sewn titanium wire. A pretreated cationic exchange membrane (Membranes International Inc., Ringwood, USA) was used to separate both compartments. A recirculation system, consisting of a reservoir airtight gasbag (1 L Tedlar® bag, Supelco, Bellefonte, USA) and a peristaltic pump (Miniplus 3, Gilson, USA), was used to take gas from the reactor headspace and reintroduce it at the bottom of the catholyte (Figure 1). All electrode assemblies showed a contact resistance < 2 Ω. Electrodes were pretreated by subsequent immersion in 1 M nitric acid, 1 M acetone, and 1 M ethanol for 24 h each to improve wettability and avoid impurities [20]. Electrodes were extensively rinsed in demineralized water to ensure an absence of chemicals from the pretreatment. Both cells worked as replicates on a three-electrode configuration with an Ag/AgCl reference electrode (0.197 V vs. SHE; the reference electrode was checked at the beginning of every batch cycle). The culture medium was continuously stirred using a magnetic stirrer at 200 rpm and maintained at 25 °C.

2.2. Influents and Inoculum

The catholyte consisted of a synthetic nutrient solution with the following composition (in g·L−1): 0.87 K2HPO4, 0.68 KH2PO4, 0.25 NH4Cl, 0.1 KCl, 0.04 CaCl2·2H2O, 0.45 MgCl2·6H2O, and 10 mL per liter of a trace mineral solution containing (in g·L−1): 6 MgSO4·7H2O, 1 MnSO4·H2O, 2 NaCl, 0.2 FeSO4·7H2O, 0.3 CoCl2·6H2O, 0.2 CaCl2·2H2O, 0.17 ZnCl2, 0.02 of CuSO4·5H2O, 0.02 H3BO3, 0.04 Na2MoO4·2H2O, 0.06 NiCl2·6H2O, 0.6 mg·L−1 Na2SeO4, and 0.8 mg·L−1 Na2WO4·2H2O as described in [20]. The anolyte consisted of 0.1 M phosphate buffer (pH 7.8).
An enriched inoculum (EI) was used as the direct source of microorganisms for the biocathodes. An anaerobic culture enrichment procedure from Bajracharya et al. [14] was strictly followed, starting from an initial anaerobic sludge (IS) retrieved from a running continuous anaerobic digester operating in the local wastewater treatment plant (Leon city WWTP, 350,000 P.E.). An initial 20% inoculum/80% culture medium mixture was used as the initial inoculation feed. The optical density at 600 nm of the EI used to inoculate the reactor was 0.72.

2.3. Experimental Procedure

Both cells were inoculated and operated in potentiostatic mode (−1 V vs. Ag/AgCl) until clear responses were found in terms of current consumption and acetic acid production. After acclimation, the acetic acid titer was lowered to around 1000 mg·L−1 by replacing part of the culture medium, as a starting point of the first and subsequent batches. This allowed conditions to be maintained as constant as possible and avoid changes that could hide differences between batches. After each batch, part of the culture medium was replaced to maintain the same initial conditions, in terms of titer, throughout the whole experiment. Two sets of 3 batches each were planned in order to assess the effect of CO2 recirculation in the system. In the first set, 500 mL of pure CO2 was fed into the headspace of the reactor, while pure 600 mL of CO2 was fed in the second set and continuously recirculated from the headspace to the bottom of the bottle at 120 mL·h−1.

2.4. Measurements and Analytical Techniques

Gas samples were collected from the headspace at the beginning and end of each cycle and analyzed immediately afterwards (detection limit 1%; quantification limit 5%). These samples were collected with a GASTIGHT 1001 (Hamilton Co., GR, Switzerland) syringe from a built-in rubber septum. Gas samples were analyzed using a gas chromatograph (Varian CP3800 GC) equipped with a thermal conductivity detector as described by Martínez et al. [21]. Regarding liquid samples, volatile fatty acids (VFAs) were measured using a gas chromatograph (Varian CP3800 GC) equipped with a Nukol capillary column and a thermal conductivity detector (30 m × 0.25 mm × 0.25 µm) from Supelco, using He as the mobile phase, as described by Martínez et al. [21] (detection and quantification limit 5 mg·L−1). pH was determined using APHA standard methodologies, as described by [22]. pH was determined with a HACH 5014T probe in a CRISON 20+ pH meter.
Electrochemical tests were performed using a potentiostat (VMP3, Biologic Science Instruments, France). Current was recorded each 600 s by means of a chronoamperometry [23], while the polarization curves were obtained from a staircase voltammetry in which each step (0.6, 0.8, and 1 V) was maintained for 2 h in order to avoid any influence of capacitive current.

2.5. Microbial Community Analysis

Genomic DNA was extracted from the IS and from the EI which was used as an inoculum for the reactor biocathodes. Samples of the biofilm (B) and supernatant (S) in the reactors were also taken from both reactors (MES1 and MES2) at 49 and 92 days of operation. To indicate this information, samples are named using the format ReactorName_SampleType_Days. Using this naming format, the microbiological samples taken in this experiment are MES1_B_49d, MES1_B_92d, MES2_S_49d and MES1_S_92d for MES1; and MES2_B_49d, MES2_B_92d, MES2_S_49d and MES2_S_92d for MES2.
Thin pieces of electrode were collected from different locations using a stainless steel surgical blade in sterile conditions in a laminar flow cabinet, and mixed and total DNA was extracted from the biofilm. The DNA was extracted using the Soil DNA Isolation Plus Kit® (Norgen Biotek Corp., Thorold, Canada) following the manufacturer’s instructions.
DNA was used for high-throughput sequencing of 16S-rRNA gene-based massive libraries for eubacterial populations using the primer set 27Fmod (5′-AGRGTTTGATCMTGGCTCAG-3′)/519R modBio (5′-GTNTTACNGCGGCKGCTG-3′) [24]. The obtained DNA reads were compiled in FASTq files for further bioinformatics processing and operational taxonomic units (OTUs) were then taxonomically classified using the Ribosomal Database Project (http://rdp.cme.msu.edu).
Venn diagram analysis was performed using Mothur and Venny software. The XLSTAT 2014 software package for multivariate analysis was used for performing principal component analysis (PCA) of the OTU abundance matrix of eubacteria population, in order to visualize the relevant information and relationships between samples. The obtained samples and OTU scores were depicted in a 2D biplot, which represents the phylogenetic assignment of the predominant OTUs (relative abundance > 0.5%).

3. Results

3.1. CO2 Recirculation Effect on MES

The two MES reactors (MES1 and MES2) were inoculated with an enriched inoculum as described in Section 2.2. They were initially operated with a static CO2 feed (i.e., the fed CO2 was not recirculated) and once reactors developed a clear and stable response in terms of current and acetate production, the experimental period began. During this period, two sets of 3 batch cycles each were performed to assess the effect of headspace gas recirculation. The first set, in which the static feed was continued, comprised 21 days (from day 49 to 70). During the second set (from day 71 to 92), both reactors were provided with a recirculation loop to continuously recirculate the headspace gas.
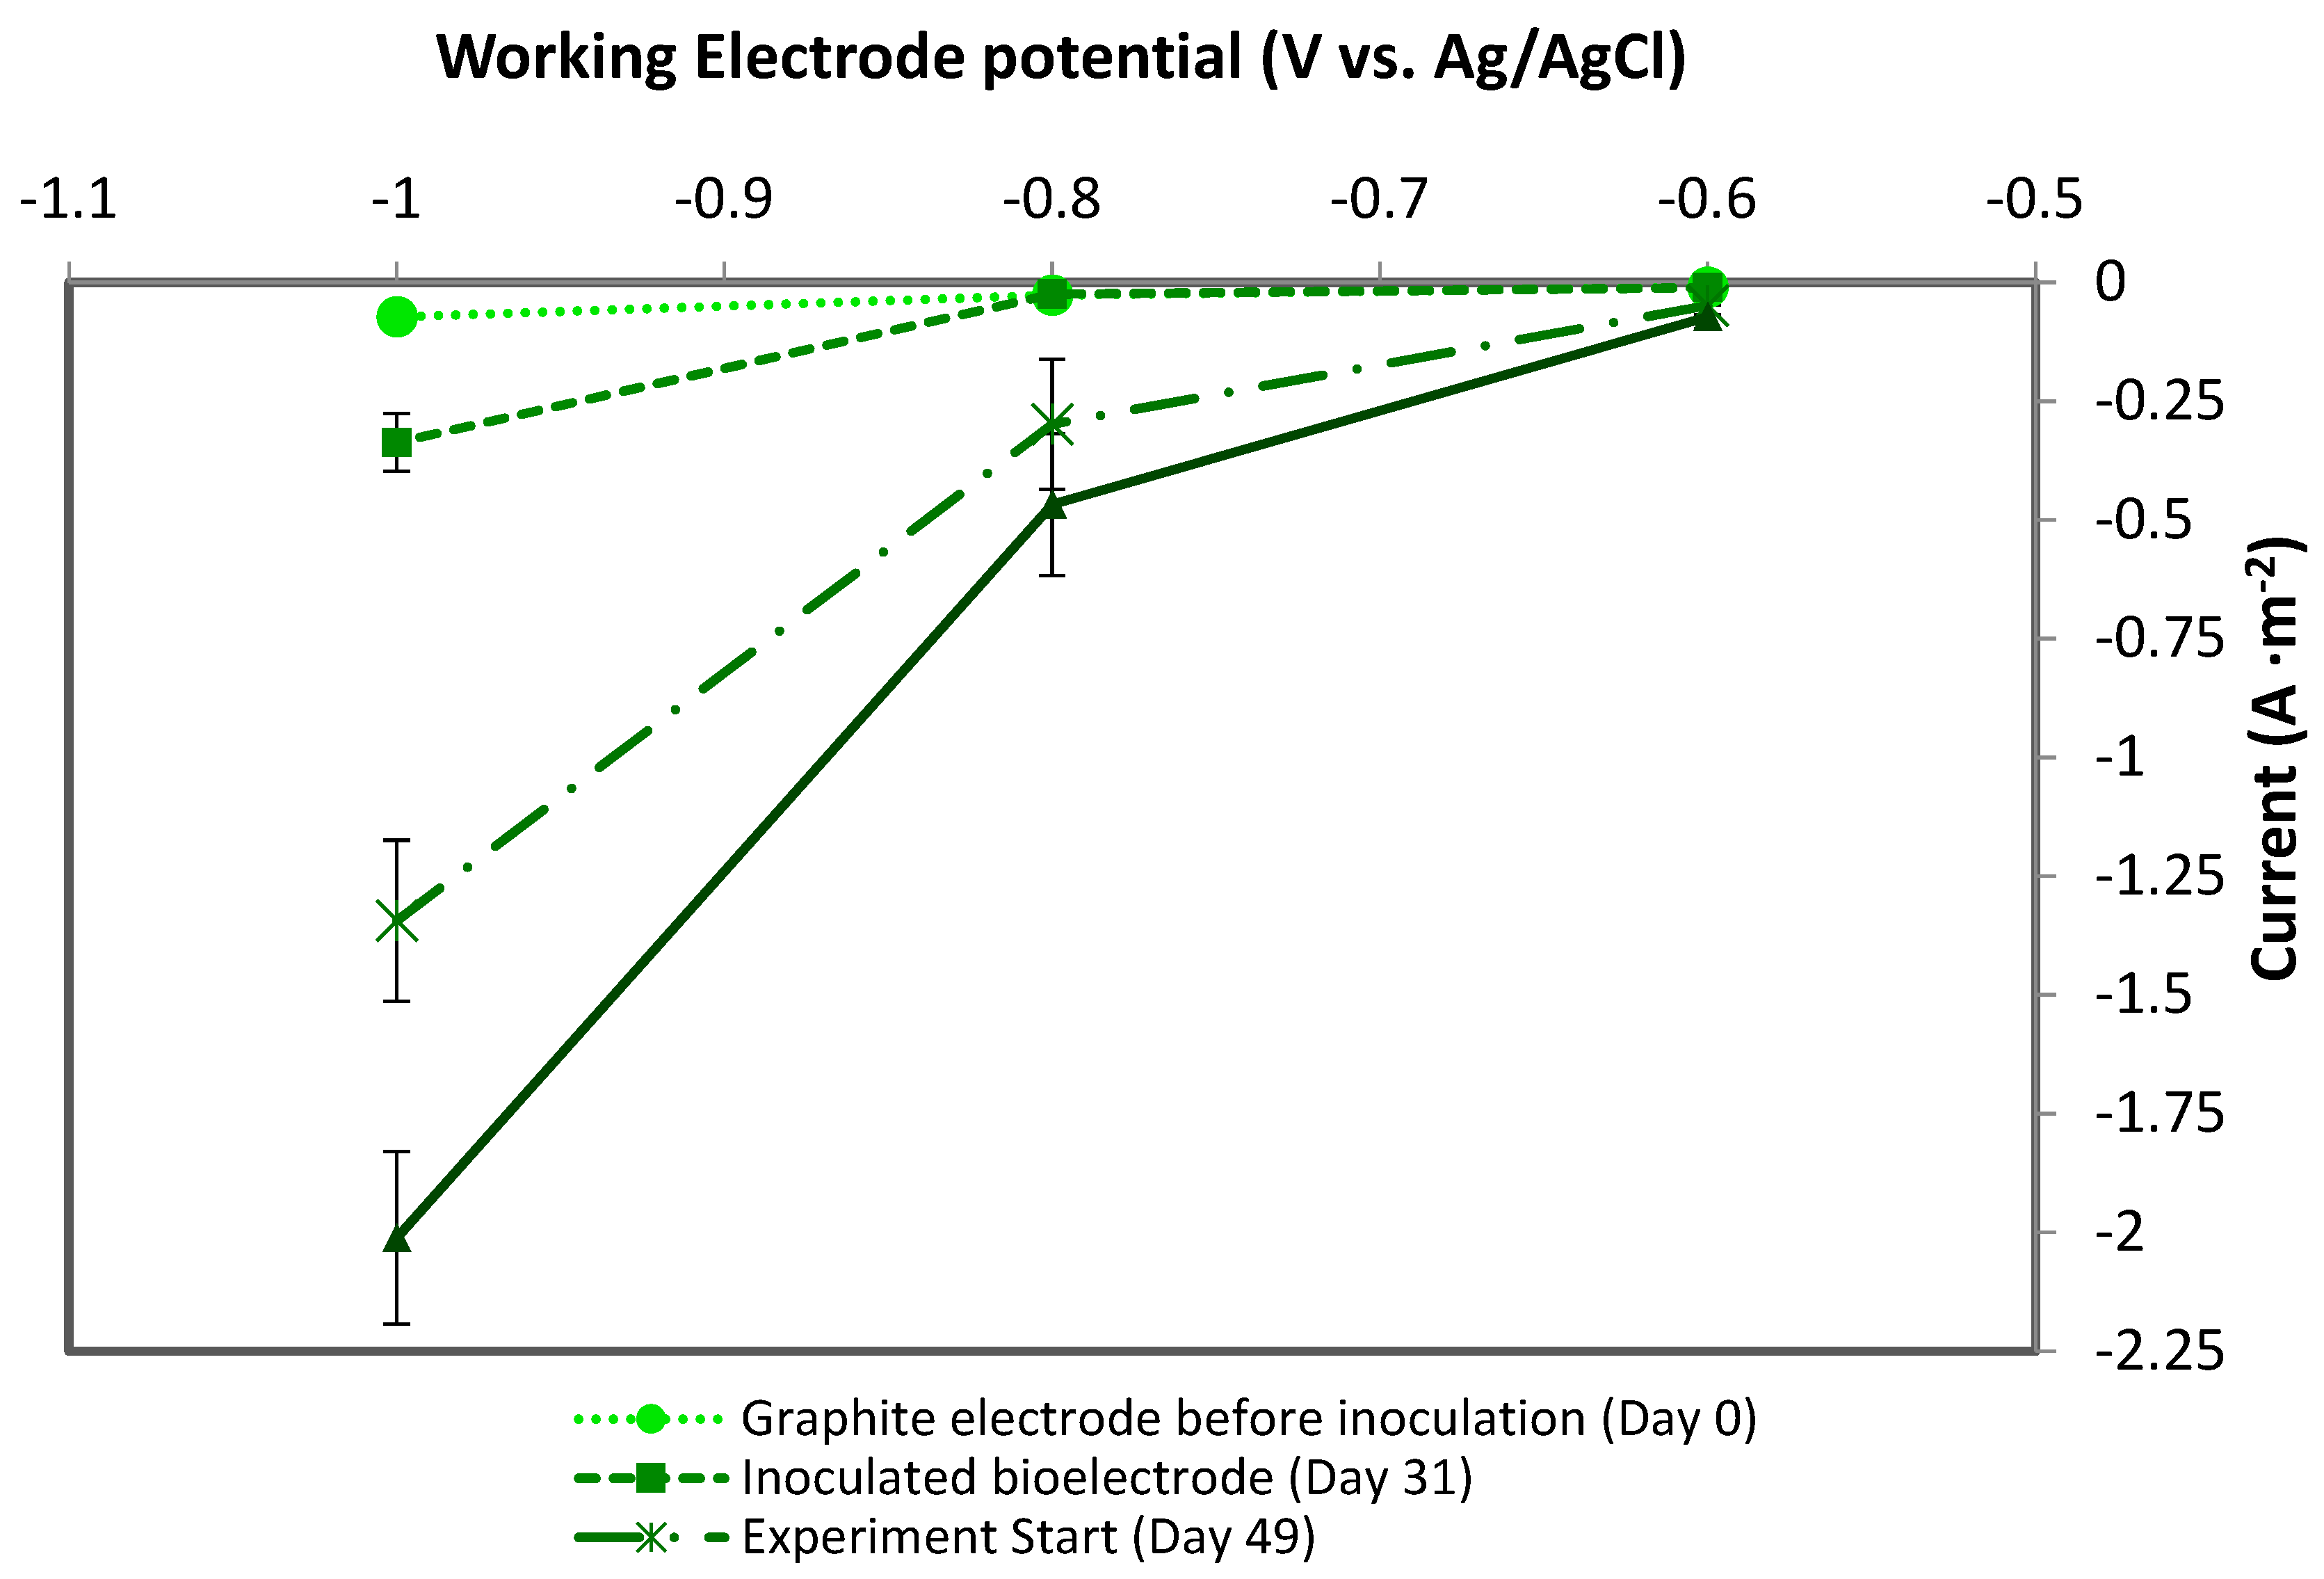
Figure 2 represents a set of polarization curves obtained at different stages during both the acclimation and experimental periods, and shows how biocatalytic activity evolves over time. The biocathodes began to display a moderate current rise at about one month after inoculation (day 31) and consistently increased with time. This trend can be easily noticed at −0.8 V vs. Ag/AgCl, becoming more apparent at −1 V vs. Ag/AgCl and being even higher at the end of the experiment (day 92) when CO2 was being bubbled into the culture medium. Although abiotic hydrogen could be theoretically produced at −1 V vs. Ag/AgCl on graphite electrodes, this can be ruled out due to the negligible currents registered with the graphite electrode before inoculation (day 0).
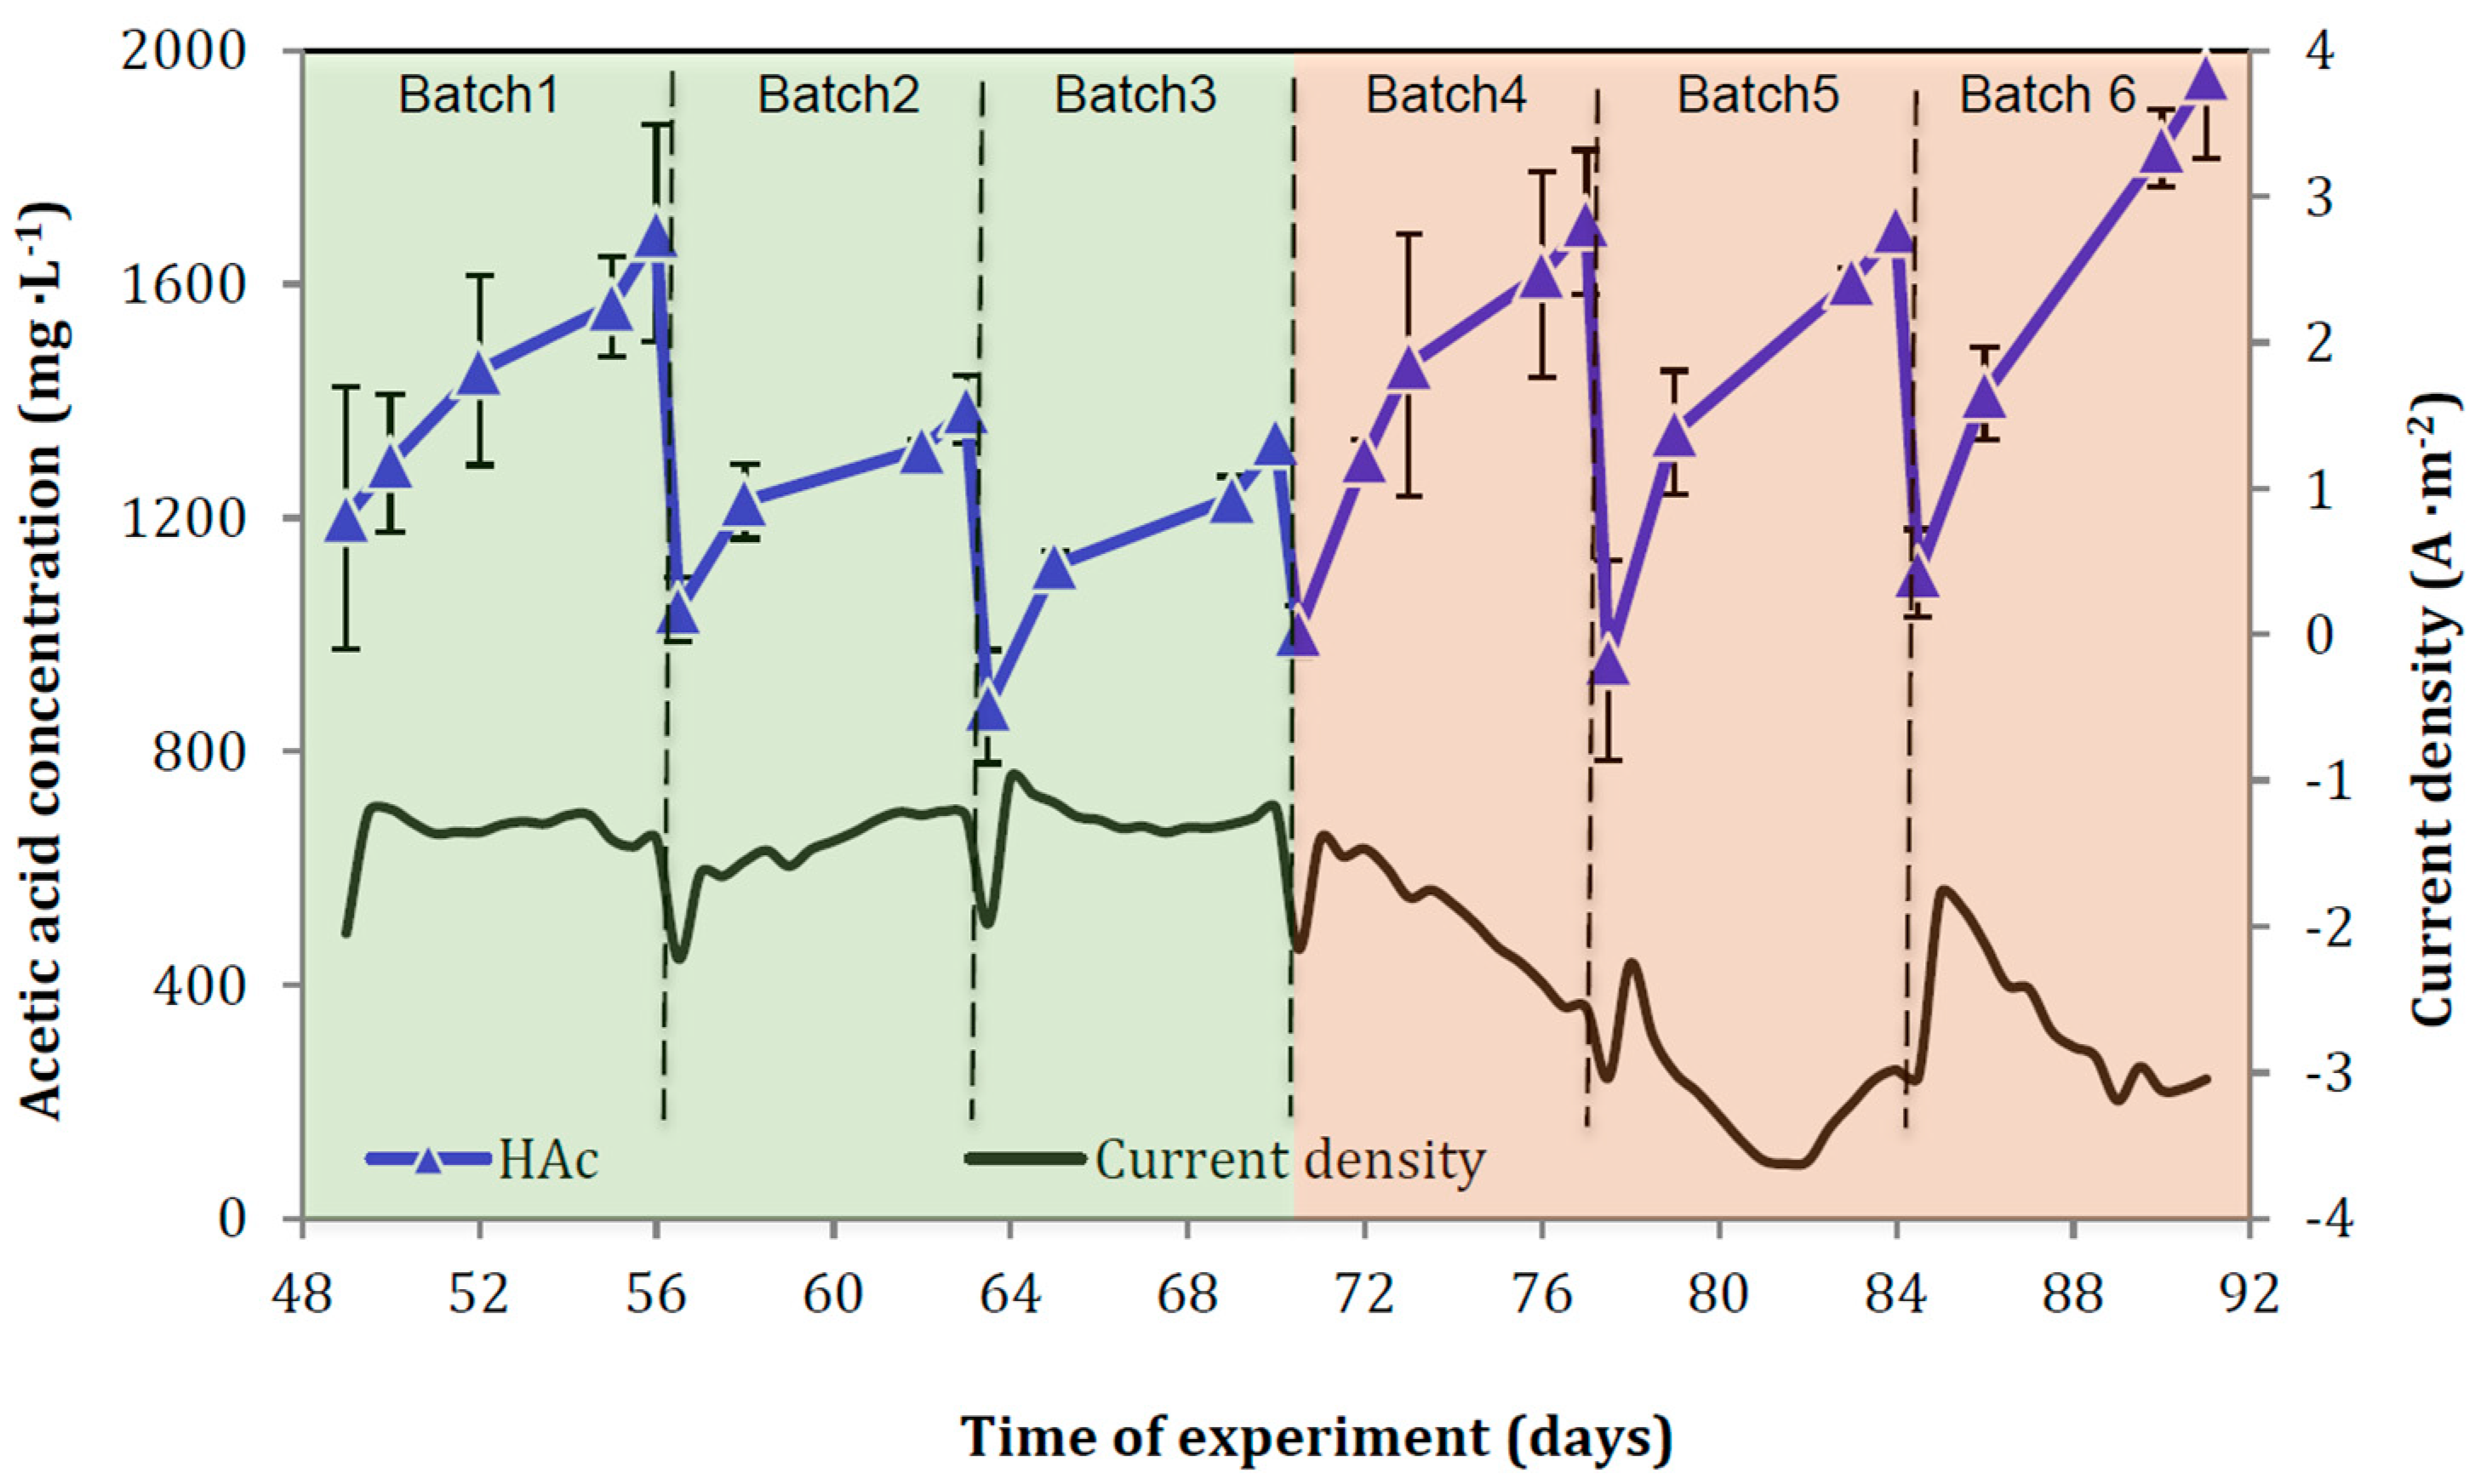
Figure 3 represents the evolution of the two reactors during the six batch cycles (experimental period) in terms of acetate and current production. Both reactors showed good replicability, developing similar performances during the entire experimental period (separate data for MES1 and MES2 are shown in Figures S1 and S2, Section S1, Supplementary Information). Furthermore, they displayed high selectivity to acetate (>95%), only yielding other VFAs or alcohols at trace concentrations below the quantification limit.
The average acetate production rate during the first period (with no recirculation) was 61 mg·L−1·d−1, reaching peak values of 161 mg·L−1·d−1 and a maximum titer of 1687 mg·L−1 (Table 1). Once the recirculation loop was implemented, the average production rate increased to 109 mg·L−1·d−1 reaching a peak value of 261 mg·L−1·d−1 and a maximum titer of 1957 mg·L−1. This corresponded to an increase of 44% in the average acetate production, 62% in the peak and 16% in the maximum titer.
Table 2 summarizes CO2 conversion, product formation, and the corresponding cathodic efficiencies for each batch cycle. CO2 conversion was found to be above 80% in all cases. Cathodic efficiencies were not as consistent as conversion values, showing a certain fluctuation in the range from 57% to 91%.
CO2-to-acetate conversion above 100% in the last batch test can be explained by possible remnants of inorganic carbon and other VFAs in the catholyte at the beginning of the batch cycles as only part of the culture medium is replaced between cycles. In addition, the efficiency of batches 2 and 5, that are appreciably lower than the rest, could be attributed to changes within the communities of the biofilm.

3.2. Microbial Communities Involved in the Process

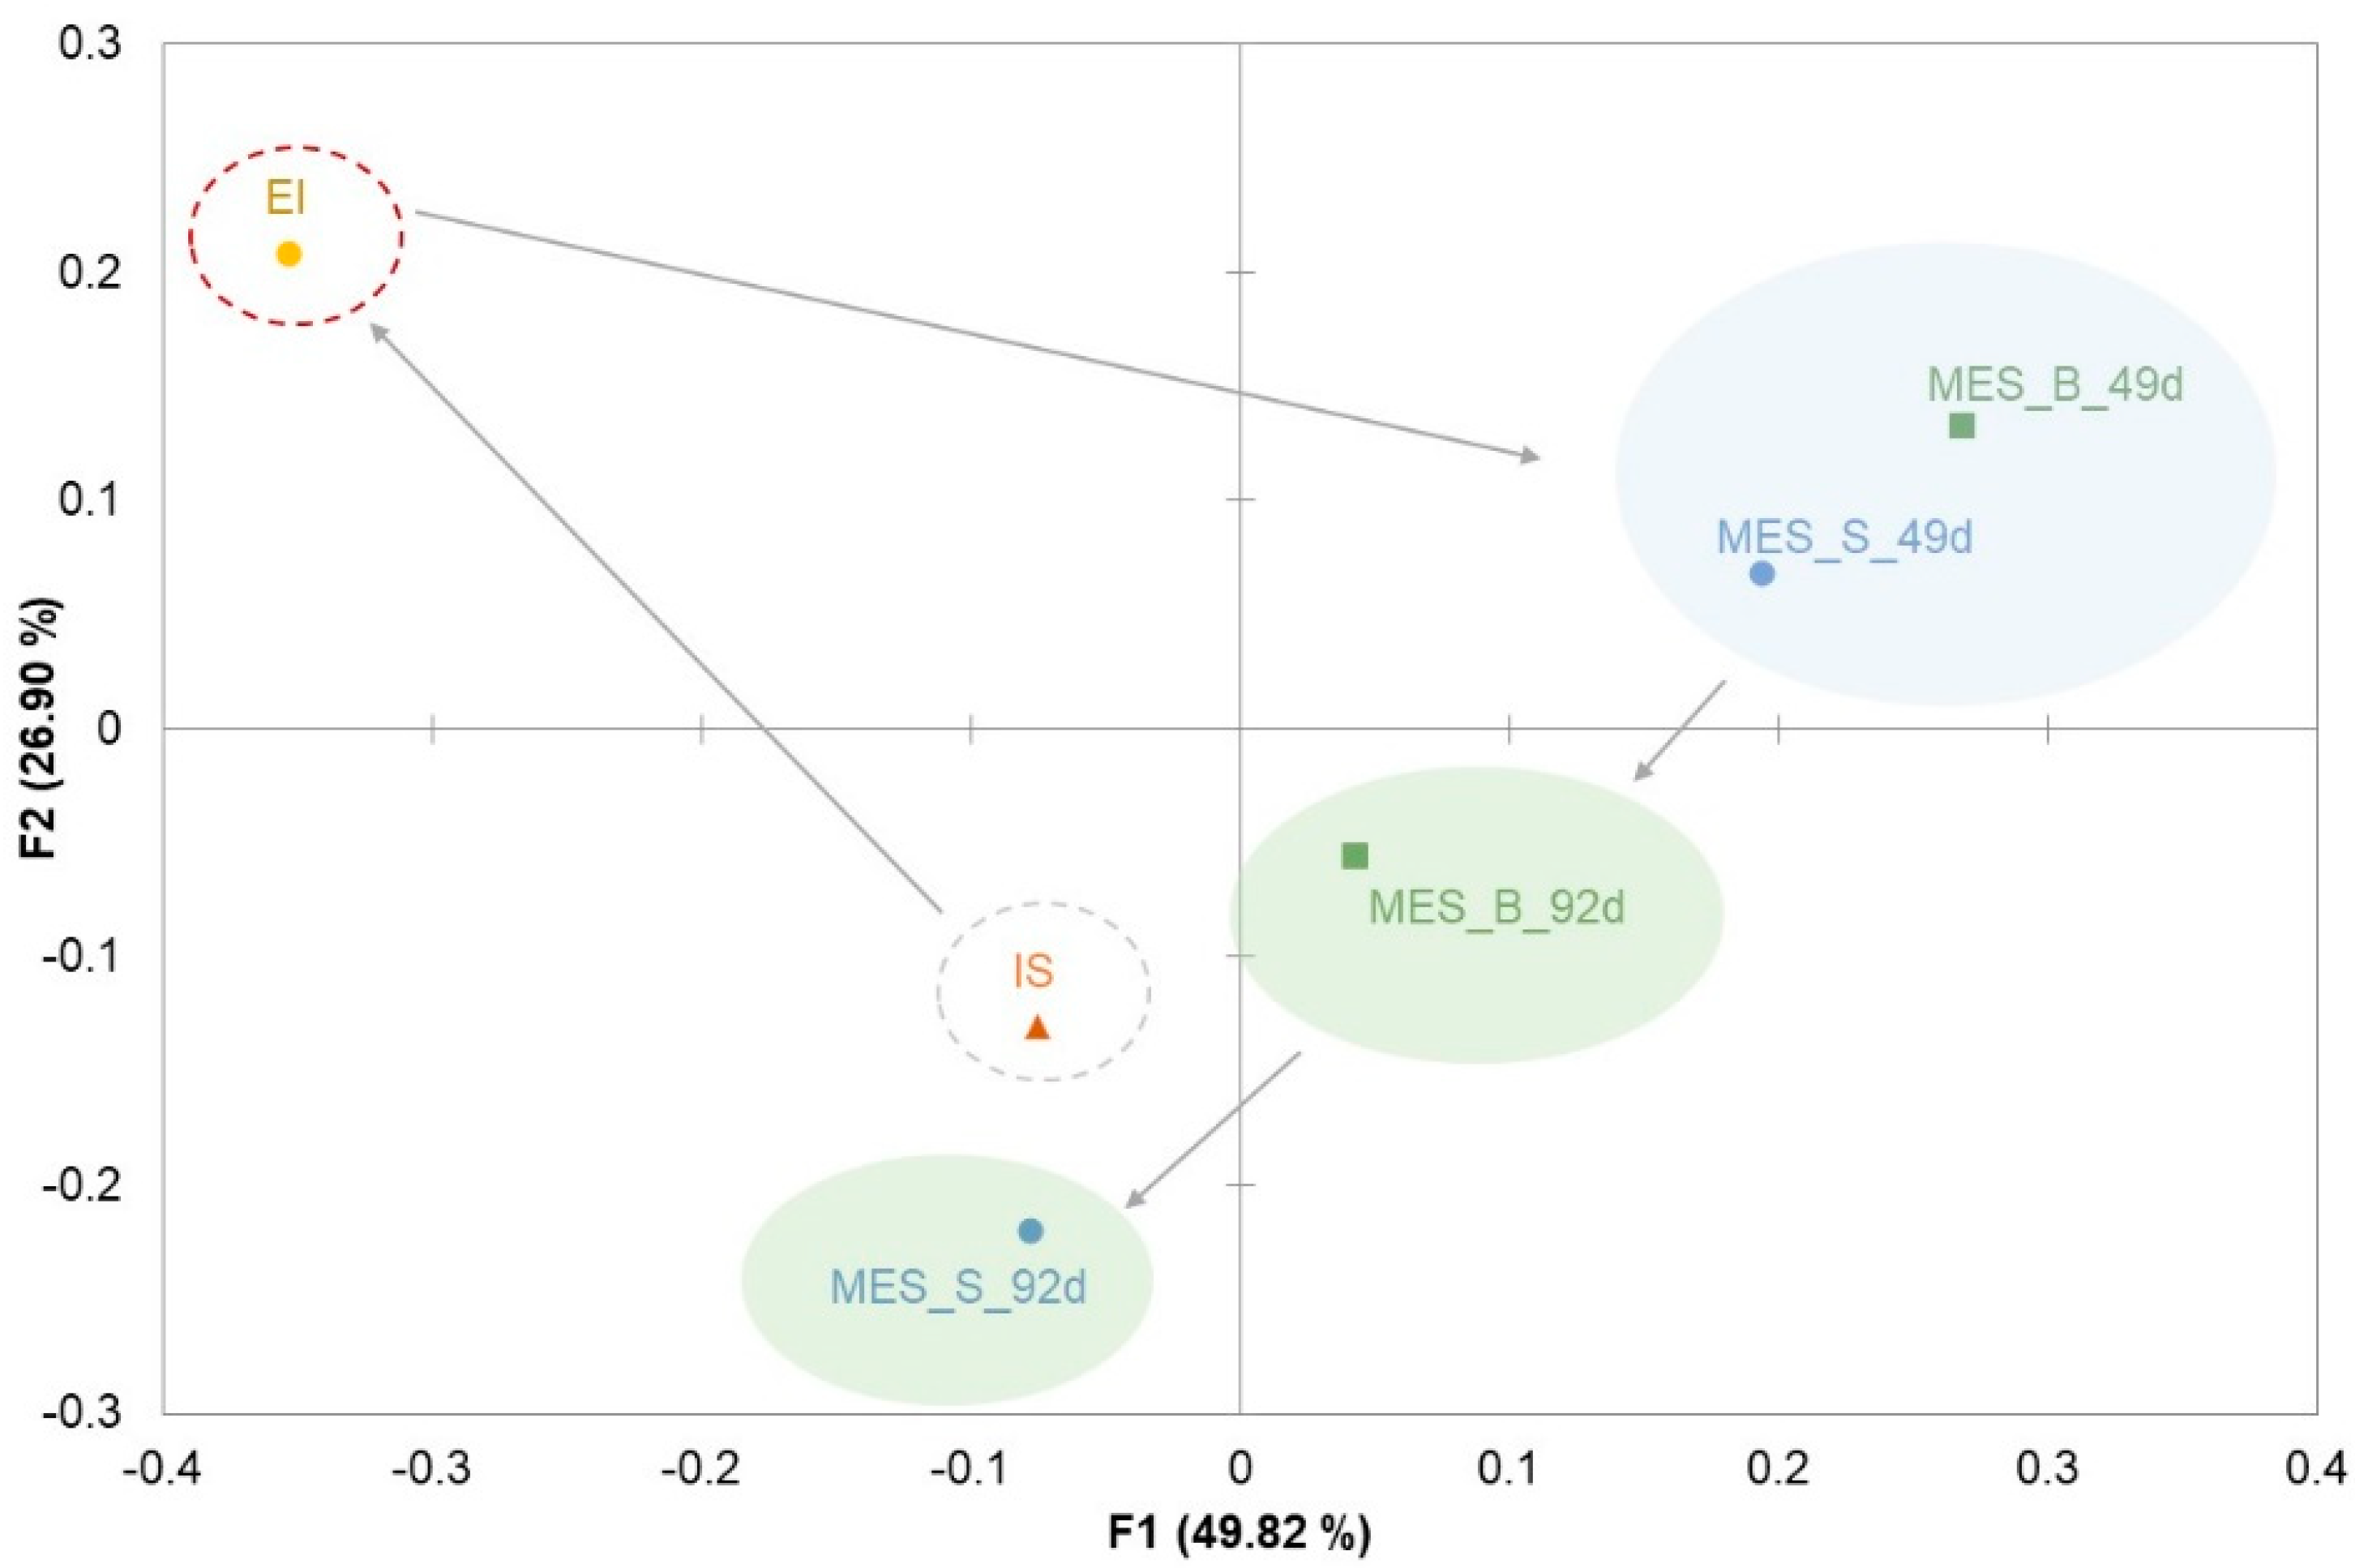
The two MES reactors (MES1 and MES2) were inoculated with an enriched inoculum (EI) derived from anaerobic sludge (IS). Samples of EI and IS, along with samples from the biofilm (B) and supernatant (S), were taken from both reactors (MES1 and MES2) at 49 and 92 days of operation. The microbial communities of the six samples were compared using principal component analysis (PCA) to get an overview of the global population dynamics throughout the experiment (Figure 4). Each point of the PCA plot represents a sample, and a closer distance between two points indicates smaller differences between the two microbial communities. A notable shift is observed after the enrichment procedure of the IS. This change should be attributed to enrichment in homoacetogenic microorganisms (as it is the objective of the enrichment), and death of others that were originally adapted to anaerobic digestion and are highly disfavored in the enrichment conditions. It is important to note that these enriched homoacetogenic microorganisms are not necessarily electroactive, so it is expected that the enriched population still shifts when introduced to a cell with a set potential as a result of changing of growth conditions. This is represented in Figure 4 by a wide distance between EI and MES samples. The results also indicate that the EI and samples from the reactor were distinctively clustered based on operational days: MES_B_49d and MES_S_49d vs. MES_B_92d and MES_S_92d. It should also be noted that there is a clear difference from the population of the biofilm compared to those of the supernatant at stage 92d (Figure 4). Overall, PCA results confirmed that there has been an evolution of the microbial composition during the experiment, meaning that the phylogenetic composition of the biofilm also changed.
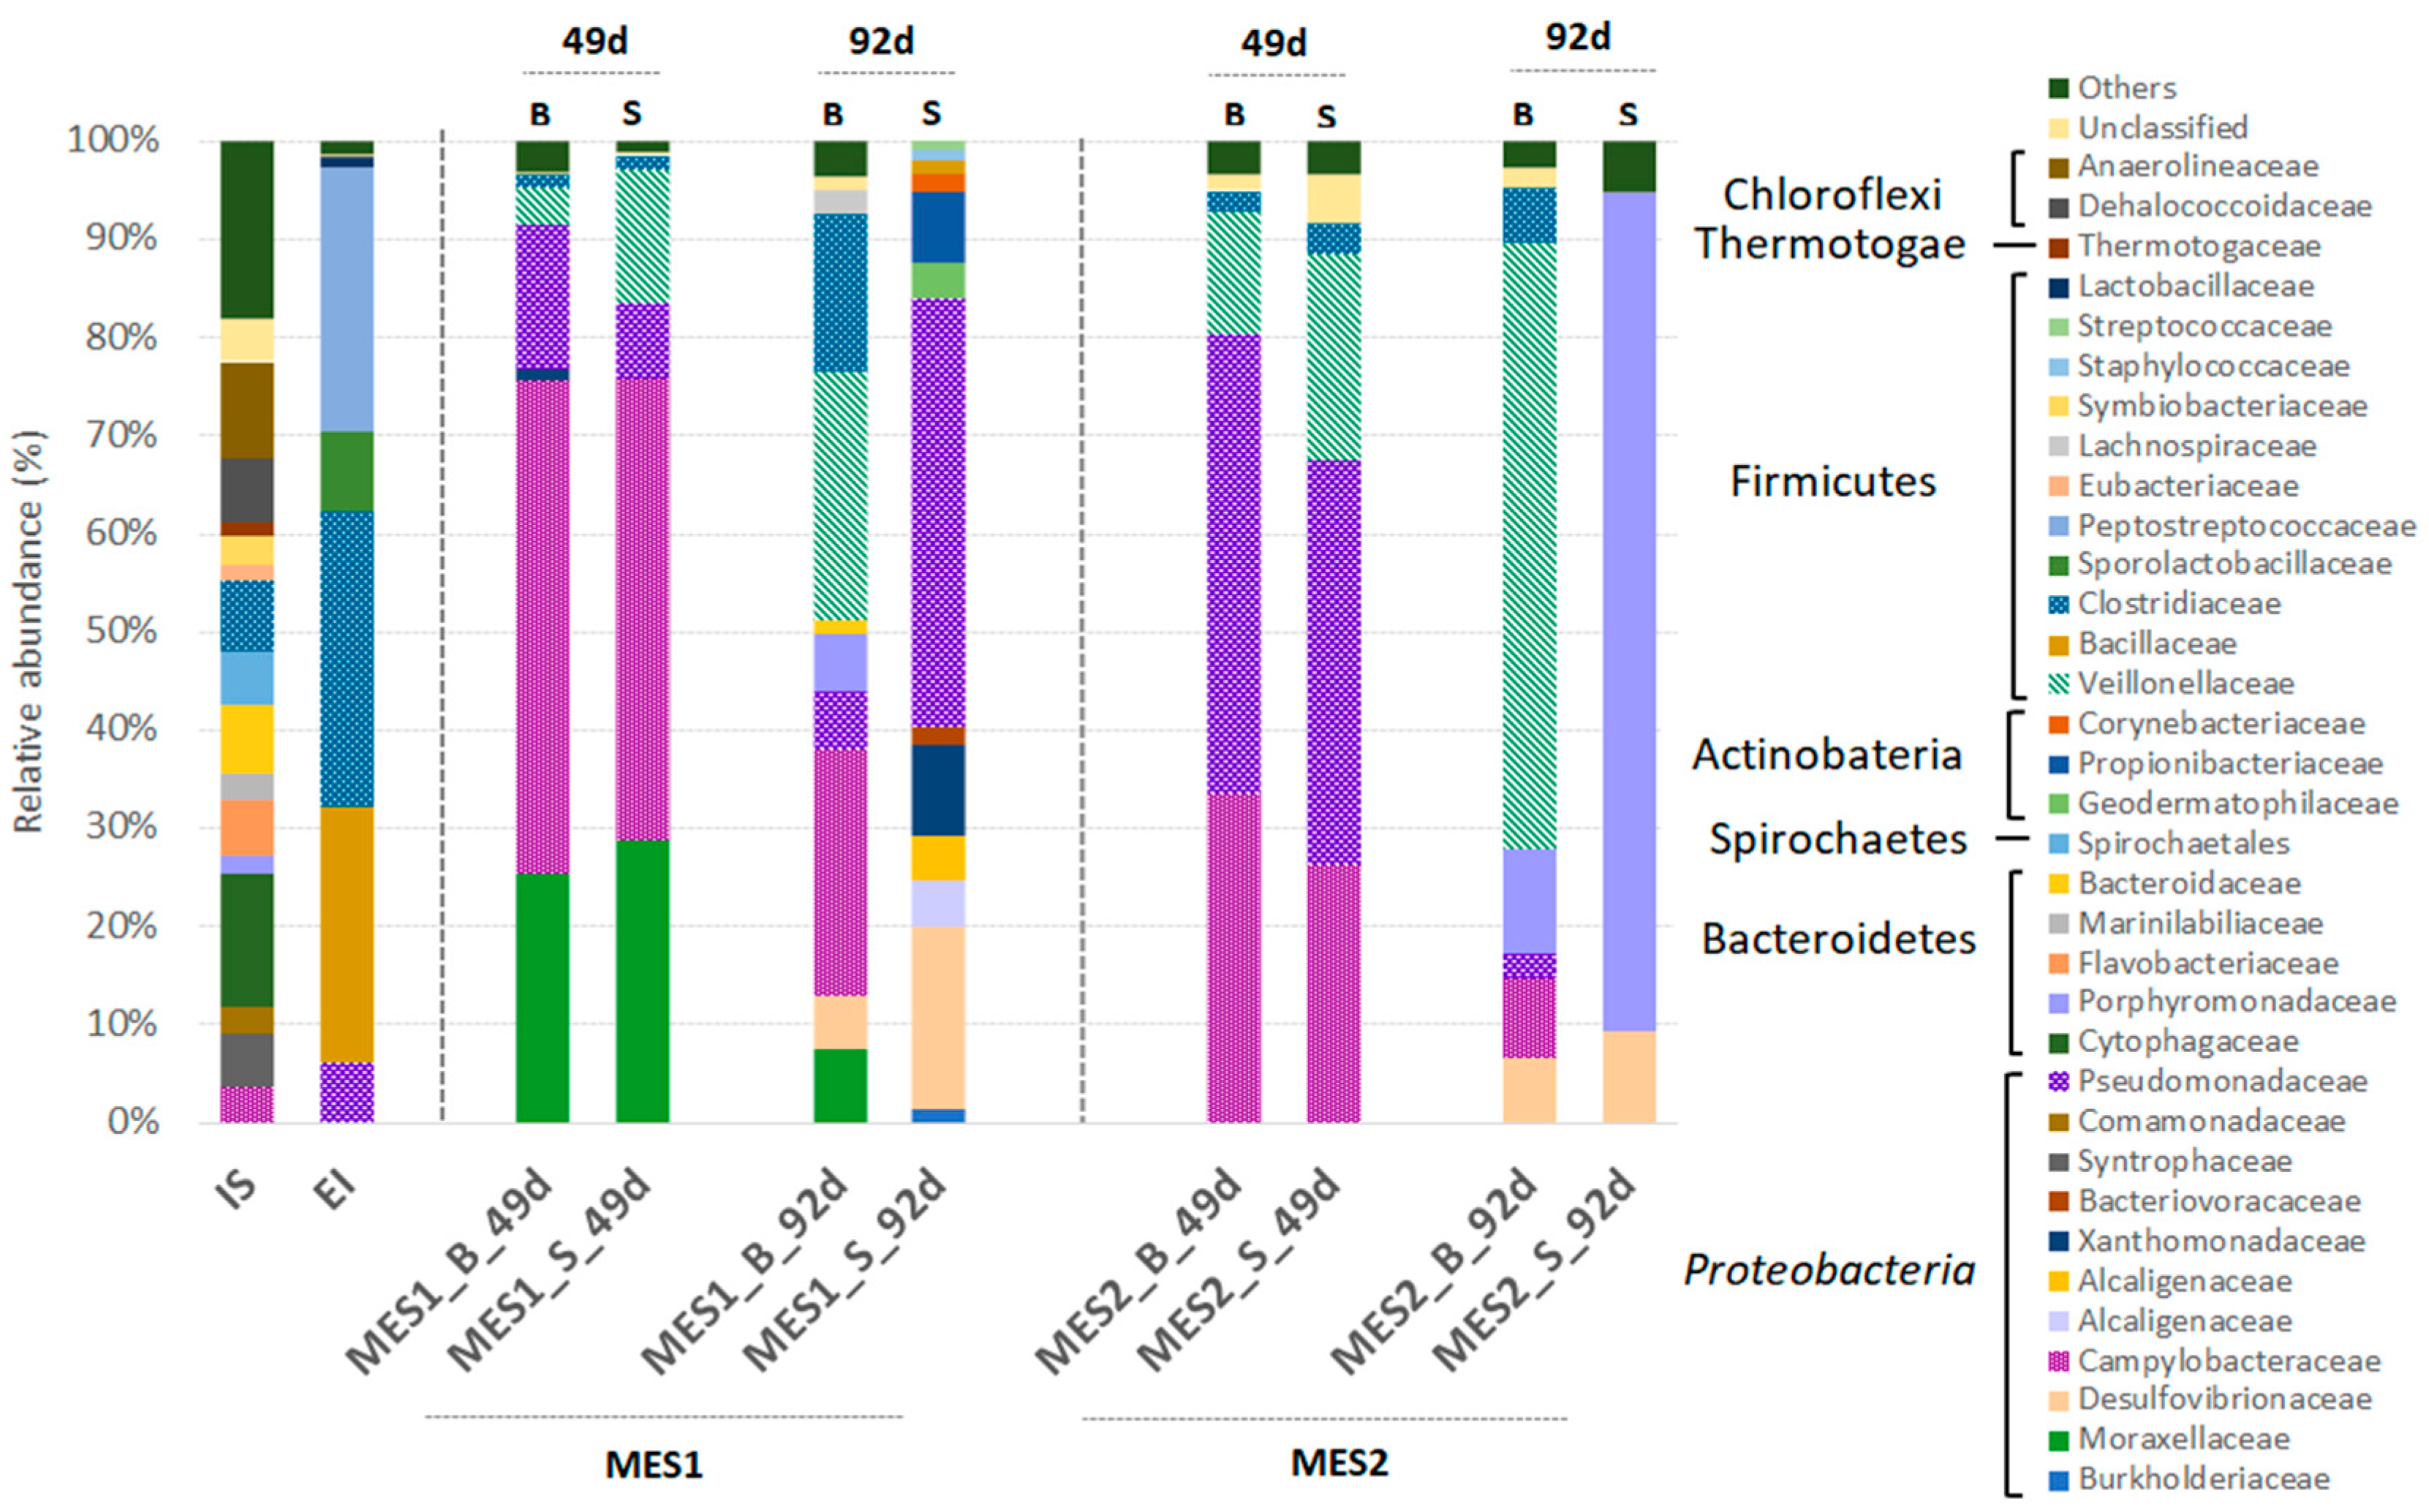
The enrichment procedure (carried out according to Bajracharya et al. [14]) proved to be satisfactory as the number of sequences identified was reduced; in total, 213 OTUs were found in the EI compared to 1690 in the IS (Table S1 and Figure S3, Supplementary Information), indicating that the richness was considerably lower. Moreover, the enrichment was evident, as 94.0% of the 69 OTUs exclusively present in the EI are composed of only 5 OTUs, identified as Bacillaceae, Clostridiaceae, Sporolactobacillaceae, and Peptostreptococcaceae belonging to Firmicutes, and Pseudomonadaceae belonging to Gammaproteobacteria (Figure 5). The main homoacetogenic family is Clostridiaceae, although Peptostreptococcaceae contains genera (such as Peptostreptococcus) which have also been described as homoacetogenic bacteria.
After inoculation and 49d under acclimation conditions, which correspond to the conditions of the first 3 experimental batches (without recirculation, Table 1), the biofilms of both MES reactors were mainly composed of five families (Figure 5), each represented by a main genus, Campylobacteraceae (Sulfurospirillum), Pseudomonadaceae (Pseudomonas), and Moraxellaceae (Acinetobacter) belonging to Proteobacteria phyla, and Veillonellaceae (Sporomusa) and Clostridiaceae (Clostridium) belonging to Firmicutes.
However, both biofilms were phylogenetically different after 92d of operation, which corresponds to the last three experimental batches (with recirculation, Table 1; see also Figure 4). Although it is true that the main groups found at 49d are still identified at 92d, other microorganisms that are usually found in MES systems, such as Porphyromonadaceae and Desulfovibrionaceae, were also identified. The two main families that were enriched from the first period (49d) to the last one (92d) were Veillonellaceae, exclusively composed of Sporomusa, and Clostridiaceae, mostly composed of Clostridium. These two families, which have been identified as acetogenic bacteria with bioelectrochemical activity [6], accounted for 41.5% and 67.5% of the total community attached to the biofilm and played an important role in acetate production.
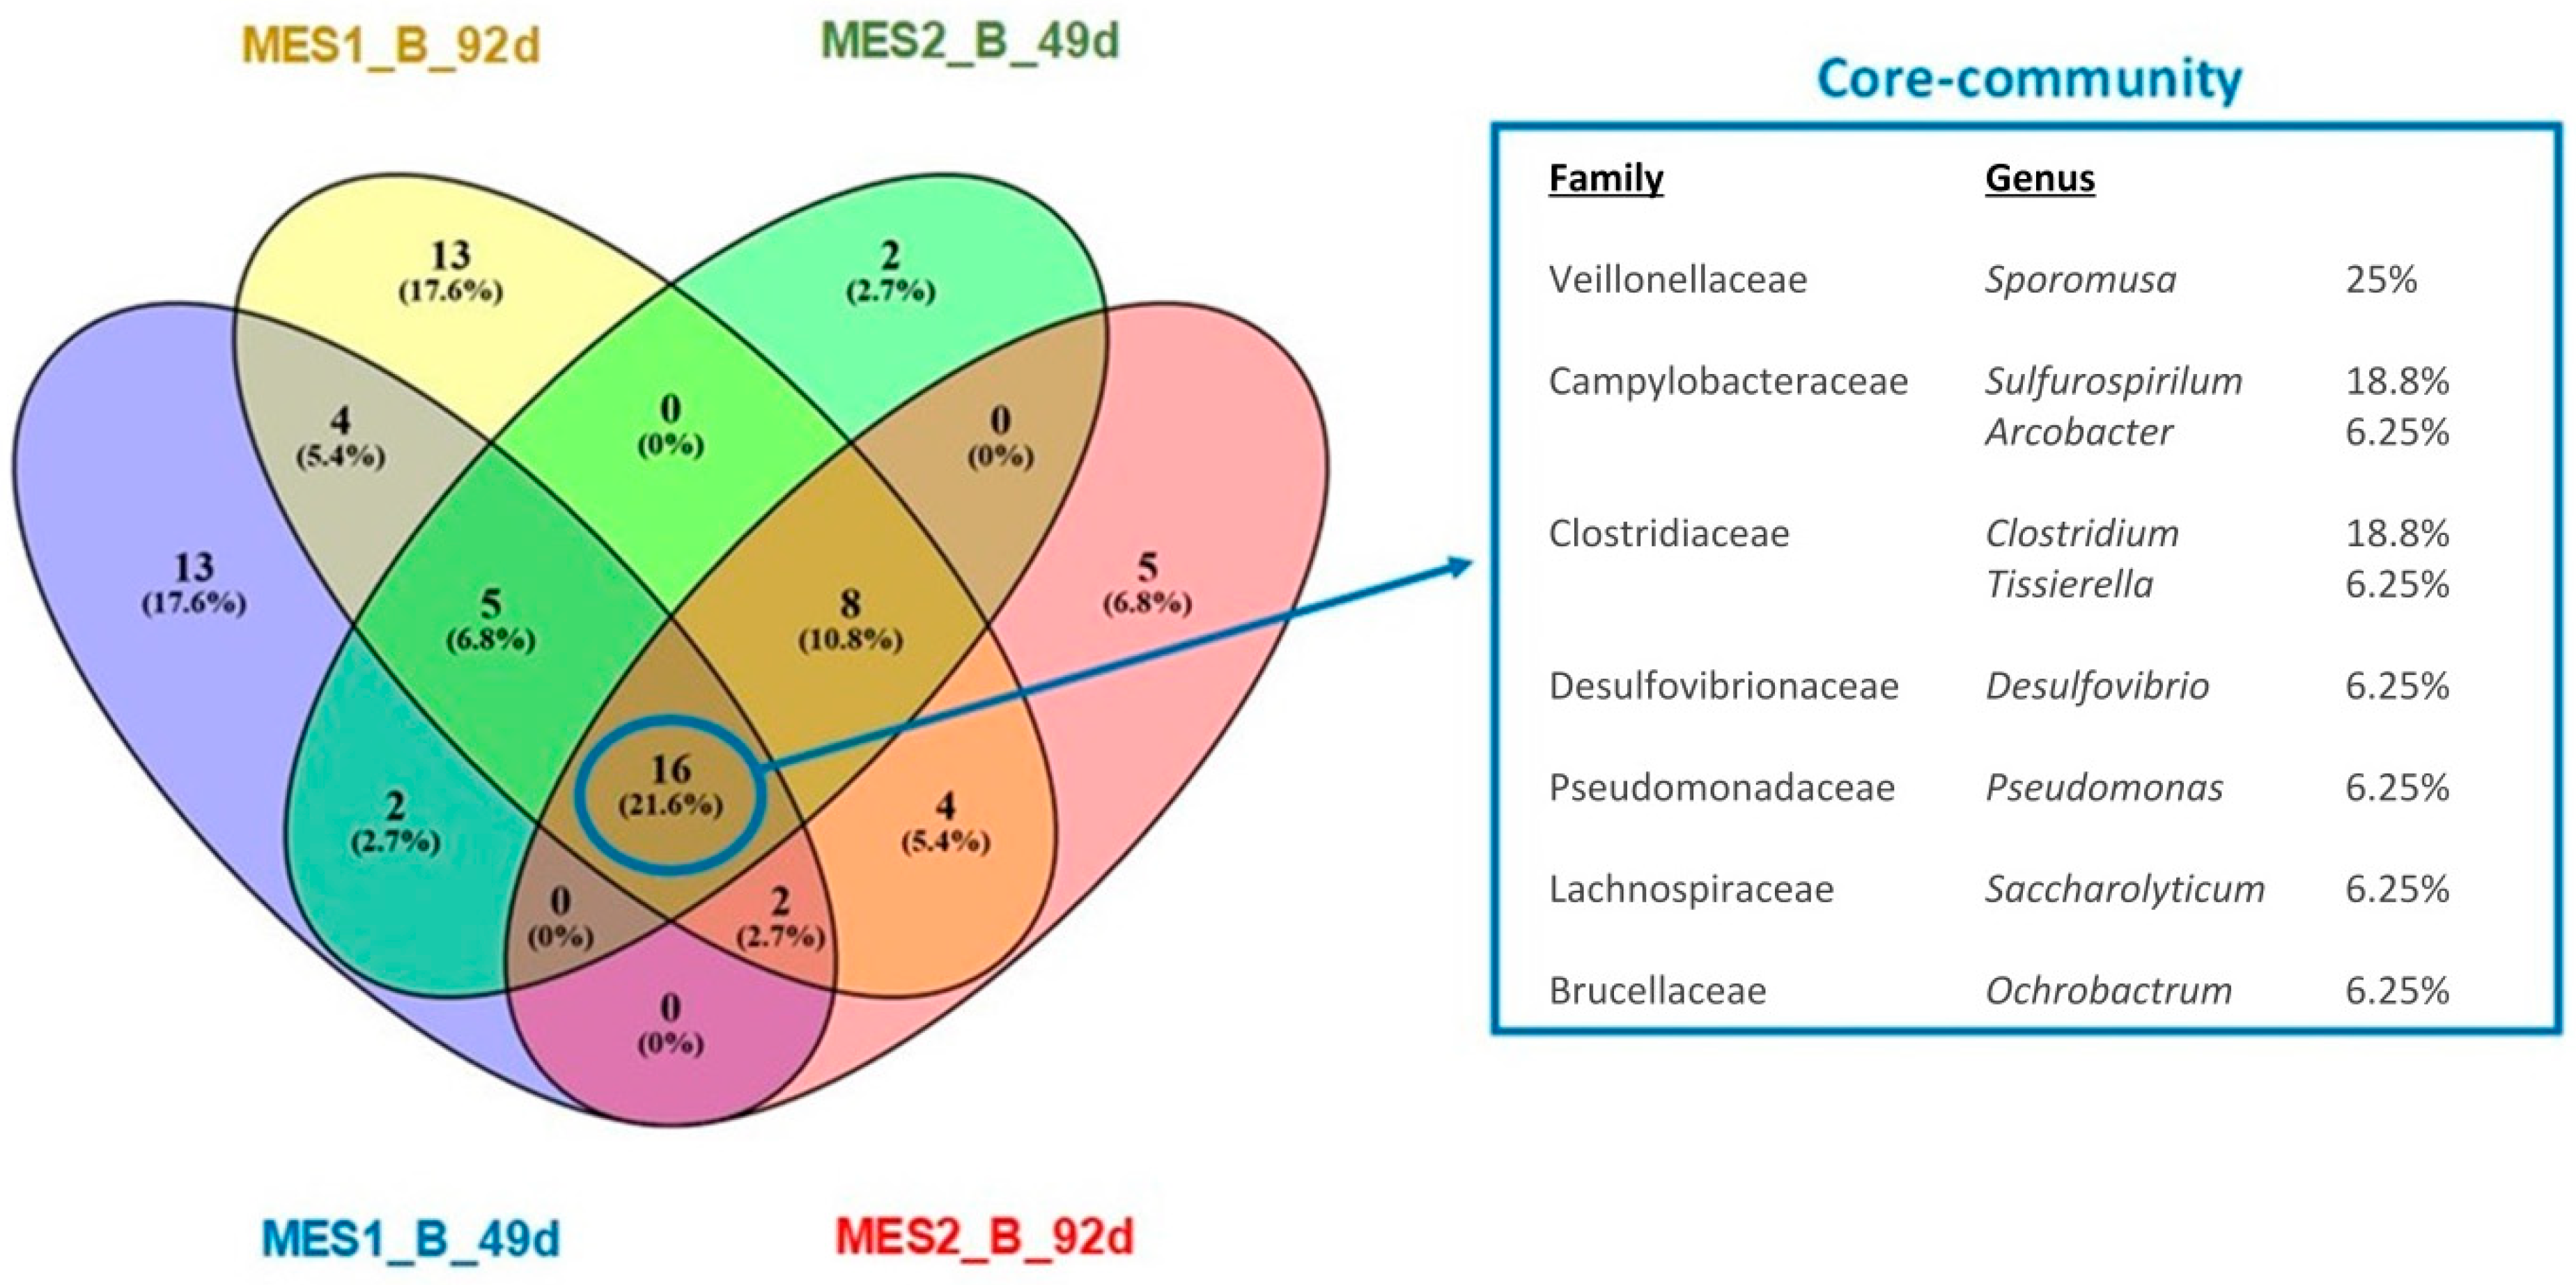
A Venn diagram was built for both initial and final biofilm samples, and for both MES1 and MES2 (Figure 6) in order to identify the core microbiome attached onto the biofilm. Providing that the source of microorganisms is the same for all of the represented samples, some microorganisms that are really not favored in our experimental conditions might be present at trace proportions. For a screening of those irrelevant microorganisms at very low proportions, only OTUs with a contribution of over 0.1% to the relative abundance are present in the Venn diagram.
The results showed that 16 common OTUs (21.6% of the total OTUs) were shared by all biofilm samples over time. The taxonomic identities of these shared OTUs are represented in Figure 6. This analysis shows that 6 genera composed the core community, represented mainly by Sporomusa, Sulfurospirillum, and Clostridium, followed by important microorganisms in MES systems like Desulfovibrio, Arcobacter, Pseudomonas, and Ochrobactrum, among others (Figure 6). This core community is usually present in acetogenic MES systems, which are most likely responsible for the conversion of CO2 into acetate.
At 49d, the supernatant community is composed of the same families that are present in the biofilms. Nevertheless, this does not happen at the end of the experiment (92d) when the biofilm and supernatant populations differ considerably. The number of sequences identified in this period was increased between 4- and 7-fold in the biofilm compared to the supernatant, which indicates that the population attached onto the biofilm over time has a more important role in MES performance. The Venn diagram for the supernatant samples (see Figure S4, Section S2, Supplementary information) shows that only 2 OTUs are common in the microbial communities present at the beginning and end of the experiment. Interestingly, these two OTUs, which only account for 2.1%, correspond to Pseudomonas and Desulfovibrio, both also belonging to the core microbiome found in the biofilm, suggesting their importance in MES systems.

4. Discussion

The inoculum enrichment succeeded in generating a productive biofilm (in terms of steady product generation and current consumption), on the surface of the bioelectrodes, promoting the proliferation of certain families such as Clostridiaceae and Pseudomonadaceae. These families and others groups have an important role in acetic acid production [25], favoring the subsequent development of an acetogenic microbiome. Both replicate cells developed a similar electrical behavior during the start-up and acclimation period, as revealed by the low deviation between them in terms of the current consumption and product generation (Figure 3). This trend continued during the first three batch cycles (days 49 to 70); in addition, both MES showed little evolution between cycles. This behavior can be expected from a well-established biofilm enriched in important families that can undergo the proposed process: early colonizers in both biofilm and supernatant were dominated by Arcobacter, Acinetobacter, Pseudomonas, and Sulfurospirillum [26] with a high relative abundance, which are responsible for the current consumption from the first three batches. Despite the acetate production rates during these 3 batches being below those reported by other researchers in MES reactors operating under similar conditions, cathodic efficiencies were similar or even higher [13,14,27,28]. Here, it is important to highlight that in the referred studies, the availability of CO2 to acetogenic bacteria was improved by sparging an excess amount of CO2 through the culture medium, or adding an excess amount of bicarbonate as feed—methods that might lead to an inefficient use of CO2. For instance, in the sparging method, most of the CO2 is lost to the atmosphere, while pH must be continuously adjusted if bicarbonate is used as the substrate, and this is not applicable for real exhaust gas streams.
Our approach for solving this CO2 availability issue without wasting an important part of our substrate and therefore fixing the maximum or all of CO2 that is put in place, is to continuously recirculate through the culture medium the gas present in the headspace. This approach, used in the last 3 cycles (days 70–92), proved to be successful, leading to a 44% improvement in current consumption and product formation (Table 1 and Table 2). In addition, gas recirculation provides an indirect stirring method than can help to reduce (and even substitute) the need for any other external stirring. This would improve the overall energy balance as other authors have already suggested [29,30]. Still, the productivity of our system was below that found in similar reactors, probably because our reactors were operated under suboptimal conditions [13,14,27,28].
The recirculation of the gas from the headspace also seemed to have an effect on the cathodic microbial communities. At the end of the experiment (day 92), and after three batch cycles with recirculation, Sporomusa was identified as the most important family; some of these OTU sequences present 99% homology with Sporomusa sphaeroides, a homoacetogen which has been shown to be able to produce acetic acid, reducing inorganic carbon as its sole carbon source [9]. Although it is true that these OTUs were also present prior to recirculation (day 49), the relative abundance across biofilm showed that this genus increased from 4% to 12% without recirculation and up to 25%–59% with recirculation, which could explain the improvement in acetate production. Other OTUs that include members of Clostridium and Desulfovibrio were also enriched after implementing the recirculation. Both genera, described as electroactive species [9,31], might be responsible for the improved current density. Furthermore, the presence of Desulfovibrio, which is able to produce hydrogen on biocathodes [32], might enhance the availability of hydrogen to homoacetogens, like Clostridium and Sporomusa, thus helping to explain the improved performance. While both of the mentioned acetogens, Clostridium and Sporomusa, were enriched on the surface of electrodes, Desulfovibrio was identified at day 92 in the biofilm as well as in the supernatant at a slightly higher abundance. This result was in agreement with another study [33], where Desulfovibrio was present in a high relative abundance as a planktonic member, although the same authors also identified this genus on their enriched electrodes in previous work [34]. Desulfovibrio has been mainly described as a biological hydrogen producer [32], and its presence along with Pseudomonas, both belonging to the Proteobacteria phylum, has been described in other MES systems [35]. Regarding Pseudomonas, there is physiological evidence that it can develop hydrogenase activity [36] and produce shuttles in BES, thus potentially playing an important role in the extracellular electron transfer [23,37]. Importantly, the presence of free hydrogenases, that can be released from cells and sorb to cathodic surfaces (where they can catalyze the hydrogen evolution reaction) represents another plausible route for hydrogen production that cannot be ruled out [38]. Despite that, hydrogen was not observed in the gas phase and, therefore, if hydrogen is acting as reaction intermediate, it is immediately consumed without reaching the headspace of the reactor. The correlation of genera from OTUs showing both acetogenic and bioelectrochemical activity, with an improvement in acetate production (44% improvement), serves to corroborate the importance of this mixture of populations which reached 34%–67% of the total community attached to the biofilm.
Despite changes in the microbial community across the experiment due to the different conditions applied, a core microbiome can be found, represented by a few dominant members such as Sporomusa, Sulfurospirillum, Arcobacter, Clostridium, Tissierella, Desulfovibrio, Pseudomonas, Sacharolyticum, and Ochrobactrum. These core communities are consistently associated with a microbial electrosynthesis biofilm that is well developed and commonly found in MES systems [19]. Regarding the supernatant population, it has been highlighted that the two common OTUs across the experiment belonged to Pseudomonas and Desulfovibrio, which were also identified within the biofilm core microbiome. This fact revealed the importance of these microorganisms in the acetogenic performance of the whole MES system.
In summary, it can be stated that our recirculation system has improved system kinetics and therefore performance in comparison with the previous non-recirculated system. Although it did not reach the maximum production rates reported by other authors [14,27], this system is capable of consistently fixing around 100% of the CO2 fed in an efficient way, showing cathodic efficiencies of 57%–91%.

5. Conclusions

The inoculum enrichment procedure proved to be effective in developing a homoacetogenic community that is capable of producing a stable, replicable, and selective biofilm. This biofilm was mainly composed of a core microbiome whose predominant genera, Sporomusa, Sulfurospirillum, Arcobacter, Desulfovibrio, Pseudomonas, and Clostridium, are usually found in acetogenic biocathodes. The correlation of these phylotypes with acetate production and MES performance suggests the important role that this mixed community played across the experiment (e.g., a higher relative abundance of Sporomusa was found in correlation with higher acetate production). By continuously recirculating the gas headspace, it was possible to increase acetate production by 44%, increasing the acetate production rate up to 261 mg HAc·L−1·d−1 (maximum titer: 1957 mg·L−1). Cathodic efficiencies of over 50% were found during the whole experiment, and increased to 91% with gas headspace recirculation. In addition, up to 100% of the CO2 fed was consumed, which represents up to 171 mL CO2·L−1·d−1.

Supplementary Materials

The following are available online at https://www.mdpi.com/1996-1073/12/17/3297/s1, Figure S1: Current consumption for reactors MES1, MES2, and their average, Figure S2: Acetic acid production for reactors MES1, MES2, and their average, Figure S3: Overlap bacterial communities from the initial sludge (IS) and for the enrichment inoculum (EI) based on the taxonomic identities of the shared OTUs, Figure S4: Overlap of the four biofilms communities and the taxonomic identities of the shared OTUs. Table S1: Number of sequences and total observed OTUs for IS and EI samples.

Author Contributions

The concept of the work was developed by R.M. with contribution from R.M.A. and A.S., R.M. performed the experiments. Data analysis and interpretation was performed by R.M., R.M.A. and A.S. with help from A.E. and A.M., R.M.A. and R.M. wrote the article and the critical revision of the paper was made by A.S., A.E. and A.M.

Funding

This research was funded by the ‘Ministerio de Economía y Competitividad’ project ref: CTQ2015-68925-R (MINECO/FEDER, EU) and ‘Junta de Castilla y Leon’ (ref: LE320P18) projects co-financed by FEDER funds.

Acknowledgments

This research was possible thanks to the financial support of the ‘Ministerio de Economía y Competitividad’ project ref: CTQ2015-68925-R (MINECO/FEDER, EU) and ‘Junta de Castilla y Leon’ (ref: LE320P18) projects co-financed by FEDER funds. Raúl Mateos thanks the Spanish ‘Ministerio de Educación, Cultura y Deporte’ for the FPU Grant (FPU14/01573). Raúl M. Alonso thanks University of León for his predoctoral grant.

Conflicts of Interest

The authors declare no conflict of interest.

References

  1. Pearson, R.J.; Eisaman, M.D.; Turner, J.W.G.; Edwards, P.P.; Jiang, Z.; Kuznetsov, V.L.; Littau, K.A.; Di Marco, L.; Taylor, S.R.G. Energy Storage via Carbon-Neutral Fuels Made from CO₂, Water, and Renewable Energy. Proc. IEEE 2012, 100, 440–460. [Google Scholar] [CrossRef]
  2. Manan, Z.A.; Mohd Nawi, W.N.R.; Wan Alwi, S.R.; Klemeš, J.J. Advances in Process Integration research for CO₂ emission reduction—A review. J. Clean. Prod. 2017, 167, 1–13. [Google Scholar] [CrossRef]
  3. Otto, A.; Grube, T.; Schiebahn, S.; Stolten, D. Closing the loop: Captured CO₂ as a feedstock in the chemical industry. Energy Environ. Sci. 2015, 8, 3283–3297. [Google Scholar] [CrossRef]
  4. Zdeb, J.; Howaniec, N.; Smoliński, A.; Zdeb, J.; Howaniec, N.; Smoliński, A. Utilization of Carbon Dioxide in Coal Gasification—An Experimental Study. Energies 2019, 12, 140. [Google Scholar] [CrossRef]
  5. Thakur, I.S.; Kumar, M.; Varjani, S.J.; Wu, Y.; Gnansounou, E.; Ravindran, S. Sequestration and utilization of carbon dioxide by chemical and biological methods for biofuels and biomaterials by chemoautotrophs: Opportunities and challenges. Bioresour. Technol. 2018, 256, 478–490. [Google Scholar] [CrossRef] [PubMed]
  6. Tremblay, P.L.; Zhang, T. Electrifying microbes for the production of chemicals. Front. Microbiol. 2015, 6, 201. [Google Scholar] [CrossRef] [PubMed]
  7. Rabaey, K.; Rozendal, R.A. Microbial electrosynthesis—Revisiting the electrical route for microbial production. Nat. Rev. Microbiol. 2010, 8, 706–716. [Google Scholar] [CrossRef] [PubMed]
  8. Bajracharya, S.; Srikanth, S.; Mohanakrishna, G.; Zacharia, R.; Strik, D.P.; Pant, D. Biotransformation of carbon dioxide in bioelectrochemical systems: State of the art and future prospects. J. Power Sources 2017, 356, 256–273. [Google Scholar] [CrossRef]
  9. Nevin, K.P.; Hensley, S.A.; Franks, A.E.; Summers, Z.M.; Ou, J.; Woodard, T.L.; Snoeyenbos-West, O.L.; Lovley, D.R. Electrosynthesis of organic compounds from carbon dioxide is catalyzed by a diversity of acetogenic microorganisms. Appl. Environ. Microbiol. 2011, 77, 2882–2886. [Google Scholar] [CrossRef]
  10. Jafary, T.; Daud, W.R.W.; Ghasemi, M.; Kim, B.H.; Md Jahim, J.; Ismail, M.; Lim, S.S. Biocathode in microbial electrolysis cell; present status and future prospects. Renew. Sustain. Energy Rev. 2015, 47, 23–33. [Google Scholar] [CrossRef]
  11. May, H.D.; Evans, P.J.; LaBelle, E.V. The bioelectrosynthesis of acetate. Curr. Opin. Biotechnol. 2016, 42, 225–233. [Google Scholar] [CrossRef]
  12. Aryal, N.; Tremblay, P.L.; Lizak, D.M.; Zhang, T. Performance of different Sporomusa species for the microbial electrosynthesis of acetate from carbon dioxide. Bioresour. Technol. 2017, 233, 184–190. [Google Scholar] [CrossRef]
  13. Bajracharya, S.; ter Heijne, A.; Dominguez Benetton, X.; Vanbroekhoven, K.; Buisman, C.J.N.; Strik, D.P.B.T.; Pant, D. Carbon dioxide reduction by mixed and pure cultures in microbial electrosynthesis using an assembly of graphite felt and stainless steel as a cathode. Bioresour. Technol. 2015, 195, 14–24. [Google Scholar] [CrossRef]
  14. Bajracharya, S.; Yuliasni, R.; Vanbroekhoven, K.; Buisman, C.J.N.; Strik, D.P.; Pant, D. Long-term operation of microbial electrosynthesis cell reducing CO₂ to multi-carbon chemicals with a mixed culture avoiding methanogenesis. Bioelectrochemistry 2017, 113, 26–34. [Google Scholar] [CrossRef]
  15. Ali, J.; Sohail, A.; Wang, L.; Rizwan Haider, M.; Mulk, S.; Pan, G.; Ali, J.; Sohail, A.; Wang, L.; Rizwan Haider, M.; et al. Electro-Microbiology as a Promising Approach Towards Renewable Energy and Environmental Sustainability. Energies 2018, 11, 1822. [Google Scholar] [CrossRef]
  16. Desloover, J.; Arends, J.B.A.; Hennebel, T.; Rabaey, K. Operational and technical considerations for microbial electrosynthesis. Biochem. Soc. Trans. 2012, 40, 1233–1238. [Google Scholar] [CrossRef]
  17. Mateos, R.; Escapa, A.; San-Martín, M.I.; De Wever, H.; Sotres, A.; Pant, D. Long-term open circuit microbial electrosynthesis system promotes methanogenesis. J. Energy Chem. 2020, 41, 3–6. [Google Scholar] [CrossRef]
  18. Muñoz-Aguilar, R.; Molognoni, D.; Bosch-Jimenez, P.; Borràs, E.; Della Pirriera, M.; Luna, Á.; Muñoz-Aguilar, R.S.; Molognoni, D.; Bosch-Jimenez, P.; Borràs, E.; et al. Design, Operation, Modeling and Grid Integration of Power-to-Gas Bioelectrochemical Systems. Energies 2018, 11, 1947. [Google Scholar] [CrossRef]
  19. Zaybak, Z.; Pisciotta, J.M.; Tokash, J.C.; Logan, B.E. Enhanced start-up of anaerobic facultatively autotrophic biocathodes in bioelectrochemical systems. J. Biotechnol. 2013, 168, 478–485. [Google Scholar] [CrossRef]
  20. Mateos, R.; Sotres, A.; Alonso, R.M.; Escapa, A.; Morán, A. Impact of the start-up process on the microbial communities in biocathodes for electrosynthesis. Bioelectrochemistry 2018, 121, 27–37. [Google Scholar] [CrossRef]
  21. Martínez, E.J.; Gil, M.V.; Rosas, J.G.; Moreno, R.; Mateos, R.; Morán, A.; Gómez, X. Application of thermal analysis for evaluating the digestion of microwave pre-treated sewage sludge. J. Therm. Anal. Calorim. 2016, 127, 1209–1219. [Google Scholar] [CrossRef]
  22. Rice, E.W.; Bridgewater, L.; American Public Health Association; American Water Works Association; Water Environment Federation. Standard Methods for the Examination of Water and Wastewater; American Public Health Association: Washington, DC, USA, 2012; ISBN 9780875530130. [Google Scholar]
  23. del Pilar Anzola Rojas, M.; Mateos, R.; Sotres, A.; Zaiat, M.; Gonzalez, E.R.; Escapa, A.; De Wever, H.; Pant, D. Microbial electrosynthesis (MES) from CO₂ is resilient to fluctuations in renewable energy supply. Energy Convers. Manag. 2018, 177, 272–279. [Google Scholar] [CrossRef]
  24. Callaway, T.R.; Dowd, S.E.; Wolcott, R.D.; Sun, Y.; McReynolds, J.L.; Edrington, T.S.; Byrd, J.A.; Anderson, R.C.; Krueger, N.; Nisbet, D.J. Evaluation of the bacterial diversity in cecal contents of laying hens fed various molting diets by using bacterial tag-encoded FLX amplicon pyrosequencing. Poult. Sci. 2009, 88, 298–302. [Google Scholar] [CrossRef]
  25. Saratale, R.G.; Saratale, G.D.; Pugazhendhi, A.; Zhen, G.; Kumar, G.; Kadier, A.; Sivagurunathan, P. Microbiome involved in microbial electrochemical systems (MESs): A review. Chemosphere 2017, 177, 176–188. [Google Scholar] [CrossRef]
  26. LaBelle, E.V.; Marshall, C.W.; Gilbert, J.A.; May, H.D. Influence of Acidic pH on Hydrogen and Acetate Production by an Electrosynthetic Microbiome. PLoS ONE 2014, 9, e109935. [Google Scholar] [CrossRef]
  27. Gildemyn, S.; Verbeeck, K.; Slabbinck, R.; Andersen, S.J.; Prévoteau, A.; Rabaey, K. Integrated Production, Extraction, and Concentration of Acetic Acid from CO₂ through Microbial Electrosynthesis. Environ. Sci. Technol. Lett. 2015, 2, 325–328. [Google Scholar] [CrossRef]
  28. Jourdin, L.; Grieger, T.; Monetti, J.; Flexer, V.; Freguia, S.; Lu, Y.; Chen, J.; Romano, M.; Wallace, G.G.; Keller, J. High Acetic Acid Production Rate Obtained by Microbial Electrosynthesis from Carbon Dioxide. Environ. Sci. Technol. 2015, 49, 13566–13574. [Google Scholar] [CrossRef]
  29. Zou, S.; He, Z. Efficiently “pumping out” value-added resources from wastewater by bioelectrochemical systems: A review from energy perspectives. Water Res. 2018, 131, 62–73. [Google Scholar] [CrossRef]
  30. Cecconet, D.; Bolognesi, S.; Callegari, A.; Capodaglio, A.G. Simulation tests of in situ groundwater denitrification with aquifer-buried biocathodes. Heliyon 2019, 5, e02117. [Google Scholar] [CrossRef] [Green Version]
  31. Cooney, M.J.; Roschi, E.; Marison, I.W.; Comminellis, C.; von Stockar, U. Physiologic studies with the sulfate-reducing bacterium Desulfovibrio desulfuricans: Evaluation for use in a biofuel cell. Enzyme Microb. Technol. 1996, 18, 358–365. [Google Scholar] [CrossRef]
  32. Aulenta, F.; Catapano, L.; Snip, L.; Villano, M.; Majone, M. Linking Bacterial Metabolism to Graphite Cathodes: Electrochemical Insights into the H2-Producing Capability of Desulfovibrio sp. ChemSusChem 2012, 5, 1080–1085. [Google Scholar] [CrossRef]
  33. Arends, J.B.A.; Patil, S.A.; Roume, H.; Rabaey, K. Continuous long-term electricity-driven bioproduction of carboxylates and isopropanol from CO₂ with a mixed microbial community. J. CO2 Util. 2017, 20, 141–149. [Google Scholar] [CrossRef]
  34. Patil, S.A.; Arends, J.B.A.; Vanwonterghem, I.; van Meerbergen, J.; Guo, K.; Tyson, G.W.; Rabaey, K. Selective Enrichment Establishes a Stable Performing Community for Microbial Electrosynthesis of Acetate from CO2. Environ. Sci. Technol. 2015, 49, 8833–8843. [Google Scholar] [CrossRef]
  35. Hari, A.R.; Venkidusamy, K.; Katuri, K.P.; Bagchi, S.; Saikaly, P.E. Temporal microbial community dynamics in microbial electrolysis cells—Influence of acetate and propionate concentration. Front. Microbiol. 2017, 8, 1371. [Google Scholar] [CrossRef]
  36. Schwartz, E.; Friedrich, B. The H2-metabolizing prokaryotes. In The Prokaryotes; Dworkin, M., Falkow, S., Rosenberg, E., Schleifer, K.H., Stackebrandt, E., Eds.; Springer: New York, NY, USA, 2006. [Google Scholar]
  37. Koch, C.; Harnisch, F. Is there a specific ecological niche for electroactive microorganisms? ChemElectroChem 2016, 3, 1282–1295. [Google Scholar] [CrossRef]
  38. Deutzmann, J.S.; Sahin, M.; Spormann, A.M. Extracellular Enzymes Facilitate Electron Uptake in Biocorrosion and Bioelectrosynthesis. MBio 2015, 6, e00496-15. [Google Scholar] [CrossRef] [Green Version]
Figure 1. Image and diagram of reactor setup. CE: counter electrode; RE: reference electrode; WE: working electrode.
Energies 12 03297 g001
Figure 2. Evolution of polarization curve currents along the experiment.
Energies 12 03297 g002
Figure 3. Acetic acid concentration along the experimental period (days 49–92). Current density is also shown along the whole period. The green area represents the 3 batch cycles with no gas headspace recirculation, while orange covers the 3 batches with recirculation.
Energies 12 03297 g003
Figure 4. Principal component analysis (PCA) of eubacterial communities based on the operational taxonomic unit (out) matrix. Microbial communities from the initial sludge (IS), enriched inoculum (EI), and samples from biofilm (B) and supernatant (S) taken during the experiment.
Energies 12 03297 g004
Figure 5. Taxonomic classification of eubacterial communities at family levels and the phyla to which these families belong.
Energies 12 03297 g005
Figure 6. Overlap of the four biofilm communities and the taxonomic identities of the shared OTUs.
Energies 12 03297 g006
Table 1. Acetic acid production summary, including averages and standard deviation for both microbial electrosynthesis (MES) reactors.
Acetic Acid Production
Operation ModeBatchMES1 RateMES2 RateMES AverageStd. Dev.Period Average
(mg·L−1·d−1)(mg·L−1·d−1)(mg·L−1·d−1)(mg·L−1·d−1)(mg·L−1·d−1)
Without recirculation173.565.569.55,661.1
249.548.448.90.7
355.374.765.013.8
With recirculation 483.1117.1100.224.1109.1
5122.089.1105.623.3
6115.0128.25121.69.4
Table 2. Carbon balance and cathodic efficiency. Averages between both MES replicate reactors (MES1 and MES2) are shown.
Operation ModeBatchCO2 InitialCO2 FinalAcetate ProductionCO2-to-Acetate ConversionTransferred ChargeCathodic Efficiency
(mol C)(mol C)(mol C)(%)(C)(%)
Without recirculation10.0220.0060.01698%14,23089.8%
20.0220.0080.01181%15,67057.4%
30.0220.0060.01593%13,79086.7%
With recirculation40.0270.0010.02390%20,32090.6%
50.0270.0000.02593%33,50057.8%
60.0270.0000.028106%28,48078.5%