Article

Identification Technology of Grid Monitoring Alarm Event Based on Natural Language Processing and Deep Learning in China

1
College of Energy and Electrical Engineering, Hohai University, Nanjing 210098, China
2
Nanjing Power Supply Company of State Grid Jiangsu Electric Power Co., Ltd., Nanjing 210019, China
3
State Grid Jiangsu Electric Power Co., Ltd., Nanjing 210024, China
*
Author to whom correspondence should be addressed.
Energies 2019, 12(17), 3258; https://doi.org/10.3390/en12173258
Submission received: 27 June 2019 / Revised: 18 August 2019 / Accepted: 20 August 2019 / Published: 23 August 2019
(This article belongs to the Special Issue Data Analytics in Energy Systems)

Abstract

:
Power dispatching systems currently receive massive, complicated, and irregular monitoring alarms during their operation, which prevents the controllers from making accurate judgments on the alarm events that occur within a short period of time. In view of the current situation with the low efficiency of monitoring alarm information, this paper proposes a method based on natural language processing (NLP) and a hybrid model that combines long short-term memory (LSTM) and convolutional neural network (CNN) for the identification of grid monitoring alarm events. Firstly, the characteristics of the alarm information text were analyzed and induced and then preprocessed. Then, the monitoring alarm information was vectorized based on the Word2vec model. Finally, a monitoring alarm event identification model based on a combination of LSTM and CNN was established for the characteristics of the alarm information. The feasibility and effectiveness of the method in this paper were verified by comparison with multiple identification models.

1. Introduction

With the rapid construction of power informatization, there has been explosive growth in power-grid data. As a kind of Chinese text data, grid monitoring alarm information is an important type of foundation data for regulatory personnel to monitor the running status of power grids. Over recent years, the amount of alarm information in the access control system has continued to increase with all collected information displayed in chronological order without any inference or process. It is easy for the regulator to miss important information regarding an alarm and they cannot accurately identify it in a short period of time. Therefore, the text mining of historical alarm information and the establishment of a fast and accurate identification method have become important issues in the field of power dispatching.
Many scholars have done profound research on the intelligent identification and alarm technology of power systems. At present, there are three kinds of techniques, which are theoretically mature: Expert system (ES), analytic model, and artificial neural network (ANN). In addition, rough set (RS) [1,2], Petri net [3,4,5], Bayesian network [6,7,8], and fuzzy set (FS) [9,10,11] have also been successfully applied in the intelligent identification and alarm of power systems. Expert system identifies through expert knowledge representation and logical reasoning mechanisms. A rule base is generated by using expert experience knowledge and fuzzy inference matching rules are applied to the alarm information to identify fault event categories [12,13]. The relevant rules and knowledge base established by the above methods need manual refinement and maintenance, and they cannot be self-learned and improved. Lee et al. [14] present a practical expert system for fault diagnosis of distribution substations. Based on the knowledge of topology and operation rules of protective devices, the reverse imprecise reasoning process is used to estimate the fault section. Although the expert system is constantly improving, there are still shortcomings, such as the incomplete fault event rules, low recognition efficiency, and vulnerability to information errors or missing interference.
The analytic model-based method describes the fault diagnosis as an unconstrained 0–1 integer programming problem, and the optimization algorithm is used to minimize the objective function, with the optimal solution as the fault diagnosis result. In reference [15], an analytic model based on chance-constrained programming technology is introduced, and a genetic algorithm based on the Monte Carlo simulation is used to resolve the objective function. In reference [16], an analytic method based on the topological description is proposed and the mapping relationship between protection device and section is built according to an event matrix. In reference [17], the concept of a dynamic correlation path is used to reflect the time relationship between the action of protective relay and circuit breaker in various forms, and the accurate identification results of multiple faults are obtained. In addition, wide-area measurement can provide synchronous data and enhance the estimation ability of fault sections in diagnostic models [18,19]. In reference [20], the system is divided into subnet and protection areas, and the identification vector indicating the fault area is obtained by current measurement. Then, the fault location is accurately located according to wide-area measurement data.
In order to improve the fault recognition ability of the monitoring and alarm system in the case of information errors and missing information, the monitoring and alarm means based on ANN have been gradually applied. Reference [21] uses a generalized regression neural network (GRNN) and a multi-layer perceptron neural network (MPNN), two types of neural network modeling, for power system fault identification. Reference [22] extracts the logic state of the relevant switch protection from the alarm information and then obtains the fault identification result based on the ANN. In reference [23], a hybrid model based on the rule base and ANN is proposed for intelligent alarm and fault location of substation. The analytic model-based method and ANN method do not need to define definite rules, which enhances the identification velocity and generalization ability of the monitoring and alarm system, and has a certain degree of fault tolerance and adaptability. However, the accuracy of identification depends on the detailed power network topology, complete protection device action logic, or real-time measurement data, which reduces the practicability of the above methods.
The development of natural language processing (NLP) and deep learning provides new ideas and methods for directly relying on monitoring alarm information texts for alarm event identification. Natural language processing has been successfully applied in the fields of information retrieval, text classification, intelligent Question and Answer, and machine translation [24]. Some scholars have begun to apply NLP in the field of power systems. In reference [25], the vector space model (VSM) is used to express the semantics, and the K-nearest neighbor (KNN) algorithm is used to evaluate the whole life state of circuit breakers. Reference [26] uses a naive Bayesian algorithm to analyze historical fault event records to predict substation faults. In reference [27], a method is proposed based on the supervised Latent Dirichlet Allocation (sLDA) to detect and identify blackout accidents by mining text about blackouts in social networks. The text semantic expression of the above method is based on the statistical processing of word frequency, and the identification method is a traditional machine-learning model. Deep learning can more fully monitor the sample characteristics of big data compared to traditional machine-learning models. In reference [28], a defect text classification model based on a convolutional neural network (CNN) is constructed for the defect text of power equipment. However, the analysis of the power equipment fault defect text is a single statement sample, the processing is relatively easy, and the classification model is a single deep-learning model. On the contrary, the monitoring alarm information is a multi-statement sample on the time series, and the processing is more complicated and difficult.
For the sake of further studying the application of deep learning and its combination model in grid monitoring alarm information mining, this paper proposes a grid monitoring alarm event identification method based on NLP and a long short-term memory (LSTM)-CNN combination model. The main contributions of this paper are as follows:
  • The Word2vec model is used to realize the semantic expression of monitoring alarm information text, instead of the semantic expression based on character retrieval matching or word frequency statistical probability. The text-based power grid monitoring alarm event identification is realized;
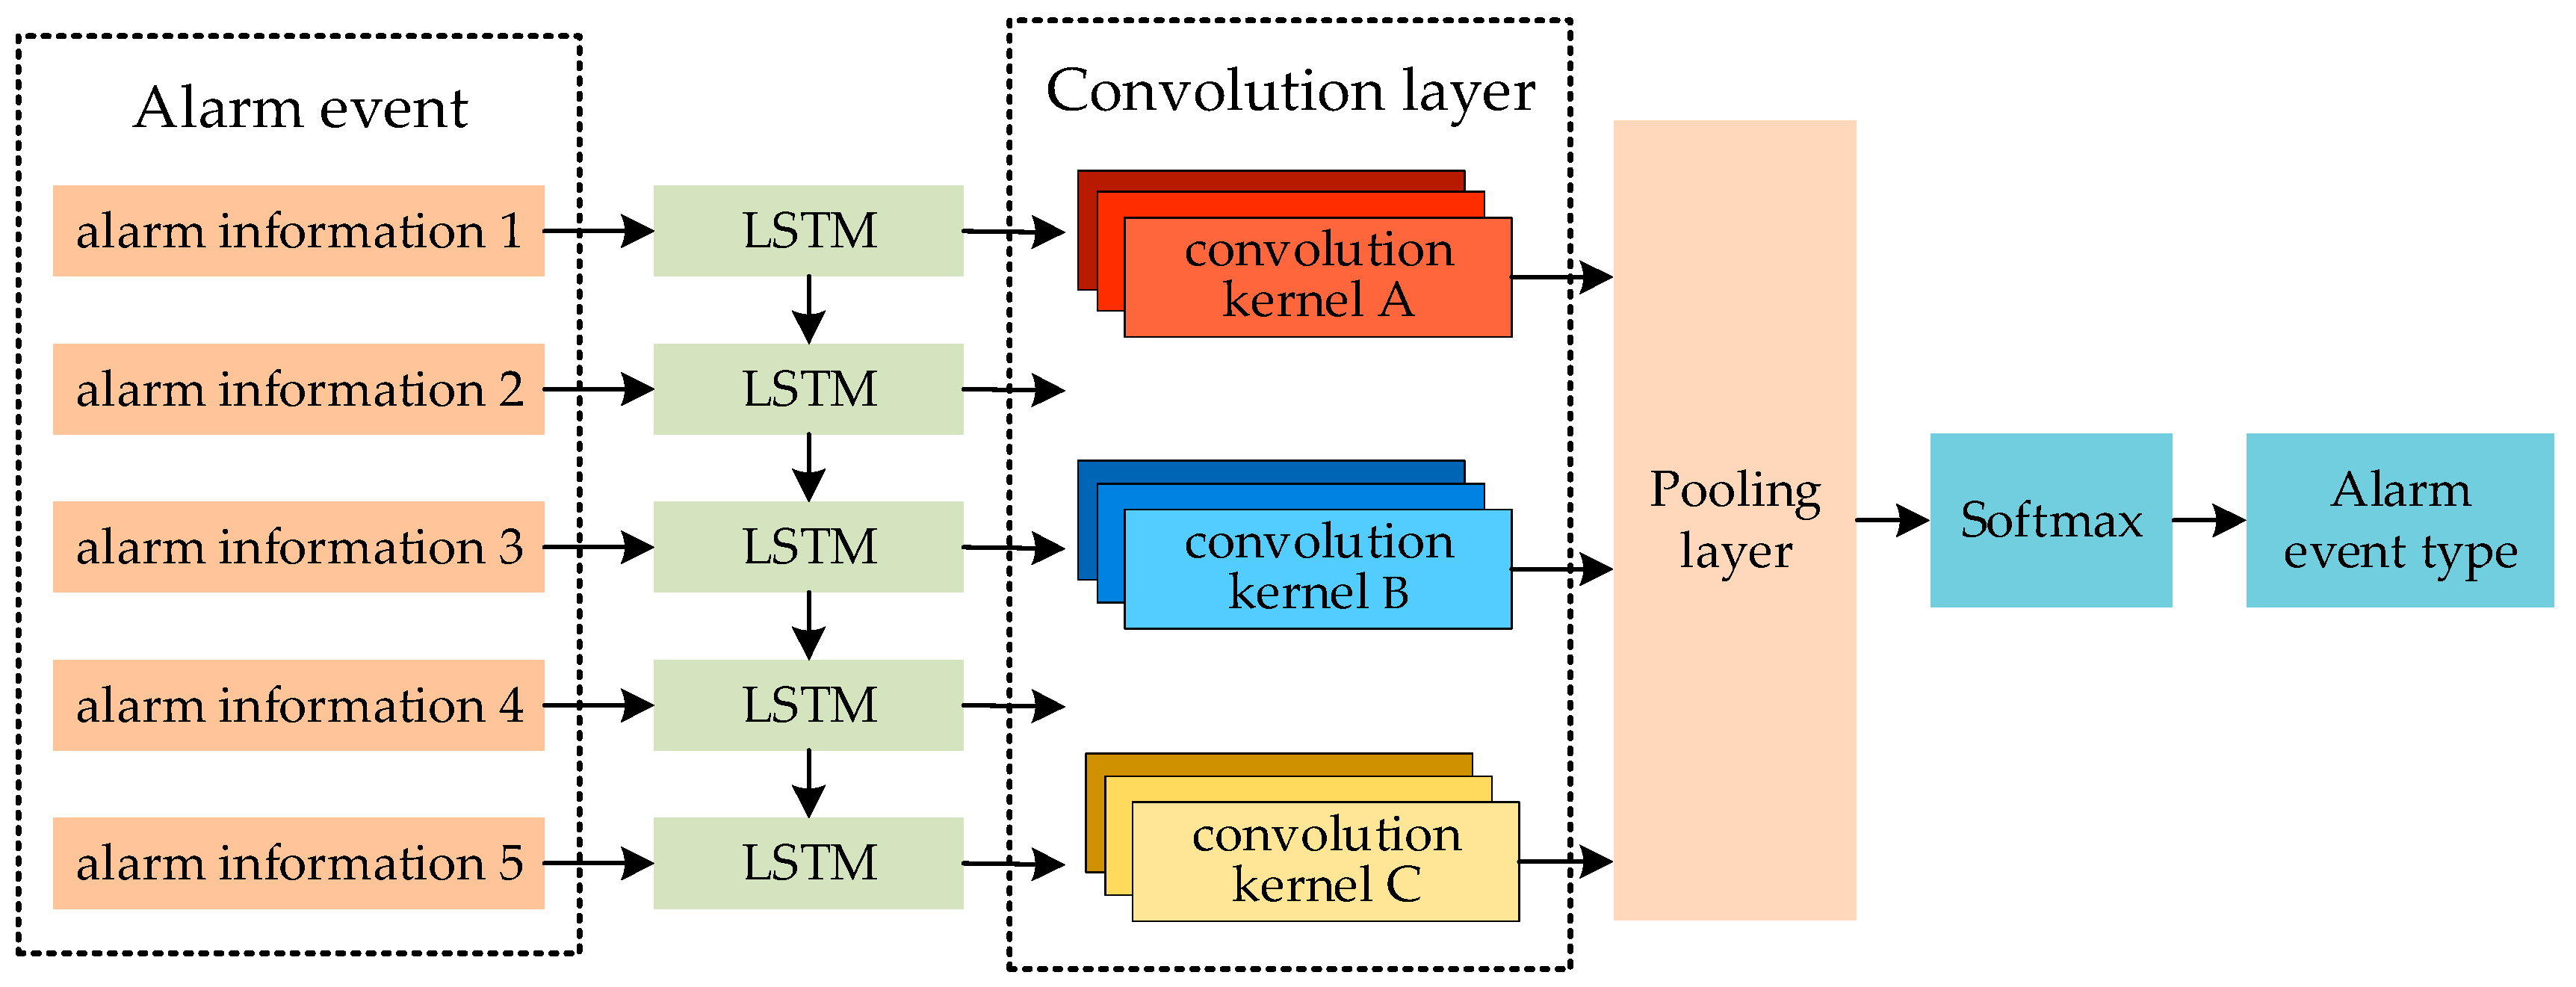
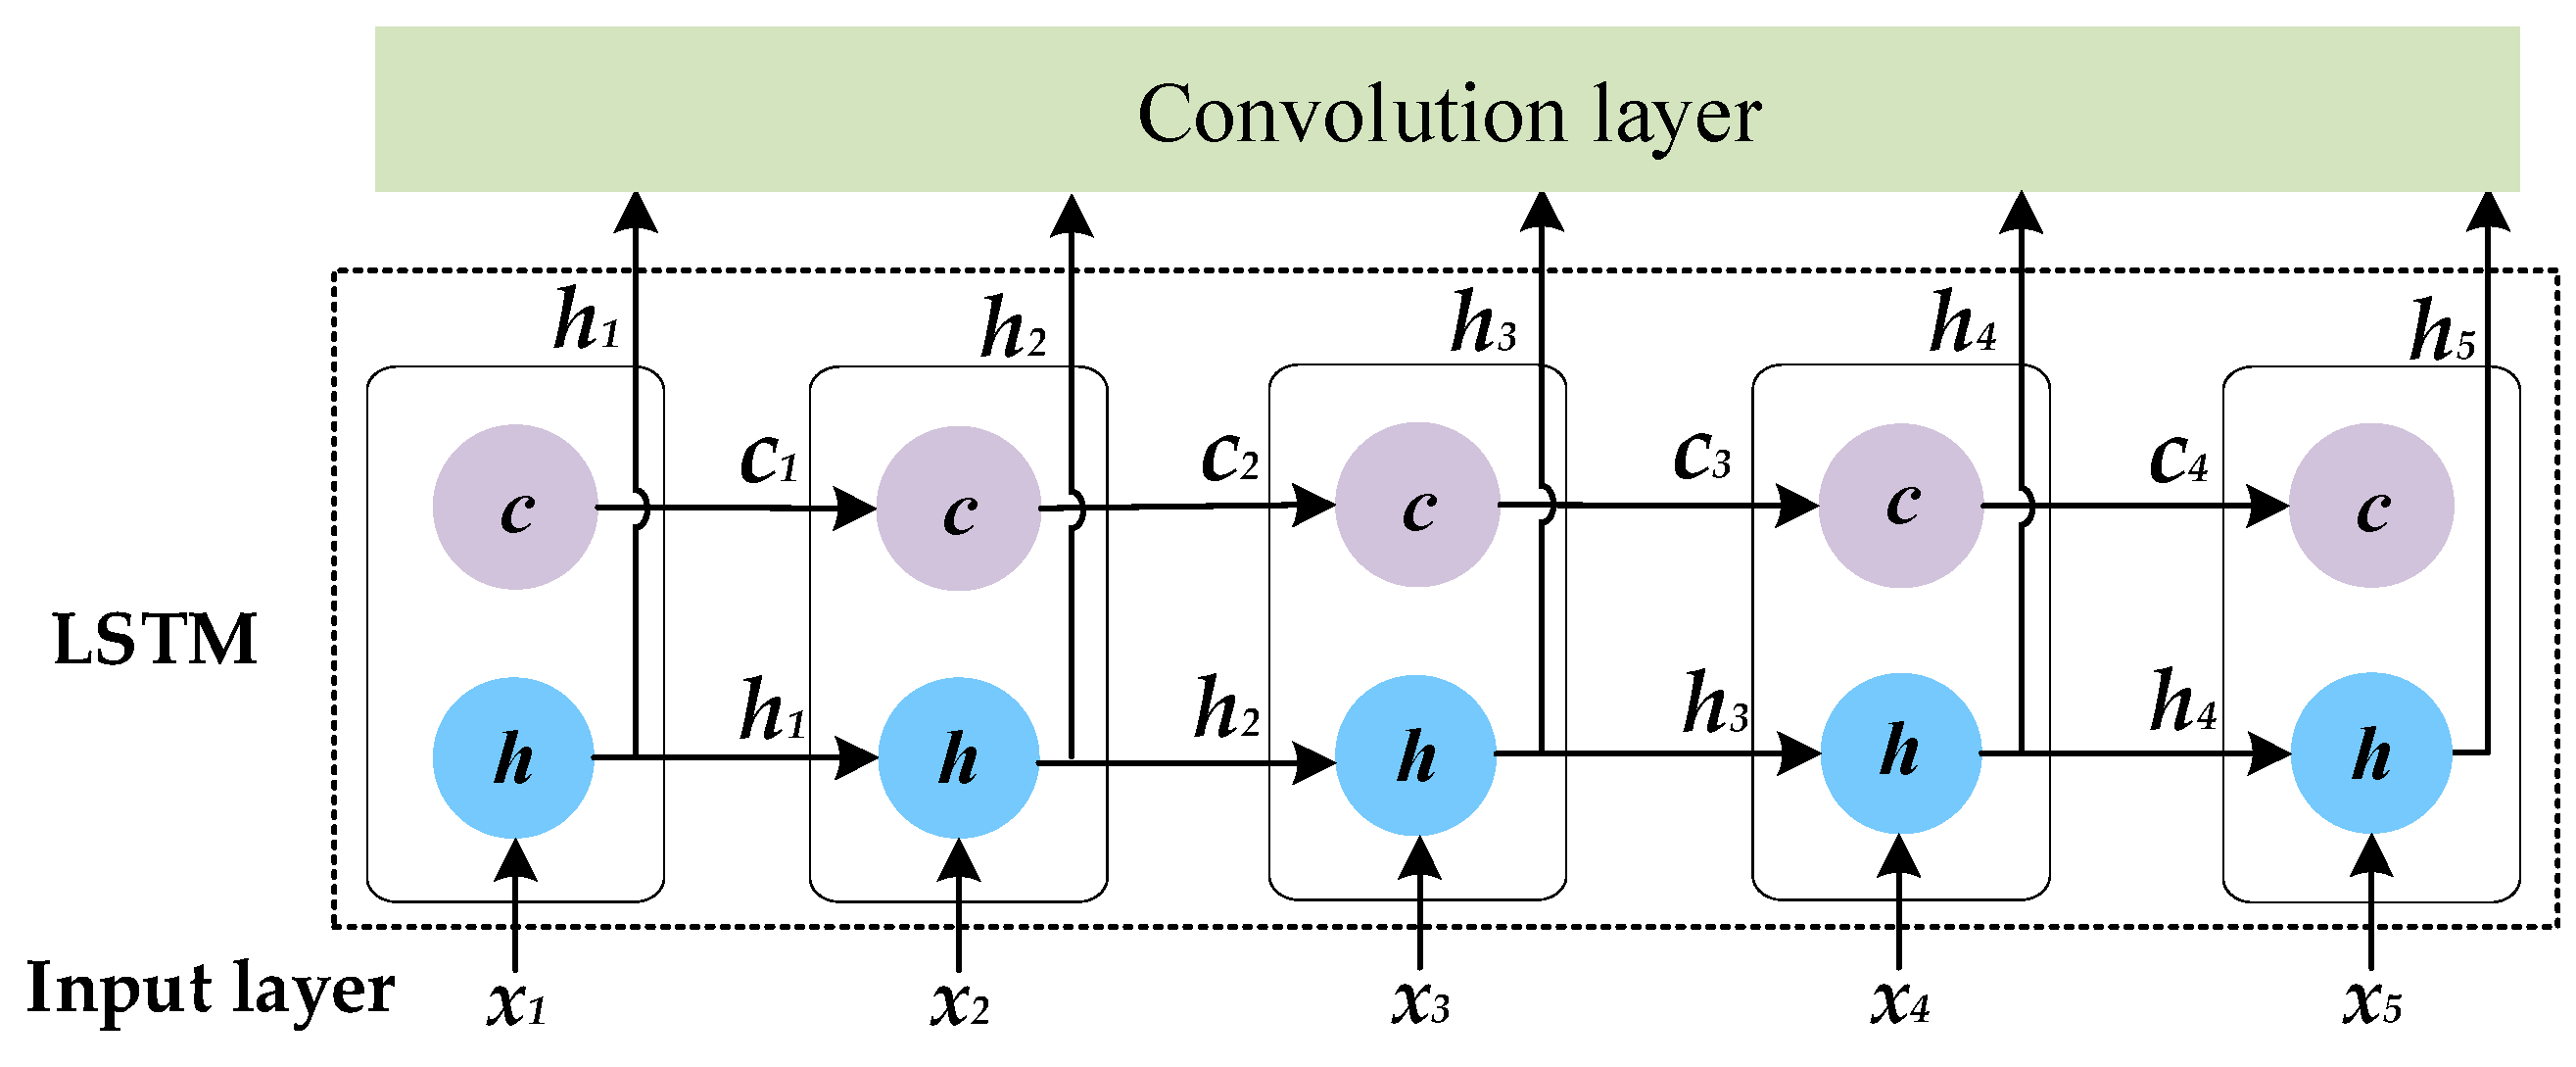
  • We analyze a large amount of historical warning information and summarize the differences between them and ordinary Chinese text. Combining the excellent performance of LSTM in dealing with the time-series problem and CNN in mining local features of short text, a hybrid deep-learning model is built to realize the rapid identification of alarm events. Compared with the single deep-learning model, the accuracy shows great improvement.
The proposed LSTM-CNN model is compared with several different machine-learning models and single deep-learning models to prove its feasibility and superiority. The other sections of this paper are arranged as follows. Section 2 introduces the characteristics of monitoring alarm information and alarm event samples. Section 3 introduces the pretreatment process of the identification method and the detailed structure and algorithm of the identification model. Section 4 carries out computational experiments, provides the identification results based on the method and other models, and compares the performance of each model. Finally, we discuss the experimental results and draw conclusions in Section 5.

2. Monitoring Alarm Event Identification Process and Characteristics of Monitoring Alarm Information

The original data collected in this paper are monitoring alarm information generated by Supervisory Control and Data Acquisition (SCADA). Each piece of monitoring alarm information includes four parts: Alarm time, alarm location, alarm content, and action status. The alarm content is unstructured Chinese text, which contains a detailed description of the switch and the equipment. A typical alarm message is shown in Figure 1.
The alarm event sample is the data used for training the identification model. Each sample is a set of alarm information that contains the information collected when an alarm event occurs. The set of alarm information reflects the characteristics of the event type to which the sample belongs. A typical alarm event sample is shown in Table 1.
This paper proposes an identification technology of monitoring alarm events based on NLP and LSTM-CNN. The main steps for its identification are as follows:
  • Pre-processing the original monitoring alarm information, including word segmentation and filtering of stop words;
  • Using the Word2vec model to represent distributed vector of pre-processed monitoring alarm information;
  • Extracting various types of alarm event samples from historical monitoring alarm information in a semi-automatic manner and labeling the event types. In the specific implementation, taking the monitoring alarm information with the key-word of “opening” as the sign and the discrete monitoring alarm information of the same substation or line in the 15 s before and after the information is extracted to form an alarm information set. Then, the information set is judged by the experience rules of regulators. The alarm information in the set is divided into position signal, protection signal, and accompanying signal. The rules of each type of alarm event contain the necessary and unnecessary conditions for event determination. After each alarm event is handled, the regulator writes a scheduling log to record the occurrence time, the cause of the event, the processing flow, and the type of event. The set of alarm information determined by rules is checked against the dispatch log to form nine types of monitoring alarm event samples;
  • Inputting the alarm event sample into the trained identification model based on LSTM-CNN to obtain the identification result;
  • Comparing the model-identifying result with the actual type of the alarm event. If the result is wrong, it can be corrected by manual supervision and added to the sample library of historical alarm events for self-learning.
The identification process of grid monitoring alarm events is shown in Figure 2.
Compared to the general expression Chinese text, the monitoring alarm information and the alarm event sample have the following characteristics:
  • Monitoring alarm information relates to the neighborhood content of power engineering, which contains a large number of professional vocabularies for power system operation. The vocabularies contain between two and five words, such as “busbar differential”, “reclosing”, “control loop”, and “fault recorder”;
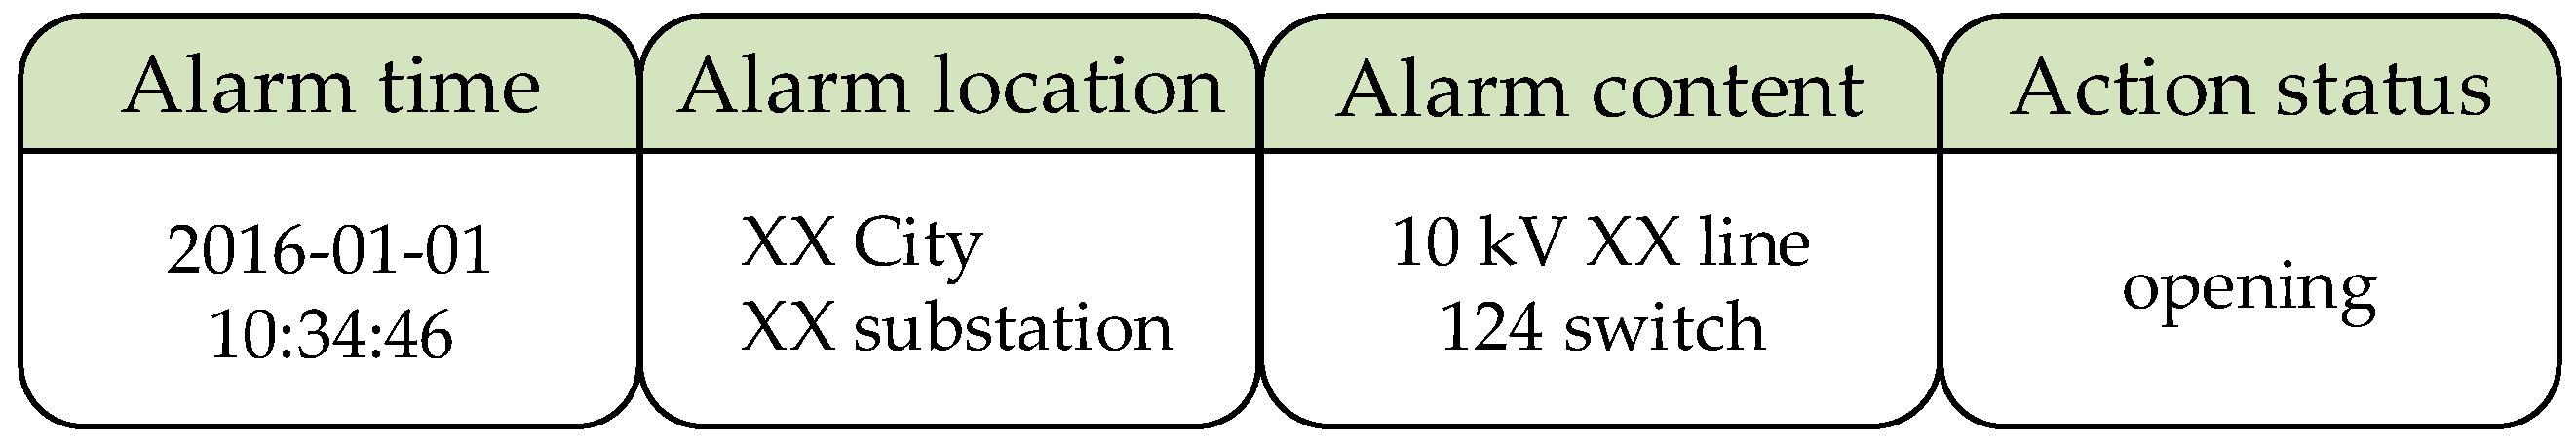
  • The monitoring alarm information contains a detailed description of the power device name and device action, and there is no fixed number of words and structure, which is unstructured text. At the same time, the Chinese words are arranged in a row next to the English text, and there is no space between them;
  • A large number of monitoring alarms contain text, numbers, and quantization units. Most of the numbers are line names or switch numbers. These fields play an important role in extracting discrete monitoring alarm information for a period of time before and after a certain piece of information is received;
  • Due to the complexity of different types of alarm events and the difference in recording accuracy caused by the version of the on-site information collection system, the number of monitoring alarms contained in various event samples is also different. According to the statistics of the extracted alarm event samples, the shortest contains only five pieces of information, and the longest can contain 137 pieces of information;
  • The monitoring alarm information in each alarm event sample occurs continuously over a short period of time and is arranged according to the time of occurrence with a strict timing relationship.

3. Monitoring Alarm Event Identification Based on NLP and LSTM-CNN

3.1. Monitoring Alarm Information Preprocessing

The preprocessing stage of monitoring alarm information in this paper includes two steps:
  • Word segmentation. Collecting professional electric vocabulary through data review and importing the substation name and line name derived from the historical monitoring alarm information into the vocabulary as a power dictionary for word segmentation. Using the accurate model of the Jieba [29] word segmentation tool to initiate the word segmentation and to generate time-ordered monitoring alarm information consisting of a series of Chinese phrases;
  • Filtering of the stop words. Noise such as irregular characters and punctuation in the monitoring alarm information may interfere with the mining of subsequent text information. Therefore, this paper establishes a stop-words list, eliminates the meaningless words in the alarm information, and achieves data cleaning to improve the post-training effect.

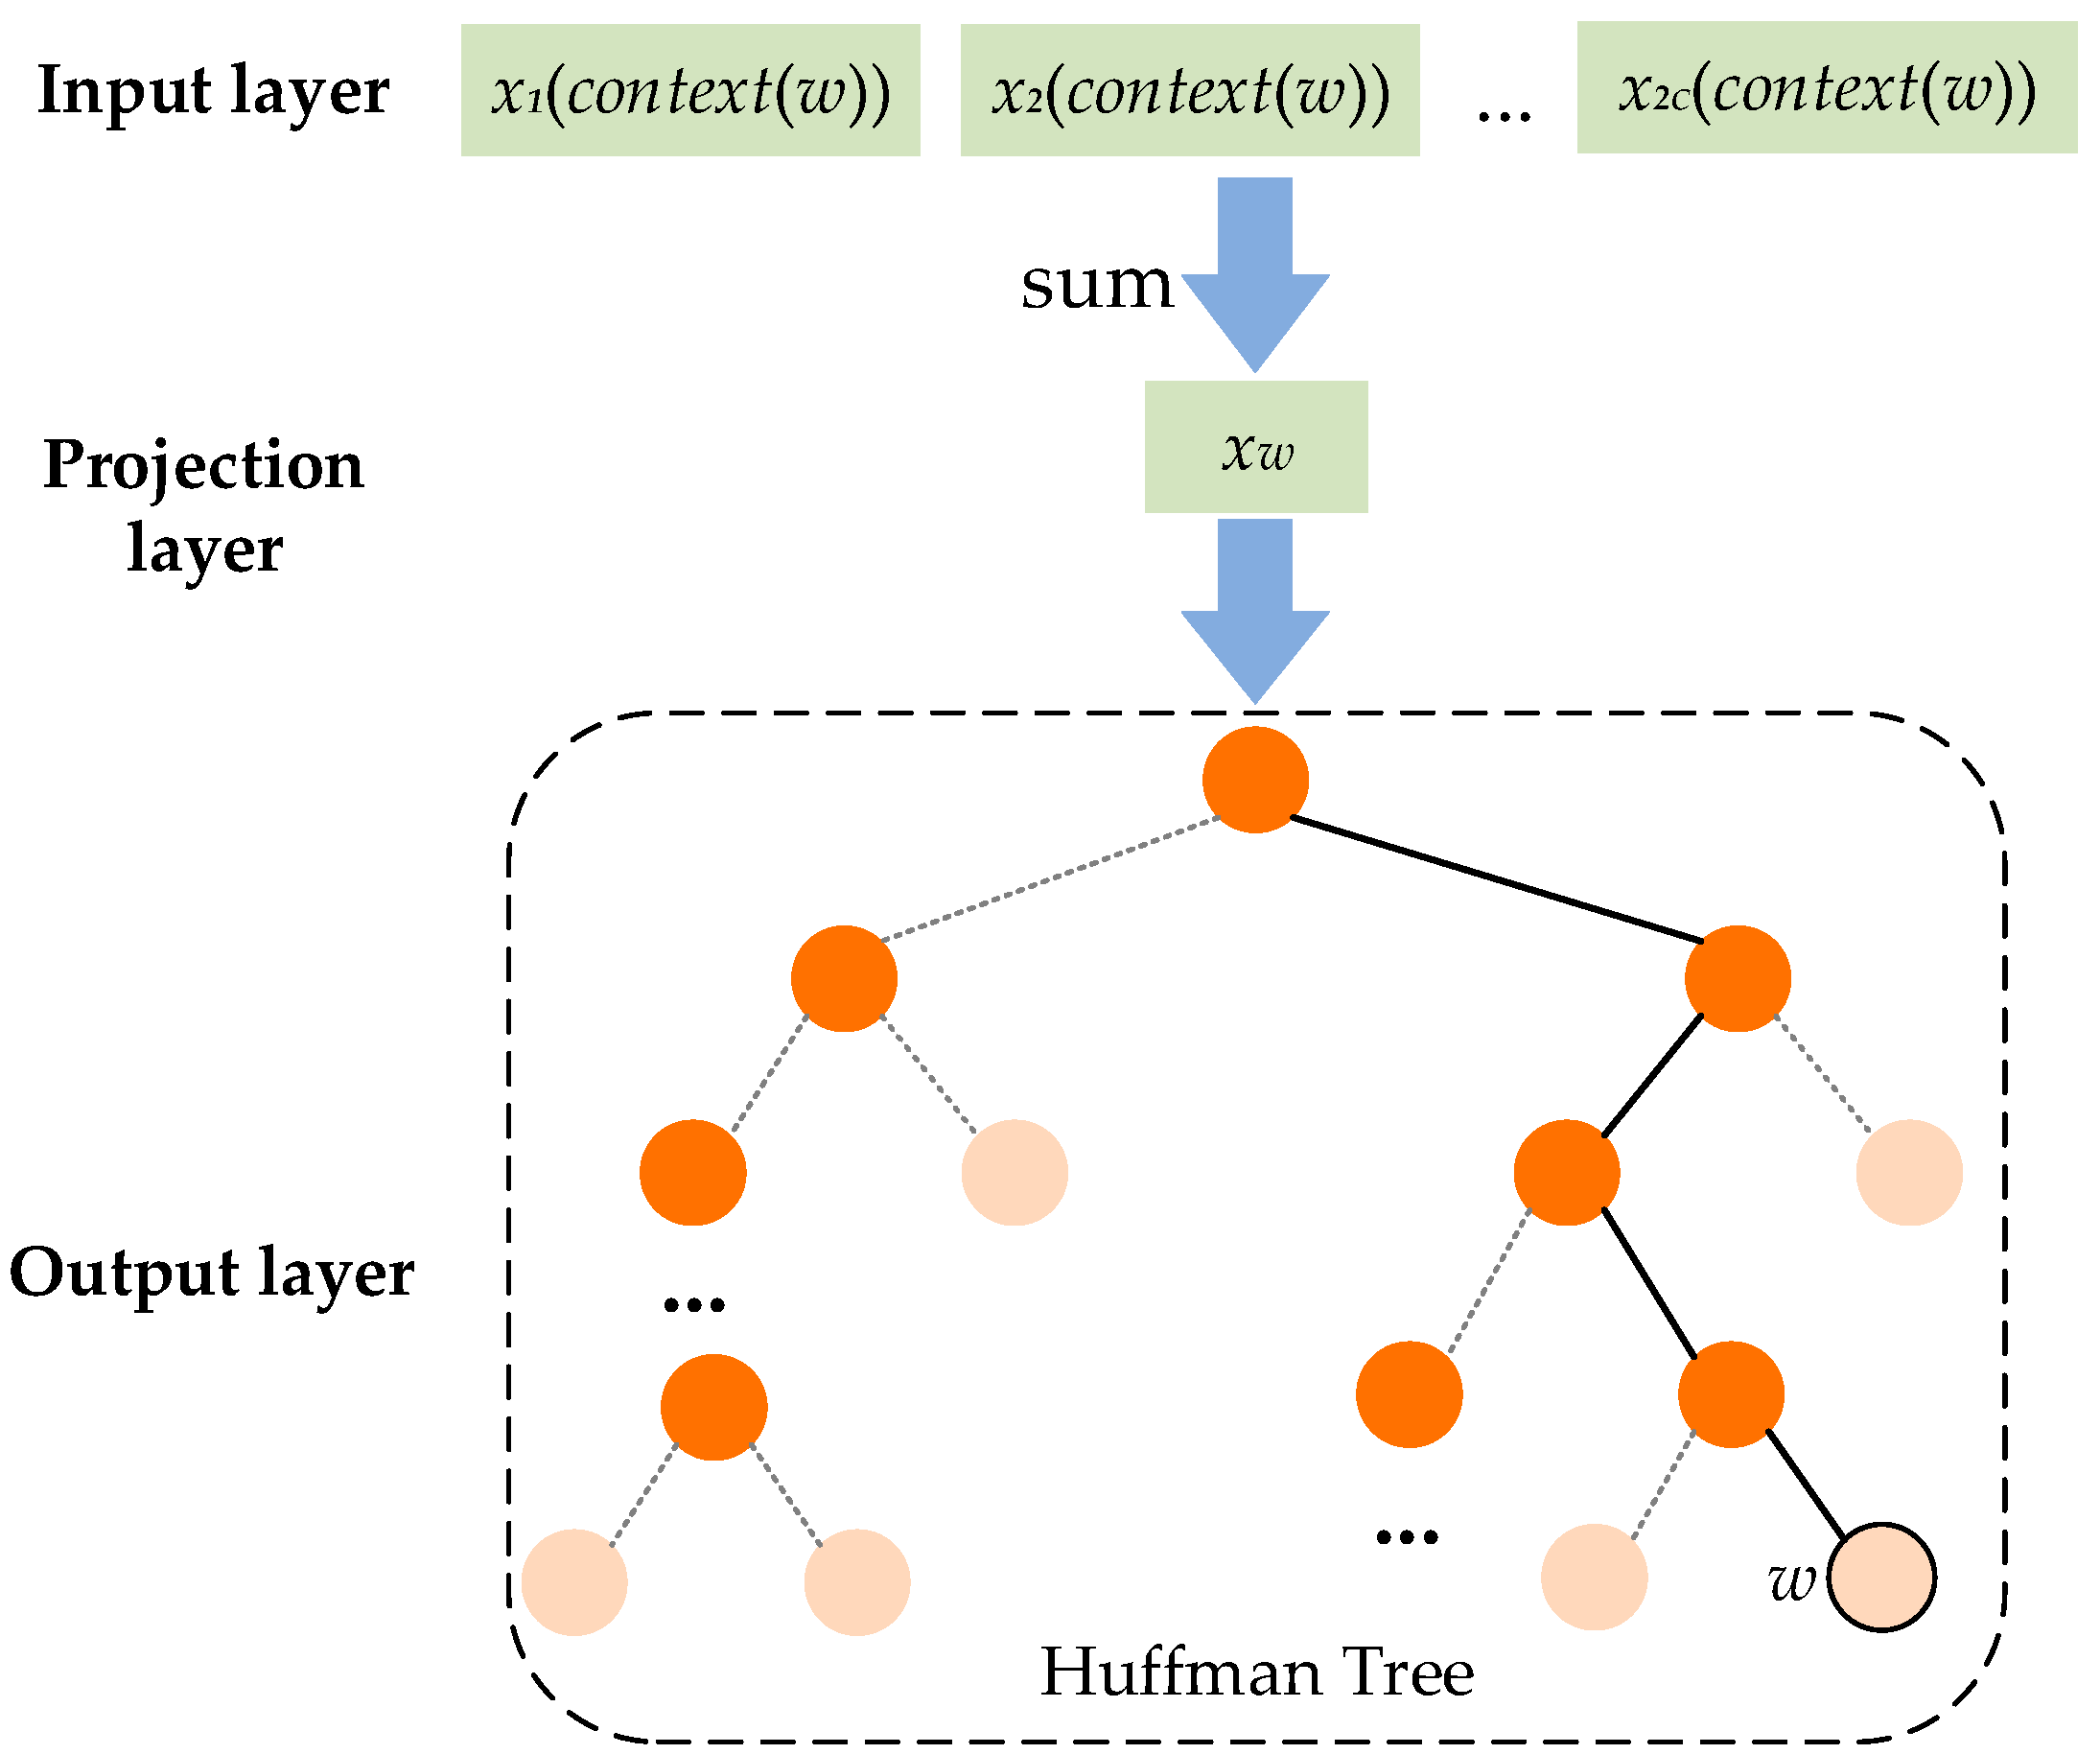
3.2. Vectorization Model of Monitoring Alarm Information Based on Word2vec

Due to the monitoring alarm information being in Chinese text, it needs to be converted to distributed vector representation. This idea was first proposed by Hinton in 1986 [30]. The purpose is to transform the word semantics into the corresponding n-dimensional real vector, which has achieved good results [31]. The currently used vector space embedding method is the Word2vec model, a method proposed by Mikolov et al. in 2013 [32]. As an unsupervised model, Word2vec solves, in a traditional one-hot encoding representation, the problem of large vector dimension and matrix sparseness, which can easily cause dimensional disaster. At the same time, contextual semantic features are introduced into the model to facilitate the classification of text. The Word2vec model is divided into two main categories: The continuous bag-of-words (CBOW) model and the Skip-gram model. Due to the training efficiency of the CBOW model being greater, this paper mainly used the training framework based on the CBOW model, as shown in Figure 3.
The CBOW model is a neural network with three layers: Input layer, projection layer, and output layer [33]. Suppose that the training sample consists of the current central word w and its c words in the context (context(w), w). The CBOW model inputs the one-hot code of 2c words, the output is the probability of occurrence of the center word w, and the distributed vector representation of each word is obtained through iterative training.
Mapping from the input layer to the projection layer, the CBOW model does not adopt the method of linear transformation plus activation function of the traditional neural network, but rather adopts the method of summing and averaging all the input word vectors of the context. Word vectors are calculated from the following equation:
x w = 1 2 c i = 1 2 c x i ( c o n t e x t ( w ) )
From the projection layer to the output layer, the CBOW model replaces the softmax layer of the traditional neural network with Hierarchical Softmax. Specifically, all the words in the training corpus are used as leaf nodes and a Hoffman tree constructed by weighing the number of occurrences of each word in the corpus is used as the output layer. Each leaf node (light node in Figure 3) corresponds to the word vector of each center word w in the training corpus, and each non-leaf node (dark node in Figure 3) corresponds to a parameter vector θw.
The total number of nodes included in the path from the Hoffman tree root node word vector xw to the leaf node where the center word w is located is l, and each time a non-leaf node experiences a binary classification and is defined as a positive class to the left (Hoffman code is 1), right is defined as a negative class (Huffman code is 0), and the probability of binary logistic regression through node j − 1 is:
p ( d j w | x w , θ j 1 w ) = { 1 1 + e x w θ j 1 w , d j w = 1 1 1 1 + e x w θ j 1 w , d j w = 0
where j = 2 , 3 , , l , d j w means Huffman code of node j − 1, d j w { 0 , 1 } , and θ j 1 w means the parameter vector of node j − 1.
Multiplying the two-class probability of each non-leaf node along the path from the root node to the leaf node is the prediction probability P ( w | c o n t e x t ( w ) ) of the central word w. The training goal of the model is to maximize the prediction probability and take the log-likelihood function of the historical alarm information database defined in the pre-processing stage as the objective function of the model:
L = w D log P ( w | c o n t e x t ( w ) ) = w D log j = 2 l p ( d j w | x w , θ j 1 w )
This uses the garden ascending method to iteratively obtain all parameter θw vectors and word vector xw.
When an alarm event occurs, the monitoring alarm information is expressed in the form of a statement, and one of the statements may contain one or more characteristics of the event. Therefore, after the word vector is obtained through the Word2vec model, it needs to be converted into a sentence vector for each monitoring alarm information. In this paper, a vector of all words in the monitoring alarm information is averaged to obtain a distributed vector representation of the monitoring alarm information with the same word vector dimension. This method can express information semantics to a certain extent, and provide data input for subsequent models. The calculation formula is:
v e c _ s u m ( d ) = t v e c ( t ) w o r d _ n u m , t d
where d means one monitoring alarm information; word_num means the numbers of words in d; t means the words in monitoring alarm information; vec(t) means the vector of t; and vec_sum(d) means the distributed vector representation of a monitoring alarm message.

3.3. Monitoring Alarm Event Identification Model Based on LSTM-CNN

3.3.1. Model Structure

A recurrent neural network (RNN) has the powerful function of processing time-dependent sequences, has been widely used to solve time series problems [34,35], and has a wide range of applications in natural language processing [36]. Long short-term memory is an improvement to RNN that successfully resolves the existence of gradient disappearance and gradient explosion defects [37]. Convolutional neural network is one of the most mature models in deep learning and is extensively applied to image recognition, text classification, and other fields [38].
The monitoring alarm information triggered by the alarm event occurs continuously over a short period of time. The information of the entire event is arranged according to the time of occurrence and has a strict timing relationship. At the same time, depending on the meaning of the statement expression, one piece of information may contain one or multiple features of an event. It is also possible that a plurality of adjacent pieces of specific information together contain important features of the result of the alarm event’s launching, indicating that there is a mutual connection between the partial information. The LSTM realizes the forgetting and retaining of the monitoring alarm information by controlling the memory unit, that is, the action occurring first in the alarm event can be saved. Therefore, the overall meaning of the monitoring alarm information sequence is better represented. CNN has the characteristics of local sensing, excellent feature extraction performance, and can mine the correlation feature between adjacent monitoring alarm information.
Based on the advantages of the two models, this paper constructs an LSTM-CNN alarm event identification model. Firstly, the recursive idea is used to represent the timing law in the event’s monitoring alarm information, and the grammar and semantic features are learned. Then, the multi-granularity convolution kernel is used to convolve the learned grammar and semantic features to further explore the depth features in the information. Then, the most important feature in the information is extracted through the pooling operation. Finally, the softmax classifier outputs the identified alarm event type. The structure of the identification model is shown in Figure 4.

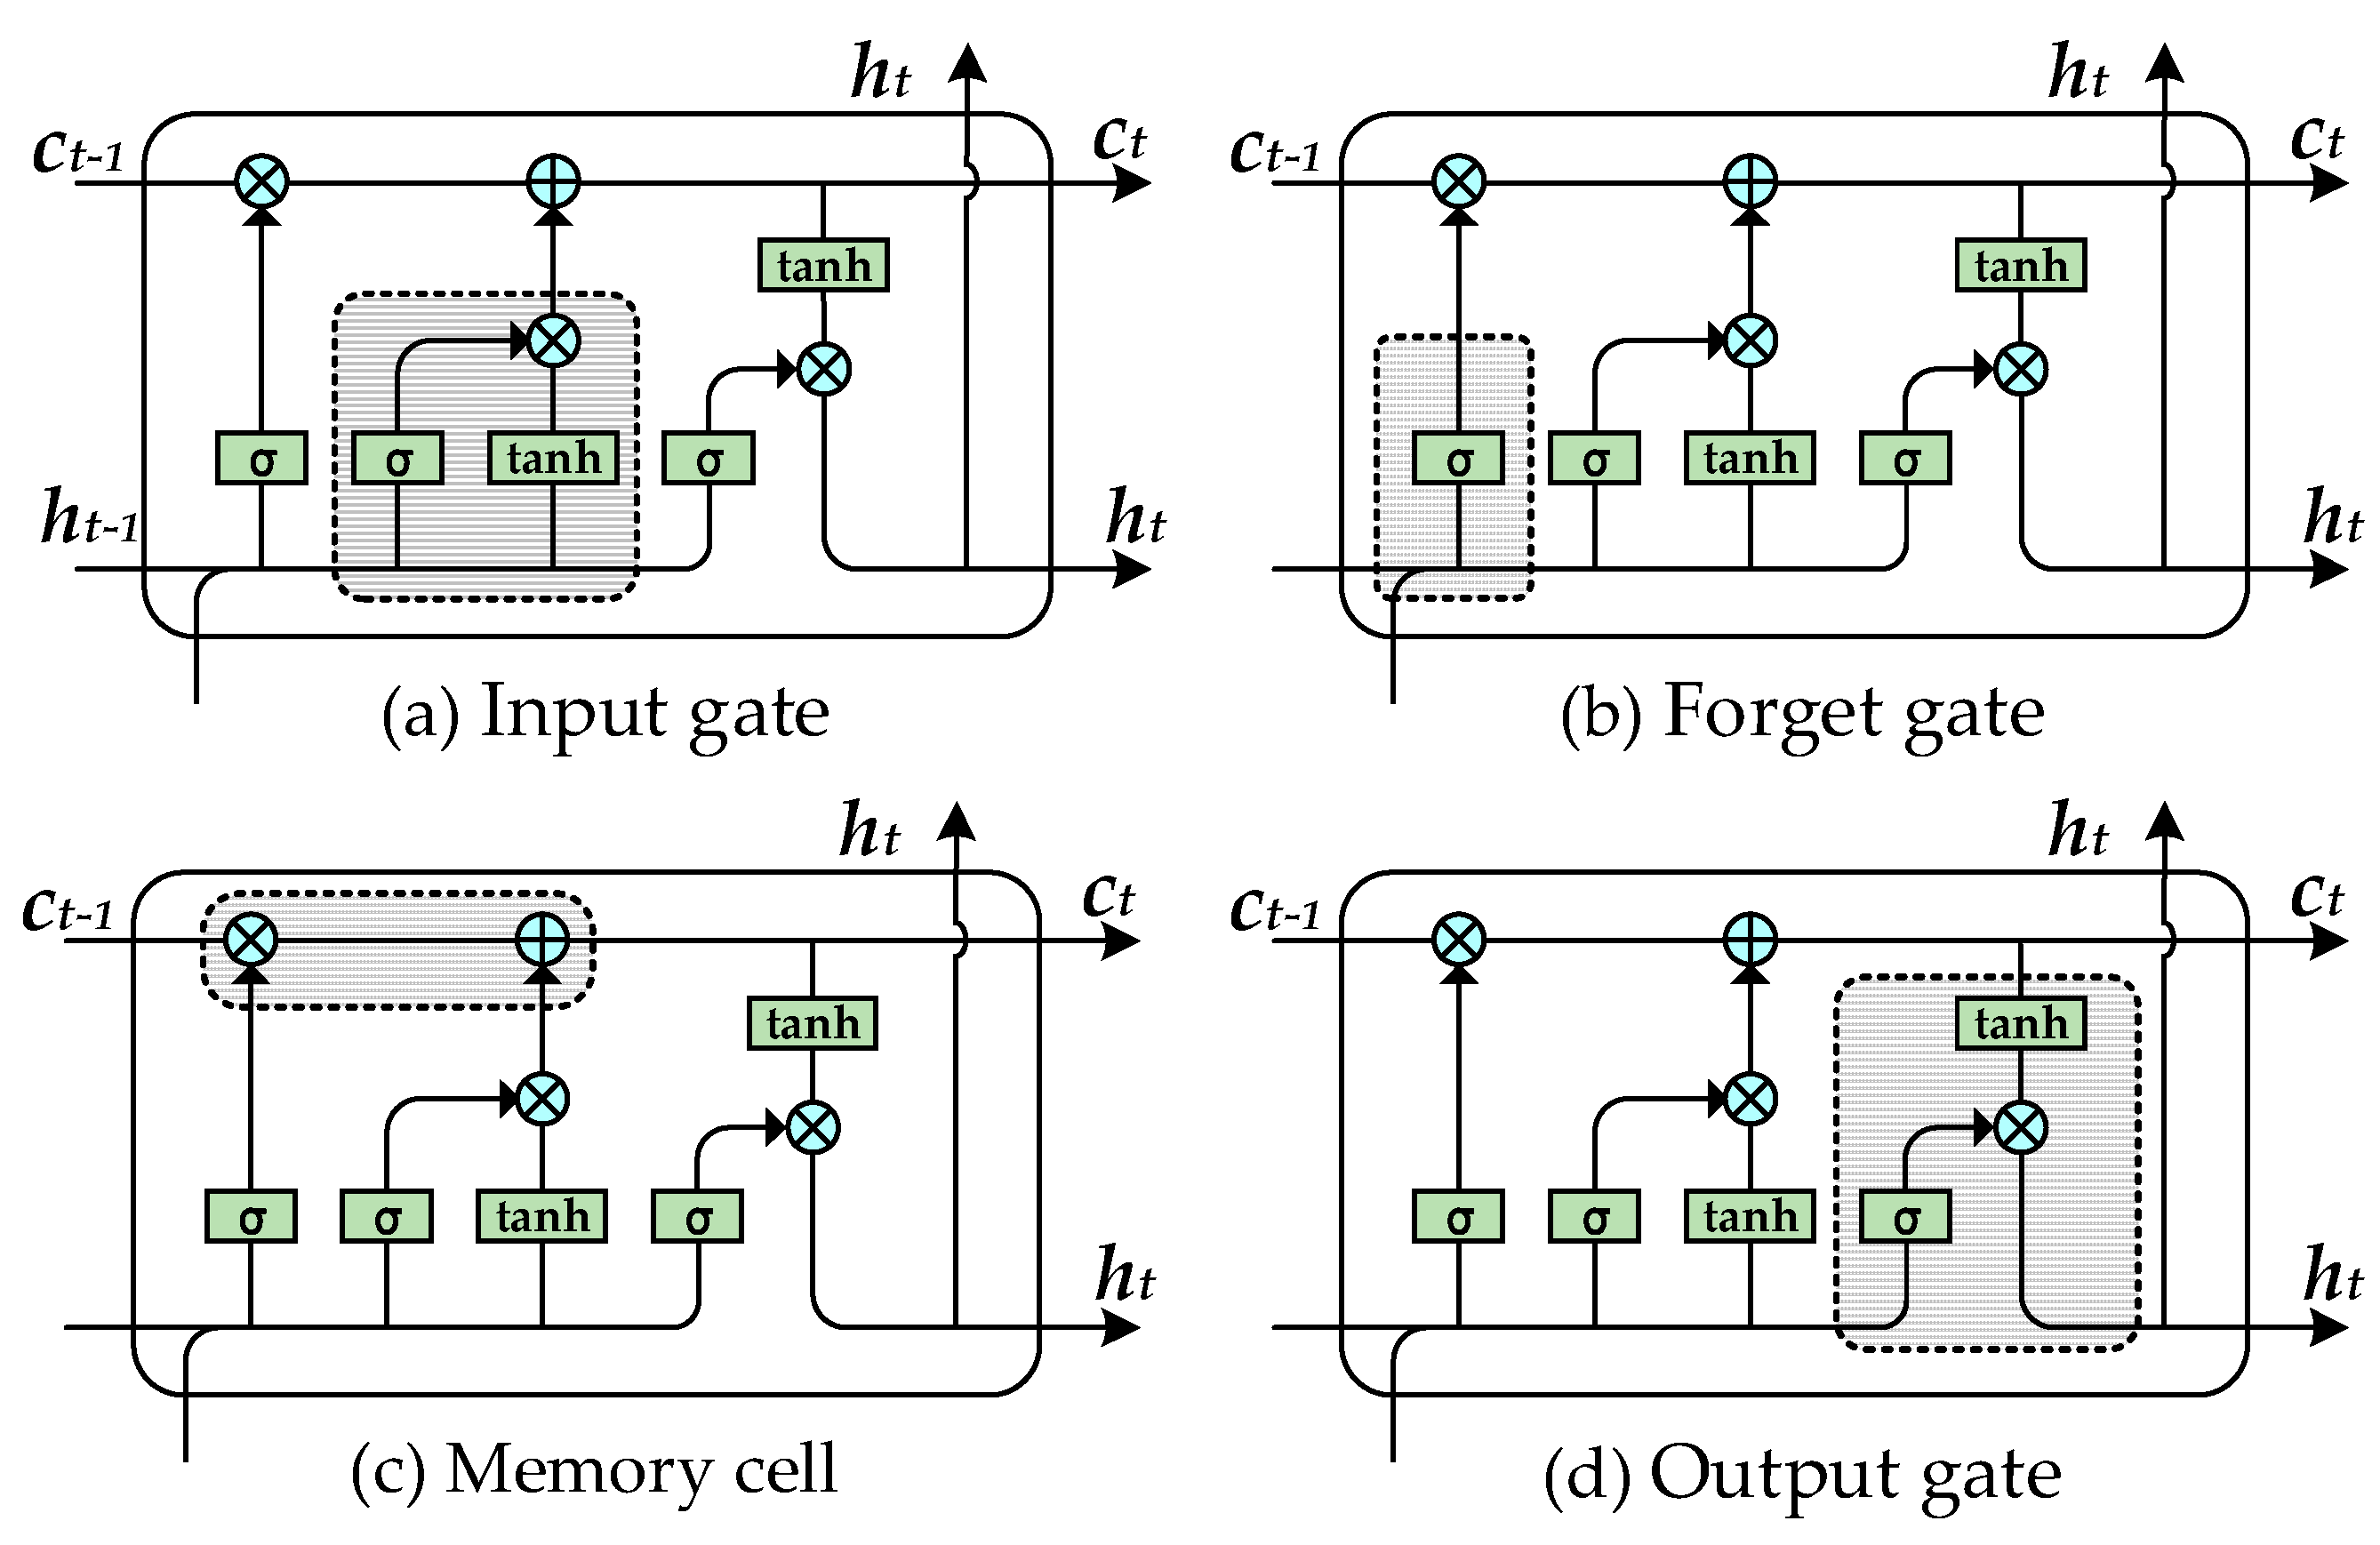
3.3.2. Long Short-Term Memory Network

Hochreater and Schmidhuber proposed the LSTM network structure in 1997 [39], and it has progressed with the mushroom growth of deep-learning technology in recent years. The LSTM module is mainly composed of four parts: Input gate, forget gate, memory cell, and output gate [40]. The output of the LSTM is simultaneously affected by the hidden-layer information and the memory cell. The hidden layer calculates the output in view of the current time input and the historical hidden-layer information, and sends the calculation result to the next layer and memory cell. The memory cell accepts these data and deletes the redundant saved information, then generates output values that act on the hidden layer. Long short-term memory achieves effective control of the state of the memory unit through three controllable gates, achieving its purpose of long-term memory and transmission of timing information. The calculation process of each part is specifically described below with reference to Figure 5.
The input gate realizes the control of the input information at the current time and determines how much information in the network input is saved to the memory unit at the current moment, as shown in Figure 5a. Then, the output is obtained with the following formula:
i t = σ ( w x i x t + w h i h t 1 + b i )
where it is the output of the input gate; xt and ht−1 are the current input and previous output of hidden layer; wxi and whi are weights of xt and ht−1, respectively; and bi is the bias of the input gate. Furthermore, σ is the sigmoid activation function and the calculation formula is adopted in this study as:
σ ( x ) = 1 1 + e x
where x is the independent variable of the activation function.
In addition, the input gate also outputs a temporary memory cell:
c t , = tanh ( w x c x t + w h c h t 1 + b c )
where wxc and whc are weights of input xt and ht−1, respectively; and bc is the bias of temporary memory cell.
The forget gate realizes the control of the memory cell at the previous moment, determines how many data are retained in the previous memory cell for the current memory cell, and is responsible for continuing to store long-term important information, as shown in Figure 5b. The output of the forget gate can be formulated as below:
f t = σ ( w x f x t + w h f h t 1 + b f )
where ft is the output of the forget gate; wxf and whf are the weights of input xt and ht−1, respectively; and bf is the bias of the forget gate.
The memory cell, as shown in Figure 5c, consists of two parts. The first part is the calculated value of the memory cell output to the forget gate at the previous moment, and the second part is the temporary memory cell which is input to the input gate at the current moment. Add the two parts to obtain the current time memory ct:
c t = f t c t 1 + i t c t
where ct−1 is the output value of the memory cell at the previous moment.
Long short-term memory combines the temporary c t and long-term memory ct−1 to generate a new memory cell. Through the forget gate control, the LSTM can retain important information of the long-term sequence, and through the input gate control, the non-important information at the current moment is prevented from entering the memory cell.
For the output gate, the outcome is determined by the input in the current moment, the output of the memory cell in the current moment, and the output of the hidden layer in the previous moment all together, as shown in Figure 5d. The calculation formulas are as follows:
o t = σ ( w x o x t + w h o h t 1 + b o )
h t = o t tanh ( c t )
where ot and ht are the output of the output gate and the current hidden layer, respectively; wxo and who are the weight of xt and ht−1, respectively; and bo is the bias of ot.
The input of the LSTM layer is a sample of alarm events. It can be represented as X = { x 1 , x 2 , , x n } , where xi is the distributed vector representation of monitoring alarm information, i = 1 , 2 , n , and n is the amount of monitoring alarm information contained in the alarm event sample (n = 5 in Figure 6). Since the monitoring alarm information in the event is arranged in chronological order, each vector represents an external input of the LSTM on a time step. The alarm event sample x is input into the LSTM to extract the overall characteristics of the entire monitoring alarm information sequence, and the hidden layer output at each time step is used as an input of the CNN to extract features between local information. The connection between the LSTM, the input layer, and the convolution layer is shown in Figure 6.

3.3.3. Convolutional Neural Network

Convolutional neural network was originally applied in the field of image processing [41], but with the development of NLP, it has gradually been applied to the field of text processing over recent years. A CNN generally includes an input layer, convolution layer, pooling layer, and fully connected layer. This paper uses a network structure based on reference [42], as shown in Figure 7.
For the input layer, input the matrix H n × k , into which the hidden layer output values of the alarm event samples are spliced at all times after being calculated by LSTM, where n is the time series length of the alarm event sample, that is, the amount of monitoring alarm information contained in the event (n = 7 in Figure 7), and k is the vector dimension of the LSTM hidden layer output value.
In the convolution layer, the convolution matrix W R h × k is convoluted with all sub-matrices of the same size in the input layer matrix H, leading to a convolution result:
r i = W H i : i + h 1
where Hi:i+h−1 is the sub-matrix formed by matrix H, from row i to i + h − 1, and the arithmetic symbol “.” is a point multiplication operation, that is, to multiply the elements of two matrices at the same position and then sum them. The results of each convolution after the non-linear operation are as follows:
c i = ReLU ( r i + b i )
where bi is the bias term and ReLU is the activation function. The calculating formula is as follows:
ReLU = ( 0 , x )
Arrange all the results in order to obtain the convolution layer feature vector c R n h + 1 . The total number of convolution operations is nh + 1.
For ordinary neural networks, there will be a parameter explosion when the number of model layers is too large. A convolutional neural network proposes a method of local perception and weight sharing, which enormously decreases the network parameter quantity and alleviates the model over-fitting problem, but also causes some data information to be lost during training. To avoid the loss of information features in the training process, this paper makes use of a multi-granularity convolution kernel to extract more related features hidden within local information. Different types of convolution windows are formed by changing the number of rows of the convolution matrix, and different types of convolution windows are represented in three colors (red, green, and yellow) in Figure 7. At the same time, the number of convolution windows in each category is set sufficiently, and the matrix element values of different convolution windows also vary. In Figure 7, the different shades of each color are used to represent the different convolution windows for each category.
The pooling layer reduces the feature vector by a certain downsampling rule, which improves the efficiency of the classifier calculation and further extracts the characteristics of the alarm event. In this paper, the max-pooling is used to take the maximum value of the feature vector c obtained by each convolution operation as the eigenvalue:
c max = max { c }
Coordinating the feature values extracted by all the different feature vectors through the pooling operation to form a pooled layer output vector q R v , where v = m k , m is the number of categories in the convolution window, and k is the number of convolution windows per type.
For the fully connected layer, the pooling layer vector q is input to the fully connected layer. The softmax classifier outputs the probability of belonging to each alarm event type, and selects the type with the highest probability as the identification result to the input monitoring alarm information:
p = soft max ( W q q + b q )
where Wq is the weight corresponding to event q, and bq is the bias corresponding to event q.

4. Results

4.1. Data Selection and Processing

For the sake of studying the application effect of the monitoring alarm event identification model constructed in this paper, a total of more than 14 million historical monitoring alarm information of a city grid company in 2016 and 2017 was used as a corpus, and nine types of alarm event samples were extracted for training and testing. The extracted alarm event samples contained all the monitoring alarm information in a fixed time window when the event occurred, so there was a small amount of information triggered by this event. The deep learning was robust and therefore had a certain fault tolerance for redundant information. Each type of alarm event sample was randomly divided into 10, of which nine were used as a training set and one was used as a test set. The type of alarm event and the number of samples of each type are shown in Table 2. The Word2vec model was used to convert monitoring alarm information into sentence vectors. The parameters of the model were set as shown in Table 3.

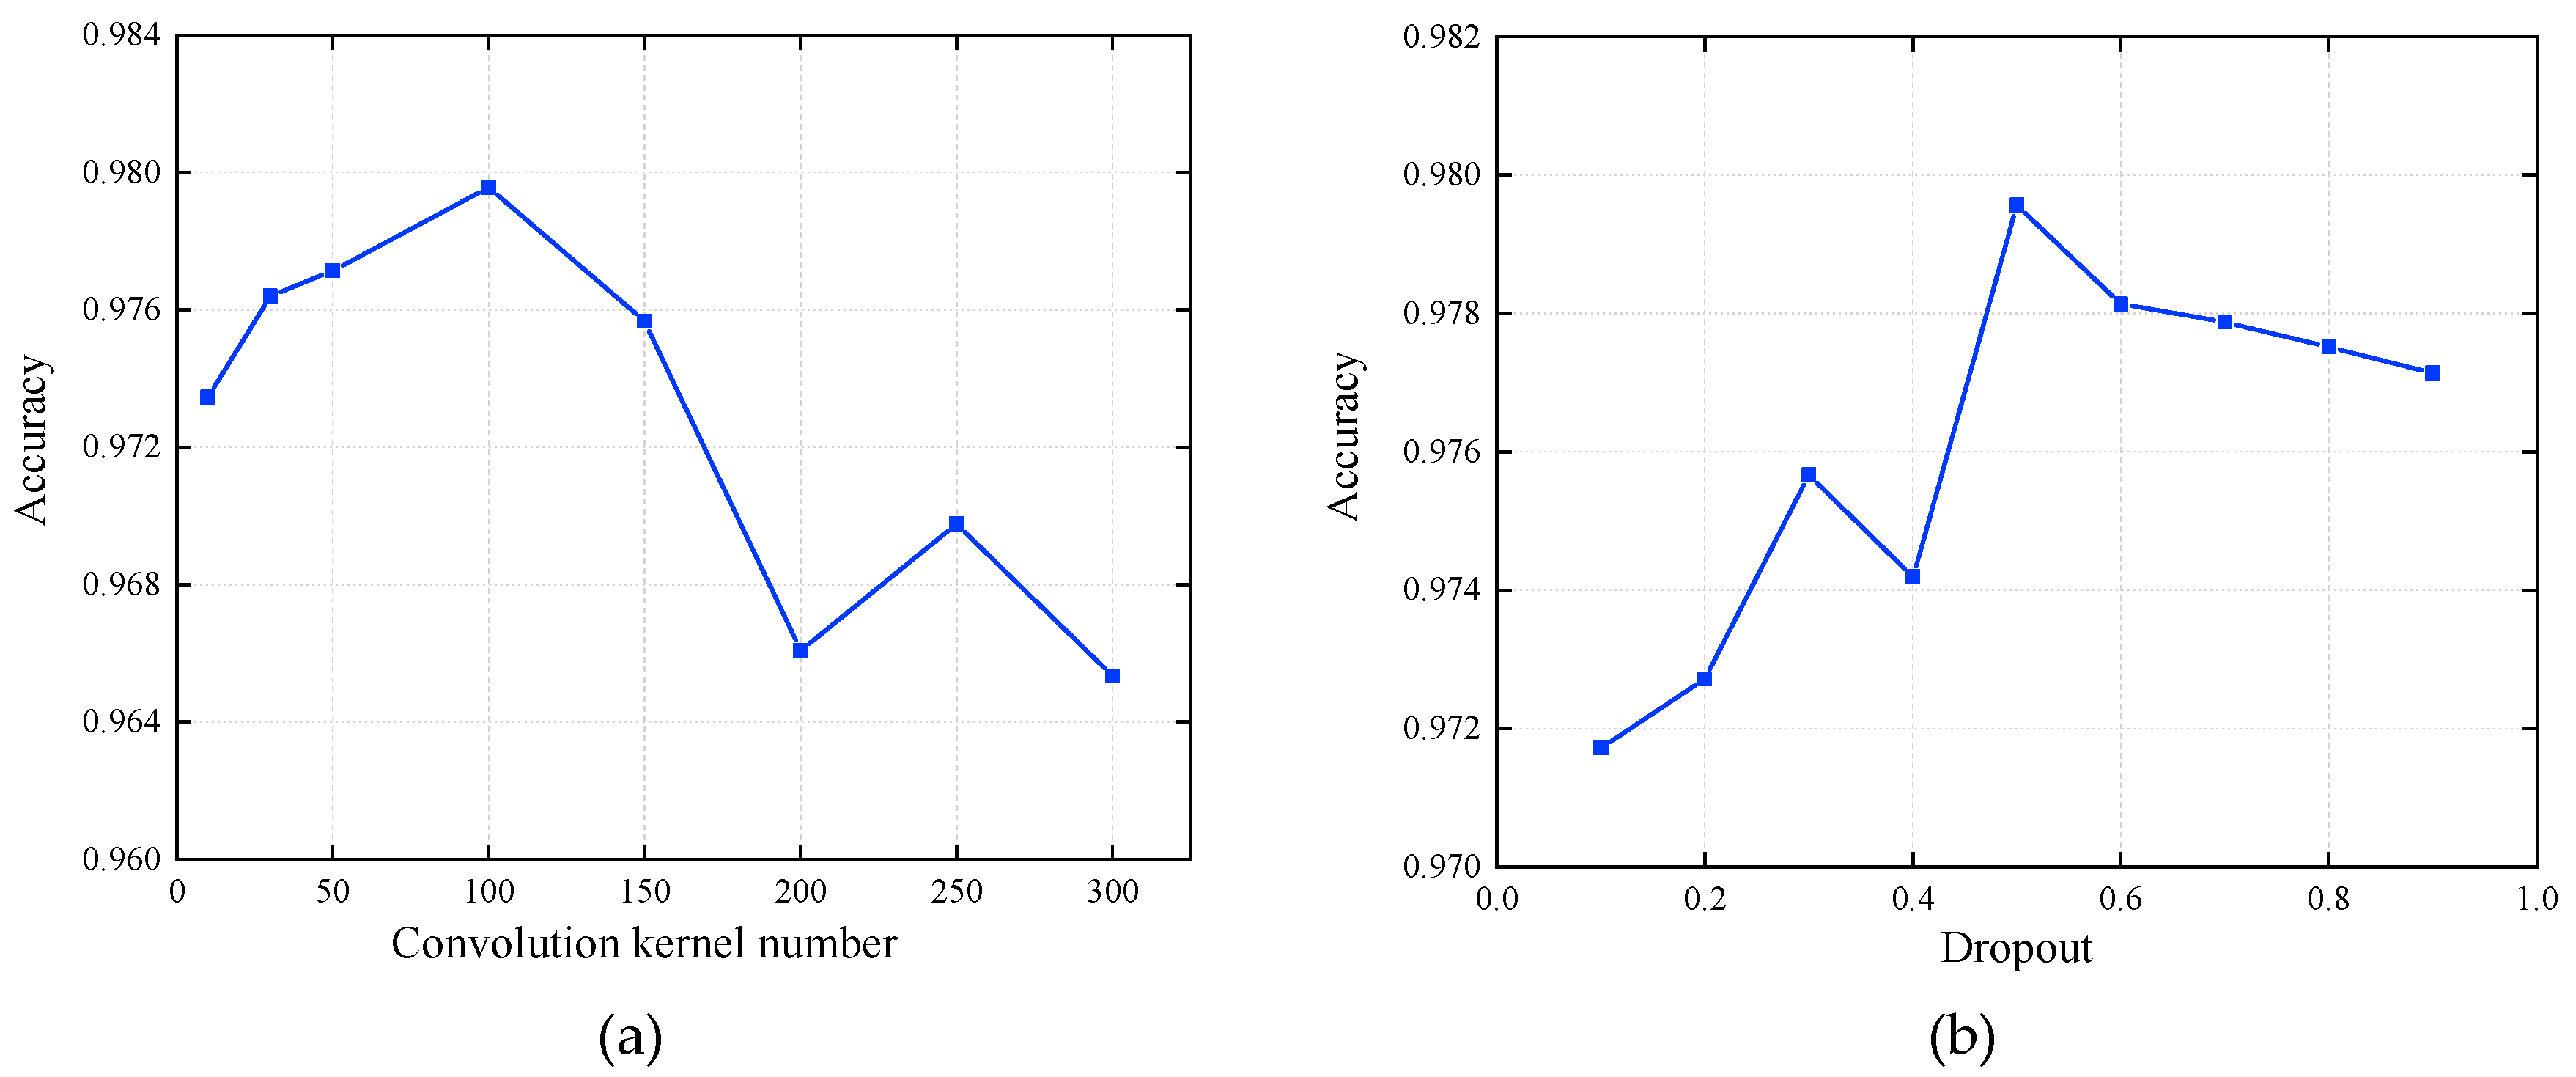
4.2. Model Parameter Setting

The input layer is a m × n dimension matrix, m is the maximum number of input alarm event samples containing monitoring alarm information, and n is the vector dimension of a single piece of monitoring alarm information and determines the matrix size as 137 × 300. The output layer is an alarm event class vector represented by one-hot coding. For various situations, it is still a matter for the solution to determine the optimal structure of different deep-learning models [43]. In this section, the structure of the identification model is defined by combining human experience with machine search. Firstly, the hidden unit number in the LSTM layer was determined. Compared to the identification accuracy when the hidden unit numbers are 64, 128, and 256, it was found that when the hidden unit number was 128, the identification accuracy was highest. By analyzing the text of monitoring alarm events, it was found that 2–3 pieces of adjacent monitoring alarm information have a local correlation characteristic. However, there might be interference from accompanying information, so three kinds of convolution kernels were set up with sizes of 3, 4, and 5. Then, experiments were carried out to observe the effect of the convolution kernel number, as shown in Figure 8a. When the number was 100, the identification accuracy reached the maximum. The ReLU, a significant unsaturated activation function, was used as the activation function of the convolution layer, according to its successful application in CNN [44] and deep belief networks (DBN) [45]. Dropout is a valid way of resolving the over-fitting problem, but it plays a small role in the convolution layer and it was only adopted in the fully connected layer in this paper. The effect of dropout on identification accuracy is shown in Figure 8b. As can be seen from the figure, when the dropout is 0.5, the model identification accuracy is highest. Adam [46] optimization algorithm was adopted to renew the model parameters.
The model of this paper was built in Tensorflow 1.4.0 [47] and Keras 2.2.4 [48] in the Python 3.6.5 environment. The entire training and testing process was performed on a Windows 10 system computer with an Intel Core i7-8550U 2.0 GHz processor and 8.0 GB RAM. The final parameter settings were determined by several experiments as shown in Table 4.
In order to illustrate the use of the Word2vec-based alarm information vectorization model in this paper, we can better express the semantic features in the alarm information text and heighten the accuracy of model identification. This paper designed two sets of controlled experiments: Changing the generation method of the initial input vector of the model and whether the alarm vector was updated in the model training. The parameters of each control model are set as shown in Table 5.
In addition, in order to validate the identification effect of the LSTM-CNN model proposed in this paper, several single learning models and typical machine learning models were selected for comparative verification. The deep-learning model selected CNN, LSTM, and bidirectional long short-term memory (Bi-LSTM). The text of the alarm information was represented by the Word2vec vectorization model. The machine-learning model selected the support vector machine (SVM) [49], logistic regression (LR), and random forest (RF) [50]. The text representation of the alarm information mainly used the term frequency-inverse document frequency (TF-IDF) [51].

4.3. Criteria for Identification Result

The confusion matrix divides all events into four categories according to their actual attribution and identification attribution. Accuracy, Precision, Recall, and F1-score are employed to measure the identification performance of the model. The two-class confusion matrix is shown in Table 6.
The formulas for calculating the four indicators are as follows:
Accuracy = T P + T N T P + F N + F P + T N
Precision = T P T P + F P
Recall = T P T P + F N
F 1 - score = 2 × P × R P + R
where Accuracy indicates the proportion of the event that identifies the correct event from all events; Precision indicates the proportion of the sample that is recognized by the model as the event that is actually the category; Recall indicates the actual prediction for the sample of the event, and is also the proportion of the category; and F1-score is a composite average of the accuracy rate and the recall rate. The range of values of all four is [0, 1], and the closer the value is to 1, the better the identification effect of the model is.

4.4. Discussion of Results

In practical application, the training of corpus word vectors and sentence vectors can be done offline and the result can be saved in advance and be recalled directly when being identified, without repeated training. Consequently, the training time and test time mentioned in this paper are only the training and test time of various identification models. The identification results of the model and the comparison model are shown in Table 7, and the identification results compared to the other six models are shown in Table 8.
From model A in Table 7, compared with the randomly generated alarm information input vector, the advance training history monitoring alarm information corpus generates the monitoring alarm information vector and can obviously increase the accuracy of the model identification, indicating that the Word2vec model can better express the semantic features of the alarm message text. From model B in Table 7, compared with the initial training mode in which the initial alarm information vector was fixed during the training process, the iterative fine-tuning of the model during the training process could improve the identification accuracy rate of the model to some extent. It indicates that the identification model had a self-learning ability. With the expansion and update of the sample library, the association between the alarm information is further explored, the parameter structure was adjusted and improved, and the identification ability was enhanced. Although the training of the alarm information vector and the iterative update in the training process of the identification model took a certain amount of time, the model training of the large sample size was generally offline training, and did not occupy the time of the online test, so it did not affect the identification speed of the model in practical engineering.
From Table 8, the accuracy of the CNN model in the four deep-learning models was at least 92.69%, and the accuracy of the random forest model in the three machine-learning models was 91.18%. For the identification of alarm information in this paper, the deep-learning model worked better than the machine-learning model. For a specific single model, the model of this paper was better than other models in all indicators. The accuracy of the LSTM model was 96.61%, and the accuracy of the CNN model was 92.69%. The accuracy of the model in this paper was 98.30%, which is 1.69% and 5.61% higher than the other two. The accuracy, recall, and F1-score were 1.68%, 1.69%, and 2.05% higher than the LSTM model, respectively. Compared with the CNN model, it was 5.58%, 5.61%, and 6%, respectively. At the same time, the Bi-LSTM model with the highest identification accuracy in other models reached 96.75%, and the model was still 1.55% higher than this.
According to the principle of the model in Section 3.3, taking the “Instantaneous fault (successful reclosure)” in Table 1 as an example, the advantages of the model in this paper are analyzed concretely. The event triggered 11 monitoring alarm messages, each of which was taken as a time step to extract the temporal characteristics of the whole event by LSTM. Secondly, local information association features were extracted by CNN. When an event occurred, part of the information played a major role in the event identification result, and other information was an accompanying signal of interference. For example, “reclosing action”, “switch closing”, and “reclosing return” were three signals that illustrate the characteristic of “reclosing work” together, but there was an accompanying signal of “spring does not store energy”. If the convolution window size is 3, the main feature cannot be extracted. Therefore, this paper set up convolution windows of different sizes to more fully extract the correlation features between local monitoring alarm information. However, single LSTM, Bi-LSTM, or CNN cannot extract global temporal features and local correlation features comprehensively, so the LSTM-CNN model had a higher identification accuracy.
In the training time, the model in this paper took the longest. On the one hand, because the model combines LSTM and CNN, the network structure was more complex than a single deep-learning model. There were more network training parameters, and the time was about twice that of the other two. On the other hand, the semantic expression of alarm information in LSTM-CNN model was expressed by 300-dimensional vectors and updated iteratively in the training process. The semantic expression of the machine-learning model was TF-IDF, which only required statistical analysis. However, the time of testing 1356 alarm events in LSTM-CNN model was 6.52 s, which is much faster than manual identification.
In order to better illustrate that the model has a good identification effect for each type of alarm event extracted, Table 9, Table 10 and Table 11 show the accuracy, recall, and F1-score of each model for each type of alarm event, respectively.
From Table 9, eight of the nine types of fault have the highest accuracy model for this model. In the case of permanent faults (reclosure failure), it was lower than Bi-LSTM and LSTM, with a difference of 1.02% and 0.74%, respectively. From Table 10, the recall of the model was only 0.6% lower than that of other models in the case of capacitor fault. Due to the sample size of the bus fault being less than other types, the extraction characteristics in the training are not completely caused by the category of bus faults, which is significantly lower than other categories. From Table 11, the F1-score of the model was the highest among the nine types of fault, and the difference between the categories is small, indicating that the model has good identification effect for each type of fault and that there are no inter-category identification imbalances.

5. Conclusions

In view of the current situation of low monitoring efficiency and a high false positive rate, this paper proposed a monitoring alarm event identification method based on NLP and LSTM-CNN. The alarm events have the characteristics of professional and mixed texts and numbers of the professional monitoring alarm information, have a large difference in the amount of information, and information arranged in sequence of time series. Combined with the Word2vec model, LSTM-CNN was used to construct a classification model capable of autonomously identifying grid monitoring alarm events based on the advantages of distributed vector representation. Taking the actual engineering data as a sample, through a comprehensive comparison with single deep-learning models and traditional machine-learning models, the significant advantages of the method in identification accuracy were demonstrated, which provided a novel idea for the development of artificial intelligence technology in the field of power grid monitoring.
The method proposed in this paper needs to learn rules and experience based on sufficient samples and cannot replace the mechanism of occurrence and physical modeling after event identification. Therefore, rule-based processing methods can be used for mechanism analysis and events with a small sample size. The organic combination of the two can form a complete intelligent alarm system.

Author Contributions

Z.B. and G.S. conceived and designed the experiments and wrote the paper; H.Z. and Z.W. performed the experiments; M.Z. analyzed the data; P.S. and Y.L. contributed reagents/materials/analysis tools.

Funding

The research is supported by Science and Technology project of State Grid Corporation of China (Research and application of event processing technology for power grid monitoring business based on machine learning (SGJSNJ00FCJS1800810)).

Conflicts of Interest

The authors declare no conflict of interest.

References

  1. Hor, C.L.; Crossley, P.A.; Watson, S.J. Building knowledge for substation-based decision support using rough sets. IEEE Trans. Power Deliv. 2007, 22, 1372–1379. [Google Scholar] [CrossRef]
  2. Rawat, S.; Patel, A.; Celestino, J.; Dos Santos, A.L.M. A dominance based rough set classification system for fault diagnosis in electrical smart grid environments. Artif. Intell. Rev. 2016, 46, 389–411. [Google Scholar] [CrossRef]
  3. Luo, X.; Kezunovic, M. Implementing fuzzy reasoning Petri-nets for fault section estimation. IEEE Trans. Power Deliv. 2008, 23, 676–685. [Google Scholar] [CrossRef]
  4. Liu, S.H.; Chen, Q.; Gao, Z.J. Power system fault diagnosis based on protection coordination and Petri net theory. In Proceedings of the 2010 Asia-Pacific Power and Energy Engineering Conference (APPEEC), Chengdu, China, 28–31 March 2010. [Google Scholar]
  5. Zhang, X.; Yue, S.; Zha, X.B. Method of power grid fault diagnosis using intuitionistic fuzzy Petri nets. IET Gener. Transm. Distrib. 2018, 12, 295–302. [Google Scholar] [CrossRef]
  6. Zhu, Y.L.; Huo, L.M.; Lu, J.L. Bayesian networks-based approach for power systems fault diagnosis. IEEE Trans. Power Deliv. 2006, 21, 634–639. [Google Scholar]
  7. Li, G.; Wu, H.H.; Wang, F. Bayesian network approach based on fault isolation for power system fault diagnosis. In Proceedings of the 2014 International Conference on Power System Technology (POWERCON), Chengdu, China, 20–22 October 2014; pp. 601–606. [Google Scholar]
  8. Lin, S.; Chen, X.Y.; Wang, Q. Fault diagnosis model based on Bayesian network considering information uncertainty and its application in traction power supply system. IEEJ Trans. Electr. Electron. Eng. 2018, 13, 671–680. [Google Scholar] [CrossRef]
  9. Min, S.-W.; Sohn, J.M.; Park, J.K.; Kim, K.H. Adaptive fault section estimation using matrix representation with fuzzy relations. IEEE Trans. Power Syst. 2004, 19, 842–848. [Google Scholar] [CrossRef]
  10. Chen, W.H. Online Fault Diagnosis for Power Transmission Networks Using Fuzzy Digraph Models. IEEE Trans. Power Deliv. 2012, 27, 688–698. [Google Scholar] [CrossRef]
  11. Zang, H.X.; Cheng, L.L.; Ding, T.; Cheung, K.W.; Wang, M.M.; Wei, Z.N.; Sun, G.Q. Estimation and validation of daily global solar radiation by day of the year-based models for different climates in China. Renew. Energy 2019, 135, 984–1003. [Google Scholar] [CrossRef]
  12. Lee, H.J.; Park, D.Y.; Ahn, B.S.; Park, Y.M.; Park, J.K.; Venkata, S.S. A fuzzy expert system for the integrated fault diagnosis. IEEE Trans. Power Deliv. 2000, 15, 833–838. [Google Scholar]
  13. Watada, J.; Tan, S.C.; Matsumoto, Y.; Vasant, P. Rough set-based text mining from a large data repository of experts diagnoses for power systems. In Proceedings of the 9th KES International Conference on Intelligent Decision Technologies (KES-IDT), Vilamoura, Portugal, 21–23 June 2017; pp. 136–144. [Google Scholar]
  14. Lee, H.J.; Ahn, B.S.; Park, Y.M. A fault diagnosis expert system for distribution substations. IEEE Trans. Power Deliv. 2000, 15, 92–97. [Google Scholar] [Green Version]
  15. Song, H.Z.; Dong, M.; Han, R.J.; Wen, F.S.; Salam, M.A.; Chen, X.G.; Fan, H.; Ye, J. Stochastic programming-based fault diagnosis in power systems under imperfect and incomplete information. Energies 2018, 11, 2565. [Google Scholar] [CrossRef]
  16. Xu, B.; Yin, X.G.; Wu, D.L.; Pang, S.; Wang, Y.K. An analytic method for power system fault diagnosis employing topology description. Energies 2019, 12, 1770. [Google Scholar] [CrossRef]
  17. Guo, W.X.; Wen, F.S.; Ledwich, G. An analytic model for fault diagnosis in power systems considering malfunctions of protective relays and circuit breakers. IEEE Trans. Power Deliv. 2010, 25, 1393–1401. [Google Scholar] [CrossRef]
  18. Korkali, M.; Abur, A. Optimal deployment of wide-area synchronized measurements for fault-location observability. IEEE Trans. Power Syst. 2013, 28, 482–489. [Google Scholar] [CrossRef]
  19. Pradhan, K.; Kundu, P. Online identification of protection element failure using wide area measurements. IET Gener. Transm. Distrib. 2015, 9, 115–123. [Google Scholar]
  20. Fan, W.; Liao, Y. Wide area measurements based fault detection and location method for transmission lines. Prot. Control Mod. Power Syst. 2019, 4, 53–64. [Google Scholar] [CrossRef]
  21. Cardoso, G., Jr.; Rolim, J.G.; Zürn, H.H. Application of neural-network modules to electric power system fault section estimation. IEEE Trans. Power Deliv. 2004, 19, 1034–1041. [Google Scholar] [CrossRef]
  22. Novelo, A.F.; Cucarella, E.Q.; Moreno, E.G.; Anglada, F.M. Fault diagnosis of electric transmission lines using modular neural networks. IEEE Lat. Am. Trans. 2016, 14, 3663–3668. [Google Scholar] [CrossRef]
  23. Souza, J.C.; Filho, M.B.; Freund, R.S. A Hybrid Intelligent System for Alarm Processing in Power Distribution Substations. Int. J. Hybrid Intell. Syst. 2010, 7, 125–136. [Google Scholar] [CrossRef]
  24. Julia, H.; Christopher, D.M. Advances in natural language processing. Science 2015, 349, 261–266. [Google Scholar]
  25. Qiu, J.; Wang, H.F.; Ying, G.L.; Zhang, B.; Zou, G.P.; He, B.T. Text mining technique and application of lifecycle condition assessment for circuit breaker. Autom. Electr. Power Syst. 2016, 40, 107–112. [Google Scholar]
  26. Zheng, J.; Dagnino, A. An initial study of predictive machine learning analytics on large volumes of historical data for power system applications. In Proceedings of the 2014 IEEE International Conference on Big Data, Washington, DC, USA, 27–30 October 2014; pp. 952–959. [Google Scholar]
  27. Sun, H.F.; Wang, Z.Y.; Wang, J.H.; Huang, Z.; Carrington, N.; Liao, J.X. Data-driven power outage detection by social sensors. IEEE Trans. Smart Grid 2016, 7, 2516–2524. [Google Scholar] [CrossRef]
  28. Liu, Z.Q.; Wang, H.F.; Cao, J.; Qiu, J. A classification model of power equipment defect texts based on convolutional neural network. Power Syst. Technol. 2018, 42, 644–650. [Google Scholar]
  29. Lin, B.S.; Wang, C.M.; Yu, C.N. The establishment of human-computer interaction based on Word2Vec. In Proceedings of the 2017 IEEE International Conference on Mechatronics and Automation, Takamatsu, Japan, 6–9 August 2017; pp. 1698–1703. [Google Scholar]
  30. Hinton, G.E. Learning distributed representations of concepts. In Proceedings of the Eighth Annual Conference of the Cognitive Science Society, Amherst, MA, USA, 15–17 August 1986; pp. 1–12. [Google Scholar]
  31. LeCun, Y.; Bengio, Y.; Hinton, G.E. Deep learning. Nature 2015, 521, 436–444. [Google Scholar] [CrossRef] [PubMed]
  32. Mikolov, T.; Chen, K.; Corrado, G.; Dean, J. Efficient estimation of word representations in vector space. arXiv 2013, arXiv:1301.3781. [Google Scholar]
  33. Mikolov, T.; Sutskever, I.; Chen, K.; Corrado, G.; Dean, J. Distributed representations of words and phrases and their compositionality. In Proceedings of the 27th Annual Conference on Neural Information Processing Systems (NIPS), Lake Tahoe, NV, USA, 5–10 December 2013. [Google Scholar]
  34. Chemali, E.; Kollmeyer, P.J.; Preindl, M.; Ahmed, R.; Emadi, A. Long Short-Term Memory Networks for Accurate State-of-Charge Estimation of Li-ion Batteries. IEEE Trans. Ind. Electron. 2018, 65, 6730–6739. [Google Scholar] [CrossRef]
  35. Guo, D.S.; Zhang, Y.N. Novel recurrent neural network for time-varying problems solving. IEEE Comput. Intell. Mag. 2012, 7, 61–65. [Google Scholar] [CrossRef]
  36. Sundermeyer, M.; Ney, H.; Schluter, R. From feedforward to recurrent LSTM neural networks for language modeling. IEEE Trans. Audio Speech Lang. Process. 2015, 23, 517–529. [Google Scholar] [CrossRef]
  37. Kong, W.C.; Dong, Z.Y.; Jia, Y.W.; Hill, D.J.; Xu, Y.; Zhang, Y. Short-term residential load forecasting based on LSTM recurrent neural network. IEEE Trans. Smart Grid 2019, 10, 841–851. [Google Scholar] [CrossRef]
  38. Zhu, Q.M.; Chen, J.F.; Zhu, L.; Duan, X.Z.; Liu, Y.L. Wind speed prediction with spatio—Temporal correlation: A deep learning approach. Energies 2018, 11, 705. [Google Scholar] [CrossRef]
  39. Hochreiter, S.; Schmidhuber, J. Long short-term memory. Neural Comput. 1997, 9, 1735–1780. [Google Scholar] [CrossRef] [PubMed]
  40. Cheng, L.L.; Zang, H.X.; Ding, T.; Sun, R.; Wang, M.M.; Wei, Z.N.; Sun, G.Q. Ensemble recurrent neural network based probabilistic wind speed forecasting approach. Energies 2018, 11, 1958. [Google Scholar] [CrossRef]
  41. Lecun, Y.; Bottou, L.; Bengio, Y.; Haffner, P. Gradient-based learning applied to document recognition. Proc. IEEE 1998, 86, 2278–2323. [Google Scholar] [CrossRef]
  42. Kim, Y. Convolutional neural networks for sentence classification. In Proceedings of the 2014 Conference on Empirical Methods in Natural Language Processing (EMNLP), Doha, Qatar, 25–29 October 2014; pp. 1746–1751. [Google Scholar]
  43. Zhang, C.Y.; Chen, C.L.P.; Gan, M.; Chen, L. Predictive Deep Boltzmann Machine for Multiperiod Wind Speed Forecasting. IEEE Trans. Sustain. Energy 2015, 6, 1416–1425. [Google Scholar] [CrossRef]
  44. Zang, H.X.; Cheng, L.L.; Ding, T.; Cheung, K.W.; Liang, Z.; Wei, Z.N.; Sun, G.Q. Hybrid method for short-term photovoltaic power forecasting based on deep convolutional neural network. IET Gener. Transm. Distrib. 2018, 12, 4557–4567. [Google Scholar] [CrossRef]
  45. Glorot, X.; Bordes, A.; Bengio, Y. Deep sparse rectifier neural networks. In Proceedings of the Fourteenth International Conference on Artificial Intelligence and Statistics, Ft. Lauderdale, FL, USA, 11–13 April 2011; Volume 15, pp. 315–323. [Google Scholar]
  46. Kingma, D.; Ba, J. Adam: A Method for Stochastic Optimization. In Proceedings of the 3rd International Conference for Learning Representations, San Diego, CA, USA, 7–9 May 2015. [Google Scholar]
  47. Wongsuphasawat, K.; Smilkov, D.; Wexler, J.; Wilson, J.; Mané, D.; Fritz, D.; Krishnan, D.; Viégas, F.B.; Wattenberg, M. Visualizing dataflow graphs of deep learning models in Tensorflow. IEEE Trans. Vis. Comput. Graph. 2018, 24, 1–12. [Google Scholar] [CrossRef]
  48. Aguiam, D.E.; Silva, A.; Guimarais, L.; Carvalho, P.J.; Conway, G.D.; Goncalves, B.; Meneses, L.; Noterdaeme, J.M.; Santos, J.M.; Tuccillo, A.A.; et al. Estimation of X-mode reflectometry first fringe frequency using neural networks. IEEE Trans. Plasma Sci. 2018, 46, 1323–1330. [Google Scholar] [CrossRef]
  49. Hou, K.Y.; Shao, G.H.; Wang, H.M.; Zheng, L.; Zhang, Q.; Wu, S.; Hu, W. Research on practical power system stability analysis algorithm based on modified SVM. Prot. Control Mod. Power Syst. 2018, 3, 119–125. [Google Scholar] [CrossRef]
  50. Kiranmai, S.A.; Laxmi, A.J. Data mining for classification of power quality problems using WEKA and the effect of attributes on classification accuracy. Prot. Control Mod. Power Syst. 2018, 3, 303–314. [Google Scholar] [CrossRef]
  51. Jing, L.P.; Huang, H.K.; Shi, H.B. Improved feature selection approach TFIDF in text mining. In Proceedings of the 2002 International Conference on Machine Learning and Cybernetics, Beijing, China, 4–5 November 2002; pp. 944–946. [Google Scholar]
Figure 1. Example of alarm information.
Energies 12 03258 g001
Figure 2. Grid monitoring alarm event identification process.
Energies 12 03258 g002
Figure 3. Training framework based on continuous bag-of-words (CBOW) model.
Energies 12 03258 g003
Figure 4. Structure of combined long short-term memory and convolutional neural network (LSTM-CNN) identification model.
Energies 12 03258 g004
Figure 5. Structure of a long short-term memory (LSTM) block.
Energies 12 03258 g005
Figure 6. Long short-term memory, input layer, and convolution layer connection.
Energies 12 03258 g006
Figure 7. Structure of convolutional neural network (CNN).
Energies 12 03258 g007
Figure 8. Effect of parameters on identification accuracy: (a) Convolution kernel number and (b) dropout.
Energies 12 03258 g008
Table 1. Example of an alarm event sample.
Alarm Event TypeRelated Alarm Information
Instantaneous fault (successful reclosure)XX City XX substation 124 over-current protection II section action
XX City XX substation 124 switch control loop disconnection action
XX City XX substation 124 over-current protection II section return
XX City XX substation 124 switch control loop disconnection reset
XX City XX substation 10 kV XX line 124 switch opening
XX City XX substation 124 accident total action
XX City XX substation 124 protection reclosing action
XX City XX change 10 kV XX line 124 switch closing
XX City XX substation 124 protection reclosing return
XX City XX substation 124 switch spring does not store energy
XX City XX substation 124 switch motor pressure action
Table 2. Number of alarm event samples.
Alarm Event TypeTraining SetTest SetTotal
Bus fault71980
Instantaneous fault (successful reclosure)42845014785
Permanent fault (unsuccessful reclosure)29592963255
Permanent fault (reclosure failure)24132852698
Main transformer electrical fault31329342
Main transformer grave gas fault23826264
Main transformer gas fault in voltage regulation 14013153
Capacitor fault14401661606
Station/grounding transformer fault34031371
Total12,198135613,554
Table 3. Key parameters of the Word2vec model.
Model ParameterParameter MeaningParameter Value
Training algorithm0: CBOW algorithm 0
1: Skip-gram algorithm
Window sizeThe maximum distance between the current word and the predicted word in a piece of information5
Minimum word frequencyWords whose word frequency is less than the number of parameter values will be discarded0
Training acceleration strategy 0: negative sampling1
1: hierarchical softmax
Word vector dimensionVector dimension of each word300
Table 4. Parameters of combined model LSTM-CNN.
Network LayerParameter NameParameter Value
LSTMAlarm information vector dimension300
Unit number128
CNNConvolution kernel size 13
Convolution kernel size 24
Convolution kernel size 35
Convolution kernel number100
Activation functionReLU
DenseDropout0.5
Activation functionsoftmax
Output dimension9
Table 5. Comparison model parameters.
Model ParameterModel of This PaperContrast Model AContrast Model B
If the input alarm info vector is randomly generatedNoYesNo
If the input alarm info vector is iteratively updatedYesNoNo
Table 6. Confusion matrix in event identification.
EventRecognized as This Type of EventRecognized as Other Type of Event
Actually for this type of eventTP (true positive)FN (false negative)
Actually for other type of eventFP (false positive)TN (true negative)
Table 7. Identification results of each comparison model.
Model Accuracy (%)Training Time (s)Test Time (s)
Model of this paper 98.301042.576.52
Contrast model A76.841054.766.49
Contrast model B97.08806.626.30
Table 8. Comparison of identification results of this model with other models.
Model Accuracy (%)Precision (%)Recall (%)F1-Score (%)Training Time (s)Test Time (s)
LSTM-CNN98.3098.3298.3098.661042.576.52
Bi-LSTM96.7596.7996.7696.75582.472.66
LSTM96.6196.6496.6196.61516.193.28
CNN92.6992.7492.6392.66539.082.74
SVM88.2088.1788.2088.15220.8221.78
RF91.1891.5291.0891.1821.880.064
LR86.2186.3386.2186.253.620.001
Table 9. Comparison of accuracy of this model with other models.
Event TypeLSTM-CNNBi-LSTMLSTMCNNRFSVMLR
Bus fault100.0088.8988.89100.0085.7187.5077.78
Instantaneous fault (successful reclosure)97.8596.0996.6092.4893.1489.8286.87
Permanent fault (unsuccessful reclosure)98.9796.2193.3383.8284.0678.0874.01
Permanent fault (reclosure failure)97.9098.9298.6497.5395.6290.1794.20
Main transformer electrical fault96.6787.5096.5590.3265.8586.6777.42
Main transformer grave gas fault96.3095.8392.8696.0095.6595.8384.62
Main transformer gas fault in voltage regulation 100.0092.31100.00100.0071.4390.9185.71
Capacitor fault99.4098.8197.6599.3997.0194.3294.12
Station/grounding transformer fault100.0096.88100.0096.88100.00100.0093.55
Table 10. Comparison of recall of this model with other models.
Event TypeLSTM-CNNBi-LSTMLSTMCNNRFSVMLR
Bus fault88.8988.8988.8977.7887.5077.7877.78
Instantaneous fault (successful reclosure)98.8098.0096.4190.8289.8288.0285.83
Permanent fault (unsuccessful reclosure)97.3094.2694.6087.5078.0877.0376.01
Permanent fault (reclosure failure)97.9096.1497.1996.8489.8693.3391.23
Main transformer electrical fault100.0096.5596.5596.5586.6789.6682.76
Main transformer grave gas fault100.0088.46100.0092.31100.0088.4684.62
Main transformer gas fault in voltage regulation 100.0092.3184.6292.3190.9176.9292.31
Capacitor fault99.40100.00100.0098.8094.32100.0096.39
Station/grounding transformer fault100.00100.00100.00100.00100.0093.5593.55
Table 11. Comparison of F1-score of this model with other models.
Event TypeLSTM-CNNBi-LSTMLSTMCNNRFSVMLR
Bus fault94.1288.8988.8987.5075.0082.3577.78
Instantaneous fault (successful reclosure)98.8197.0496.5091.6491.2488.9186.35
Permanent fault (unsuccessful reclosure)98.1395.2293.9685.6287.3477.5575.00
Permanent fault (reclosure failure)98.7697.5198.4097.1893.7491.7292.69
Main transformer electrical fault98.3191.8096.5593.3377.1488.1480.00
Main transformer grave gas fault98.1192.0096.3094.1289.8092.0084.62
Main transformer gas fault in voltage regulation 100.0092.3191.6796.0074.0783.3388.89
Capacitor fault99.4099.4098.8199.0997.3097.0895.24
Station/grounding transformer fault100.0098.41100.0098.4196.6796.6793.55

