Article

A Downhole Hydrocyclone for the Recovery of Natural Gas Hydrates and Desanding: The CFD Simulation of the Flow Field and Separation Performance

1
Department of Mechatronic Engineering, Southwest Petroleum University, Chengdu 610500, China
2
State Key Laboratory of Oil and Gas Reservoir Geology and Development Engineering, Southwest Petroleum University, Chengdu 610500, China
*
Authors to whom correspondence should be addressed.
Energies 2019, 12(17), 3257; https://doi.org/10.3390/en12173257
Submission received: 4 July 2019 / Revised: 13 August 2019 / Accepted: 15 August 2019 / Published: 23 August 2019
(This article belongs to the Section D: Energy Storage and Application)

Abstract

:
The application of a hydrocyclone to recycle NGH and desand during NGH exploitation is a novel idea. The flow field and performance of this hydrocyclone is in the frontier of the research in this field and is unclear so far. This research aimed to reveal the flow field characteristics and performance of NGH downhole hydrocyclones. In this paper, flow field, solid phase particle volume distribution and separation efficiency were investigated according to the two objectives of NGH recovery efficiency and sand removal efficiency with different inlet velocities by computational fluid simulations (CFD)-FLUENT software. The results show that the short circuit flow contributed to the recovery of NGH. Axial velocity is a decisive factor in balancing the two objectives of NGH recovery efficiency and sand removal efficiency. In addition, the same as those in traditional hydrocyclones, the static pressure, tangential velocity and turbulence intensity play key roles in separation performance, hydrocyclone performance can be improved by increasing the inlet velocity. On the other hand, most separation efficiencies were greater than 80%, when the particle size was larger than 15 µm, and the differential pressure was less than 0.6 MPa. Therefore, all the above results confirm that hydrocyclone has good performance in NGH exploitation, and the basis of its structural design and optimization are provided.

1. Introduction

Natural gas hydrate (NGH), also known as “Flammable Ice”, is considered as a potential clean new energy resource because its combustion only produces hydrated carbon dioxide, and its reserves are huge [1]. It is estimated that the total amount of methane gas in global gas hydrate resources is approximately 3 × 10¹⁵ m3 [1,2]. These resources are mainly distributed in polar and deep-sea slopes and nearly 95% are reserved in deep-sea slopes, which are characterized by large content and weak cementation [3,4,5]. Therefore, they are difficult to exploit. In recent years, testing productions have been terminated directly or indirectly due to sand production [6,7,8]. To solve this problem, a downhole in situ separation technology is proposed based on the “Solid Fluidization” method that has achieved good performance in South China Sea testing production [9,10]. The implementation process is presented in Figure 1. In Step 1, the slim hole is drilled. In Step 2, the NGH reservoir is crushed by a jet stream and fluidized into mixed slurry. In Step 3, the downhole in situ separation system separates the mixed NGH slurry into NGH and sand slurry, and then the NGH slurry is transported up through the riser. The sand slurry is discharged from the outfall, and then the high-density sand is backfilled and solidified in the backfill system [11]. This method is different from the depressurization method in that the phase temperature and pressure balance does not change in the NGH reservoir position, and the NGH reservoir is directly crushed and collected into the pipeline, so as to break the phase equilibrium in the transport pipeline, so as to prevent the occurrence of phase transformation in the reservoir location, leading to geological hazards. In this way, pipeline transportation energy consumption, pipeline blockage, and tool wear can be reduced, and ultimately the production efficiency of NGH is improved. In downhole hydrocyclone, as a key component of the downhole in situ separation system, the performance and flow field characteristics play a decisive role.
Hydrocyclones are widely used in various engineering processes because of their simple design, flexible operation, large capacity, and low maintenance costs [12,13]. Flow field characteristics are highly complex multiphase structures in a hydrocyclone. There is turbulence intensity distribution, axial velocity distribution, static pressure distribution, tangential velocity distribution, radial velocity distribution, circulation flow and short-circuit flow in hydrocyclones, all of which play key roles during the separation process, and affect the final separation performance. In previous papers, short-circuit flow (the flow that enters directly from the inlet of the hydrocyclone into the bottom inlet of the vortex finder and then discharges from the outlet of the vortex finder without rotating through the separation zone of the cone section) played a negative role and circulating flow played a positive role in the separation process [14,15]. In recent decades, scholars have studied the flow field and performance of hydrocyclones with different structures applied in various engineering processes. Lanyue [16] investigated the influence of inlet velocity on a two-stage hydrocyclone separation performance and suggested that a higher inlet velocity was beneficial to the separation of two-stage hydrocyclones. Liow [17,18] investigated the flow field and performance of mini-tangential and mini-axial hydrocyclones and found that the reasons for poor separation performance were flow asymmetry and recirculation zones. Qiang Zhao [19] researched the separation performance and flow field of a hydrocyclone with different vortex finder wall thicknesses and concluded that the type of hydrocyclone researched was advantageous in effective classification. Shi-ying Shi [20] measured the swirling field in a vane-type pipe oil–water separator and obtained the distribution of the radial, tangential and axial velocities, which were beneficial to optimizing the design of the downhole oil–water separator. Wanwilai [21] performed simulations of influence of the inserted rod on the velocity distributions and separation performance and showed that the separation performance was improved by inserting an appropriate sized rod. However, the application of a hydrocyclone to recycle NGH and desand during NGH exploitation is a novel idea, and its performance needs to balance the recovery rate of the NGH outlet and the removal rate of the sand outlet. Nevertheless, the flow field and performance of NGH hydrocyclones are of great significance, and it is in the frontier of the research and not clear so far.
In recent decades, with the improvement of computer technology, computational fluid dynamic (CFD) technology has made remarkable progress in the numerical simulation of hydrocyclones. The advantage of this method is that not only can the complex flow field in a hydrocyclone be better understood but experimental time and cost can also be saved. For multiphase flow, current mainstream models are of two major types: the Euler–Euler and Euler–Lagrange models [22]. The Euler–Lagrange approach can track the movement of particles and predict flow structures and forces. However, the limitations of this approach are neglecting particle collisions and influences of particle volume fraction on the fluid and operating in dilute regimes [23,24]. The Euler–Euler models can accurately predict the separation performance and flow characteristics in both dense and dilute regimes through considering the interaction fluid and particles. Considering the ability of computers, the mixture model is generally taken as a simple and economical multiphase flow model. For turbulence models, the prediction of the Reynolds stress model (RSM) and large eddy simulation is reasonable but, considering the computational efficiency, the former is usually adopted. However, very few of them have included the flow characteristics and separation process of NGH hydrocyclone using the computational fluid dynamics (CFDs) method.
The objective of this paper is to reveal the flow field characteristics and performance of NGH downhole hydrocyclones. Further, the flow field and performance of NGH downhole hydrocyclones are distinguished from those of traditional hydrocyclones. Finally, this study shows that hydrocyclone separators have a very good effect on hydrate desalination and purification. In this paper, the flow field, solid phase particle volume distribution and separation efficiency were investigated according to the two objectives of NGH recovery efficiency and sand removal efficiency with different inlet velocities by computational fluid dynamic (CFD)-FLUENT software. Specifically, the distribution of turbulence intensity, static pressure, tangential velocity, axial velocity, radial velocity, solid phase particle volume, NGH recovery efficiency and sand removal efficiency were obtained.

2. Numerical Method

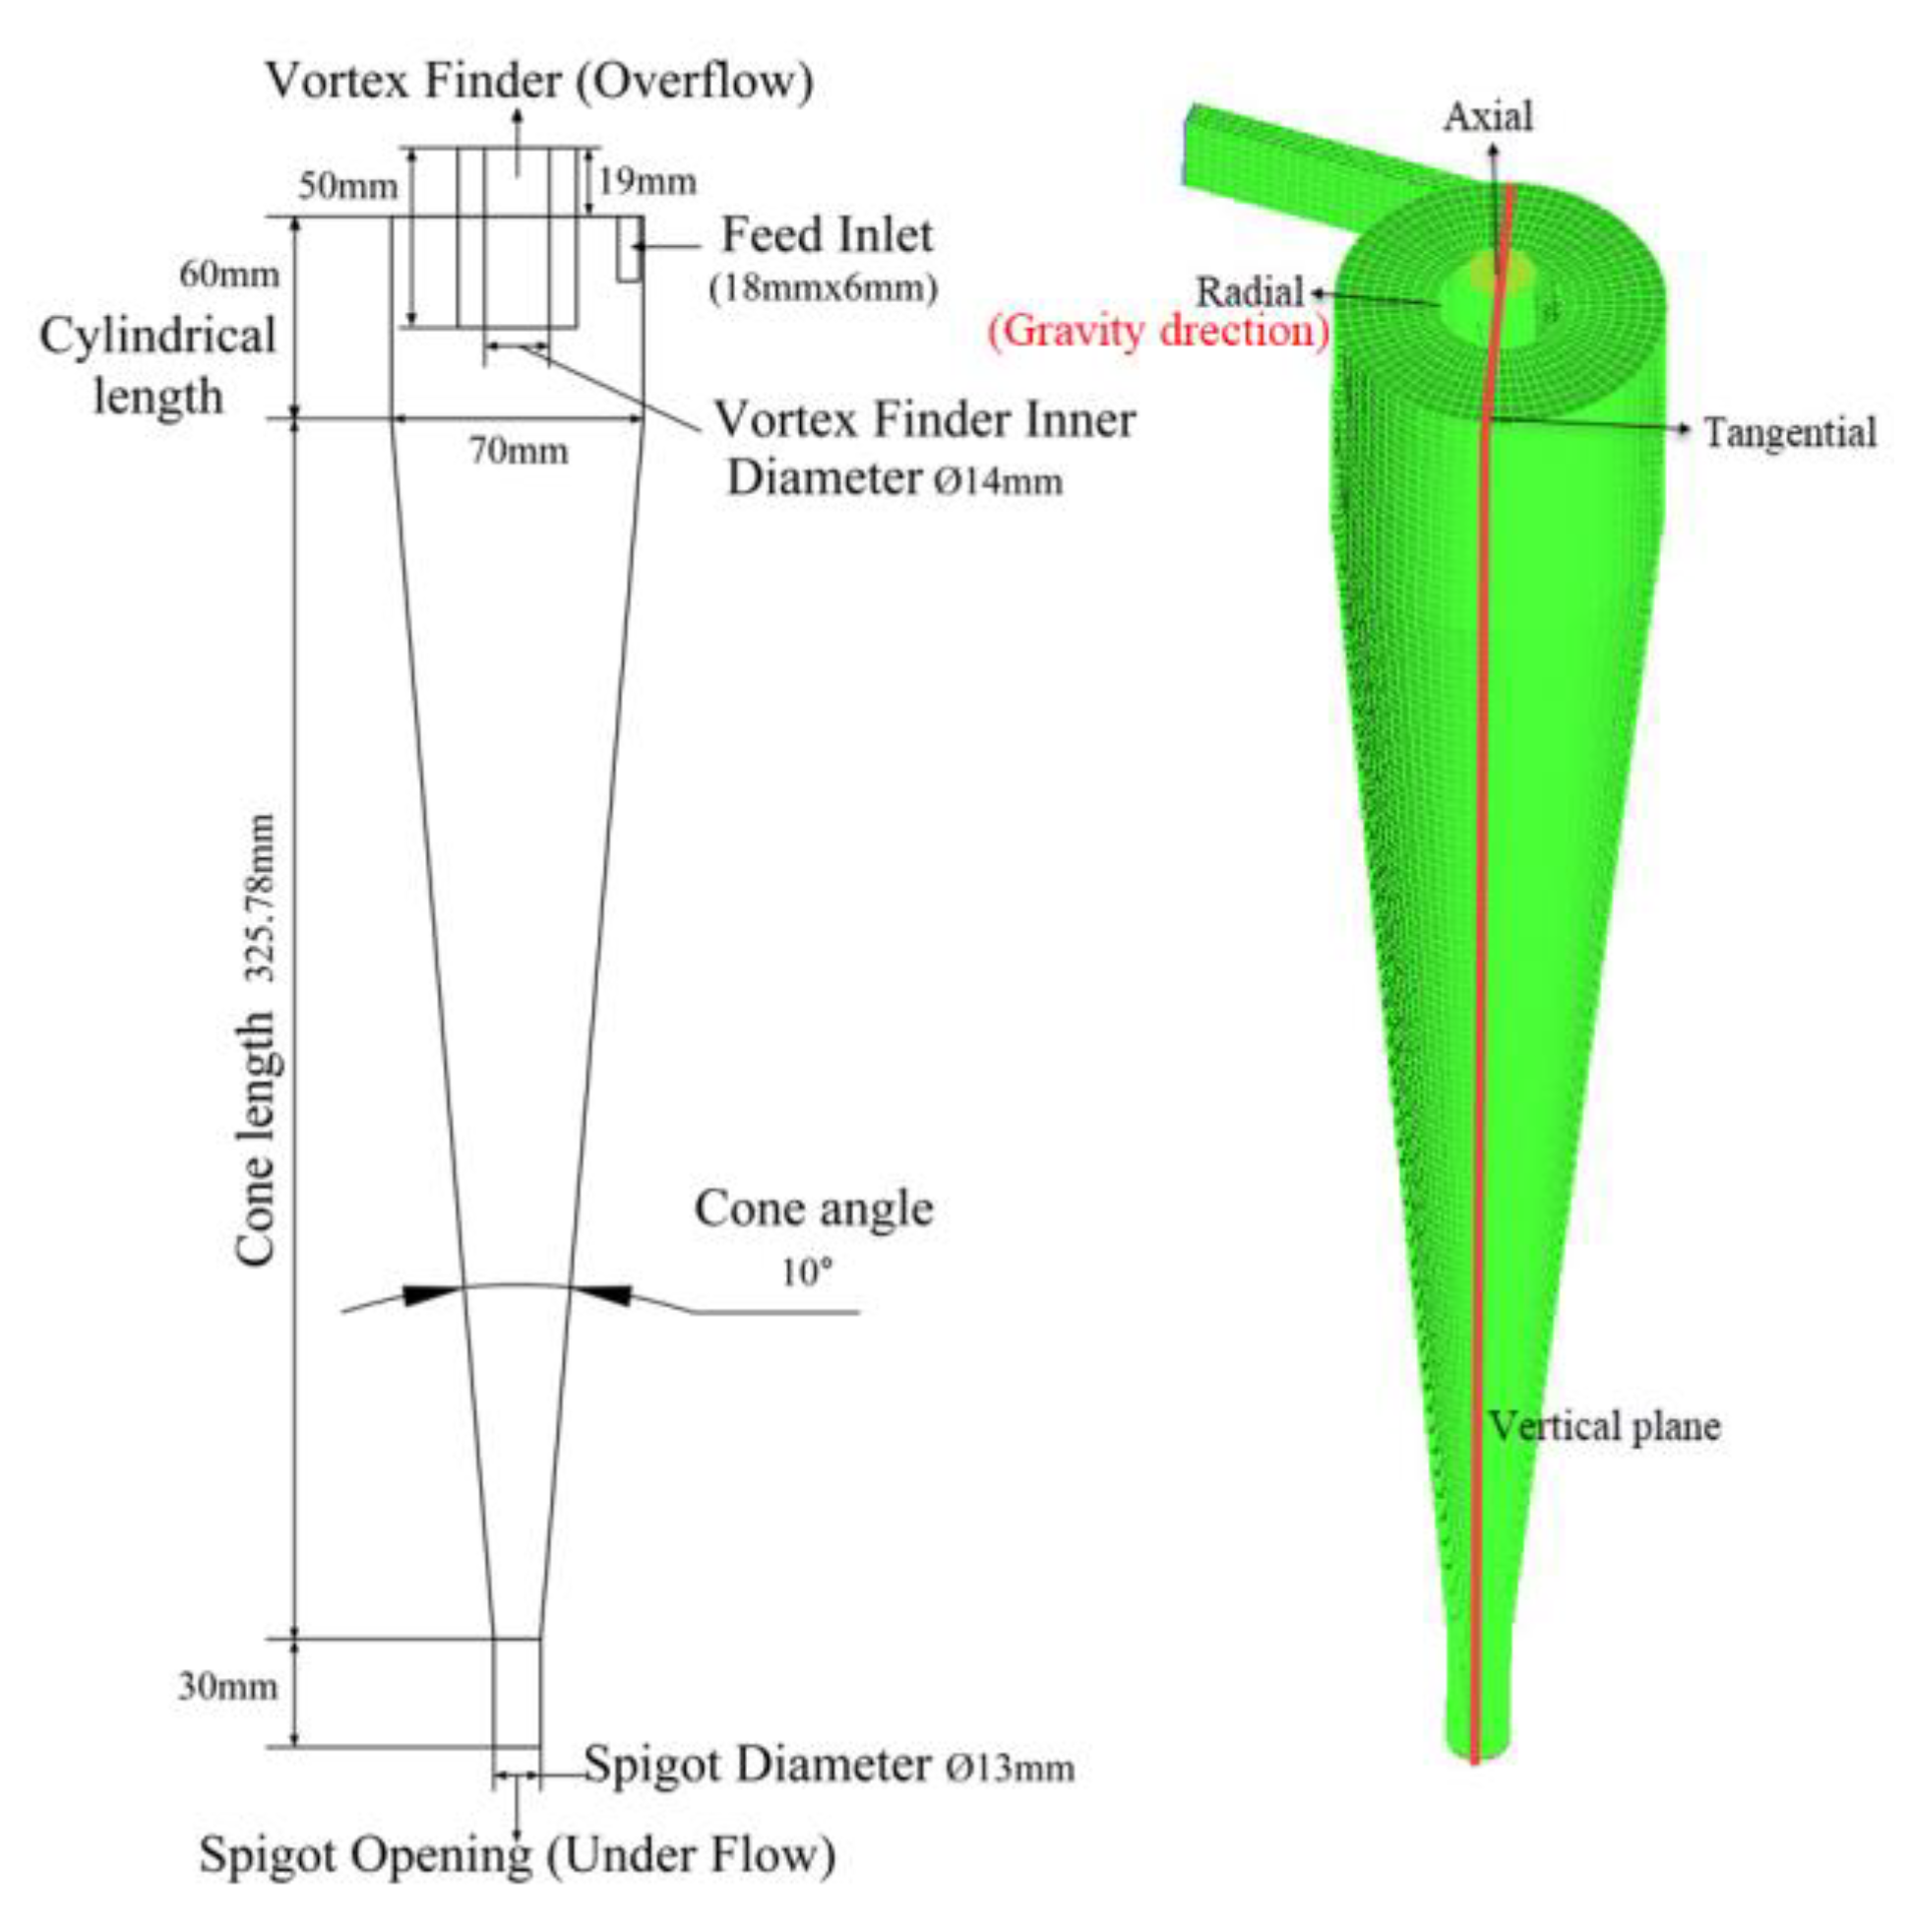
2.1. Structure Geometry

Figure 2 and Table 1 present the geometrical parameters that were optimized in our previous research [11].

2.2. Model Description

In this paper, the Mixture model was adopted for multiphase flow models because the mixture model is a simplification of the Euler–Euler model with characteristics of both the calculation precision and speed.
The continuity equation is as follows:
ρ t + ρ u i x i = 0
The momentum equation of the Mixture model is defined as:
t ( ρ u i ) + x j ( ρ u i u j ) = x i p + x i ( k = 3 n p k ) + x j [ μ ( u i x j + u j x i ) + ( ρ u i u j ¯ ) + k = 1 n ρ k u d r , k i u d r , k j ] + g ρ
where g is gravitational acceleration, u d r is the drift velocity, ρ u i u j ¯ is the Reynolds stress term. ρ , u i and u j are the density and velocity of the mixture phase fluid, respectively, which are calculated by the following equations:
ρ = k = 1 n α k ρ k ,   u i = k = 1 n α k ρ k u k , i ρ ,   μ = k = 1 n α k μ k
where α k , ρ k , u k and μ k are the volume fraction, density, velocity and viscosity of the kth phase fluid, respectively.
The characteristic flow inside hydrocyclones are strong, swirling, highly anisotropic, and turbulent. To accurately predict the flow behavior for various categories of fluid flows, the RSM model was applied, and its transport equation is defined as:
( ρ u i u j ¯ ) t + ( ρ u k u i u j ¯ ) x k = D T , i j + D L , i j + P i j + G i j + Φ i j + ε i j + F i j
where D T , i j is the turbulent diffusion, D L , i j is the molecular viscous diffusion, P i j is the shear stress generation, G i j is the buoyancy generation, Φ i j is the pressure strain, ε i j is the viscous dissipation, and F i j is the system rotation generation.

2.3. Simulation Conditions and Boundary Condition

Figure 2 presents the mesh of the hydrocyclone. It is shown in Table 2 that the research on grid independence was conducted with mesh sizes of 100,000, 200,000, 300,000, 400,000 and 500,000 cells. This shows that the results are independent when the total number of grids is over 300,000. The results of maximum static pressure indicate that better accuracies can be obtained when larger mesh sizes in the hydrocyclone are obtained. In the rest of this study, the total number of grids discretizing the entire geometry was approximately 300,000. To accurately capture the flow features, the grids were refined at the critical regions, for example, around the core, at the spigot opening, near the walls, within and near the vortex finder. For better visualization, the results were shown for a vertical 2D plane at the specified axis center, and this plane is simply called the vertical plane in the rest of this paper. Figure 2 presents the directions of the positive tangential, axial and radial velocities.
In this paper, the FLUENT software was employed for CFD. A steady state, a 3-D model, and a double-precision implicit solver were adopted. A SIMPLE algorithm scheme was carried out. The higher-order quadratic upwind interpolation (QUICK) spatial discretization scheme was used. The RSM and Mixture models were employed to simulate the inside flow field and to calculate the separation efficiency of the NGH hydrocyclone. The NGH reservoir type is a non-diagenetic pore filling, the seabed temperature is 3.75 °C, the geothermal gradient is 0.045 °C/m, and the estimation of the NGH reservoir temperature is approximately 13 °C. The seawater has a depth of 1200 m, the overburden has a thickness of 200 m, and the estimated pressure of the hydrate reservoir is approximately 14 MPa. Therefore, the simulation operating condition (the temperature and pressure of the NGH Reservoir) was set as 13 °C and 14 MPa. The flow rates can be obtained by multiplying the inlet velocity by the inlet area. A velocity inlet (8, 12, and 16 m/s) and pressure outlets (Relative pressure 0) were used. No slip boundary condition was adopted for the wall boundary. Table 3 shows the boundary and initial condition.
According to the idea of the solid fluidization mining of NGH, the environment in the separator is similar to that of the hydrate reservoir. That is, the temperature and pressure changes are very small. Although the hydrate is decomposed into gas to a certain extent, there is little decomposed gas. Therefore, the gas phase is temporarily neglected in this simulation. Further, it was assumed that the mixture slurry of NGH contained three phases of seawater, namely, NGH, solid and sand. All particles are spherical in shape. Based on the analysis of sediment physical properties in the South China Sea, Figure 3 shows the distribution of sediment particle diameters. As shown in Figure 3, the diameter of the particles ranges from 1 to 100 µm, and most particles are approximately 30 µm in diameter. Table 4 shows the specific parameters of the media of the simulation calculation.

3. Results and Discussion

Firstly, CFD model validation was carried out and, then, the flow field features and separation performance were studied. The inlet velocity directly affects the intensity of the centrifugal force field in the hydrocyclone and is an important criterion of the hydrocyclone’s performance. Therefore, to obtain more accurate flow field distribution characteristics and separation performance, hydrocyclones with different inlet velocities were studied.

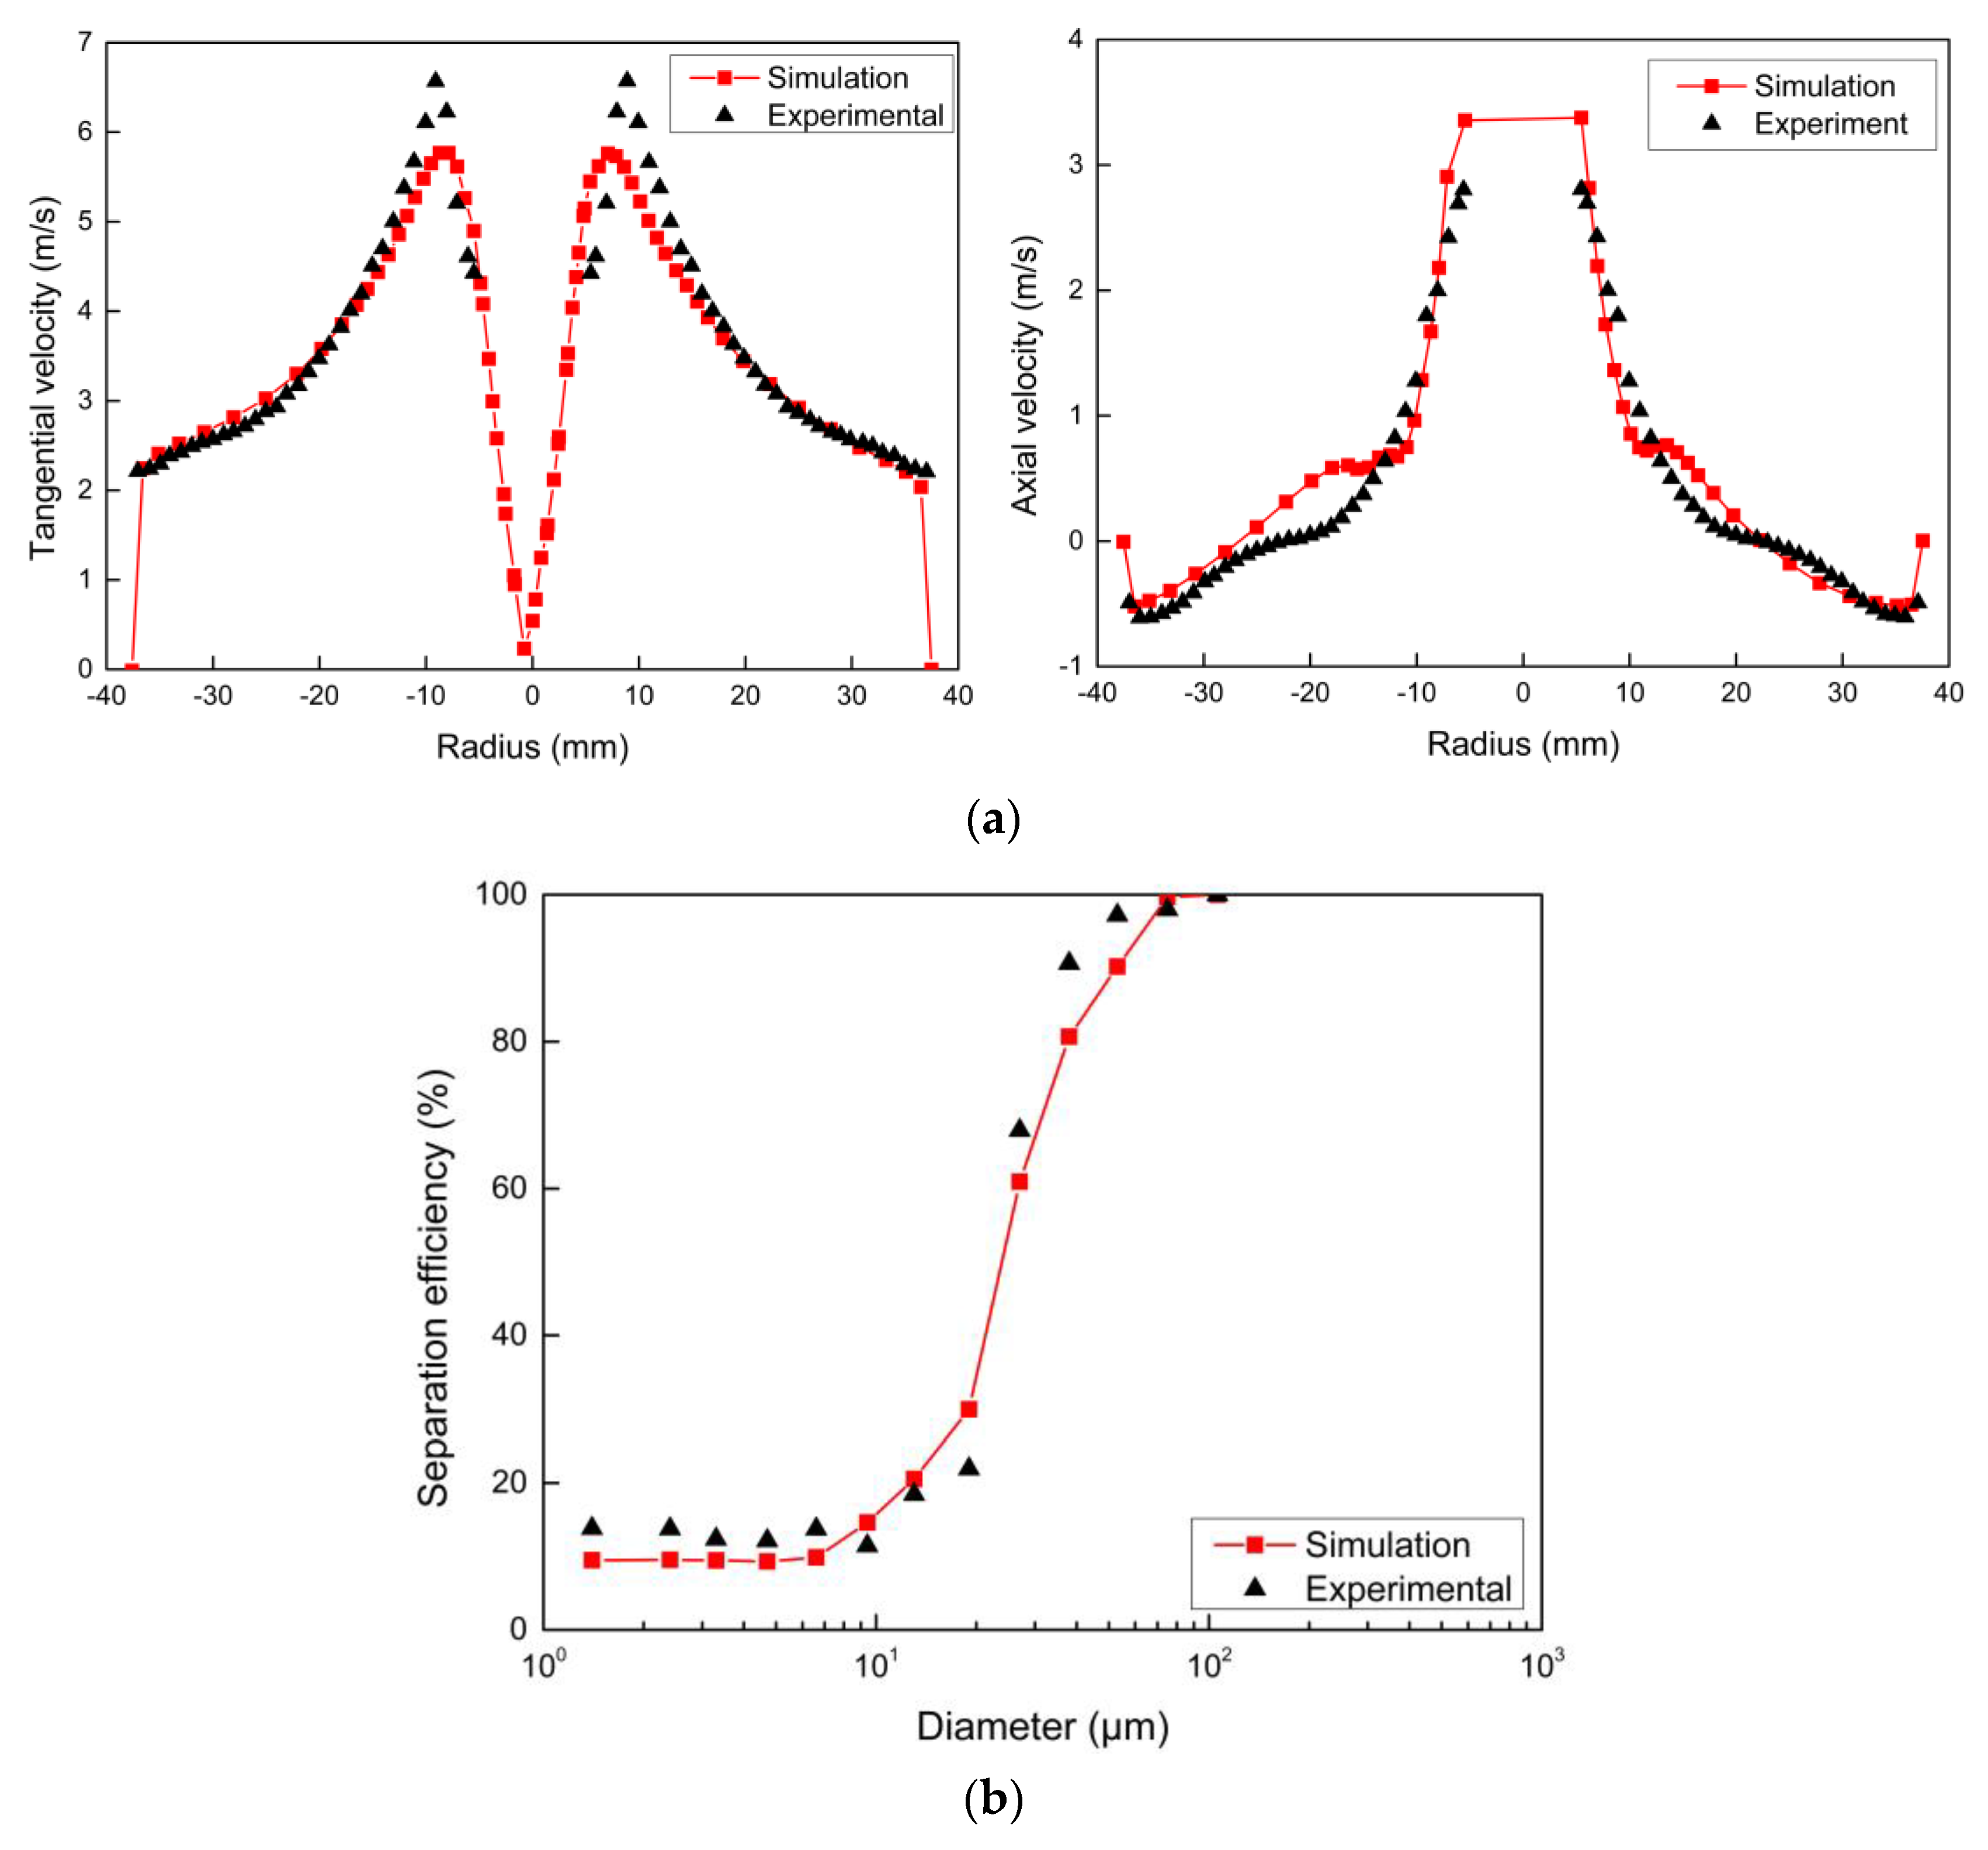
3.1. The Model Validation

The CFD model was validated by a comparison of our simulation results with the experiment results by Hsieh [25] and Delgadillo [26] in the 75-mm and 250-mm hydrocyclone. Figure 4a presents a comparison of the axial and tangential velocity on the vertical plane located at 60 mm away from the top of the 75-mm hydrocyclone. The solid content and particle size distribution of the feed of the 250-mm hydrocyclone was used in the simulation as in Delgadillo’s work. Figure 4b shows comparison curves of separation efficiency. As shown in Figure 4, the simulation results are in good agreement with the experimental results, which indicates that the selected model can effectively predict velocity profiles and separation performance in the hydrocyclone.

3.2. Flow Field Characteristics

In this paper, the flow characteristics of the hydrocyclone were studied by presenting the contours of the vertical plane and the distribution curves in different positions on the vertical plane (e.g., Figure 5, Z = 15, 120, 210, 300, and 390 mm) with different inlet velocities.

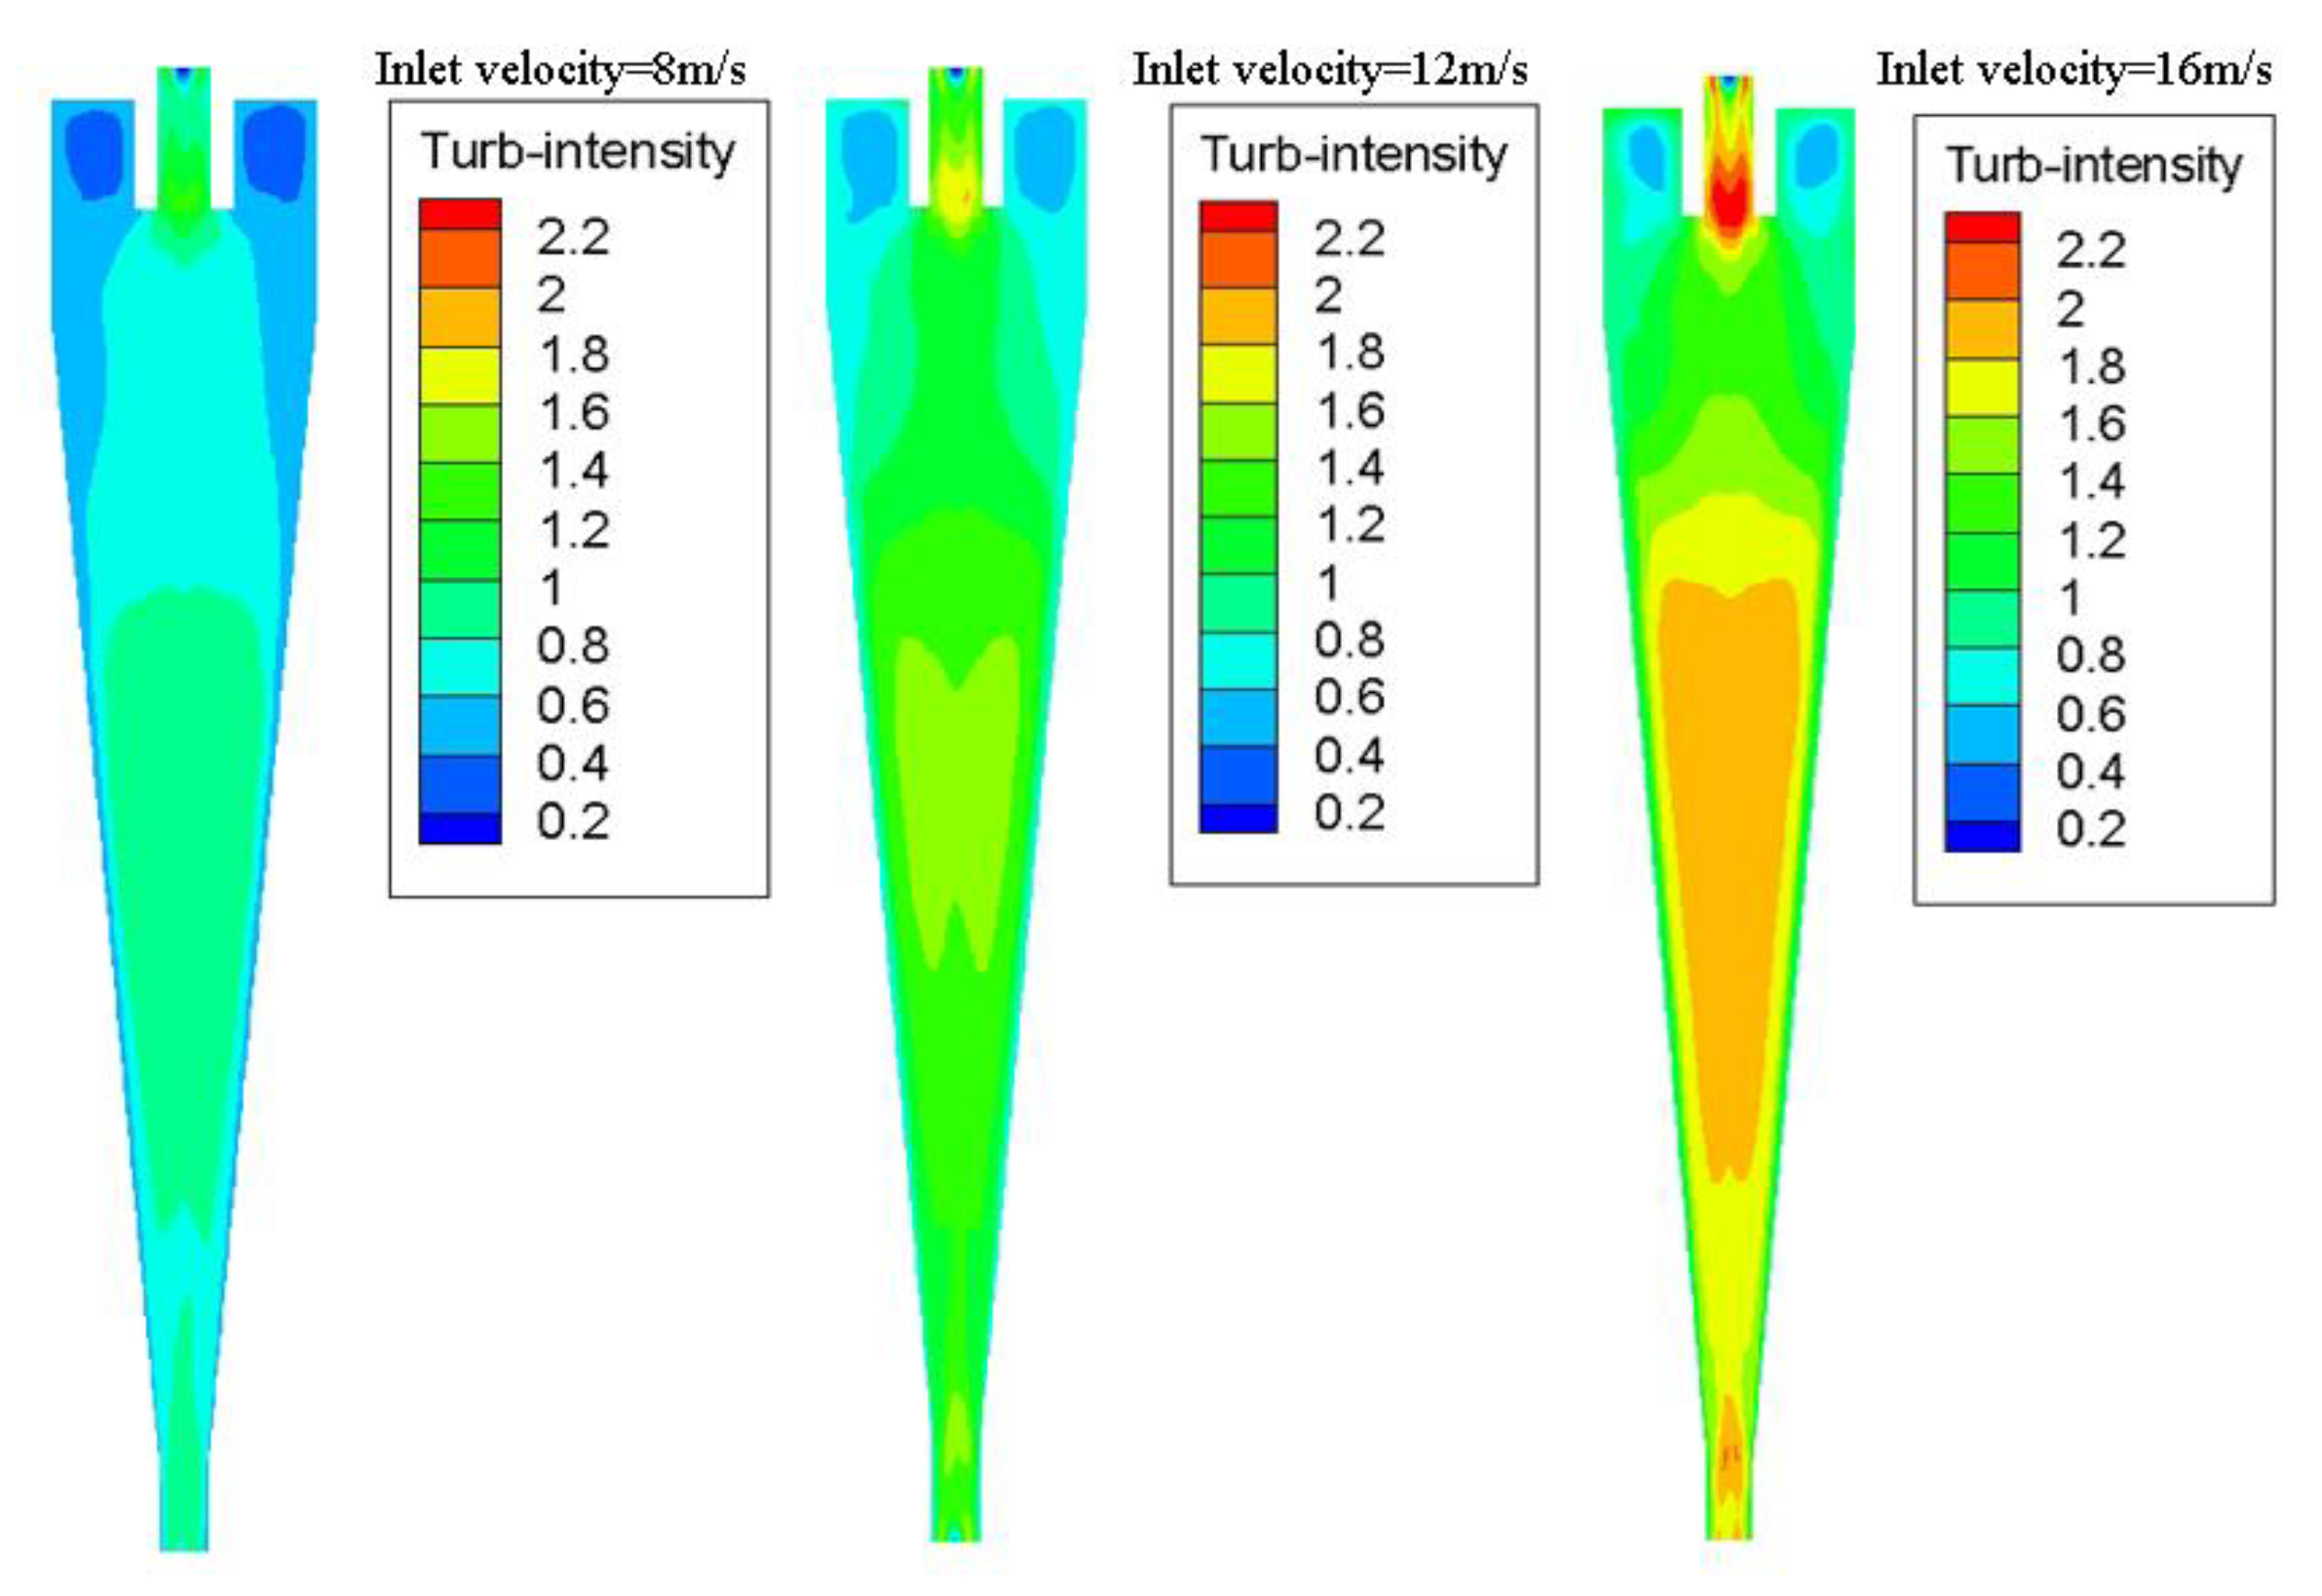
3.2.1. Turbulence Intensity

Turbulence intensity is defined as the ratio of the fluctuating velocity to the average velocity. It is known that turbulence intensity conditions are always related to the number of misplaced particles and energy consumption, which may deteriorate the hydrocyclone’s performance. Figure 6 shows representative turbulence intensity contours with different inlet velocities across the vertical plane.
It shows that the turbulence intensity values are higher at 16 m/s than those at other inlet velocities. This will lead to NGH and sand particles being misplaced. The maximum value occurs at the bottom of the vortex finder as a traditional hydrocyclone with an air core, and the larger values occur at the middle of the cone. This will lead to sand particles being misplaced to the vortex finder. On further increasing the inlet velocity, the turbulence intensity increases. It is mainly due to the fact that as the inlet velocity increases, fluid velocity fluctuations and collision are strengthened, which leads to an increase in turbulence intensity. The greater the turbulence intensity is, the greater the collision between hydrated particles and sand particles in the hydrocyclone and the higher the energy consumption. Besides, when the inlet velocity increases, the turbulence intensity at the bottom of the vortex finder and the middle of the cone increases sharply. This phenomenon occurs because with the increase in inlet velocity, more and more water passes to the overflow and the fluid velocity reverses in the axial direction, intensifying friction. It is suggested that the fluid stability could be maintained by modifying the structure, controlling the inlet velocity and so on.

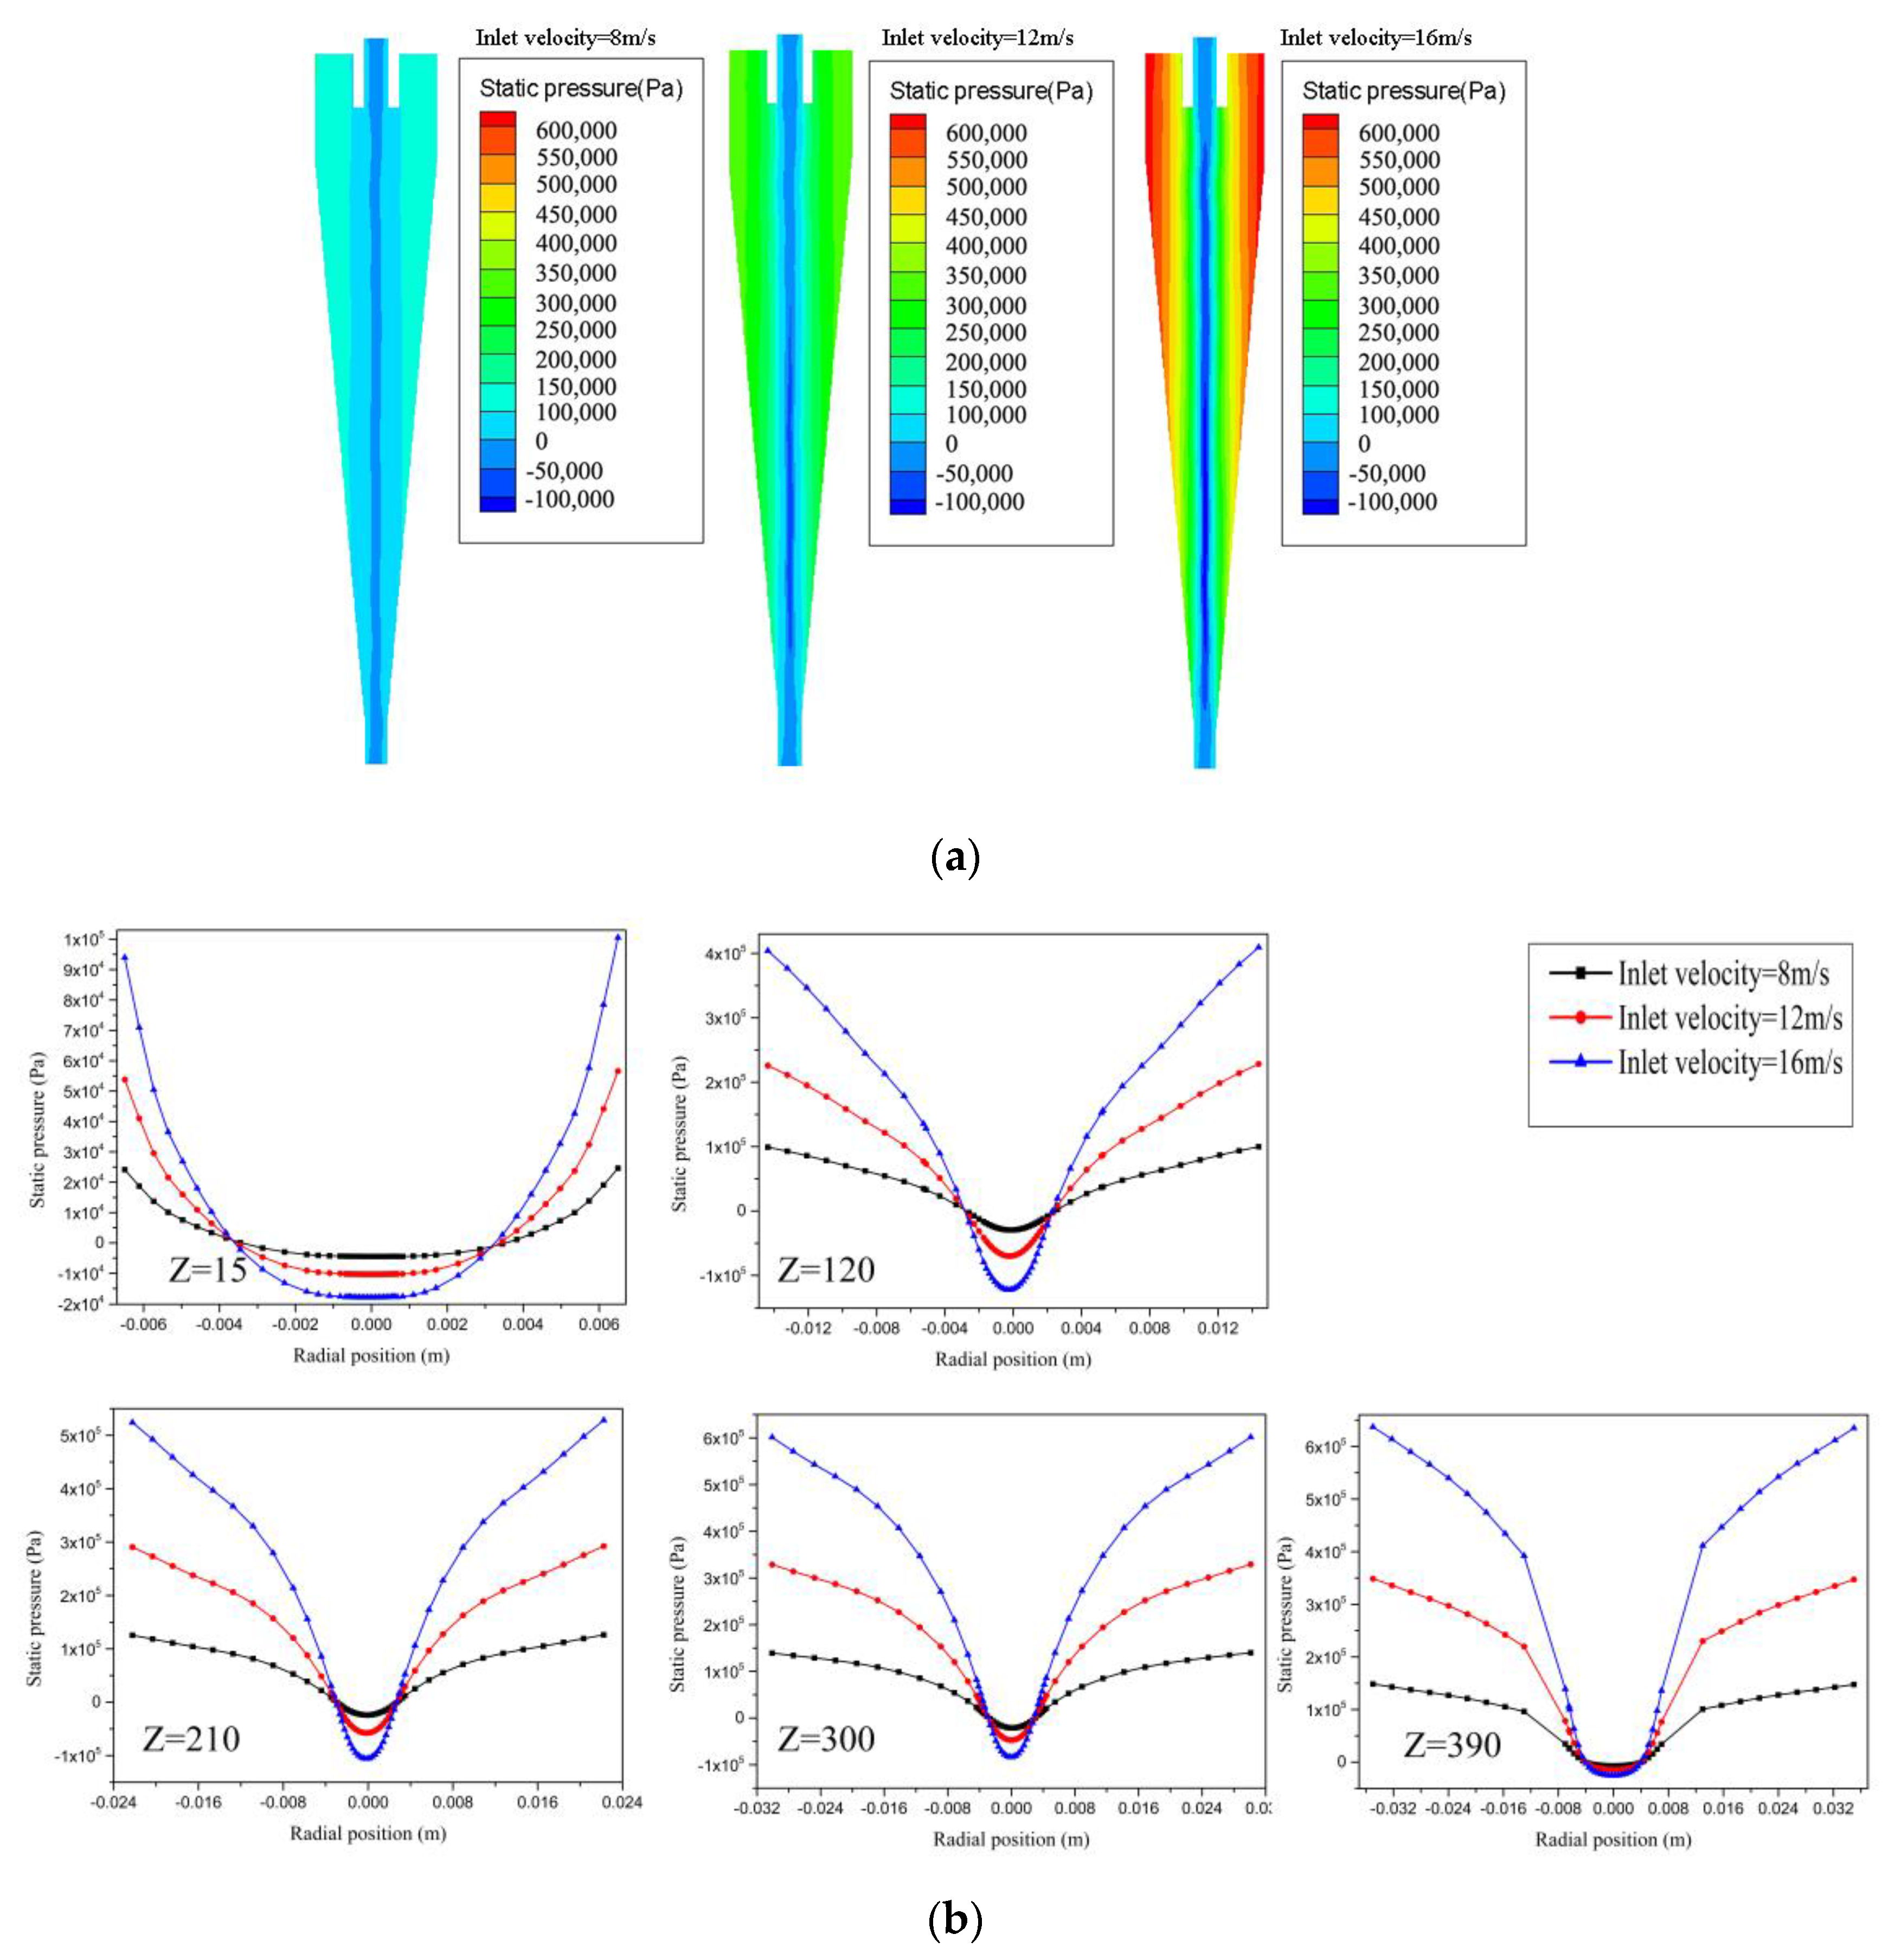
3.2.2. Static Pressure

The static pressure contours across the vertical plane are shown in Figure 7a. Here, the absolute value of the static pressure increases from center to wall along the radial direction, and the distribution of the static pressure is in approximate symmetry about the center, which is the same in a traditional hydrocyclone. When the inlet velocity increases, the positive pressure values increase, while the negative values decrease.
The sand and NGH particles are governed to move to the center in a radial direction by the pressure gradient force F p .
F p = d p d r V = Δ p V
where V is the volume of the particle, and Δ p is the radial pressure gradient.
Figure 7b shows static pressure distribution curves over a diameter line of Z = 15, 120, 21, 300, and 390 mm with different inlet velocities. The pressure value in Figure 7 refers to the relative pressure; that is, the pressure relative to the hydrate reservoir pressure. It shows the static pressure distributions in a “V” shape and also approximate symmetry in the radial direction. When the inlet velocity increases, the pressure gradient increases. From Equation (5), the pressure gradient force is also greater. The NGH particles need to be recovered from the overflow; that is, they need move to the center. Thus, the greater the pressure gradient is, the better the recovery of NGH particles. Thus, to balance two-objectives of NGH recovery efficiency and sand removal efficiency, the pressure gradient force needs to be controlled appropriately. On the other hand, the static pressure increases at first, then decreases in the axial direction and reaches the maximum at inlet section. The main reason for this is due to the conversion of static pressure energy into kinetic energy. Compared with the traditional hydrocyclone applied on the land surface, although there is a negative pressure area in the central part of the NGH hydrocyclone, it is not form an air core. This is mainly due to the fluid sealing at the outlet.
From Figure 7, the most differential pressure was less than 0.6 MPa in the NGH hydrocyclone, and it increases with an increase in inlet velocity. To sum up, it shows that the NGH hydrocyclone is relatively high in energy consumption compared with the traditional hydrocyclone.

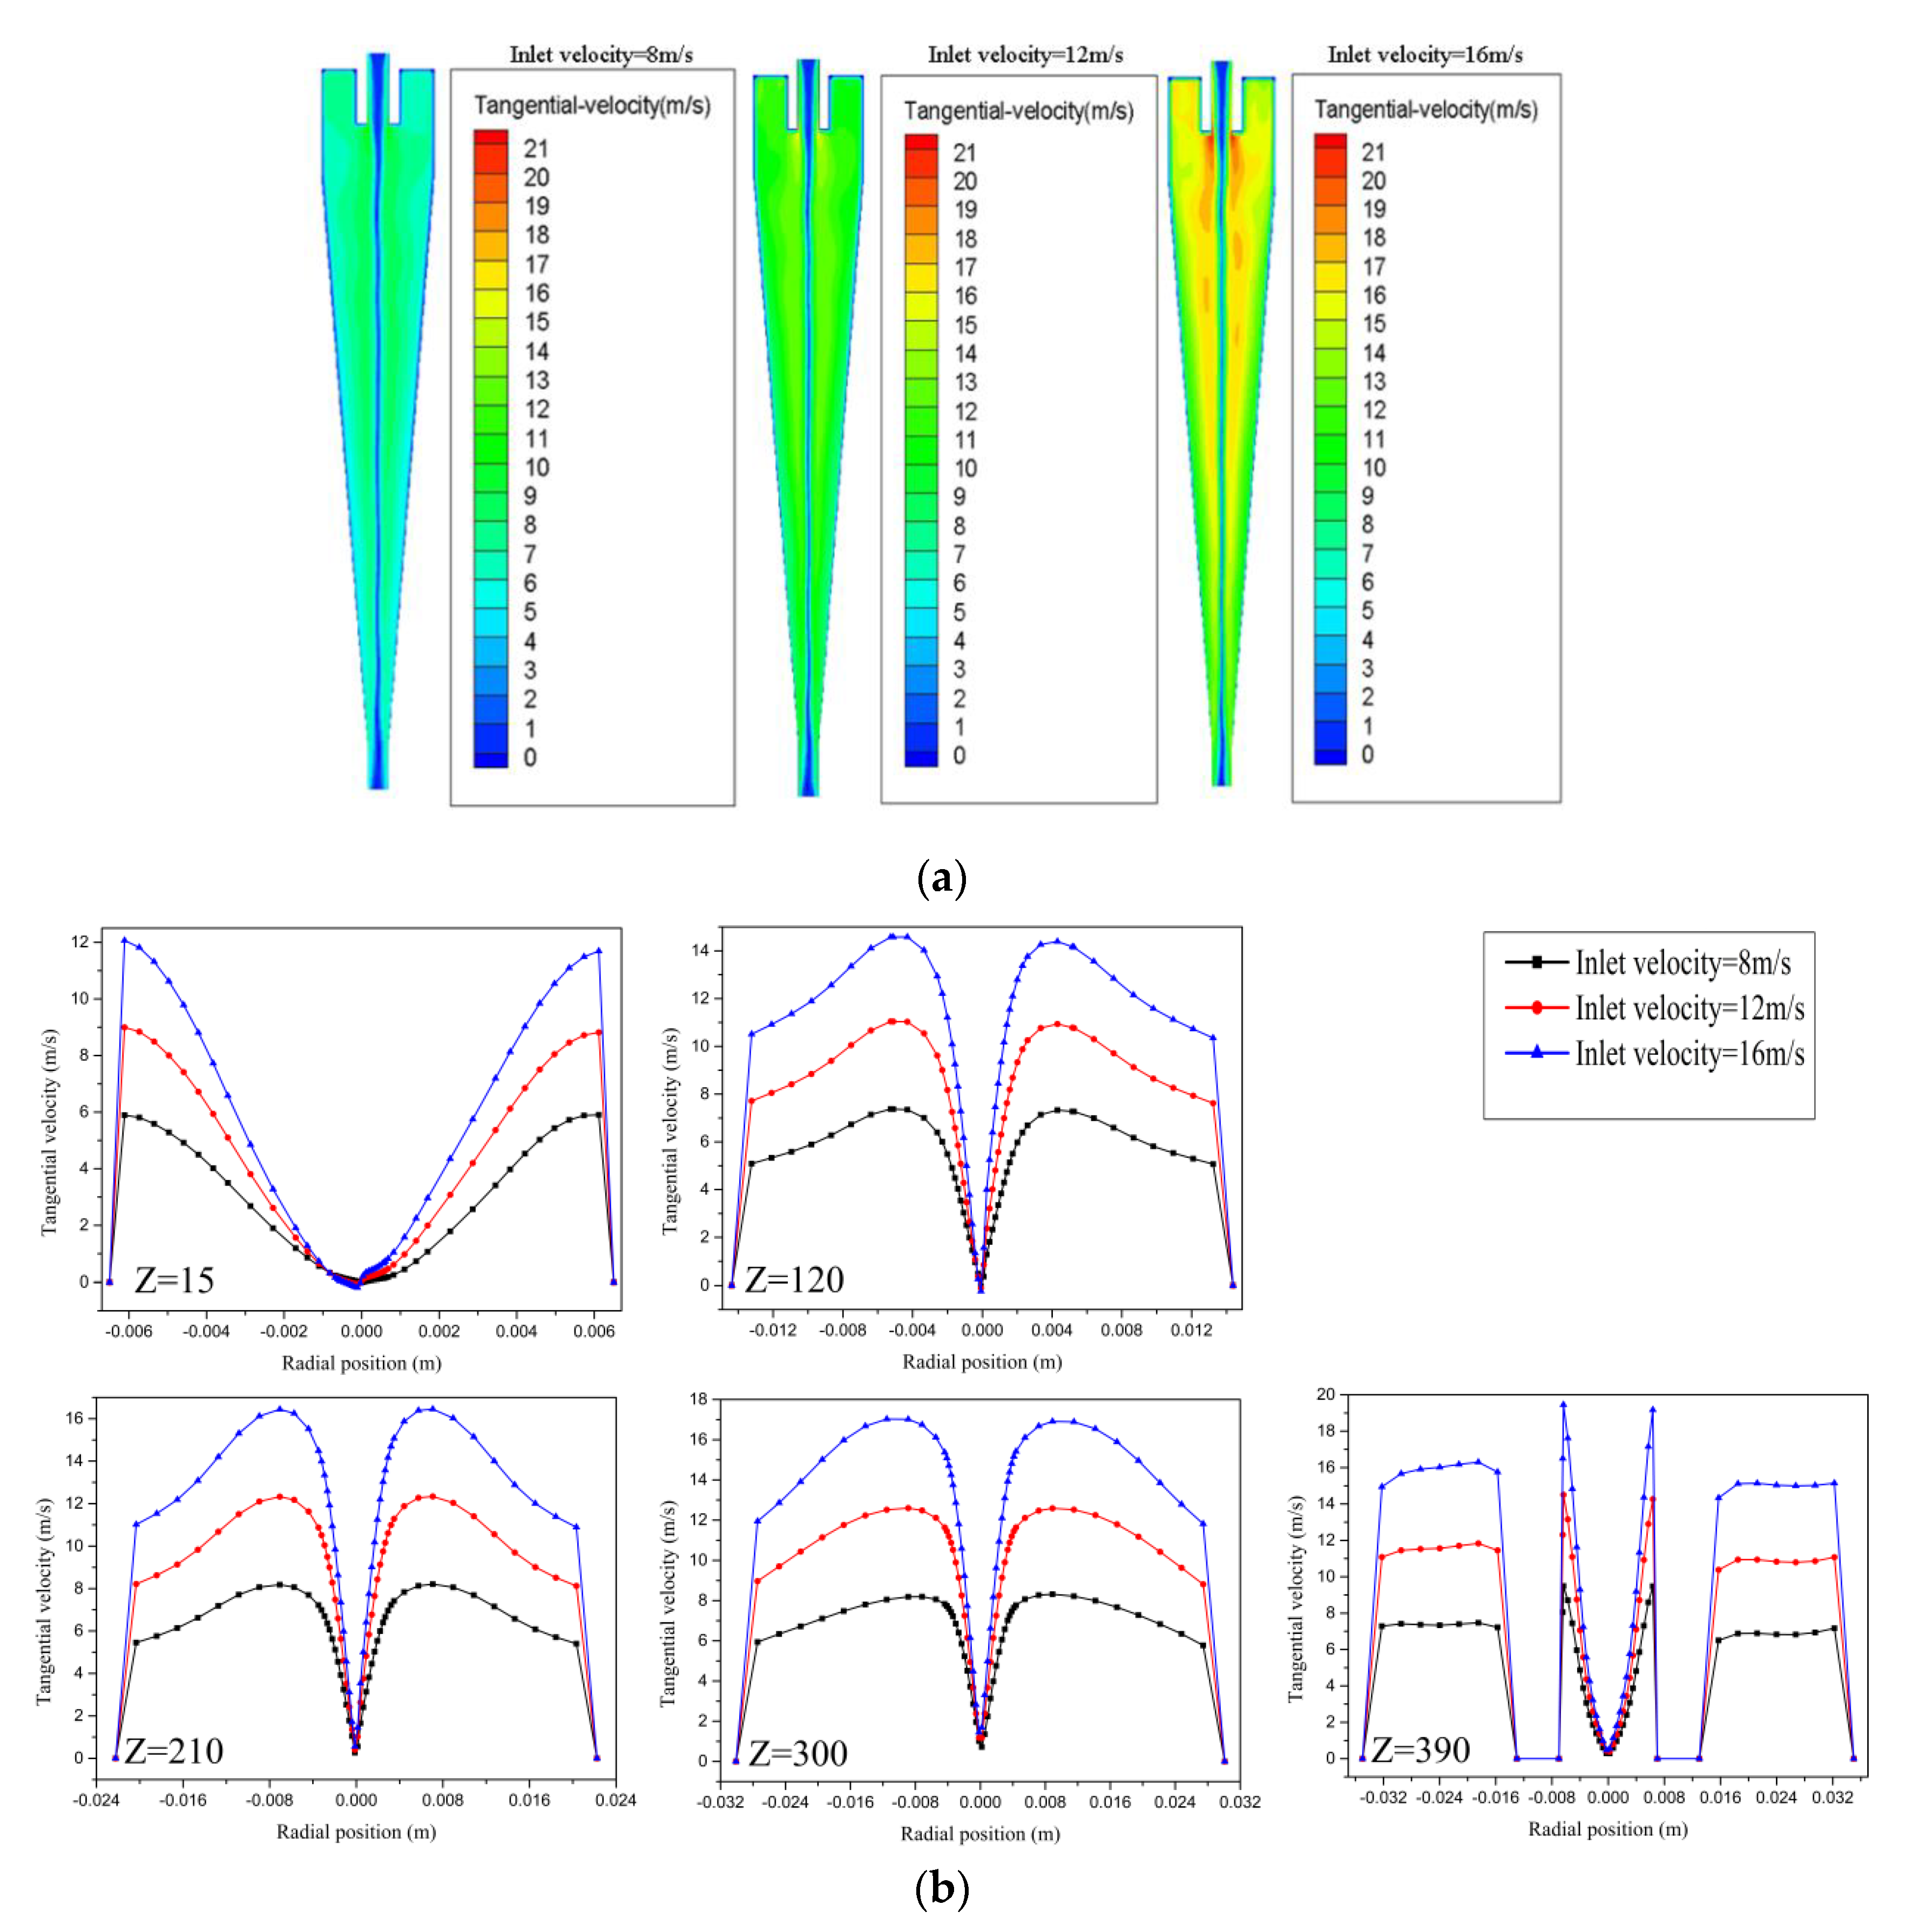
3.2.3. Tangential Velocity

The tangential velocity determines the centrifugal force that dominates the motion of particles towards the outside wall.
F c = V ρ u t 2 r
where ρ is the particle density, and V is the particle volume. Equation (6) shows that the centrifugal force is proportional to the square of the tangential velocity.
Figure 8a presents the tangential velocity contours across the vertical plane with different inlet velocities. The distribution curves of the tangential velocity over a diameter line of Z = 15, 120, 210, 300, and 390 mm with different inlet velocities are shown in Figure 8b. It is easy to see that the tangential velocity first increases and then decreases from center to wall, and its distribution shape is in the form of “M”. Meanwhile, all tangential velocities can be taken as a Rankine vortex. Furthermore, the sand particles need to be recovered from the underflow; that is, they need to be moved to the wall. Thus, tangential velocity increases when inlet velocity increases, which is beneficial to the separation of sand particles. To balance the two objectives of NGH recovery efficiency and sand removal efficiency, the tangential velocity needs to be controlled appropriately. The inlet velocity can be increased in order to increase the tangential velocity, which enhances the centrifugal force and improves separation performance during the process of the purification of NGH slurry by sand removal.

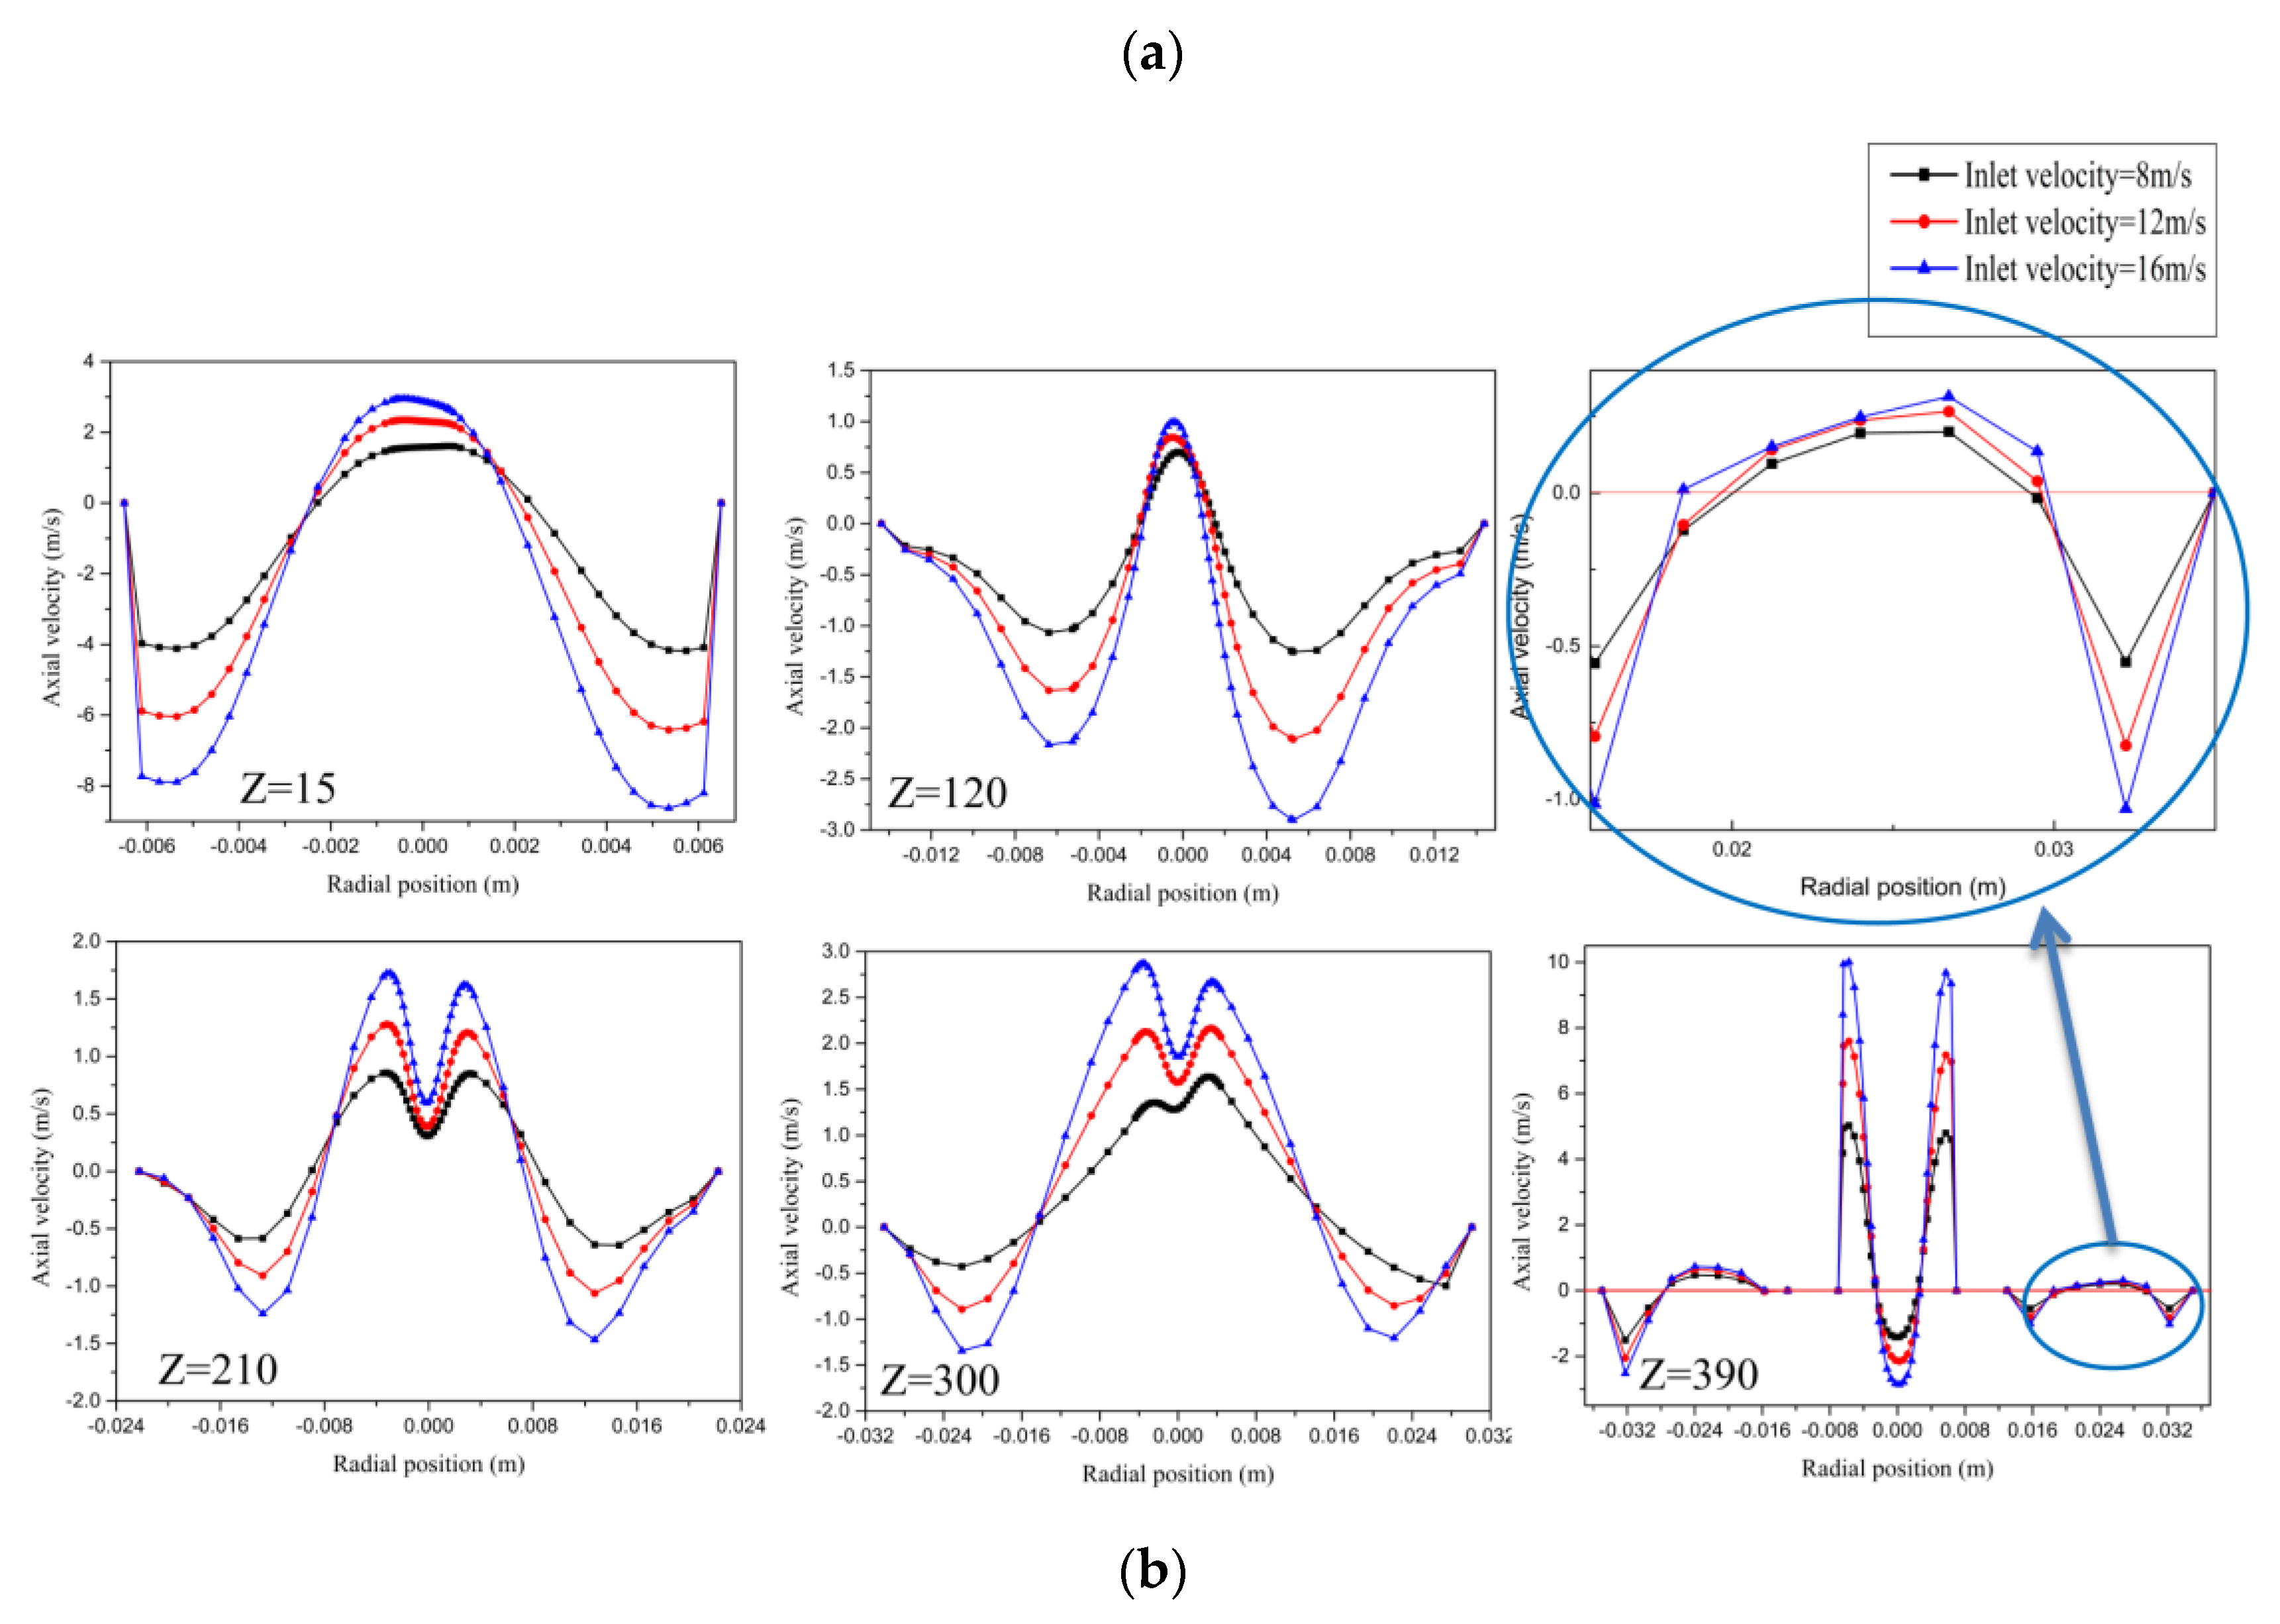
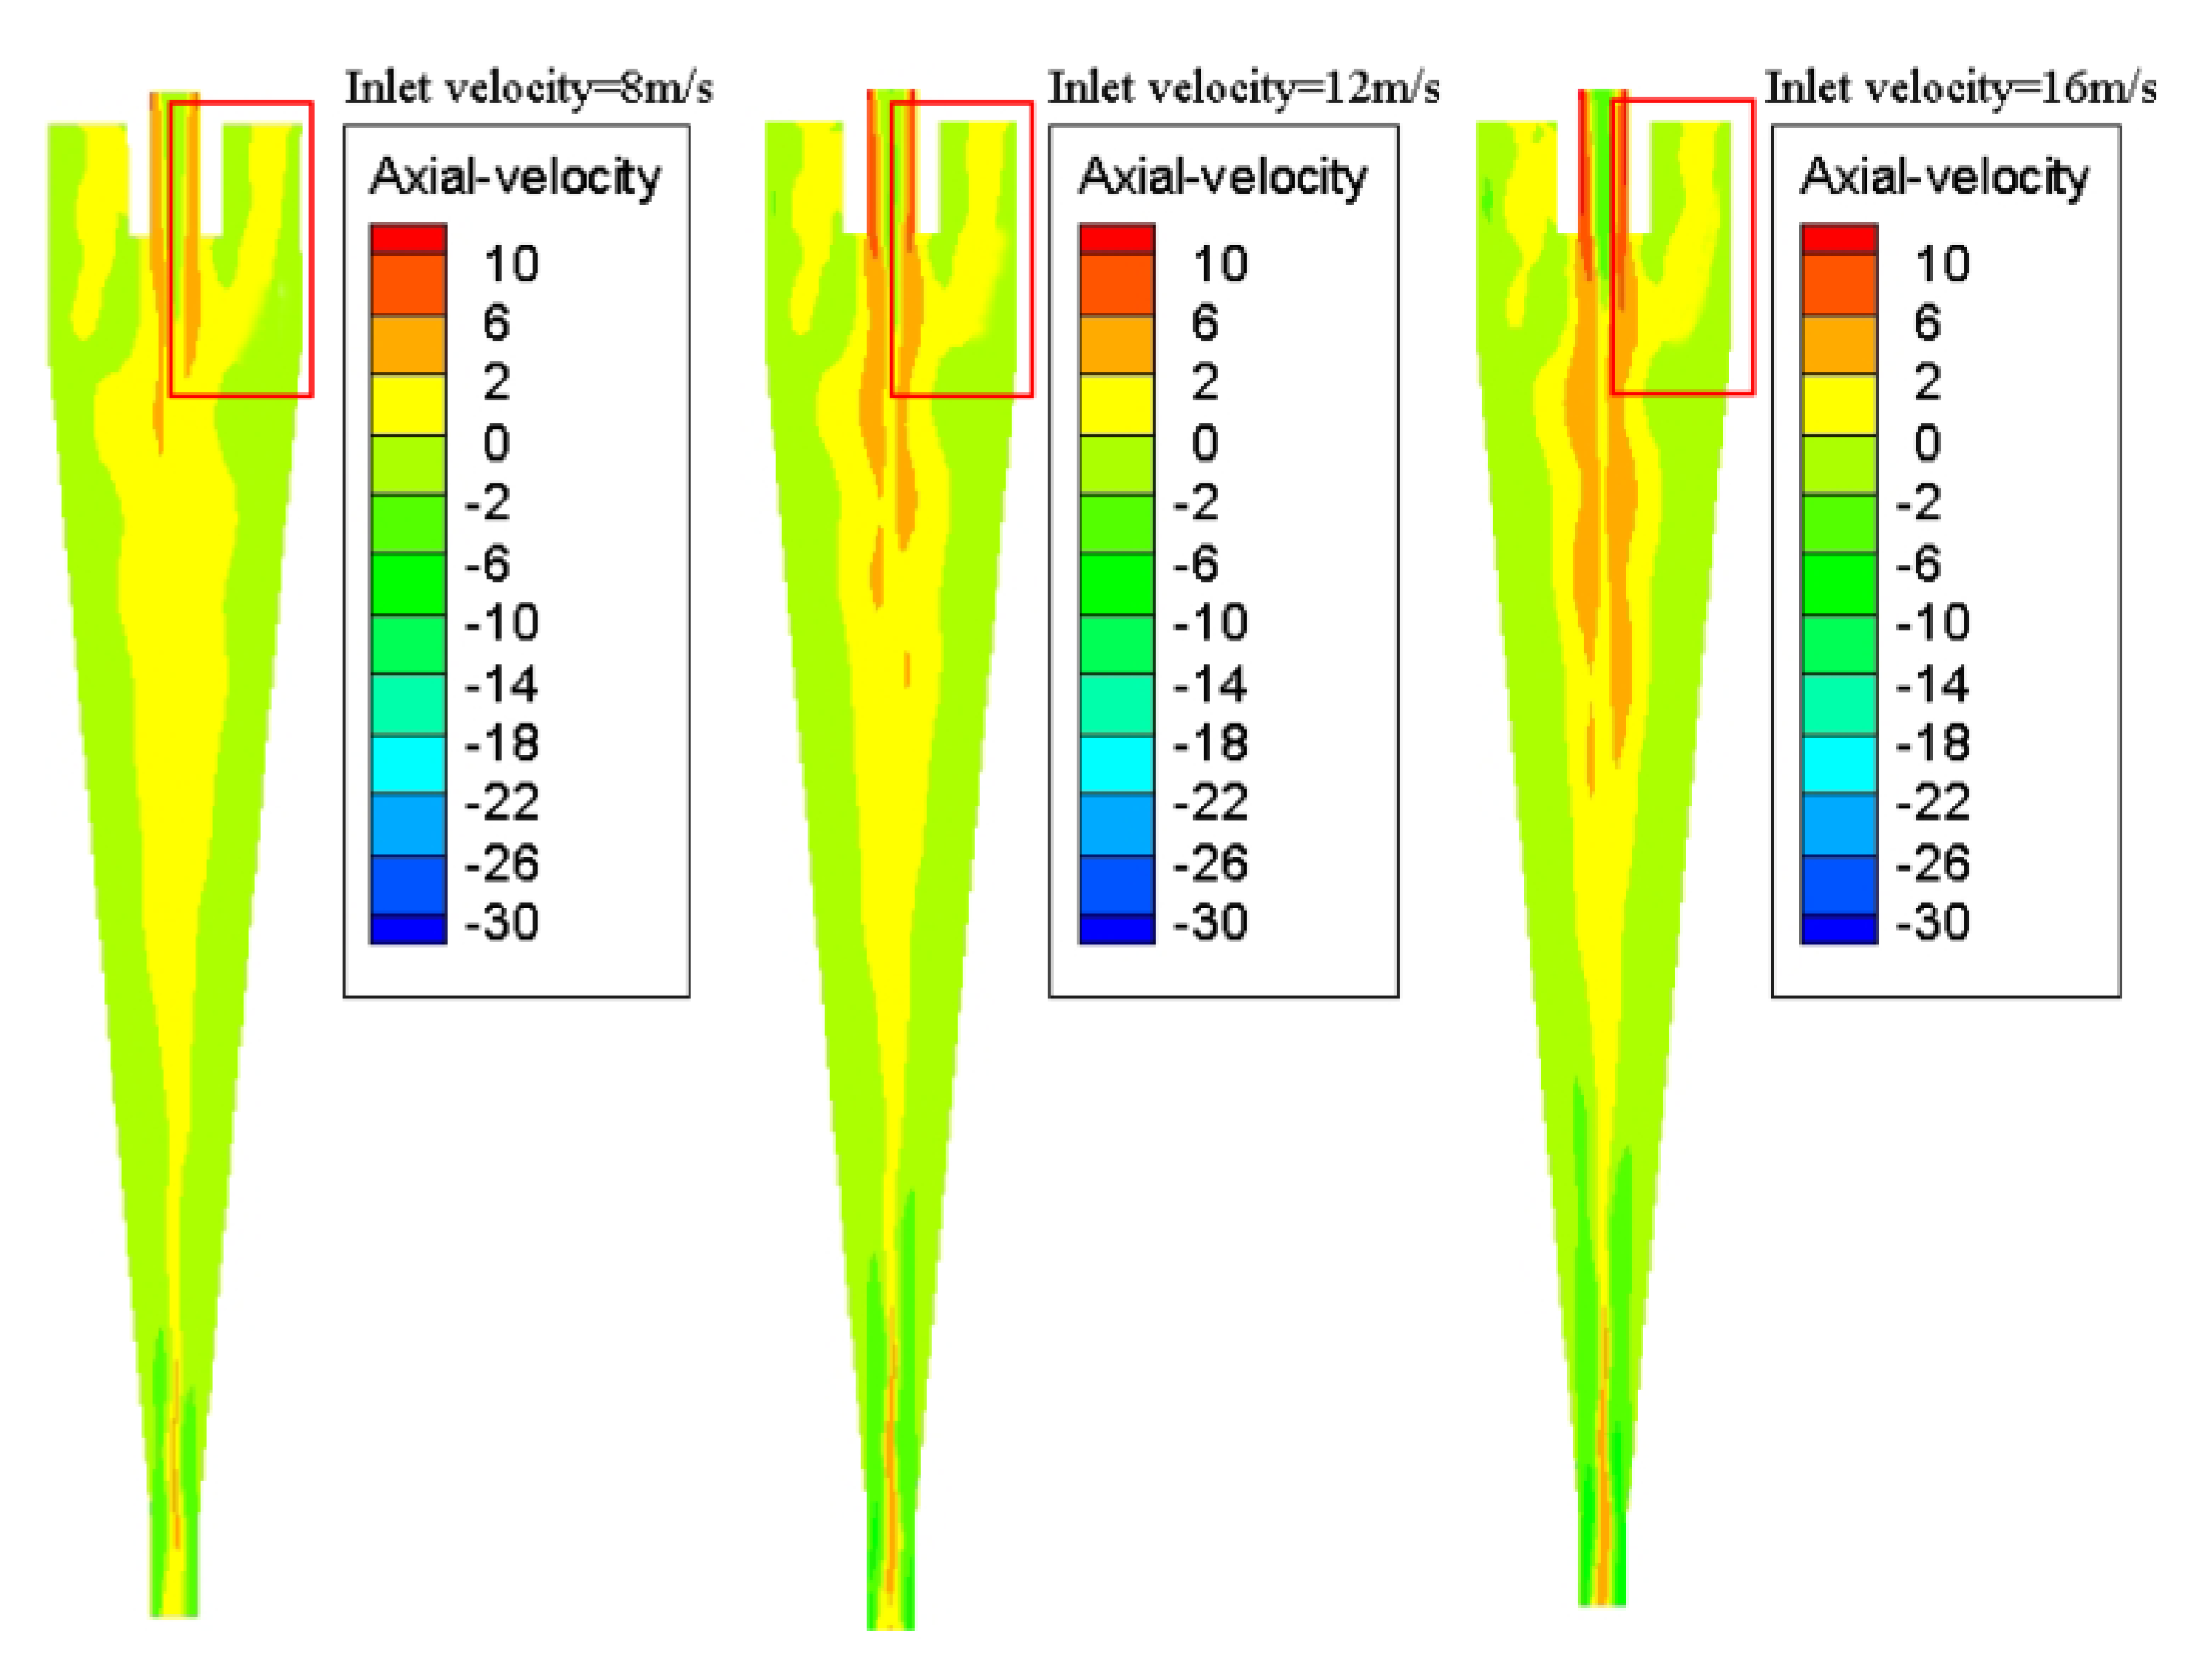
3.2.4. Axial Velocity

NGH particles are expected to enter the upward flow to be recovered, and the sand particles are expected to enter the downward flow to be removed. The axial velocity divides the flow field inside the hydrocyclone into up flow and down flow and determines the flow ratio. Therefore, axial velocity is a decisive factor in balancing the two objectives of NGH recovery efficiency and sand removal efficiency.
The axial velocity contours across the vertical plane with the different inlet velocities presented in Figure 9a. The axial velocity is divided into two regions by the zero axial velocity vectors (LZVVs) in the radial direction. In addition, there is a short circuit flow and a circulating flow near and below the vortex finder, respectively. The short circuit flow drives particles away from the separation area and directly into the upward flow, which can play a positive role in the recovery of NGH, but plays a negative role in the removal of sand particles. The circulating flow can separate the particles that have not entered the separation area into the separation area, which is beneficial to improve the separation efficiency. The pressure gradient force acting on NGH particles is greater than the sum of centrifugal force and fluid resistance. Therefore, NGH particles tend to move towards the center, then enter the upward flow through the axial zero velocity plane and eventually are recycled from the vortex finder. The centrifugal force acting on sand particles is greater than the sum of the pressure gradient force and fluid resistance. So, the sand particles have a tendency to move towards the wall, then move through the axial zero velocity surface into the downward flow, and finally are removed from the spigot. Furthermore, as the inlet velocity increases, the phenomenon of circulating flow and short circuit flow is more obvious. Therefore, a suitable inlet velocity value could control circulating flow and short circuit flow, ultimately maintaining the good performance of the NGH hydrocyclone.
The distribution curves of axial velocity over a diameter line of Z = 15, 120, 210, 300, and 390 mm with different inlet velocities are presented in Figure 9b. Here, axial velocity distribution along the radial and axial directions can be shown in more detail. Figure 9b shows that the values of axial velocity increase in both the positive region and negative region, and the short circuit flow increases when the inlet velocity increases. This demonstrates that there is more flow out of upward flow when the inlet velocity increases. It can be seen that the direction of the axial velocity changes, indicating that there is a certain backflow at the vortex finder and underflow.

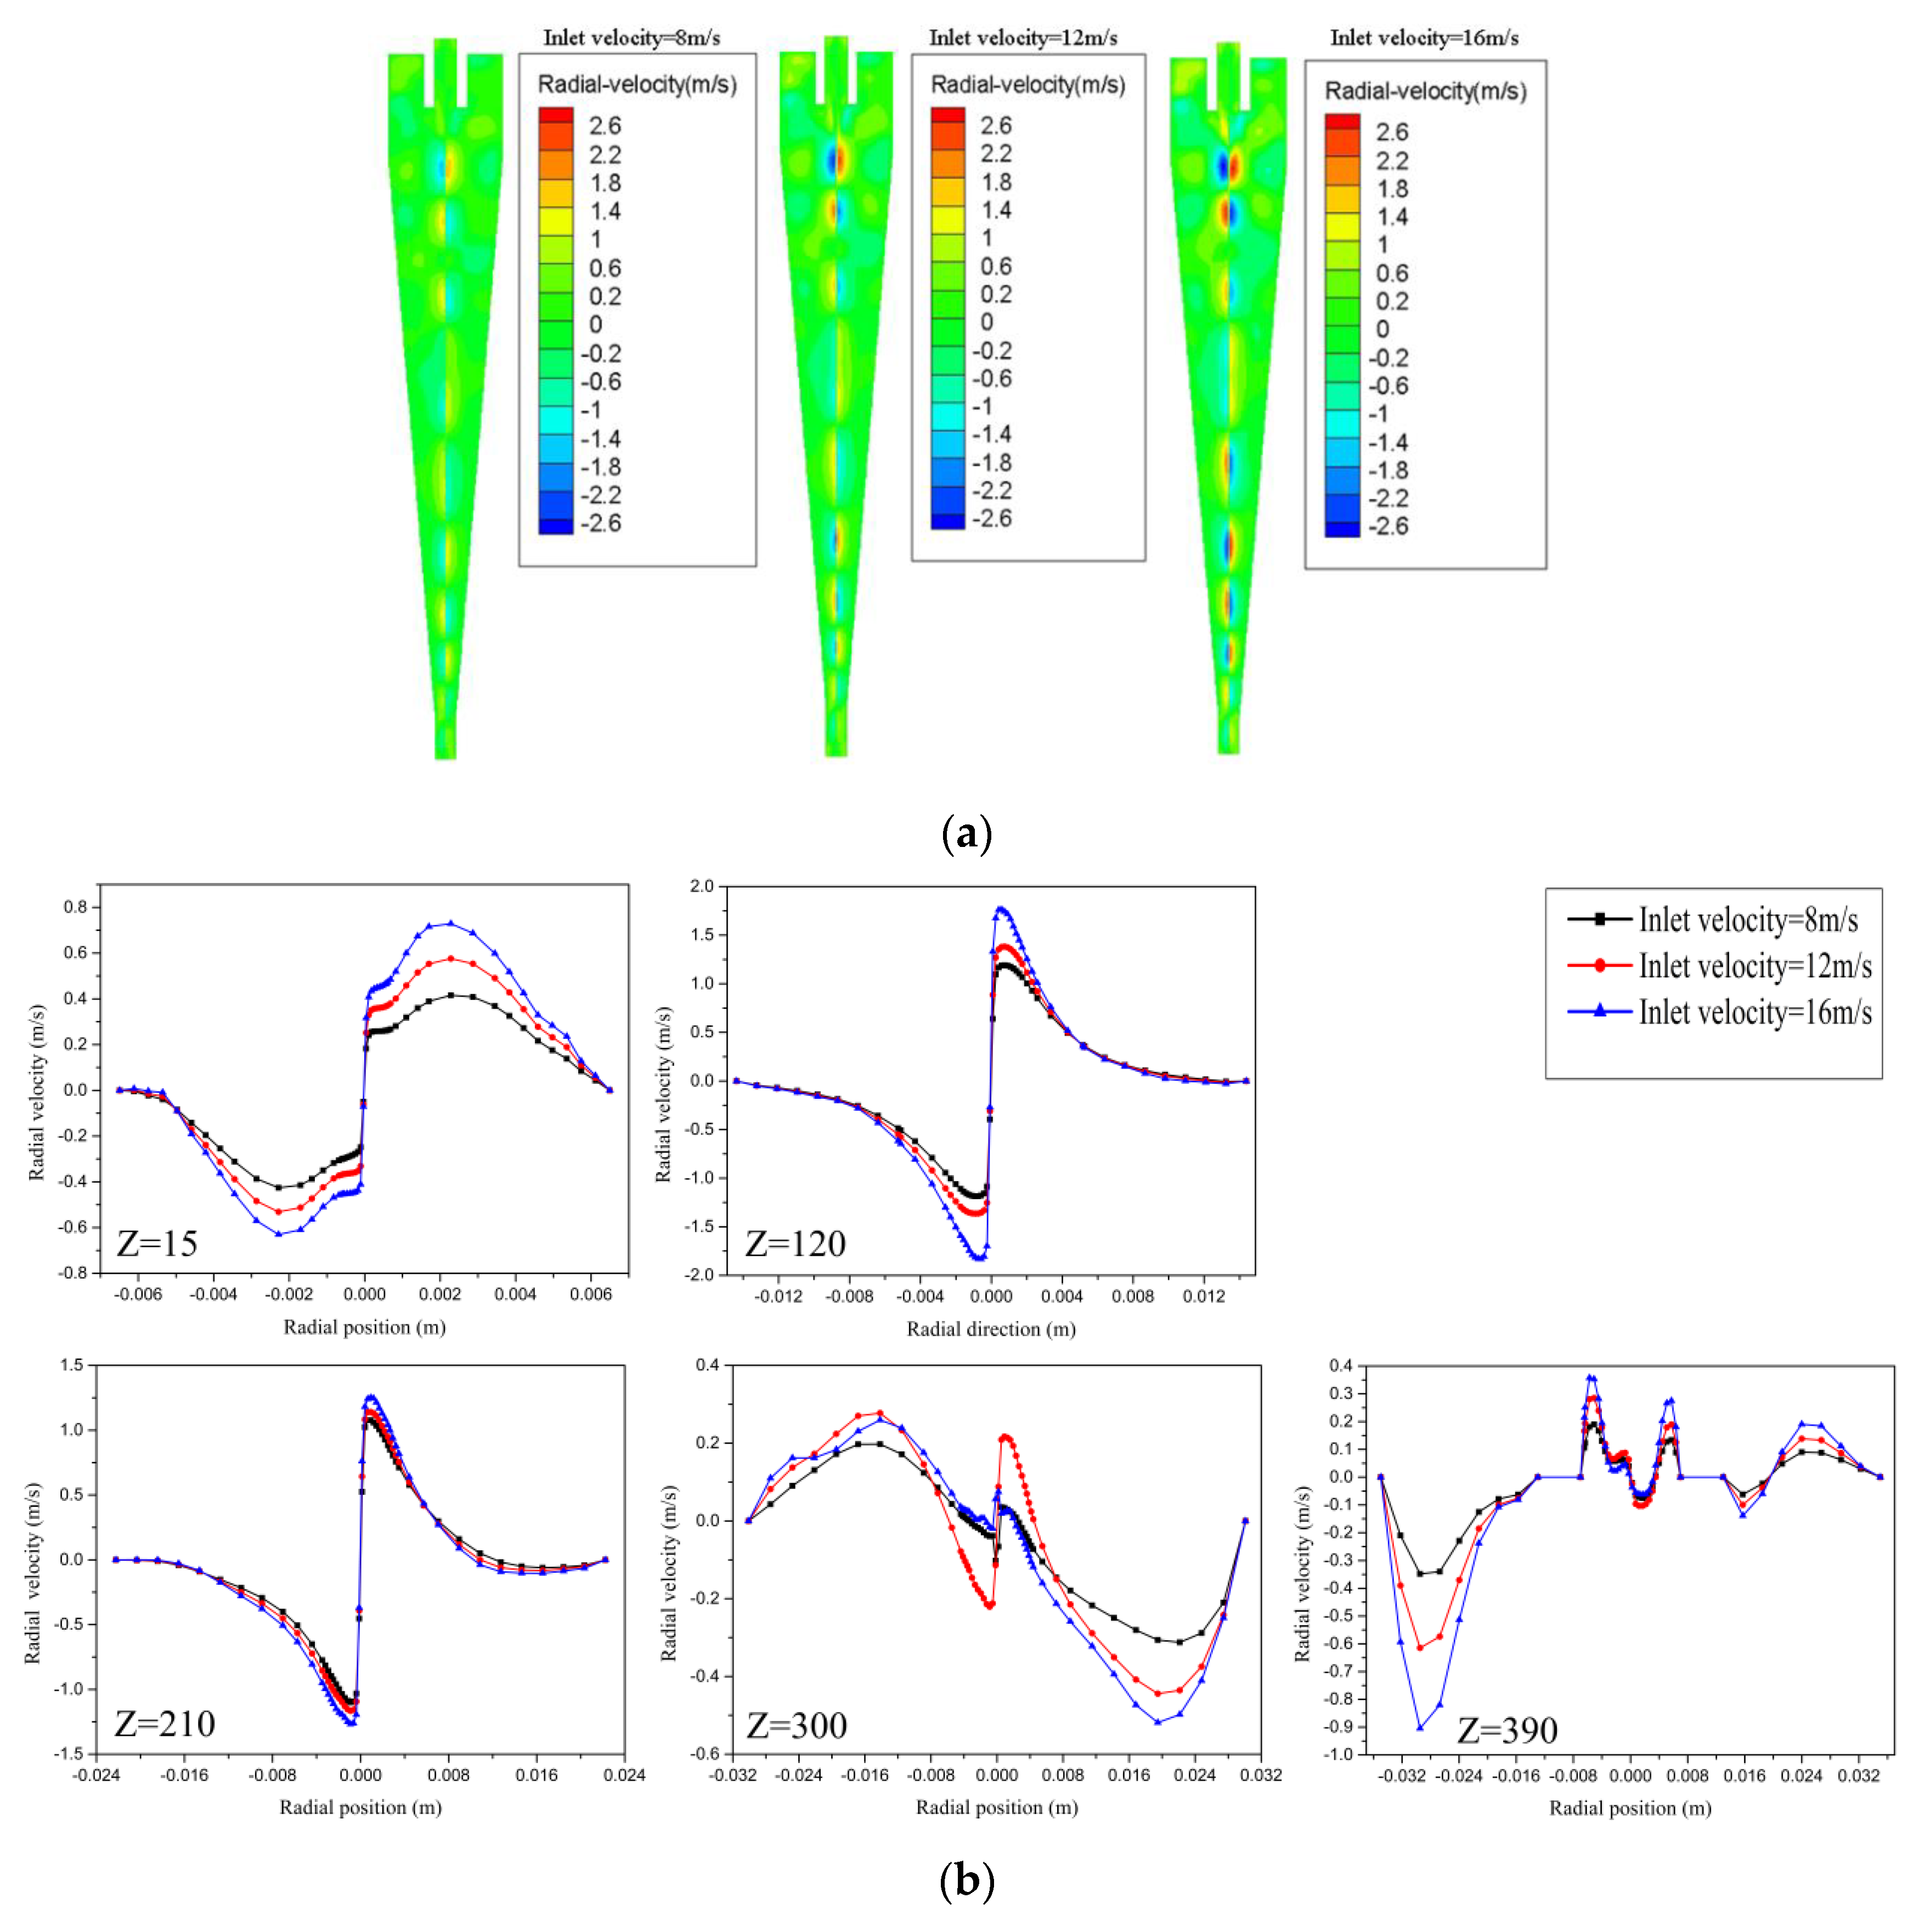
3.2.5. Radial Velocity

The radial velocity contours across vertical plane with different inlet velocities, as shown in Figure 10a. The negative values are radially inward, and the positive values are radially outward in this figure. It can be seen that, numerically, the tangential velocity and the axial velocity are much larger than the radial velocity. In the inner region, there is positive distribution on one side and negative distribution on the other, forming a schema of circulating flow. The main reason for this is that there is negative pressure on the upper and lower outlet, causing instability in the inner flow field. This is shown more clearly in Figure 10b, with distribution curves of the radial velocity over a diameter line of Z = 15, 120, 210, 300, and 390 mm with different inlet velocities. With increasing inlet velocity, the radial velocity increases. Furthermore, the instability trend of radial velocity is consistent with the turbulence distribution contours in Figure 6. The change in the radial velocity will have a certain influence on the separation of the particles, thus affecting the separation performance of NGH hydrocyclones.

3.3. Separation Performance

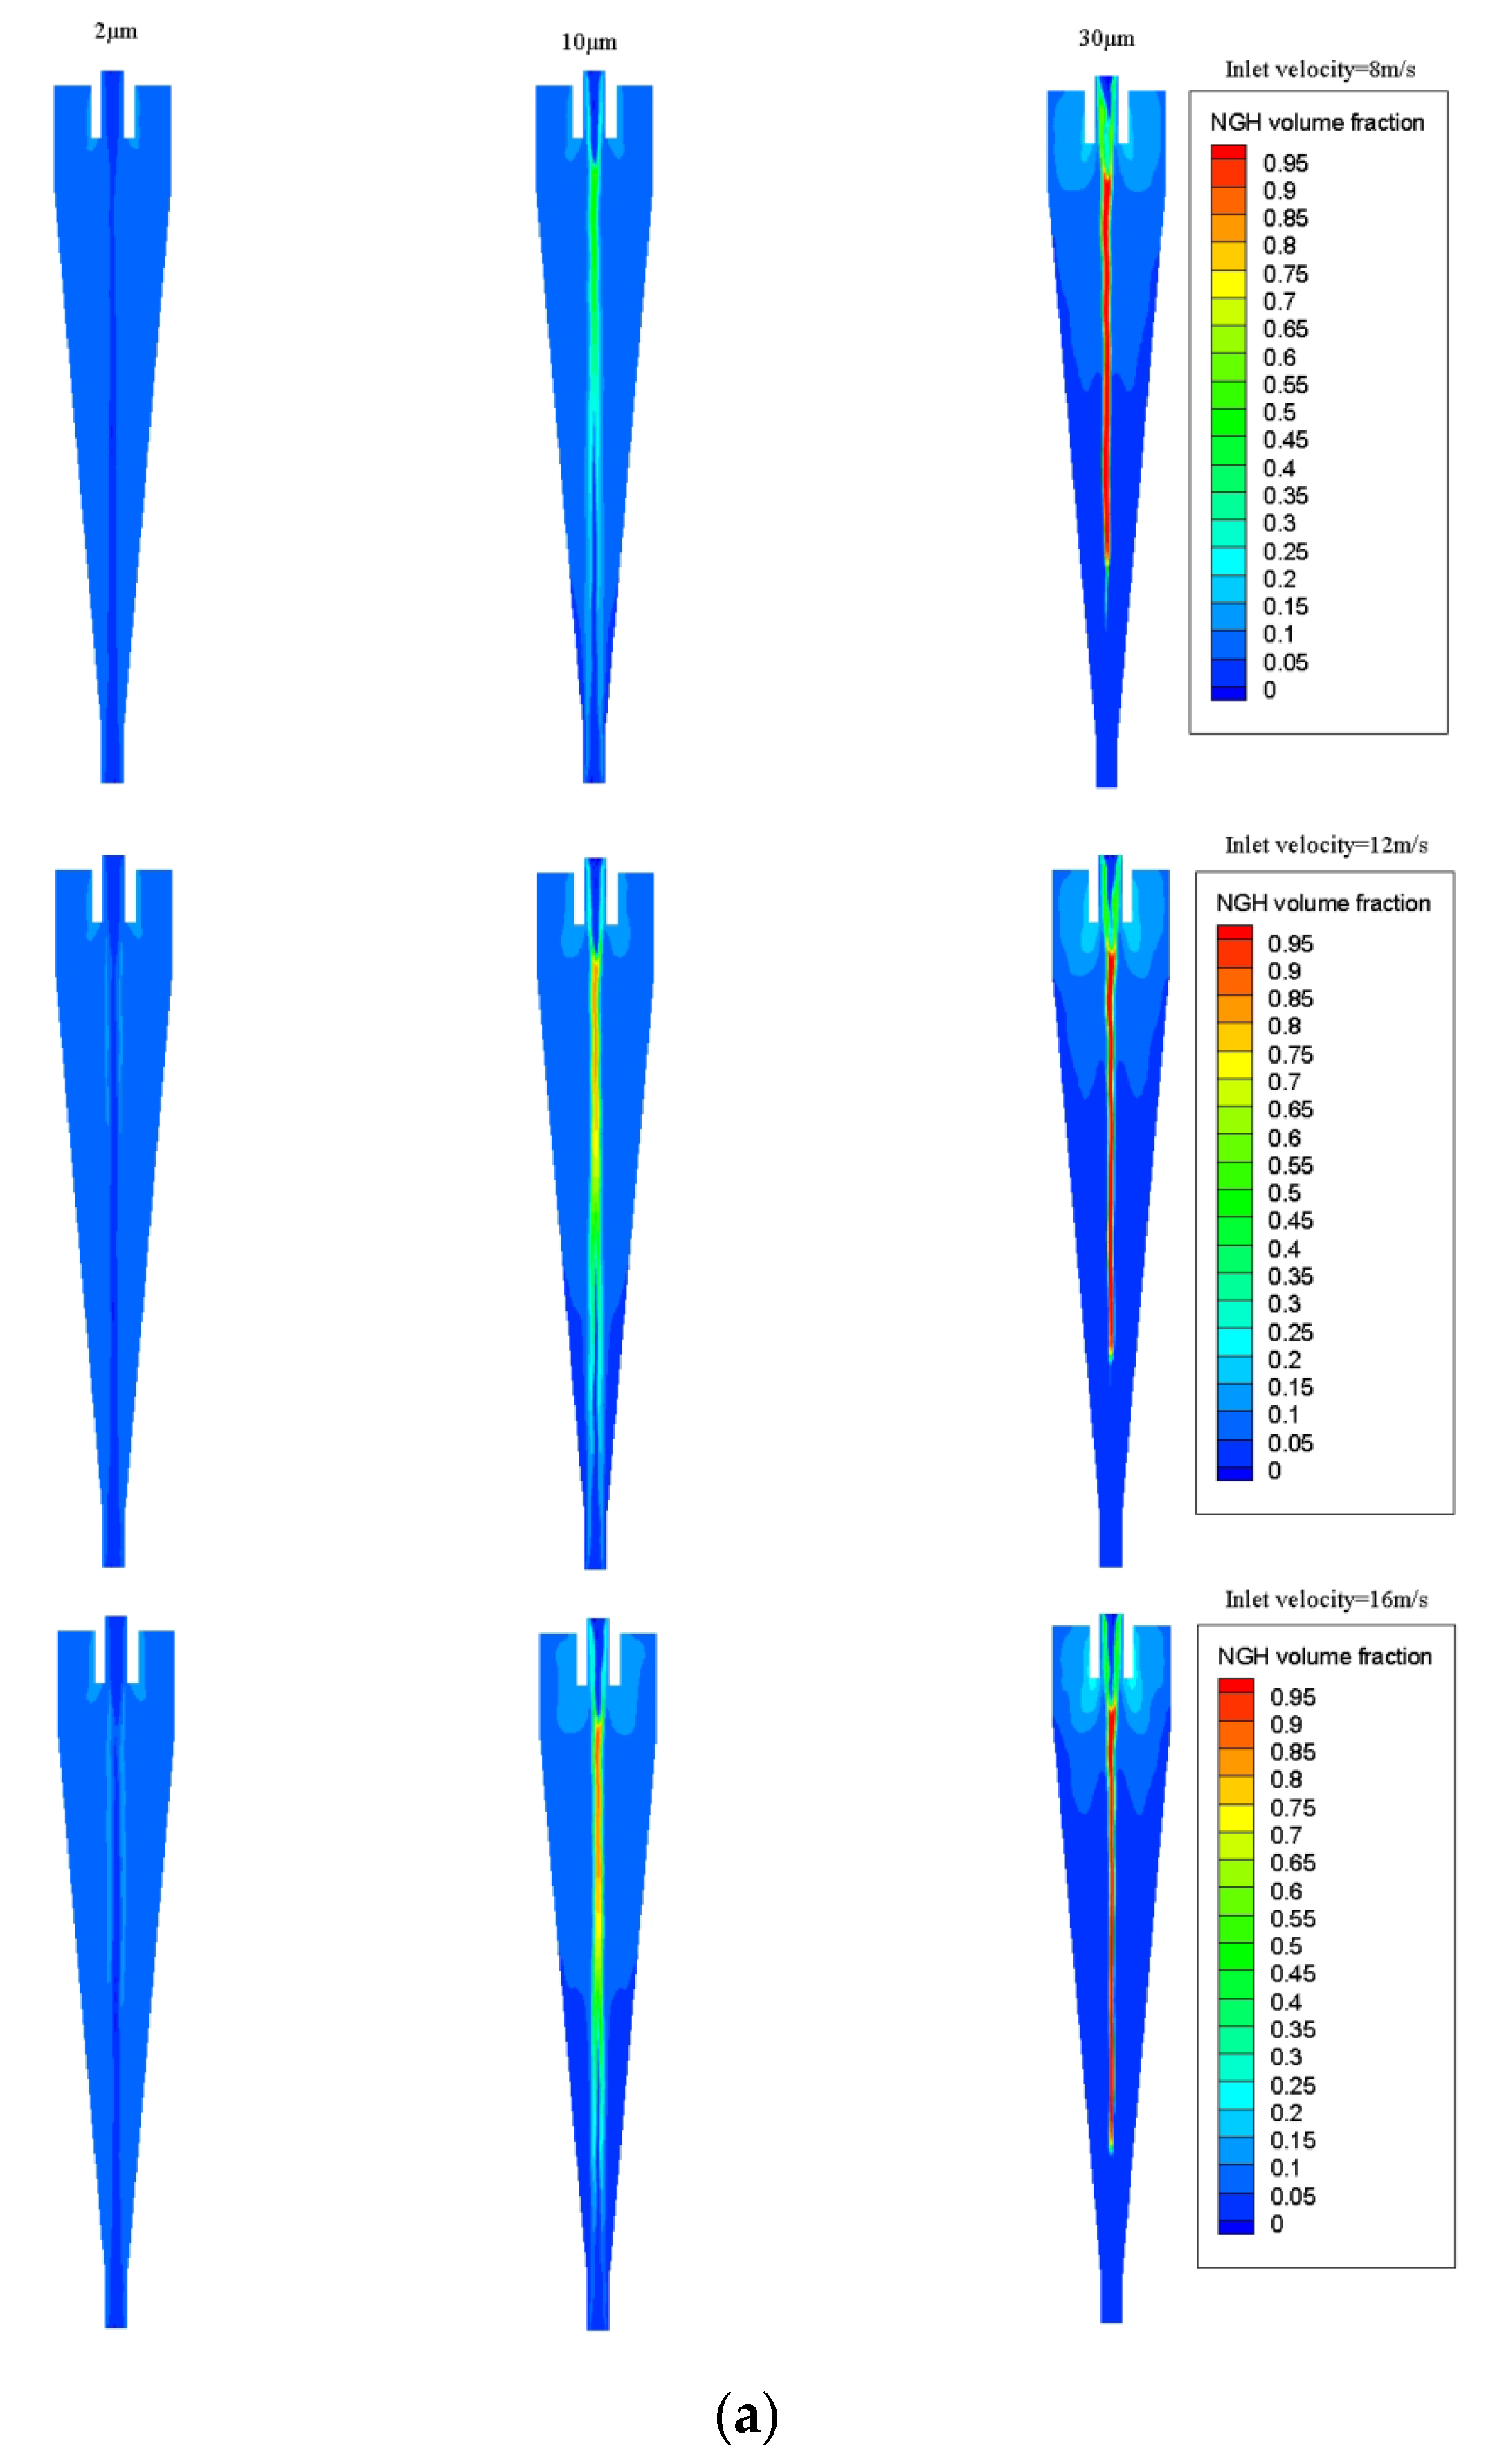
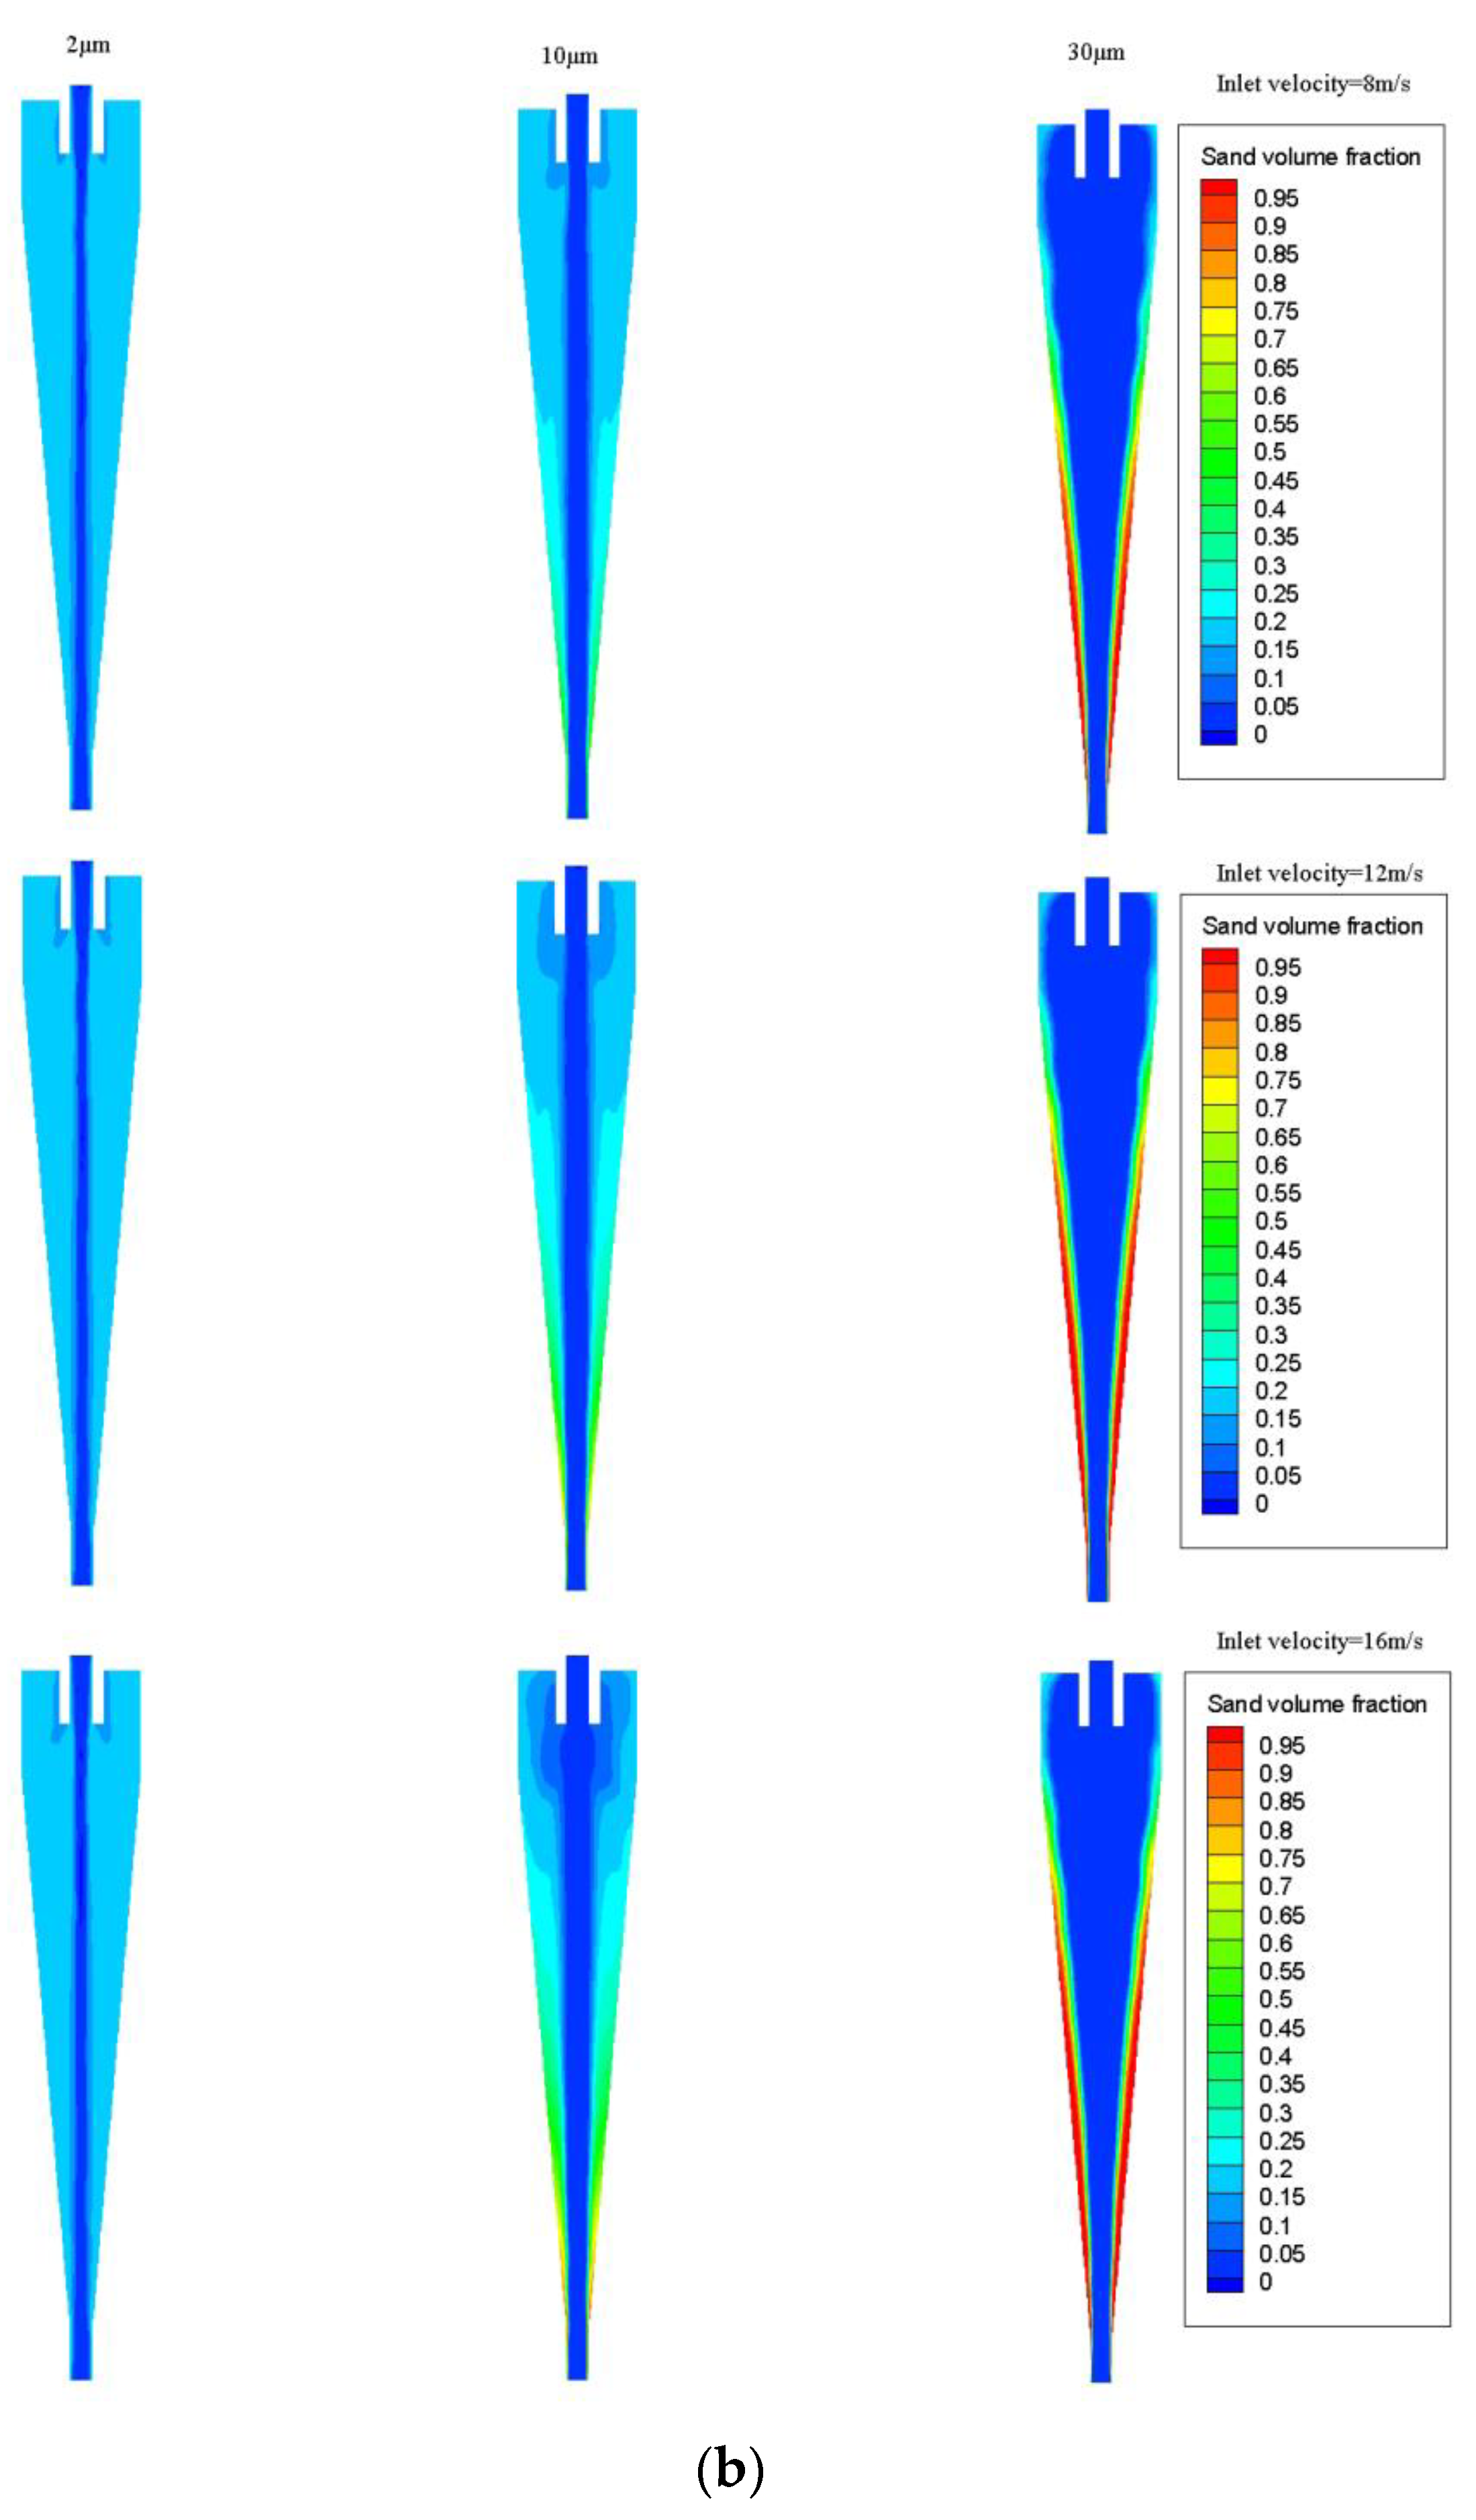
3.3.1. Solid Volume Fraction Distribution

Because the distribution of particle size is proportional, the characteristic particle size is usually used to represent the particle size distribution characteristics of the component. Especially in separation technology, generally speaking, the separation efficiency increases with the increase in particle size. The smaller the particle size, the lower the separation efficiency. The particle content of the maximum particle size is very small. Further, to understand the separation behaviors, the distribution of the solid volume fraction with a characteristic particle size of 2, 10, and 30 µm in the NGH hydrocyclone was investigated. Figure 11 shows the distributions of solid volume fraction contours across the vertical plane with different inlet velocities and different particle diameters, respectively.
The NGH solid volume fraction contours across the vertical plane with different inlet velocities and different particle diameters, as presented in Figure 11a. With the increase in particle diameter, the NGH volume fraction of enrichment along the center improves. The main reason for this is that the density of seawater is greater than that of NGH, so the pressure gradient force dominates the movement of NGH particles to the center. When NGH particle diameter increases, the pressure gradient force increases, which increases the probability of NGH particles moving to the center. The NGH volume fraction of enrichment along the center improves when the inlet velocity increases. The one reason for this is that the pressure gradient force increases, and the other reason is the strengthened short circuit flow, which is consistent with Figure 9.
The sand solid volume fraction contours across the vertical plane with different inlet velocities and different particle diameters, as presented in Figure 11b. Here, the sand solid volume fraction near the wall increases with an increase in particle diameter. The main reason for this is that the sand particles are dominated mainly by the centrifugal force toward the wall and then spiral up to the underflow. This shows that the hydrocyclone has good performance when the sand particle diameter is larger than 10 µm.
Generally, with the increase in inlet velocity, the volume fraction of sand particles near the wall increases, and the volume fraction of NGH particles near the center increases, which indicates that the NGH recovery efficiency and sand removal efficiency can be increased by increasing inlet velocity.

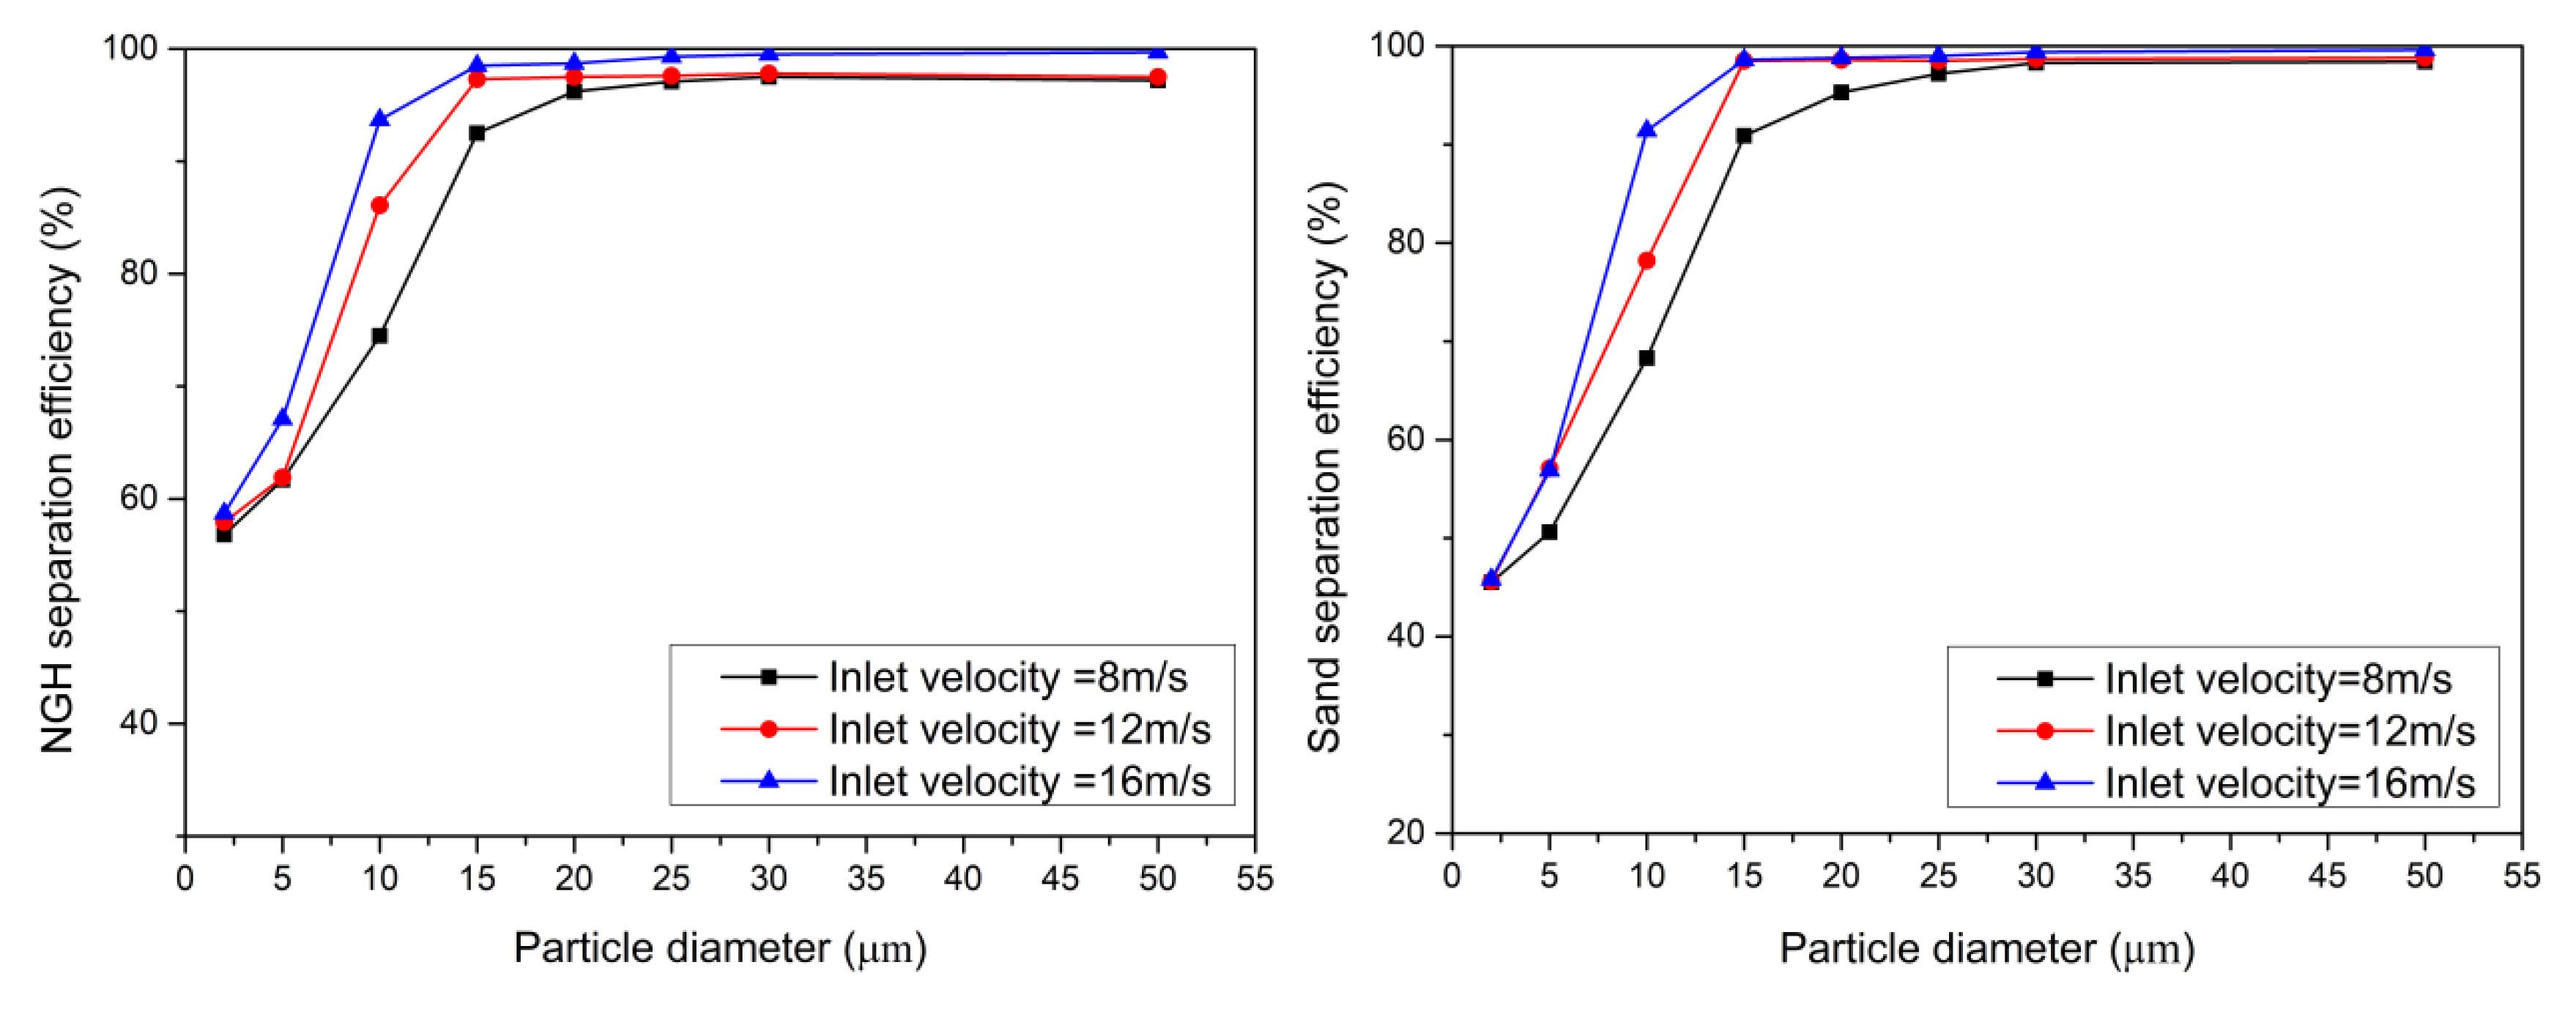
3.3.2. Separation Efficiency

Separation efficiency is one of the most important criterions to estimate the performance of the hydrocyclone. It is given by the following formula:
E = m u m i × 100 %
where mu and mi refer to the inlet and outlet mass flow rates of a hydrocyclone (kg/s), respectively. Specifically, the NGH recovery efficiency is the ratio of the NGH mass flow rate between the overflow outlet and the inlet. The sand removal efficiency is the ratio of the sand mass flow rate between the underflow outlet and the inlet.
The distribution curves of separation efficiency with different inlet velocities are presented in Figure 12, which indicates that when particle diameter increases, the separation efficiency firstly increases and then remains steady. The separation efficiency firstly increases continuously with an increase in inlet velocity, which is consistent with the solid phase distribution shown in Figure 11. The main reason for this is that with the increase in the inlet velocity, the pressure gradient and the tangential velocity obviously increase. Meanwhile the centrifugal force and the pressure gradient force are enhanced, and the movement of the particles is strengthened. In addition, the cut size of the NGH particle was less than 2 µm, and the cut size of the sand particle was approximately 5 µm. The cut size decreases with increasing inlet velocity. This shows that for fine particles, the separation performance of NGH is better than sand. Therefore, the maximum recovery of NGH can be achieved when sand particles are removed as much as possible. Besides, the separation efficiencies were greater than 80% when the particle diameter was over 15 µm. It is indicated that the NGH hydrocyclone has good performance, and is suitable for the purification of NGH slurry.

4. Conclusions

(1)
The distributions of static pressure, tangential velocity, axial velocity and radial velocity in the NGH hydrocyclone are the same as those in traditional hydrocyclones. However, unlike in the traditional hydrocyclone, the turbulence is more intense, and the larger value appears in the middle of the cone section in NGH hydrocyclone. Further, it is found that the short circuit flow contributed to the recovery of NGH.
(2)
To balance the two objectives of NGH recovery efficiency and sand removal efficiency, it is suggested that the the static pressure, and tangential velocity are controlled reasonably to govern NGH and sand particle movement. In addition, it is suggested that the axial velocity is used to control the split ratio of upward and downward flow.
(3)
With the increase in particle diameter and inlet velocity, the volume fraction of the NGH solid near the center of the hydrocyclone increases, and the volume fraction of the sand solid near the wall of hydrocyclone increases. The separation efficiency increases first and is then stable. Furthermore, most separation efficiencies were over 80%, and the differential pressure was less than 0.6 MPa. Overall, the results show that this NGH hydrocyclone can balance the two objectives of NGH recovery efficiency and sand removal efficiency and have good separation performance for NGH separation. The separation efficiency can be improved by changing the inlet velocity.
(4)
In this paper, the effects of phase change and particle shape on the NGH separation process are not considered. However, research on these effects is significant, and will be carried out in the later research.

Author Contributions

Conceptualization, G.W.; validation, S.Q.; formal analysis, S.Q.; investigation, S.Q.; data curation, L.W.; writing—original draft preparation, S.Q.; visualization, X.F.; supervision, G.W.; project administration, G.W.

Funding

National Key R&D Program of China, grant number 2016YFC0304008. National Key R&D Program of China, grant number 2018YFC0310201. Strategic Consultation Project of the Chinese Academy of Engineering, grant number 2017-XZ-10-02-02. Open Fund of State Key Laboratory of Oil and Gas Reservoir Geology and Exploitation (Southwest Petroleum University), grant number PLN201827. Miaozi Engineering Cultivation Project of Sichuan Science and Technology Department, grant number 2019090.

Acknowledgments

The authors are grateful to the National Key R&D Program of China (2016YFC0304008 and 2018YFC0310201), the Strategic Consultation Project of the Chinese Academy of Engineering (2017-XZ-10-02-02), Open Fund (PLN201827) of State Key Laboratory of Oil and Gas Reservoir Geology and Exploitation (Southwest Petroleum University) and Miaozi Engineering Cultivation Project of Sichuan Science and Technology Department, grant number 2019090 for the financial support of this work.

Conflicts of Interest

The authors declare no conflict of interest.

References

  1. Kezirian, M.T.; Phoenix, S.L. Natural Gas Hydrate as a Storage Mechanism for Safe, Sustainable and Economical Production from Offshore Petroleum Reserves. Energies 2017, 10, 828. [Google Scholar] [CrossRef]
  2. Boswell, R.; Collett, T.S. Current perspectives on gas hydrate resources. Energy Environ. Sci. 2011, 4, 1206–1215. [Google Scholar] [CrossRef]
  3. Collett, T.S.; Johnson, A.H.; Knapp, C.C.; Boswell, R. Natural gas hydrates—A review. Browse Collect. 2009, 89, 146–219. [Google Scholar]
  4. Masui, A.; Haneda, H.; Ogata, Y.; Aoki, K. Mechanical Properties of Sandy Sediment Containing Marine Gas Hydrates In Deep Sea Offshore Japan. In Proceedings of the Seventh ISOPE Ocean Mining Symposium, Lisbon, Portugal, 1–6 July 2007; International Society of Offshore and Polar Engineers (SPE): Richardson, TX, USA, 2007; p. 4. [Google Scholar]
  5. Chong, Z.R.; Yang, S.H.B.; Babu, P.; Linga, P.; Li, X.S. Review of natural gas hydrates as an energy resource: Prospects and challenges. Appl. Energy 2016, 162, 1633–1652. [Google Scholar] [CrossRef]
  6. Zhang, W.; Shao, M.J.; Tian, Q.L. Technical Progress of a Pilot Project to Produce Natural Gas Hydrate in Japanese Waters. Pet. Drill. Tech. 2017, 45, 101–105. [Google Scholar]
  7. Lu, J.; Xiong, Y.; Li, D.; Shen, X.; Wu, Q.; Liang, D. Experimental Investigation of Characteristics of Sand Production in Wellbore during Hydrate Exploitation by the Depressurization Method. Energies 2018, 11, 1673. [Google Scholar] [CrossRef]
  8. Feng, J.C.; Wang, Y.; Li, X.S. Entropy generation analysis of hydrate dissociation by depressurization with horizontal well in different scales of hydrate reservoirs. Energy 2017, 125, 62–71. [Google Scholar] [CrossRef]
  9. Zhou, S.W.; Chen, W.; Li, Q.P.; Zhou, J.L.; Shi, H.S. Research on the solid fluidization well testing and production for shallow non-diagenetic natural gas hydrate in deep water area. Offshore Oil Gas China 2017, 29, 1. [Google Scholar]
  10. Zhou, S.; Zhao, J.; Li, Q.; Chen, W.; Zhou, J.; Wei, N.; Sun, W. Optimal Design of the Engineering Parameters for the first Global Trial Production of Marine Natural Gas Hydrates through Solid Fluidization. Nat. Gas Ind. 2018, 5, 118–131. [Google Scholar] [CrossRef]
  11. Qiu, S.Z.; Wang, G.R.; Zhou, S.W.; Liu, Q.Y.; Zhong, L.; Wang, L.Z. The downhole hydrocyclone separator for purifying natural gas hydrate: Structure design, optimization, and performance. Sep. Sci. Technol. 2019, 1–11. [Google Scholar] [CrossRef]
  12. Bu, X.N.; Zhang, T.T.; Peng, Y.L.; Xie, G.Y.; Wu, E.D. Multi-Stage Flotation for the Removal of Ash from Fine Graphite Using Mechanical and Centrifugal Forces. Minerals 2018, 1, 15. [Google Scholar] [CrossRef]
  13. Ni, L.; Tian, J.; Song, T.; Jong, Y.; Zhao, J. Optimizing Geometric Parameters in Hydrocyclones for Enhanced Separations: A Review and Perspective. Sep. Purif. Rev. 2019, 48, 30–51. [Google Scholar] [CrossRef]
  14. Liu, Y.; Cheng, Q.; Zhang, B.; Tian, F. Three-phase hydrocyclone separator—A review. Chem. Eng. Res. Des. 2015, 100, 554–560. [Google Scholar] [CrossRef]
  15. Wang, H.; Zhang, Y.; Wang, J. Cyclonic Separation Technology: Researches and Developments. Chin. J. Chem. Eng. 2012, 20, 212–219. [Google Scholar] [CrossRef]
  16. Jiang, L.; Liu, P.; Zhang, Y.; Yang, X.; Wang, H. The Effect of Inlet Velocity on the Separation, Performance of a Two-Stage Hydrocyclone. Minerals 2019, 9, 209. [Google Scholar] [CrossRef]
  17. Liow, J.L.; Oakman, O.A. Performance of mini-axial hydrocyclones. Miner. Eng. 2018, 122, 67–78. [Google Scholar] [CrossRef]
  18. Zhu, G.; Liow, J.L.; Neely, A. Computational study of the flow characteristics and separation efficiency in a mini-hydrocyclone. Chem. Eng. Res. Des. 2012, 90, 2135–2147. [Google Scholar] [CrossRef]
  19. Zhao, Q.; Cui, B.; Wei, D.; Song, T.; Feng, Y. Numerical analysis of the flow field and separation performance in hydrocyclones with different vortex finder wall thickness. Powder. Technol. 2019, 345, 478–491. [Google Scholar] [CrossRef]
  20. Shi, S.Y.; Xu, J.Y. Flow field of continuous phase in a vane-type pipe oil–water separator. Exp. Therm. Fluid Sci. 2015, 60, 208–212. [Google Scholar] [CrossRef]
  21. Evans, W.K.; Suksangpanomrung, A.; Nowakowski, A.F. The simulation of the flow within a hydrocyclone operating with an air core and with an inserted metal rod. Chem. Eng. J. 2008, 143, 51–61. [Google Scholar] [CrossRef]
  22. Ghodrat, M.; Kuang, S.B.; Yu, A.B.; Vince, A.; Barnett, G.D.; Barnett, P.J. Numerical analysis of hydrocyclones with different vortex finder configurations. Miner. Eng. 2014, 63, 125–138. [Google Scholar] [CrossRef]
  23. Kuang, S.B.; Chu, K.W.; Yu, A.B.; Vince, A. Numerical study of liquid–gas–solid flow in classifying hydrocyclones: Effect of feed solids concentration. Miner. Eng. 2012, 31, 17–31. [Google Scholar] [CrossRef]
  24. Wang, B.; Chu, K.W.; Yu, A.B.; Vince, A.; Barnett, G.D.; Barnett, P.J. Computational study of the multiphase flow and performance of dense medium cyclones: Effect of body dimensions. Miner. Eng. 2011, 24, 19–34. [Google Scholar] [CrossRef]
  25. Hsieh, K.T.; Rajamani, K. Phenomenological model of hydrocyclone: Model development and verification for single-phase flow. Int. J. Miner. Process. 1988, 22, 223–237. [Google Scholar] [CrossRef]
  26. Delgadillo, J.A. Modelling of 75- and 250-mm Hydrocyclones and Exploration of Novel Designs Using Computational Fluid Dynamics. Ph.D. Thesis, University of Utah, Salt Lake City, UT, USA, 2006. [Google Scholar]
Figure 1. The exploitation process of natural gas hydrate (NGH).
Energies 12 03257 g001
Figure 2. The geometrical parameters and mesh of the hydrocyclone.
Energies 12 03257 g002
Figure 3. The geometrical parameters and mesh of the hydrocyclone.
Energies 12 03257 g003
Figure 4. Model validation of comparison curves. (a) A comparison of the axial and tangential velocity on the vertical plane located at 60 mm away from the top of the 75-mm hydrocyclone. (b) A comparison of separation efficiency curves from the reference experimental date and our simulation in the 250-mm hydrocyclone with the 27.2%, by weight, limestone feed.
Energies 12 03257 g004
Figure 5. Schematic diagram of the position distribution of the vertical plane.
Energies 12 03257 g005
Figure 6. The turbulence intensity contours across the vertical plane with different inlet velocities.
Energies 12 03257 g006
Figure 7. The static pressure across the vertical plane with different inlet velocities. (a) The static pressure contours across the vertical plane with different inlet velocities. (b) The distribution curves of static pressure over a diameter line of Z = 15, 120, 210, 300, and 390 mm with different inlet velocities.
Energies 12 03257 g007
Figure 8. The tangential velocity across the vertical plane with different inlet velocities. (a) The tangential velocity contours across the vertical plane with different inlet velocities. (b) The distribution curves of tangential velocities over a diameter line of Z = 15, 120, 210, 300, and 390 mm with different inlet velocities.
Energies 12 03257 g008
Figure 9. The axial velocity across the vertical plane with different inlet velocities. (a) The axial velocity contours across the vertical plane with different inlet velocities. (b) The distribution curves of axial velocities over a diameter line of Z = 15, 120, 210, 300, and 390 mm with different inlet velocities.
Energies 12 03257 g009aEnergies 12 03257 g009b
Figure 10. The radial velocity across the vertical plane with different inlet velocities. (a) The radial velocity contours across the vertical plane with different inlet velocities. (b) The distribution curves of radial over a diameter line of Z = 15, 120, 210, 300, and 390 mm with different inlet velocities.
Energies 12 03257 g010
Figure 11. The solid volume fraction contours across the vertical plane with different inlet velocities and different particle diameters. (a) The NGH solid volume fraction contours. (b) The sand solid volume fraction contours.
Energies 12 03257 g011aEnergies 12 03257 g011b
Figure 12. The distribution curves of separation efficiency with different inlet velocities.
Energies 12 03257 g012
Table 1. Structural parameters of hydrocyclones.
NamesSize
Dominant diameter D, mm70
Inlet height a, mm18
Inlet width b, mm6
Vortex finder diameter d0, mm14
Vortex finder length L0, mm50
Cylindrical length L, mm60
Cone angle, °10
Spigot diameter ds, mm13
Table 2. Relationship between total number of computational cells and maximum static pressure.
Mesh SizesMaximum Static Pressure (MPa)
100,0000.161555
200,0000.293760
300,0000.389087
400,0000.389125
500,0000.389053
Table 3. Boundary and initial condition.
ParameterValue
Inlet velocity, m/s (Inlet flow rates, m3/h)8, 12, 16 (3.11, 4.67, 6.22)
Particle diameter, μm2, 10, 30
Outlet pressure, MPa0
Operating condition: temperature, °C, and pressure, MPa13 and 14
Table 4. Physical parameters of various media.
MediaDensity, kg/m3Viscosity, kg/m/sVolume Fraction, %
Seawater10250.001775
Sand2600-15
NGH910-10

