Article

Efficient Methods of Market Pricing in Power Industry within the Context of System Integration of Renewable Energy Sources

1
Department of Economics in Power Engineering and Industry, National Research University “Moscow Power Engineering Institute”, Krasnokazarmennaya st. 14, Moscow 111250, Russia
2
OAC INTER RAO UES, Bolshaya Pirogovskaya st. 27, Moscow 119435, Russia
3
Faculty of Economics, Peoples’ Friendship University of Russia, Miklukho-Maklaya Str. 6, Moscow 117198, Russia
4
Department of Marketing, State University of Management, 99 Ryazan Avenue, Moscow 109542, Russia
*
Author to whom correspondence should be addressed.
Energies 2019, 12(17), 3250; https://doi.org/10.3390/en12173250
Submission received: 24 July 2019 / Revised: 16 August 2019 / Accepted: 19 August 2019 / Published: 23 August 2019
(This article belongs to the Special Issue Market Design for a High-Renewables Electricity System)

Abstract

:
Currently, the majority of world economies (even those located in the sunbelt (+/− 35 degrees of latitude with good sunshine with low seasonality) uses various types of fossil fuels as the main source of energy for their economies. However, this represents a very volatile and unsustainable strategy, since according to various estimates, the fossil fuel era will inevitably end as all carbon fuels are going to be spent in the next few centuries. Unlike traditional energy, renewable energy sources (RES) are not based on energy resources, but rather rely upon natural energy flows. With regard to its unique property, there has been an active construction of power plants of renewable energy and their gradual integration into national energy supply systems in recent decades. At the same time, the existing models of electricity markets were unprepared for their wide distribution. Hence, determination of the market value of energy generated by power plants using renewable energy sources becomes a particularly significant issue. This market value has to take into account the prevention of costs from the use of fossil fuels, as well as the resulting environmental benefits. Our paper proposes methods for solving this problem, contributing to the increase of economic efficiency of investment projects for the construction of renewable energy facilities and the formation of economic incentives for their propagation in energy supply systems. The proposed methods are based on the dynamic differentiation of tariffs for consumers with renewable energy sources depending on their structure of electricity consumption. Its effectiveness is demonstrated by calculating the cost of electricity for households located in the Krasnodar region using renewable energy sources. It is shown that this approach to the formation of tariffs for consumers allows the household to receive additional savings from the efficient use of energy installations on RES and energy storage devices in terms of alignment of the energy consumption schedule. This creates a significant incentive for households to use them and contributes to increasing the effectiveness of government renewable energy support programs, including by solving the acute problem of raising electricity tariffs from the grid.

1. Introduction

Over the past few decades, the views on the role of traditional hydrocarbon energy changed dramatically. An increasing stress in concepts of development of a human society of the future is made on power engineering on the basis of using the renewable energy sources, as Melas et al., Augutis et al., Bhattacharya et al., and Umbach et al. have consistently shown through examples of various countries across the world [1,2,3,4]. The answer to the question of why this is happening lies not only in the consideration of actions of economic mechanisms and incentives in the energy sector. One can see that the answer also partly lies in a political subtext of energy development based on renewable energy, its scientific, environmental, and social aspects and so on. All of them form the outer visible part of the energy economic and policy iceberg.
Within the core of the hidden processes of close attention of governments of many countries to the development of renewable energy generation one can find careful attempts to find the scale and depth of the next energy crisis. Its occurrence is only a matter of time, due to many factors, the main of which are the following two: (i) physically limited amount of extracted energy sources, and (ii) the constant growth of energy consumption by human civilization, as Qureshi et al., Uz, or Ang et al. point out in their papers in the relevant energy-focused journals [5,6,7]. Particularly noteworthy is the fact that electricity is no longer just an additional benefit. As a result of the serious growth of the world’s population and the concomitant restructuring of all vital industries nowadays, energy has become the key to the survival of billions of people all around the world.
In an attempt to avoid the consequences of a social and economic shock as a result of the energy crisis, various countries took steps to break the vicious circle and provide the basis for ensuring the minimum necessary level of power generation within the national energy systems [8,9]. This explains the emergence of keen interest in renewable energy based on the use of natural energy flows. Their integration into power systems is one of the priority tasks of the energy policy of a number of countries aimed at ensuring energy security, despite the fact that renewable energy sources in many cases are characterized by low economic efficiency and form many problems associated with the optimization and management of operating modes of power systems. For instance, some researchers [10,11,12,13] explain this by the uneven production of renewable energy and its inconsistency with the electricity consumption schedule. Moreover, the introduction of renewable energy often leads to an increase in the cost of energy for the end consumer. Some other researchers [14,15,16] note that the increase in the cost of electricity is primarily due to an increase in the grid tariff due to a decrease in electricity consumption from the grid and an increase in the demand for peak power capacities.
Most recently, academic research and engineering projects conducted in the field of development of renewable energy have started to gain serious attention.
Serious state support is provided for scientific and technological developments of renewable energy power plants, the emphasis of which is shifted towards increasing their installed capacity. As noted in the papers [17,18,19], an increase in the unit capacity of power plants leads to a reduction in the cost of electricity production.
Another direction in the field of the use of renewable energy sources which is developing no less intensively is the development, creation and operation of small power plants. According to many authors [20,21,22,23], they focus on the needs of private households or small settlements. It is worth noting that the military departments of most countries are strongly interested in creating such autonomous systems, which ensures a constant flow of funds to finance such projects.
To achieve the goals of national strategies for the development of renewable energy and increase their investment attractiveness at the level of governments and energy departments of countries, it is necessary to develop state tariff policy tools aimed at introducing and using renewable energy sources in energy supply systems. They should include economic incentives to optimize energy consumption through the introduction of autonomous energy sources and be based on differentiated pricing by hour area of the day. At the same time, as practice shows, differentiated tariffs are often less profitable for the consumer than a fixed tariff during the billing period [14,15]. This is due to the discrepancy between the fixed values of the tariff rates established for the time zones and the actual daily energy consumption schedule. Taking into account the development of automated systems for commercial metering of electricity, it is necessary to develop a pricing method that takes into account real-time changes in energy consumption and stimulates consumers and manufacturers to introduce and effectively use renewable energy sources.
This paper aims to solve the following important problems and issues:
  • Inconsistency between the existing systems for differentiating electricity tariffs by time zones and real daily energy consumption schedules which leads to inefficiency of the tariff policy in the field of energy management of consumers and their irrational use of renewable energy sources.
  • The need to reduce the growth in the cost of electricity for consumers from the power supply system caused by suboptimal loading of the production capacity of the energy system when consumers use autonomous energy sources based on renewable energy sources.
  • Stimulating consumers to align the schedule of electricity consumption during the day and increase the efficiency of using autonomous energy sources based on renewable energy sources (RES), including the use of electric energy storage technology.

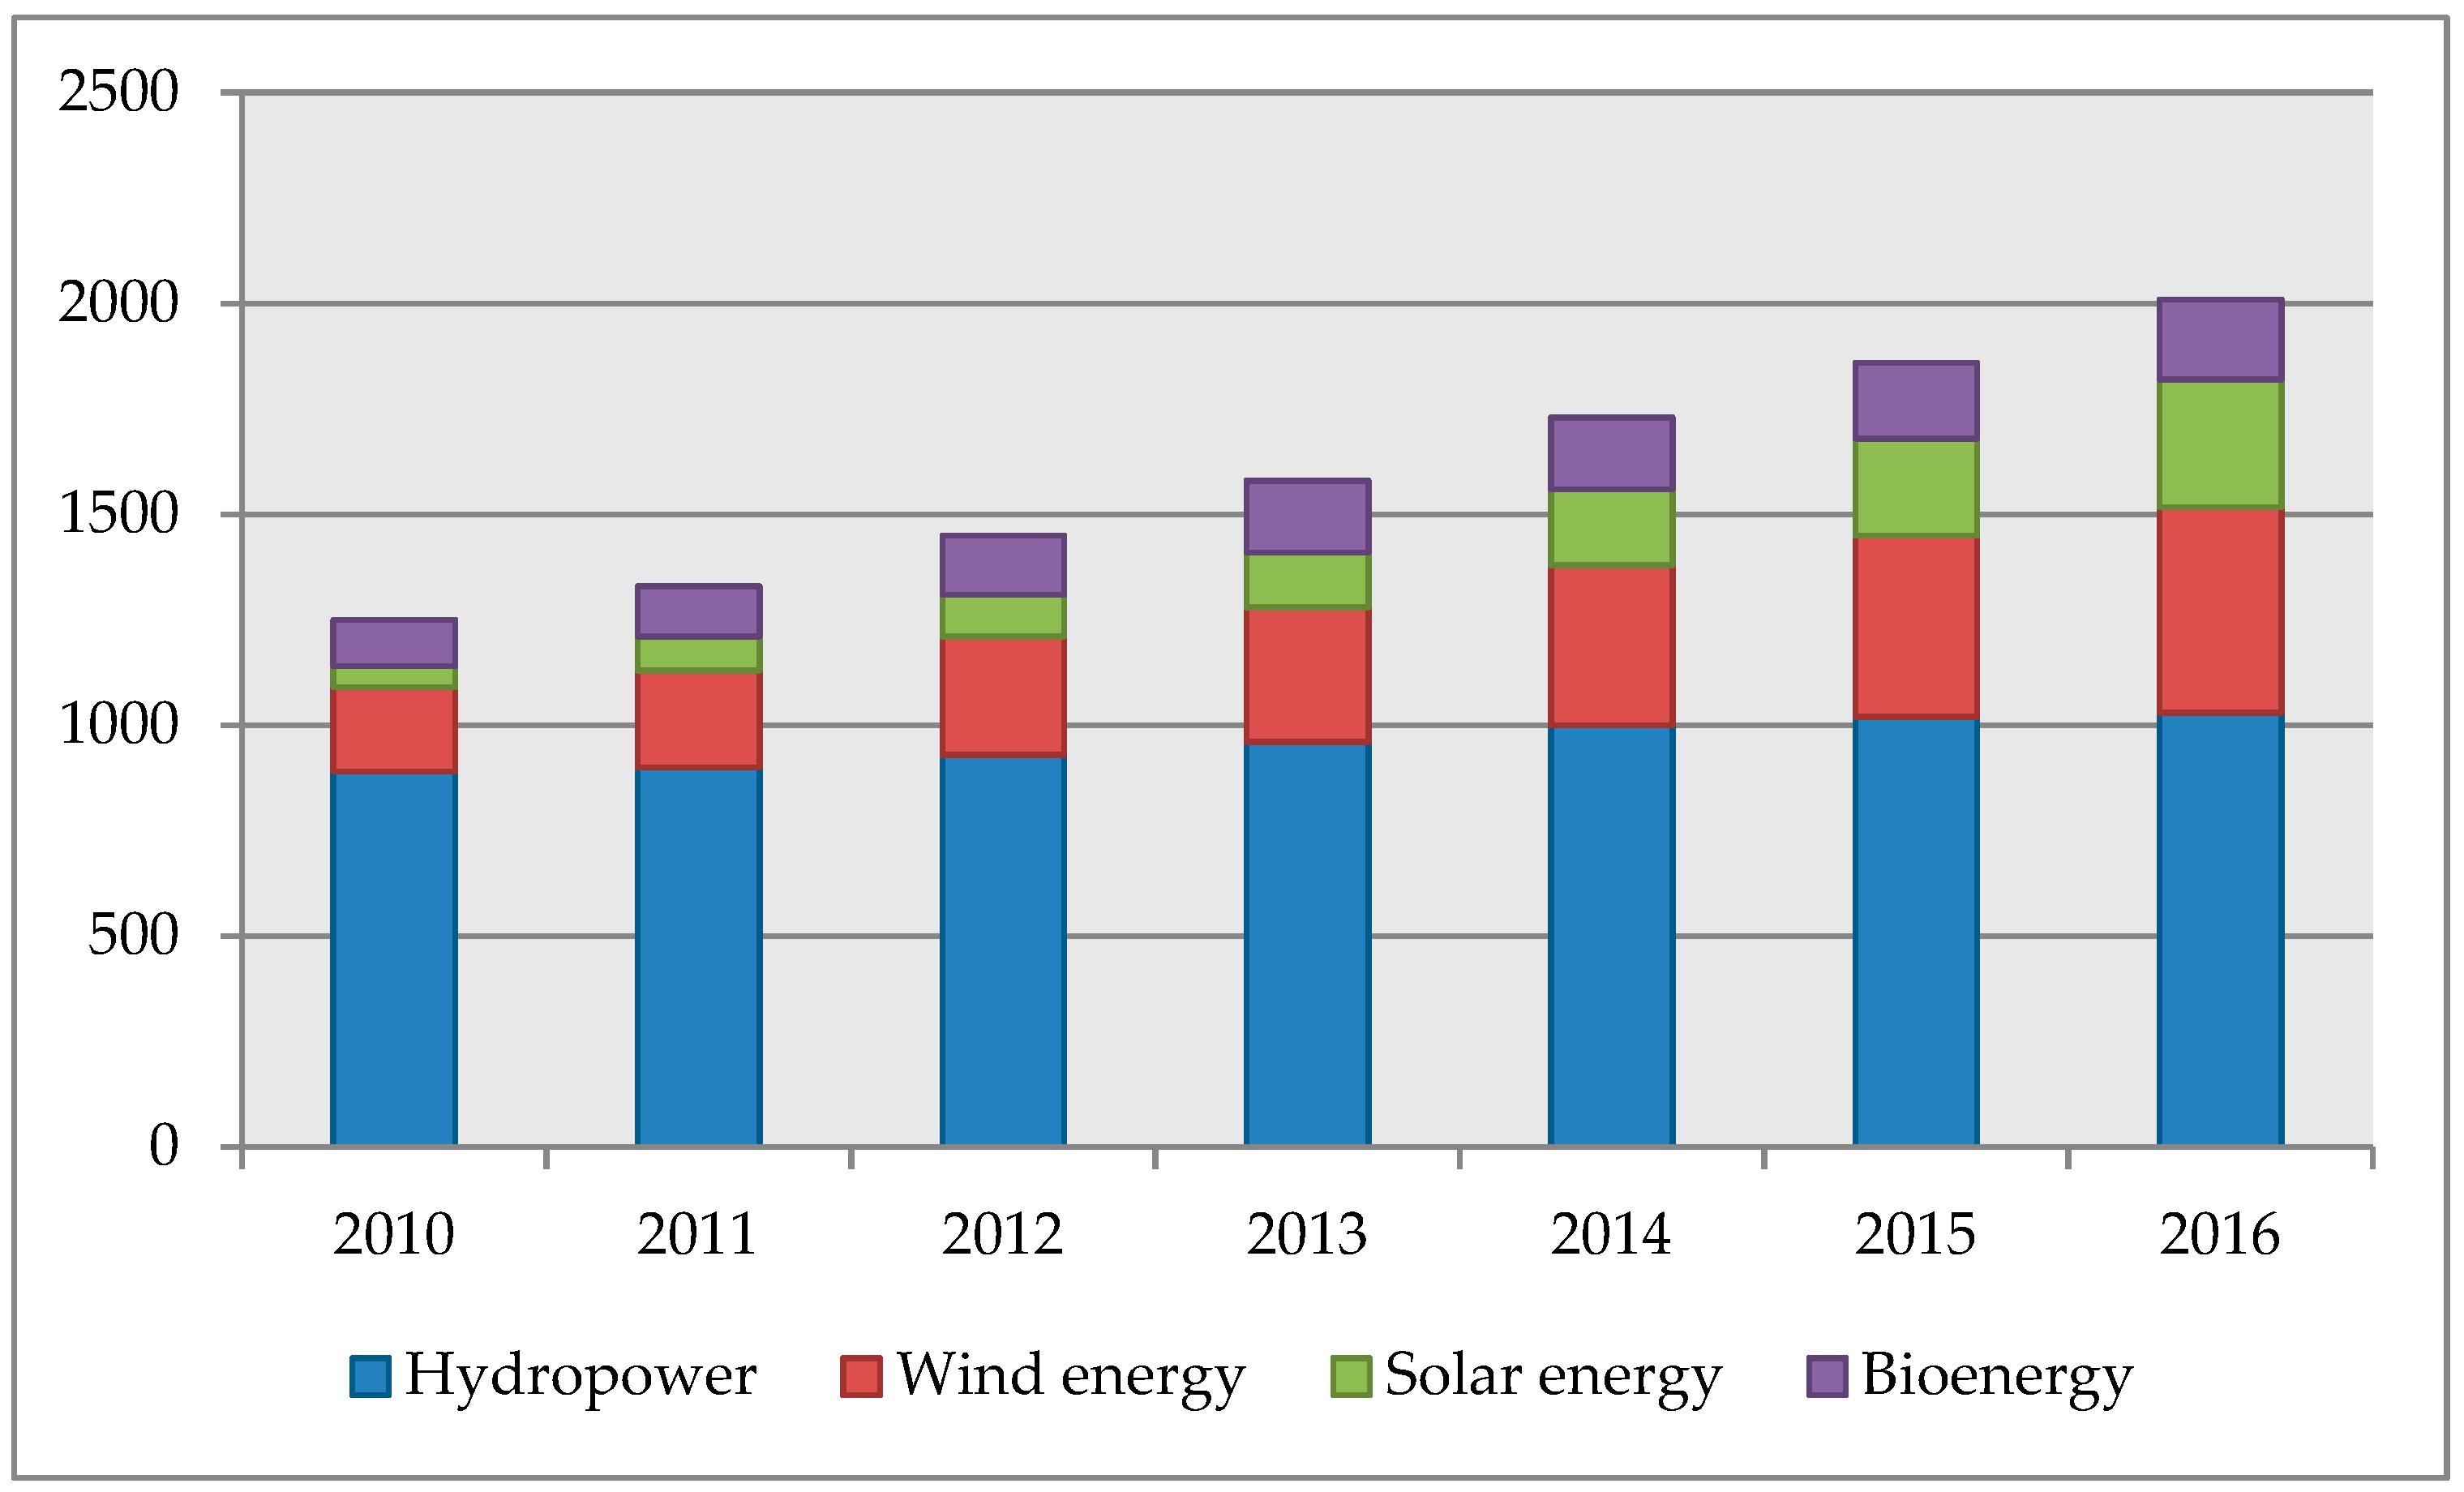
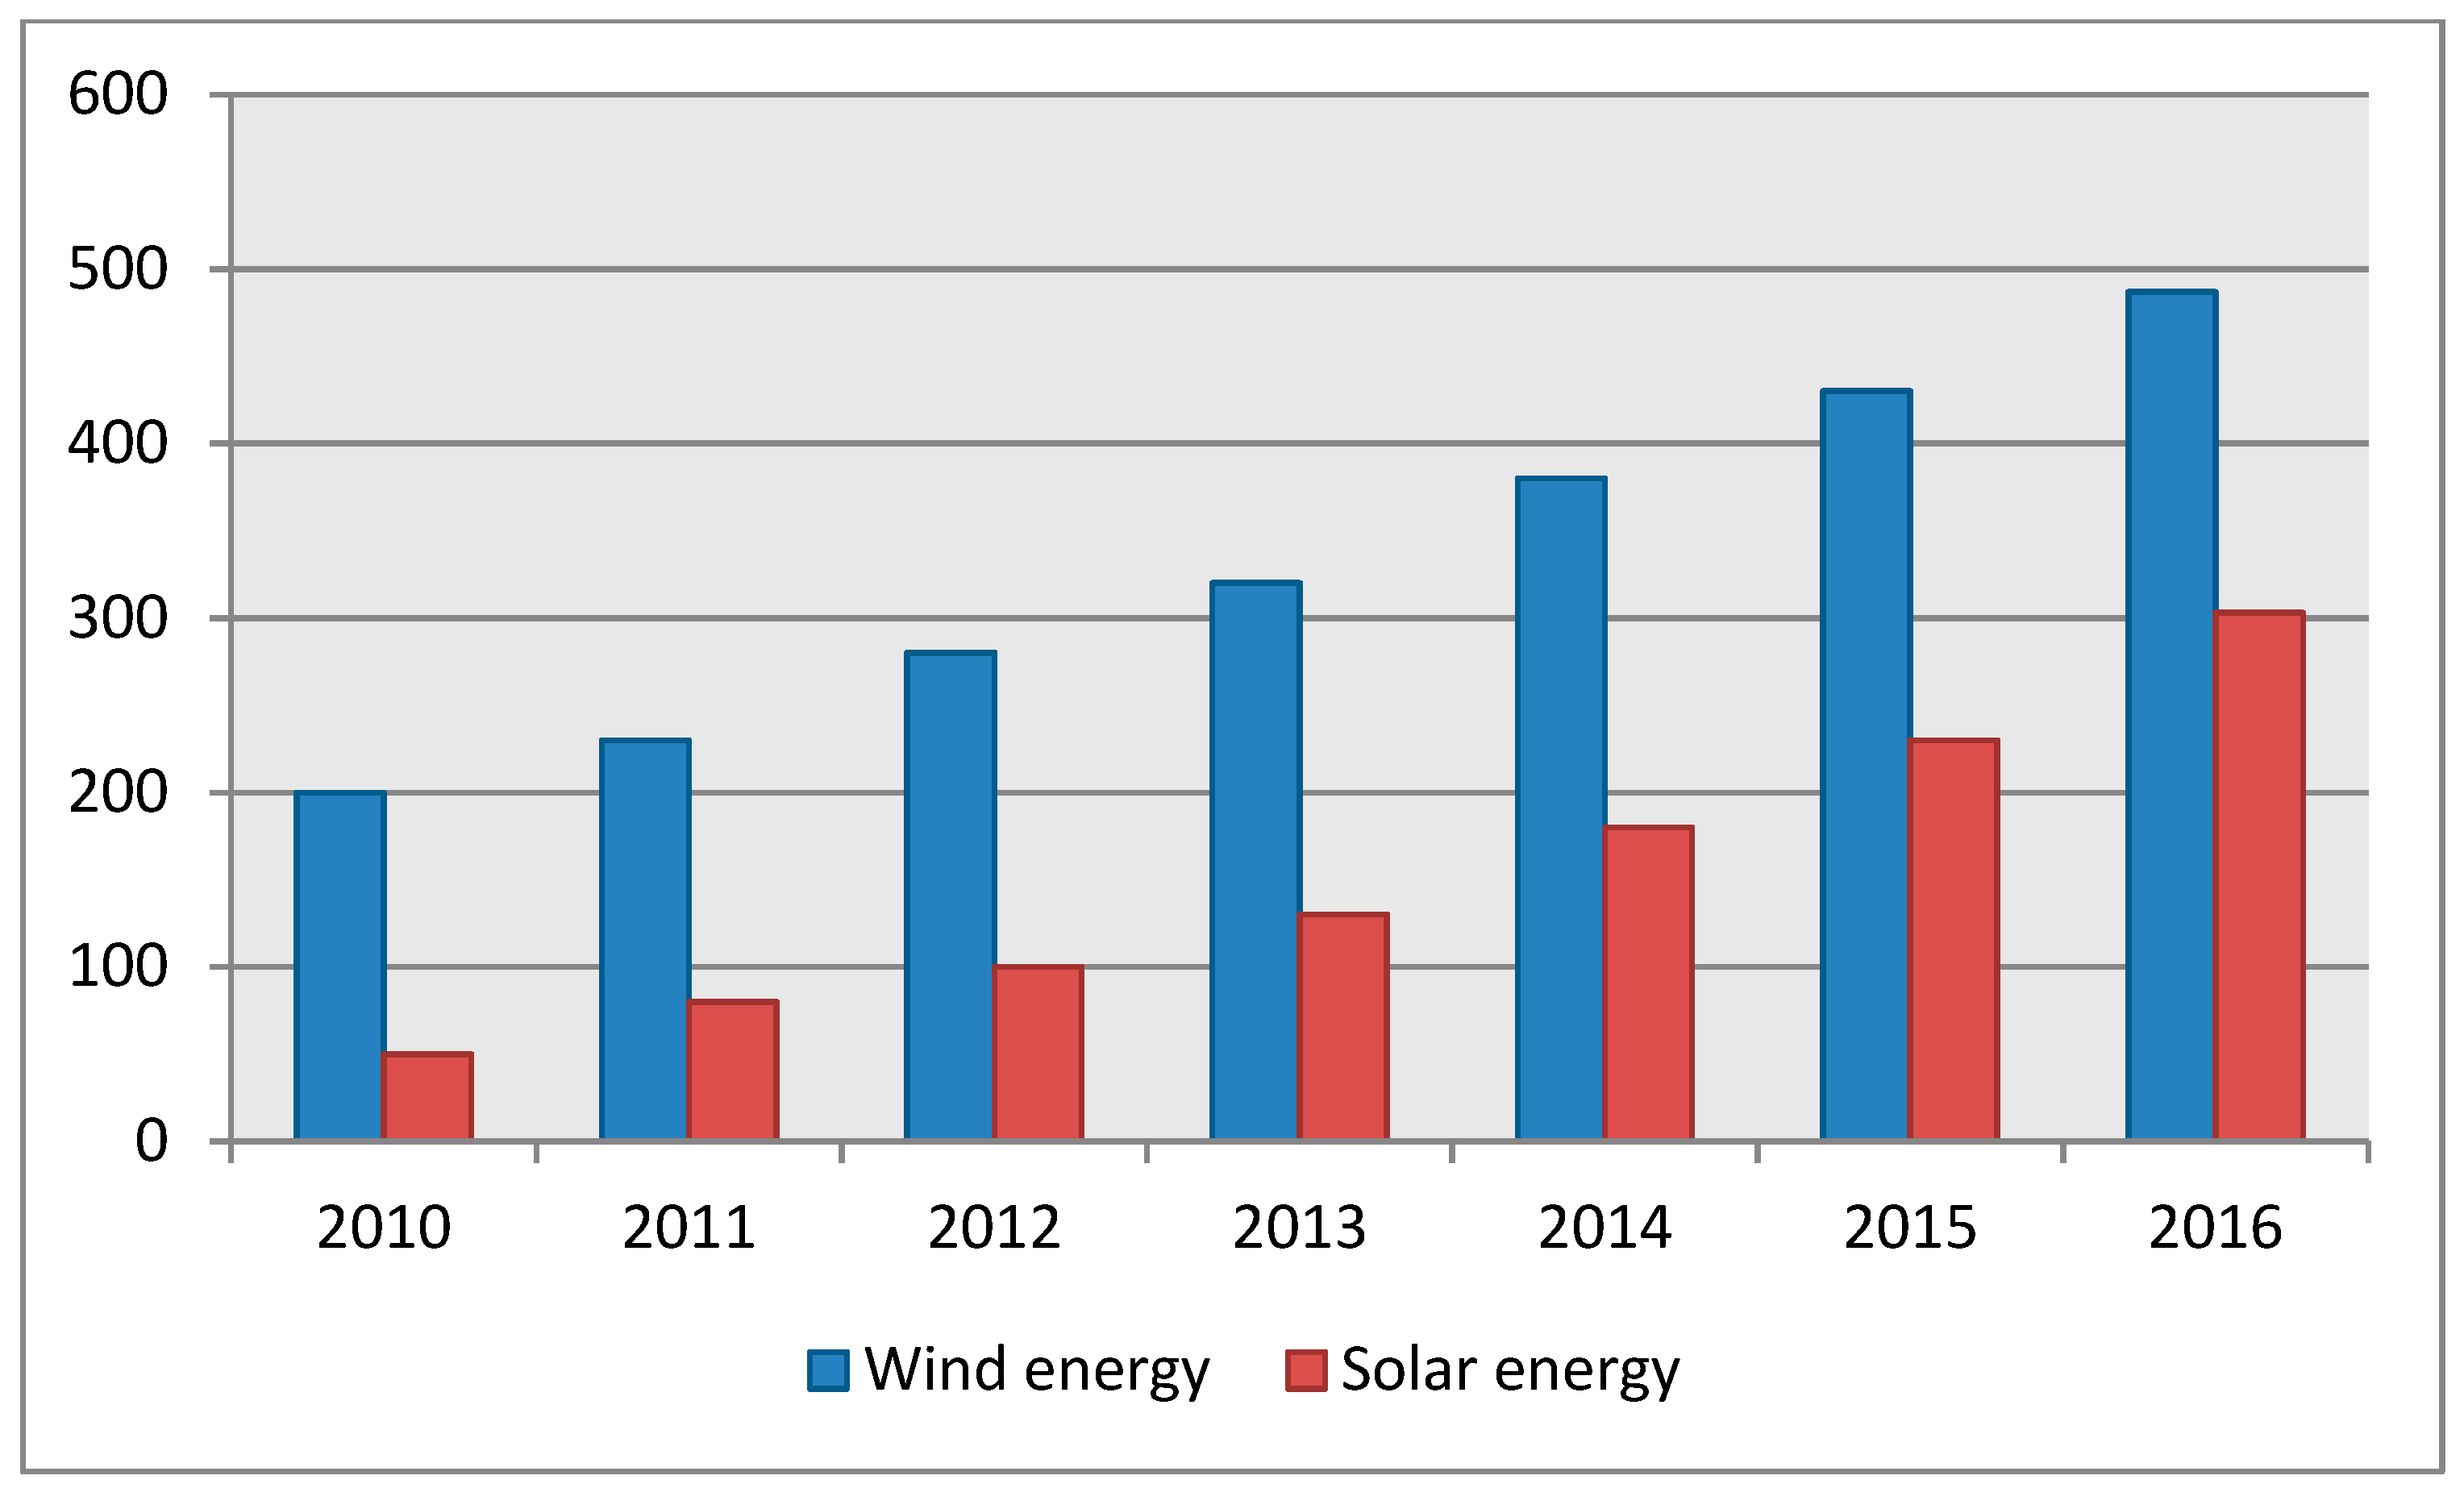
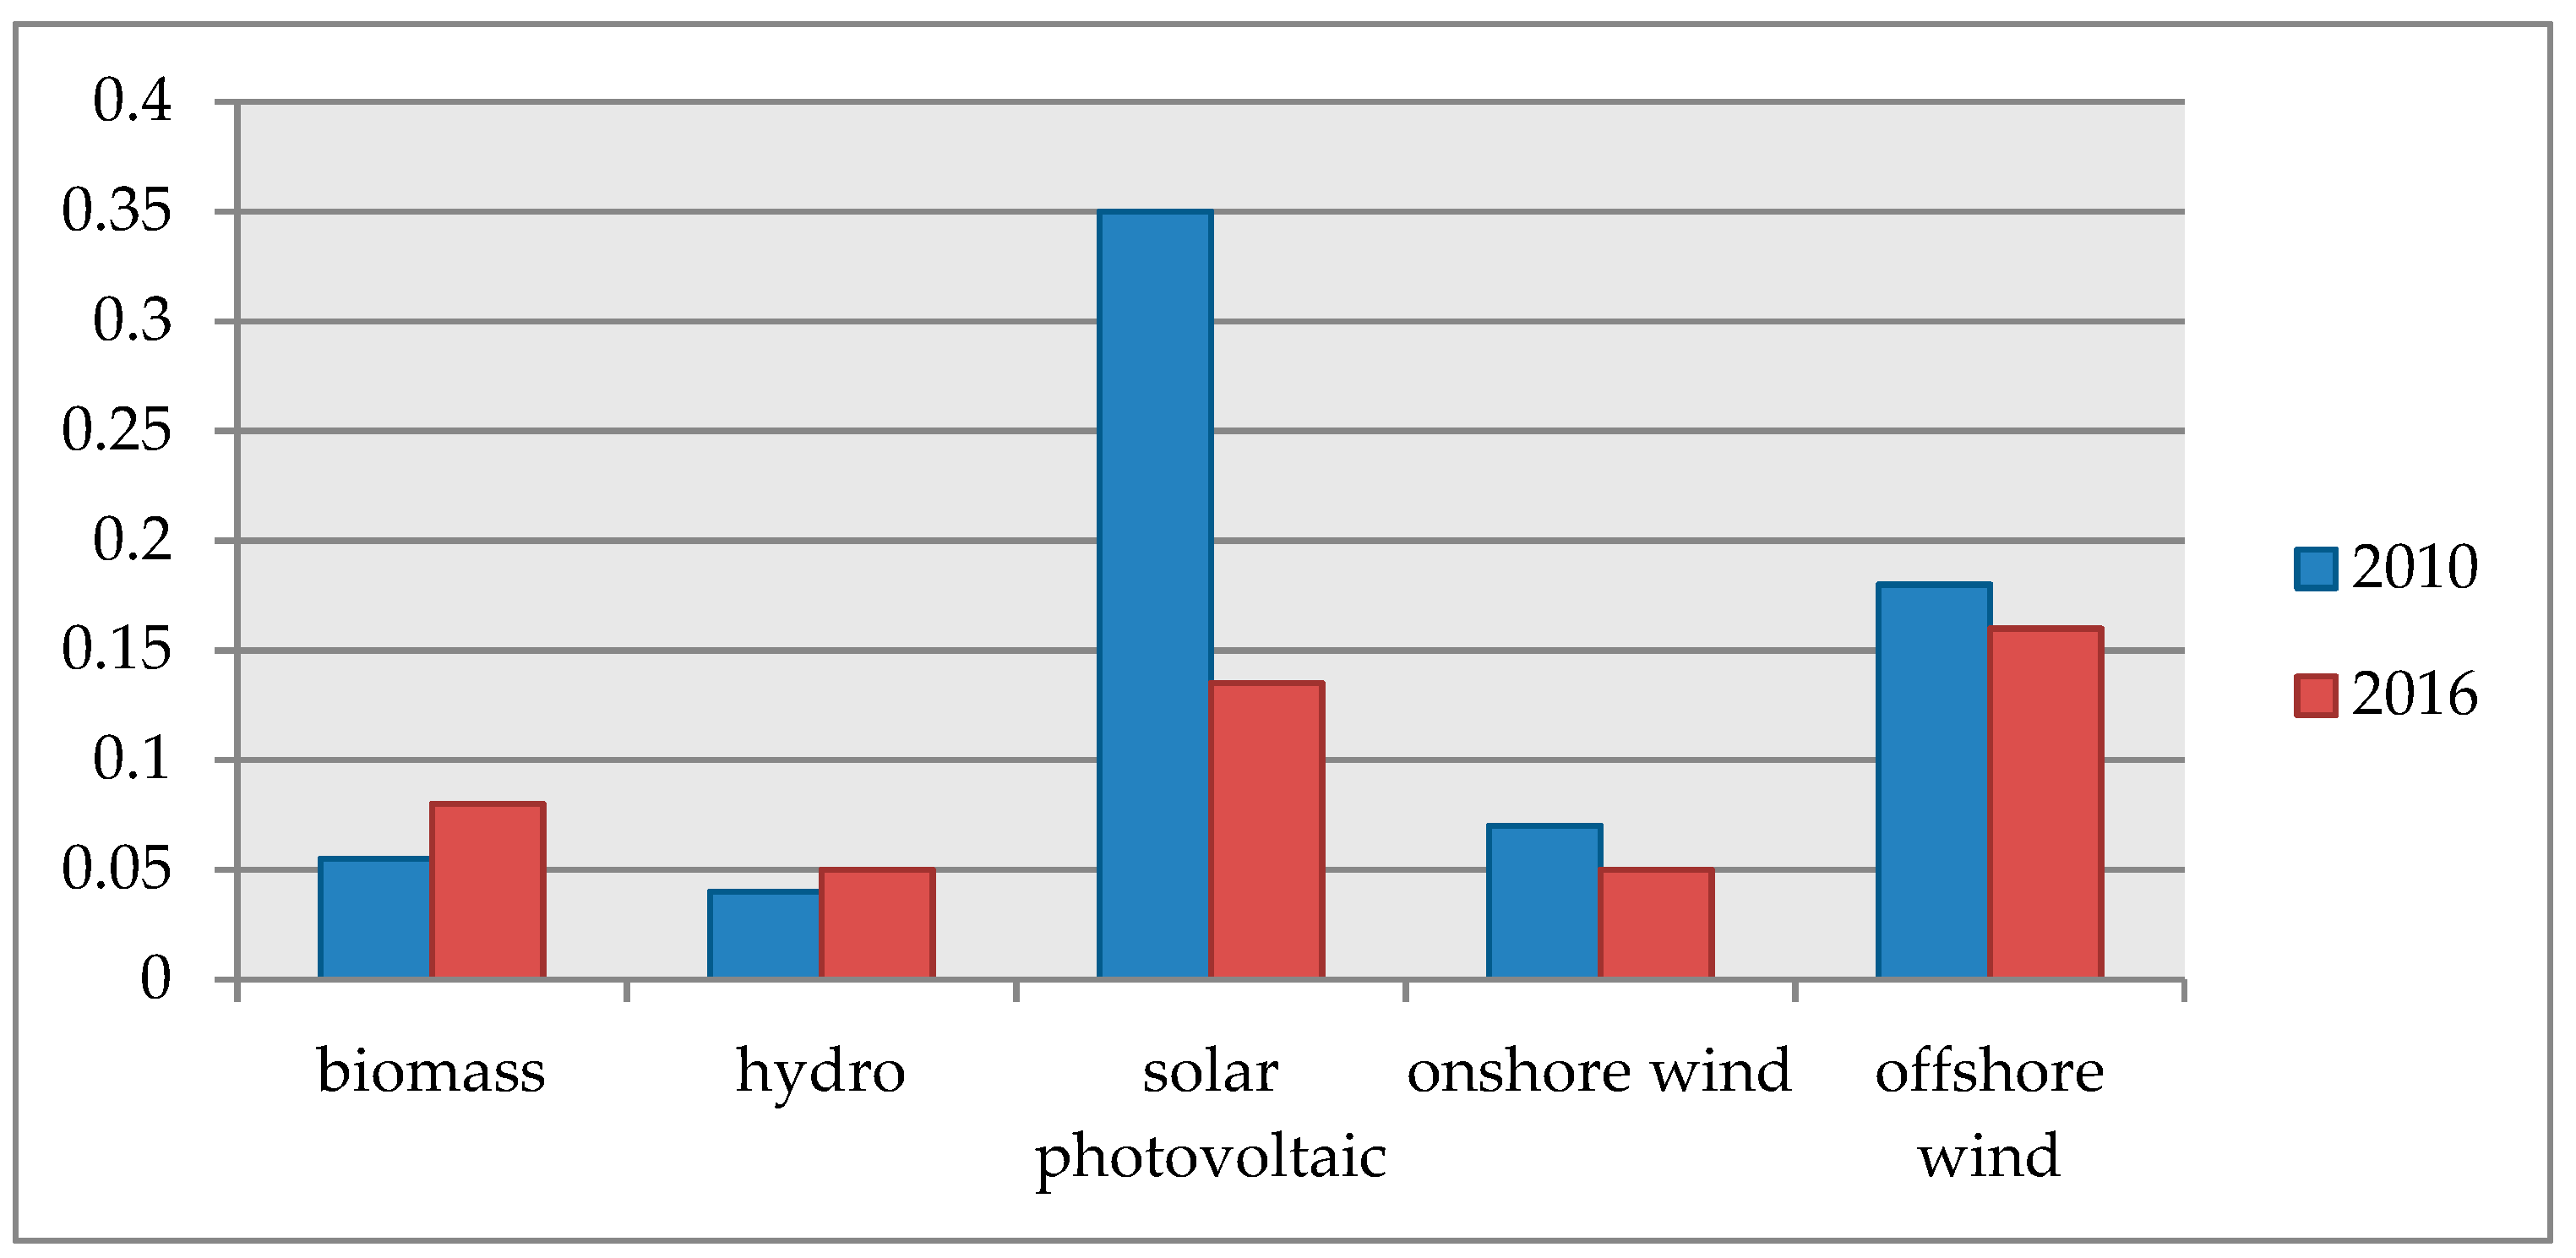
2. Overview of the Global Renewable Energy Market

According to the data from 2016, the renewable energy market is represented by power plants with a total capacity of more than 2000 GW (Figure 1) [24,25,26]. The main suppliers of renewable energy are hydropower and wind as well as solar energy and bioenergy.
At the same time, solar and wind energy markets are the fastest growing in the world. The world wind power capacity over the past 7 years increased 2.5 times, reaching a total capacity of 487 GW, while the global solar photovoltaic power capacities increased more than 10 times and amounted to 303 GW (Figure 2) [24,25,26].
Additionally, there is a significant reduction in the cost of individual technologies of renewable energy. This contributes to the innovative development of the industry, in particular, reducing the cost of installation and production of solar photovoltaic cells, as well as the modernization of wind turbine structures and the emergence of new materials. In terms of the cost, the renewable energy sources in many countries are now close to competing with new fossil-fired power plants (Figure 3) [27,28,29].
One of the most competitive renewable energy sources is coastal wind installations, primarily for countries where energy resources are expensive. Where fossil fuels are fairly cheap (for example, fairly low gas prices in the United States and Russia), wind turbines can compete with traditional energy sources only under favorable weather conditions and state support programs for the development of the industry. At the same time, the increased interest of many countries in environmental protection and energy security leads to the active development of renewable energy [30,31,32,33,34].
Nowadays, more than 160 countries of the world (82%) pursue a policy of supporting the sector, of which in 20 countries the share of renewable energy sources in the total energy balance exceeds 20%. According to the EU energy strategy, by 2030 countries should ensure a 40% reduction in greenhouse gas emissions and an increase to 32% of the share of renewable energy [35]. In the longer term, many countries will likely go significantly further. In particular, Germany plans to reach 60% of the share of renewable energy in the country’s total energy balance by 2050. Figure 4 presents a generalized model of factors influencing the development of renewable energy in the world.
Overall, it becomes apparent that high rates of growth in production of renewable energy are largely due to significant state support. It allows in a number of countries to make renewable energy attractive, even in cases where its initial economic indicators are more than 50% worse than when using fossil fuel resources. At the same time, renewable energy is successfully developing in the world in spite of the crisis phenomena in the global economy, and, in fact, is one of the most effective ways to overcome the energy crisis.

3. Analysis of the Methods and Consequences of State Support for the Development of RES

Over the past few decades, the development of renewable energy sources in the world has achieved great success in increasing production efficiency and reducing equipment cost. Due to the development of new technologies, renewable energy has become capable of the cost of production to compete with traditional power generation in countries with favorable for the use of natural energy. However, in spite of all their achievements, today renewable energy technologies face great challenges in ensuring the required level of competitiveness due to the peculiarities of energy production and the high cost of building an installed capacity unit, which makes it impossible to develop them without state support [36,37].
Government programs to support renewable energy sources are usually aimed at solving several problems at once [38,39,40,41,42]:
  • decarbonization of power systems and an increase in domestic electricity production,
  • improving the technological competitiveness of renewable energy by reducing production costs and creating new jobs.
  • In some countries, state programs of support for renewable energy have existed for more than 20 years, which made it possible to analyze the experience of the best practices in implementing such programs. There are four categories of government policy tools to support renewables:
  • tax incentives;
  • state subsidies;
  • regulatory tools;
  • privileged access policy.
Many countries use several RES support tools at once. At the same time, it is possible to trace the relationship between the number of tools used to support renewable energy sources and the country’s income. Low-income countries use an average of 2.2 different mechanisms, while high-income countries use 4.8 [43]. Table 1 presents a summary of the use of renewable energy support mechanisms in the world.
In recent years, more and more political tools have been created for the development of RES. For 2018, 164 countries are already implementing state programs for the development of RES. At the same time, half of them are countries with developing or transitional economies [43,44]. Tax relief and earmarked loans are commonly used to support renewable energy. In high-income countries investment subsidies and grants are mainly used.
The dominant mechanisms for the support of renewable energy are schemes for the introduction of a special fixed (green) tariff (feed-in tariff) and netting of electricity (net metering), applied in both developing and developed countries. Today, about 66% of countries use these tools.
Net metering assumes that in windy or sundial hours the owner of an installation of renewable energy sources delivers surplus electricity to the grid, which he cannot consume himself, and during windless or night hours he consumes electricity from the grid to offset the volumes supplied earlier. If according to the results of the billing period, such a participant in energy supply consumed more electricity than he supplied, then he compensates for the difference at the usual rate. If, on the contrary, he consumes less energy than he supplied, he may use the surplus in subsequent periods or even receive payments from the power utility. When using net metering, only one meter is required, which will show the difference between the volumes of electricity taken and delivered to the grid. A feed-in tariff allows owners of a power plant for renewable energy to receive compensation for electricity supplied to the network that exceeds the retail tariff; however, as the number of owners of such installations grows, the feed-in tariff usually decreases and ultimately compares to the retail tariff. This scheme requires the installation of two separate meters.
Despite the advantages, the use of these tools to support renewable energy often leads to the emergence of cross-subsidization of consumers and generation, as well as an increase in the tariff for electricity transmission throughout the network. So for the period 2008–2016, Australia, Spain, Portugal and Germany were characterized by an exceptional increase in electricity prices (a 112% price increase) [14,15,43]. This is due to the fact that in these countries, generation and sale of electricity are competitive activities, while transmission and distribution networks are structurally separated and regulated by the monopolies. Reducing the demand for electricity from the grid and reducing the uniformity of the electricity consumption schedule due to the spread of generation to renewable energy sources led to an increase in the network tariff, which was to provide the necessary regulated revenue to grid companies and compensate them for the investments made over the past five years to develop the network infrastructure. In turn, consumers responded to the growth of tariffs by reducing consumption, which led to an increase in network tariff rates for the next year in order to provide the necessary gross revenue to grid companies and the second wave of changes in electricity demand from the grid.
The described negative processes in the energy supply system aggravated the state programs for subsidizing consumers who commissioned installations for renewable energy sources, in particular, solar photovoltaic panels, which were compensated by raising prices for power grid supply. The sharp increase in fixed-rate tariff obligations for RES (feed-in tariff) led to the third wave of network tariff increases.
Another consequence of the wrong state policy in support of renewable energy is the emergence of indirect cross-subsidization, when consumers who have not installed or cannot afford installations on renewable energy, in fact, pay the grid company for consumers who switch to renewable energy, forced to raise the network tariff, and generation company, which increases the uneven loading of power equipment and the number of hours of use of expensive peak power while reducing the amount of electricity generation [44,45,46].
The way out of the situation described is the development of a tariff that stimulates the consumer to equalize the load during the day period of electricity consumption [47,48,49]. This suggests the use of a differentiated tariff for the zones of the day, the key disadvantage of which in this situation is its static nature, when the selected zones may not correspond to a dynamically changing load schedule and, thus, instead of reducing the price of electricity for the consumer, lead to its increase. It is necessary to develop a methodology for dynamic differentiation of the electricity tariff, which with the development of automated systems for commercial metering of electricity and their intellectualization becomes applicable in practice.

4. Proposal for the Method of Dynamic Differentiation of Electricity Tariffs

To solve the problem of reducing power supply costs, reducing the need for expensive peak capacity of the power system and increasing the efficiency of using autonomous power plants for renewable energy, it is necessary to manage power consumption by encouraging consumers to use measures to level the daily consumption schedule. These measures should encourage consumers to introduce power storage equipment into the autonomous power supply system (for example, based on solar photovoltaic panels), allowing them to distribute the produced energy over a wide range of hours during the day, as well as to change their institutional behavior, which will be expressed in adapting the daily pattern of electricity consumption to a production schedule of available autonomous energy sources.
Such a measure to stimulate the optimization of power consumption and the effective use of autonomous sources is the formation of an economically sound tariff according to the zonal principle. The zones of base, semi-peak and peak load on the power system are distinguished. For each zone, depending on the amount of electricity consumption, its own tariff rate is set.
At the same time, as shown in the next part of the paper, the zonal differentiation of the tariff does not always contribute to improving the efficiency of electricity supply and may even be less beneficial for the consumer than the single-value undifferentiated tariff. This is due to the fixed values of the peak and half-peak tariff rates and transition time zones, which do not correspond to the actual daily load curve of consumers. Also, a contribution is made by the existing tariff differentiation in many countries in terms of amount of energy consumption, which is often poorly founded.
The development of automated systems for commercial metering of electricity along the path of using advanced (smart) electricity meters, equipped with communication tools for monitoring and data transmission on energy consumption in real time, allows us to develop pricing methods for electricity with much greater differentiation of time zones consumption and tariff rates than the existing ones [50,51,52]. Thus, it is possible to solve the problem of inconsistency of the tariff differentiation system and real daily energy consumption schedules.
The following algorithm is proposed for dynamic pricing of electricity, taking into account the fact that consumer load charts on weekends and working days differ significantly:
  • Based on the statistical analysis of data for the previous period, daily graphs of consumer load are compiled on a typical work day and a day off: P w ( t ) и P h ( t )
  • According to consumer load schedules, values are calculated:
    • Minimum power consumption per unit of time:
      P w min = min P w ( t ) , P h min = min P h ( t )
    • Average power consumption per unit of time:
      P ¯ w = t = 0 n 1 P w ( t ) n , P ¯ h = t = 0 n 1 P h ( t ) n
    • Half-peak power consumption per unit of time:
      P w p p = P ¯ w + 2 t = 0 n 1 ( P w ( t ) P ¯ w ) 2 n , P h p p = P ¯ h + 2 t = 0 n 1 ( P h ( t ) P ¯ h ) 2 n
    • Maximum power consumption per unit of time:
      P w max = max P w ( t ) , P h max = max P h ( t )
  • Energy consumption zones are determined:
    • Basic power consumption (B):
      P w B ( t ) [ 0 , P w min ] , P h B ( t ) [ 0 , P h min ] , t = 0 , 23 ¯
    • Half-peak power consumption (PP):
      P w P P ( t w ) ( P w min , P w p p ] , P h P P ( t h ) ( P h min , P h p p ] , t w = t P w min , t P w P P ¯ , t h = t P h min , t P h P P ¯ , P w ( t P w min ) = P w min , P h ( t P h min ) = P h min , P w ( t P w P P ) = P w P P , P h ( t P h P P ) = P h P P
    • Peak power consumption (P):
      P w P ( t w ) ( P w p p , P w max ] , P h P ( t h ) ( P h P P , P h max ] , t w = t P w P P , t P w max ¯ , t h = t P h P P , t P h max ¯ , P w ( t P w P P ) = P w P P , P h ( t P h P P ) = P h P P , P w ( t P w max ) = P w max , P h ( t P h max ) = P h max
  • A fixed tariff rate is established for the base consumption zone, and an interval of tariff rates is established for the half-peak and peak power consumption zones:
    • Basic power consumption (B):
      C B ( t ) = C B , t = 0 , 23 ¯
    • Half-peak power consumption (PP):
      C P P ( t ) [ C min P P , C max P P ] , C min P P = C P P ( P ( t ) = P min ) , C min P P > C B , C max P P = C P P ( P ( t ) = P P P ) , t = t P min , t P P P ¯
    • Peak power consumption (P):
      C P ( t ) [ C min P , C max P ] , C min P = C P ( P ( t ) = P P P ) , C min P > C max P P   C max P = C P P ( P ( t ) = P max ) , t = t P P P , t P max ¯
  • We believe that the increase or decrease in energy consumption proportionally reduces or increases the cost of electricity in the corresponding zone with the coefficient K :
    • Half-peak power consumption (PP):
      K P P = C max P P C min P P t P P P t P min
    • Peak power consumption (P):
      K P = C max P C min P t P max t P P P
  • The chain growth rates are calculated, which characterize the increments of energy consumption in the areas of half-peak and peak consumption:
    • Half-peak power consumption (PP):
      G P P ( t ) = P P P ( t ) P P P ( t 1 )
    • Peak power consumption (P):
      G P ( t ) = P P ( t ) P P ( t 1 )
  • A dynamic calculation of the cost of electricity for the consumers at each time point for working days and days off are produced. In case of increase in energy consumption in the half-peak and peak zones, an additional penalty is imposed [ G ( t ) 1 ] K . Accordingly, when energy consumption decreases in comparison with the previously registered value, the tariff rate is decreased:
    T C w ( t ) = { C B P w ( t ) , P w ( t ) = P w min C P P ( t ) P w ( t ) + [ G P P ( t ) 1 ] K p p , P w ( t ) ( P w min , P w P P ] C P ( t ) P w ( t ) + [ G P ( t ) 1 ] K p , P w ( t ) ( P w P P , P w max ] ,
    T C h ( t ) = { C B P h ( t ) , P h ( t ) = P h min C P P ( t ) P h ( t ) + [ G P P ( t ) 1 ] K p p , P h ( t ) ( P h min , P h P P ] C P ( t ) P h ( t ) + [ G P ( t ) 1 ] K p , P h ( t ) ( P h P P , P h max ]
  • The total cost of electricity per day is calculated, taking into account the discrete values of the indications of smart meters:
    T C w D = i = 1 n T C w ( t i ) ( t i t i 1 ) , T C h D = i = 1 n T C h ( t i ) ( t i t i 1 )
The above algorithm implements the principle of dynamic pricing of electricity for the consumer, when at each moment in time it is determined in which energy consumption zone (base, half-peak, peak) the consumer load curve is found. Based on the calculation of the chain load growth rates for each energy consumption zone, a system of tariff rates is formed. The growth of energy consumption in the semi-peak zone and its coverage due to the use of energy system resources, rather than renewable energy, is punished by higher tariff rates, reduction of energy consumption is encouraged by a dynamic reduction in rates.

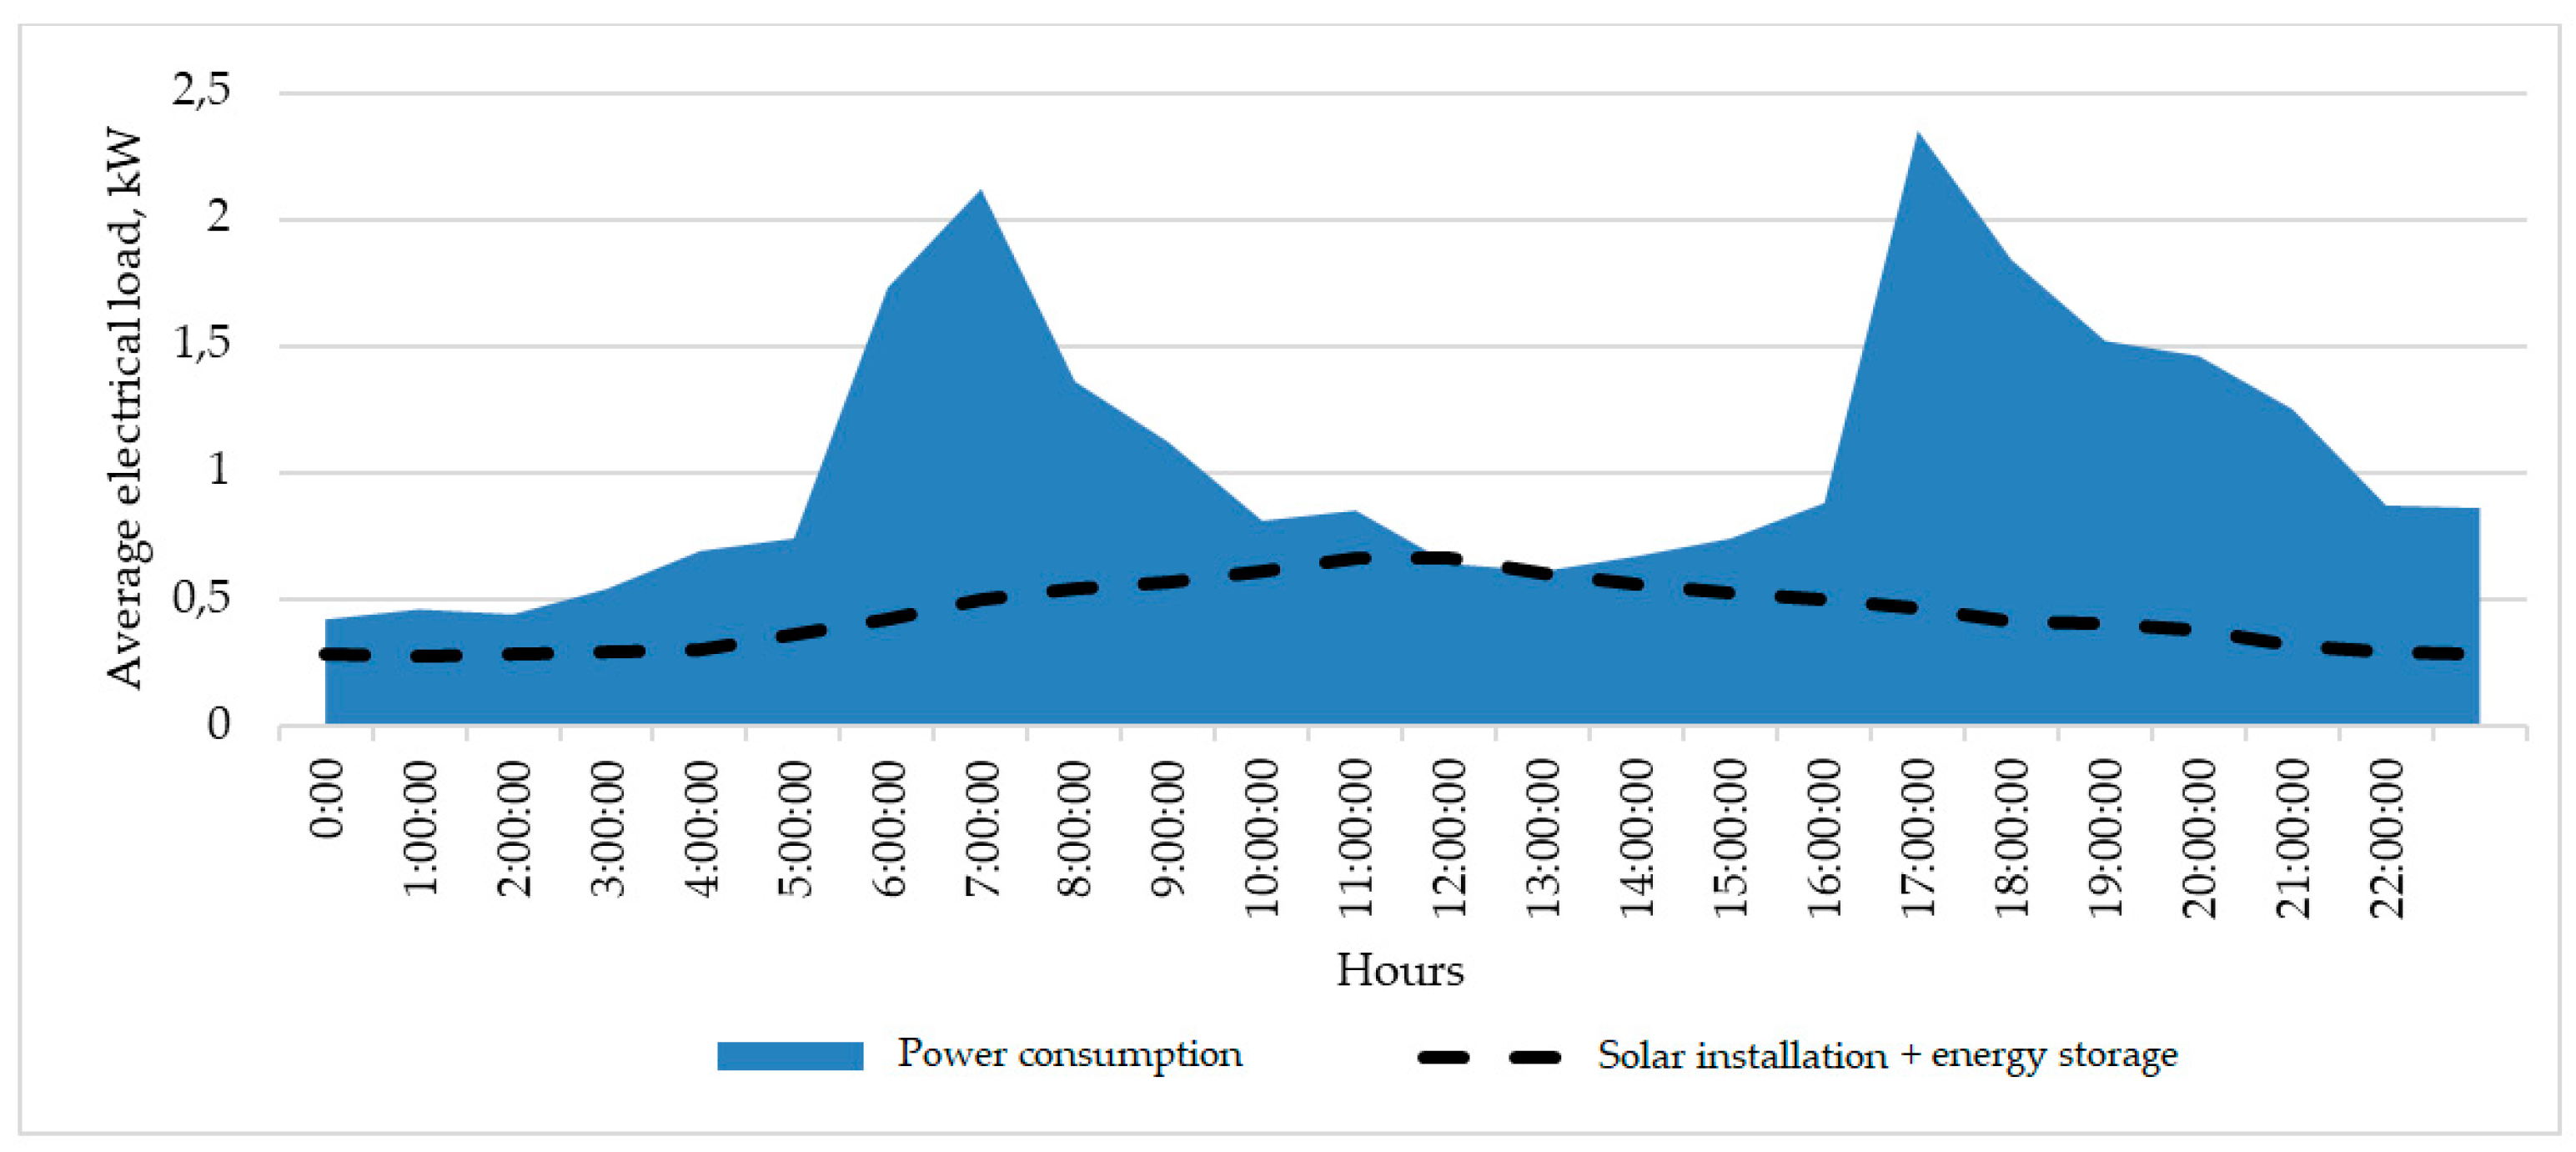
5. Empirical Model: A Case Study of Krasnodar Region of Russia

Our empirical model focuses on the Krasnodar region which is one of the largest regions-consumers of electricity in Russia. At the same time, it is characterized by a high level of energy deficiency. Hence, the development of territorial energy system in the region is given great importance [53,54].
In 2016, electricity production amounted to about 7 billion kWh with a consumption volume of 22 billion kWh. From 2006 to 2016 electricity consumption in the region increased by more than two times. The increase in consumption in the territorial energy system was mainly due to the growth of electricity consumption by industrial enterprises, the intensive development of the resort and recreation complex and the buildup of electrical loads during the construction of Olympic facilities in Sochi.
The shortage of generating capacity of the territorial energy system of the Krasnodar region was covered by the flow of electricity and power through the intersystem power lines from adjacent power systems. In January 2017, the total flow of electricity into the power system of the Krasnodar region amounted to more than 1 billion kWh, including 130 million kWh via interstate lines. In total, the Krasnodar region satisfies its electricity needs by 35% due to preferential energy production at thermal power plants [55].
Krasnodar region is one of the most attractive in Russia for the development of generation based on the use of renewable energy sources in terms of its natural and climatic characteristics. According to existing estimates, by realizing the potential of renewable energy in the Krasnodar region, it is possible to produce up to 1300 MW instead of burning hydrocarbon fuels. The most important types of renewable resources for the Krasnodar region are solar and wind energy, which account for 80% of the energy potential of renewable energy sources in the region [52,56,57].
Special attention in the region is paid to the development of distributed solar energy, which should make it possible to reduce capital expenditures on the construction of new sources of traditional energy, as well as on the construction of new kilometers of transmission lines. The potential of solar energy in the region is about 1400 kWh/m2, which corresponds to the level of countries that actively use solar energy today, such as the United States and Australia [14,28,52].
Solar energy is used primarily for the needs of households using electricity generators based on photovoltaic cells and panels [58]. Figure 5 and Figure 6 show the averaged graphs of the daily load of a household on a typical working day and on a day off with a graph of energy generated by solar installations.
As can be seen from the graphs presented, the peak of the electricity produced by solar power plants does not correlate with the time of day with the peaks of household electricity consumption, especially on working days. The significant difference between daily power consumption and autonomous power generation of households with solar panels leads to inefficient use of solar generation. Thus, the economic potential of individual solar installations is not fully disclosed, which leads to low efficiency of state programs to subsidize the development of solar energy.
One of the ways to increase the efficiency of using solar installations is to use energy storage technologies, which make it possible to distribute electricity generated from solar power plants during the day (Figure 7) [38,59,60,61].
As can be seen from the graph, as a result of the use of energy storage, it becomes possible to use electricity generated from solar installations more evenly throughout the day. Consumption during peak hours is reduced by about 30% and household energy consumption at night is reduced by 80%.
The use of solar power and energy storage by households is largely related to the current tariff menu for electricity from the network in the region. Today, one-rate tariffs are applied in Kranodar region, differentiated by two and three zones of the day, as well as the volume of consumption (Table 2) [59].
According to the current tariff menu and the “dynamic” differentiated tariff proposed in the previous part of the paper, the cost of electricity per month was estimated for households consuming electricity only from the grid, households with solar panels and households with solar panels and storage using given electrical load graphs. The calculation results are shown in Table 3.
As can be seen from the data, the cost of electricity when applying the existing tariff differentiation scheme for two and three times zones of the day is the highest for households that do not use solar power. These results are also true for households with solar panels and storage, which suggests that the existing tariff menu does not encourage consumers to use solar energy efficiently. This is due to the discrepancy between the time zones used in the existing differentiated tariffs and the actual peak and half-peak areas of household electricity consumption, as well as the high values of household electricity consumption in the morning and evening hours. Thus, it is beneficial for the consumer to use the one-rate undifferentiated tariff regardless of the availability of renewable energy sources and the use of energy storage devices.
This problem can be solved using the proposed method of dynamic tariff differentiation. For households that do not use solar installations, the simplest one-rate tariff still remains the cheapest. However, for households that use solar installations, and the solar systems with stored energy, there are obvious advantages for a “dynamic” differential tariff. Reducing the cost of electricity for households will stimulate the population to more active and, most importantly, rational use of solar installations, will reduce the load on the energy system, as well as reduce the need for building new generating capacity of traditional energy with high capital costs.

6. Conclusions

Overall, it can be stated that the need and prospects for the development of renewable energy across the world are confirmed today by various stimulating legal and economic acts and laws, including those located in the area of creating differentiated power grid tariffs for consumers.
At the same time, as the conducted study showed, the applied system of state tariff differentiation often not only does not lead to the formation of economic incentives for optimizing electricity consumption when introducing power plants for renewable energy, but also turns out to be less beneficial for the consumer than simple one-rate tariffs. This is due to the fixed values of the transition to tariff zones at half-peak and peak rates, which do not correspond to the real daily consumption graph of the region’s households. The situation is also aggravated by poorly justified differentiation of the tariff by the volume of energy consumed during the period.
Analysis of the developed daily energy consumption graphs of households in the Krasnodar region on workdays and weekends showed that the rational use of solar power plants leads to a significant decrease in the amount of energy consumed from the power system in the half-peak zone of the load curve. At the same time, it is not possible to achieve a uniform distribution of the load on the power system during the day due to the use of autonomous solar installations. Energy consumption at peak hours is reduced, but the unevenness of the daily load graph remains. Consequently, there remains a need for the availability of maneuverable peak equipment in the power system, which is rapidly gaining power, even if the accumulative power equipment is installed to reduce the irregularity of the power consumption graph. At the same time, solar energy sources will displace half-peak power plants from the load graph, reducing the need of this generation for power system to ensure continuous power supply to consumers.
The development of automated systems for commercial metering of electricity along the path to the use of smart electricity meters allows developing electricity pricing methods with a much greater differentiation of consumption zones and tariff rates than the existing ones. Thus, it is possible to solve the problem of inconsistency of the tariff differentiation system by time zones and real daily energy consumption graphs.
Using the example of the Krasnodar region, it is shown that the proposed method of dynamic differentiation of the electricity tariff allows a household to receive additional savings from the effective use of solar power and energy storage in terms of equalizing the energy consumption schedule. This creates a significant incentive for their use by households and contributes to the effectiveness of government programs to support renewable energy sources, including solving the acute problem of increasing power grid tariffs.

Author Contributions

Conceptualization, E.L. and G.K.; methodology, E.L., V.C., and G.K.; formal analysis, E.L., P.O., and V.C.; investigation, E.L.; resources, P.O. and V.C.; data curation, E.L., P.O., G.K., and V.C.; writing—original draft preparation, E.L., V.C., and P.O.; writing—review and editing, E.L.; visualization, E.L.

Funding

This research was funded by the Ministry of Education and Science of the Russian Federation, grant number 26.9593.2017/8.9.

Acknowledgments

This paper was supported by the Ministry of Education and Science of the Russian Federation, research project No. 26.9593.2017/8.9.

Conflicts of Interest

The authors declare no conflict of interest.

Nomenclature

A List of Symbols
P w ( t ) , P h ( t ) daily graphs of consumer load on a typical work day and a day off
P w min , P h min minimum power consumption on a typical work day and a day off
P ¯ w , P ¯ h average power consumption on a typical work day and a day off
P w p p , P h p p half-peak power consumption on a typical work day and a day off
P w max , P h max maximum power consumption on a typical work day and a day off
C B fixed tariff rate for the basic power consumption zone
[ C min P P , C max P P ] interval of tariff rates for the half-peak power consumption zone
[ C min P , C max P ] interval of tariff rates for the peak power consumption zone
K P P cast coefficient for the half-peak power consumption zone
K P cast coefficient for the peak power consumption zone
G P P ( t ) chain growth rates for the half-peak power consumption zone
G P ( t ) chain growth rates for the peak power consumption zone
T C w ( t ) , T C h ( t ) tariff rates at each time point for working days and days off
T C w D , T C h D total cost of electricity per day for working days and days off
Abbreviations
RESrenewable energy sources
Bbasic power consumption zone
Ppeak power consumption zone
PPhalf-peak power consumption zone

References

  1. Melas, V.; Lisin, E.; Tvaronavičienė, M.; Peresadko, G.; Radwański, R. Energy security and economic development: Renewables and the integration of energy systems. J. Secur. Sustain. Issues 2017, 7, 133–139. [Google Scholar] [CrossRef]
  2. Augutis, J.; Martišauskas, L.; Krikštolaitis, R.; Augutienė, E. Impact of the Renewable Energy Sources on the Energy Security. Energy Procedia 2014, 61, 945–948. [Google Scholar] [CrossRef] [Green Version]
  3. Bhattacharya, M.; Paramati, S.; Ozturk, I.; Bhattacharya, S. The effect of renewable energy consumption on economic growth: Evidence from top 38 countries. Appl. Energy 2016, 162, 733–741. [Google Scholar] [CrossRef]
  4. Umbach, F. Global energy security and the implications for the EU. Energy Policy 2010, 38, 1229–1240. [Google Scholar] [CrossRef]
  5. Qureshi, M.; Rasli, A.; Zaman, K. Energy crisis, greenhouse gas emissions and sectoral growth reforms: Repairing the fabricated mosaic. J. Clean. Prod. 2016, 112, 3657–3666. [Google Scholar] [CrossRef]
  6. Uz, D. Energy efficiency investments in small and medium sized manufacturing firms: The case of California energy crisis. Energy Econ. 2018, 70, 421–428. [Google Scholar] [CrossRef]
  7. Ang, B.; Choong, W.; Ng, T. Energy security: Definitions, dimensions and indexes. Renew. Sustain. Energy Rev. 2015, 42, 1077–1093. [Google Scholar] [CrossRef]
  8. Filipović, S.; Radovanović, M.; Golušin, V. Macroeconomic and political aspects of energy security—Exploratory data analysis. Renew. Sustain. Energy Rev. 2018, 97, 428–435. [Google Scholar] [CrossRef]
  9. Sovacool, B. Differing cultures of energy security: An international comparison of public perceptions. Renew. Sustain. Energy Rev. 2016, 55, 811–822. [Google Scholar] [CrossRef]
  10. Abdmouleh, Z.; Alammari, R.; Gastli, A. Review of policies encouraging renewable energy integration & best practices. Renew. Sustain. Energy Rev. 2015, 45, 249–262. [Google Scholar] [CrossRef]
  11. Oree, V.; Hassen, S.; Fleming, P. Generation expansion planning optimisation with renewable energy integration: A review. Renew. Sustain. Energy Rev. 2017, 69, 790–803. [Google Scholar] [CrossRef]
  12. Radovanović, M.; Filipović, S.; Pavlović, D. Energy security measurement-A sustainable approach. Renew. Sustain. Energy Rev. 2017, 68, 1020–1032. [Google Scholar] [CrossRef]
  13. Maheshwari, Z.; Ramakumar, R. Smart integrated renewable energy systems (SIRES): A novel approach for sustainable development. Energies 2017, 10, 1145. [Google Scholar] [CrossRef]
  14. Simshauser, P. Distribution network prices and solar PV: Resolving rate instability and wealth transfers through demand tariffs. Energy Econ. 2016, 54, 108–122. [Google Scholar] [CrossRef]
  15. Strielkowski, W.; Štreimikienė, D.; Bilan, Y. Network charging and residential tariffs: A case of household photovoltaics in the United Kingdom. Renew. Sustain. Energy Rev. 2017, 77, 461–473. [Google Scholar] [CrossRef]
  16. Ntanos, S.; Kyriakopoulos, G.; Chalikias, M.; Arabatzis, G.; Skordoulis, M. Public perceptions and willingness to pay for renewable energy: A case study from Greece. Sustainability 2018, 10, 687. [Google Scholar] [CrossRef]
  17. Caldés, N.; del Río, P.; Lechón, Y.; Gerbeti, A. Renewable Energy Cooperation in Europe: What Next? Drivers and Barriers to the Use of Cooperation Mechanisms. Energies 2018, 12, 70. [Google Scholar] [CrossRef]
  18. Ntanos, S.; Skordoulis, M.; Kyriakopoulos, G.; Arabatzis, G.; Chalikias, M.; Galatsidas, S.; Katsarou, A. Renewable energy and economic growth: Evidence from European countries. Sustainability 2018, 10, 2626. [Google Scholar] [CrossRef]
  19. Noailly, J.; Smeets, R. Directing technical change from fossil-fuel to renewable energy innovation: An application using firm-level patent data. J. Environ. Econ. Manag. 2015, 72, 15–37. [Google Scholar] [CrossRef]
  20. Cucchiella, F.; D’Adamo, I.; Gastaldi, M. Future trajectories of renewable energy consumption in the European Union. Resources 2018, 7, 10. [Google Scholar] [CrossRef]
  21. Kim, K.; Kim, Y. Role of policy in innovation and international trade of renewable energy technology: Empirical study of solar PV and wind power technology. Renew. Sustain. Energy Rev. 2015, 44, 717–727. [Google Scholar] [CrossRef]
  22. Brecl, K.; Topič, M. Photovoltaics (PV) System Energy Forecast on the Basis of the Local Weather Forecast: Problems, Uncertainties and Solutions. Energies 2018, 11, 1143. [Google Scholar] [CrossRef]
  23. Kammen, D.; Sunter, D. City-integrated renewable energy for urban sustainability. Science 2016, 352, 922–928. [Google Scholar] [CrossRef] [PubMed] [Green Version]
  24. International Energy Agency. Statistics Data Browser. Available online: https://www.iea.org/statistics (accessed on 20 June 2019).
  25. BP Statistical Review of World Energy. 2018. Available online: https://www.bp.com/content/dam/bp/business-sites/en/global/corporate/pdfs/energy-economics/statistical-review/bp-stats-review-2018-full-report.pdf (accessed on 20 June 2019).
  26. Global Energy Statistical Yearbook 2019. Available online: https://yearbook.enerdata.net/renewables/renewable-in-electricity-production-share.html (accessed on 20 June 2019).
  27. International Energy Agency. Renewables 2017. Available online: https://www.iea.org/renewables2017 (accessed on 20 June 2019).
  28. International Renewable Energy Agency. Available online: https://www.irena.org/-/media/Files/IRENA/Agency/Publication/2018/Jan/IRENA_2017_Power_Costs_2018.pdf (accessed on 20 June 2019).
  29. University of Oxford. Our World in Data. Renewable Energy. Available online: https://ourworldindata.org/renewable-energy (accessed on 20 June 2019).
  30. Sander, M. Conceptual proposals for measuring the impact of international regimes on energy security. Energy Policy 2013, 63, 449–457. [Google Scholar] [CrossRef]
  31. Li, Y.; Shi, X.; Yao, L. Evaluating energy security of resource-poor economies: A modified principle component analysis approach. Energy Econ. 2016, 58, 211–221. [Google Scholar] [CrossRef]
  32. Löschel, A.; Moslener, U.; Rübbelke, D.T. Indicators of energy security in industrialised countries. Energy Policy 2010, 38, 1665–1671. [Google Scholar] [CrossRef]
  33. Proskuryakova, L. Energy technology foresight in emerging economies. Technol. Forecast. Soc. Chang. 2017, 119, 205–210. [Google Scholar] [CrossRef]
  34. Hoffmann, C. Beyond the resource curse and pipeline conspiracies: Energy as a social relation in the middle east. Energy Res. Soc. Sci. 2018, 41, 39–47. [Google Scholar] [CrossRef]
  35. European Commission. 2030 Climate & Energy Framework. Available online: https://ec.europa.eu/clima/policies/strategies/2030_en (accessed on 20 June 2019).
  36. Lisin, E.; Rogalev, A.; Strielkowski, W.; Komarov, I. Sustainable modernization of the Russian power utilities industry. Sustainability 2015, 7, 11378–11400. [Google Scholar] [CrossRef]
  37. Lisin, E.; Strielkowski, W. Modelling new economic approaches for the wholesale energy markets in Russia and the EU. Transform. Bus. Econ. 2014, 13, 566–580. [Google Scholar]
  38. Strielkowski, W.; Lisin, E.; Tvaronavičienė, M. Towards energy security: Sustainable development of electrical energy storage. J. Secur. Sustain. Issues 2016, 6, 235–244. [Google Scholar] [CrossRef]
  39. Ćetković, S.; Buzogány, A. Varieties of capitalism and clean energy transitions in the European Union: When renewable energy hits different economic logics. Clim. Policy 2016, 16, 642–657. [Google Scholar] [CrossRef] [Green Version]
  40. Ringel, M. Energy efficiency policy governance in a multi-level administration structure - Evidence from Germany. Energy Effic. 2017, 10, 753–776. [Google Scholar] [CrossRef]
  41. Kasmaei, M.P.; Lehtonen, M.; Sanz, J.C.; Mantovani, J.R.S. Carbon Footprint Management: A Pathway toward Smart Emission Abatement. IEEE Trans. Ind. Inform. 2019. [Google Scholar] [CrossRef]
  42. Cerna, F.V.; Pourakbari-Kasmaei, M.; Contreras, J.; Gallego, L.A. Optimal Selection of Navigation Modes of HEVs Considering CO2 Emissions Reduction. IEEE Trans. Veh. Technol. 2019, 68, 2196–2206. [Google Scholar] [CrossRef]
  43. The Renewable Energy Policy Network of the 21st Century (REN21). Renewables 2016. Available online: https://www.ren21.net/wp-content/uploads/2019/05/REN21_GSR2016_FullReport_en_11.pdf (accessed on 20 June 2019).
  44. Salas-Fumás, V.; Rosell-Martínez, J.; Delgado-Gómez, M. Capacity, investment and market power in the economic value of energy firms. Energy Econ. 2016, 53, 28–39. [Google Scholar] [CrossRef]
  45. Amrouche, S.; Rekioua, D.; Rekioua, T.; Bacha, S. Overview of energy storage in renewable energy systems. Int. J. Hydrog. Energy 2016, 41, 20914–20927. [Google Scholar] [CrossRef]
  46. Lisin, E.; Kindra, V.; Horvathova, Z. Sustainable development of regional heat supply systems in the context of the Eurasian economic union energy markets association. J. Secur. Sustain. Issues 2017, 6, 215–245. [Google Scholar] [CrossRef]
  47. McPherson, M.; Tahseen, S. Deploying storage assets to facilitate variable renewable energy integration: The impacts of grid flexibility, renewable penetration, and market structure. Energy 2018, 145, 856–870. [Google Scholar] [CrossRef]
  48. Lisin, E.; Shuvalova, D.; Volkova, I.; Strielkowski, W. Sustainable Development of Regional Power Systems and the Consumption of Electric Energy. Sustainability 2018, 10, 1111. [Google Scholar] [CrossRef]
  49. Lisin, E.; Sobolev, A.; Strielkowski, W.; Garanin, I. Thermal efficiency of cogeneration units with multi-stage reheating for Russian municipal heating systems. Energies 2016, 9, 269. [Google Scholar] [CrossRef]
  50. Jokar, P.; Arianpoo, N.; Leung, V.C. A survey on security issues in smart grids. Secur. Commun. Netw. 2016, 9, 262–273. [Google Scholar] [CrossRef]
  51. Dincer, I.; Acar, C. Smart energy systems for a sustainable future. Appl. Energy 2017, 194, 225–235. [Google Scholar] [CrossRef]
  52. Cucchiella, F.; D’Adamo, I.; Gastaldi, M. Economic analysis of a photovoltaic system: A resource for residential households. Energies 2017, 10, 814. [Google Scholar] [CrossRef]
  53. Daus, Y.; Kharchenko, V.; Yudaev, I. Evaluation of solar radiation intensity for the territory of the Southern Federal District of Russia when designing microgrids based on renewable energy sources. Appl. Sol. Energy 2016, 52, 151–156. [Google Scholar] [CrossRef]
  54. Smeets, N. Similar goals, divergent motives. The enabling and constraining factors of Russia’s capacity-based renewable energy support scheme. Energy Policy 2017, 101, 138–149. [Google Scholar] [CrossRef]
  55. Federal State Statistics Service. Main Statistics. 2018. Available online: http://www.gks.ru/wps/wcm/connect/rosstat_main/rosstat/ru/statistics (accessed on 20 June 2019).
  56. System Operator UES. Report on the functioning of the UES of Russia in 2017. Available online: https://so-ups.ru/fileadmin/files/company/reports/disclosure/2018/ups_rep2017.pdf (accessed on 20 June 2019).
  57. Kozlova, M.; Collan, M. Modeling the effects of the new Russian capacity mechanism on renewable energy investments. Energy Policy 2016, 95, 350–360. [Google Scholar] [CrossRef]
  58. Vasileva, E.; Viljainen, S.; Sulamaa, P.; Kuleshov, D. RES support in Russia: Impact on capacity and electricity market prices. Renew. Energy 2015, 76, 82–90. [Google Scholar] [CrossRef]
  59. PJSC “Kubanenergo”. Annual Report. 2017. Available online: http://kubanenergo.ru/media/media/kuban_web_oneside%2005-06.pdf (accessed on 20 June 2019).
  60. Faessler, B.; Schuler, M.; Preißinger, M.; Kepplinger, P. Battery storage systems as grid-balancing measure in low-voltage distribution grids with distributed generation. Energies 2017, 10, 2161. [Google Scholar] [CrossRef]
  61. Subramani, G.; Ramachandaramurthy, V.K.; Padmanaban, S.; Mihet-Popa, L.; Blaabjerg, F.; Guerrero, J.M. Grid-tied photovoltaic and battery storage systems with Malaysian electricity tariff—A review on maximum demand shaving. Energies 2017, 10, 1884. [Google Scholar] [CrossRef]
Figure 1. World production capacity of renewable energy sources, GW.
Energies 12 03250 g001
Figure 2. World wind and solar production capacity, GW.
Energies 12 03250 g002
Figure 3. Estimated cost of electricity on renewable energy installations, US dollars per kWh.
Energies 12 03250 g003
Figure 4. Factors renewable energy development in the world.
Energies 12 03250 g004
Figure 5. Household electrical load graph on a working day with a superimposed graph of electricity generated by solar installations.
Energies 12 03250 g005
Figure 6. Household electrical load graph on a day off with a superimposed graph of electricity generated by solar installations.
Energies 12 03250 g006
Figure 7. Household electrical load graph on a working day with a superimposed graph of electricity produced by solar installations with energy storage.
Energies 12 03250 g007
Table 1. Application of state support mechanisms for renewable energy sources (RES) in the world.
Instruments of State Support for RES2005 2016
Countries with approved state programs for the development of RES48 160
Countries applying special tariffs for generating renewable energy34 108
Countries using emission quotas for greenhouse gases11 99
Table 2. Electricity tariffs in the Krasnodar region.
CategoryOne-Rate Tariff, Rubles/kWhOne-Rate Tariff, Differentiated by Two Zones of the Day, Rubles/kWhOne-Rate Tariff, Differentiated by Three Zones of the Day, Rubles/kWh
Day Zone (Peak and Half-Peak)Night ZonePeak ZoneHalf-Peak ZoneNight Zone
for the amount of electricity consumed up to 250 kWh per month1.101.100.771.651.100.44
for the amount of electricity consumed from 250 to 600 kWh per month1.441.441.012.161.440.58
for the amount of electricity consumed in excess of 600 kWh per month4.954.953.477.434.951.98
Table 3. Comparison of the results of calculating the cost of electricity for households according to the current tariff menu and the proposed dynamic tariff differentiation.
Types of Power Grid TariffsThe Cost of Electricity for Households, Rubles/month
with Consumption only from the Power Gridwith Solar Installationswith Solar Installations and Storage
One-rate tariff204,496106,75688,515
One-rate tariff, differentiated by two zones of the day235,367126,75796,784
One-rate tariff, differentiated by three zones of the day221,299118,33490,327
“Dynamic” differentiated tariff220,15798,24573,346

