Surface and Groundwater Hydrochemistry of the Menengai Caldera Geothermal Field and Surrounding Nakuru County, Kenya

 ,
,  ,
,
Abstract
1. Introduction
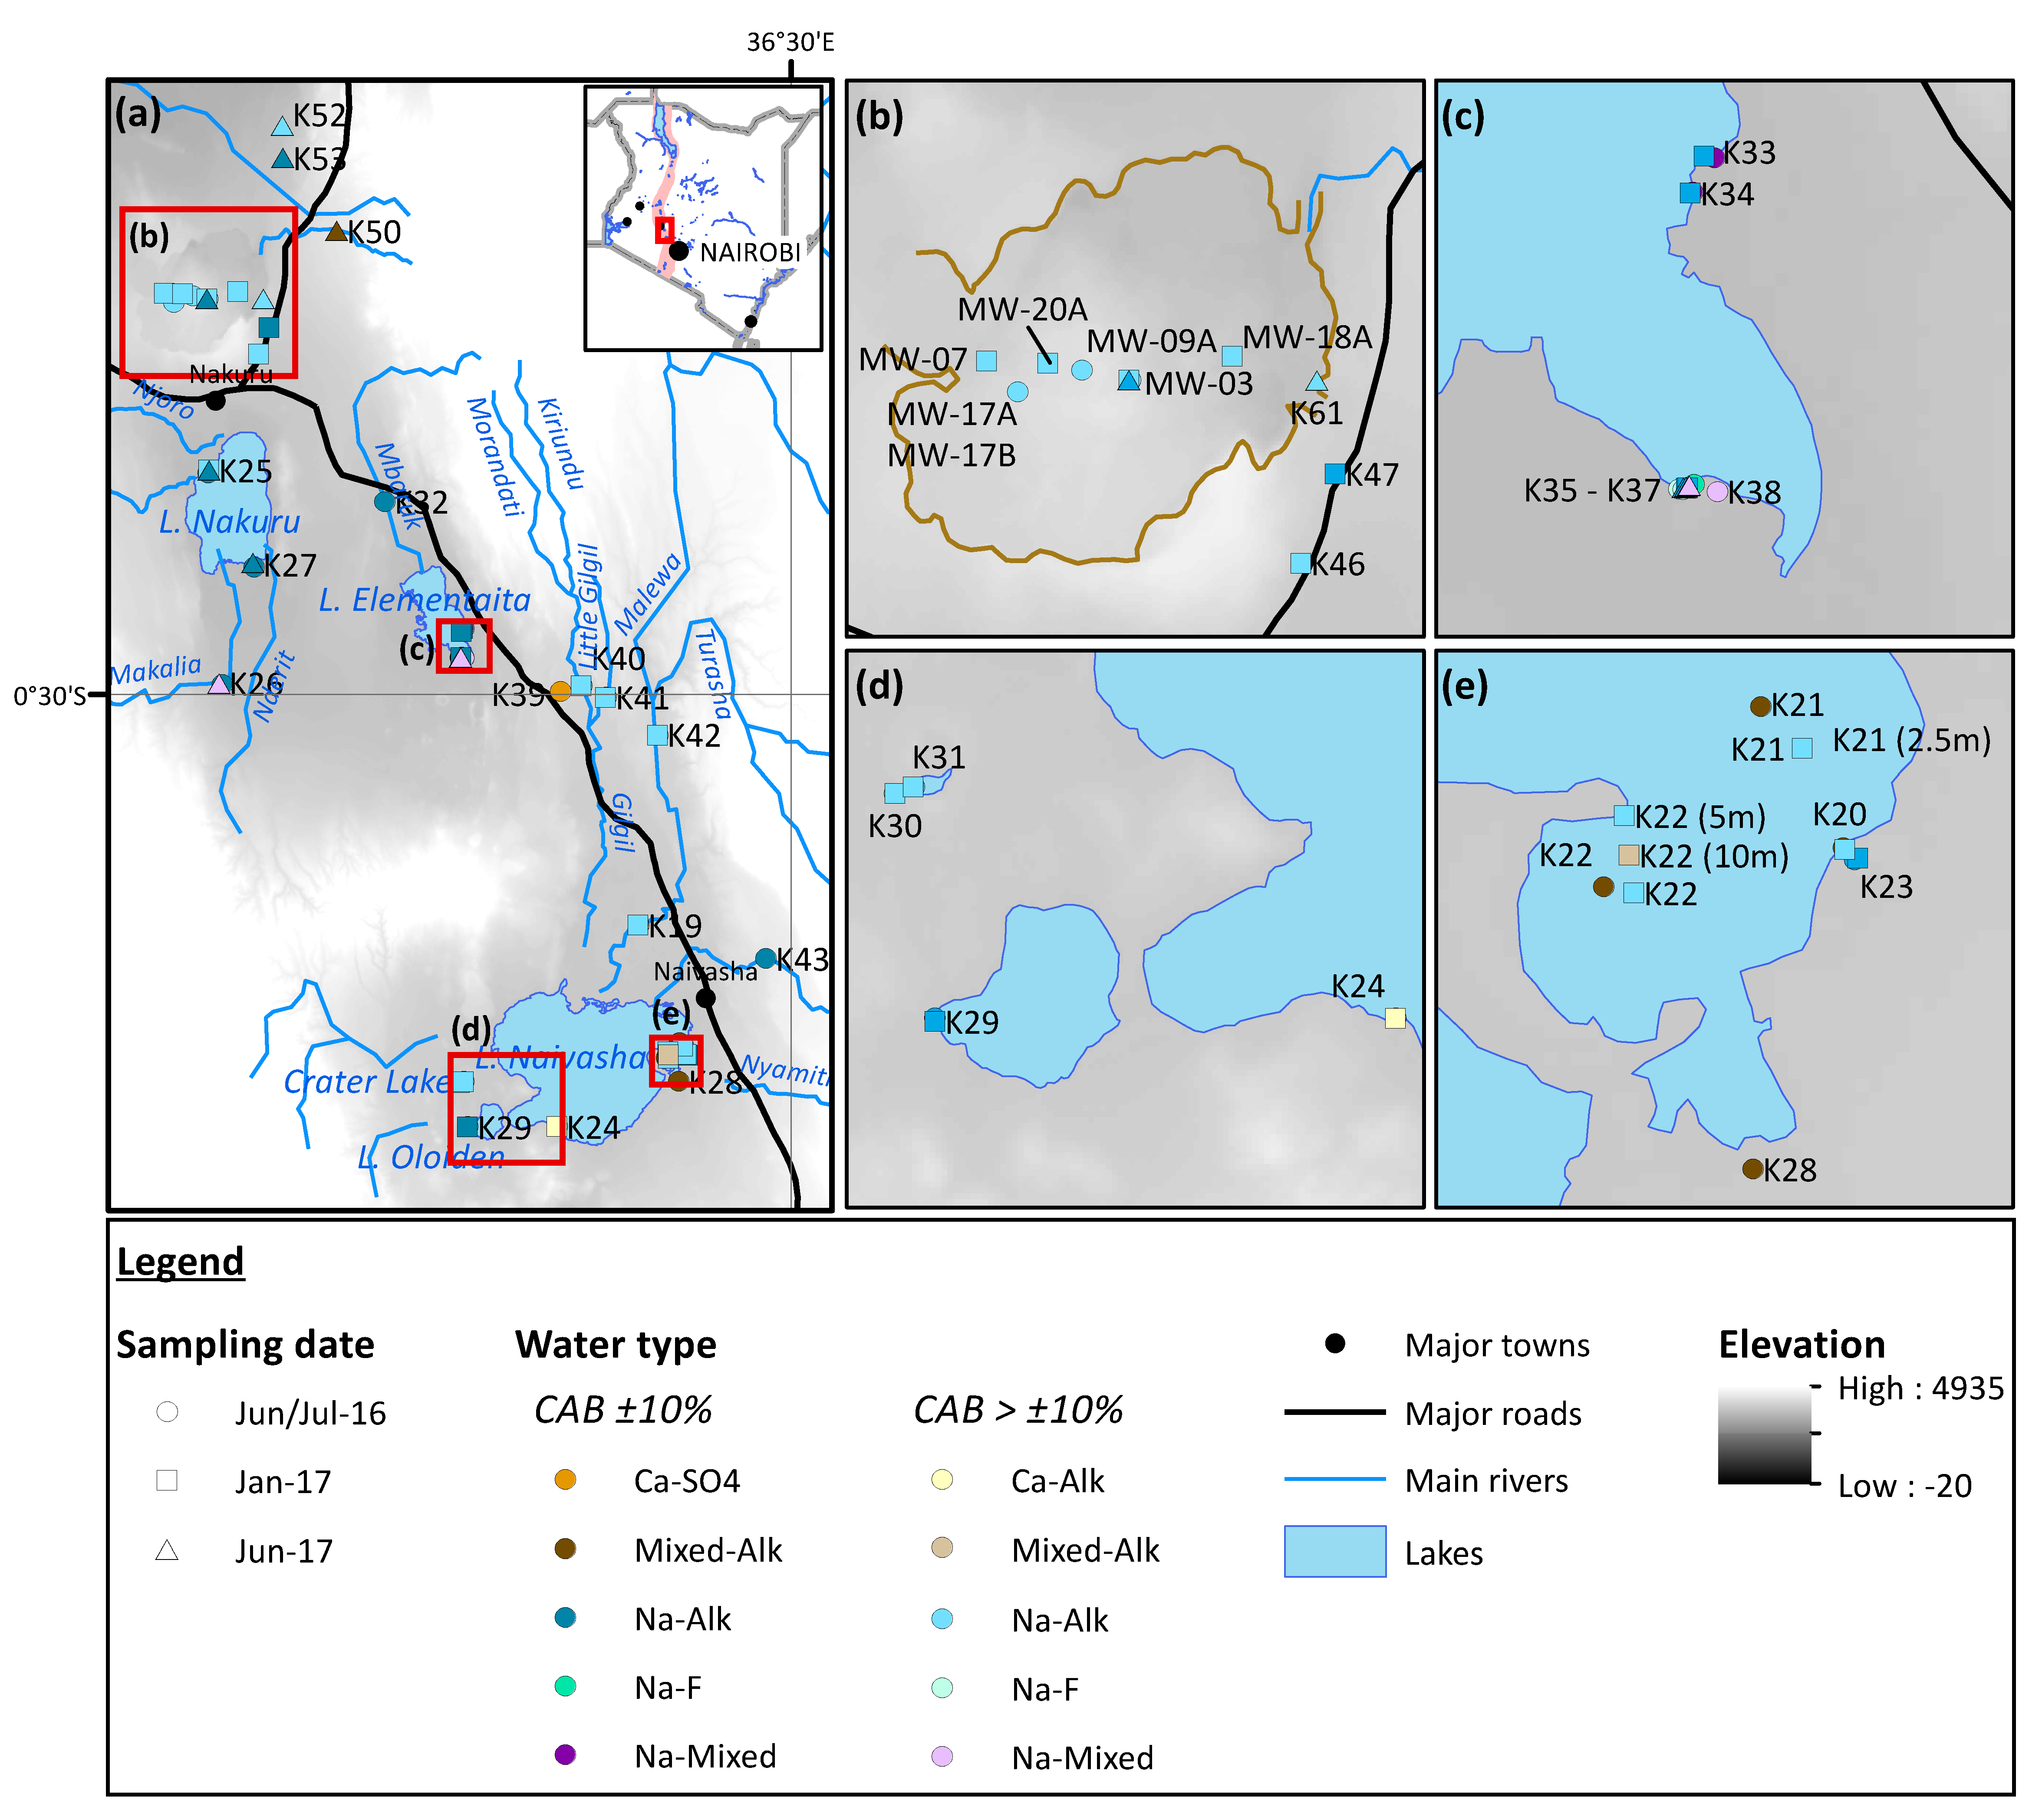
2. Study Area
2.1. Geological Setting
2.2. Hydrology and Hydrogeology of the Region
2.3. Source of Subsurface Heat in the Region
2.4. Geothermal Exploration and Development Efforts in the Menengai Geothermal Field
- A shallow liquid-dominated reservoir with temperature of 150–190 °C, intersected by wells MW-01, 03, 04 and 12, but very thin or absent in the vicinity of MW-06, 09 and 13 in the caldera centre. Estimated depth of 700—1100 m bgl at the top and 1000–1400 m bgl at the base, with areal extent of c. 20 km2.
- An intermediate reservoir with estimated temperatures in the range 250–270 °C in the vicinity of wells MW-01, 04 and 12 and c. 230 °C near MW-03. Possibly hydraulically connected to reservoir 3 (below).
- A dome-shaped deep reservoir with temperature estimated to be between 280 °C and >340 °C which is vapour-dominated in its central part (MW-06, 09, 12 and 13); a two-phase vapour-liquid zone near MW-01 and 04; and a liquid-dominated zone near MW-01 and 03 (with MW-01 at the zone boundary). In the centre of the dome, the estimated depth is 1100–1400 m bgl at the top and 2000–2200 m bgl at the base, with an average 600–1000 m thickness that decreases to below 500 m at the peripheries.
3. Materials and Methods
3.1. Field Sampling
3.2. Laboratory Analyses
4. Results
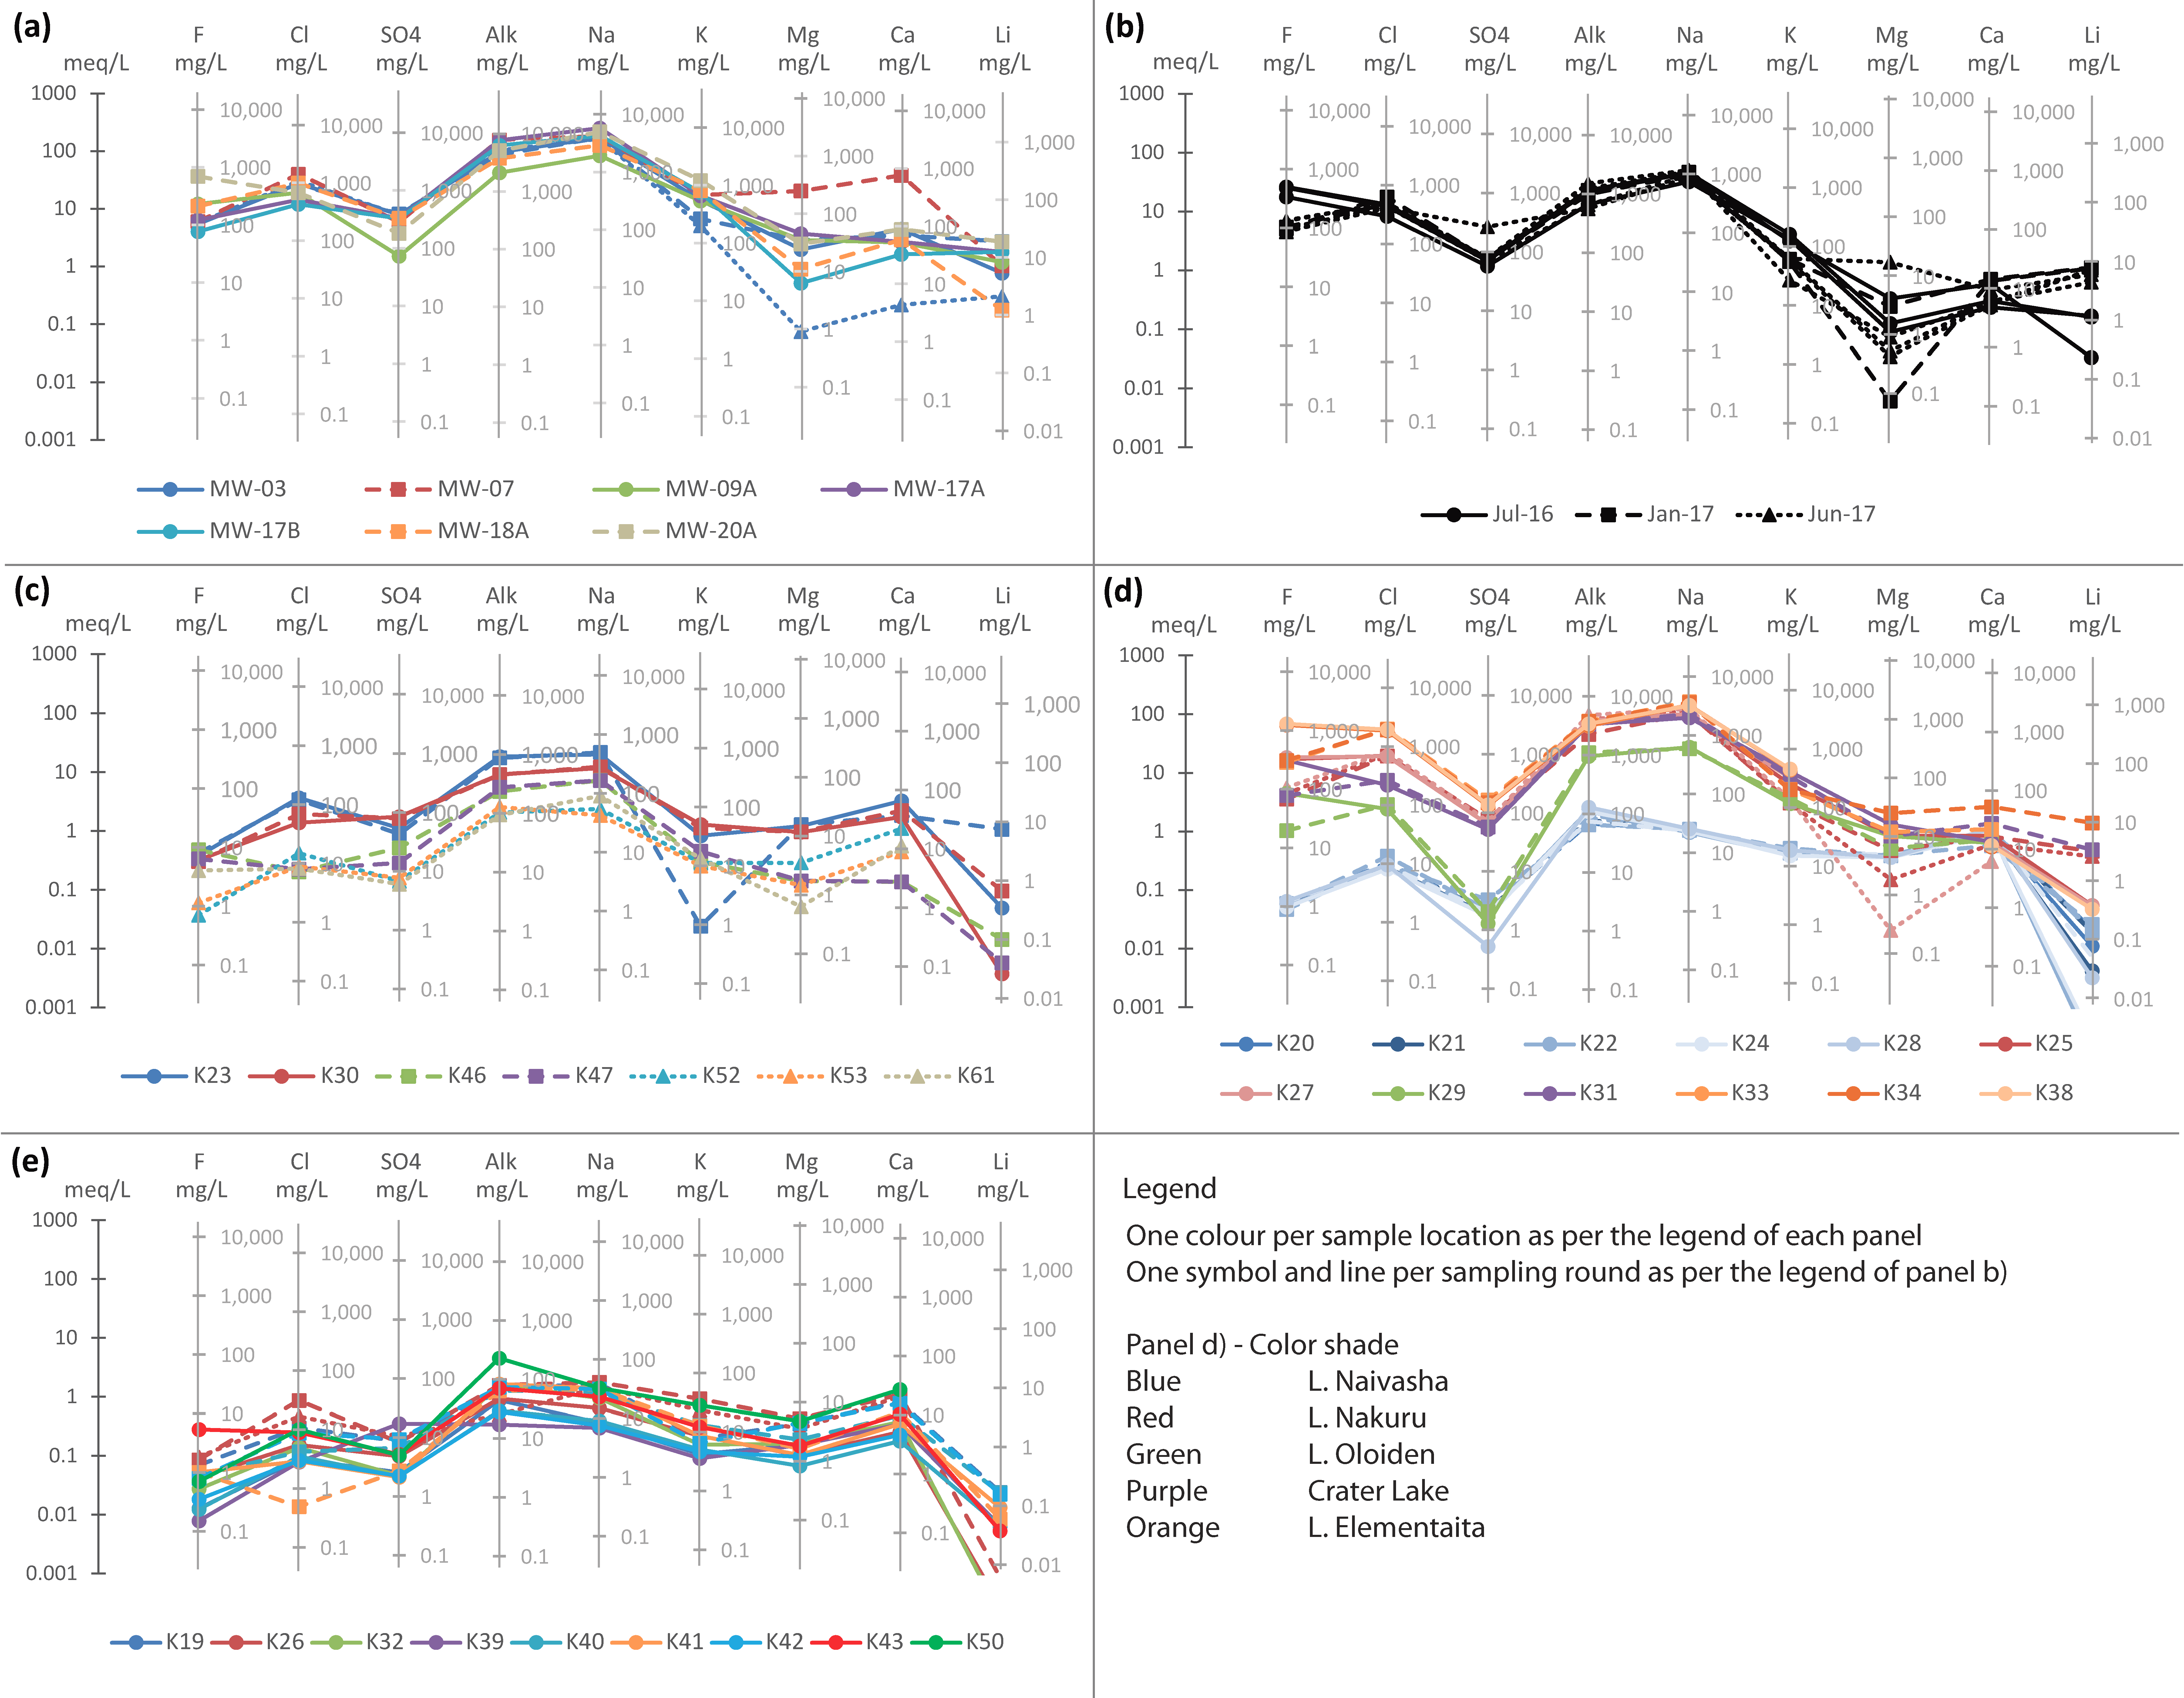
4.1. Physico-Chemistry of Nakuru County Waters
4.1.1. Geothermal Fluids
4.1.2. Groundwater
4.1.3. Surface Water
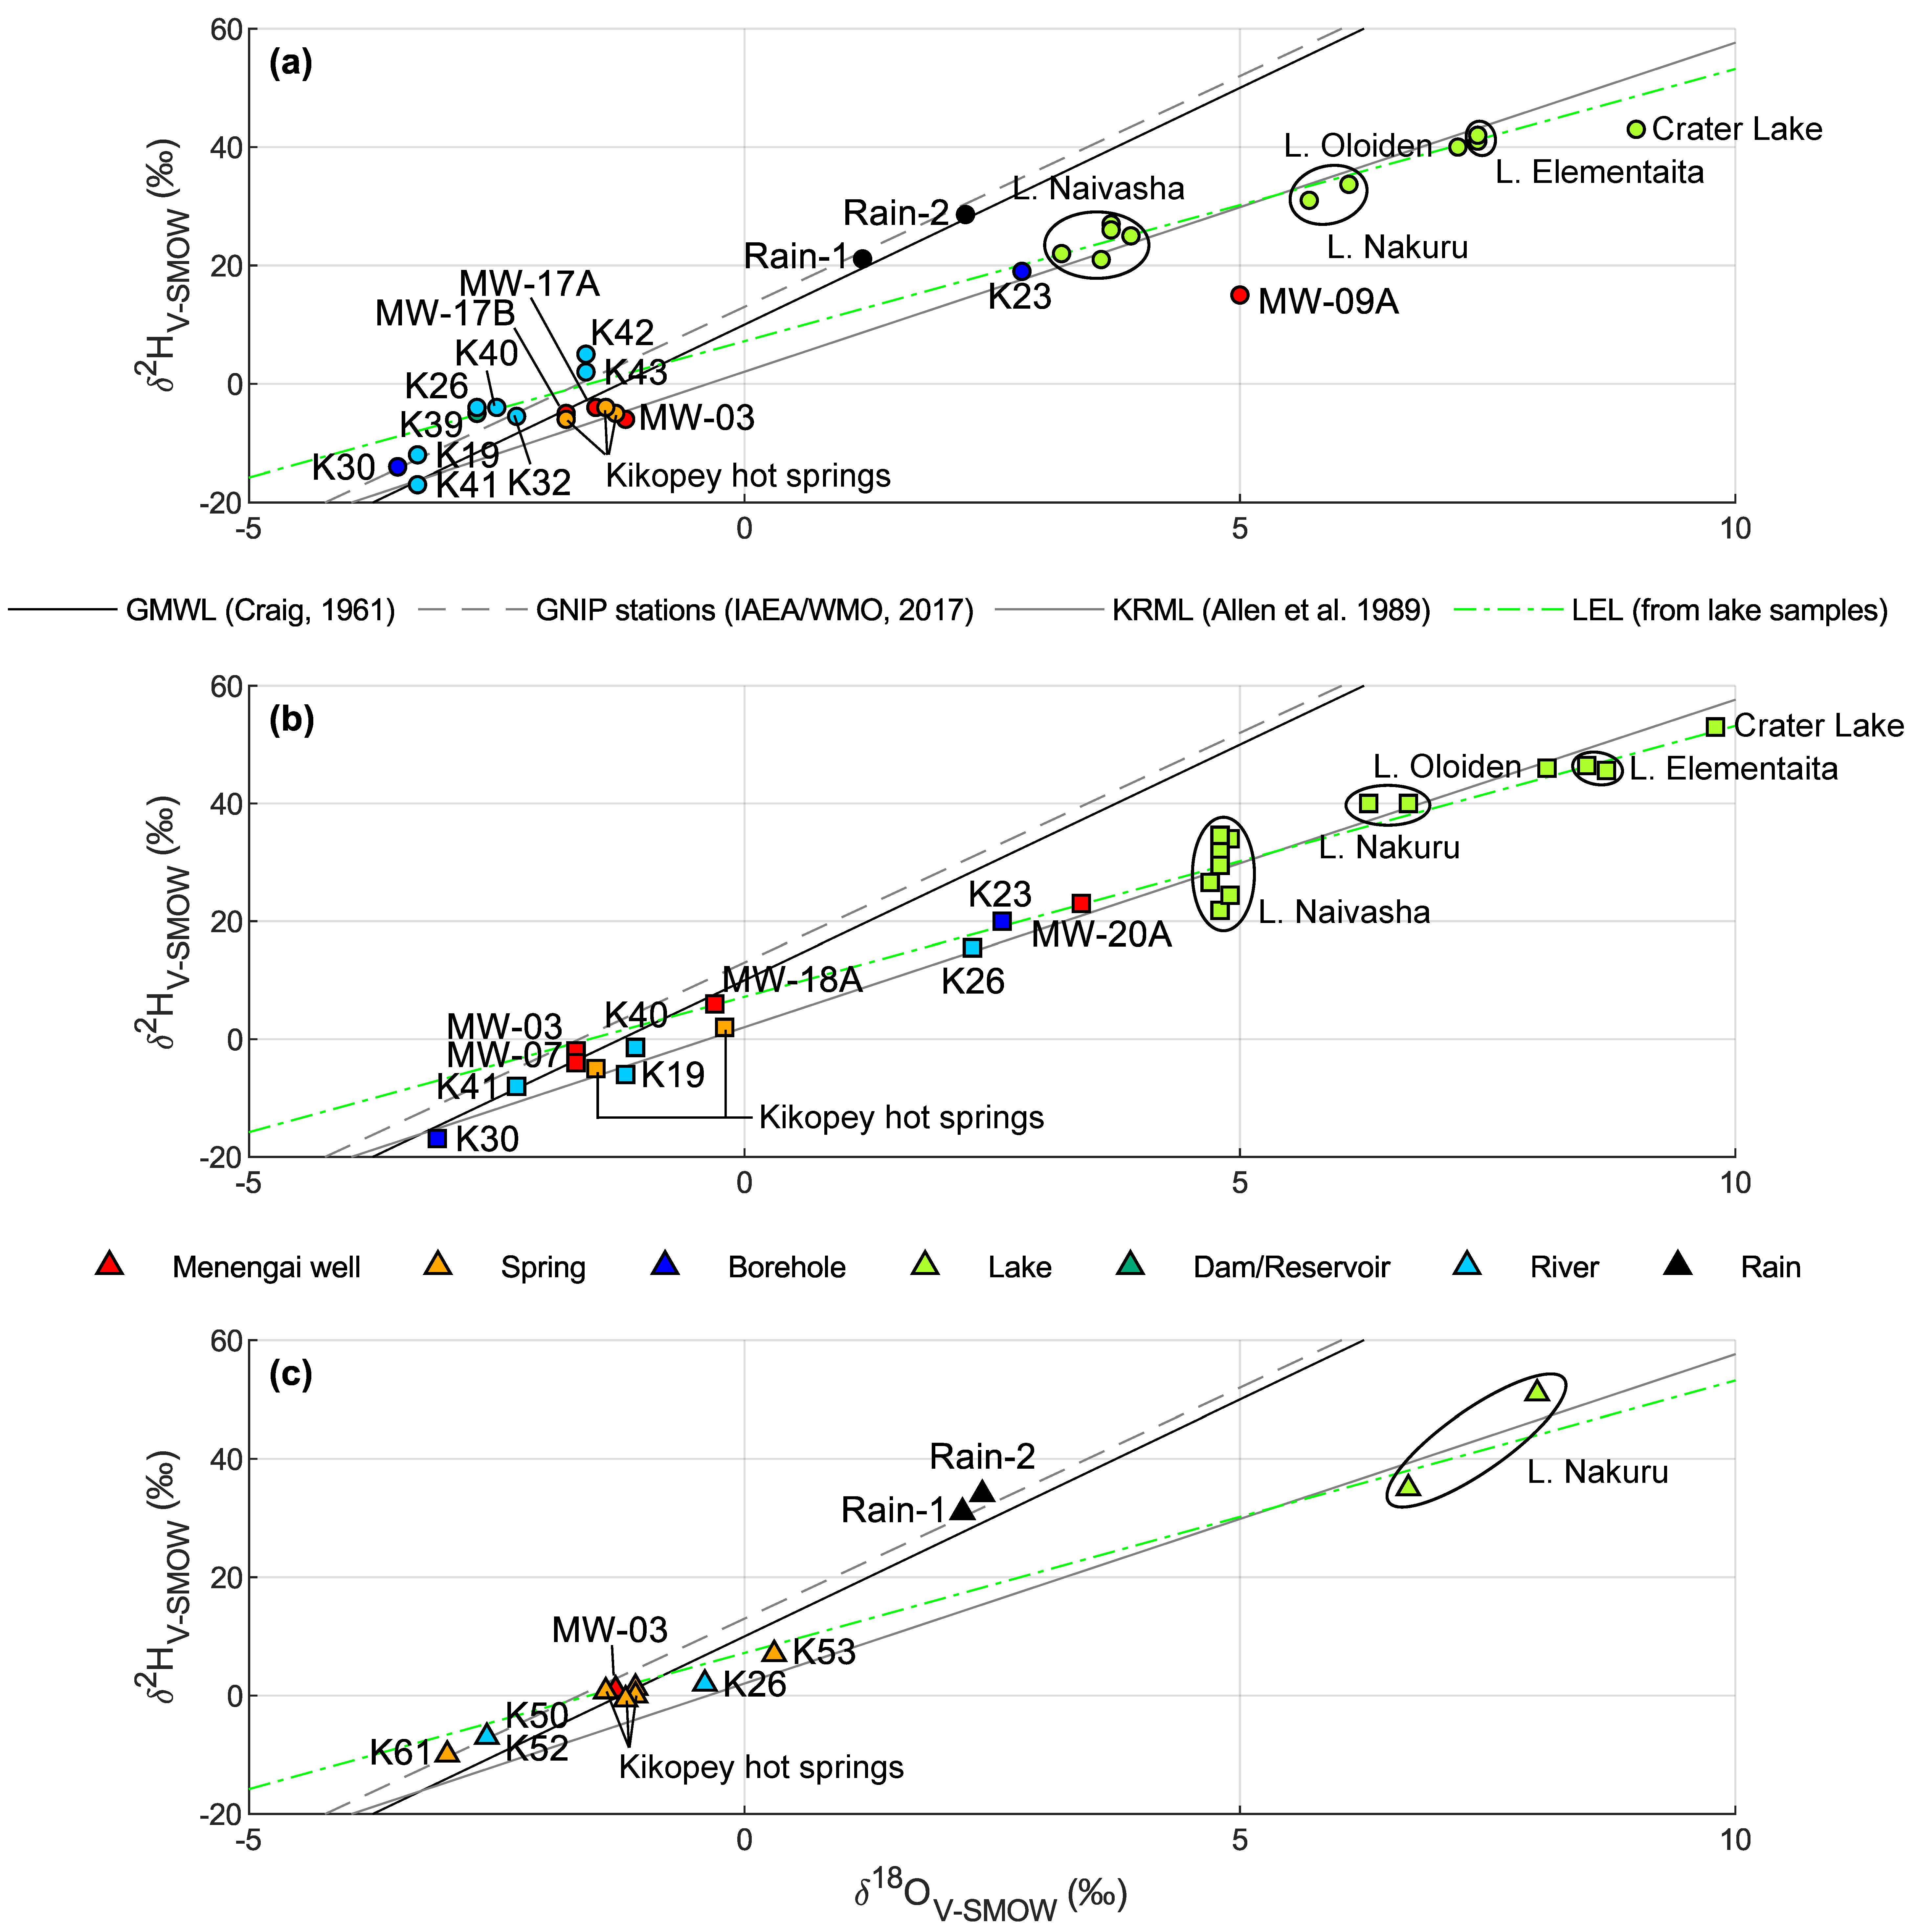
4.2. Stable Isotopes δ18O & δ2H
5. Discussion
5.1. Local Meteoric Water Line
5.2. Comparison with Previous Studies
5.3. Seasonal Variability
6. Conclusions
Supplementary Materials
Author Contributions
Funding
Acknowledgments
Conflicts of Interest
References
- Alexander, K.B.; Ussher, G. Geothermal resource assessment for Mt Longonot, Central Rift Valley, Kenya. In Proceedings of the GRC Annual Meeting, San Diego, CA, USA, 23–26 October 2011; pp. 1147–1154. [Google Scholar]
- Teklemariam, M. Geothermal outlook in East Africa and contribution of UNU-GTP in capacity building. In Proceedings of the 40th Anniversary Workshop of UNU-GTP, Reykjavik, Iceland, 26 April 2018. [Google Scholar]
- Omenda, P.; Mangi, P. Country update report for Kenya—2016. In Proceedings of the 6th African Rift Geothermal Conference, Addis Ababa, Ethiopia, 31 October–6 November 2016. [Google Scholar]
- IEA. Electricity Generation by Fuel; International Energy Agency: Paris, France, 2019. [Google Scholar]
- Richter, A. KenGen Announces 86.6 MW of Olkaria V Unit 1 Geothermal Plant to Be Online. Available online: http://www.thinkgeoenergy.com/kengen-announces-86-6-mw-of-olkaria-v-unit-1-geothermal-plant-to-be-online/ (accessed on 31 July 2019).
- Omenda, P.; Simiyu, S. Country update report for Kenya 2010–2014. In Proceedings of the World Geothermal Congress 2015, Melbourne, Australia, 19–24 April 2015. [Google Scholar]
- Baker, B.H. Tectonics and volcanism of the southern Kenya Rift Valley and its influence on rift sedimentation. Geol. Soc. Lond. Spec. Publ. 1986, 25, 45–57. [Google Scholar] [CrossRef]
- Allen, D.J.; Darling, W.G.; Burgess, W.G. Geothermics and Hydrology of the Southern Part of the Kenya Rift Valley with Emphasis on the Magadi-Nakuru Area; SD/89/1; British Geological Survey: Nottingham, UK, 1989. [Google Scholar]
- Burke, K.; Dewey, J.F. Plume-Generated Triple Junctions: Key Indicators in Applying Plate Tectonics to Old Rocks. J. Geol. 1973, 81, 406–433. [Google Scholar] [CrossRef]
- Wameyo, P.M. Magnetotelluric and Transient Electromagnetic Methods in Geothermal Prospecting, with Examples from Menengai, Kenya; The United Nations University: Reykjavík, Iceland, 2005; pp. 409–439. [Google Scholar]
- Omenda, P.A. Status of geothermal exploration in Kenya and future plans for its development. In Proceedings of the Short Course II on Surface Exploration for Geothermal Resources, Lake Naivasha, Kenya, 2–17 November 2008. [Google Scholar]
- Kanda, I. Geochemical exploration of geothermal prospects: A case study of Menengai, Kenya. In Proceedings of the Short Course VIII on Exploration for Geothermal Resources, Lake Naivasha, Kenya, 31 October–23 November 2013. [Google Scholar]
- Leat, P.T.; Macdonald, R.; Smith, R.L. Geochemical evolution of the Menengai Caldera Volcano, Kenya. J. Geophys. Res. Space Phys. 1984, 89, 8571–8592. [Google Scholar] [CrossRef]
- Macdonald, R.; Navarro, J.; Upton, B.; Davies, G. Strong compositional zonation in peralkaline magma: Menengai, Kenya Rift Valley. J. Volcanol. Geotherm. Res. 1994, 60, 301–325. [Google Scholar] [CrossRef]
- Jirsa, F.; Gruber, M.; Stojanovic, A.; Omondi, S.O.; Mader, D.; Körner, W.; Schagerl, M. Major and trace element geochemistry of Lake Bogoria and Lake Nakuru, Kenya, during extreme draught. Geochemie 2013, 73, 275–282. [Google Scholar] [CrossRef] [PubMed]
- Kanda, I.; Suwai, J. Hydrogeochemistry of shallow and deep water aquifers of Menengai geothermal area, Kenya Rift Valley. In Proceedings of the GRC Annual Meeting, Las Vegas, NV, USA, 29 September–2 October 2013; pp. 403–409. [Google Scholar]
- Igunza, G.M.; Kanda, I. Geochemical evaluation of groundwater flow processes and mixing in Menengai geothermal field, Kenya. In Proceedings of the GRC Annual Meeting, Salt Lake City, UT, USA, 1–4 October 2017. [Google Scholar]
- Raini, J.A. Impact of land use changes on water resources and biodiversity of Lake Nakuru catchment basin, Kenya. Afr. J. Ecol. 2009, 47, 39–45. [Google Scholar] [CrossRef]
- WRI. Kenya GIS Data. Available online: http://www.wri.org/resources/data-sets/kenya-gis-data (accessed on 10 January 2017).
- Munyiri, S.K. Structural Mapping of Olkaria Domes Geothermal Field Using Geochemical Soil Gas Surveys, Remote Sensing and GIS; School of Engineering and Natural Sciences, University of Iceland: Reykjavík, Iceland, 2016. [Google Scholar]
- Kaishan. Milestone Achieved by Kaishan in Its Exploration of Overseas Geothermal Power Generation Markets; Zhejiang Kaishan Compressor Co., Ltd.: Hangzhou, China, 2017. [Google Scholar]
- Gaciri, S.; Davies, T. The occurrence and geochemistry of fluoride in some natural waters of Kenya. J. Hydrol. 1993, 143, 395–412. [Google Scholar] [CrossRef]
- Darling, W.; Griesshaber, E.; Andrews, J.; Armannsson, H.; O’Nions, R. The origin of hydrothermal and other gases in the Kenya Rift Valley. Geochim. Cosmochim. Acta 1995, 59, 2501–2512. [Google Scholar] [CrossRef]
- Furman, T. Geochemistry of East African Rift basalts: An overview. J. Afr. Earth Sci. 2007, 48, 147–160. [Google Scholar] [CrossRef]
- Marty, B.; Gunnlaugsson, E.; Jambon, A.; Oskarsson, N.; Ozima, M.; Pineau, F.; Torssander, P. Gas geochemistry of geothermal fluids, the Hengill area, southwest rift zone of Iceland. Chem. Geol. 1991, 91, 207–225. [Google Scholar] [CrossRef]
- Lollar, B.S.; Ballentine, C.; Onions, R. The fate of mantle-derived carbon in a continental sedimentary basin: Integration of relationships and stable isotope signatures. Geochim. Cosmochim. Acta 1997, 61, 2295–2307. [Google Scholar] [CrossRef]
- Allen, D.J.; Darling, W.G. Geothermics and hydrogeology of the Kenya Rift Valley between Lake Baringo and Lake Turkana; SD/92/001; British Geological Survey: Nottingham, UK, 1992; p. 133. [Google Scholar]
- Rogers, N. Two mantle plumes beneath the East African rift system: Sr, Nd and Pb isotope evidence from Kenya Rift basalts. Earth Planet. Sci. Lett. 2000, 176, 387–400. [Google Scholar] [CrossRef]
- Baker, B.H.; Wohlenberg, J. Structure and Evolution of the Kenya Rift Valley. Nature 1971, 229, 538–542. [Google Scholar] [CrossRef] [PubMed]
- Girdler, R.W.; Sowerbutts, W.T.C. Some recent geophysical studies of the Rift System in East Africa. J. Geomagn. Geoelectr. 1970, 22, 153–163. [Google Scholar] [CrossRef]
- Khan, M.A.; Mansfield, J. Gravity Measurements in the Gregory Rift. Nat. Phys. Sci. 1971, 229, 72–75. [Google Scholar] [CrossRef]
- Searle, R.C. Evidence from Gravity Anomalies for Thinning of the Lithosphere beneath the Rift Valley in Kenya. Geophys. J. Int. 1970, 21, 13–31. [Google Scholar] [CrossRef]
- Wambugu, J.M. Chemistry in exploration of a geothermal field. In Proceedings of the Short Course IV on Exploration for Geothermal Resources, Lake Naivasha, Kenya, 1–22 November 2009. [Google Scholar]
- Lagat, J. Geothermal surface exploration approach: Case study of Menengai geothermal field, Kenya. In Proceedings of the Kenya Geothermal Conference, Nairobi, Kenya, 21–23 November 2011. [Google Scholar]
- Shako, L.; Wamalwa, A. GIS applications in heat source mapping in Menengai geothermal field. In Proceedings of the 5th African Rift Geothermal Conference, Arusha, Tanzania, 29–31 October 2014. [Google Scholar]
- Simiyu, S.M. Application of micro-seismic methods to geothermal exploration: Examples from the Kenya Rift. In Proceedings of the Short Course VIII on Exploration for Geothermal Resources, Lake Naivasha, Kenya, 31 October–23 November 2013. [Google Scholar]
- Malimo, S.J. Use of radon and carbon dioxide in geochemical exploration of Menengai and Silali geothermal prospects, Kenya. In Proceedings of the 4th African Rift Geothermal Conference, Nairobi, Kenya, 21–23 November 2012. [Google Scholar]
- Mibei, G. Geothermal exploration of the Menengai geothermal field. In Proceedings of the Short Course X on Exploration for Geothermal Resources, Lake Naivasha, Kenya, 9–30 November 2015. [Google Scholar]
- Omenda, P.A. Geothermal development in Kenya: A country update—2012. In Proceedings of the 4th African Rift Geothermal Conference, Nairobi, Kenya, 21–23 November 2012; pp. 89–93. [Google Scholar]
- Suwai, J.J. Preliminary Reservoir Analysis of Menengai Geothermal Field Exploration Wells; The United Nations University: Reykjavík, Iceland, 2011; pp. 799–826. [Google Scholar]
- Mangi, P.M. Geothermal development in Kenya—Country updates. In Proceedings of the 7th African Rift Geothermal Conference, Kigali, Rwanda, 29 October–4 November 2018. [Google Scholar]
- Sekento, L.R. Geochemical and Isotopic Study of the Menengai Geothermal Field, Kenya; The United Nations University: Reykjavík, Iceland, 2012; pp. 769–792. [Google Scholar]
- Gichira, J. Joint 1D inversion of MT and TEM data from Menengai geothermal field, Kenya. In Proceedings of the 5th African Rift Geothermal Conference, Arusha, Tanzania, 29–31 October 2014. [Google Scholar]
- Kanda, I.; Fujimitsu, Y.; Nishijima, J. Geological structures controlling the placement and geometry of heat sources within the Menengai geothermal field, Kenya as evidenced by gravity study. Geothermics 2019, 79, 67–81. [Google Scholar] [CrossRef]
- Montegrossi, G.; Pasqua, C.; Battistelli, A.; Mwawongo, G.; Ofwona, C. 3D natural state model of the Menengai geothermal system, Kenya. In Proceedings of the World Geothermal Congress 2015, Melbourne, Australia, 19–24 April 2015. [Google Scholar]
- Standard Reporter. Nakuru Power Project Now Set for September; Available online: https://www.standardmedia.co.ke/business/article/2001289112/nakuru-power-project-to-start-in-september (accessed on 23 July 2018).
- Takouleu, J.M. Kenya: Zhejiang Kaishan to Build Menengai III Geothermal Power Plant. Afrik21, 15 April 2019. [Google Scholar]
- Kipng’ok, J. Fluid Chemistry, Feed Zones and Boiling in the First Geothermal Exploration Well at Menengai, Kenya; The United Nations University: Reykjavík, Iceland, 2011; pp. 281–302. [Google Scholar]
- Malimo, S.J. Fluid chemistry of Menengai geothermal wells, Kenya. In Proceedings of the GRC Annual Meeting, Las Vegas, NV, USA, 29 September–2 October 2013; pp. 425–429. [Google Scholar]
- Auko, L.O. Evaluation of Fluid—Mineral Interaction in the Menengai Geothermal System, Central Rift, Kenya; The United Nations University: Reykjavík, Iceland, 2014; pp. 39–64. [Google Scholar]
- Kipng’ok, J.; Ochieng, L.; Kanda, I.; Suwai, J. Characterization of the Menengai high temperature geothermal reservoir using gas chemistry. In Proceedings of the GRC Annual Meeting, Portland, OR, USA, 26–28 May 2014; pp. 445–451. [Google Scholar]
- Malimo, S.J. Geochemical monitoring practices. In Proceedings of the Short Course IX on Exploration for Geothermal Resources, Lake Naivasha, Kenya, 2–23 November 2014. [Google Scholar]
- Auko, L.O.; Kipngok, J.K.; Mibei, G.K.; Kanda, I.K. Chemical Composition of Fumarolic Gases at the Menengai Geothermal Field-Central Rift Kenya: Variations monitored over a period of sampling from the year 2009 to June 2013. In Proceedings of the World Geothermal Congress 2015, Melbourne, Australia, 19–24 April 2015. [Google Scholar]
- Mundui, J.K.K. Mineral Scaling Potential Of Geothermal Fluids in Well MW 01A in Menengai, Kenya; The United Nations University: Reykjavík, Iceland, 2015; pp. 533–548. [Google Scholar]
- Kipngok, J.; Suwai, J.; Auko, L.; Malimo, S.; Mulusa, G.; Chepkemoi, S.; Marini, L. Assessment of carbon dioxide (CO2) partial pressures in the Menengai geothermal area, Kenya. In Proceedings of the 7th African Rift Geothermal Conference, Kigali, Rwanda, 29 October–4 November 2018. [Google Scholar]
- Njue, L.; Kipngok, J. Menengai Geothermal Field—Eastern Upflow. In Proceedings of the 7th African Rift Geothermal Conference, Kigali, Rwanda, 29 October–4 November 2018. [Google Scholar]
- USGS. Earth Explorer. Available online: https://earthexplorer.usgs.gov/ (accessed on 27 June 2019).
- Burnside, N.; Banks, D.; Boyce, A.; Athresh, A. Hydrochemistry and stable isotopes as tools for understanding the sustainability of minewater geothermal energy production from a ‘standing column’ heat pump system: Markham Colliery, Bolsover, Derbyshire, UK. Int. J. Coal Geol. 2016, 165, 223–230. [Google Scholar] [CrossRef]
- Misstear, B.D.R.; Banks, D.; Clark, L. Water Wells and Boreholes, 2nd ed.; John Wiley & Sons Ltd.: Chichester, UK, 2017; p. 536. [Google Scholar]
- Younger, P. Groundwater in the Environment; Blackwell Publishing: Hoboken, NJ, USA, 2007. [Google Scholar]
- Gonfiantini, R.I.A.E.A. advisory group meeting on stable isotope reference samples for geochemical and hydrological investigations: Vienna, Austria, September 19–21, 1983. Chem. Geol. 1984, 46, 85. [Google Scholar] [CrossRef]
- Andhika, M.; Castañeda, M.H.; Regenspurg, S. Characterization of Silica Precipitation at Geothermal Conditions. In Proceedings of the World Geothermal Congress 2015, Melbourne, Australia, 19–24 April 2015. [Google Scholar]
- WHO. Global Health Observatory Indicator Views; World Health Organization: Geneva, Switzerland, 2018. [Google Scholar]
- Craig, H. Isotopic Variations in Meteoric Waters. Science 1961, 133, 1702–1703. [Google Scholar] [CrossRef]
- IAEA/WMO. Global Network of Isotopes in Precipitation; IAEA/WMO: Geneva, Switzerland, 2019. [Google Scholar]
- NCDC. NCDC Climatic Data Online; National Climatic Data Centre: Asheville, NC, USA, 2019.
- Craig, H. The isotopic geochemistry of water and carbon in geothermal areas. In Nuclear Geology on Geothermal Areas; Consiglio Nazionale Delle Ricerche (CNR): Spoleto, Italy, 1963; pp. 17–53. [Google Scholar]
- D’Amore, F.; Panichi, C. Geochemistry in geothermal exploration. Int. J. Energy Res. 1985, 9, 277–298. [Google Scholar] [CrossRef]
- Nicholson, K. Geothermal Fluids: Chemistry and Exploration Techniques; Springer: Berlin/Heidelberg, Germany, 1993. [Google Scholar] [CrossRef]
- Ármannsson, H. Geochemical Studies on Three Geothermal Areas in West and Southwest, Uganda—Final Report; UGA/92/003; UNDESD, GSMD: Entebbe, Uganda; New York, NY, USA, 1994. [Google Scholar]
- Mutonga, M.W. Stable isotopic composition of geothermal fields in Kenya: The relationship between geothermal fields and Kenya Rift lakes waters. In Proceedings of the World Geothermal Congress 2015, Melbourne, Australia, 19–24 April 2015. [Google Scholar]
- Nkapiani, M.N.; Kamunya, K.M. Application of Stable Isotope Geochemistry to Tracing Recharge and Flow Systems of Fluids in Olkaria Geothermal Field, Kenya. In Proceedings of the Stanford Geothermal Workshop, Stanford, CA, USA, 26–28 January 2015. [Google Scholar]
- Ojiambo, B.S.; Poreda, R.J.; Lyons, W.B. Ground Water/Surface Water Interactions in Lake Naivasha, Kenya, Using δ18O, δD, and 3H/3He Age-Dating. Ground Water 2001, 39, 526–533. [Google Scholar] [CrossRef] [PubMed]
- Rozanski, K.; Araguas-Araguas, L.; Gonfiantini, R. Isotope patterns of precipitation in the East African region. In The Limnology, Climatology and Paleoclimatology of the East African Lakes; Johnson, T.C., Odada, E.O., Eds.; Gordon and Breach Publishers: Amsterdam, The Netherlands, 1996; pp. 79–93. [Google Scholar]
- Cohen, A.S.; Talbot, M.R.; Awramik, S.M.; Dettman, D.L.; Abell, P. Lake level and paleoenvironmental history of Lake Tanganyika, Africa, as inferred from late Holocene and modern stromatolites. GSA Bull. 1997, 109, 444–460. [Google Scholar] [CrossRef]
- Ojiambo, B.S.; Lyons, W.B. Stable Isotope Composition of Olkaria Geothermal Fluids, Kenya. Geotherm. Resour. Counc. Trans. 1993, 17, 149–154. [Google Scholar]
- Olaka, L.A.; Wilke, F.D.; Olago, D.O.; Odada, E.O.; Mulch, A.; Musolff, A. Groundwater fluoride enrichment in an active rift setting: Central Kenya Rift case study. Sci. Total Environ. 2016, 545, 641–653. [Google Scholar] [CrossRef] [PubMed]
- Nkapiani, M.N. Application of Stable Isotope Geochemisty to Tracing Recharge and Flow Systems of Fluids in the Olkaria Geothemal Field, Kenya; United Nations University: Reykjarvik, Iceland, 2014. [Google Scholar]
- Cioni, R.; Fanelli, G.; Guidi, M.; Kinyariro, J.; Marini, L. Lake Bogoria hot springs (Kenya): Geochemical features and geothermal implications. J. Volcanol. Geotherm. Res. 1992, 50, 231–246. [Google Scholar] [CrossRef]
- Karingithi, C.W. Geochemical Characteristcs of the Greater Olkaria Geothermal Field, Kenya; The United Nations University: Reykjavík, Iceland, 2000; pp. 165–188. [Google Scholar]


| Sampling Features | Available Data | Main Findings | Reference |
|---|---|---|---|
| MW-01 | Water chemistry, gas analyses, temperature and pressure profiles | Two main feed zones with potential mixing; 2-phase fluid rich in CO2 and oversaturated with respect to calcite CO2 from magnetic flux rather than equilibrium with minerals | [48] |
| MW-01, MW-04 and MW-05; lakes; cold and hot springs; boreholes | Water and gas chemistry, H and O isotopes | Menengai geothermal fluid is a mixture of local groundwater and water from Lake Nakuru Isotopic signature affected by water-rock interaction in MW-05 | [42] |
| MW-01 and MW-04; Lake Nakuru; boreholes | Water chemistry, H and O isotopes | Geothermal reservoir fluid, Lake Nakuru waters and local groundwater align on a possible mixing line Other hypothesis suggested: Rock-water interactions or dilution by local meteoric water Possible mixing between two end-members (feed zones) | [16] |
| MW-01, MW-03, MW-04 and MW-12 (two-phase discharge); MW-06 and MW-09 (steam) | Water chemistry, non-condensable gases | Steam fraction 0.1–0.5 Silica used as geothermometer Fluid gas concentrations increasing with temperature Dissolved CO2 controlled by local equilibrium between fluid and secondary minerals; some input due to magmatic intrusion | [49] |
| MW-01, MW-03, MW-04, MW-12, MW-19 and MW-20 | Water chemistry, gas composition | Heterogeneous reservoir with excess enthalpy caused by phase separation and conductive heat transfer from hot rock or magma to the circulating fluid, forming superheated steam | [50] |
| MW-01, MW-03, MW-04, MW-12, MW-19 and MW-20 (two-phase discharge); MW-06, MW-09 and MW-13 (steam) | Gas composition | Low H2O/CO2 related to high temperature from deep horizons and conversely Wells producing steam richer in H2S than 2-phase wells Redox conditions controlled by Fayalite–Hematite–Quartz buffer Variable steam fraction; gases attain chemical equilibrium | [51] |
| Boreholes | Water chemistry | No impact of geothermal exploitation on groundwater resources Trend following the direction of the Molo TVA | [52] |
| Fumaroles | Gas composition | Temporal variations difficult to assess due to atmospheric contamination (natural or due to sampling). Nevertheless, it was concluded that no significant changes occurred in response to geothermal exploitation | [53] |
| MW-01A | Water chemistry | Scaling potential assessed by chemical modelling Risks of calcite scaling during initial boiling, not at later stages; of amorphous silica scaling during use of water especially if the temperature drops below 100 °C | [54] |
| MW-01 and MW-04; lakes; boreholes | Water chemistry, H and O isotopes, tritium | Geothermal reservoir fluid, Lake Nakuru waters and local groundwater align on a possible mixing line (same as [16]) Low tritium values suggesting mean residence time over 25 years Recharge to geothermal reservoir from Lake Nakuru (estimated at 20%) | [17] |
| Boreholes; MW-01, MW-01A, MW-03, MW-04, MW-09A, MW-12, MW-19, MW-19A and MW-20A | Water chemistry (pCO2), isotopes (δ13C-CO2, 3He/4He) | pCO2 used to map structures Presence of CO2 in significant proportions affects boiling and phase conditions in wells Main CO2 origin from mantle (+ possible contribution from thermogenic processes and calcite dissolution | [55] |
| Fumarole MF-2; MW-18A | Gas composition, water chemistry | Fumarole MF-2 indicates a potential permeable zone (upflow zone) Liquid chemistry of MW-18A suggests intense boiling and water–rock interaction; oversaturation with respect to calcite; minimal mixing Low gas concentrations in MW-18A vapour phase (NCG 1.6% w/w); CO2 dominant | [56] |
| Sample Origin | Number of Samples | Temp °C | EC 1 µS/cm | pH | ORP 2 mV | Alkalinity mg/L CaCO3 |
|---|---|---|---|---|---|---|
| Menengai wells | 9 | >65 | 7645–18,150 | 8.8-10 | <−100 | 3780–7860 |
| Kikopey hot springs | 9 | 36–46 | 3170–4427 | 8.9–9.3 | 21–104 | 560–1500 |
| Other springs | 3 | 25–27 | 244–434 | 7.3–8.1 | 115–135 | 94–128 |
| Boreholes | 6 | 18–38 | 747–2202 | 7.1–8.9 | 107–198 | 235–920 |
| Rivers | 15 | 15–26 | 69–389 | 6.2–8.6 | 33–259 | 17–228 |
| Lake Nakuru | 6 | 19–33 | 8160–9713 | 9.4–9.8 | 17–131 | 340–4830 |
| Lake Elementaita | 5 | 23–26 | 11,900–13,250 | 9.4–9.9 | 1.1–164 | 3140–3830 |
| Lake Naivasha | 14 | 21–31 | 245–752 | 6.8–8.7 | 102–223 | 65–130 |
| Lake Oloiden | 2 | 24–30 | 2492–2693 | 9.2–9.5 | 129–161 | 960–1110 |
| Crater Lake | 2 | 23–25 | 7530–8221 | 9.5–9.8 | 86–107 | 3340–3380 |
| Sample Origin | Ca2+ | Mg2+ | Na+ | K+ | NH4+ | Cl | SO42− | NO3− | NO2− | PO43− | F− | Br− | Li+ |
|---|---|---|---|---|---|---|---|---|---|---|---|---|---|
| Menengai wells | 4.3–761 | 0.9–248 | 1923–5774 | 198–1212 | n.d. 1 | 425–1415 | 72–392 | n.d.–1.4 | n.d. | n.d. | 77–691 | n.d.–39 | 1.2–19 |
| Kikopey hot springs | 4.7–15 | 0.1–17 | 736–1160 | 26–162 | n.d. | 294–632 | 57–267 | n.d.–1.9 | n.d. | n.d. | 86–501 | n.d.–21 | 57–262 |
| Other springs | 0.8–3.5 | 9.9–14 | 42–98 | 0.2–0.4 | 8.9–22 | 5.4–15 | 6.7–7.7 | 4.5–35 | n.d. | n.d. | 0.7–4.5 | n.d.–0.1 | n.d. |
| Boreholes | 2.7–65 | 1.7–16 | 166–499 | 0.9–51 | n.d. | 7.2–130 | 13–84 | n.d.–26 | n.d.–0.3 | n.d.–1.3 | 5.8–9.4 | n.d.–16 | n.d.–7.4 |
| Rivers | 3.6–22 | 0.8–5.2 | 6.8–41 | 3.6–37 | n.d.–5.6 | 0.5–31 | 2.1–17 | n.d.–6 | n.d.–0.2 | n.d. | 0.2–5.3 | n.d.–3.6 | n.d.–0.2 |
| Lake Nakuru | 6.2–17 | n.d.–11 | 2323–2854 | 119–323 | n.d. | 679–810 | 63–78 | n.d. | n.d. | n.d. | 67–346 | n.d.–6.2 | n.d.–3.2 |
| Lake Elementaita | 10–53 | n.d.–25 | 3223–3704 | 201–457 | n.d.–63.2 | 1857–1986 | 131–166 | n.d. | n.d. | n.d. | 288–1298 | 5.3–27 | 0.3–9.7 |
| Lake Naivasha | 11–23 | 4.4–4.9 | 22–26 | 14–21 | n.d.–2.1 | 8.1–14 | 0.5–3.3 | n.d.–0.1 | n.d. | n.d. | 0.9–1.2 | 0.1–0.4 | n.d.–0.2 |
| Lake Oloiden | 12–15 | 6.2–11 | 594–629 | 117–144 | n.d. | 85–102 | 1.3–2.1 | n.d. | n.d. | n.d. | 19–84 | 2.6–3.1 | 0.5–1.6 |
| Crater Lake | 13–28 | 10–16 | 2005–2338 | 340–408 | n.d. | 218–264 | 52–58 | n.d. | n.d. | n.d. | 78–311 | 4.3–5.8 | 0.5–3.4 |
© 2019 by the authors. Licensee MDPI, Basel, Switzerland. This article is an open access article distributed under the terms and conditions of the Creative Commons Attribution (CC BY) license (http://creativecommons.org/licenses/by/4.0/).
Share and Cite
Montcoudiol, N.; Burnside, N.M.; Györe, D.; Mariita, N.; Mutia, T.; Boyce, A. Surface and Groundwater Hydrochemistry of the Menengai Caldera Geothermal Field and Surrounding Nakuru County, Kenya. Energies 2019, 12, 3131. https://doi.org/10.3390/en12163131
Montcoudiol N, Burnside NM, Györe D, Mariita N, Mutia T, Boyce A. Surface and Groundwater Hydrochemistry of the Menengai Caldera Geothermal Field and Surrounding Nakuru County, Kenya. Energies. 2019; 12(16):3131. https://doi.org/10.3390/en12163131
Chicago/Turabian StyleMontcoudiol, Nelly, Neil M. Burnside, Domokos Györe, Nicholas Mariita, Thecla Mutia, and Adrian Boyce. 2019. "Surface and Groundwater Hydrochemistry of the Menengai Caldera Geothermal Field and Surrounding Nakuru County, Kenya" Energies 12, no. 16: 3131. https://doi.org/10.3390/en12163131
APA StyleMontcoudiol, N., Burnside, N. M., Györe, D., Mariita, N., Mutia, T., & Boyce, A. (2019). Surface and Groundwater Hydrochemistry of the Menengai Caldera Geothermal Field and Surrounding Nakuru County, Kenya. Energies, 12(16), 3131. https://doi.org/10.3390/en12163131