Abstract
Geothermal well integrity has proven to be of high importance, especially because the geothermal life span is expected to be longer than that of conventional oil and gas wells. Recent studies have demonstrated that cement-casing interfacial bonding is a classical well failure in such wells, but field measurements do not correlate with the simulations. We believe that this discrepancy is due to limitations of the simulation itself, which in most cases assumes a free movement of the casing after the interfacial bonding has been exceeded. Since the casing is cemented using a complex hardware package such as centralizer and other cementing components, the free movement of the casing is only possible when no-cement exists behind the casing. This paper proposes a novel experimental method to understand cement strength properties other than the standardized unconfined cement strength (UCS). The novel setup allows the measurement of interfacial bonding strength between cement and casing and the pure cement shear strength. The later becomes an important parameter as the interaction between casing couplings and cement will show. In the past, standard cement bending tests were designed to measure cement shear, but the value obtained from such tests is not relevant for the geothermal in situ casing-cement interaction, and thus the need for a new testing method arose. The new method is capable to mimic the interaction between the casing connection edges and the cement. We believe that the results presented within this paper will help engineers to validate their numerical simulations and to optimize the geothermal well design which will result in the increase of the well integrity for the life of the geothermal well.
1. Introduction
The energy harnessed from geothermal resources is a reliable and well-known resource which can offer base load power generation. Other renewable energy forms are in general not able to provide base load power generation without high cost investment in energy storage [1]. Drilling principles in geothermal and oil and gas are very similar. In fact, geothermal is equivalent with the high-pressure high temperature well classification of the later. Because of these similarities, technical problems of oil and gas wells will also apply to geothermal ones, and thus, the engineers will follow same construction standards and regulations. The loss of well integrity, a major concern which may cause safety issues, environmental risks, lost time, and additional cost, is considered to be very important and an actual problem with wells of any age and type. During the production phase, the cement behind the casing is considered to be an important safety barrier, and therefore, a successful cementing job becomes critical to achieve the long term well integrity [2].
In the work performed by Wehling [3] it has been shown that the wellbore integrity can be seriously affected by three types of cement mechanical failure: radial cracks, de-bonding cracks or micro annulus, and shear failure. However, those three types of failure will exist only when the axial movement of the casing is not restricted by any geometry change of the casing string. When geometry changes are considered, the intimate interaction between cement and casing must be studied and considered.
The American Petroleum Institute (API) Specification 10A (API 10A) states the requirements, properties, and conditions of use for different cement classes, thus we have used class H cement for the experiments. Table 1 shows the classification of API cements (adapted after [4]). It must be noted that the dry powder is called cement; however, the hardened product after cement is mixed with water is still called cement for well construction purposes. Some authors use the term ‘cement sheath’ to refer to the hardened cement. The cement powder mixed with water is called ‘cement slurry’ and it is very easily pumped down the hole. Once the cement slurry sets or hardens it forms the ‘cement sheath’ or simple called ‘cement’. The use of cement types and their mixtures can vary by well depth, bottom hole temperature, and pressure as well as sulfate resistance, especially for geothermal applications. In order to improve cement properties, a small amount of chemicals called additives are added in order to control and modify the behavior of the cement slurry. The most common additives can be classified in accelerators, retarders, extenders, and weighting agents. Of course, special applications will require special developed solutions and additives. The most common cement used in well cementing, also named oilwell cement, is the Portland cement type which sets and develops compressive strength through the process of hydration, which is a complex chemical process generated by the reactions between dry cement constituents and water. The main components that result from the cement hydration are the generally named C-S-H gels and calcium hydroxide. The hydration process of the cement primary phases can be illustrated for the different cement components as follows [4]: during cement setting, the transition from water and anhydrous components to C-S-H gel takes place to 30% in one day whereas the remaining 70% are completed after 28 days. Although the hydration starts instantaneously, the process is slow (taking hours and days) and is influenced by the curing conditions and additives.

Table 1.
Portland cement classes [4].
When it comes to well integrity, every casing that is cemented in place must ensure good isolation and avoid any fluid migration during the life of the well. Geothermal wells have the same requirements in terms of well integrity as oil and gas ones. That also implies that the surface casing which should isolate and protect the fresh water horizons must comply with well integrity conditions and regulations. Ichim and Teodoriu [5,6] have pointed out the importance of thermal cycles and their inevitable effect on cement integrity. Although surface casings are not directly exposed to high temperature of the fluid produced by a geothermal well, the casing and cement temperatures may reach elevated values up to 100 °C. This hypothesis was considered for the experiments shown in this paper and as such, the maximum temperature used for testing was only 65 °C. The temperature effect is also considered for the interaction between coupling and cement, and this paper is introducing laboratory test results achieved through a customized testing setup of a coupling and the surrounding cement.
In both the hydrocarbons and geothermal industry, investigations on compressive strength of diverse cement samples under various influential factors such as: thermal variation, added additives, and curing time have been of interest to observe their influence on well integrity issues. Philippacopoulos et al. [7] pointed out that compressive strength might not be the main factor that secures zonal isolation in oil, gas, or geothermal wells. Their studies indicated that other mechanical properties of the cement, such as shear stress, bonding stress, Young’s modulus, and Poisson’s ratio are important factors to be considered when wellbore integrity is evaluated. Teodoriu [8] introduced the possibility of cement failure caused by shear failure, but unlike numerous compressive strength studies of cement, the well integrity issues caused by shear failure have not been spotlighted as much. This issue had been readdressed by [9] who showed the importance of long-term cement properties and the need for reference numbers to be used for numerical well integrity studies. For the purpose of this work, it is important to note that the shear strength is a mechanical property of Portland cement-based materials analogous to the unconfined compressive strength (UCS) and the tensile strength (UTS). The interfacial bonding shear strength studied in this paper is an interfacial property that depends on cement and the contact material (i.e., between casing and cement); therefore, the proper name for this mechanical property is interfacial bonding shear strength (IBSS). Interfacial can be measured in tension or through shear, but our focus in this work is shear bonding failure.
Concrete IBSS is a very important mechanical property for the construction industry and as a result, numerous studies have focused on measuring it. Unlike well cements, the concrete used for civil engineering is a mix of cement with aggregates of different shapes and sizes such as sand or gravel. The most used setup to measure the flexure strength in civil engineering is the beam shaped structure loaded in three points, which can be indirectly used to measure shear strength. However, this loading is different from the annular shaped cement placed around the casing in a geothermal well. The results of the civil engineering beam tests are only focused on the cement and neglect the cement-pipe interaction. Wong et al. [10] have conducted a very detailed experiment to measure the direct shear strength for concrete in order to understand their shearing behavior under a given range of confining pressure. Bejar and Rushing [11] examined the shear strength of a cylinder model of Class H Cement with added silica fume through a finite element analysis approach. However, their main concern was the accuracy of the cement properties used for the simulation. The first published studies on cement interfacial bonding were presented by Evans and Carter [12] who obtained shear bonding strength (equivalent to interfacial bonding strength described in this work) and hydraulic bonding strength (equivalent to a leak strength) between casing and cement. The shear bonding tests (this was the official name provided by the authors, which is the equivalent of our proposed IBSS) performed by [12] consisted of measuring the axial force required to push a cylinder that was previously cemented inside another cylindrical shape container. The hydraulic shear bond (HSB) was measured by pumping water in the middle of two concentric cylinders that were cemented in place. [12] experiments were performed on API Class A cement samples cured inside of a 2 in. pipe (inside diameter) of 10 in. length. Experimental work on cement IBSS was also performed by [13,14,15]. Some of their published data will be used as comparison for this paper and are presented later.
Using Finite Element Method, Kaldal et al. [16] and Teodoriu [8] have shown the importance of casing coupling—cement interaction, in which the maximum stresses in a temperature loaded well will always appear between the coupling edges and cement. Figure 1 shows the von Misses stresses obtained by [16] The results indicate that the failure mode of cement is most likely shear (please note the high stress concentration around the edge of the coupling). Teodoriu [8] has theoretically stated that the shear stress will probably propagate vertically or diagonally (see the marked lines in Figure 1). Due to the thin cement layer (normally between 10 and 30 mm), it is safe to assume that the shear failure will most likely propagate vertically.
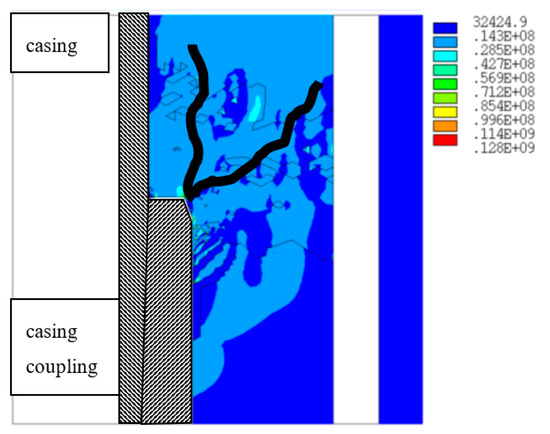
Figure 1.
von Mises stresses [MPa] in the cement around a Buttress type casing coupling (modified after [15]).
The experiments presented in this work simulate the shear bonding strength between cement and casing coupling, showing which shear failure will appear first and then comparing this with the cement ultimate compressive strength. To resemble the annular shape that represents casing/coupling, each test cell was customized accordingly. A standard API recipe of Class H cement has been used and the samples were tested for shear/bonding stress at different ages. API class H cement is very commonly used in deep wells. The cement composition follows the requirements of API 10A Table 9.3 [17].
2. Experimental Approach
In what follows, the experimental approach used in this work is shown. First, the sample preparation will be described, followed by the measurement and data collection.
2.1. Sample Preparation
The purpose of this work is to obtain accurate mechanical properties of neat set cement only, since additives may strongly alter the results, and thus, structured and focused research will not be possible without understanding based cement properties. For this purpose, Class H neat cement was considered. According to API 10 A [18], mixing class H cement requires 38% water by weight of well cement. This requirement leads to using 860 g of Class H cement and 327 g of distilled water. The mixing procedure followed exactly the API specifications and was as follows: the mixing speed was maintained at 4000 RPM while the cement was added; the cement powder was fully added to the mixer within 15 s during that time. After 15 s, the mixing rate switched automatically to 12,000 RPM and was maintained for 35 s. All the equipment used for mixing is API certified and was explained in great detail by [19,20]. The cement slurry was visually inspected (to be free of clumps or air bubbles) and then poured into dedicated molds: for UCS cube molds as per API 10A [18] (cubes), for pure shear strength a dedicated newly build cell was used, while for interfacial bonding shear strength cylindrical pipes were used. When cement-mold bonding had to be reduced, the contact surface was coated with a non-reactive release agent (grease) before the cement mixture was poured. Particularly for the interfacial bonding shear strength samples, no grease was used on the metallic molds, and the surfaces were carefully cleaned and kept free of any impurities. After a few minutes in which the air bubbles were monitored, the molds were placed in water baths with controlled temperature. Distilled water was used for mixing and curing the samples. The pressure was always atmospheric pressure, while the selected temperatures for the experiments presented in this paper are room (20 °C) and elevated (65 °C) ones. The samples were cured for 1, 3, 7, and 14 days. Several room temperature samples were cured for 35 and 82 days before the shear and bonding tests were performed. For reference, cube molds were prepared and used for the same curing days as shown above.
2.2. Experimental Setup
The experimental setup consists of an instrumented hydraulic press with a maximum capacity of 200 kN (or 20 tons). The hydraulic press applies the axial load to the samples through a manufactured extension bar while a force gauge placed below the testing cell measured the applied load. The force gauge is connected to a data acquisition system together with a displacement sensor. The cells (molds) used for these experiments are placed in their corresponding adapters before the force is only applied to the cement used for investigations, see Figure 2. Figure 3 shows a cross sectional view of the shear cell with a similar shoulder as the one generated by the casing coupling (Figure 2A) compared with the interfacial bonding shear strength cell (Figure 2B). The IBSS cell uses a slightly different principle as the cell presented by other authors. Our cell uses the cement inside of a cylinder with known and well measured geometry and thus, only one contact area with the pipe exists. A single contact area simplifies the process and also improves the ability to accurately measure the interfacial bonding shear strength. The pipe is zinc plated with a slightly higher roughness than regular blank pipe; however, a good bonding between pipe and cement was intended. Future tests can be performed with pipes of different roughness and/or coatings. The pure shear strength cells (molds) are made of steel with low pipe roughness and, as mentioned above, the inner surface of the cell was greased in order to avoid cement bonding. The pure shear strength cell has a step diameter change at the inner diameter, which has the same geometry as a casing coupling downscaled to the size of 2 inch. The adapter used for shear applies the force on a contact area (circle) that has the same diameter as the smallest ID of the cell. As a result, the cement is sheared along this diameter. The evolution of load and displacement was measured and recorded for later analysis.
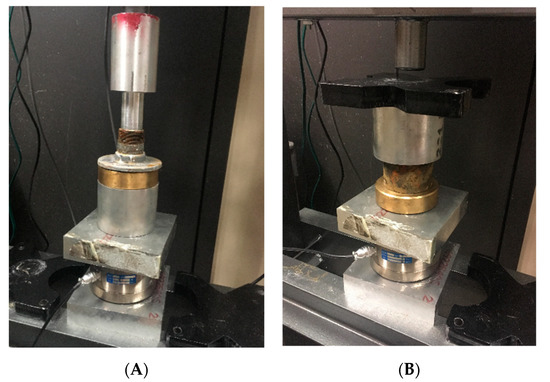
Figure 2.
Views of the testing cells mounted in the press, the interfacial shear bonding strength (A) and the shear strength (B).
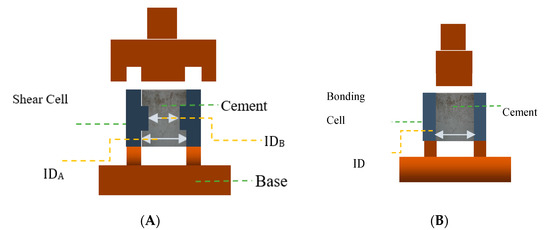
Figure 3.
Shear strength (A) and interfacial bonding shear strength (B) test cells used in the present study.
Table 2 shows the geometrical details of the constructed cells: length, outer diameter, and inner diameter (IDA, IDB). The shear strength cell has two inner diameters in order to create the square shoulder of an equivalent coupling. The values shown in Table 2 are used for calculation based on the Equations (1) and (2).
Table 2.
Geometries of the shear and bonding cells.
Figure 4 shows the shear strength specimens before and after testing. The cement behavior for fresh samples (1 to 3 days curing) versus long term samples is very interesting. Samples with low curing time tend to show a higher ductility and thus, the cement is literally extruded from the sample, while the long-term samples (cured over 7 days or longer) will crack and fail in a brittle mode. Figure 5 shows the shear bonding strength specimens after testing. The same behavior as above was noted. One explanation of this behavior is that the incomplete cement hydration strongly affects the cement properties. This was particularly observed on the evolution of the cement UCS, which needs time to reach a good UCS value.
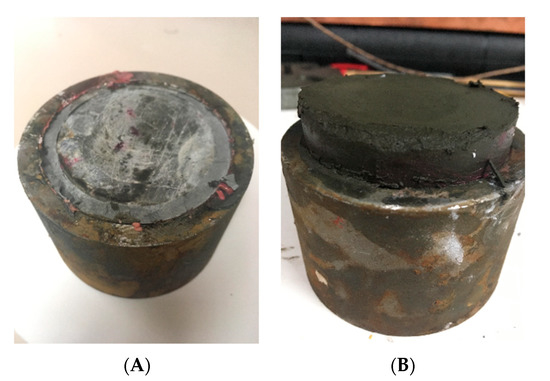
Figure 4.
Shear strength specimens before testing (A) and after testing (B)—after testing the cement is pushed outside the mold.
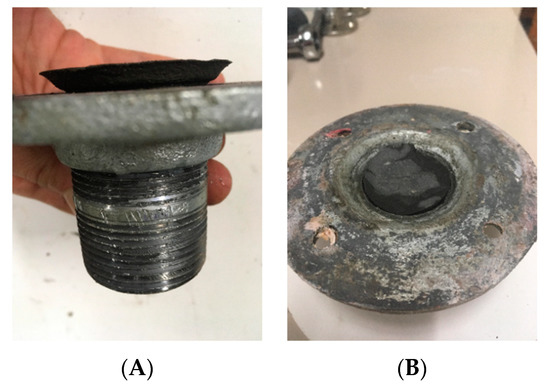
Figure 5.
Interfacial bonding shear strength specimens after testing: (A) shows a cement sample cured for 1 day and (B) a long-term cured sample). Note that the cement sample cured for one day is still in one piece, whereas the long-term sample suffered brittle failure.
The pure shear strength (measured in MPa) is calculated using the following equation:
where
- Fmax is the maximum recorded force, N;
- IDB is the inner diameter of the shoulder, m;
- SL is the shear length of cement in the cell, m.
The interfacial bonding shear strength (measured in MPa) is calculated as:
where
- Fmax is the maximum recorded force, N;
- IDA is the inner diameter of the cell, m;
- CL is the interfacial bonding shear strength cell length, m.
To verify if the data generated within this research is comparable with other published results, we compared our results with previously published data by [12,13,14,15,21,22,23,24]. However, the published data is limited and allows only a qualitative comparison. Also, only the interfacial bonding shear strength data could be compared since no previous work has proposed a pure shear test comparable with the ones performed in this work. Also, the literature study we had performed showed that commonly, interfacial bonding shear strength was measured after 1 day (24 h) and therefore, as presented in Table 3, the results found in this research for 1 day at room temperature show comparable numbers.
Table 3.
Comparison and validation of the preliminary tests of this work with the literature published values.
As shown in Table 3, the interfacial bonding shear strength values measured after 1 day of curing are similar to the reported values. The measured interfacial bonding shear strength after 82 days of curing is higher than that reported by [12] but can be explained by the extended curing time used for the experiment: 82 versus 5 days curing. All room temperature data points shown in this work are based on a minimum of 6 experiments that were repeated to enhance the data quality. Elevated temperature experiments were done using 4 samples for each data point.
2.3. Elevated Curing Temperature Experiments and Results
The effects of elevated temperature on cement mechanical properties were further investigated by curing the samples for 3 days at elevated temperature set to be 65 °C (±2 °C). For the interfacial bonding shear strength test, 6 samples were tested at room temperature, while only 4 samples were exposed to elevated temperature to investigate the thermal effect on the samples. To reduce the measurement and mixing errors, average values were calculated and used for comparison as shown in Table 4. The elevated temperature curing affected the measured properties of the cement, specifically samples cured at high temperature of 65 °C (±2 °C) showed approximately 3 times higher bonding stress in average, see Table 4.
Table 4.
Comparison between 3-day curing room temperature and elevated temperature (ET) bonding s strength.
Similarly, the average pure shear strength value after 3 days of curing at room temperature was 7.28 MPa, while at an elevated temperature of 65 °C (±2 °C), a value of 21.04 MPa was obtained. The measured pure shear strength at elevated temperature shows a large variation between the first and the second attempt. We assume that this could be a result of curing temperature variance during the curing process. Later it was also observed that the cement batch of the second samples was different, showing slight differences from our preliminary experiments [25]. To avoid this, all other samples were prepared from the same cement batch and the same container, while the temperature was continuously monitored using a PC based data acquisition. Figure 6 shows the values measured for PSS and IBSS at elevated temperatures for 3 days curing compared to room temperature at 1, 3, and 7 days of curing. Figure 7 allows for a better comparison of the values measured at room vs. elevated temperature. Please note that the accuracy of our measurements is less than 1%, therefore the error bars are not visible in Figure 6.
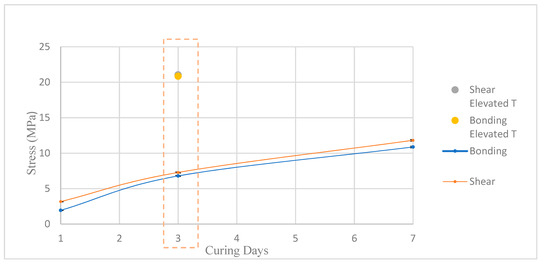
Figure 6.
Thermal effect on pure shear strength (PSS) and interfacial bond shear strength (IBSS).
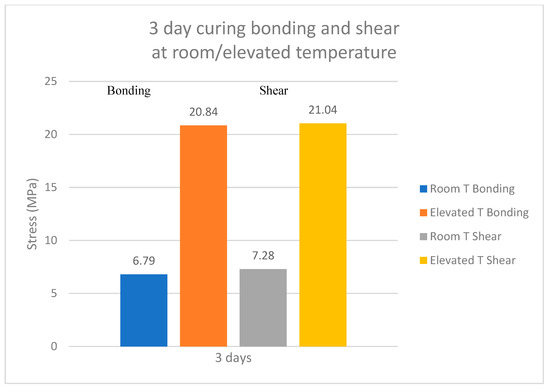
Figure 7.
Detailed comparison of the PSS and interfacial bond shear strength (IBSS) of class H cement.
3. Discussions
Figure 8 shows the calculated equivalent PSS and IBSS for the samples used in this work. The PSS is higher than the IBSS in all cases, which implies that the cement will first de-bond from the pipe prior to shear failure. However, at elevated temperatures, the IBSS seems to be affected, showing lower values than at room temperature. We believe that this is also due to different expansion coefficients between cement and steel resulting in a lower contact. Furthermore, the chemical bonding process may be affected by the temperature as well. By looking at the UCS increase due to temperature, we believe that the fast hydration process will impede the surface strong bond. The interfacial bonding shear strength values are shown in Table 3. We also observed a decrease of shear strength after 14 days. To further understand this behavior, the unconfined compressive strength (UCS) has been measured.
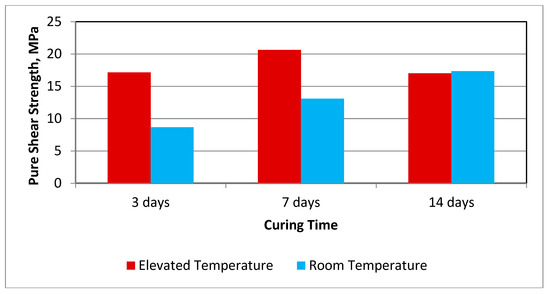
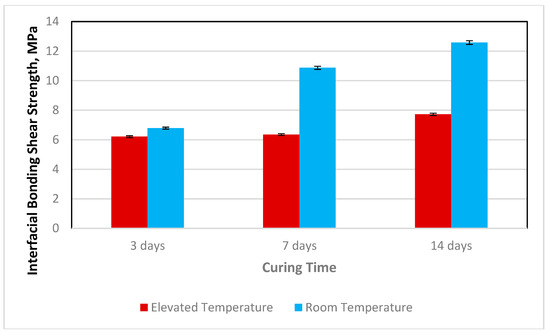
Figure 8.
The measured pure shear strength (PSS) (top) and interfacial bonding shear strength (IBSS) (bottom) for class H cement.
The evolution of unconfined compressive strength (UCS) of the cement measured at room and elevated temperature was used as reference for all other measured parameters and it is shown in Figure 9. The measured UCS of the cement (Class H) increases with time, and temperature leads to a higher UCS for the same day compared with room temperature. This behavior is normal and has been repeatedly reported in the literature. Also, the room temperature values for UCS are low but they are normal for neat class H cement. The increase of the UCS values infers that the other properties like interfacial bonding shear strength and pure shear strength will show the same tendency. However, our experiments have shown that the interfacial bonding shear strength does not change for samples cured at elevated temperatures, especially day 3 and 7. After 14 days of curing, a small increase of the interfacial bonding shear strength was noted, but the value is lower than the one obtained at room temperature. Although no similar tests have been found in the literature, the closest experiments we found were from civil engineering, related to rebar bonding to the cement, and they also showed a lower value at elevated temperatures.
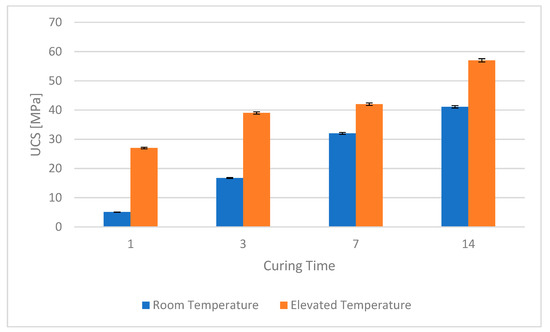
Figure 9.
The measured unconfined cement strength (UCS) at room and elevated temperatures for class H cement.
To further understand the behavior of cement pure shear strength and interfacial bonding shear strength, the comparison shown in Figure 10 and Figure 11 is provided. We have compared these properties with the UCS of cement under same curing conditions. Figure 10 shows a very good linear dependency between pure shear strength and cement UCS; however, when interfacial bonding shear strength is compared with UCS, it shows a strong non-linear behavior for elevated temperatures. UCS data are comparable with other published experiments [26,27]. Also as mentioned above, the pure shear strength data at elevated temperature shows a decline of shear with the increase of curing time. We also obtained the same results after repeating the experiments. Figure 11 shows the behavior of interfacial bonding shear strength. It can be observed that the bonding strength has a nonlinear behavior that is very strong at room temperature. A logarithmic trend line was found to fit very well this trend. The elevated temperature values are lower than the ones measured at room temperature conditions. Consequently, the bonding strength does not evolve continuously with the cement hydration, hence curing, but instead reaches a maximum value faster and stays constant. This has strong implications for the understanding of well integrity and long-term behavior of the well. Our experiments focused on 14 days curing time, but longer curing time experiments may prove this concept. Unfortunately, there are no similar experiments in the literature that would allow a comparison with the results in this paper.
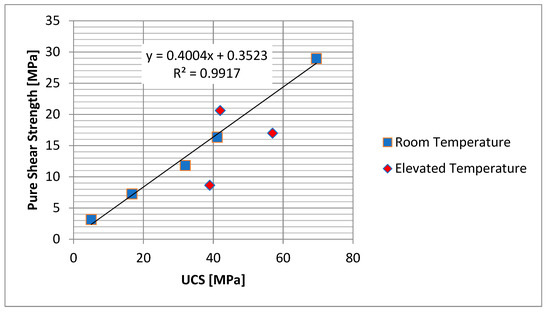
Figure 10.
Correlation between unconfined cement strength (UCS) and pure shear strength of class H cement.
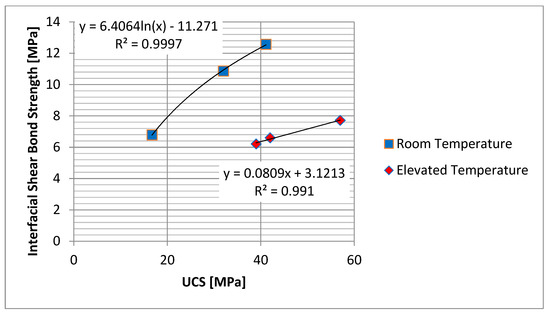
Figure 11.
Correlation between unconfined cement strength (UCS) and interfacial bonding shear strength of class H cement.
4. Conclusions
The lack of data for class H cement pure shear strength (PSS) and interfacial bonding shear strength (IBSS) was the main driver for this paper and the experiments herein. The experiments were performed for two curing temperatures: room temperature (20 °C) and elevated temperature (~65 °C). For the first time, a novel setup allows to differentiate between pure shear strength and interfacial bonding shear strength.
The new proposed method to evaluate cement interfacial bonding shear strength produced results similar with data published for one day (the only available). However, our unique method to estimate cement pure shear strength has been proven to be an excellent addition to estimating cement mechanical properties. Our investigations have shown some scattering of data at elevated temperature, but low temperature results showed excellent quality.
Long term measurements make this work unique by showing that interfacial bonding shear strength does not increase linearly. The interfacial bonding shear strength was measured for a curing time longer that 24 h, as most other papers have shown. The results clearly show the implications and the need of investigating long term behavior of well cements.
The following observations can be made:
- Pure shear strength for specimens cured at elevated temperature is higher than that for specimens cured for the same days at room temperature, which was expected.
- The value of interfacial bonding shear strength for specimens cured at elevated temperature is lower than the one obtained in room temperature conditions and it does not increase as strongly as we observed for room temperature conditions. This observation is new and has never been published.
- The measured pure shear strength for specimens cured at elevated temperature was 17.1 MPa which is 2.1 times greater than it was at room temperature for day 3. After 14 days, a decrease of the pure shear strength occurs, although the UCS was minimally increasing.
Author Contributions
Conceptualization: C.T.; Methodology: C.T.; Formal Analysis: C.T., S.S.; Experimental Work: C.T., M.C.Y.; Writing-Original Draft Preparation: C.T.; Writing-Review & Editing: C.T., S.S.; Supervision of Experiments: C.T.
Funding
This research received no external funding.
Acknowledgments
We would like to thank to Central Plains Cement Company for their support with cement materials.
Conflicts of Interest
The authors declare no conflict of interest.
Nomenclature
| Area, m2 | |
| Correction coefficient for Hashin-Shtrikman 3-phase boundaries | |
| Thermal conductivity, W/m-K or BTU/hr-ft-°F | |
| Thickness, m | |
| Amount of heat transferred through material, W | |
| Temperature gradient, K | |
| Water fraction inside the pores, - | |
| Component mass fraction, - | |
| Cement porosity, - |
References
- Kömürcü, M.İ.; Akpınar, A. Importance of geothermal energy and its environmental effects in Turkey. Renew. Energy 2009, 34, 1611–1615. [Google Scholar]
- Alber, M.; Ehringhausen, N. Petrophysical properties of casing cement while curing. Int. Soc. Rock Mech. Rock Eng. 2017, 191, 164–171. [Google Scholar] [CrossRef]
- Wehling, P. Wellbore Cement Integrity Testing. Master’s Thesis, TU-Clausthal, Clausthal-Zellerfeld, Germany, 2008. [Google Scholar]
- Nelson, E.B. Well Cementing; Elsevier: Amsterdam, The Netherlands, 1990. [Google Scholar]
- Teodoriu, C.; Ichim, A.C.; Falcone, G. Design optimization of geothermal wells using an improved overall heat transfer coefficient. In Proceedings of the 42nd Stanford Geothermal Workshop, Stanford, CA, USA, 13–14 February 2017. [Google Scholar]
- Ichim, A.C.; Teodoriu, C. Revisiting thermal well integrity through a closer look at casing-cement-formation interaction. In Proceedings of the SPE Thermal Well Integrity and Design Symposium, Banff, AB, Canada, 28 November–1 December 2016. [Google Scholar]
- Philippacopoulos, J.A.; Berndt, L.M. Structural analysis of geothermal well cements. Geothermics 2002, 31, 657–676. [Google Scholar] [CrossRef]
- Teodoriu, C. Why and When Does Casing Fail in Geothermal Wells: A Surprising Question? In Proceedings of the World Geothermal Congress 2015, Melbourne, Australia, 19–25 April 2015. [Google Scholar]
- Ichim, A.C.; Teodoriu, C. Development of a cement repository to improve the understanding of well integrity behavior with time. In Proceedings of the SPE Oklahoma City Oil and Gas Symposium, Oklahoma City, OK, USA, 27–31 March 2017. [Google Scholar]
- Wong, R.C.K.; Ma, S.K.Y.; Wong, R.H.C.; Chau, K.T. Shear strength components of concrete under direct shearing. Cem. Concr. Res. 2007, 37, 1248–1256. [Google Scholar] [CrossRef]
- Bejar, L.A.; Rushing, T.S. Computational Shear Strength of Ultrahigh-Performance API Class H Cement-Silica-Fume Paste Cylinders via Direct Shear Tests. J. Mater. Civ. Eng. 2017, 29, 04017113. [Google Scholar] [CrossRef]
- Evans, G.W.; Carter, L.G. Bonding Studies of Cementing Compositions to Pipe and Formations; American Petroleum Institute: Washington, DC, USA, 1962. [Google Scholar]
- Zhao, X.; Guan, Z.; Xu, M.; Shi, Y.; Liao, H.; Sun, J. The Influence of casing-sand adhesion on cementing bond strength. PLoS ONE 2015, 10, e0130892. [Google Scholar] [CrossRef]
- Salehi, S.; Khattak, M.J.; Ali, N. Development of geopolymer-based cement slurries with enhanced thickening time, compressive and shear bond strength and durability. In Proceedings of the IADC/SPE Drilling Conference and Exhibition, Fort Worth, TX, USA, 1–3 March 2016. [Google Scholar]
- Lavrov, A.; Torsæter, M. Physics and Mechanics of Primary Well Cementing; Springer: Berlin, Germany, 2016. [Google Scholar]
- Kaldal, G.S.; Jónsson, M.; Pálsson, H.; Karlsdóttir, S.N. Structural Analysis of casings in high temperature geothermal wells in Iceland. In Proceedings of the World Geothermal Congress, Melbourne, Australia, 19–25 April 2015. [Google Scholar]
- API (American Petroleum Institute). Specification for Cements and Materials for Well Cementing; American Petroleum Institute: Washington, DC, USA, 2002. [Google Scholar]
- API (American Petroleum Institute). Recommended Practice for Testing Well Cements; American Petroleum Institute: Washington, DC, USA, 2013. [Google Scholar]
- Romanowski, N.; Ichim, A.C.; Teodoriu, C. Investigations on oilwell cement strength response to ultrasonic measurements in the presence of additives. J. Energy Res. Technol. 2018, 140, 072904. [Google Scholar] [CrossRef]
- Saleh, F.K.; Salehi, S.; Teodoriu, C. Experimental investigation of mixing energy of well cements: The gap between laboratory and field mixing. J. Nat. Gas Sci. Eng. 2019, 63, 47–57. [Google Scholar] [CrossRef]
- Won, J.; Lee, D.; Na, K.; Lee, I.M.; Choi, H. Physical properties of G-class cement for geothermal well cementing in South Korea. Renev. Energy 2015, 80, 123–131. [Google Scholar] [CrossRef]
- Miranda, C.R.; Toledo Filho, R.D.; Fairbairn, E.M.R.; Thaumaturgo, C.; Vargas, A.A.; Oliveira, G.M.B.; Teixeira, K.C. New design of high-performance cement systems for zonal isolation: influence of porosity, rheological parameters and chemical and mechanical resistance. In Proceedings of the SPE Latin American and Caribbean Petroleum Engineering Conference, Lima, Peru, 1–3 December 2010. [Google Scholar]
- Jimenez, W.C.; Pang, X.; Urdaneta, J.A.; Sørensen, E.; Lende, G.; Nimane, S. Thermo-mechanical properties of annular sealants—A path to optimized wellbore integrity and economics. In Proceedings of the SPE Kuwait Oil & Gas Show and Conference, Kuwait City, Kuwait, 15–18 October 2017. [Google Scholar]
- Bwala, A.H. Experimental Investigation of Shear Bond Strength and Microstructure of Fly Ash Geopolymer Cement for Oil and Gas Industry. Master’s Thesis, University of Louisiana at Lafayette, Lafayette, LA, USA, August 2015. [Google Scholar]
- Teodoriu, C.; Yi, M.C.; Ichim, A.C.; Salehi, S. A novel view of cement failure with application to geothermal well construction. In Proceedings of the 43rd Workshop on Geothermal Reservoir Engineering, Stanford, CA, USA, 12–14 February 2018. [Google Scholar]
- Teodoriu, C.; Kosinowski, C. Wellbore integrity and cement failure at HPHT conditions. Int. J. Eng. App. Sci. 2013, 2, 2305–8269. [Google Scholar]
- Kosinowski, C.; Teodoriu, C. Study of class G cement fatigue using experimental investigations. In Proceedings of the SPE/EAGE European Unconventional Resources Conference & Exhibition–From Potential to Production, Vienna, Austria, 19–22 March 2012. [Google Scholar]
© 2019 by the authors. Licensee MDPI, Basel, Switzerland. This article is an open access article distributed under the terms and conditions of the Creative Commons Attribution (CC BY) license (http://creativecommons.org/licenses/by/4.0/).