An Immune Firefly Algorithm for Tracking the Maximum Power Point of PV Array under Partial Shading Conditions

Abstract
:1. Introduction
2. Firefly Algorithm
2.1. Basic Assumptions
2.2. Terminologies of FA and PV System
2.3. Mathematical Expression
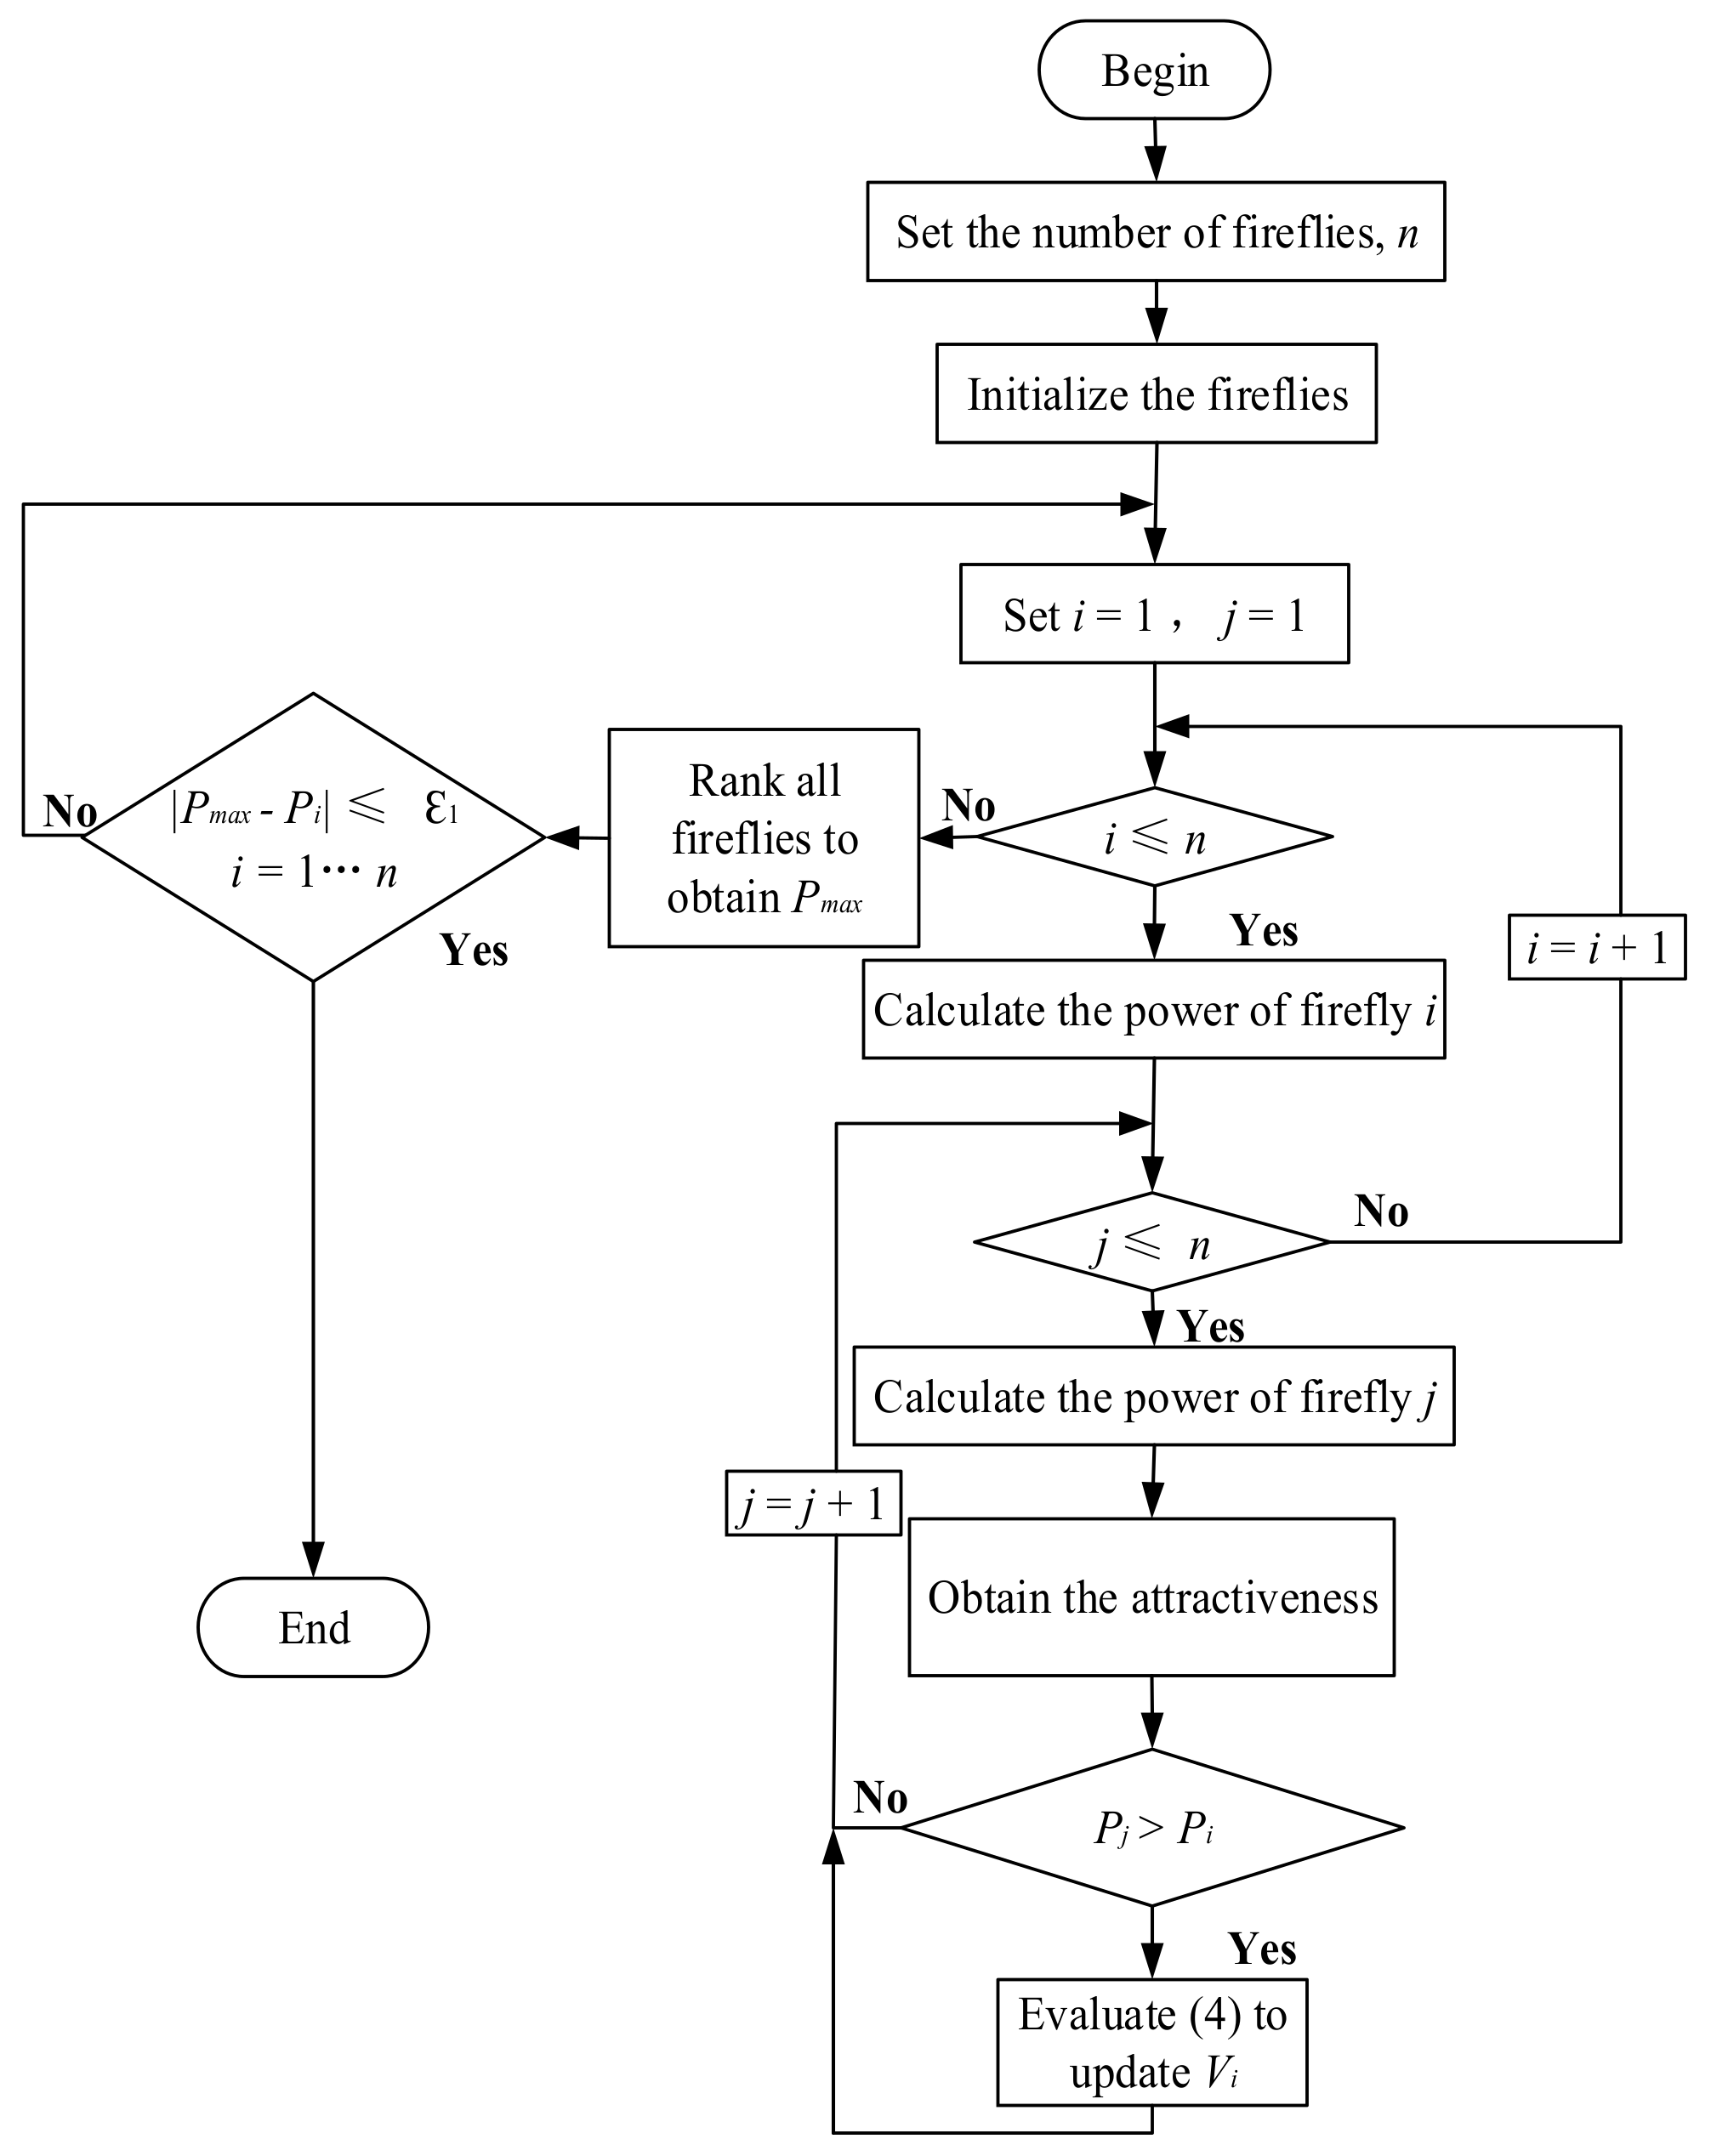
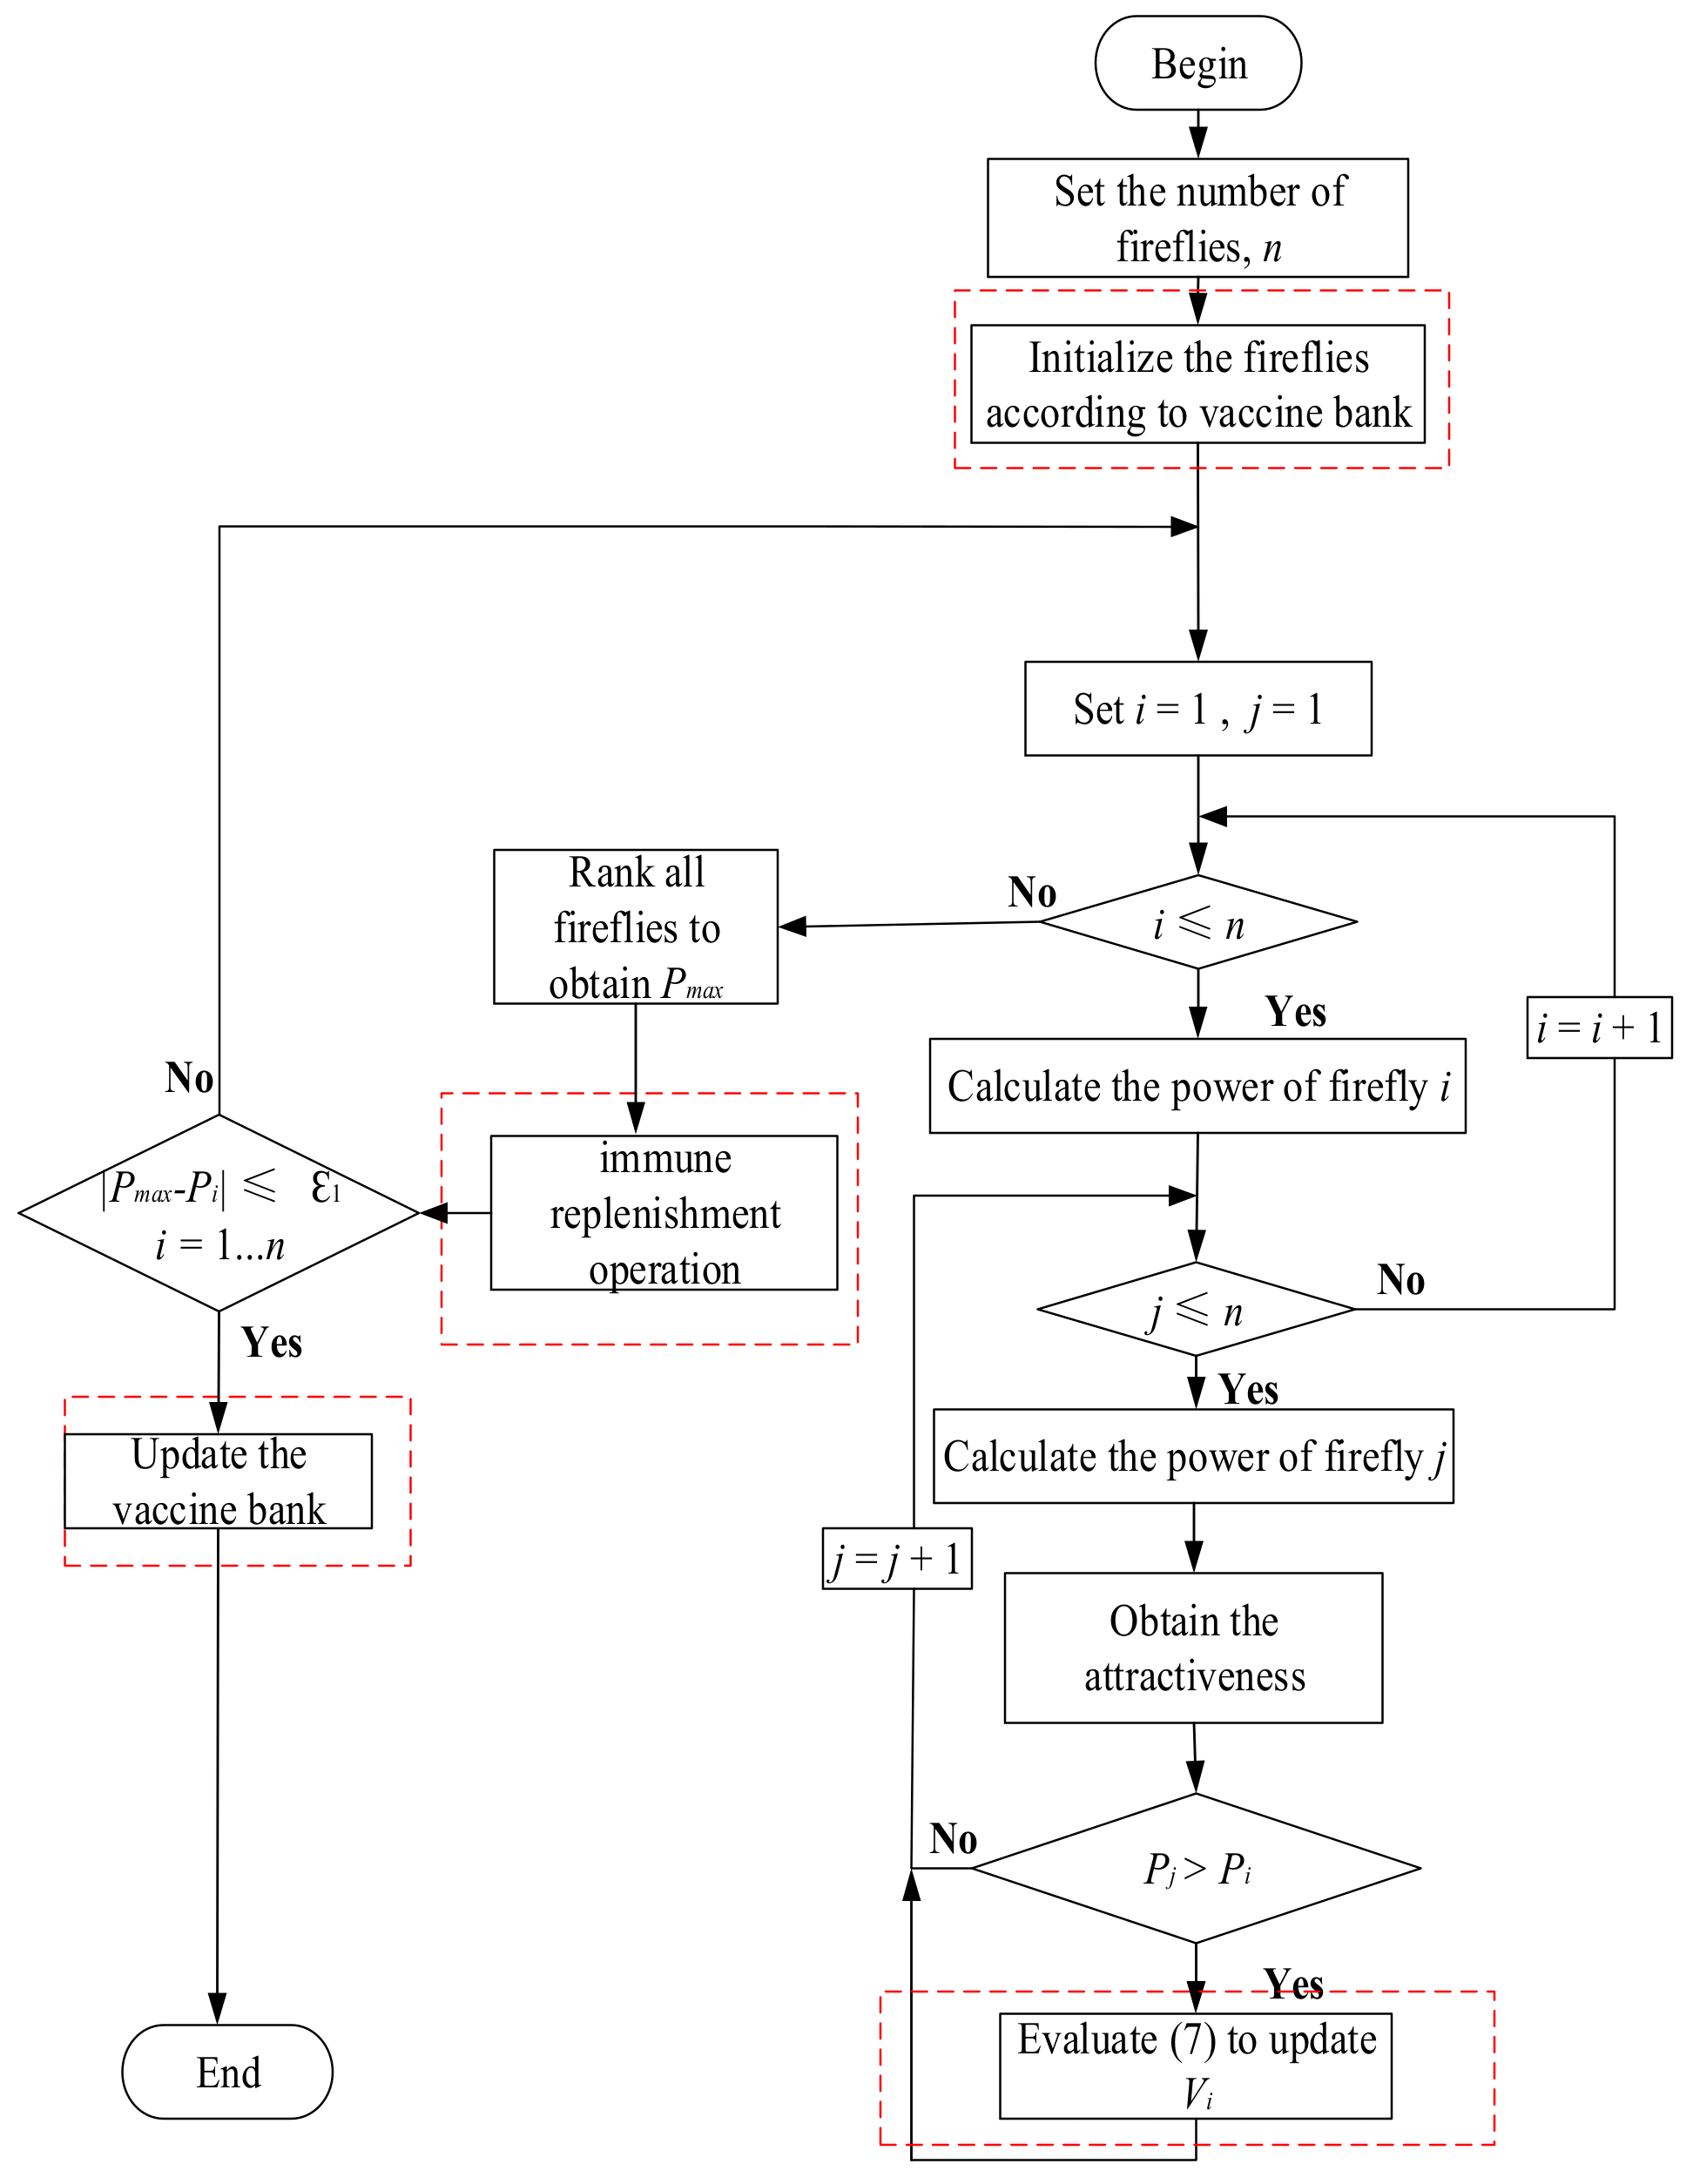
3. Immune Firefly Algorithm
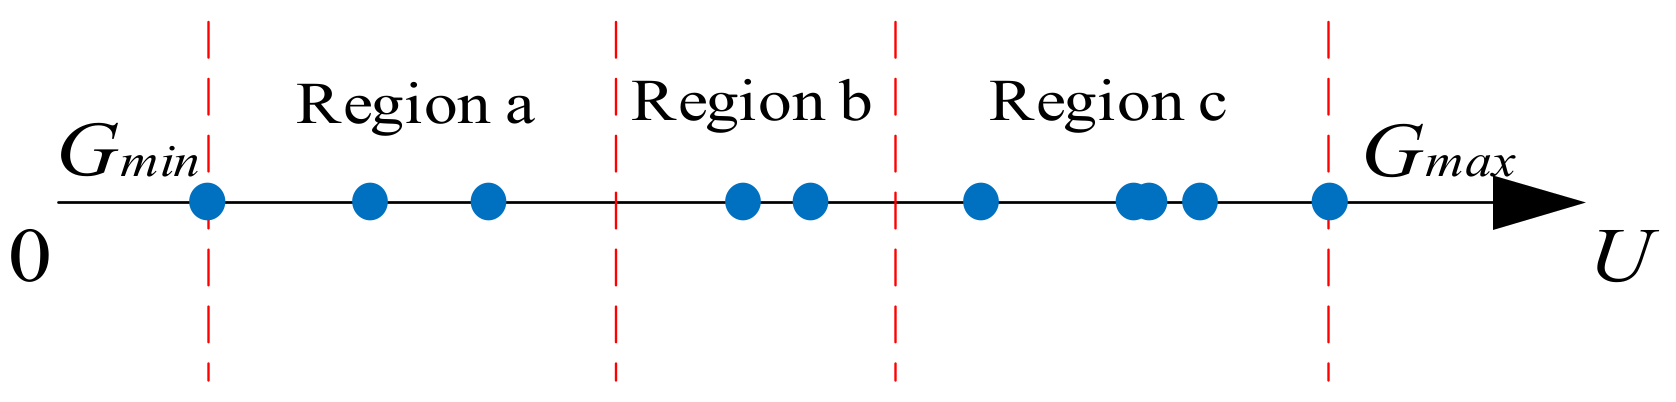
3.1. Vaccine Data-Base
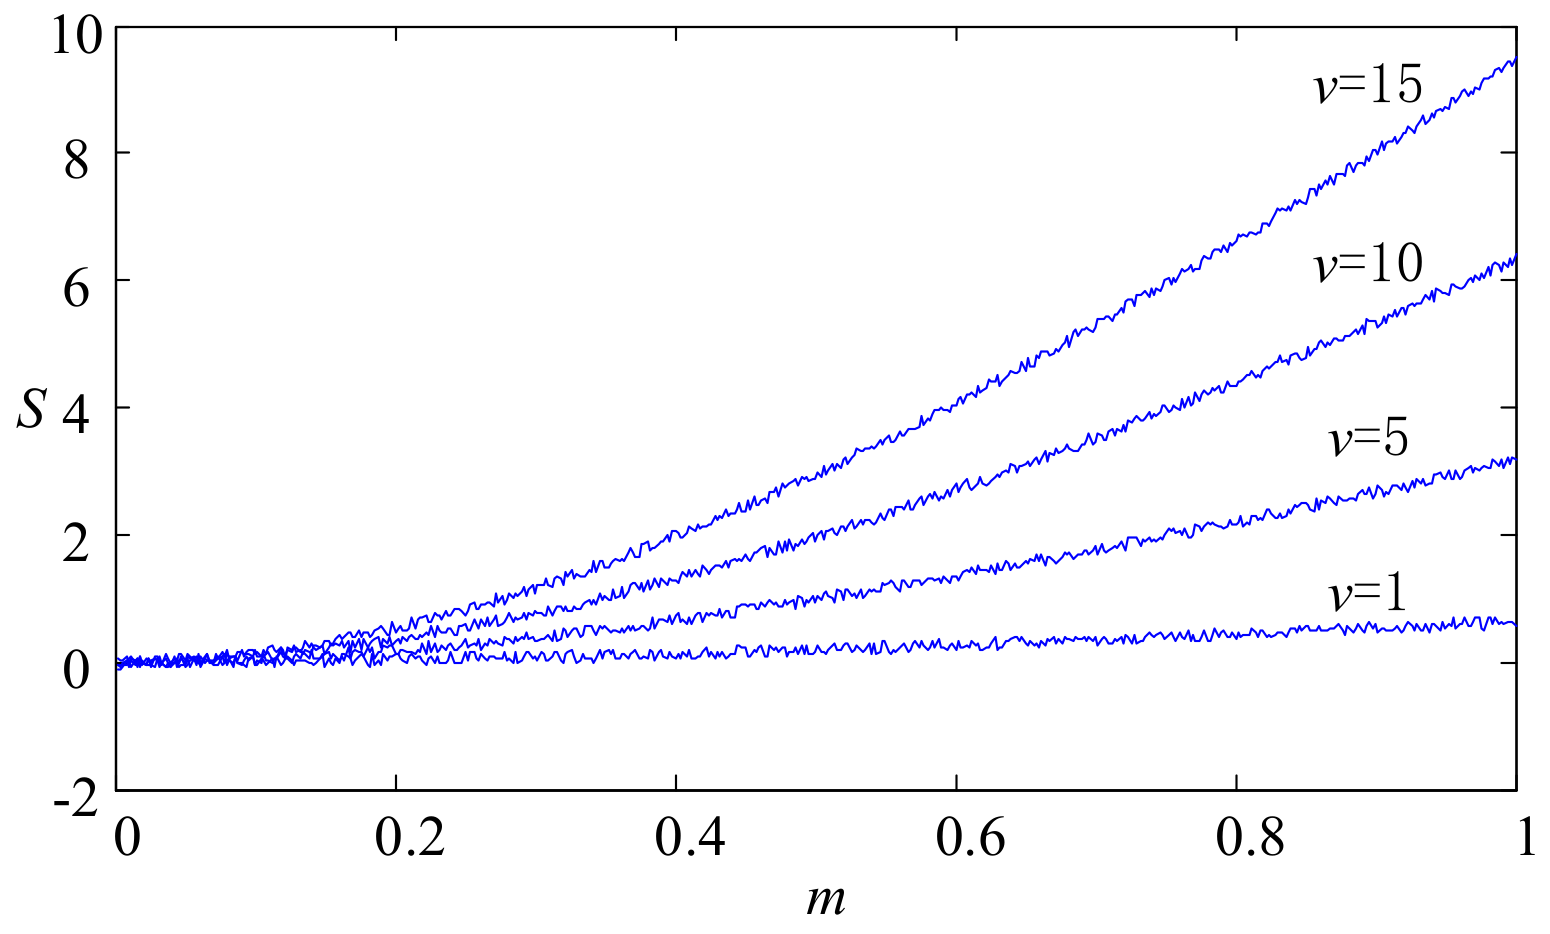
3.2. Improved Iteration Formula
3.3. Immune Replenishment Operation
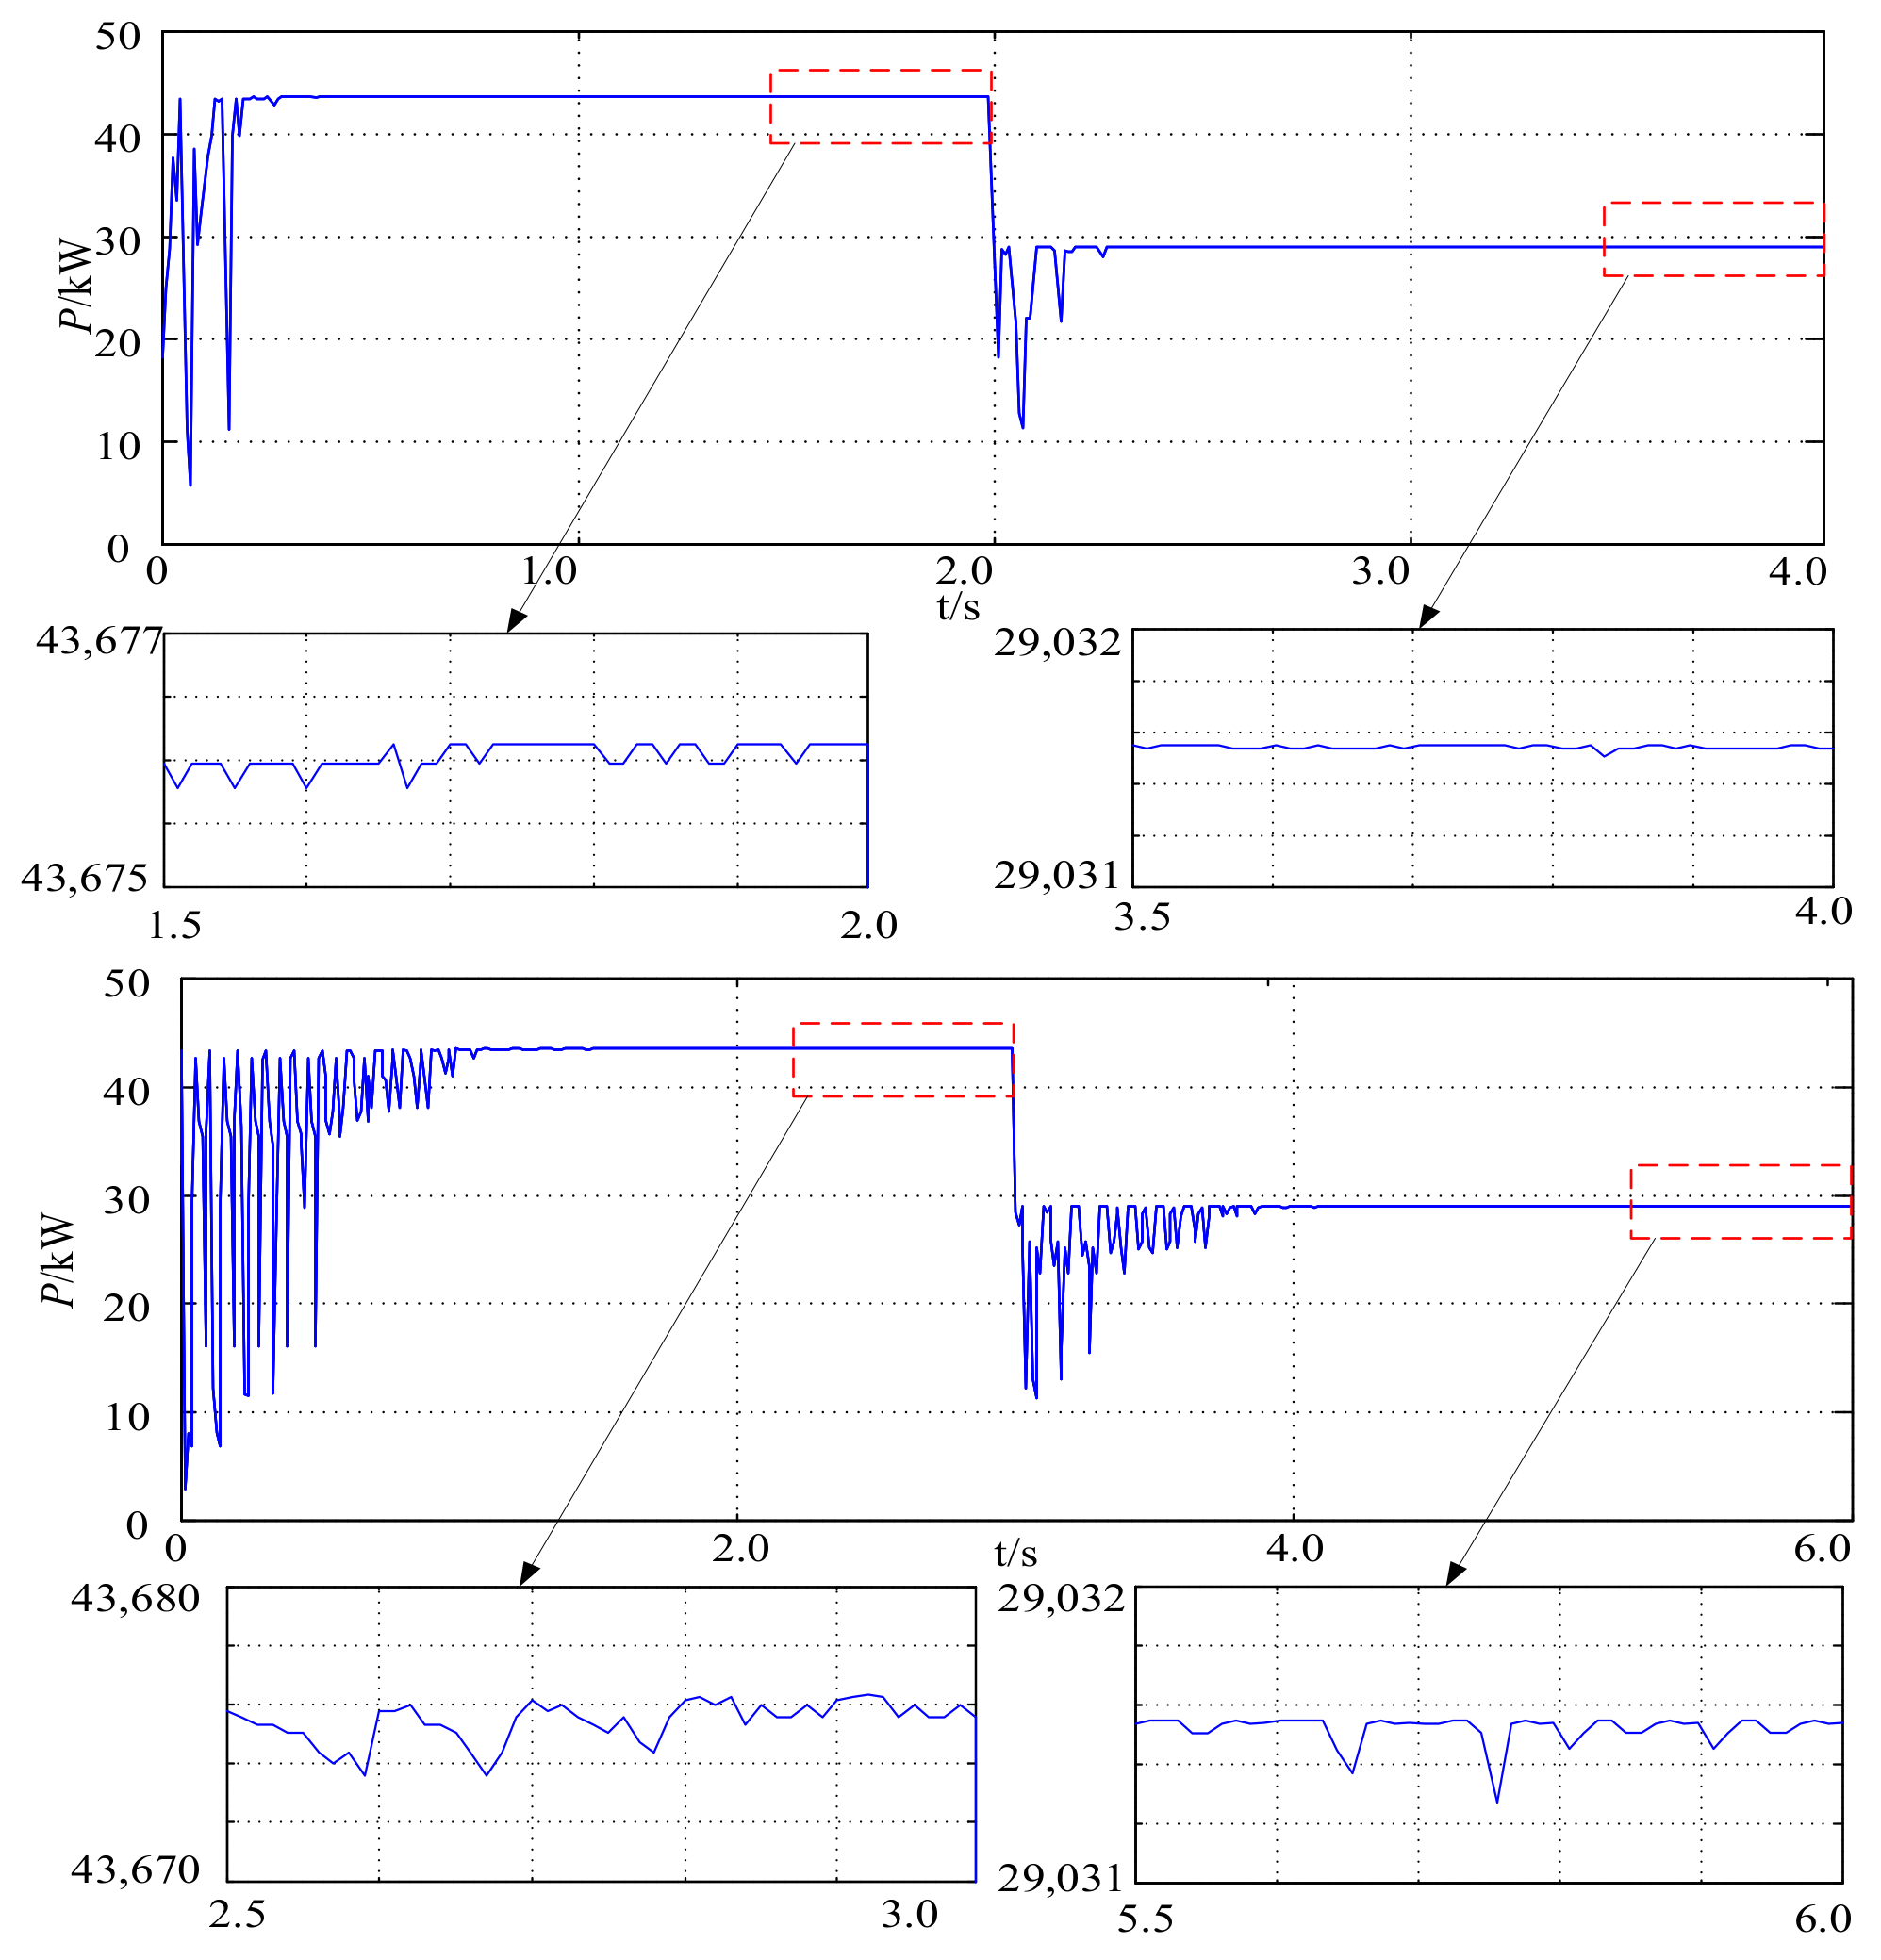
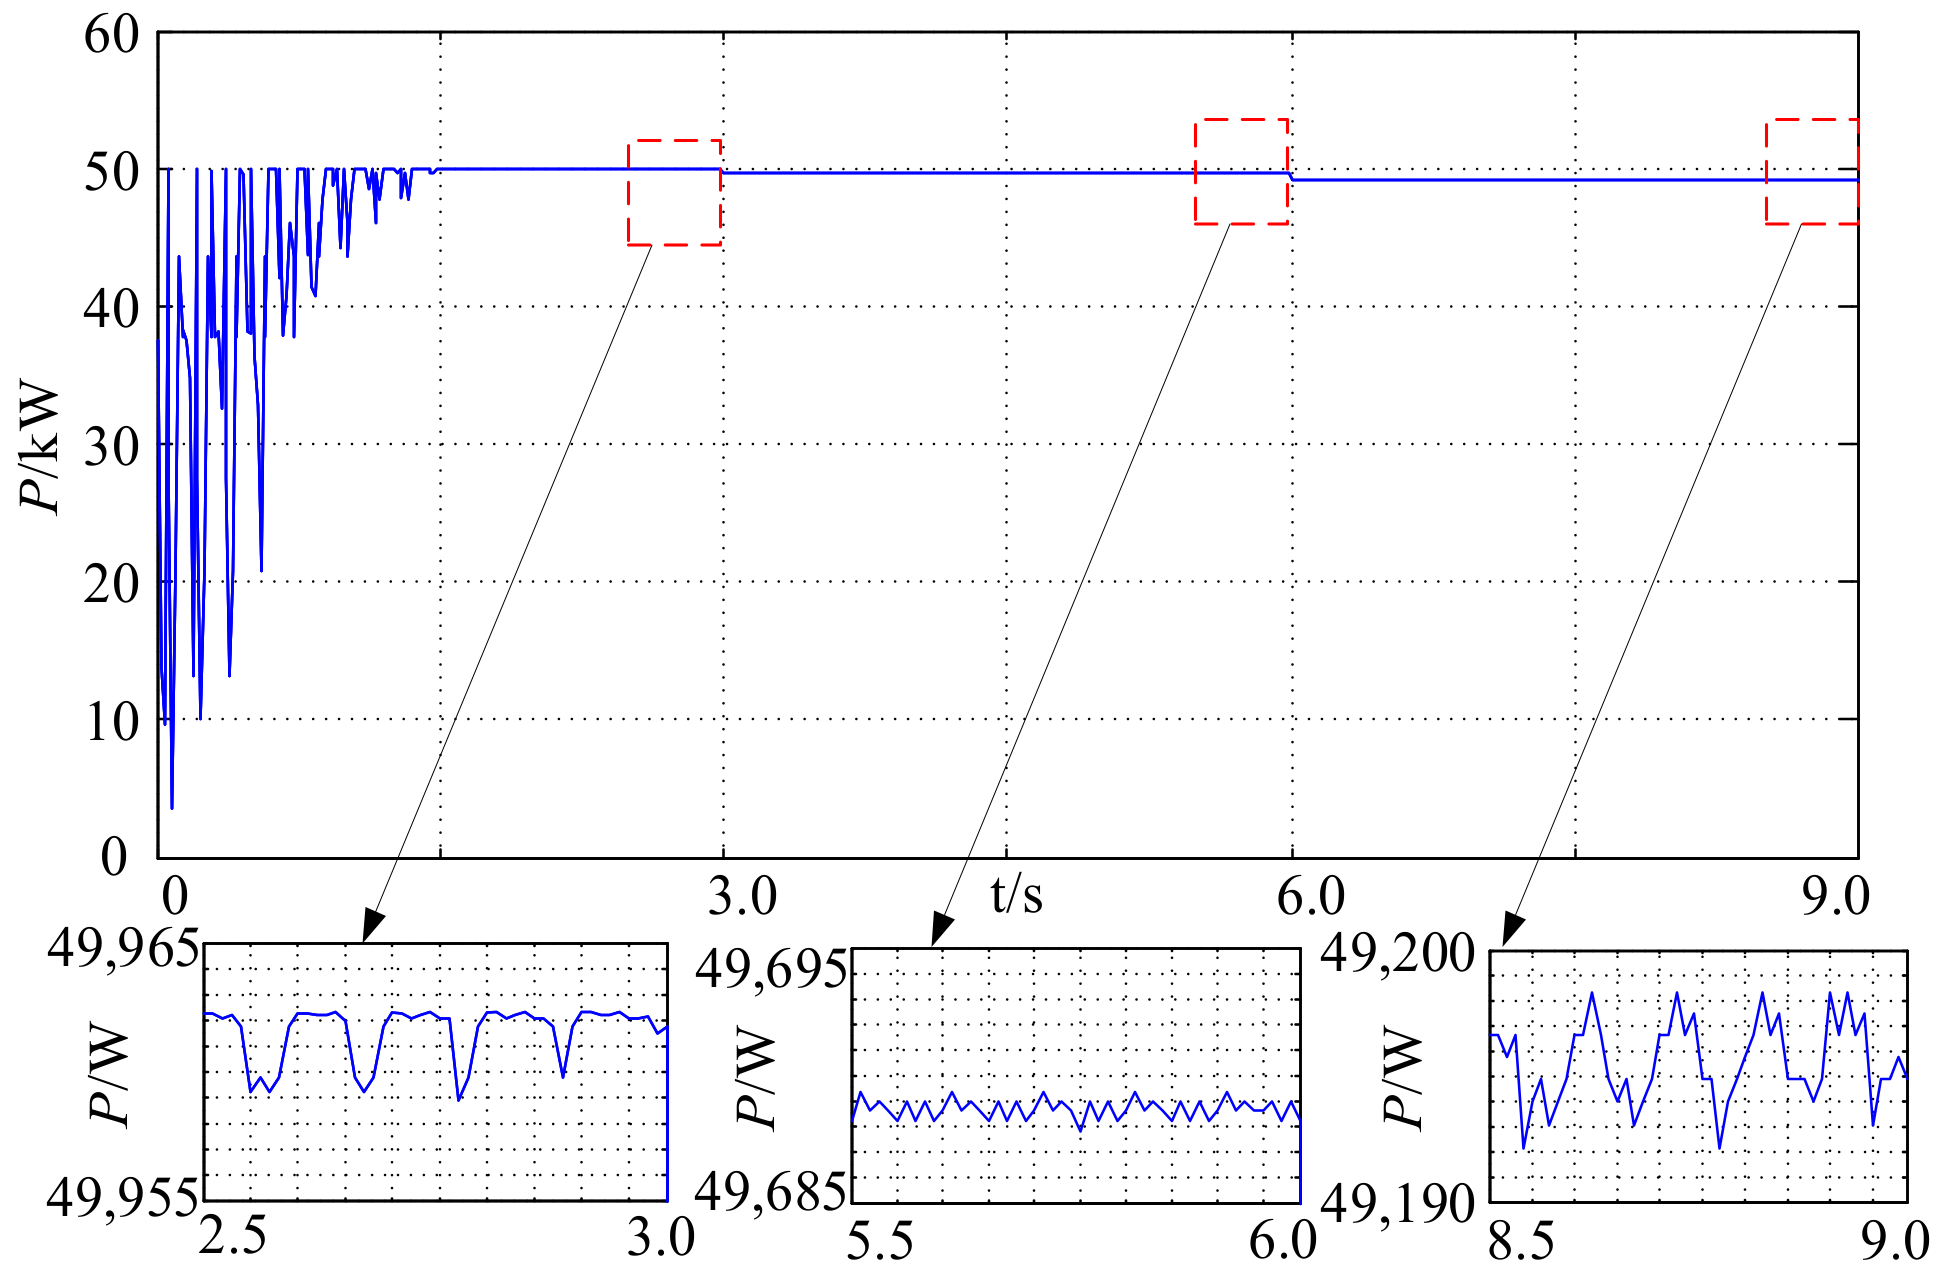
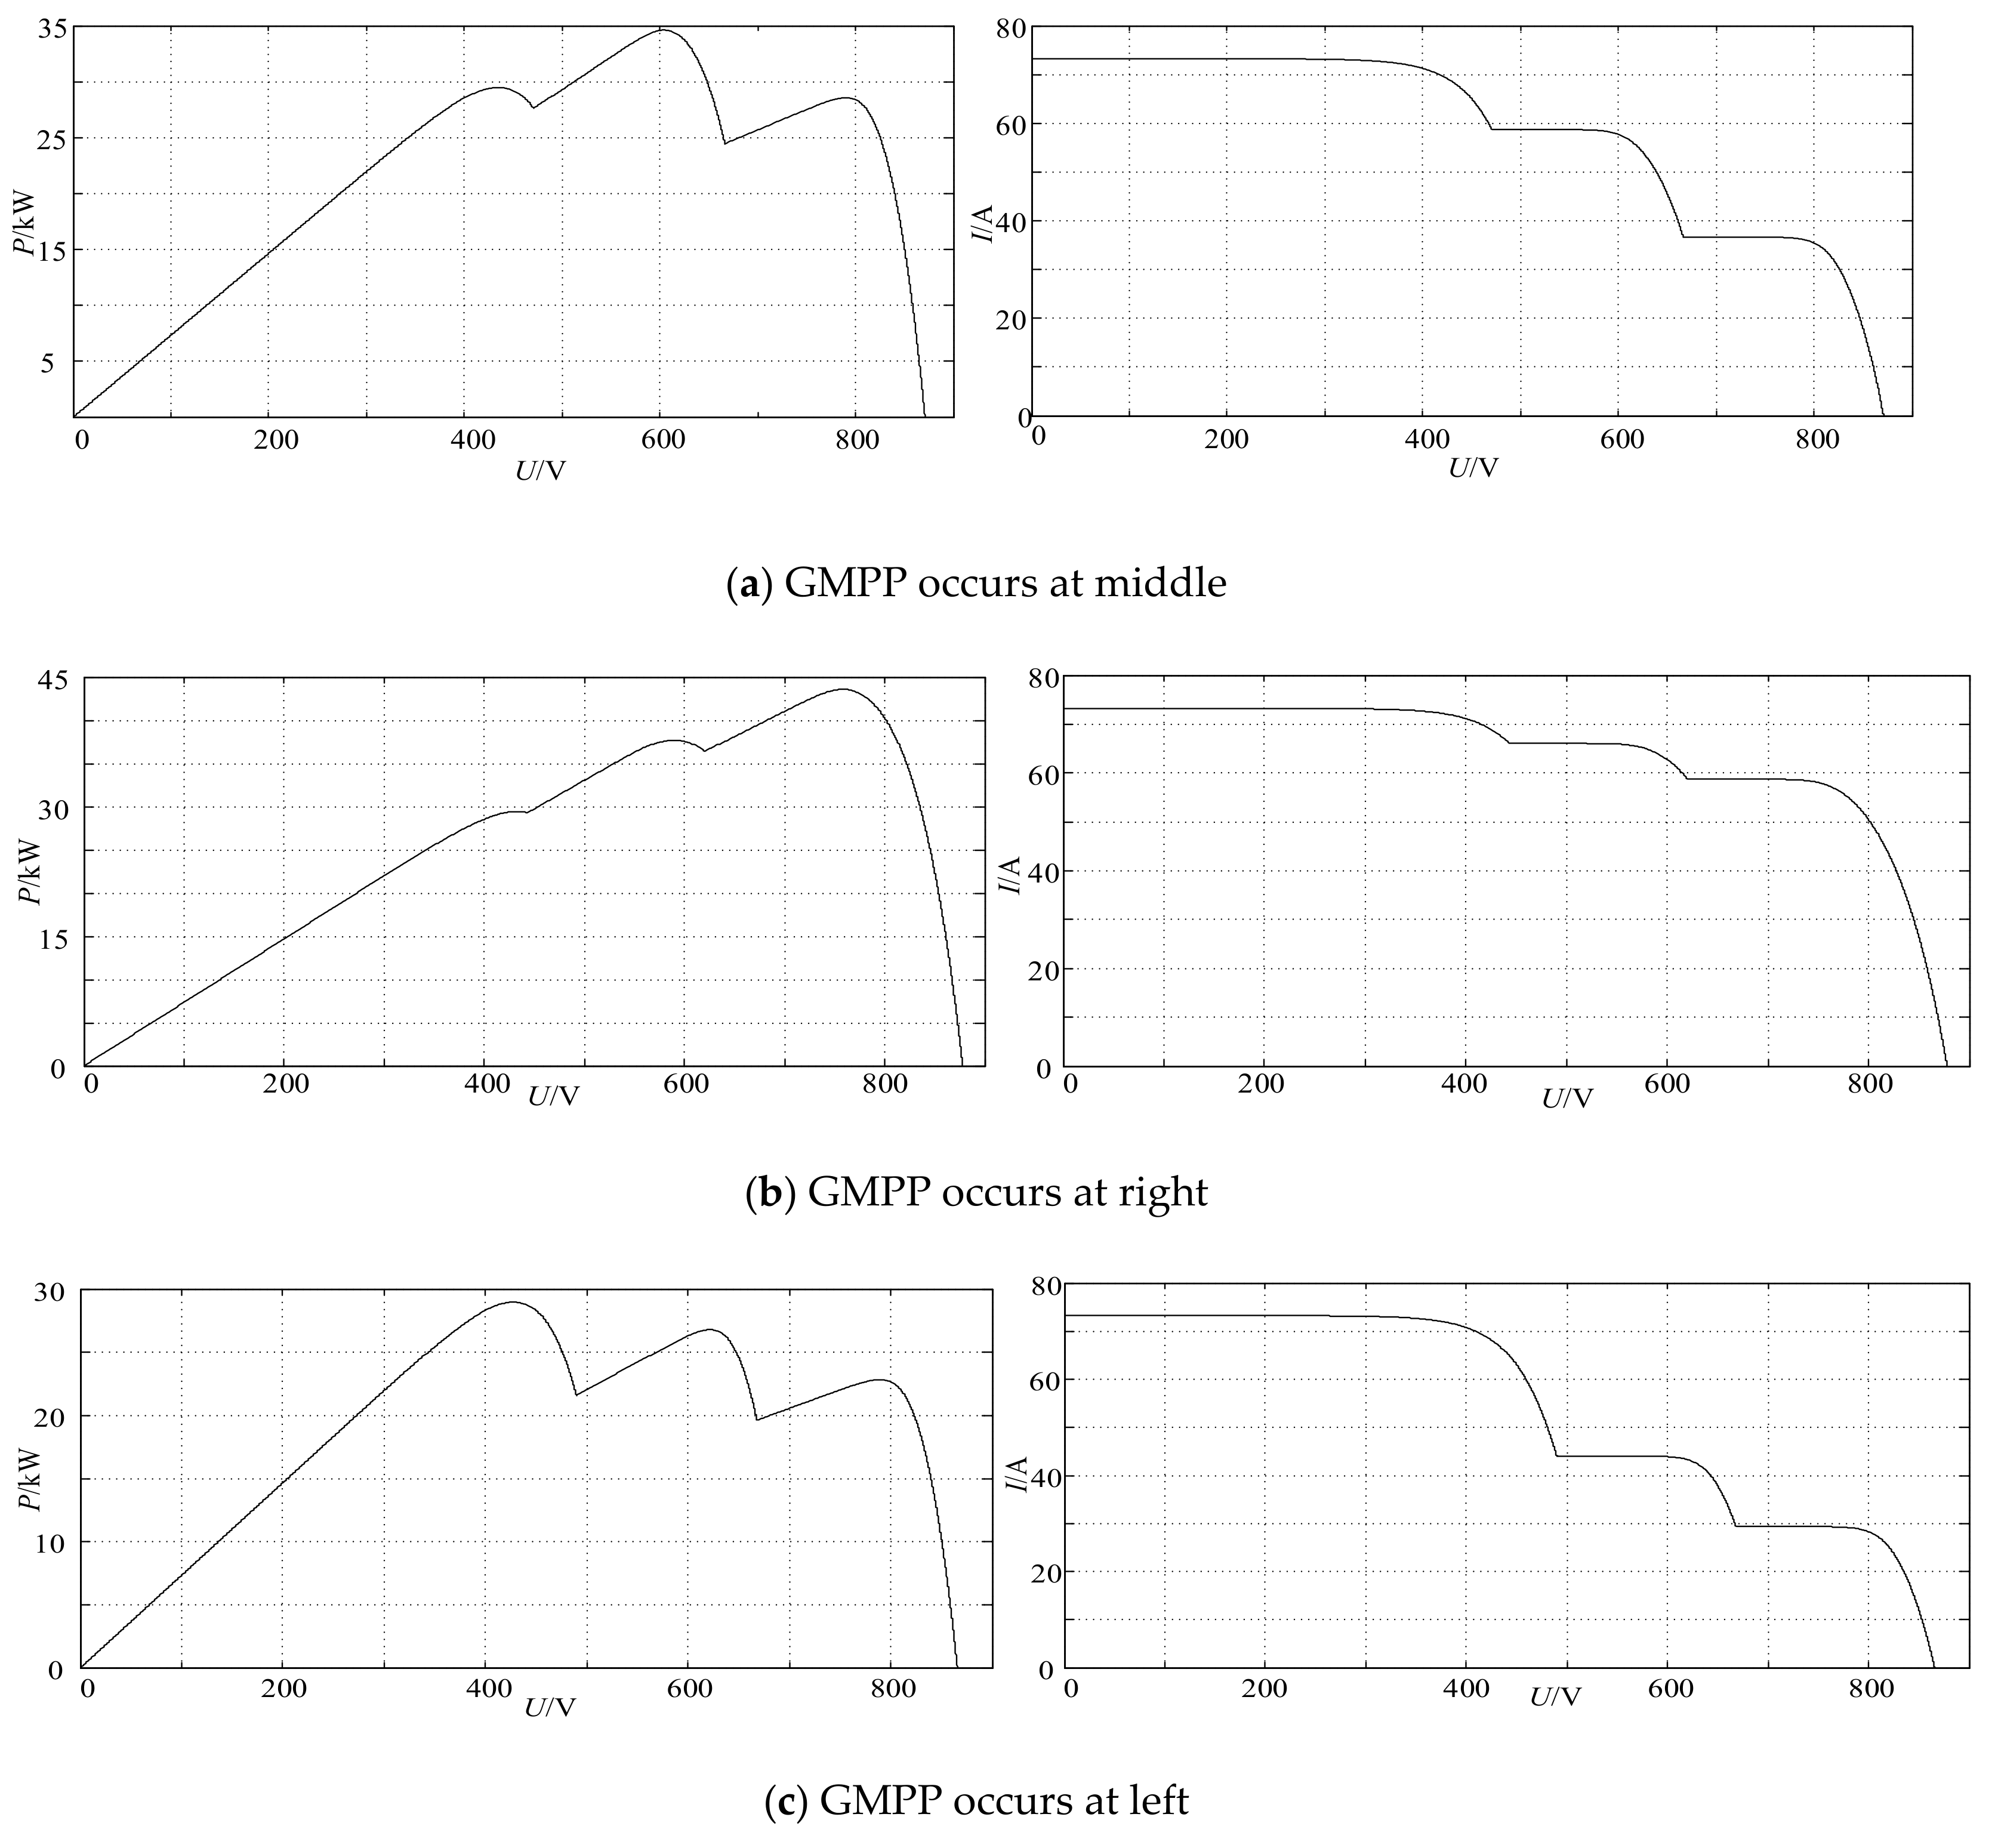
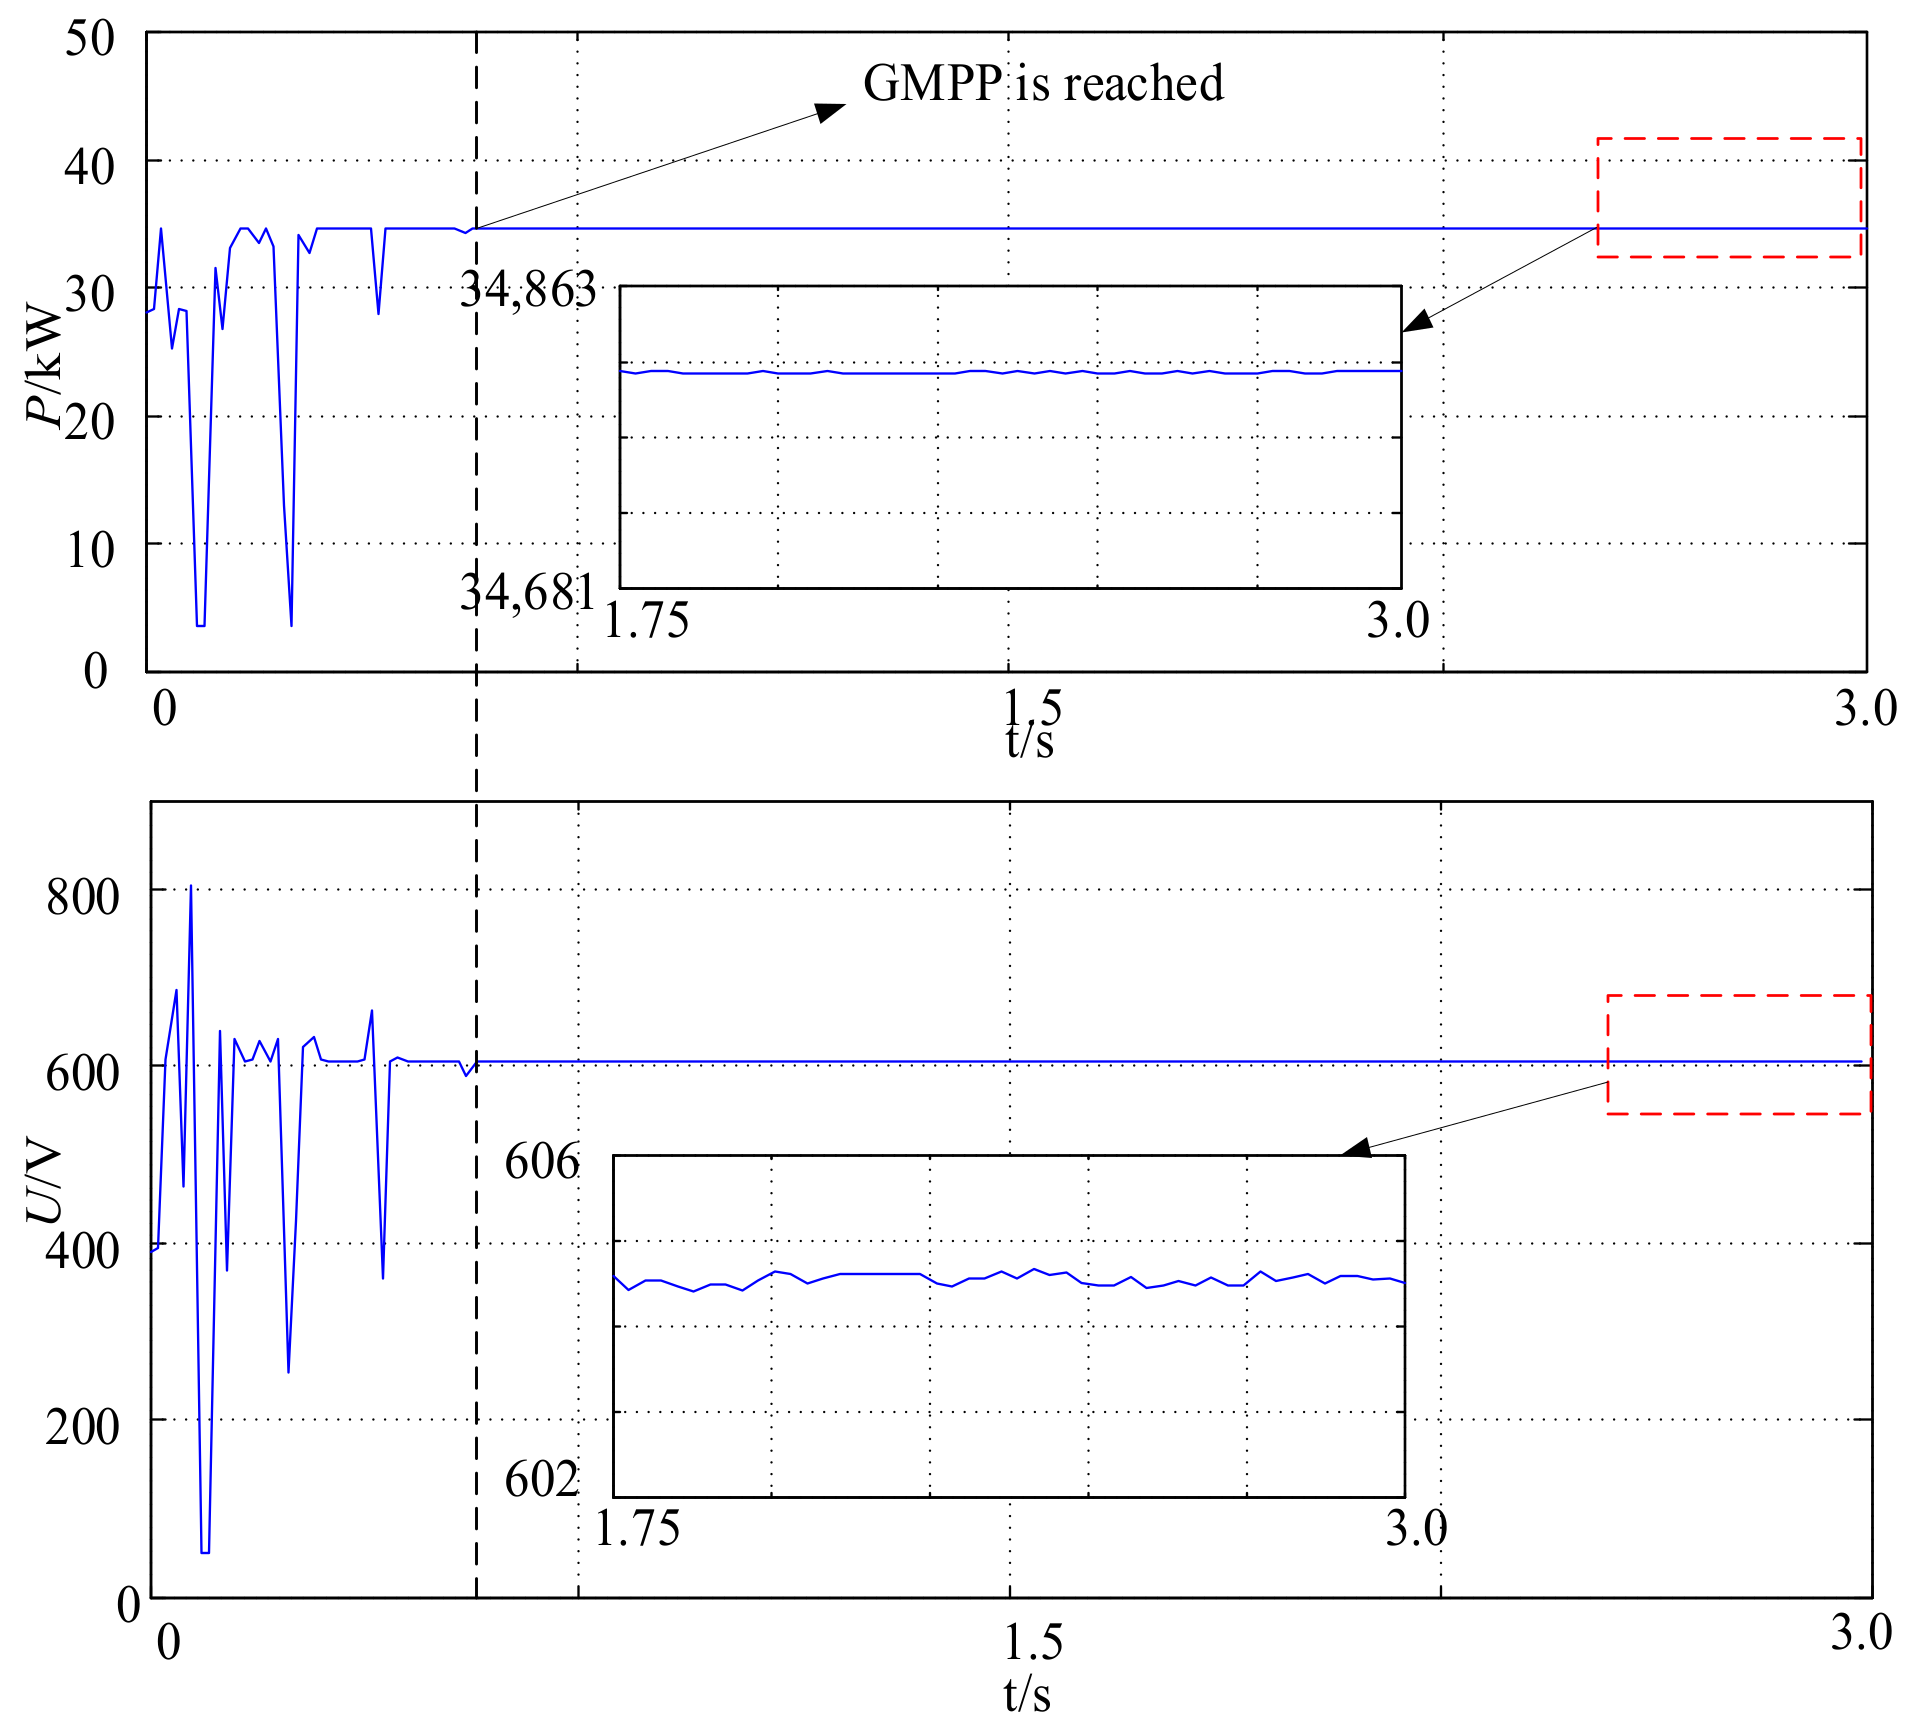
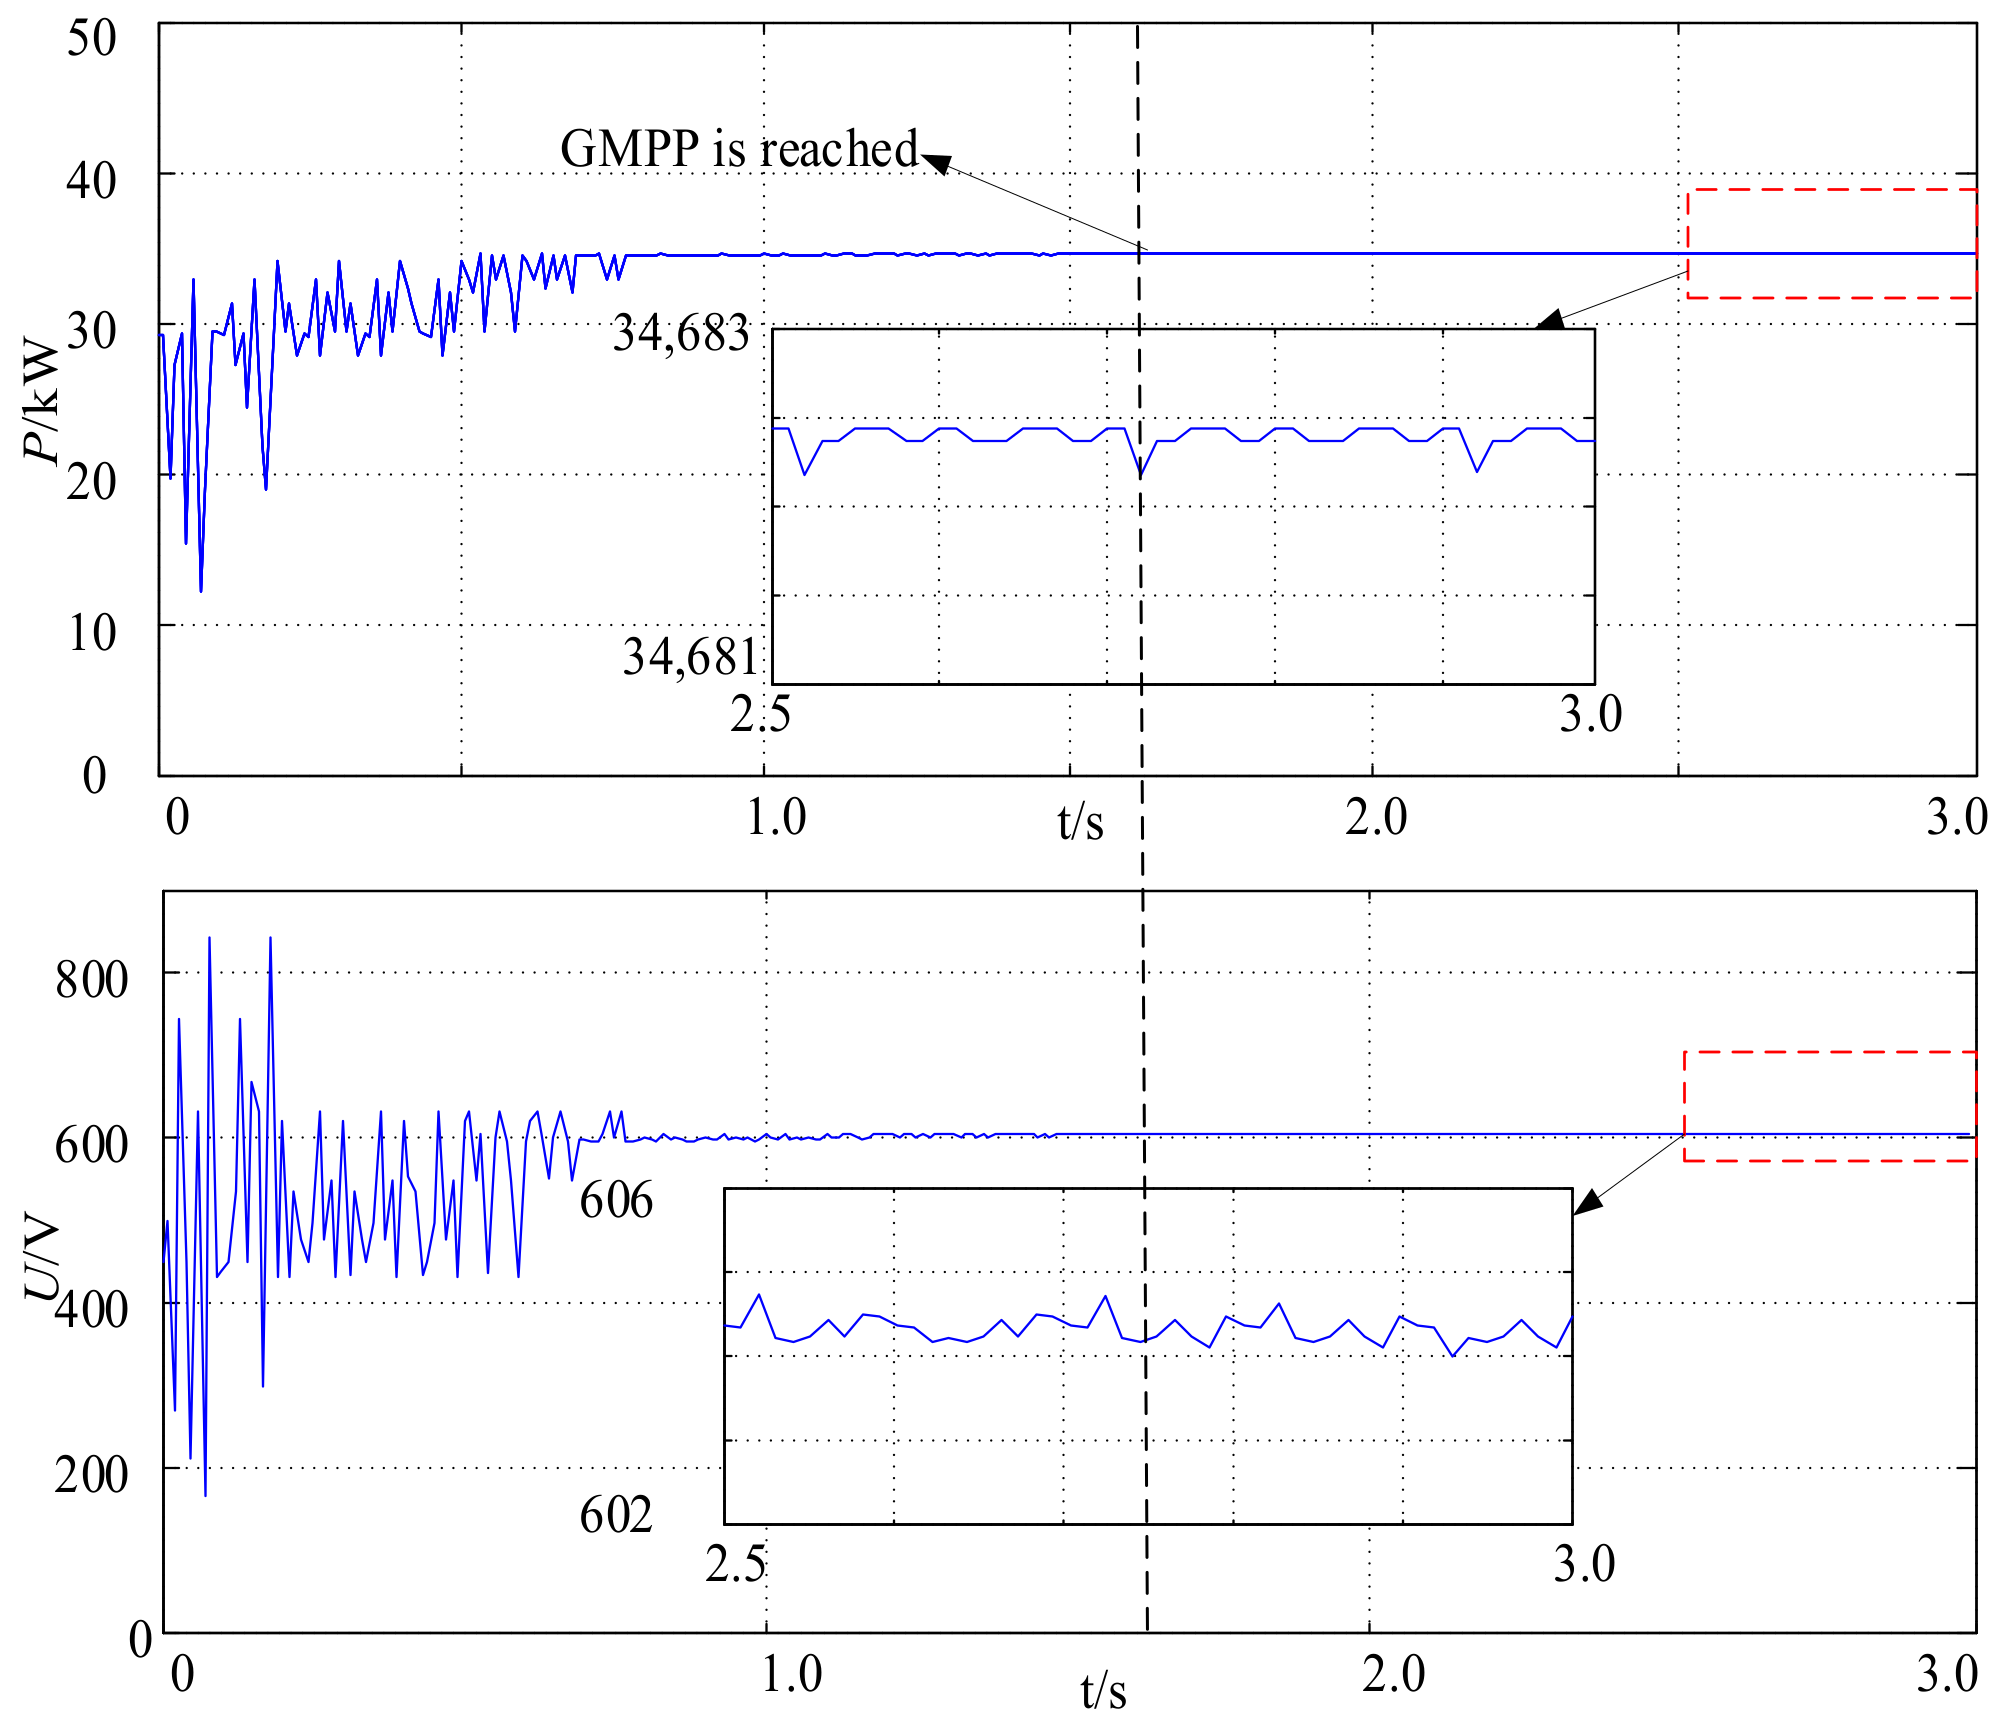
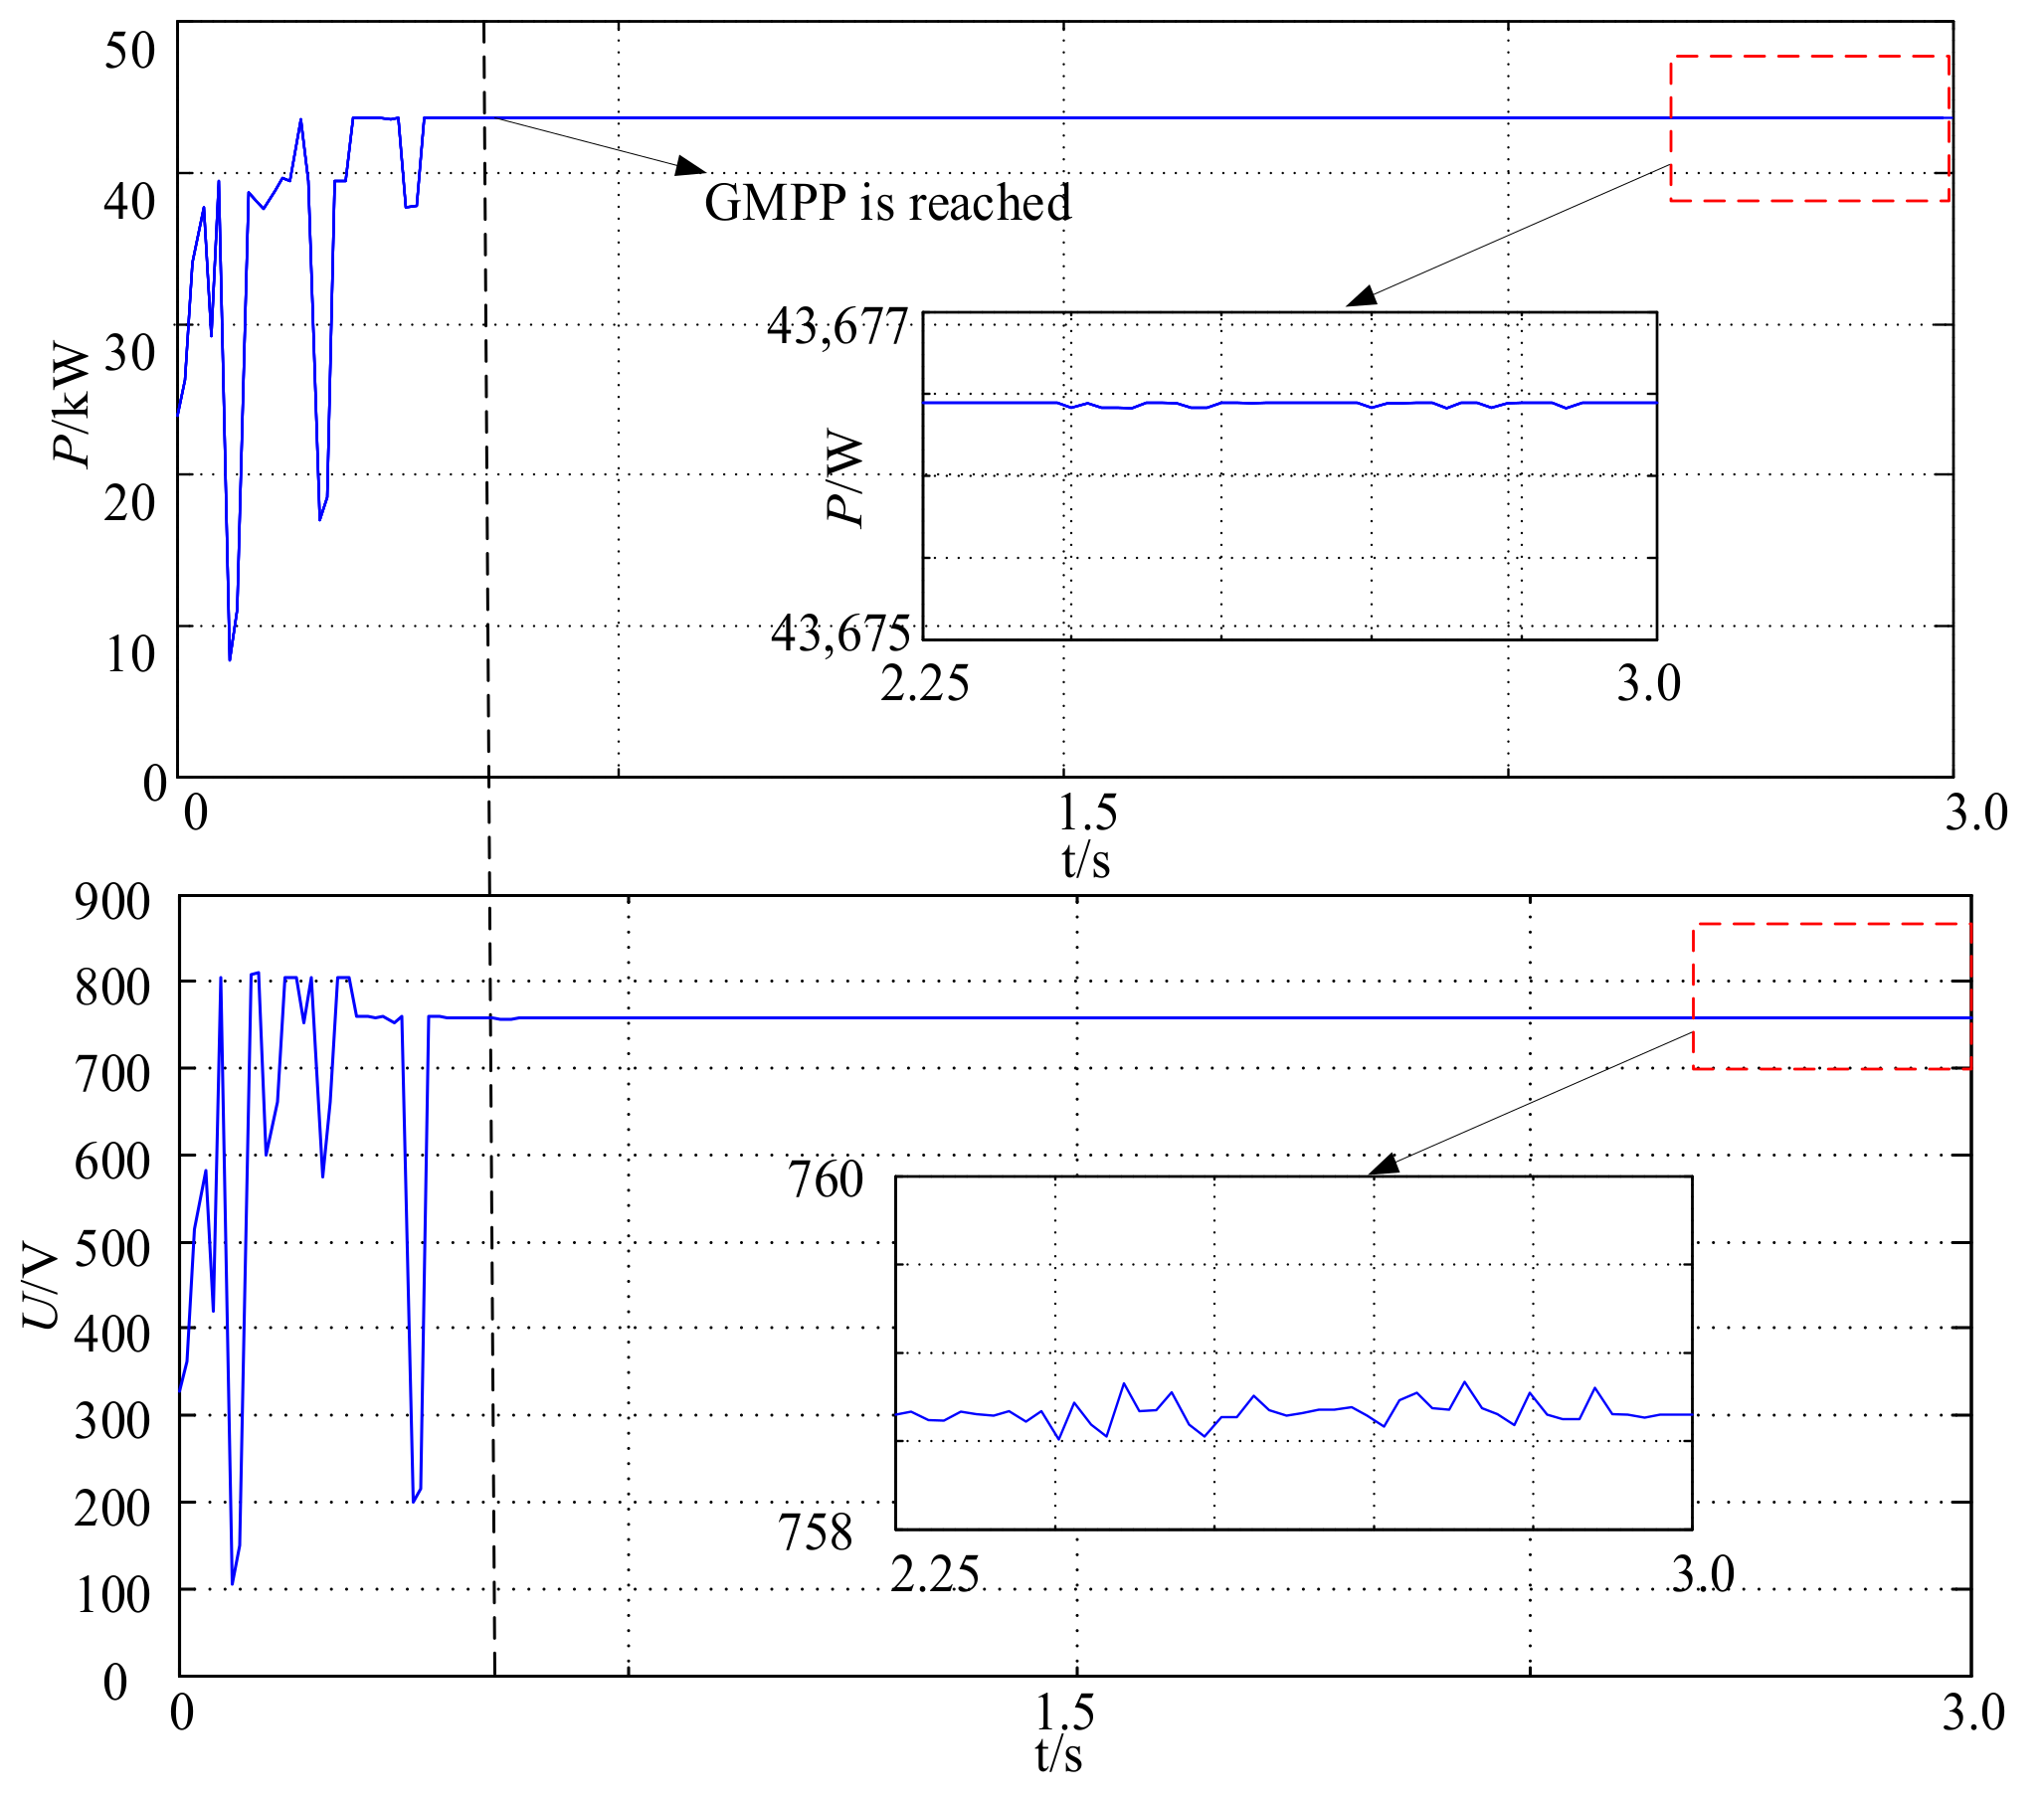
4. Case Studies
4.1. Parameters
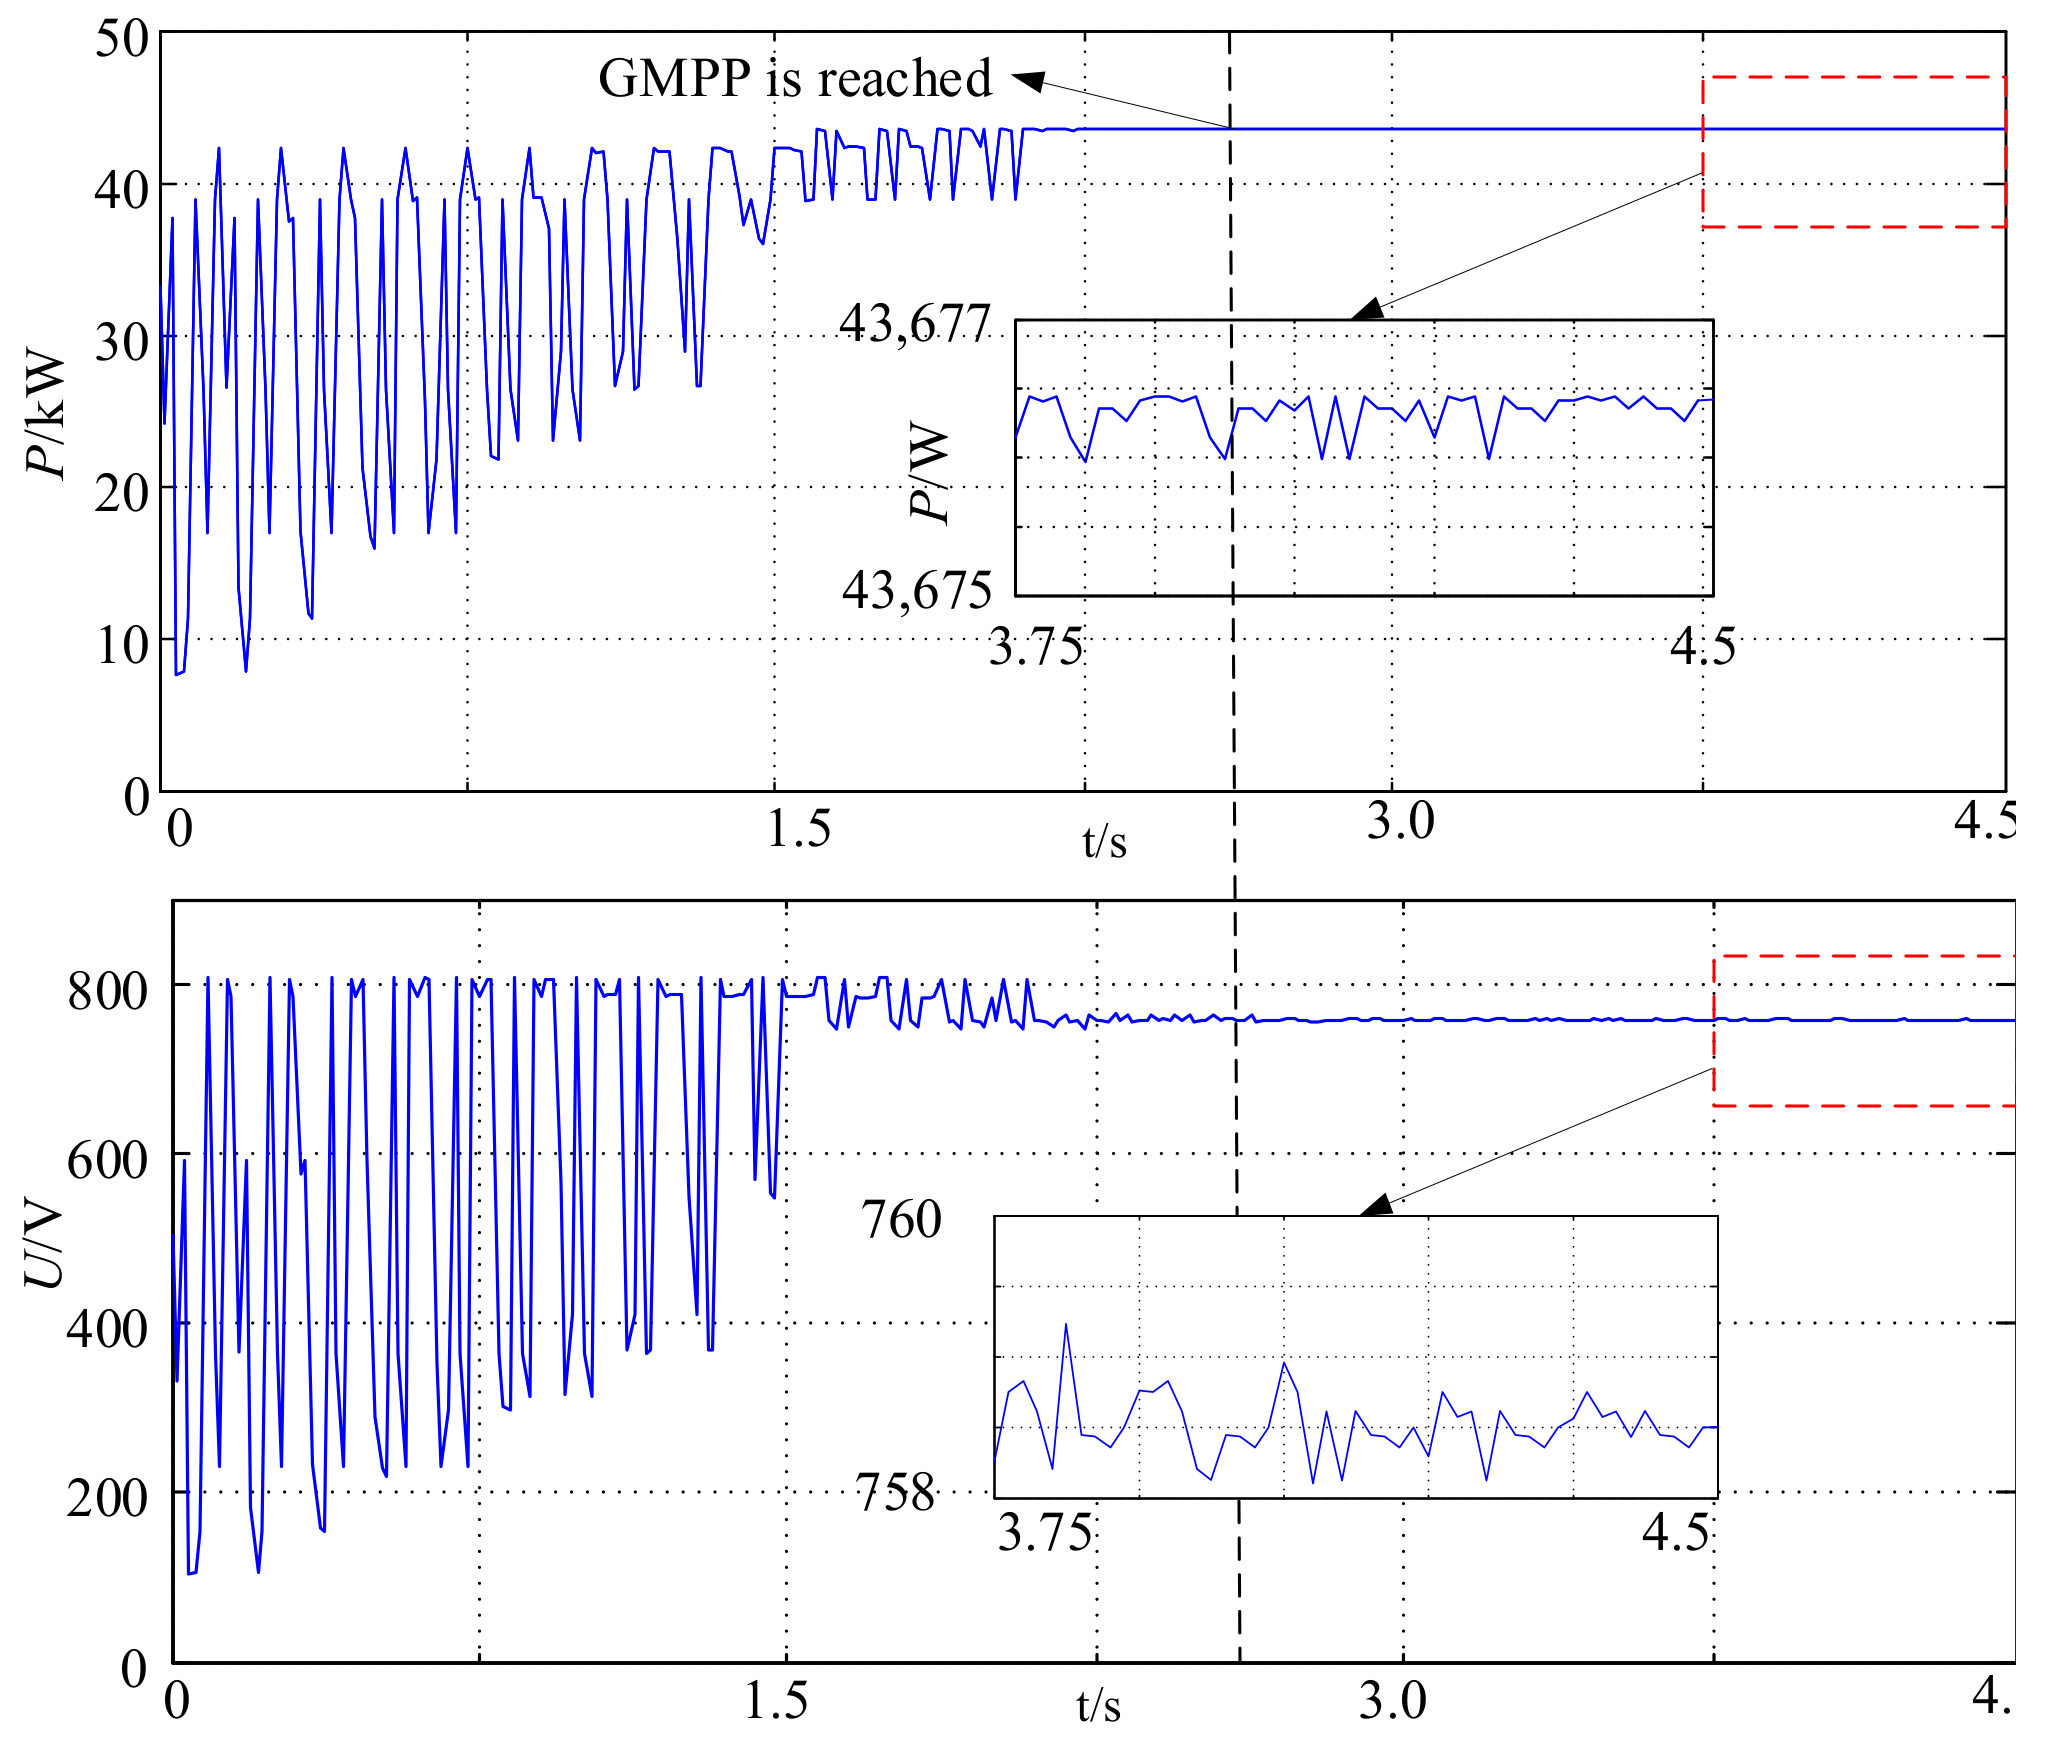
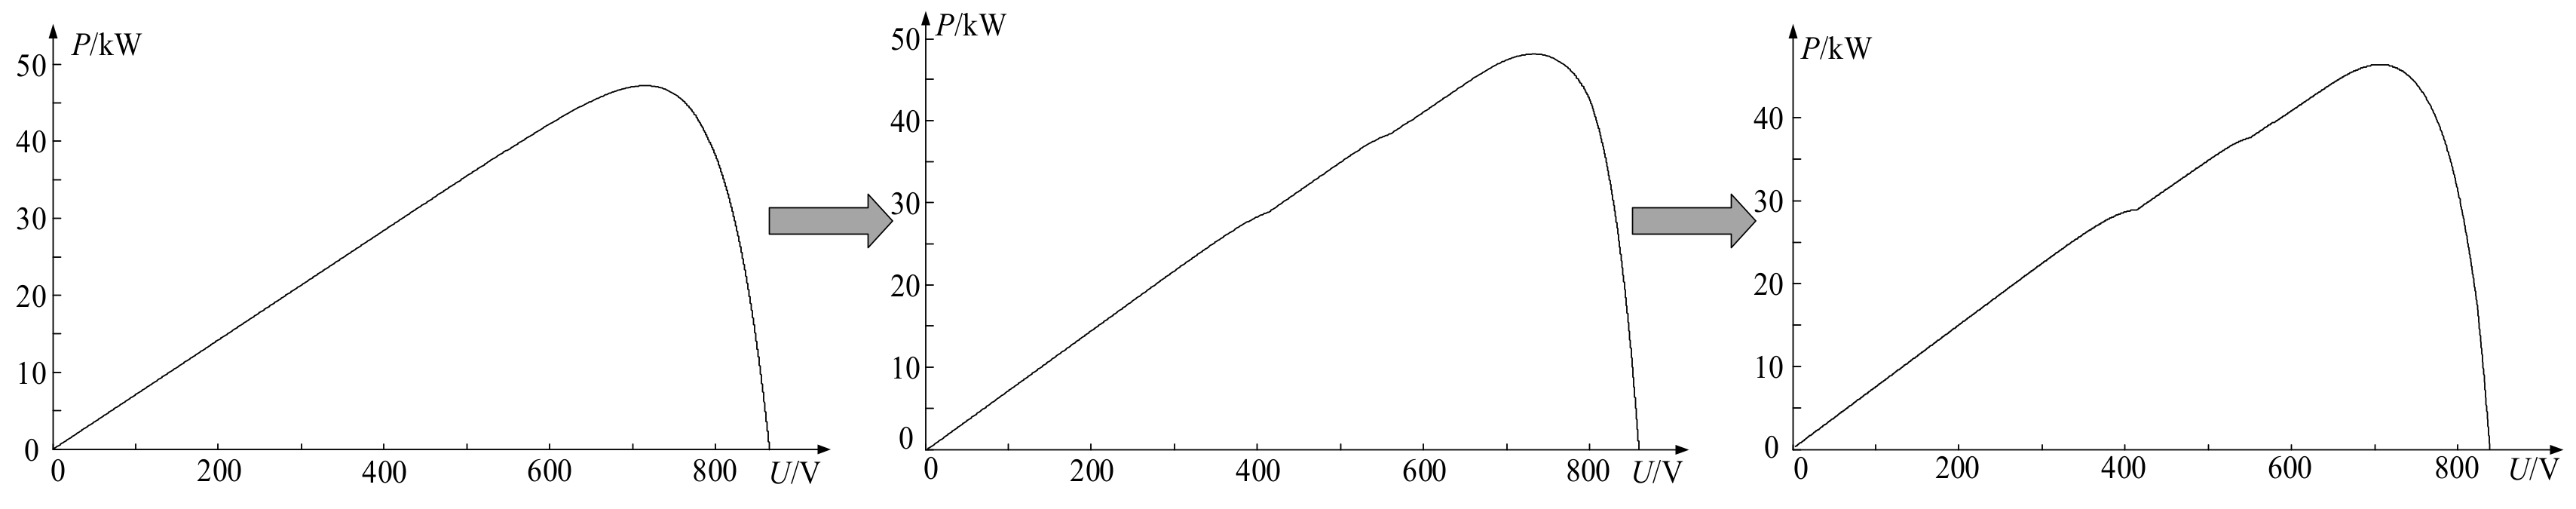
4.2. Static Cases
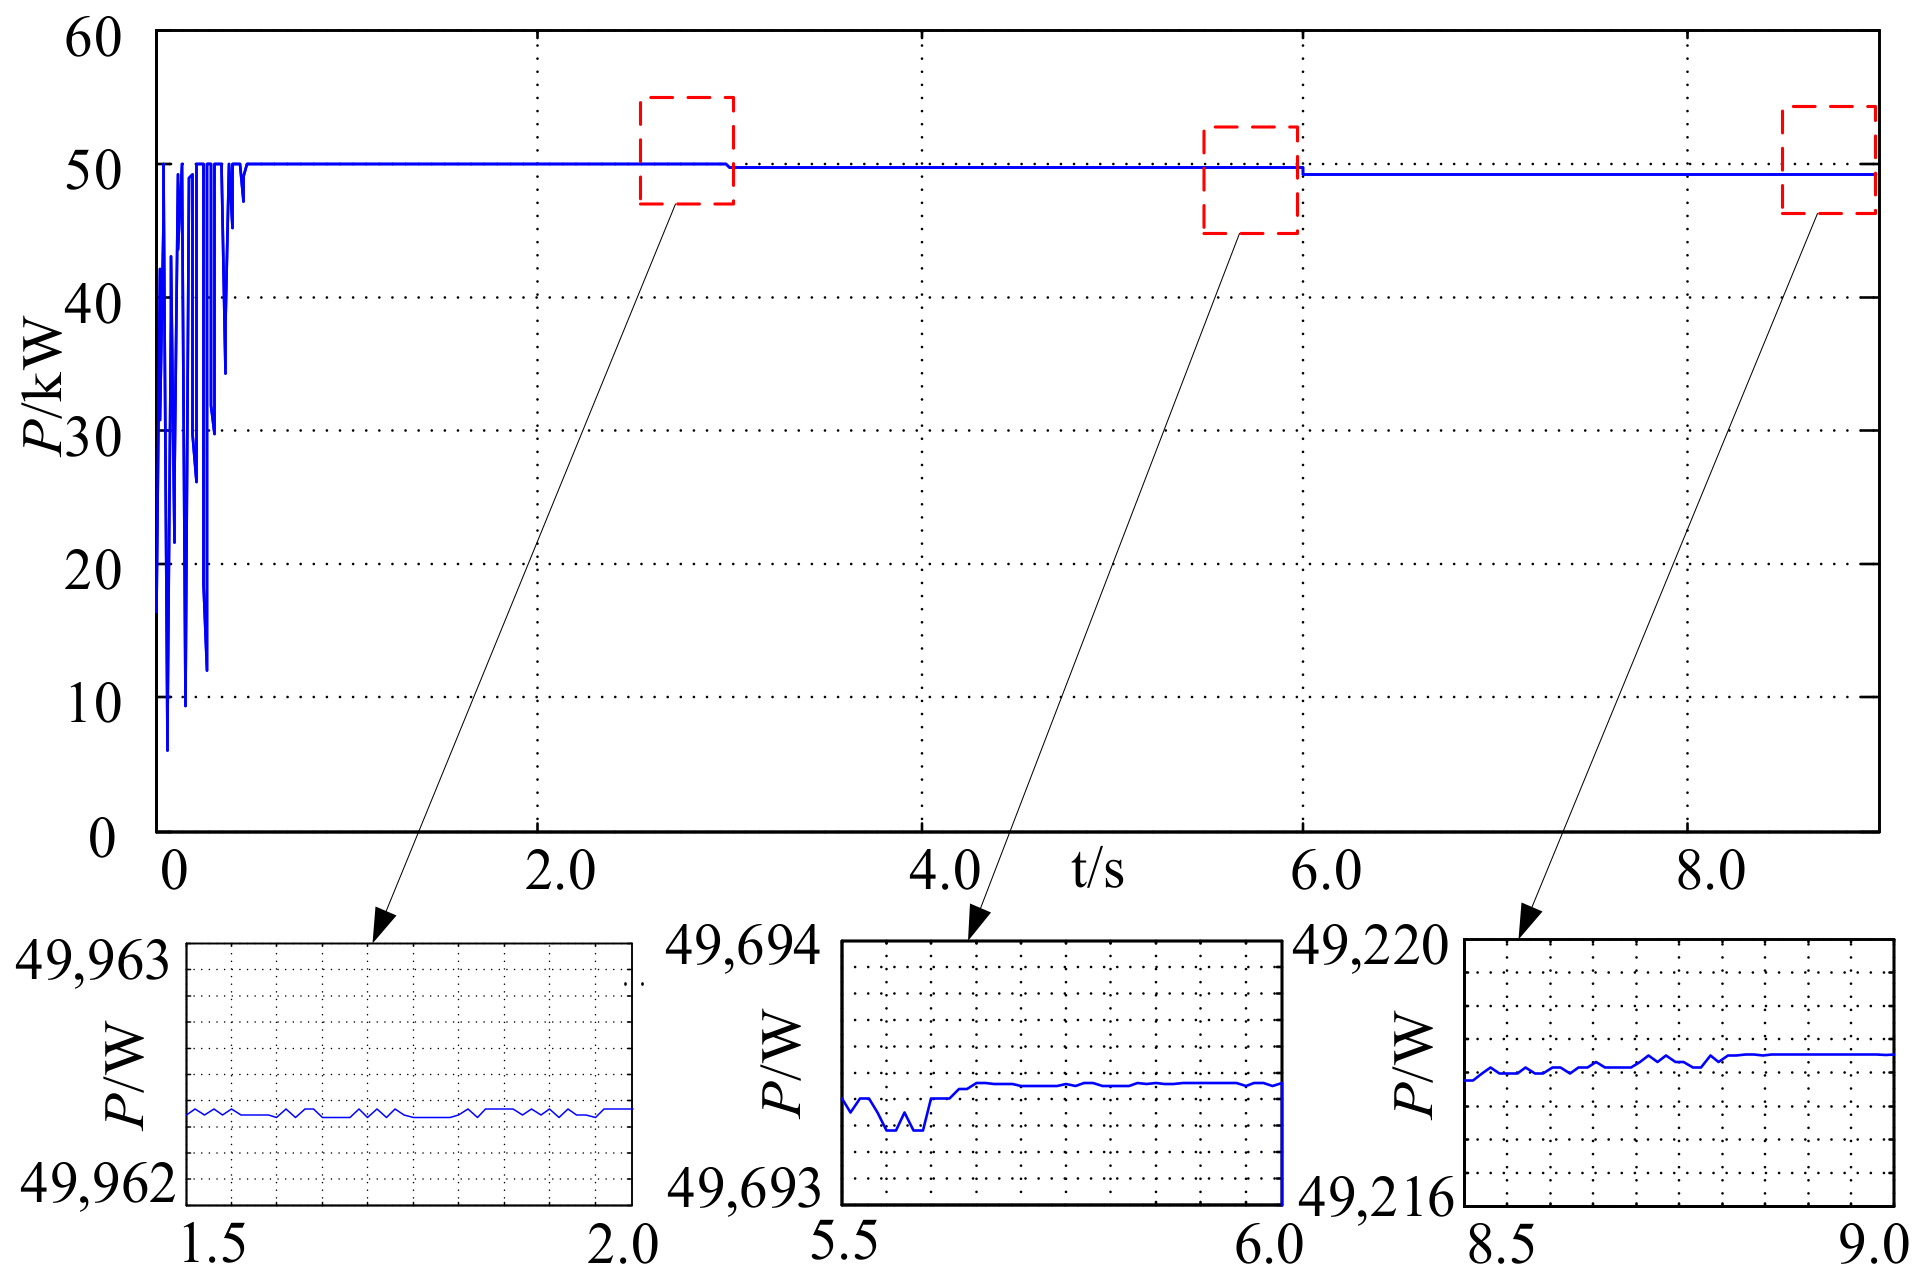
4.3. Dynamic Case
5. Conclusions
Author Contributions
Funding
Conflicts of Interest
References
- Jones, D.C.; Erickson, R.W. Probabilistic analysis of a generalized perturb and observe algorithm featuring robust operation in the presence of power curve traps. IEEE Trans. Power Electron. 2013, 28, 2912–2926. [Google Scholar] [CrossRef]
- Pilawa-Podgurski, R.C.N.; Li, W.; Celanovic, I.; Perreault, D.J. Integrated CMOS energy harvesting converter with digital maximum power point tracking for a portable thermophotovoltaic power generator. IEEE J. Emerg. Sel. Top. Power Electron. 2015, 3, 1021–1035. [Google Scholar] [CrossRef]
- Alajmi, B.N.; Ahmed, K.H.; Finney, S.J.; Williams, B.W. Fuzzylogic-control approach of a modified hill-climbing method for maximum power point in microgrid standalone photovoltaic system. IEEE Trans. Power Electron. 2011, 26, 1022–1030. [Google Scholar] [CrossRef]
- Hsieh, G.C.; Hsieh, H.I.; Tsai, C.Y.; Wang, C.H. Photovoltaic power-increment-aided incremental-conductance MPPT with two-phased tracking. IEEE Trans. Power Electron. 2013, 28, 2895–2911. [Google Scholar] [CrossRef]
- Spagnuolo, E.R.; Franquelo, L.G.; Ramos-Paja, C.A.; Suntio, T.; Xiao, W.M. Grid-connected photovoltaic generation plants: Components and operation. IEEE Ind. Electron. Mag. 2013, 7, 6–20. [Google Scholar]
- Shimizu, T.; Hirakata, M.; Kamezawa, T.; Watanabe, H. Generation control circuit for photovoltaic modules. IEEE Trans. Power Electron. 2001, 16, 293–300. [Google Scholar] [CrossRef]
- Karatepe, E.; Hiyama, T.; Boztepe, M.; Colak, M. Voltage based power compensation system for photovoltaic generation system under partially shaded insolation conditions. Energy Convers. Manag. 2008, 49, 2307–2316. [Google Scholar] [CrossRef]
- Sharma, P.; Agarwal, V. Maximum power extraction from a partially shaded PV array using shunt-series compensation. IEEE J. Photovolt. 2014, 4, 1128–1137. [Google Scholar] [CrossRef]
- Sharma, P.; Argarwal, V. Exact maximum power point tracking of grid-connected partially shaded PV source using current compensation concept. IEEE Trans. Power Electron. 2014, 29, 4684–4692. [Google Scholar] [CrossRef]
- El-Dein, M.Z.S.; Kazerani, M.; Salama, M.M.A. Optimal photovoltaic array reconfiguration to reduce partial shading losses. IEEE Trans. Sustain. Energy 2013, 4, 145–153. [Google Scholar] [CrossRef]
- Hu, Y.; Chen, H.; Xu, R.D.; Li, R. Photovoltaic (PV) array fault diagnosis strategy based on optimal sensor placement. Proc. CSEE 2011, 31, 19–30. [Google Scholar]
- Velasco-Quesada, G.; Guinjoan-Gispert, F.; Pique-Lopez, R.; Roman-Lumbreras, M.; Conesa-Roca, A. Electrical PV array recon-figuration strategy for energy extraction improvement in grid-connected PV systems. IEEE Trans. Ind. Electron. 2009, 56, 4319–4331. [Google Scholar] [CrossRef]
- Koutroulis, E.; Blaabjerg, F. A new technique for tracking the global maximum power point of PV arrays operating under partialshading conditions. IEEE J. Photovolt. 2012, 2, 184–190. [Google Scholar] [CrossRef]
- Shubhajit, S.R.; Saha, H. Maximum power point tracking of partially shaded solar photovoltaic array. Sol. Energy Mater. Sol. Cells 2010, 94, 1441–1447. [Google Scholar]
- Liu, Y.; Huang, S.; Liang, W. A particle swarm optimization-based maximum power point tracking algorithm for PV systems operating under partially shaded conditions. IEEE Trans. Energy Convers. 2012, 27, 1027–1035. [Google Scholar] [CrossRef]
- Ishaque, K.; Salam, Z.; Amjad, M.; Mekhilef, S. An improved particle swarm optimization (PSO)-based MPPT for PV with reduced steady-state oscillation. IEEE Trans. Power Electron. 2012, 27, 3627–3638. [Google Scholar] [CrossRef]
- Sundareswarm, K.; Sankar, P.; Nayak, P.S.R.; Simon, S.P.; Palani, S. Enhanced energy output from a PV system under partial shaded conditions through artificial bee colony. IEEE Trans. Sustain. Energy. 2015, 6, 198–209. [Google Scholar] [CrossRef]
- Alajmi, B.N.; Ahmed, K.H.; Finney, S.J.; Williams, B.W. A maximum power point tracking technique for partially shaded photovoltaic systems in microgrids. IEEE Trans. Ind. Electron. 2013, 60, 1596–1606. [Google Scholar] [CrossRef]
- Zhou, L.; Chen, Y.; Guo, K.; Jia, F. New approach for MPPT control of photovoltaic system with mutative-scale dual-carrier chaotic search. IEEE Trans. Power Electron. 2011, 26, 1038–1048. [Google Scholar] [CrossRef]
- Nguyen, T.L.; Low, K.S. A global maximum power point tracking scheme employing DIRECT search algorithm for photovoltaic systems. IEEE Trans. Ind. Electron. 2010, 57, 3456–3467. [Google Scholar] [CrossRef]
- Ahmed, N.A.; Miyatake, M. A novel maximum power point tracking for photovoltaic applications under partially shaded insolation conditions. Electr. Power Syst. Res. 2008, 78, 777–784. [Google Scholar] [CrossRef]
- Ishaque, K.; Salam, Z. A deterministic particle swarm optimization maximum power point tracker for photovoltaic system under partial shading condition. IEEE Trans. Ind. Electron. 2013, 60, 3195–3206. [Google Scholar] [CrossRef]
- Patel, H.; Agarwal, V. Maximum power point tracking scheme for PV systems operating under partially shaded conditions. IEEE Trans. Ind. Electron. 2008, 55, 1689–1698. [Google Scholar] [CrossRef]
- Tey, K.S.; Mekhilef, S. Modified incremental conductance algorithm for photovoltaic system under partial shading conditions and load variation. IEEE Trans. Ind. Electron. 2014, 61, 5384–5392. [Google Scholar]
- Tey, K.S.; Mekhilef, S. A fast-converging MPPT technique for photovoltaic system under fast-varying solar irradiation and load resistance. IEEE Trans. Ind. Inform. 2014, 11, 176–186. [Google Scholar]
- Tey, K.S.; Mekhilef, S. Modified incremental conductance MPPT algorithm to mitigate inaccurate responses under fast-changing solar irradiation. Sol. Energy 2014, 101, 333–342. [Google Scholar] [CrossRef]
- Tey, K.S.; Mekhilef, S.; Safari, A. Simple and low cost incremental conductance maximum power point tracking using buck-boost converter. J. Renew. Sustain. Energy 2013, 5, 023106. [Google Scholar]
- Seyedmahmoudian, M.; Mekhilef, S.; Rahmani, R.; Yusof, R.; Renani, E.T. Analytical modeling of partially shaded photovoltaic systems. Energies 2013, 6, 128–144. [Google Scholar] [CrossRef]
- Yang, X.-S. Nature-Inspired Metaheuristic Algorithms; Luniver Press: Cambridge, UK, 2008. [Google Scholar]
- Sundareswaran, K.; Peddapati, S.; Palani, S. MPPT of PV systems under partial shaded conditions through a colony of flashing fireflies. IEEE Trans. Energy Convers. 2014, 29, 463–472. [Google Scholar]
- Femia, N.; Petrone, G.; Spagnuolo, G.; Vitell, M. Optimization of perturb and observe maximum power point tracking method. IEEE Trans. Power Electron. 2005, 20, 963–973. [Google Scholar] [CrossRef]
- Teshome, D.F.; Lee, C.H.; Lin, Y.W.; Lian, K.L. A Modified Firefly Algorithm for Photovoltaic Maximum Power Point Tracking Control Under Partial Shading. IEEE J. Emerg. Sel. Top. Power Electron. 2017, 5, 661–671. [Google Scholar] [CrossRef]


| Firefly Algorithm | PV System |
|---|---|
| Firefly position | Two-dimensional coordinates expressed as (Voltage, Power) |
| Distance | Cartesian distance between firefly positions |
| Attractiveness | An exponential function of distance |
| Brightness | Power |
| Brightness of the brightest firefly | Global maximum power |
| Parameters | Value |
|---|---|
| n | 10 |
| γ | 10−8 |
| β0 | 1 |
| α | 0.5 |
| v | 5 |
| θ | 0.6 |
| μ | 0.2 |
| Convergence Time | Case | IFA | FA |
|---|---|---|---|
| Best | 1 | 0.21 s | 0.60 s |
| Worst | 0.50 s | 1.56 s | |
| Average | 0.33 s | 0.97 s | |
| Best | 2 | 0.39 s | 0.95 s |
| Worst | 0.57 s | 1.67 s | |
| Average | 0.45 s | 1.18 s | |
| Best | 3 | 0.27 s | 0.79 s |
| Worst | 0.38 s | 1.26 s | |
| Average | 0.31 s | 0.96 s |
| Case | Posc/W | |
|---|---|---|
| IFA | FA | |
| 1 | 0.42 | 1.07 |
| 2 | 0.69 | 1.16 |
| 3 | 0.45 | 1.22 |
© 2019 by the authors. Licensee MDPI, Basel, Switzerland. This article is an open access article distributed under the terms and conditions of the Creative Commons Attribution (CC BY) license (http://creativecommons.org/licenses/by/4.0/).
Share and Cite
Zhang, M.; Chen, Z.; Wei, L. An Immune Firefly Algorithm for Tracking the Maximum Power Point of PV Array under Partial Shading Conditions. Energies 2019, 12, 3083. https://doi.org/10.3390/en12163083
Zhang M, Chen Z, Wei L. An Immune Firefly Algorithm for Tracking the Maximum Power Point of PV Array under Partial Shading Conditions. Energies. 2019; 12(16):3083. https://doi.org/10.3390/en12163083
Chicago/Turabian StyleZhang, Mingrui, Zheyang Chen, and Li Wei. 2019. "An Immune Firefly Algorithm for Tracking the Maximum Power Point of PV Array under Partial Shading Conditions" Energies 12, no. 16: 3083. https://doi.org/10.3390/en12163083
APA StyleZhang, M., Chen, Z., & Wei, L. (2019). An Immune Firefly Algorithm for Tracking the Maximum Power Point of PV Array under Partial Shading Conditions. Energies, 12(16), 3083. https://doi.org/10.3390/en12163083