Analysis of Regional Differences and Influencing Factors on China’s Carbon Emission Efficiency in 2005–2015


Abstract
1. Introduction
2. Literature Review
3. Research Method
3.1. The Definition of Carbon Emission Efficiency
3.2. The Modified Undesirable EBM DEA Model
3.3. Tobit Model
4. Data Source and Indicator Selection
- Capital stock. The paper estimated the capital stock by using the perpetual inventory method, defined as follows [58].where Ki,t and Ii,t stand for the capital stock and the gross fixed capital formation of the ith province in the tth year, respectively. δ is the depreciation rate of capital stock, and is set to 9.6% in accordance with previous studies [59]. The provincial data of capital stock were converted into the 2005 constant price. The capital stock data of provinces in 2005 was expressed as followsAll data of the gross fixed capital formation as well as the price index of fixed-asset investment in Chinese provinces were from the China Statistical Yearbook (2006–2016).
- Labor force. The paper adopted the total amount of employees in three industries as the labor force variable. The data on the provincial level were collected from the statistical yearbook (2006–2016).
- Energy consumption. This paper chose the energy consumption of each province as the input index. The data were collected from China’s Energy Statistical Yearbook (2006–2016).
- GDP. To diminish the impact of inflation, we convert the provincial GDP into the 2005 constant price. The data came from the China Statistical Yearbook (2006–2016).
5. Analysis of Regional Differences in Carbon Efficiency
5.1. Overall Characteristics of Chinese Carbon Emission Efficiency
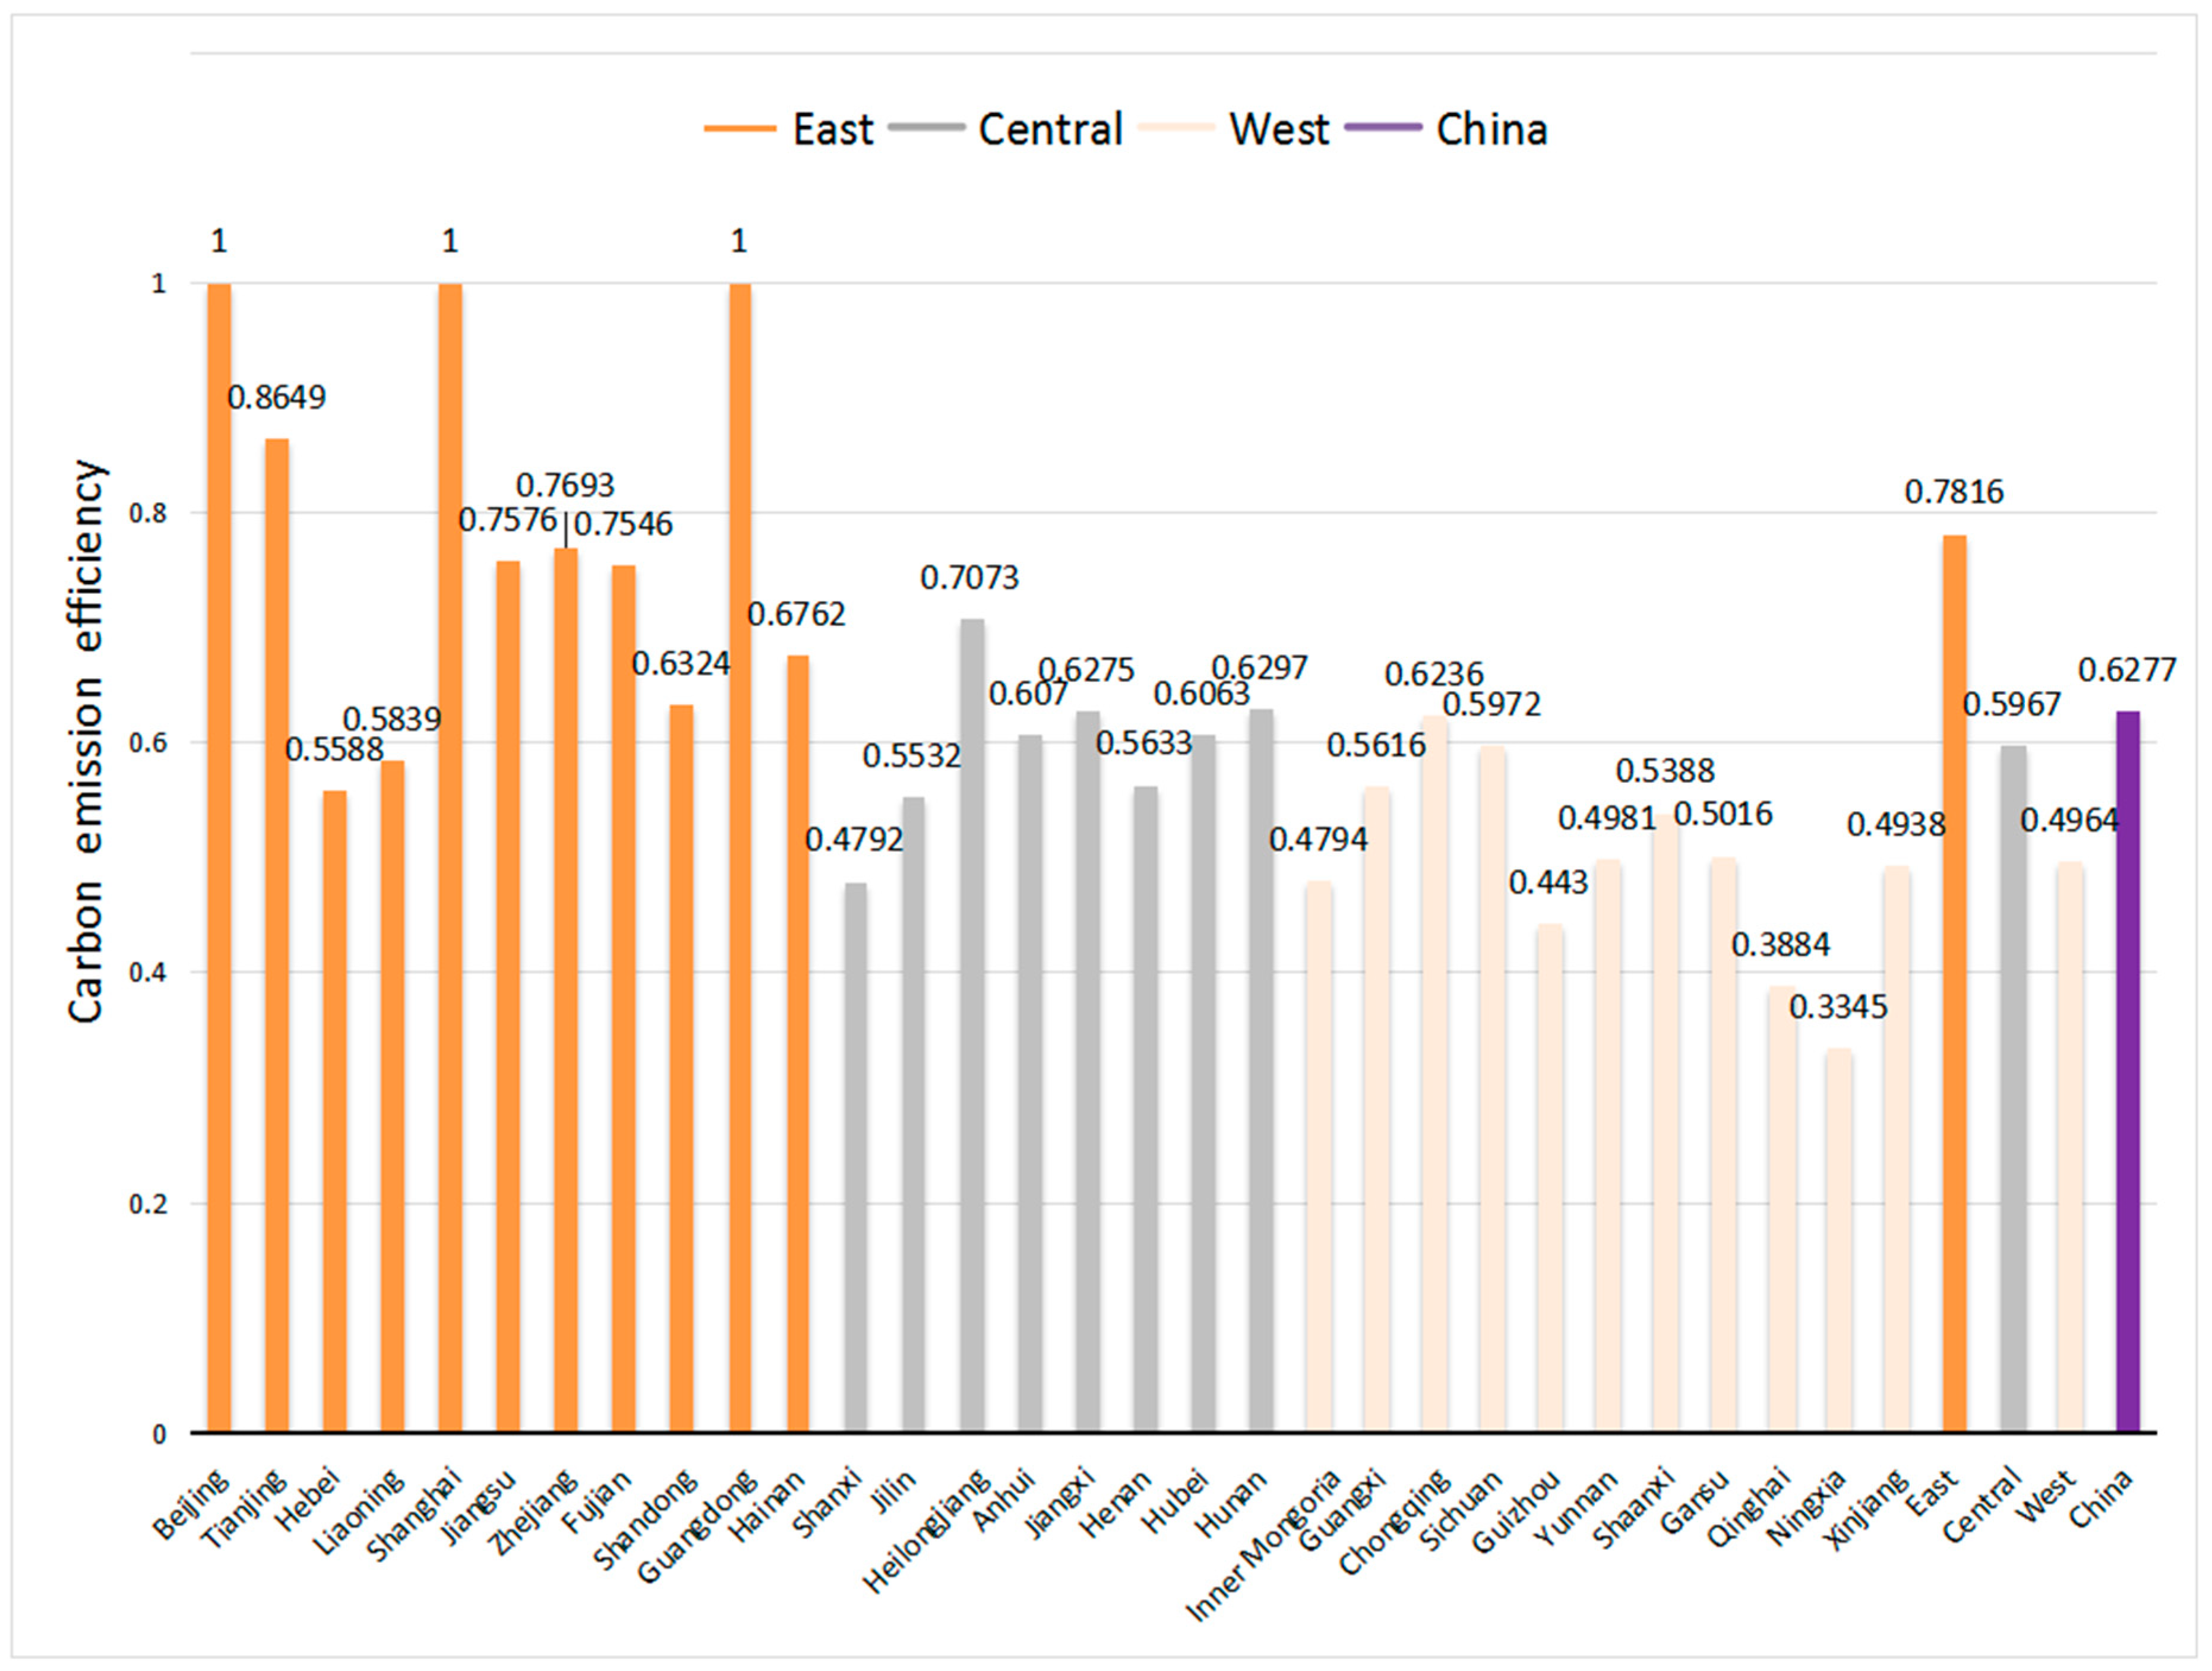
5.2. Regional Differences of Carbon Emission Efficiency: East, Central, and West
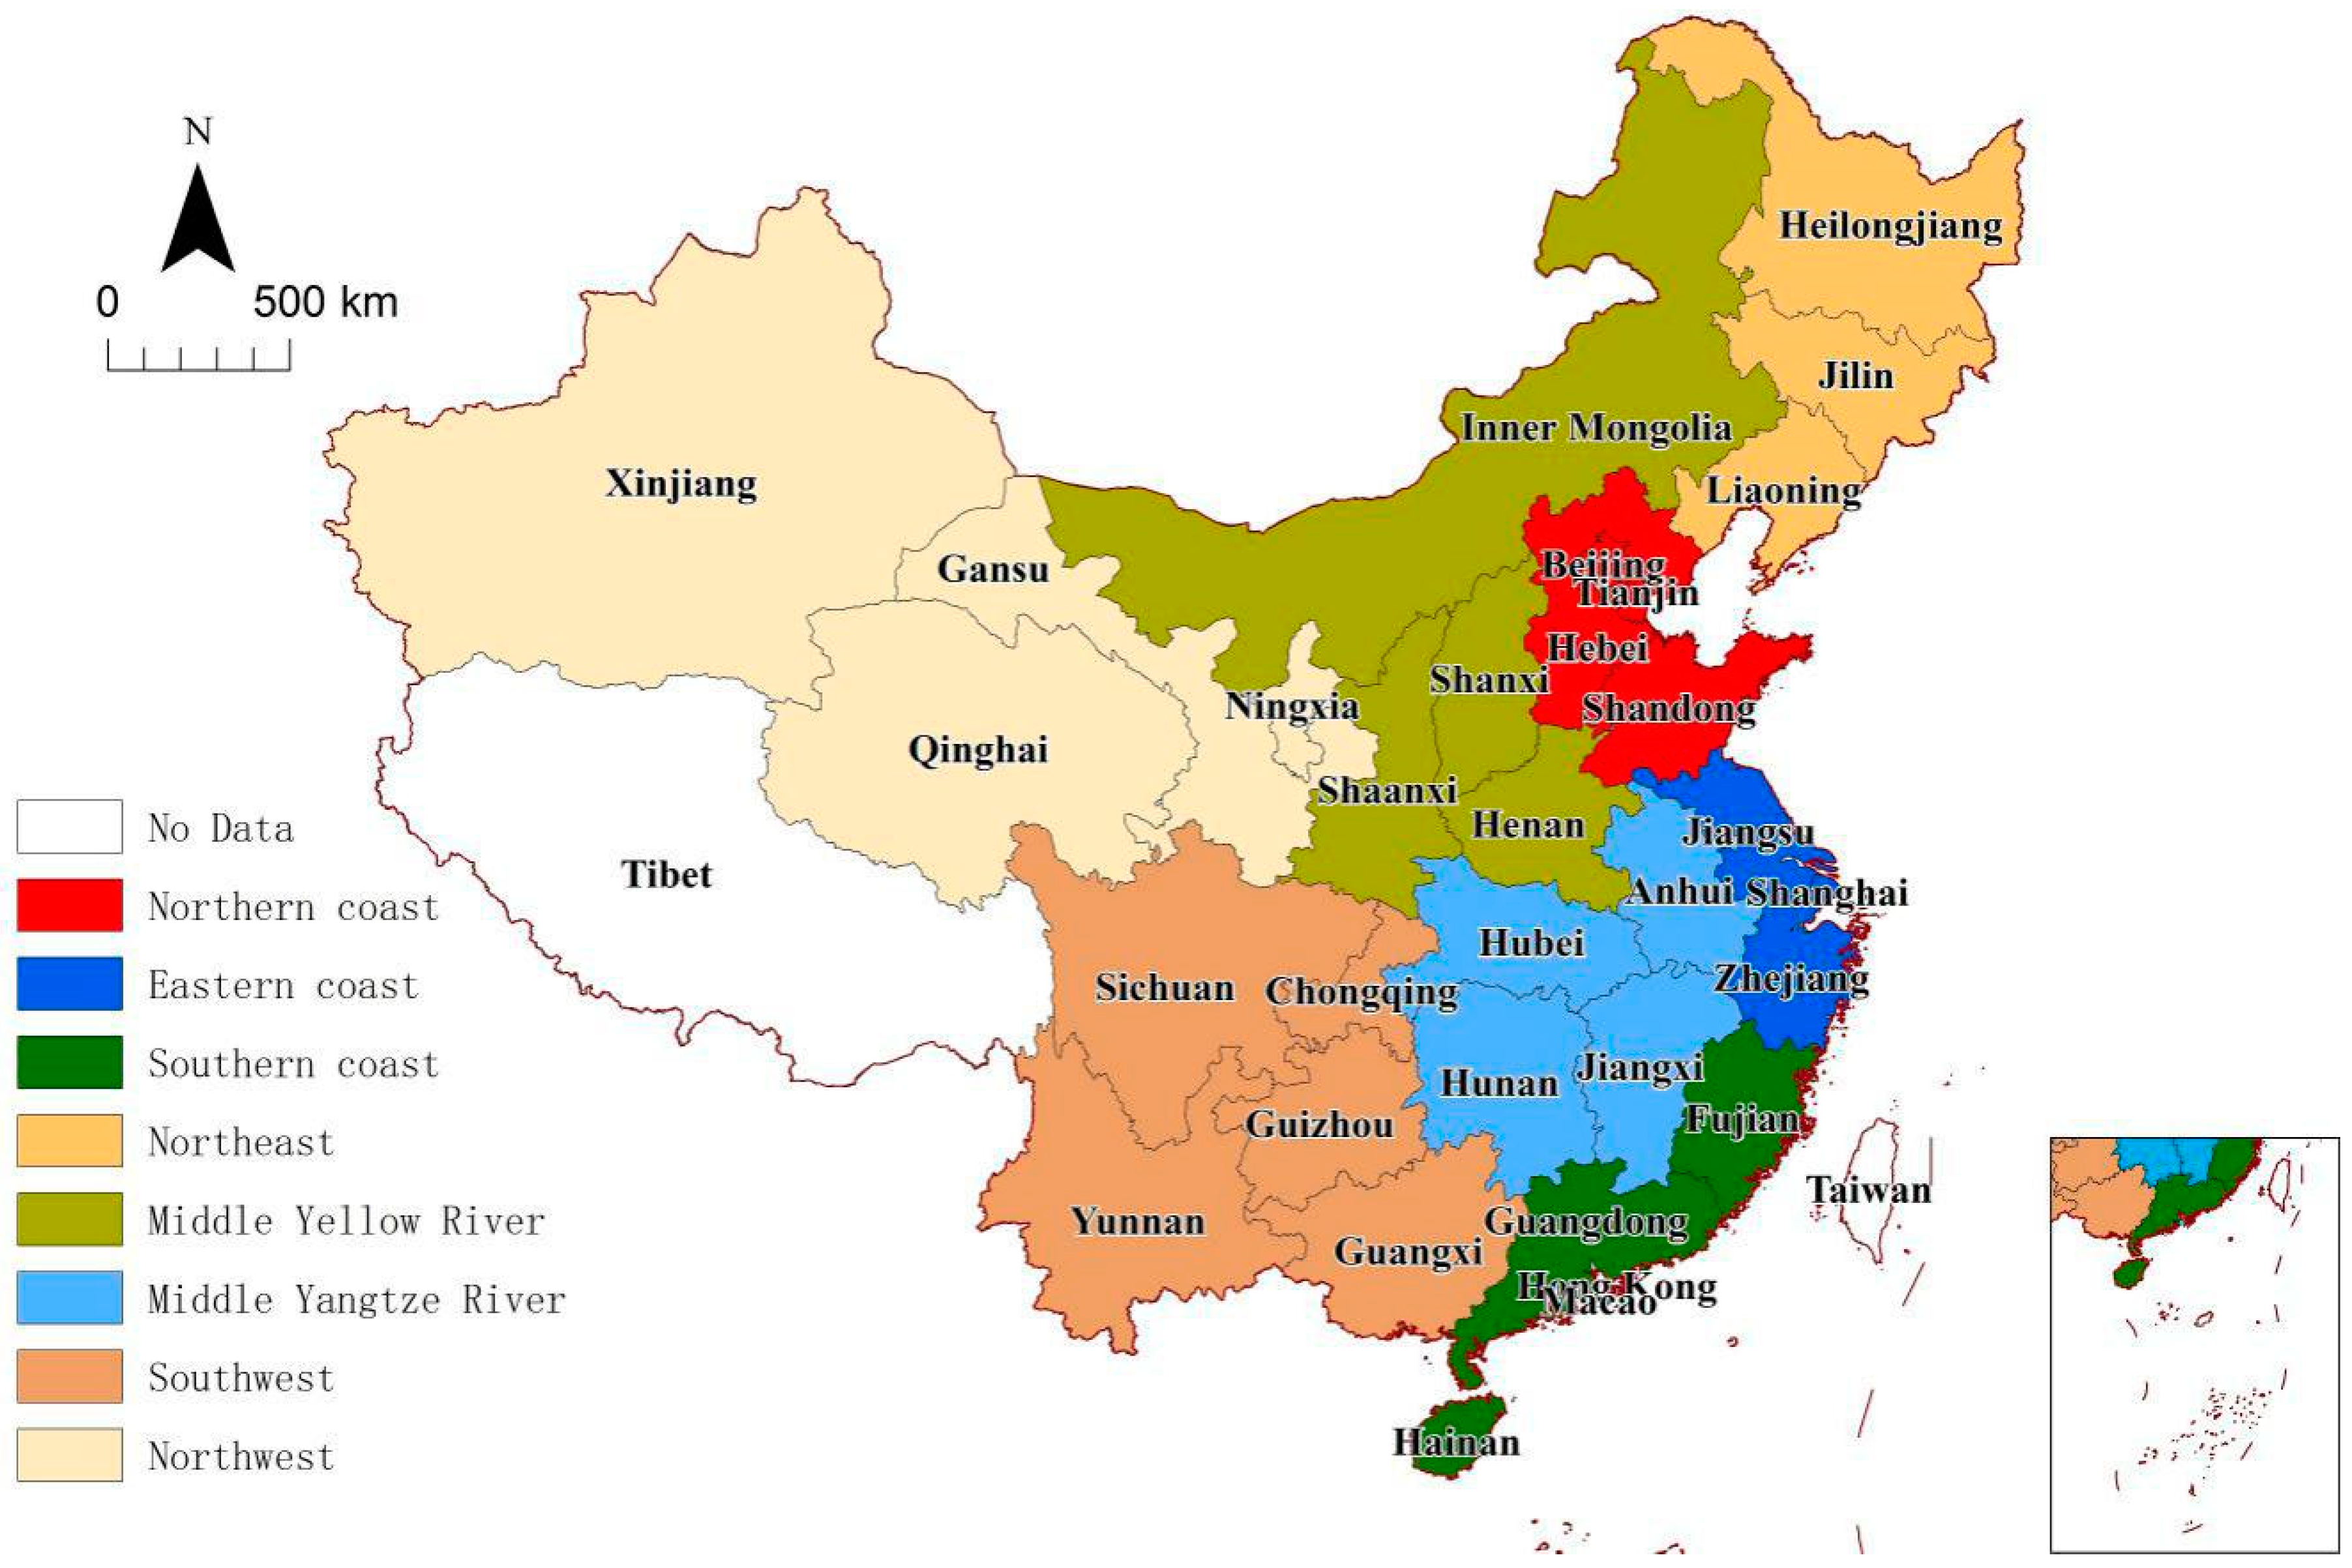
5.3. Regional Differences in Carbon Emission Efficiency: A Comparison of Eight Comprehensive Economic Regions
6. Influence Factors of Carbon Emission Efficiency Based on the Tobit Regression
6.1. Determinants of Carbon Emission Efficiency
6.1.1. Government Intervention in the Economy
6.1.2. Industrial Structure
6.1.3. Foreign Trade Level
6.1.4. The Foreign Capital Utilization Level
6.1.5. Energy Intensity
6.1.6. Science and Technology Level
6.2. Unit Root Test and Cointegration Test
6.3. Explaining Carbon Emission Efficiency: Tobit Regression Results
7. Conclusions and Discussions
Author Contributions
Acknowledgments
Conflicts of Interest
References
- IPCC. Climate Change 2007: Synthesis Report; Cambridge University Press: Cambridge, UK, 2007. [Google Scholar]
- Edenhofer, O.; Pichs-Madruga, R.; Sokona, Y.; Farahani, E.; Kadner, S.; Kadner, K.; Seyboth, A.; Adler, I.; Baum, S.; Myhre, G.; et al. Climate Change 2014: Mitigation of Climate Change; Working Group III Contribution to the IPCC Fifth Assessment Report; Cambridge University Press: Cambridge, UK, 2015. [Google Scholar]
- BP. Statistical Review of World Energy; BP: London, UK, 2018. [Google Scholar]
- The Global Carbon Project (GCP). Global Carbon Budget 2017. Earth Syst. Sci. Data 2018, 10, 405–448. Available online: https://www.earth-syst-sci-data.net/10/405/2018/ (accessed on 25 July 2019). [CrossRef]
- Xie, L.; Chen, C.L.; Yu, Y.H. Dynamic Assessment of Environmental Efficiency in Chinese Industry: A Multiple DEA Model with a Gini Criterion Approach. Sustainability 2019, 11, 2294. [Google Scholar] [CrossRef]
- Wang, S.; Wang, H.; Zhang, L.; Dang, J. Provincial Carbon Emissions Efficiency and Its Influencing Factors in China. Sustainability 2019, 11, 2355. [Google Scholar] [CrossRef]
- The 13th Five-Year Plan for Economic and Social Development of the People’s Republic of China (2016–2020); The Central Compilation and Translation Bureau: Beijing, China, 2016.
- Meng, Z.S.; Wang, H.A.; Wang, B.N. Empirical Analysis of Carbon Emission Accounting and Influencing Factors of Energy Consumption in China. Int. J. Environ. Res. Public Health 2018, 15, 2467. [Google Scholar] [CrossRef] [PubMed]
- Feng, F.; Peng, L.L. Is There Any Difference in the Effect of Different R and D Sources on Carbon Intensity in China? Sustainability 2019, 11, 1701. [Google Scholar] [CrossRef]
- Wang, Q.W.; Zhou, P.; Shen, N.; Wang, S.S. Measuring Carbon Dioxide Emission Performance in Chinese Provinces: A Parametric Approach. Renew. Sustain. Energy Rev. Dev. 2013, 21, 324–330. [Google Scholar] [CrossRef]
- Chu, X.X.; Geng, H.; Guo, W. How Does Energy Misallocation Affect Carbon Emission Efficiency in China? An Empirical Study Based on the Spatial Econometric Model. Sustainability 2019, 11, 2115. [Google Scholar] [CrossRef]
- Zhong, Y.Y.; Zhong, W.Z. China’s Regional Total Factor Carbon Emission Performance and Influencing Factors Analysis. J. Bus. Econ. 2012, 1, 85–96. [Google Scholar] [CrossRef]
- Wang, M. Key Issues in China’s Development; China Development Press: Beijing, China, 2005.
- Charnes, A.; Cooper, W.W.; Rhodes, E. Measuring the Efficiency of Decision Making Units. Eur. J. Oper. Res. 1978, 2, 429–444. [Google Scholar] [CrossRef]
- Banker, R.D.; Charnes, R.F.; Cooper, W.W. Some Models for Estimating Technical and Scale Inefficiencies in Data Envelopment Analysis. Manag. Sci. 1984, 30, 1078–1092. [Google Scholar] [CrossRef]
- Tone, K. A Slacks-based Measure of Efficiency in Data Envelopment Analysis. Eur. J. Oper. Res. 2001, 130, 498–509. [Google Scholar] [CrossRef]
- Li, Y.; Chiu, Y.H.; Lin, T.Y. The Impact of Economic Growth and Air Pollution on Public Health in 31 Chinese Cities. Int. J. Environ. Res. Public Health 2019, 16, 393. [Google Scholar] [CrossRef]
- Qu, Y.; Yu, Y.; Appolloni, A.; Li, M.; Liu, Y. Measuring Green Growth Efficiency for Chinese Manufacturing Industries. Sustainability 2017, 9, 637. [Google Scholar] [CrossRef]
- Li, Y.; Chiu, Y.H.; Lin, T.Y. Energy and Environmental Efficiency in Different Chinese Regions. Sustainability 2019, 11, 1216. [Google Scholar] [CrossRef]
- Tian, Z.; Ren, F.R.; Xiao, Q.W.; Chiu, Y.H.; Lin, T.Y. Cross-Regional Comparative Study on Carbon Emission Efficiency of China’s Yangtze River Economic Belt Based on the Meta-Frontier. Int. J. Environ. Res. Public Health 2019, 16, 619. [Google Scholar] [CrossRef]
- Yang, L.; Wang, K.L.; Geng, J.C. China’s Regional Ecological Energy Efficiency and Energy Saving and Pollution Abatement Potentials: An Empirical Analysis Using Epsilon-Based Measure Model. J. Clean. Prod. 2018, 194, 300–308. [Google Scholar] [CrossRef]
- Cui, Q.; Li, Y. CNG2020 Strategy and Airline Efficiency: A Network Epsilon-Based Measure with Managerial Disposability. Int. J. Sustain. Transp. 2018, 12, 313–323. [Google Scholar] [CrossRef]
- Tone, K.; Tsutsui, M. An Epsilon-Based Measure of Efficiency in DEA-A Third Pole of Technical Efficiency. European. J. Oper. Res. 2010, 207, 1554–1563. [Google Scholar] [CrossRef]
- Li, Y.; Chiu, Y.H.; Lu, L.C. New Energy Development and Pollution Emissions in China. Int. J. Environ. Res. Public Health 2019, 16, 1764. [Google Scholar] [CrossRef]
- Tobin, J. Estimation of relationships for limited dependent variables. Econometrica 1958, 26, 24–36. Available online: https://search.proquest.com/docview/214674441?OpenUrlRefId=info:xri/sid:baidu&accountid=13151 (accessed on 25 July 2019). [CrossRef]
- Kaya, Y.; Yokobori, K. Global Environment, Energy, and Economic Development; United Nations University: Tokyo, Japan, 1993. [Google Scholar]
- Mielnik, O.; Goldemberg, J. Communication the Evolution of the Carbonization Index in Developing Countries. Energy Policy 1999, 27, 307–308. [Google Scholar] [CrossRef]
- Sun, J.W. The Decrease of CO2 Emission Intensity is Decarbonization at National and Global Levels. Energy Policy 2005, 33, 975–978. [Google Scholar] [CrossRef]
- Li, Z.L. Analysis on Regional Carbon Emission Efficiency Measurement and Influence Factors in China. Master’s Thesis, China University of Mining & Technology, Beijing, China, 2014. [Google Scholar]
- Zofit, J.L.; Prieto, A.M. Environmental Efficiency and Regulatory Standards: The Case of CO2 Emissions from OECD Industries. Resour. Energy Econ. 2001, 23, 63–83. [Google Scholar] [CrossRef]
- Wang, K.; Wei, Y.M.; Zhang, X. A Comparative Analysis of China’s Regional Energy and Emission. Performance: Which is the Better Way to Deal with Undesirable Outputs? Energy Policy 2012, 46, 574–584. [Google Scholar] [CrossRef]
- Zhou, G.; Chung, W.; Zhang, Y. Measuring Energy Efficiency Performance of China’s Transport Sector: A Data Envelopment Analysis Approach. Expert Syst. Appl. 2014, 41, 709–722. [Google Scholar] [CrossRef]
- Yao, X.; Zhou, H.; Zhang, A.; Li, A.J. Regional Energy Efficiency, Carbon Emission Performance and Technology Gaps in China: A Meta-frontier Non-Radial Directional Distance Function Analysis. Energy Policy 2015, 84, 142–154. [Google Scholar] [CrossRef]
- Aigner, D.; Lovell, C.A.K.; Schmidt, P. Formulation and Estimation of Stochastic Frontier Production Function Models. J. Econ. 1977, 6, 21–37. [Google Scholar] [CrossRef]
- Lee, S.; Kim, C. Estimation of Association between Healthcare System Efficiency and Policy Factors for Public Health. Appl. Sci. 2018, 8, 2674. [Google Scholar] [CrossRef]
- Greene, W. Reconsidering heterogeneity in panel data estimators of the stochastic frontier model. J. Econ. 2005, 126, 269–303. [Google Scholar] [CrossRef]
- Cullinane, K.; Song, D.W.; Gray, R. A stochastic frontier model of the efficiency of major container terminals in Asia: Assessing the influence of administrative and ownership structures. Transp. Res. Part A 2002, 36, 743–762. [Google Scholar] [CrossRef]
- Zheng, J.; Zhang, H.Q.; Xing, Z.C. Re-Examining Regional Total-Factor Water Efficiency and Its Determinants in China: A Parametric Distance Function Approach. Water 2018, 10, 1286. [Google Scholar] [CrossRef]
- Cullinane, K.; Wang, T.F.; Song, D.W.; Ji, P. The technical efficiency of container ports: Comparing data envelopment analysis and stochastic frontier analysis. Transp. Res. Part A Policy Pract. 2006, 40, 354–374. [Google Scholar] [CrossRef]
- Wang, S.Q.; Zhou, L.; Wang, H.; Li, X.C. Water Use Efficiency and Its Influencing Factors in China: Based on the Data Envelopment Analysis (DEA)-Tobit Model. Water 2018, 10, 832. [Google Scholar] [CrossRef]
- Chung, Y.H.; Fare, R.; Grosskopf, S. Productivity and Undesirable Outputs: A Directional Distance Function Approach. J. Environ. Manag. 1997, 51, 229–240. [Google Scholar] [CrossRef]
- Wei, M.; Cao, M.F.; Jiang, J.R. Determinants of Long-run Carbon Emission Performance. J. Quant. Tech. Econ. 2010, 9, 43–52+81. Available online: http://en.cnki.com.cn/Article_en/CJFDTOTAL-SLJY201009006.htm (accessed on 25 July 2019).
- Wang, Y.; Duan, F.M.; Ma, X.J.; He, L.C. Carbon Emissions Efficiency in China: Key Facts from Regional and Industrial Sector. J. Clean. Prod. 2019, 206, 850–869. [Google Scholar] [CrossRef]
- Li, K.; Lin, B. Metafroniter Energy Efficiency with CO2 Emissions and its Convergence Analysis for China. Energy Econ. 2015, 48, 230–241. [Google Scholar] [CrossRef]
- Huo, T.; Ren, H.; Cai, W.; Feng, W.; Tang, M.; Zhou, N. The Total-Factor Energy Productivity Growth of China’s Construction Industry: Evidence from the Regional Level. Nat. Hazards 2018, 1–24. [Google Scholar] [CrossRef]
- Wei, Y.G.; Li, Y.; Wu, M.Y.; Li, Y.B. The Decomposition of Total-Factor CO2 Emission Efficiency of 97 Contracting Countries in Paris Agreement. Energy Econ. 2019, 78, 365–378. [Google Scholar] [CrossRef]
- Anselin, L. Spatial Econometrics: Methods and Models; Kluwer Academic Publishers: Dordrecht, The Netherlands, 1988. [Google Scholar]
- Lesage, J.; Pace, R.K. Introduction to Spatial Econometrics; CRC Press: New York, NY, USA, 2009. [Google Scholar]
- Chuai, X.W.; Huang, X.J.; Wang, W.J.; Wen, J.Q.; Chen, Q.; Peng, J.W. Spatial Econometric Analysis of Carbon Emissions from Energy Consumption in China. J. Geogr. Sci. 2012, 22, 630–642. Available online: https://link.springer.com/article/10.1007/s11442-012-0952-z (accessed on 25 July 2019). [CrossRef]
- Ma, D.L.; Chen, Z.C.; Wang, L. Spatial Econometrics Research on Inter-Provincial Carbon Emissions Efficiency in China. Renew. Sustain. Energy Rev. 2015, 25, 67–77. Available online: http://en.cnki.com.cn/Article_en/CJFDTotal-ZGRZ201501010.htm (accessed on 25 July 2019).
- Cheng, Y.Q.; Wang, Z.Y.; Ye, X.Y.; Wei, D. Spatiotemporal Dynamics of Carbon Intensity from Energy Consumption in China. J. Geogr. Sci. 2014, 24, 631–650. Available online: http://en.cnki.com.cn/Article_en/CJFDTotal-ZGDE201404004.htm (accessed on 25 July 2019). [CrossRef]
- Yi, T.; Tong, L.; Qiu, M.H.; Liu, J.P. Analysis of Driving Factors of Photovoltaic Power Generation Efficiency: A Case Study in China. Energies 2019, 12, 355. [Google Scholar] [CrossRef]
- Wang, Y.; Zhao, T.; Wang, J.A.; Guo, F.; Kan, X.; Yuan, R. Spatial Analysis on Carbon Emission Abatement Capacity at Provincial Level in China from 1997 to 2014: An Empirical Study Based on SDM Model. Atmos. Pollut. Res. 2019, 10, 97–104. [Google Scholar] [CrossRef]
- Shi, S.A.; Xia, L.; Meng, M. Energy Efficiency and Its Driving Factors in China’s Three Economic Regions. Sustainability 2017, 9, 2059. [Google Scholar] [CrossRef]
- Wang, S.J.; Ma, Y.Y. Influencing Factors and Regional Discrepancies of the Efficiency of Carbon Dioxide Emissions in Jiangsu, China. Ecol. Indic. 2018, 90, 460–468. [Google Scholar] [CrossRef]
- Gai, M.; Cao, G.Y.; Tian, C.S.; Ke, L.N. Decoupling Analysis of Energy Carbon Emissions and Regional Economic Growth in the Liaoning Coastal Economic Belt. Resour. Sci. 2014, 36, 1267–1277. Available online: http://www.cnki.com.cn/Article/CJFDTOTAL-ZRZY201406020.htm (accessed on 25 July 2019).
- Takakai, F.; Kobayashi, M.; Sato, T.; Yasuda, K.; Kaneta, Y. Effects of Forage Rice Cultivation on Carbon and Greenhouse Gas Balances in a Rice Paddy Field. Atmosphere 2018, 9, 504. [Google Scholar] [CrossRef]
- Goldsmith, R.M. A Perpetual Inventory of National Wealth. Stud. Income Wealth 1951, 14, 5–73. Available online: http://www.nber.org/books/unkn51-2 (accessed on 25 July 2019).
- Zhang, J.; Wu, G.Y.; Zhang, J.P. The Estimation of China’s Provincial Capital Stock: 1952–2000. Econ. Res. J. 2004, 10, 35–44. Available online: http://en.cnki.com.cn/Article_en/CJFDTOTAL-JJYJ200410004.htm (accessed on 25 July 2019).
- Zhao, Z.Y.; Yang, C.F. The Decomposition Analysis on the Driving Factors of China’s Carbon Emission. Chin. Soft Sci. 2012, 6, 175–183. Available online: http://en.cnki.com.cn/Article_en/CJFDTotal-SEJJ201106005.htm (accessed on 25 July 2019).
- Hu, Y.; Liu, J.F.; Hu, W.; Zhang, Z. Regional Variance, Trend Evolution and Factors of China’s Carbon Emission Intensity Based on 30 Provinces (cities and districts)’ 1997–2012 Panel Data. Resour. Dev. Mark. 2016, 18, 7–13. Available online: http://www.en.cnki.com.cn/Article_en/CJFDTotal-ZIYU201605002.htm (accessed on 25 July 2019).
- IPCC. Guidelines for National Greenhouse Gas Inventories; Cambridge University Press (IPCC Secretariat): Cambridge, UK, 2006. [Google Scholar]
- National Development and Reform Commission. Guidelines for Provincial Greenhouse Gas Inventories in China. Available online: http://www.tanjiaoyi.com/article-27200-1.html (accessed on 31 May 2019).
- Liu, J.P.; Ge, H.X.; Wang, Y.R.; Chen, J.Z.; Wang, H. Dynamic Evaluation of Carbon Emission Efficiency in China’s Provinces Based on Cross Efficiency DEA Model. Resour. Dev. Mark. 2017, 33, 1041–1057. Available online: http://www.en.cnki.com.cn/Article_en/CJFDTotal-ZTKB201709004.htm (accessed on July 2019).
- Tang, D.C.; Zhang, Y.; Bethel, B.J. An Analysis of Disparities and Driving Factors of Carbon Emissions in the Yangtze River Economic Belt. Sustainability 2019, 11, 2362. [Google Scholar] [CrossRef]
- Li, Y.M.; Zhang, L.; Cheng, X.L. A Decomposition Model and Reduction Approaches for Carbon Dioxide Emissions in China. Resour. Sci. 2010, 32, 218–222. Available online: http://en.cnki.com.cn/article_en/cjfdtotal-zrzy201002006.htm (accessed on 25 July 2019).
- Zhang, Y.J.; Liu, Z.; Zhang, H.; Tan, T.-D. The impact of Economic Growth, Industrial Structure and Urbanization on Carbon Emission Intensity in China. Nat. Hazards 2014, 73, 579–595. Available online: https://link.springer.com/article/10.1007/s11069-014-1091-x (accessed on 25 July 2019). [CrossRef]
- Cheng, Z.H.; Shi, X.A. Can Industrial Structural Adjustment Improve the Total-Factor Carbon Emission Performance in China? Int. J. Environ. Res. Public Health 2018, 15, 2291. [Google Scholar] [CrossRef]
- Lin, B.Q.; Chen, T.; Li, Y.Q.; Song, H.H.; Ma, Z.X. Research on the Effects of Urbanization on Carbon Emissions Efficiency of Urban Agglomerations in China. J. Clean. Prod. 2018, 197, 1374–1781. [Google Scholar] [CrossRef]
- Wang, S.; Liu, X.; Zhou, C.; Hu, J.; Ou, J. Examining the impacts of socioeconomic factors, urban form, and transportation networks on CO2 emissions in China’s megacities. Appl. Energy 2017, 185, 189–200. [Google Scholar] [CrossRef]
- Mi, Z.; Wei, Y.M.; Wang, B.; Meng, J.; Liu, Z.; Shan, Y.; Liu, J.; Guan, D. Socioeconomic impact assessment of China’s CO2 emissions peak prior to 2030. J. Clean. Prod. 2017, 142, 2227–2236. [Google Scholar] [CrossRef]
- Shui, B.; Harriss, R.C. The Role of CO2 Embodiment in US–China Trade. Energy Policy 2006, 34, 4063–4068. [Google Scholar] [CrossRef]
- Weber, C.L.; Peters, G.P.; Guan, D.; Hubacek, K. The Contribution of Chinese Exports to Climate Change. Energy Policy 2008, 9, 3572–3577. [Google Scholar] [CrossRef]
- Lee, J.W. The Contribution of Foreign Direct Investment to Clean Energy Use, Carbon Emissions and Economic Growth. Energy Policy 2013, 55, 483–489. [Google Scholar] [CrossRef]
- Pazienza, P. The impact of FDI in the OECD manufacturing sector on CO2 emission: Evidence and policy issues. Environ. Impact Assess. Rev. 2019, 77, 66–68. [Google Scholar] [CrossRef]
- Fan, B.; Zhang, Y.; Li, X.Z.; Miao, X. Trade Openness and Carbon Leakage: Empirical Evidence from China’s Industrial Sector. Energies 2019, 12, 1101. [Google Scholar] [CrossRef]
- Zhu, H.; Duan, L.; Guo, Y.; Yu, K. The effects of FDI, economic growth and energy consumption on carbon emissions in ASEAN-5: Evidence from panel quantile regression. Econ. Model. 2016, 58, 237–248. [Google Scholar] [CrossRef]
- Tamazian, A.; Chousa, J.P.; Vadlamannati, K.C. Does higher economic and financial development lead to environmental degradation: Evidence from BRIC countries. Energy Policy 2009, 37, 246–253. [Google Scholar] [CrossRef]
- Arik, L.; Taylor, M.S. Unmasking the Pollution Haven Effect. Int. Econ. Rev. 2008, 49, 223–254. [Google Scholar] [CrossRef]
- Zhou, Y.; Fu, J.T.; Kong, Y.; Wu, R. How Foreign Direct Investment Influences Carbon Emissions, Based on the Empirical Analysis of Chinese Urban Data. Sustainability 2018, 10, 2163. [Google Scholar] [CrossRef]
- Liu, N.; Ma, Z.J.; Kang, J.D. Changes in Carbon Intensity in China’s Industrial Sector: Decomposition and Attribution Analysis. Energy Policy 2015, 87, 28–38. [Google Scholar] [CrossRef]
- Fan, F.Y.; Lei, Y.L. Decomposition Analysis of Energy-Related Carbon Emissions from the Transportation Sector in Beijing. Transp. Res. Part D Transp. Environ. 2016, 42, 135–145. [Google Scholar] [CrossRef]
- Shuai, C.Y.; Chen, X.; Wu, Y. Identifying the key Impact Factors of Carbon Emission in China. Results from a Largely Expanded Pool of Potential Impact Factors. J. Clean. Prod. 2018, 175, 612–623. [Google Scholar] [CrossRef]
- Meng, B.; Xue, J.; Feng, K.; Guan, D.; Fu, X. China’s inter-regional spillover of carbon emissions and domestic supply chains. Energy Policy 2013, 61, 1305–1321. [Google Scholar] [CrossRef]
- Fan, T.; Luo, R.; Fan, Y.; Zhang, L.; Chang, X. Study on Influence Factors for carbon Dioxide Emissions in China’s Chemical Industry with LMDI Method. China Soft Sci. 2013, 3, 166–174. Available online: http://en.cnki.com.cn/Article_en/CJFDTotal-ZGRK201303016.htm (accessed on 25 July 2019).
- Zhang, P.Y.; He, J.J.; Hong, X.; Zhang, W.; Qin, C.Z.; Pang, B.; Li, Y.Y.; Liu, Y. Regional-Level Carbon Emissions Modelling and Scenario Analysis: A STIRPAT Case Study in Henan Province, China. Sustainability 2017, 9, 2342. [Google Scholar] [CrossRef]
- Zhu, C.Z.; Gao, D.W. A Research on the Factors Influencing Carbon Emission of Transportation Industry in “the Belt and Road Initiative” Countries Based on Panel Data. Energies 2019, 12, 2405. [Google Scholar] [CrossRef]
- Liu, W.D.; Xu, X.M.; Niu, D.X. Research on the Impact of Technology Import and Technology Innovation on the Peak of Carbon Emissions in China. Technol. Econ. Manag. Res. 2016, 9, 3–9. Available online: http://www.en.cnki.com.cn/Article_en/CJFDTOTAL-JXJG201609001.htm (accessed on 25 July 2019).
- Liu, S.; Xia, X.H.; Chen, X.Y. Assessing Urban Carbon Emission Efficiency in China: Based on the Global Data Envelopment Analysis. Energy Procedia 2018, 152, 762–767. [Google Scholar] [CrossRef]
- Gu, A.; Zhang, Y.; Pan, B.L. Relationship between Industrial Water Use and Economic Growth in China: Insights from an Environmental Kuznets Curve. Water 2017, 9, 556. [Google Scholar] [CrossRef]
- Levin, A.; Lin, C.; Chu, C. Unit Root Tests in Panel Data: Asymptotic and Finite Sample Properties. J. Econom. 2002, 108, 1–24. Available online: https://www.sciencedirect.com/science/article/pii/S0304407601000987 (accessed on 25 July 2019). [CrossRef]
- Im, K.S.; Pesaran, M.H.; Shin, Y.C. Testing for Unit Roots in Heterogeneous Panels. J. Econ. 2003, 115, 53–74. [Google Scholar] [CrossRef]
- Dickey, D.A.; Fuller, W.A. Distribution of the Estimators for Autoregressive Time Series with A Unit Root. J. Am. Stat. Assoc. 1979, 366, 427–431. [Google Scholar] [CrossRef]
- Phillips, P.C.B.; Perron, P. Testing for A Unit Root in Time Series Regression. Biometrika 1988, 75, 335–346. [Google Scholar] [CrossRef]
- Pedroni, P. Critical Values for Cointegration Tests in Het-erogeneous Panels with Multiple Regressors. Oxf. Bull. Econ. Stat. 1999, 61, 653–670. Available online: https://www.scirp.org/reference/ReferencesPapers.aspx?ReferenceID=2340557 (accessed on 25 July 2019). [CrossRef]
- Du, K.; Zou, C.Y. Regional Disparity, Affecting Factors and Convergence Analysis of Carbon Dioxide Emission Efficiency in China: On Stochastic Frontier Model and Panel Unit Root. Zhejiang Soc. Sci. 2011, 11, 32–43+156. Available online: http://en.cnki.com.cn/Article_en/CJFDTotal-ZJSH201111007.htm (accessed on 25 July 2019).
- Zhu, D.J.; Du, K.R. Foreign Trade, Economic Growth and the Efficiency of Carbon Emission in China. J. Shanxi Financ. Econ. Univ. 2013, 35, 1–11. Available online: http://en.cnki.com.cn/Article_en/CJFDTOTAL-SXCJ201305000.htm (accessed on 25 July 2019).
- Perkins, R.; Neumayer, E. Transnational Linkages and the Spillover of Environment-Efficiency into Developing Countries. Glob. Environ. Chang. 2009, 19, 375–383. [Google Scholar] [CrossRef]
- Wang, Z.X.; Ye, D.J.; Zheng, H.H.; Lv, C.Y. The Influence of Market Reform on the CO2 Emission Efficiency of China. J. Clean. Prod. 2019, 225, 236–247. [Google Scholar] [CrossRef]


| Fuel Type | Coal | Coke | Gasoline | Kerosene | Diesel | Fuel Oil | Natural Gas |
|---|---|---|---|---|---|---|---|
| ALCV (kj/kg) | 20,908 | 28,435 | 43,070 | 43,070 | 42,652 | 41,816 | 38,931 |
| CCF (kg/Tj) | 95,333 | 107,000 | 70,000 | 71,500 | 74,100 | 77,400 | 56,100 |
| COF(%) | 92.30 | 92.80 | 98.60 | 98.00 | 98.20 | 98.50 | 99.00 |
| Indicator Type | Primary Indicators | Secondary Indicators |
|---|---|---|
| Input indicator | Capital | Capital stock (unit: 100 million yuan) |
| Labor | Total number of employees in three industries (unit: 10,000) | |
| Energy | Total energy consumption (unit: 10,000 tons of standard coal) | |
| Output indicator | Desired outcomes | GDP (unit: 100 million yuan) |
| Undesired outcomes | CO2 (emissions unit: 104 tons) |
| Regions | 2005 | 2006 | 2007 | 2008 | 2009 | 2010 |
| Beijing | 1 | 1 | 1 | 1 | 1 | 1 |
| Tianjing | 0.8580 | 0.8276 | 0.8165 | 0.8083 | 0.7897 | 0.8050 |
| Hebei | 0.6260 | 0.5545 | 0.5517 | 0.5337 | 0.5415 | 0.5603 |
| Shanxi | 0.5719 | 0.4794 | 0.4806 | 0.4601 | 0.4598 | 0.4779 |
| Inner Mongoria | 0.4858 | 0.4605 | 0.4672 | 0.4620 | 0.4814 | 0.4984 |
| Liaoning | 0.6123 | 0.5778 | 0.5754 | 0.5572 | 0.5723 | 0.6046 |
| Jilin | 0.6085 | 0.5731 | 0.5716 | 0.5452 | 0.5433 | 0.5535 |
| Heilongjiang | 1 | 1 | 0.6864 | 0.6563 | 0.6715 | 0.6919 |
| Shanghai | 1 | 1 | 1 | 1 | 1 | 1 |
| Jiangsu | 0.8052 | 0.7765 | 0.7710 | 0.7304 | 0.7319 | 0.7546 |
| Zhejiang | 0.8400 | 0.8029 | 0.7874 | 0.7423 | 0.7319 | 0.7622 |
| Anhui | 0.6770 | 0.6056 | 0.5962 | 0.5601 | 0.5706 | 0.6024 |
| Fujian | 0.8219 | 0.8044 | 0.7919 | 0.7459 | 0.7278 | 0.7585 |
| Jiangxi | 0.6771 | 0.6282 | 0.6195 | 0.5953 | 0.6026 | 0.6220 |
| Shandong | 0.6444 | 0.6208 | 0.6235 | 0.6001 | 0.6118 | 0.6368 |
| Henan | 0.6553 | 0.5852 | 0.5763 | 0.5504 | 0.5511 | 0.5567 |
| Hubei | 0.6484 | 0.5766 | 0.5726 | 0.5622 | 0.5852 | 0.6069 |
| Hunan | 0.7000 | 0.6077 | 0.6006 | 0.5779 | 0.6019 | 0.6287 |
| Guangdong | 1 | 1 | 1 | 1 | 1 | 1 |
| Guangxi | 0.6613 | 0.6081 | 0.5975 | 0.5725 | 0.5704 | 0.5569 |
| Hainan | 0.8204 | 0.7686 | 0.7502 | 0.6841 | 0.6761 | 0.6974 |
| Chongqing | 0.5854 | 0.5670 | 0.5732 | 0.5586 | 0.5835 | 0.6178 |
| Sichuan | 0.6362 | 0.5655 | 0.5582 | 0.5243 | 0.5494 | 0.5835 |
| Guizhou | 0.4972 | 0.4089 | 0.4082 | 0.3868 | 0.4142 | 0.4466 |
| Yunnan | 0.5873 | 0.5052 | 0.5011 | 0.4786 | 0.4940 | 0.5027 |
| Shaanxi | 0.5993 | 0.5480 | 0.5409 | 0.5290 | 0.5323 | 0.5355 |
| Gansu | 0.5664 | 0.4806 | 0.4731 | 0.4477 | 0.4767 | 0.4989 |
| Qinghai | 0.4256 | 0.3845 | 0.3809 | 0.3790 | 0.3951 | 0.4160 |
| Ningxia | 0.3693 | 0.3311 | 0.3308 | 0.3260 | 0.3386 | 0.3469 |
| Xinjiang | 0.5726 | 0.5192 | 0.5147 | 0.4922 | 0.5005 | 0.5093 |
| East | 0.8207 | 0.7939 | 0.7880 | 0.7638 | 0.7621 | 0.7799 |
| Central | 0.6923 | 0.5944 | 0.5880 | 0.5634 | 0.5732 | 0.5925 |
| West | 0.5442 | 0.4890 | 0.4860 | 0.4688 | 0.4851 | 0.5011 |
| China | 0.6851 | 0.6289 | 0.6239 | 0.6022 | 0.6102 | 0.6277 |
| Regions | 2011 | 2012 | 2013 | 2014 | 2015 | mean |
| Beijing | 1 | 1 | 1 | 1 | 1 | 1 |
| Tianjing | 0.8087 | 0.8000 | 1 | 1 | 1 | 0.8649 |
| Hebei | 0.5603 | 0.5382 | 0.5798 | 0.5586 | 0.5424 | 0.5588 |
| Shanxi | 0.4802 | 0.4593 | 0.4966 | 0.4662 | 0.4388 | 0.4792 |
| Inner Mongoria | 0.4883 | 0.4595 | 0.5063 | 0.4819 | 0.4820 | 0.4794 |
| Liaoning | 0.6010 | 0.5680 | 0.6081 | 0.5759 | 0.5701 | 0.5839 |
| Jilin | 0.5435 | 0.5301 | 0.5561 | 0.5343 | 0.5255 | 0.5532 |
| Heilongjiang | 0.6986 | 0.6601 | 0.7093 | 0.6697 | 0.6368 | 0.7073 |
| Shanghai | 1 | 1 | 1 | 1 | 1 | 1 |
| Jiangsu | 0.7330 | 0.7153 | 0.7750 | 0.7736 | 0.7674 | 0.7576 |
| Zhejiang | 0.7442 | 0.7295 | 0.7812 | 0.7761 | 0.7650 | 0.7693 |
| Anhui | 0.6139 | 0.5903 | 0.6330 | 0.6256 | 0.6018 | 0.6070 |
| Fujian | 0.7281 | 0.7029 | 0.7603 | 0.7390 | 0.7198 | 0.7546 |
| Jiangxi | 0.6264 | 0.6109 | 0.6444 | 0.6458 | 0.6302 | 0.6275 |
| Shandong | 0.6397 | 0.6138 | 0.6782 | 0.6527 | 0.6350 | 0.6324 |
| Henan | 0.5528 | 0.5414 | 0.5619 | 0.5407 | 0.5243 | 0.5633 |
| Hubei | 0.6153 | 0.5970 | 0.6525 | 0.6353 | 0.6178 | 0.6063 |
| Hunan | 0.6386 | 0.6200 | 0.6654 | 0.6523 | 0.6337 | 0.6297 |
| Guangdong | 1 | 1 | 1 | 1 | 1 | 1 |
| Guangxi | 0.5397 | 0.5117 | 0.5327 | 0.5195 | 0.5077 | 0.5616 |
| Hainan | 0.6644 | 0.6078 | 0.6229 | 0.5868 | 0.5600 | 0.6762 |
| Chongqing | 0.6405 | 0.6290 | 0.7162 | 0.6967 | 0.6913 | 0.6236 |
| Sichuan | 0.6162 | 0.6067 | 0.6528 | 0.6438 | 0.6328 | 0.5972 |
| Guizhou | 0.4655 | 0.4451 | 0.4845 | 0.4717 | 0.4447 | 0.4430 |
| Yunnan | 0.5013 | 0.4750 | 0.5008 | 0.4775 | 0.4559 | 0.4981 |
| Shaanxi | 0.5367 | 0.5156 | 0.5468 | 0.5237 | 0.5192 | 0.5388 |
| Gansu | 0.5112 | 0.4952 | 0.5381 | 0.5266 | 0.5033 | 0.5016 |
| Qinghai | 0.4163 | 0.3889 | 0.3923 | 0.3582 | 0.3352 | 0.3884 |
| Ningxia | 0.3430 | 0.3284 | 0.3478 | 0.3203 | 0.2973 | 0.3345 |
| Xinjiang | 0.5035 | 0.4655 | 0.4852 | 0.4478 | 0.4218 | 0.4938 |
| East | 0.7709 | 0.7523 | 0.8005 | 0.7875 | 0.7782 | 0.7816 |
| Central | 0.5962 | 0.5761 | 0.6149 | 0.5962 | 0.5761 | 0.5967 |
| West | 0.5057 | 0.4837 | 0.5185 | 0.4971 | 0.4810 | 0.4964 |
| China | 0.6270 | 0.6068 | 0.6476 | 0.6300 | 0.6153 | 0.6277 |
| Regions | Provinces | Value | Regions | Provinces | Value |
|---|---|---|---|---|---|
| Northern coast | Beijing | 1 | Middle Yellow River | Shanxi | 0.4792 |
| Tianjin | 0.8649 | Inner Mongolia | 0.4794 | ||
| Hebei | 0.5588 | ||||
| Shandong | 0.6324 | Henan | 0.5633 | ||
| mean | 0.7640 | Shaanxi | 0.5388 | ||
| Mean | 0.5152 | ||||
| Eastern coast | Shanghai | 1 | Middle Yangtze River | Anhui | 0.6070 |
| Jiangsu | 0.7576 | Jiangxi | 0.6275 | ||
| Zhejiang | 0.7693 | Hubei | 0.6063 | ||
| mean | 0.8423 | Hunan | 0.6297 | ||
| Mean | 0.6176 | ||||
| Southern coast | Fujian | 0.7546 | Southwest | Guangxi | 0.5616 |
| Guangdong | 1 | Chongqing | 0.6236 | ||
| Hainan | 0.6762 | Sichuan | 0.5972 | ||
| mean | 0.8103 | Guizhou | 0.4430 | ||
| Yunnan | 0.4981 | ||||
| Mean | 0.5447 | ||||
| Northeast | Liaoning | 0.5839 | Northwest | Ningxia | 0.5016 |
| Jilin | 0.5532 | Gansu | 0.3884 | ||
| Heilongjiang | 0.7073 | Qinghai | 0.3345 | ||
| mean | 0.6148 | Xinjiang | 0.4938 | ||
| Mean | 0.4296 |
| Explanatory Variable | Variables’ Definition and Unit | Prejudgment | Key References |
|---|---|---|---|
| Government intervention in the economy (GIE) | The proportion of the local financial expenditure to GDP (%) | Unknown | [6,11] |
| Industrial structure (IS) | The proportion of the local added value of the tertiary industry to GDP (%) | Positive | [66,67,68,69,70,71] |
| Foreign trade level (FTL) | The proportion of the local import and export trade to GDP (%) | Unknown | [11,72,73] |
| Foreign capital utilization level (FCUL) | The proportion of the local foreign direct investment to GDP (%) | Unknown | [74,75,76,77,78,79,80] |
| Energy intensity (EI) | 10,000 yuan GDP standard coal consumption (yuan/tons of standard coal) | Negative | [81,82,83,84,85] |
| Science and technology level (STL) | The proportion of the local R&D expenditure to GDP (%) | Positive | [11,53,86,87,88,89] |
| LLC | IPS | Fisher-ADF | PP-ADF | |
|---|---|---|---|---|
| CEE | −13.9912 *** | −8.15403 *** | 155.223 *** | 202.149 *** |
| GIE | −1.15188 | 4.99367 | 20.0210 | 36.1092 |
| IS | 6.28823 | 7.88391 | 21.5548 | 19.3982 |
| FTL | −2.48395 *** | 1.40910 | 41.2505 | 44.3308 |
| FCUL | −7.04262 *** | −2.20561 ** | 88.6931 *** | 150.166 *** |
| EI | −2.24391 *** | 4.94331 | 26.1251 | 37.3777 |
| STL | −2.86846 *** | 1.52624 | 48.4451 | 77.5646 * |
| △CEE | −19.0895 *** | −11.2225 *** | 221.242 *** | 371.516 *** |
| △GIE | −11.0323 *** | −6.73075 *** | 155.873 *** | 190.270 *** |
| △IS | −5.75004 *** | −1.35639 * | 78.7522 * | 101.827 *** |
| △FTL | −12.2580 *** | −5.97896 *** | 150.454 *** | 208.309 *** |
| △FCUL | −11.9671 *** | −5.06193 *** | 133.507 *** | 156.930 *** |
| △EI | −15.1595 *** | −9.84822 *** | 205.206 *** | 242.850 *** |
| △STL | −14.9755 *** | −8.24486 *** | 187.069 *** | 244.140 *** |
| Panel-V-Stat | Panel-Rho-Stat | Panel-PP-Stat | Panel-ADF-Stat | |
|---|---|---|---|---|
| within-dimension | −1694.92 | 4.901894 | −15.11433 *** | −2.657887 *** |
| between-dimension | 7.692484 | −22.66525 *** | −2.098071 *** |
| Variable | Coefficient | Std. Err. | Z-Statistic | P > |z| | [95% Conf. Interval] | |
|---|---|---|---|---|---|---|
| DGI | −0.461083 *** | 0.0585006 | −7.88 | 0.000 | −0.5757416 | −0.3464233 |
| IS | 0.0076522 | 0.0836948 | 0.09 | 0.927 | −0.1563865 | 0.171691 |
| FTL | 0.0881033 *** | 0.0230223 | 3.83 | 0.000 | 0.0429804 | 0.1332263 |
| FCUL | 0.8143128 *** | 0.236718 | 3.44 | 0.000 | 0.350354 | 6.832712 |
| EI | −0.043391 *** | 0.0110785 | −3.92 | 0.003 | −0.0651047 | −0.0216776 |
| STL | 4.95859 *** | 0.9562014 | 5.19 | 0.003 | 3.084472 | 6.629005 |
© 2019 by the authors. Licensee MDPI, Basel, Switzerland. This article is an open access article distributed under the terms and conditions of the Creative Commons Attribution (CC BY) license (http://creativecommons.org/licenses/by/4.0/).
Share and Cite
Zeng, L.; Lu, H.; Liu, Y.; Zhou, Y.; Hu, H. Analysis of Regional Differences and Influencing Factors on China’s Carbon Emission Efficiency in 2005–2015. Energies 2019, 12, 3081. https://doi.org/10.3390/en12163081
Zeng L, Lu H, Liu Y, Zhou Y, Hu H. Analysis of Regional Differences and Influencing Factors on China’s Carbon Emission Efficiency in 2005–2015. Energies. 2019; 12(16):3081. https://doi.org/10.3390/en12163081
Chicago/Turabian StyleZeng, Liangen, Haiyan Lu, Yenping Liu, Yang Zhou, and Haoyu Hu. 2019. "Analysis of Regional Differences and Influencing Factors on China’s Carbon Emission Efficiency in 2005–2015" Energies 12, no. 16: 3081. https://doi.org/10.3390/en12163081
APA StyleZeng, L., Lu, H., Liu, Y., Zhou, Y., & Hu, H. (2019). Analysis of Regional Differences and Influencing Factors on China’s Carbon Emission Efficiency in 2005–2015. Energies, 12(16), 3081. https://doi.org/10.3390/en12163081