Apparent Viscosity Prediction of Water-Based Muds Using Empirical Correlation and an Artificial Neural Network


Abstract
1. Introduction
2. Artificial Neural Network
3. Experimental Measurements
3.1. Drilling Mud Preparation
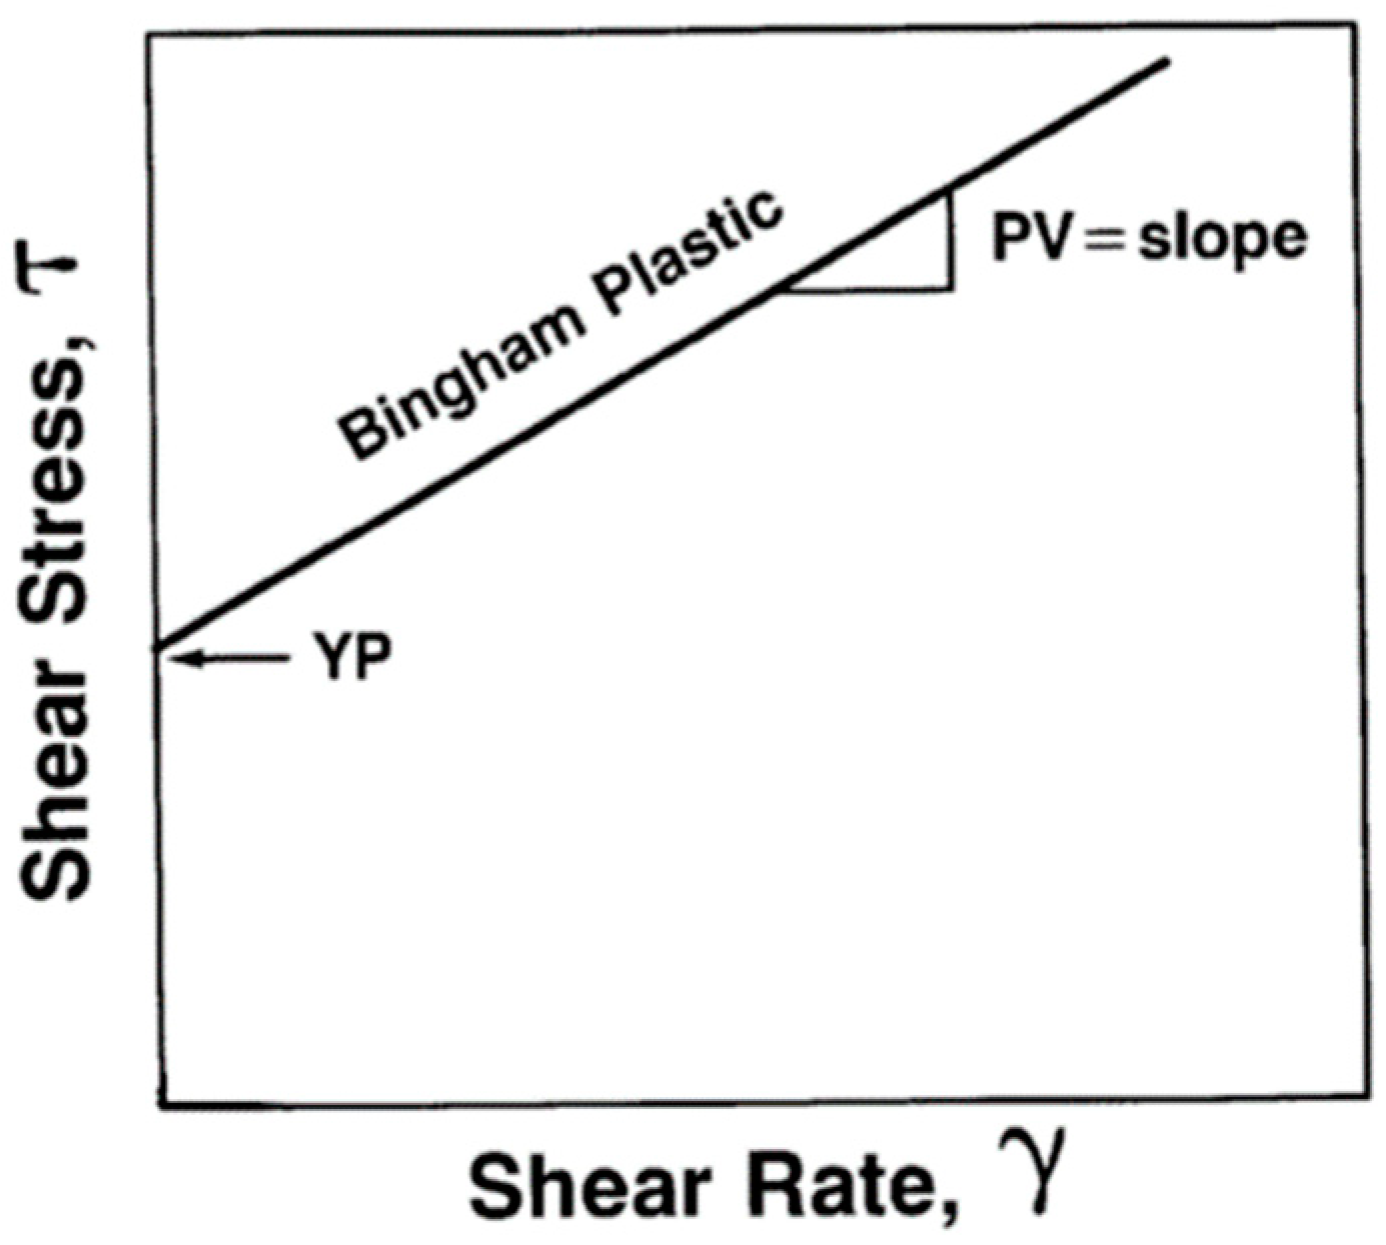
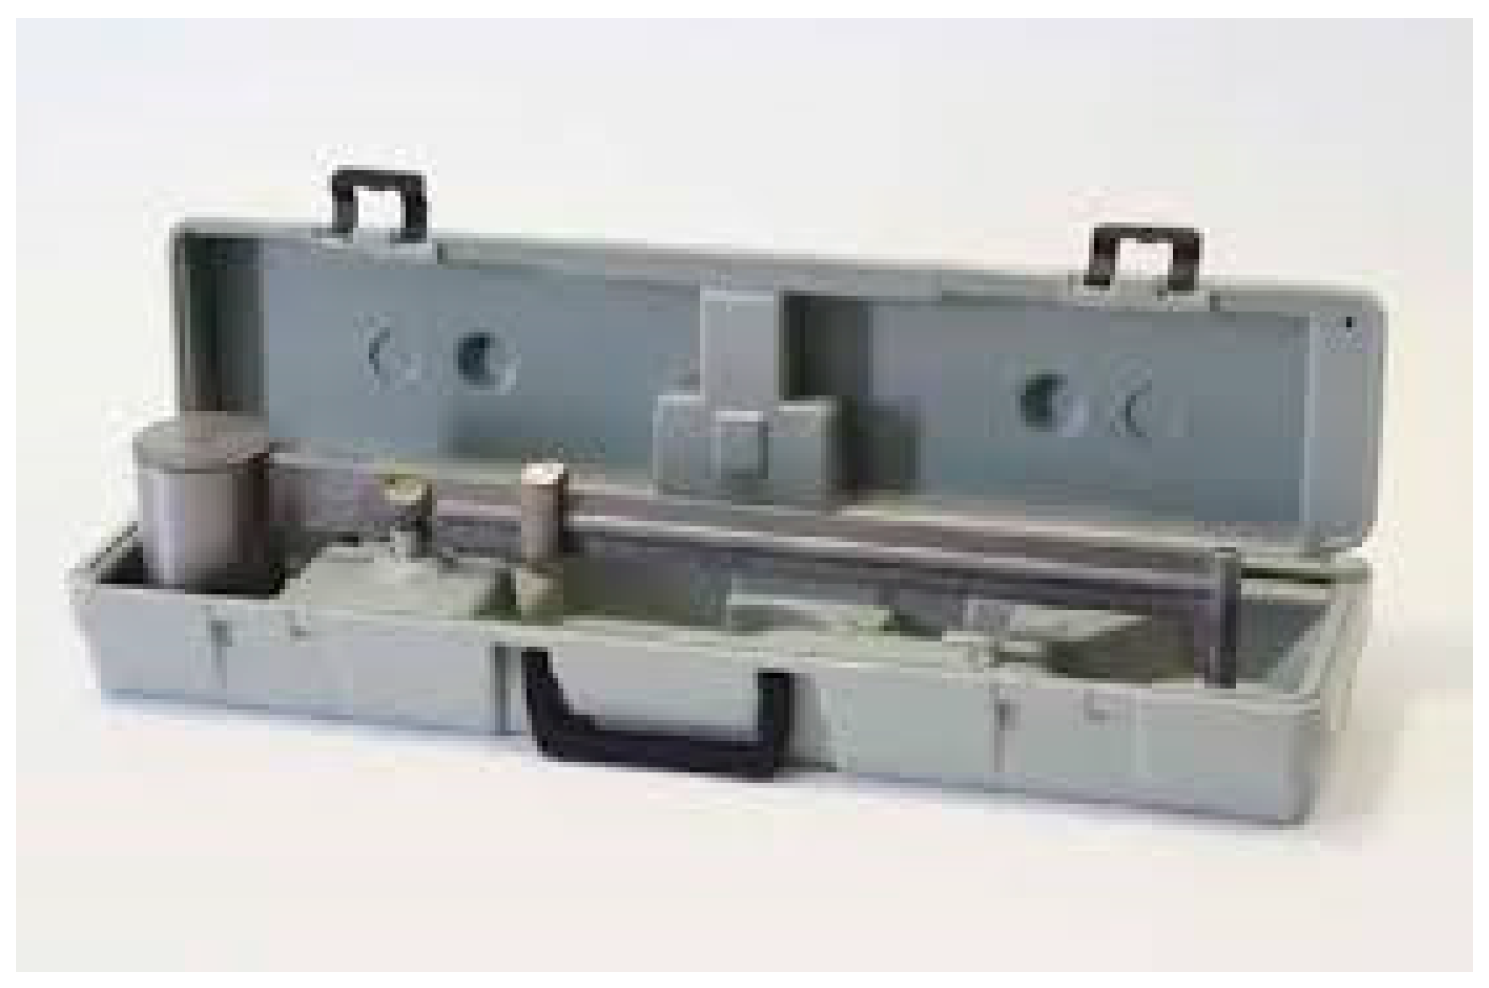
3.2. Apparent Viscosity Measurement
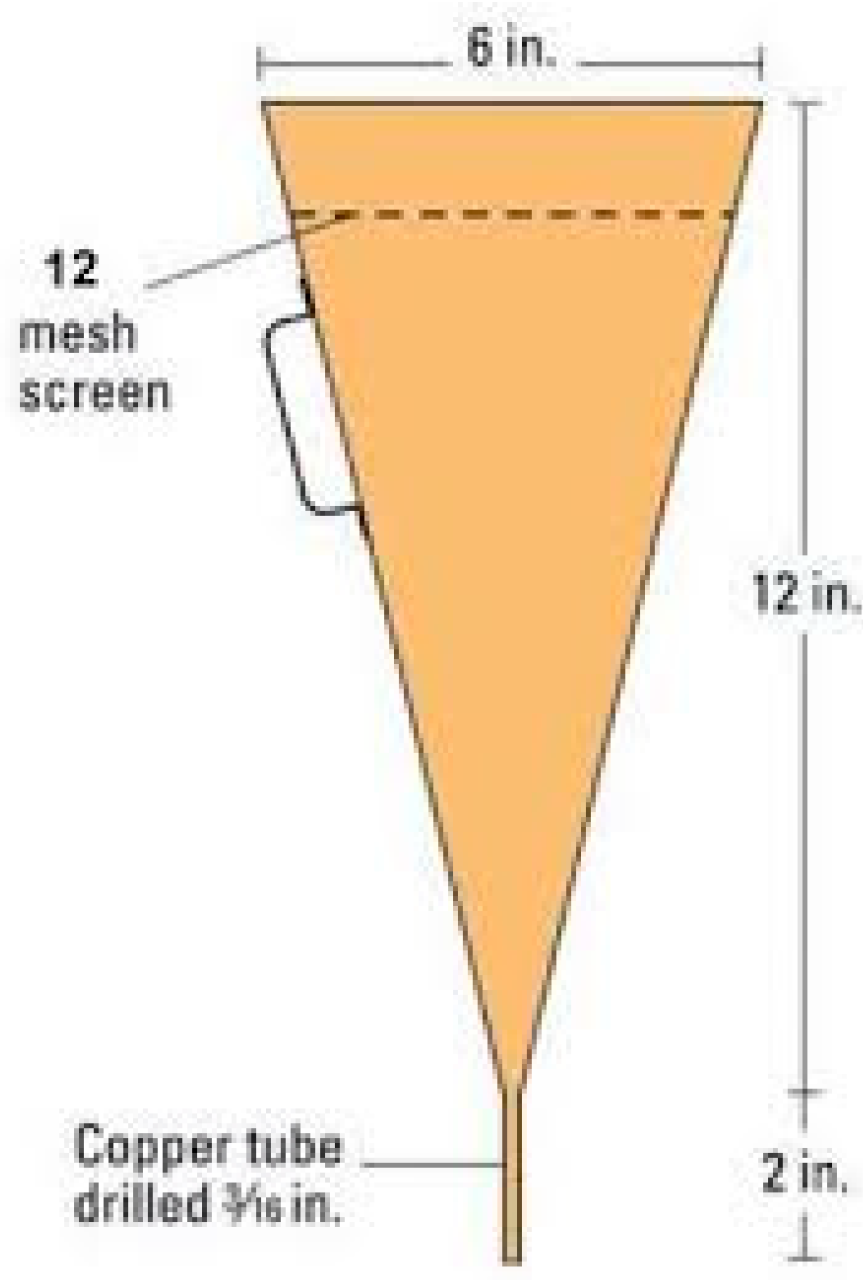
3.3. Marsh Funnel Viscosity Measurement
3.4. Mud Weight Measurement
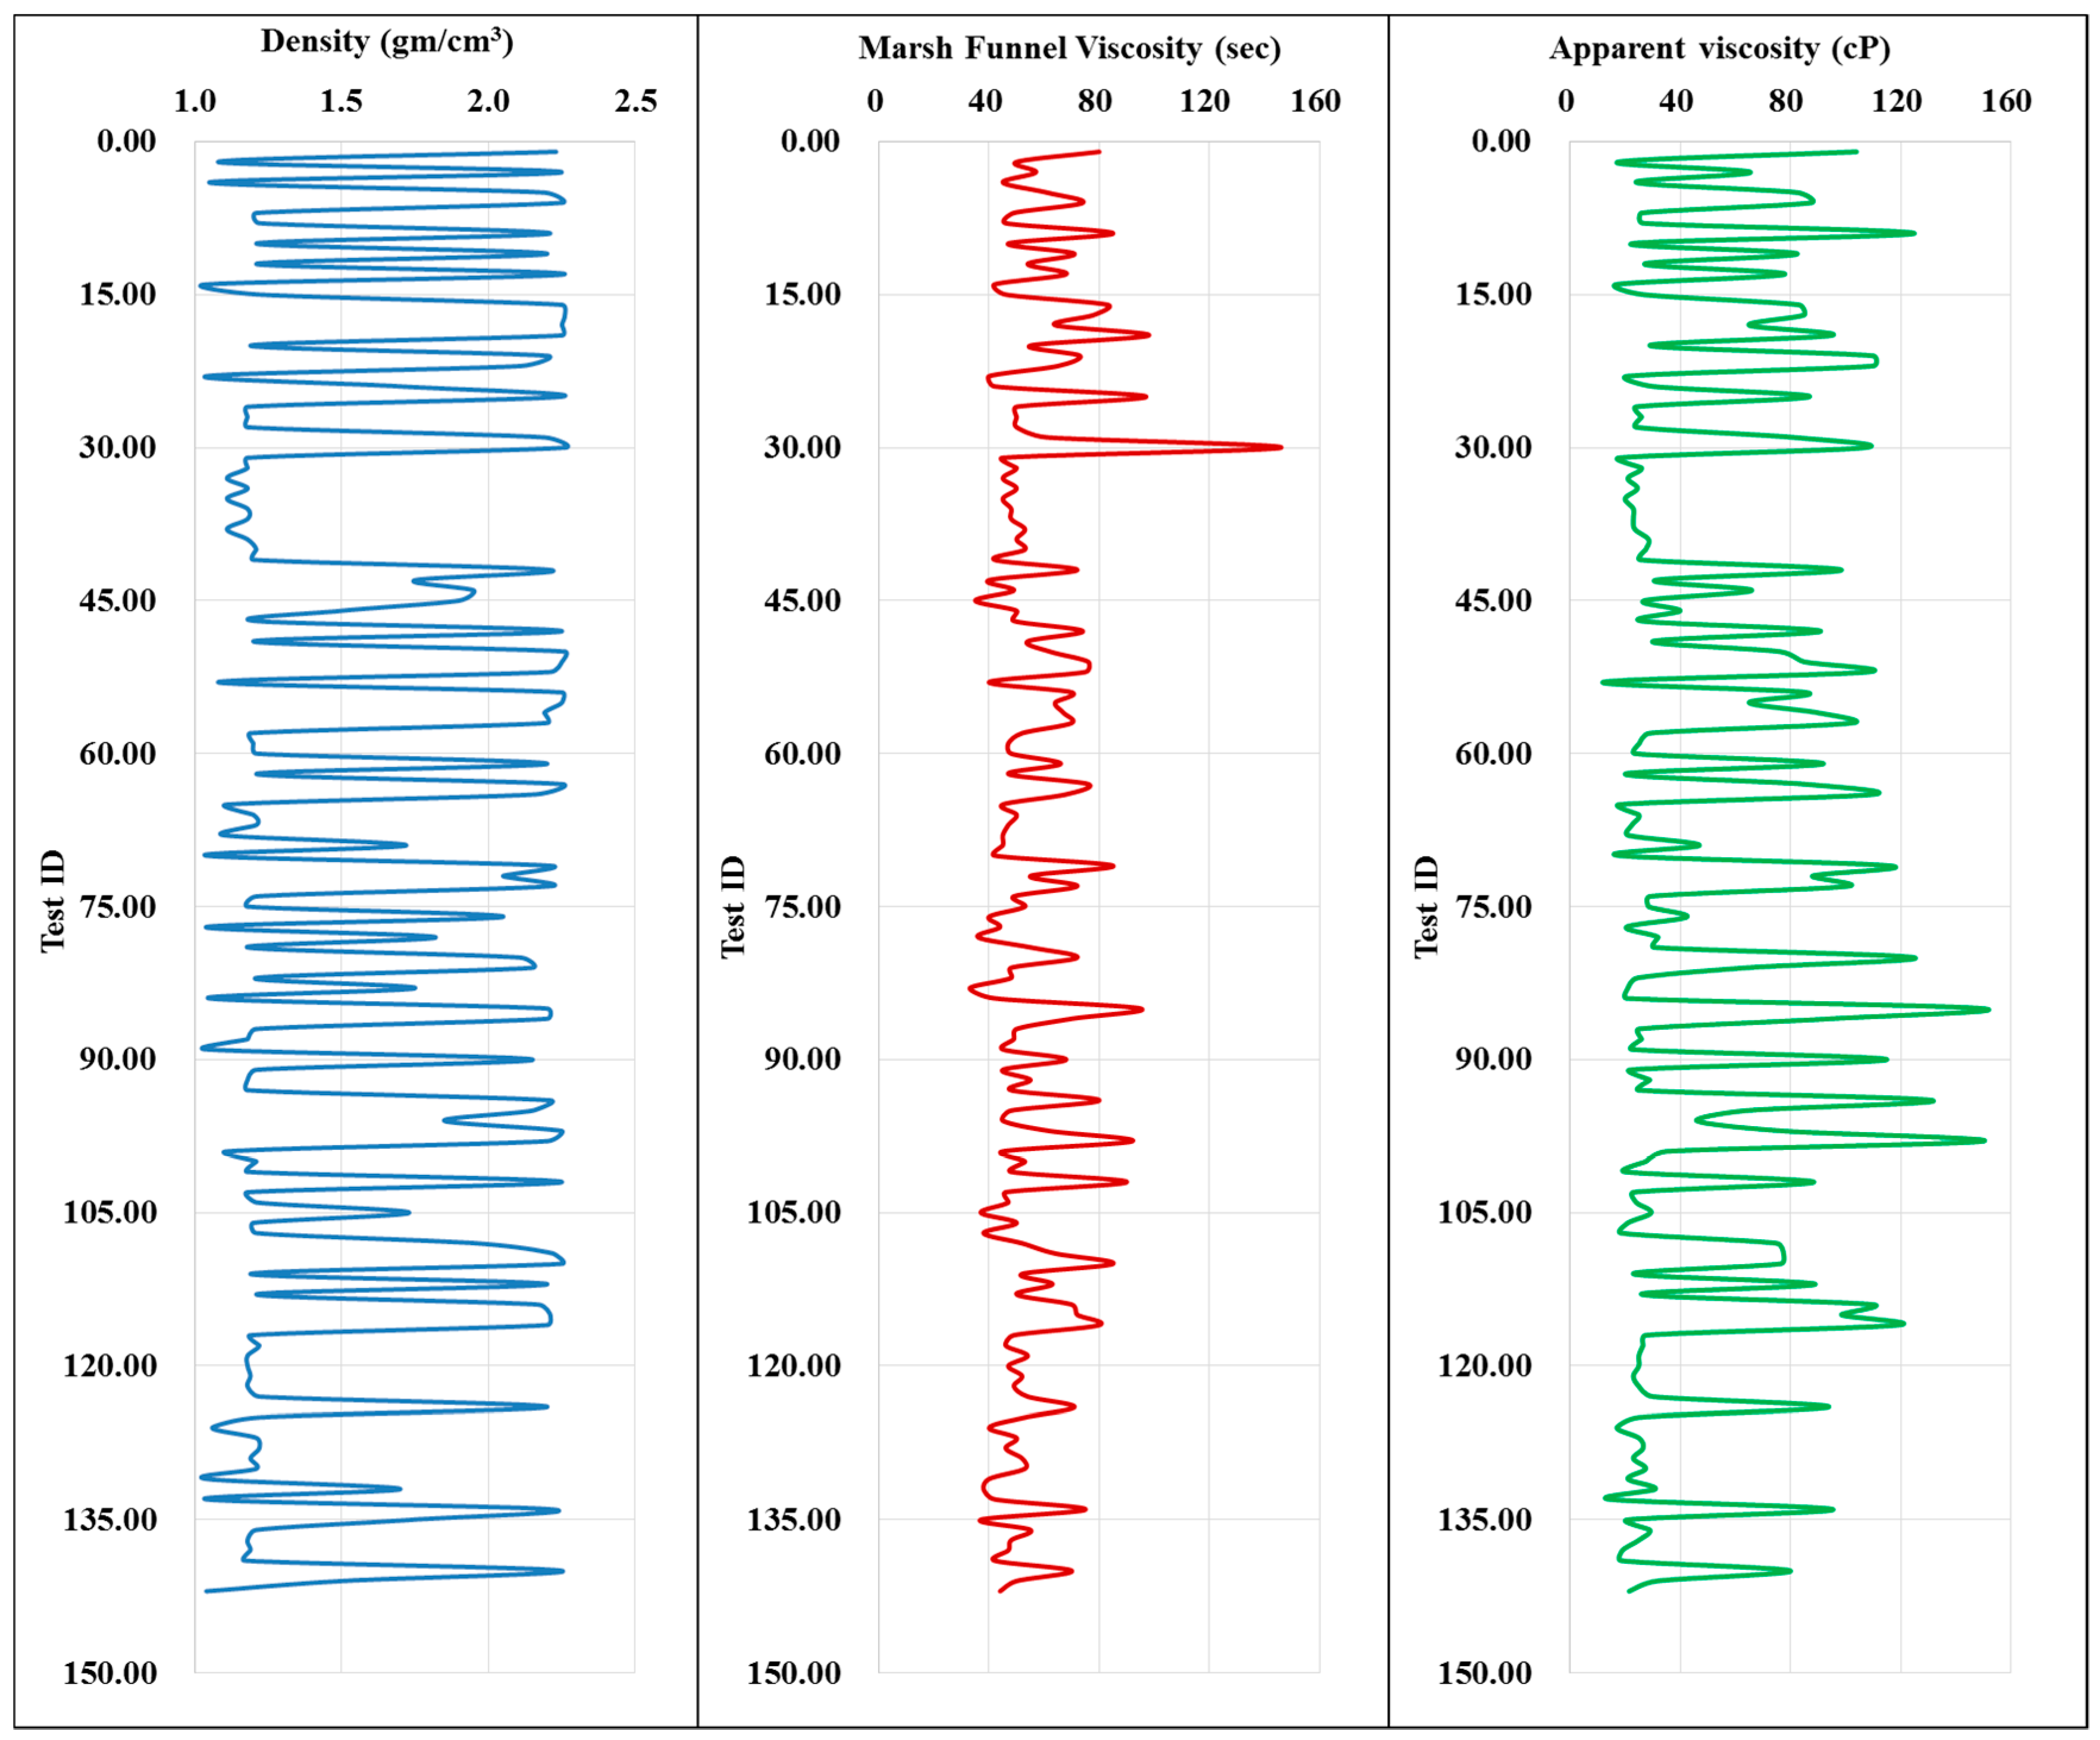
4. Result and Discussion
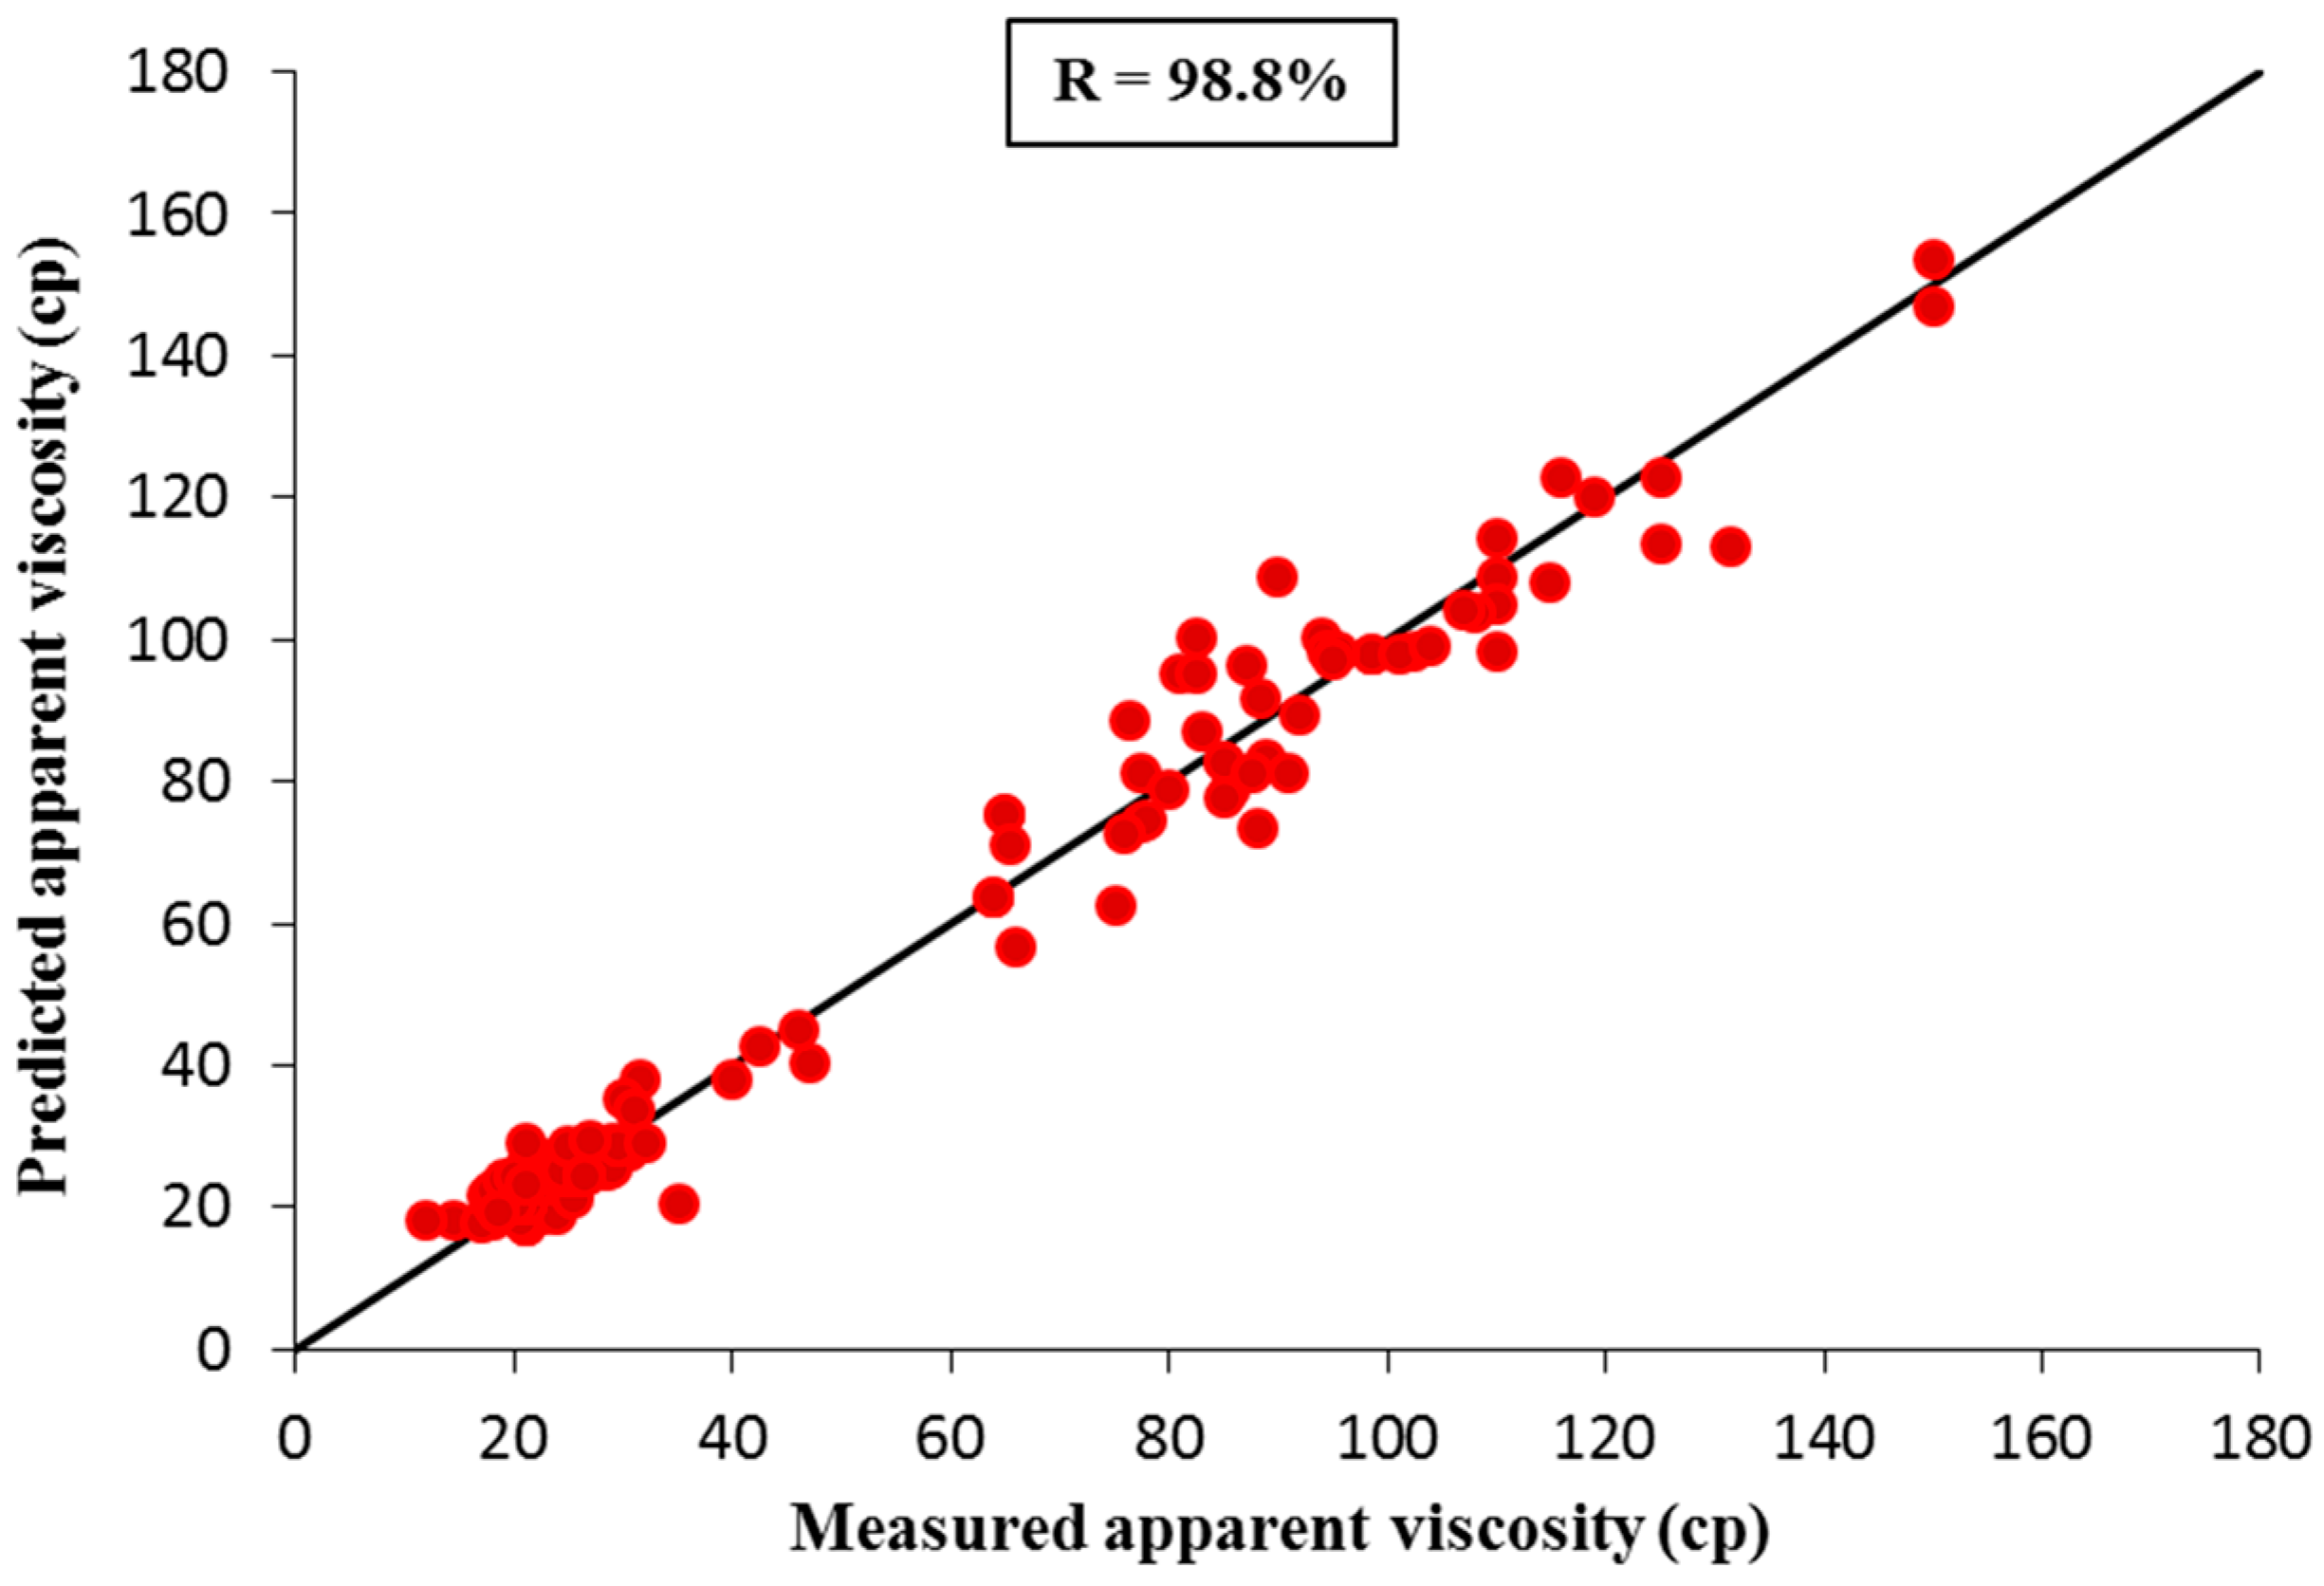
4.1. Development of New Empirical Correlation
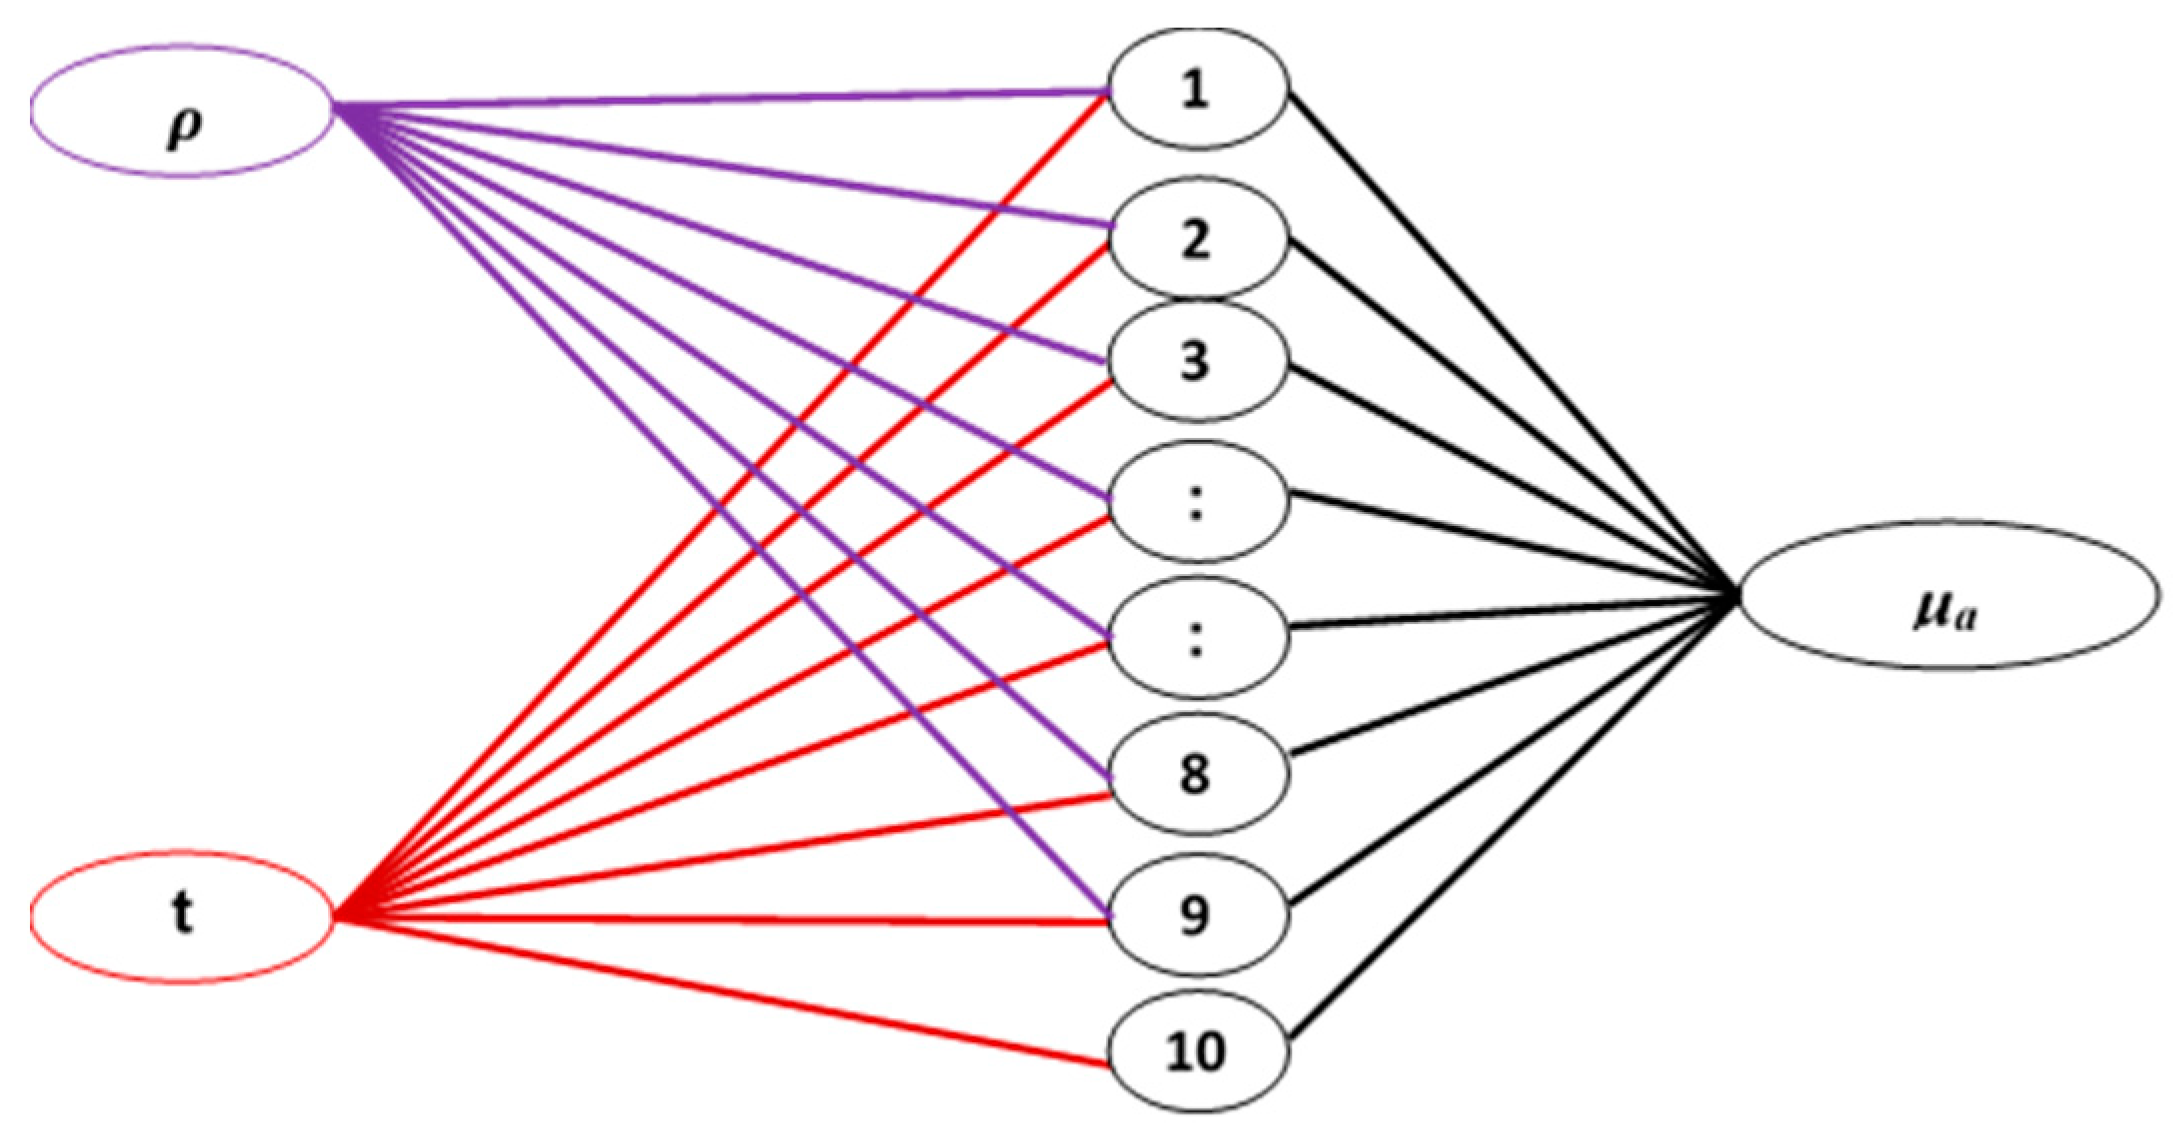
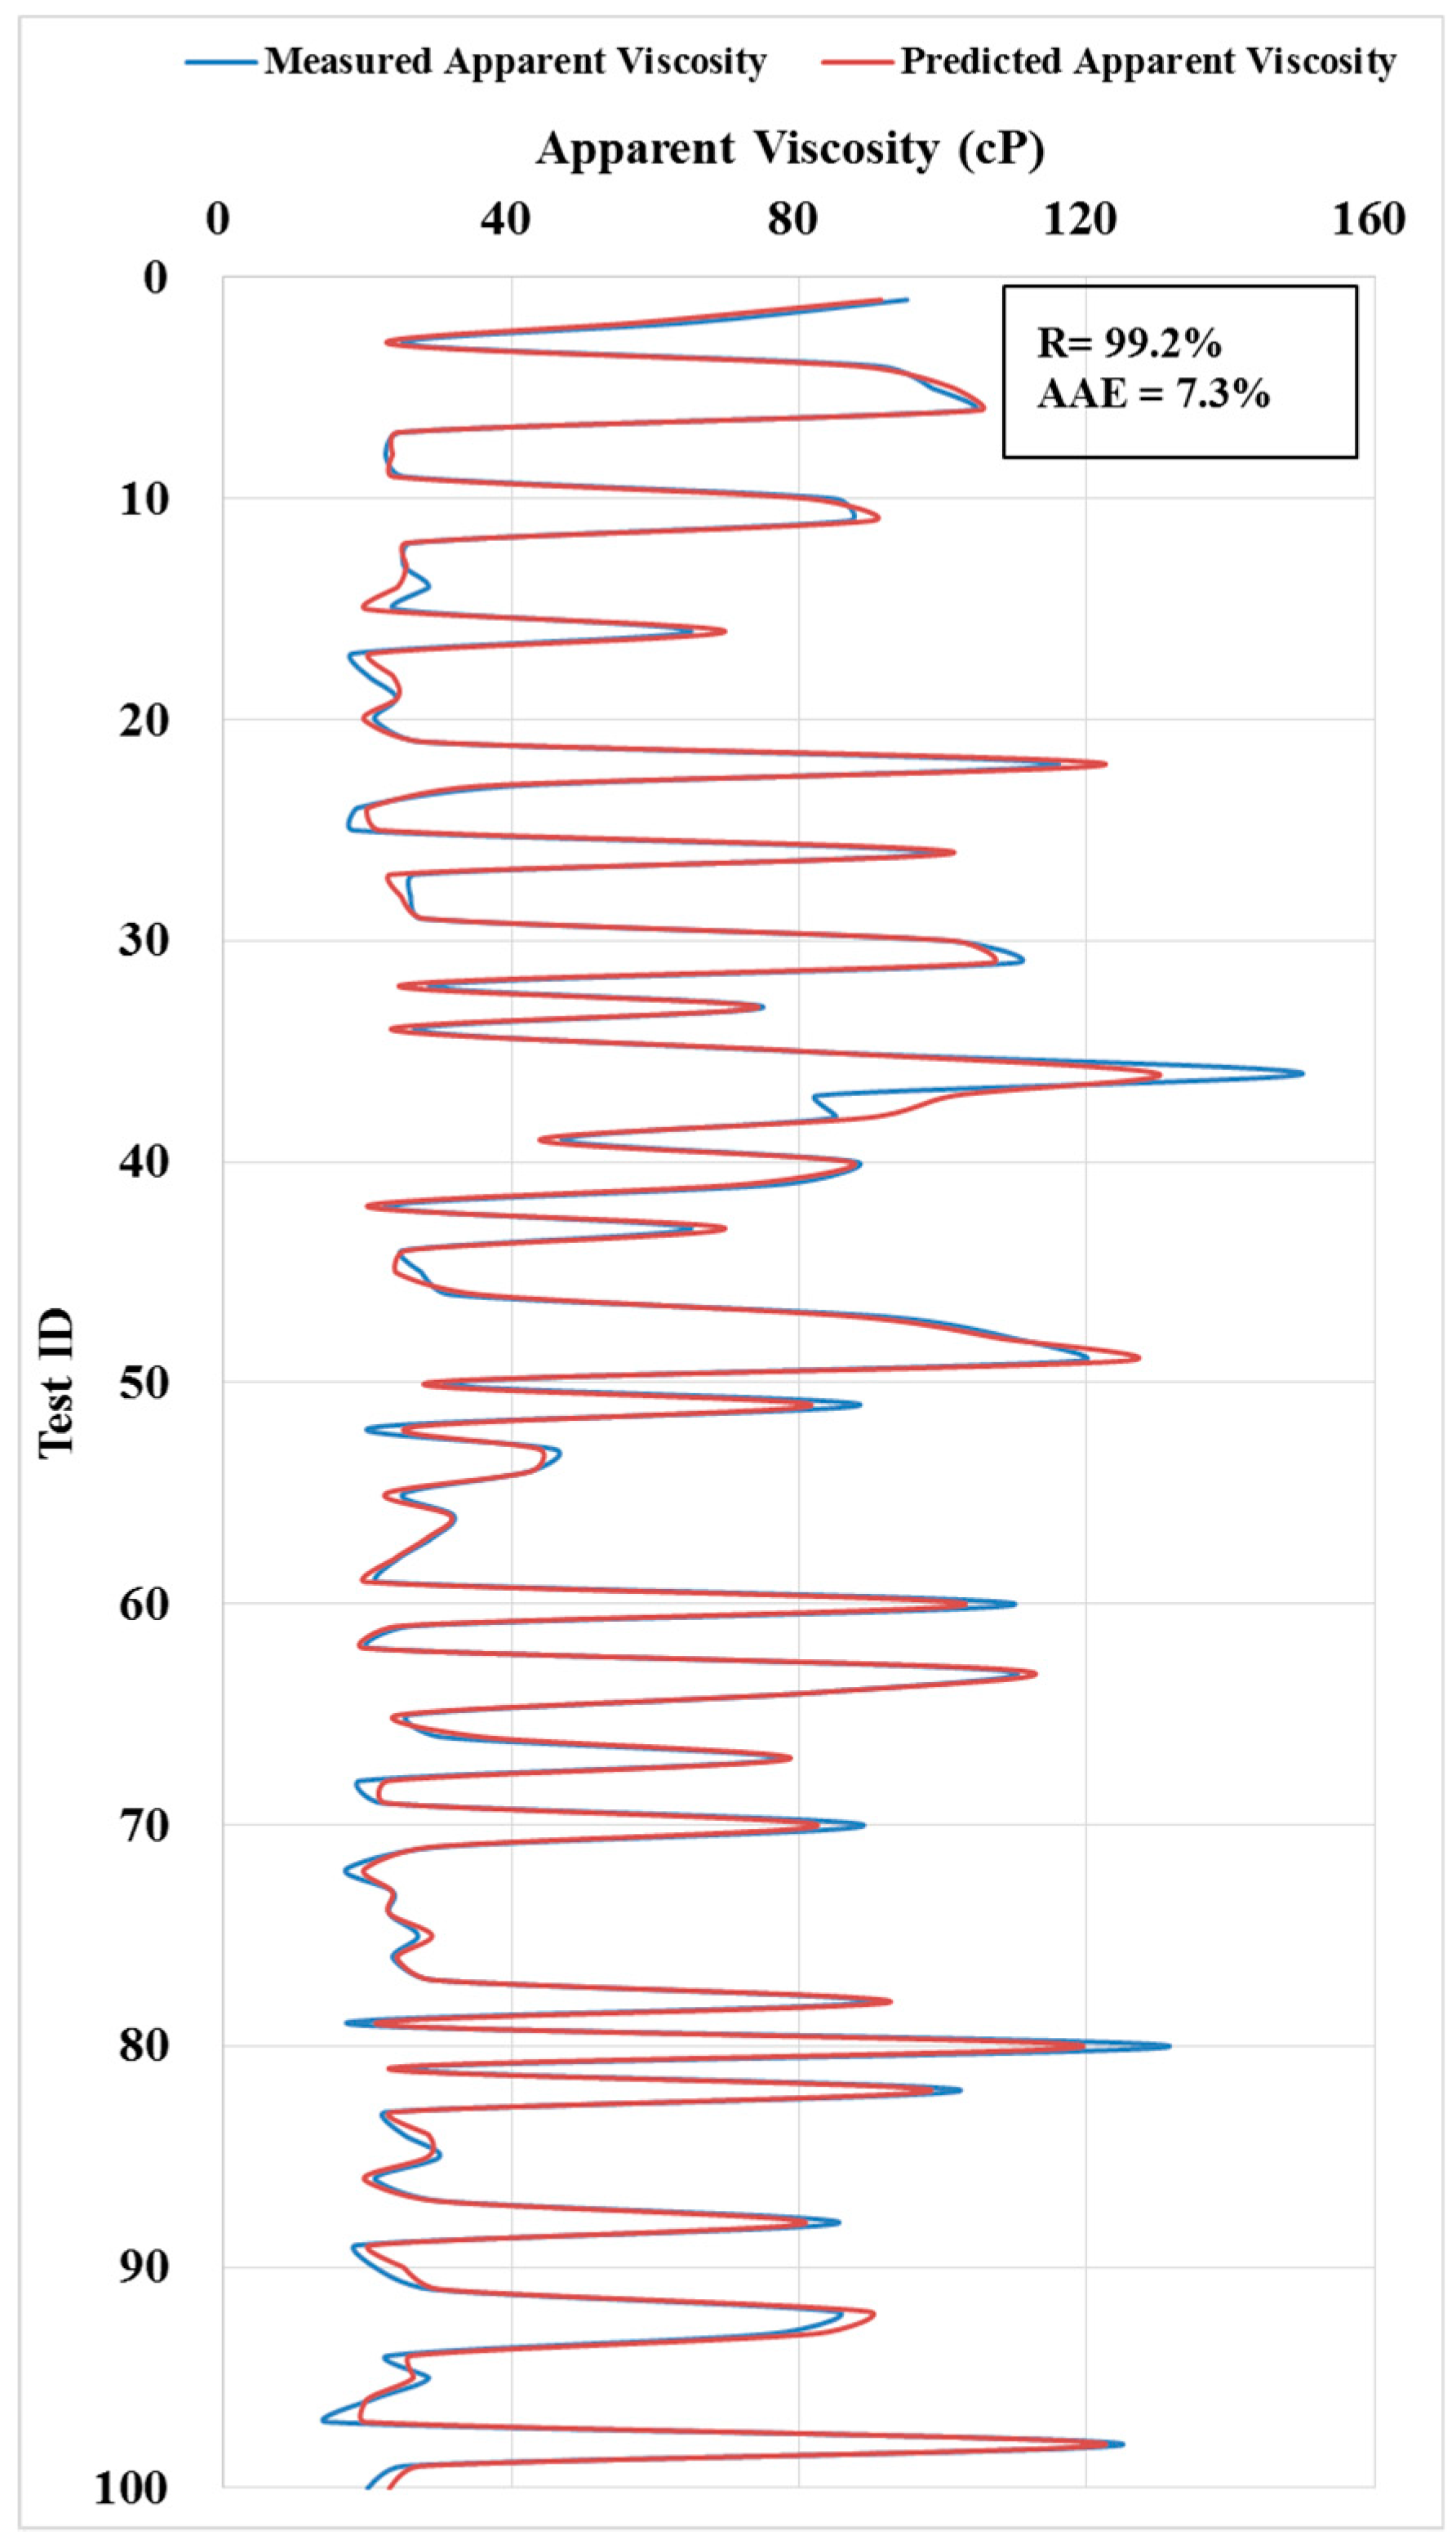
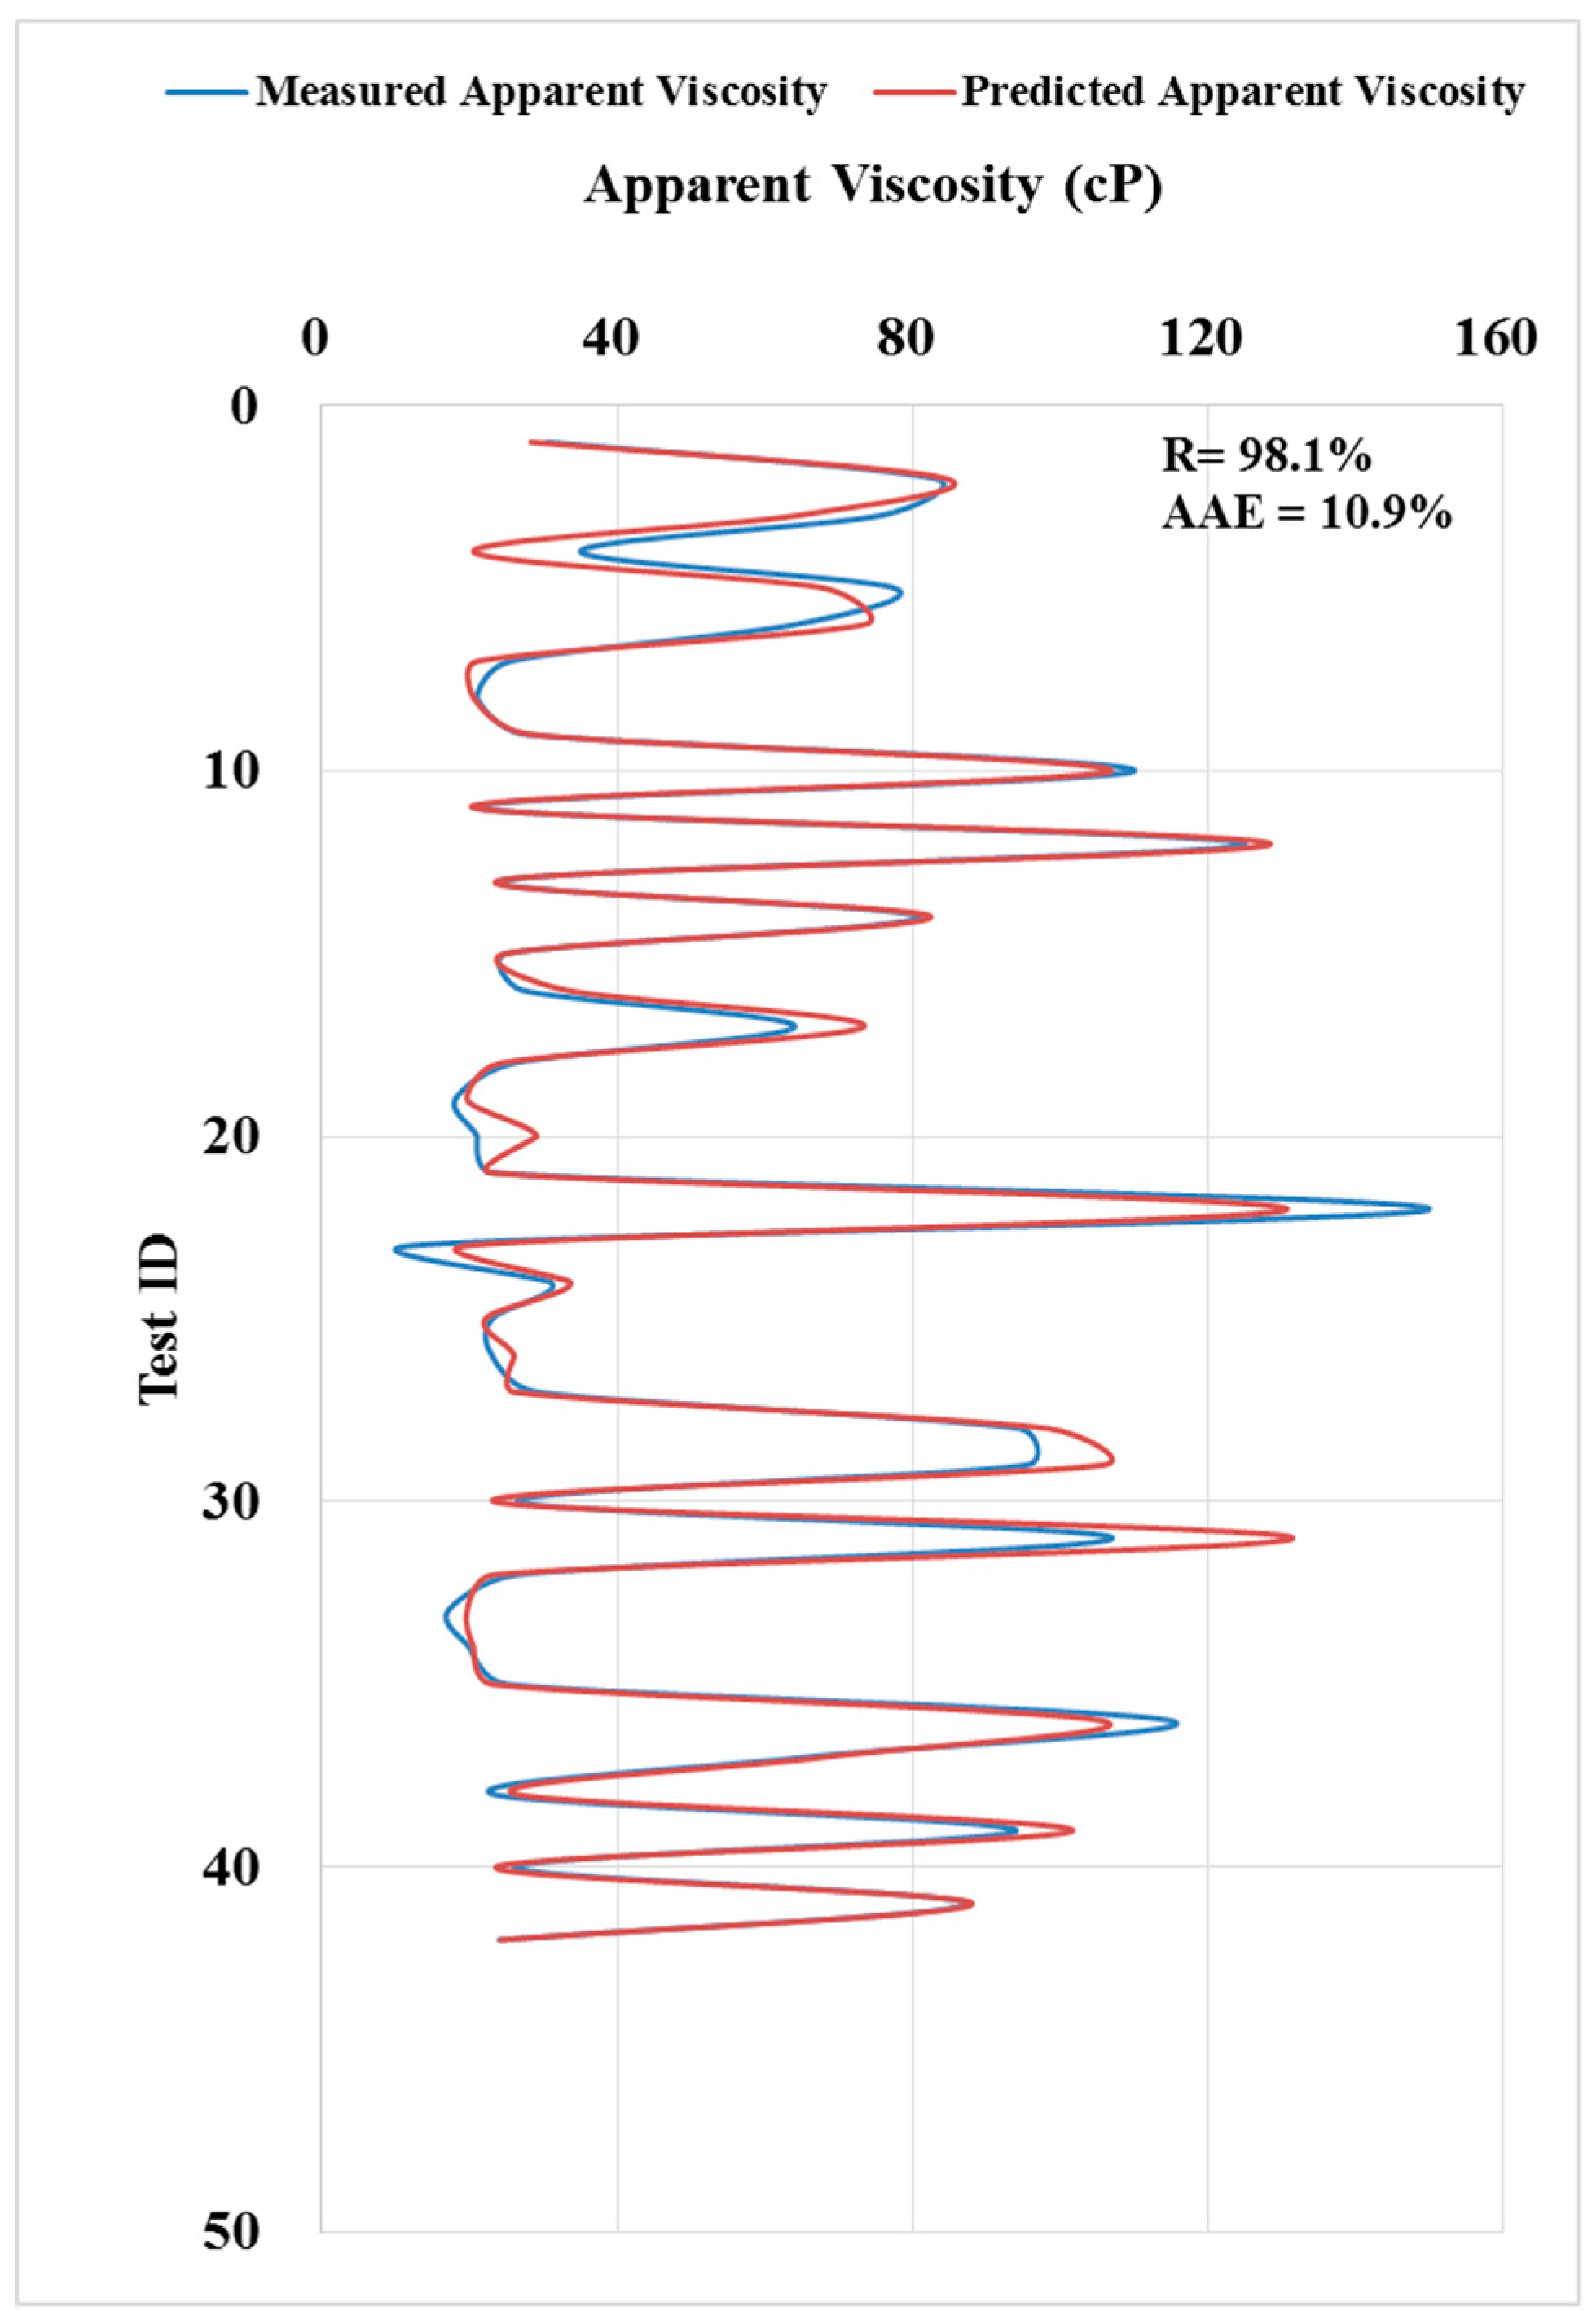
4.2. Development of an Artificial Neural Network Model
5. Conclusions
Author Contributions
Funding
Conflicts of Interest
References
- Caenn, R.; Darley, H.C.; Gray, G.R. Composition and Properties of Drilling and Completion Fluids; Gulf Professional Publishing: Oxford, UK, 2011. [Google Scholar]
- Darley, H.C.; Gray, G.R. Composition and Properties of Drilling and Completion Fluids; Gulf Professional Publishing: Houston, TX, USA, 1988. [Google Scholar]
- Balhoff, M.T.; Lake, L.W.; Bommer, P.W.; Lewis, W.E.; Weber, M.J.; Calderin, J.M. Rheological and yield stress measurements of non-Newtonian fluids using a Marsh Funnel. J. Pet. Sci. Eng. 2011, 77, 393–402. [Google Scholar] [CrossRef]
- ASME Shale Shaker Committee. Drilling Fluids Processing Handbook; Elsevier: Amsterdam, The Netherlands, 2011. [Google Scholar]
- Bourgoyne, A.T.; Millheim, K.K.; Chenevert, M.E.; Young, F.S., Jr. Applied Drilling Engineering; Society of Petroleum Engineers: Richardson, TX, USA, 1986. [Google Scholar]
- Hall, H.; Thompson, H.; Nuss, F. Ability of drilling mud to lift bit cuttings. J. Pet. Technol. 1950, 2, 35–46. [Google Scholar] [CrossRef]
- Hussaini, S.M.; Azar, J.J. Experimental study of drilled cuttings transport using common drilling muds. Soc. Pet. Eng. J. 1983, 23, 11–20. [Google Scholar] [CrossRef]
- Boyou, N.V.; Ismail, I.; Sulaiman, W.R.W.; Haddad, A.S.; Husein, N.; Hui, H.T.; Nadaraja, K. Experimental investigation of hole cleaning in directional drilling by using nano-enhanced water-based drilling fluids. J. Pet. Sci. Eng. 2019, 176, 220–231. [Google Scholar] [CrossRef]
- Rafati, R.; Smith, S.R.; Haddad, A.S.; Novara, R.; Hamidi, H. Effect of nanoparticles on the modifications of drilling fluids properties: A review of recent advances. J. Pet. Sci. Eng. 2018, 161, 61–76. [Google Scholar] [CrossRef]
- Smith, S.R.; Rafati, R.; Haddad, A.S.; Cooper, A.; Hamidi, H. Application of aluminium oxide nanoparticles to enhance rheological and filtration properties of water based muds at HPHT conditions. Colloids Surf. A Physicochem. Eng. Asp. 2018, 537, 361–371. [Google Scholar] [CrossRef]
- Pitt, M. The Marsh funnel and drilling fluid viscosity: A new equation for field use. SPE Drill. Complet. 2000, 15, 3–6. [Google Scholar] [CrossRef]
- Elkatatny, S.; Tariq, Z.; Mahmoud, M. Real time prediction of drilling fluid rheological properties using Artificial Neural Networks visible mathematical model (white box). J. Pet. Sci. Eng. 2016, 146, 1202–1210. [Google Scholar] [CrossRef]
- Asadisaghandi, J.; Tahmasebi, P. Comparative evaluation of back-propagation neural network learning algorithms and empirical correlations for prediction of oil PVT properties in Iran oilfields. J. Pet. Sci. Eng. 2011, 78, 464–475. [Google Scholar] [CrossRef]
- Tahmasebi, P.; Hezarkhani, A. Application of adaptive neuro-fuzzy inference system for grade estimation; case study, sarcheshmeh porphyry copper deposit, Kerman, Iran. Aust. J. Basic Appl. Sci. 2010, 4, 408–420. [Google Scholar]
- Tahmasebi, P.; Hezarkhani, A. Application of a modular feedforward neural network for grade estimation. Nat. Resour. Res. 2011, 20, 25–32. [Google Scholar] [CrossRef]
- Tahmasebi, P.; Hezarkhani, A. A hybrid neural networks-fuzzy logic-genetic algorithm for grade estimation. Comput. Geosci. 2012, 42, 18–27. [Google Scholar] [CrossRef] [PubMed]
- Tahmasebi, P.; Hezarkhani, A. A fast and independent architecture of artificial neural network for permeability prediction. J. Pet. Sci. Eng. 2012, 86, 118–126. [Google Scholar] [CrossRef]
- Le Van, S.; Chon, B. Artificial neural network model for alkali-surfactant-polymer flooding in viscous oil reservoirs: Generation and application. Energies 2016, 9, 1081. [Google Scholar] [CrossRef]
- Le Van, S.; Chon, B. Applicability of an Artificial Neural Network for Predicting Water-Alternating-CO2 Performance. Energies 2017, 10, 842. [Google Scholar] [CrossRef]
- Le Van, S.; Chon, B.H. Evaluating the critical performances of a CO2-Enhanced oil recovery process using artificial neural network models. J. Pet. Sci. Eng. 2017, 157, 207–222. [Google Scholar] [CrossRef]
- Le Van, S.; Chon, B.H. Effective prediction and management of a CO2 flooding process for enhancing oil recovery using artificial neural networks. J. Energy Resour. Technol. 2018, 140, 032906. [Google Scholar] [CrossRef]
- Mohaghegh, S. Virtual-intelligence applications in petroleum engineering: Part 1—Artificial neural networks. J. Pet. Technol. 2000, 52, 64–73. [Google Scholar] [CrossRef]
- Mohagheghian, E.; Zafarian-Rigaki, H.; Motamedi-Ghahfarrokhi, Y.; Hemmati-Sarapardeh, A. Using an artificial neural network to predict carbon dioxide compressibility factor at high pressure and temperature. Korean J. Chem. Eng. 2015, 32, 2087–2096. [Google Scholar] [CrossRef]
- Al-Khdheeawi, E.A.; Feng, R.; Mahdi, D.S. Lithology Determination from Drilling Data Using Artificial Neural Network. In Proceedings of the 53rd US Rock Mechanics/Geomechanics Symposium, New York, NY, USA, 23–26 June 2019. [Google Scholar]
- Al-Khdheeawi, E.A.; Hussain, A.B.; Dunia, A.-S. Undersaturated Oil Compressibility Prediction for Mishrif Reservoir in the Southern Iraqi Oil Fields Using Artificial Neural Network. J. Pet. Res. Stud. 2014, 377, 54–72. [Google Scholar]
- Ramgulam, A.; Ertekin, T.; Flemings, P.B. Utilization of Artificial Neural Networks in the Optimization of History Matching. Ph.D. Thesis, Pennsylvania State University, Stecker Ridge, PA, USA, 2006. [Google Scholar]
- American Petroleum Institute. Recommended Practice for Field Testing Water-based Drilling Fluids; American Petroleum Institute: Washington, DC, USA, 2017. [Google Scholar]
- Skelland, A.H.P. Non-Newtonian Flow and Heat Transfer; Wiley: New York, NY, USA, 1967. [Google Scholar]
- Bingham, E.C. Fluidity and Plasticity; McGraw-Hill: New York, NY, USA, 1922; Volume 2. [Google Scholar]
- Azar, J.J.; Samuel, G.R. Drilling Engineering; PennWell books: Tulsa, OK, USA, 2007. [Google Scholar]
- Marsh, H.N. Properties and treatment of rotary mud. Trans. AIME 1931, 92, 234–251. [Google Scholar] [CrossRef]
- Baker, H.A.; Al-Shamma’a, D.A.; Al-Khdheeawi, E.A. New Correlation for Predicting Undersaturated Oil Compressibility for Mishrif Reservoir in the Southern Iraqi Oil Fields. J. Eng. 2013, 19, 1158–1168. [Google Scholar]


| Property | Minimum | Maximum | Mean |
|---|---|---|---|
| Apparent viscosity (cp) | 12 | 150 | 50.3 |
| Mud weight (gm/cc) | 1.04 | 2.26 | 1.6 |
| March Funnel viscosity (sec) | 33 | 146 | 56.4 |
| plastic viscosity (cp) | 126 | 10 | 38.4 |
| Yield point (Lb/100 ft2) | 59 | 4 | 24 |
| Initial gel strength (Lb/100 ft2) | 28 | 3 | 10.3 |
| 10 minute gel strength (Lb/100 ft2) | 77 | 7 | 35.3 |
| Model Constant | ρ ≤ 2.19 | ρ > 2.19 |
|---|---|---|
| A1 | −22.1223471 | 1800.007 |
| A2 | −16,969.9217 | −163.094 |
| A3 | 0.001953123 | −23.0043 |
| A4 | −1.51689336 | 72.08154 |
| A5 | 1521.04489 | −2.85495 |
| A6 | −3501.02636 | 0.829787 |
| A7 | 1.73767137 | −31.2506 |
| A8 | 17,000.0495 | −3997.91 |
| Correlation | Correlation Coefficient, R (%) | Average Absolute Error, AAE (%) |
|---|---|---|
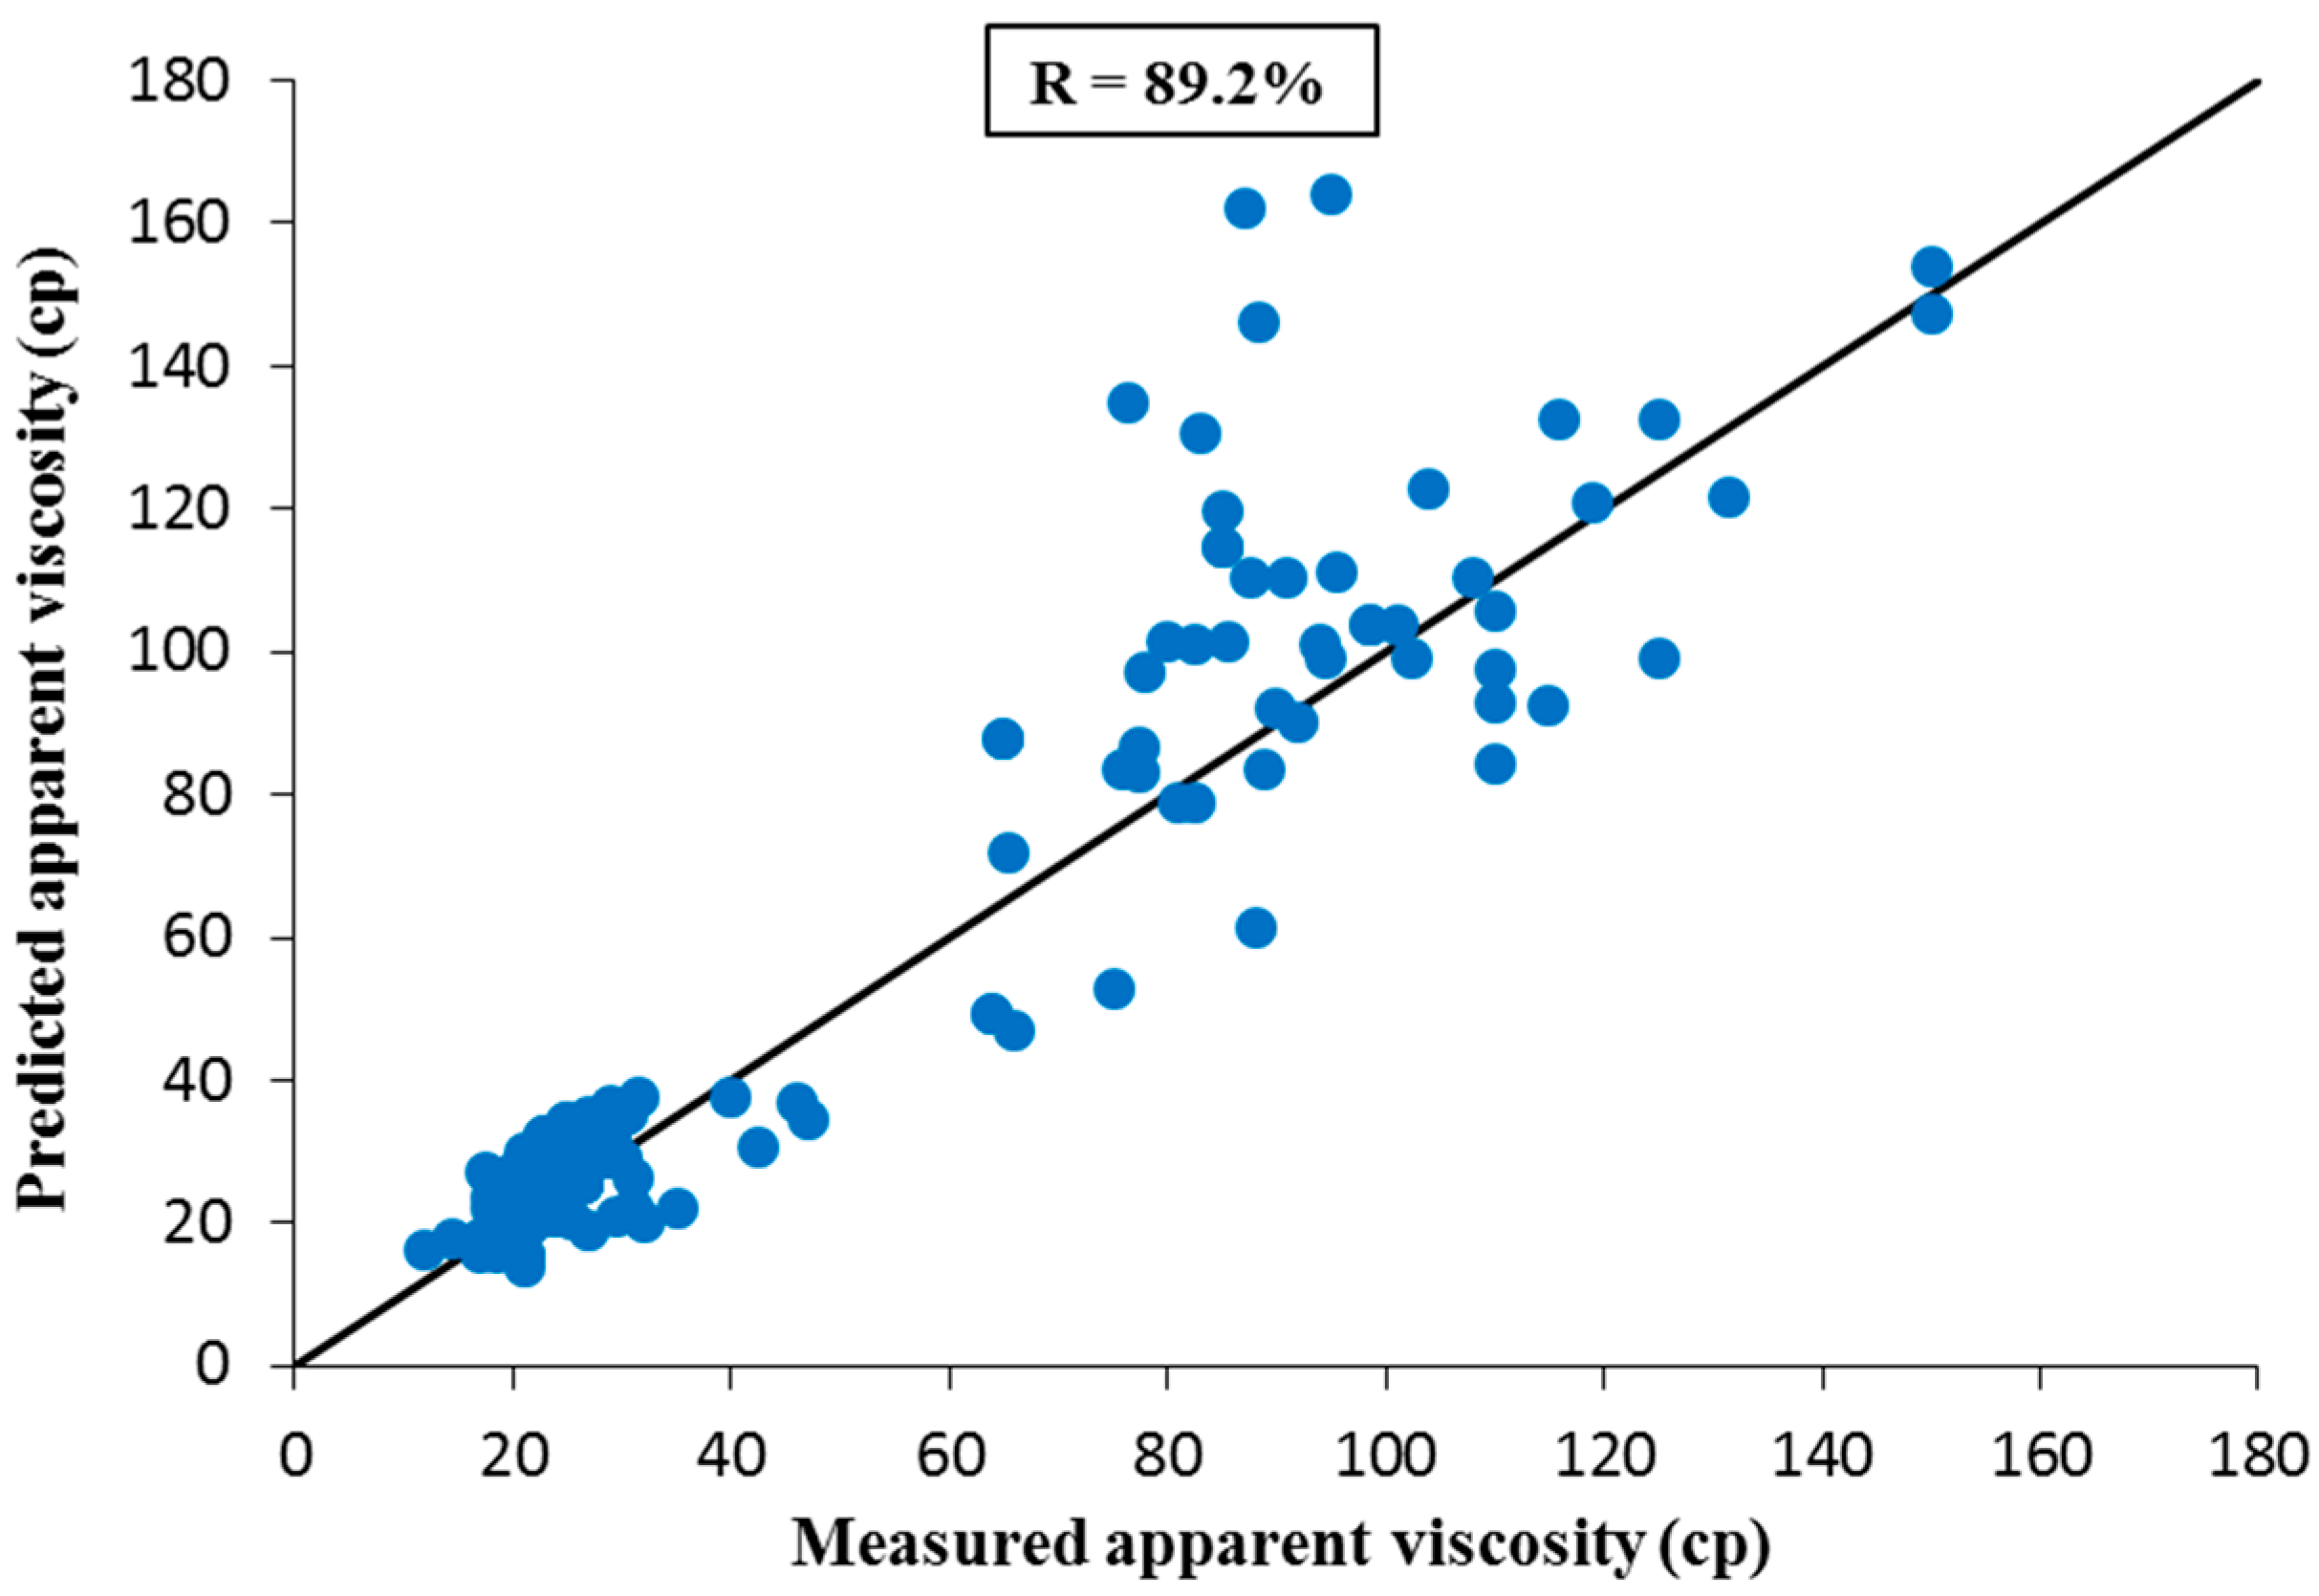
| Pitt’s correlation [11] | 89.2 | 20.3 |
| This study (correlation) | 98.8 | 8.6 |
| This study (ANN) | 98.2 | 10.9 |
| Element | Lithology Model |
|---|---|
| Number of layers | 3 (Input, hidden, output) |
| Number of input Variables (Nodes) | 2 (ρ, t) |
| Number of output Variable | 1 (μa) |
| Number of hidden layers | 1 |
| Number of Neuron in the hidden layer | 10 |
| Performance goal (mse) | 0 |
| Max. Number of epochs to train | 10,000 |
| Network type | Fed-forward backprop |
| Transfer functions | tansig, purelin |
| Train function | Trainlgdx |
| Learning function | Learngdm |
| Number of the Training sample | 100 |
| Number of Testing sample | 42 |
© 2019 by the authors. Licensee MDPI, Basel, Switzerland. This article is an open access article distributed under the terms and conditions of the Creative Commons Attribution (CC BY) license (http://creativecommons.org/licenses/by/4.0/).
Share and Cite
Al-Khdheeawi, E.A.; Mahdi, D.S. Apparent Viscosity Prediction of Water-Based Muds Using Empirical Correlation and an Artificial Neural Network. Energies 2019, 12, 3067. https://doi.org/10.3390/en12163067
Al-Khdheeawi EA, Mahdi DS. Apparent Viscosity Prediction of Water-Based Muds Using Empirical Correlation and an Artificial Neural Network. Energies. 2019; 12(16):3067. https://doi.org/10.3390/en12163067
Chicago/Turabian StyleAl-Khdheeawi, Emad A., and Doaa Saleh Mahdi. 2019. "Apparent Viscosity Prediction of Water-Based Muds Using Empirical Correlation and an Artificial Neural Network" Energies 12, no. 16: 3067. https://doi.org/10.3390/en12163067
APA StyleAl-Khdheeawi, E. A., & Mahdi, D. S. (2019). Apparent Viscosity Prediction of Water-Based Muds Using Empirical Correlation and an Artificial Neural Network. Energies, 12(16), 3067. https://doi.org/10.3390/en12163067