Article

Enhancement of DUBAL Network Operational Performance Using Resistive High Temperature Superconducting Fault Current Limiter †

1
EGA Aluminum, Dubai 3627, UAE
2
Khalifa University, APEC Centre, Department of Electrical and Computer Engineering, Abu Dhabi 127788, UAE
*
Author to whom correspondence should be addressed.
This paper is an extended version of our paper published in 2018 IEEE International Conference on High-Voltage Engineering and Applications (ICHVE 2018), Athens, Greece, 10–13 September 2018, doi:10.1109/ICHVE.2018.8642074.
Energies 2019, 12(15), 3007; https://doi.org/10.3390/en12153007
Submission received: 30 June 2019 / Revised: 21 July 2019 / Accepted: 25 July 2019 / Published: 4 August 2019
(This article belongs to the Section F: Electrical Engineering)

Abstract

:
Power systems under expansion suffer from escalating fault levels that impact equipment integrity, operational flexibility, and the overall security of the system. The fault current limiter (FCL) is one of approaches used by utilities to limit fault current levels and in Dubai Aluminum (DUBAL) series current limiting reactors are currently used. However, more effective (FCL) topologies are sought and, in this paper, a case study is proposed using resistive high temperature superconducting fault current limiters (HT-SFCLs). The application of HT-SCFLs is aimed here at reducing short-circuit currents, while at the same time enhancing the stability and security of the network. The study involves analysis of three-phase and single-line-to-ground faults, evaluation of the voltage levels and total harmonic distortion (THD) levels at busbars considering different fault scenarios, and demonstrates how the use of HT-SFCLs at various locations improves the plant performance. The ideal HT-SFCL model is adopted for this analysis since the aim is to look at the steady-state performance rather than the transient performance. Comparison with series reactor FCLs which are currently installed in the plant show better performance with the proposed HT-SFCL. Voltage profile values and total harmonic content were also compared with measurement data available at the plant.

1. Introduction

Power systems are increasing in size and are becoming more interconnected due to urban expansion and increasing energy demands. This in turn rises fault currents to levels that may exceed the ratings of existing protection devices. Large fault currents may cause equipment damage, blackouts, and increased risk to personnel safety. Fault current limitation methods include the use of fuses, series reactor FCL, high transformer impedance, and busbar splitting. However, fuses are limited in application and require maintenance after each fault occurrence, whereas the latter three approaches cause an increase in system impedance. High-temperature superconducting fault current limiters (HT-SCFCLs) offer superior performance compared with series reactors: They can rapidly and effectively limit fault current and recover to a low-impedance state after fault clearance, which makes them attractive for power system applications [1,2,3,4,5]. Research on HT-SFCL development based on an inductive type concept has been reported [6,7,8]. To extend application to medium and high voltage transmission and distribution systems, researchers have been progressively focusing more on the design of resistive type FCLs [9,10,11] due to their simple structure, lighter weight, and lower cost compared with the series reactance type. The first resistive SFCL was made of bismuth strontium calcium copper oxide, or BSCCO material, but limitations of the AC losses at medium voltages and above requires significant expenses on cryogenics. To overcome the problem of AC loss, magnetic field-assisted quench superconductors have been developed [3]. Other materials that have been or are being investigated for designing resistive SFCLs are YBCO (yttrium barium copper oxide)-coated material and magnesium diboride (MgB2). The conceptual design of a 154 kV/2 kA resistive HT-SFCL based on 2G HTS wires was described in [10]. The authors in [11] reported on the design of a 24 kV resistive HTS-FCL using YBCO tapes, which was installed in a busbar coupling location and in a transformer feeder location. The first commercial HT-SFCL was successfully installed in an operational power system [12]. In [13], the design and commissioning of two medium voltage resistive HT-SFCLs, with a rated voltage of 12 kV was described. In 2014, the successful performance after one year of operation under steady-state conditions of a 9 kV resistive HT-SFCL installed in a MV distribution feeder was demonstrated [14]. Various studies have been conducted to evaluate their performance with regards to system stability, reliability, and security enhancement aspects [15,16,17]. Studies reporting on their performance at higher voltage levels are limited.
This paper reports the results of a feasibility study on the performance of resistive HT-SFCLs for possible installation at 33 and 132 kV busbar couplings within Dubai Aluminum (DUBAL) industrial power plant. The study aims at assessing the performance of the fault current limiters under short-circuit faults in combination with existing reactor FCLs. The fault current magnitude, harmonics, and voltage profile are computed and analyzed under different fault scenarios. In addition, the FCL performance considering probable contingencies is presented. The aim is to investigate the optimum configuration and location of HTS-FCL units in the plant that gives improved fault current margins to within breaker ratings, and improved harmonic content, while providing reduced steady-state losses in the plant. The network was modelled under a worst-case operational scenario with existing reactor FCL and with the proposed HT-SFCL, and the results show that improvements are evident with the HT-SCFL when compared with the case of reactor FCL. The results are further compared with the available on-site measurement data.

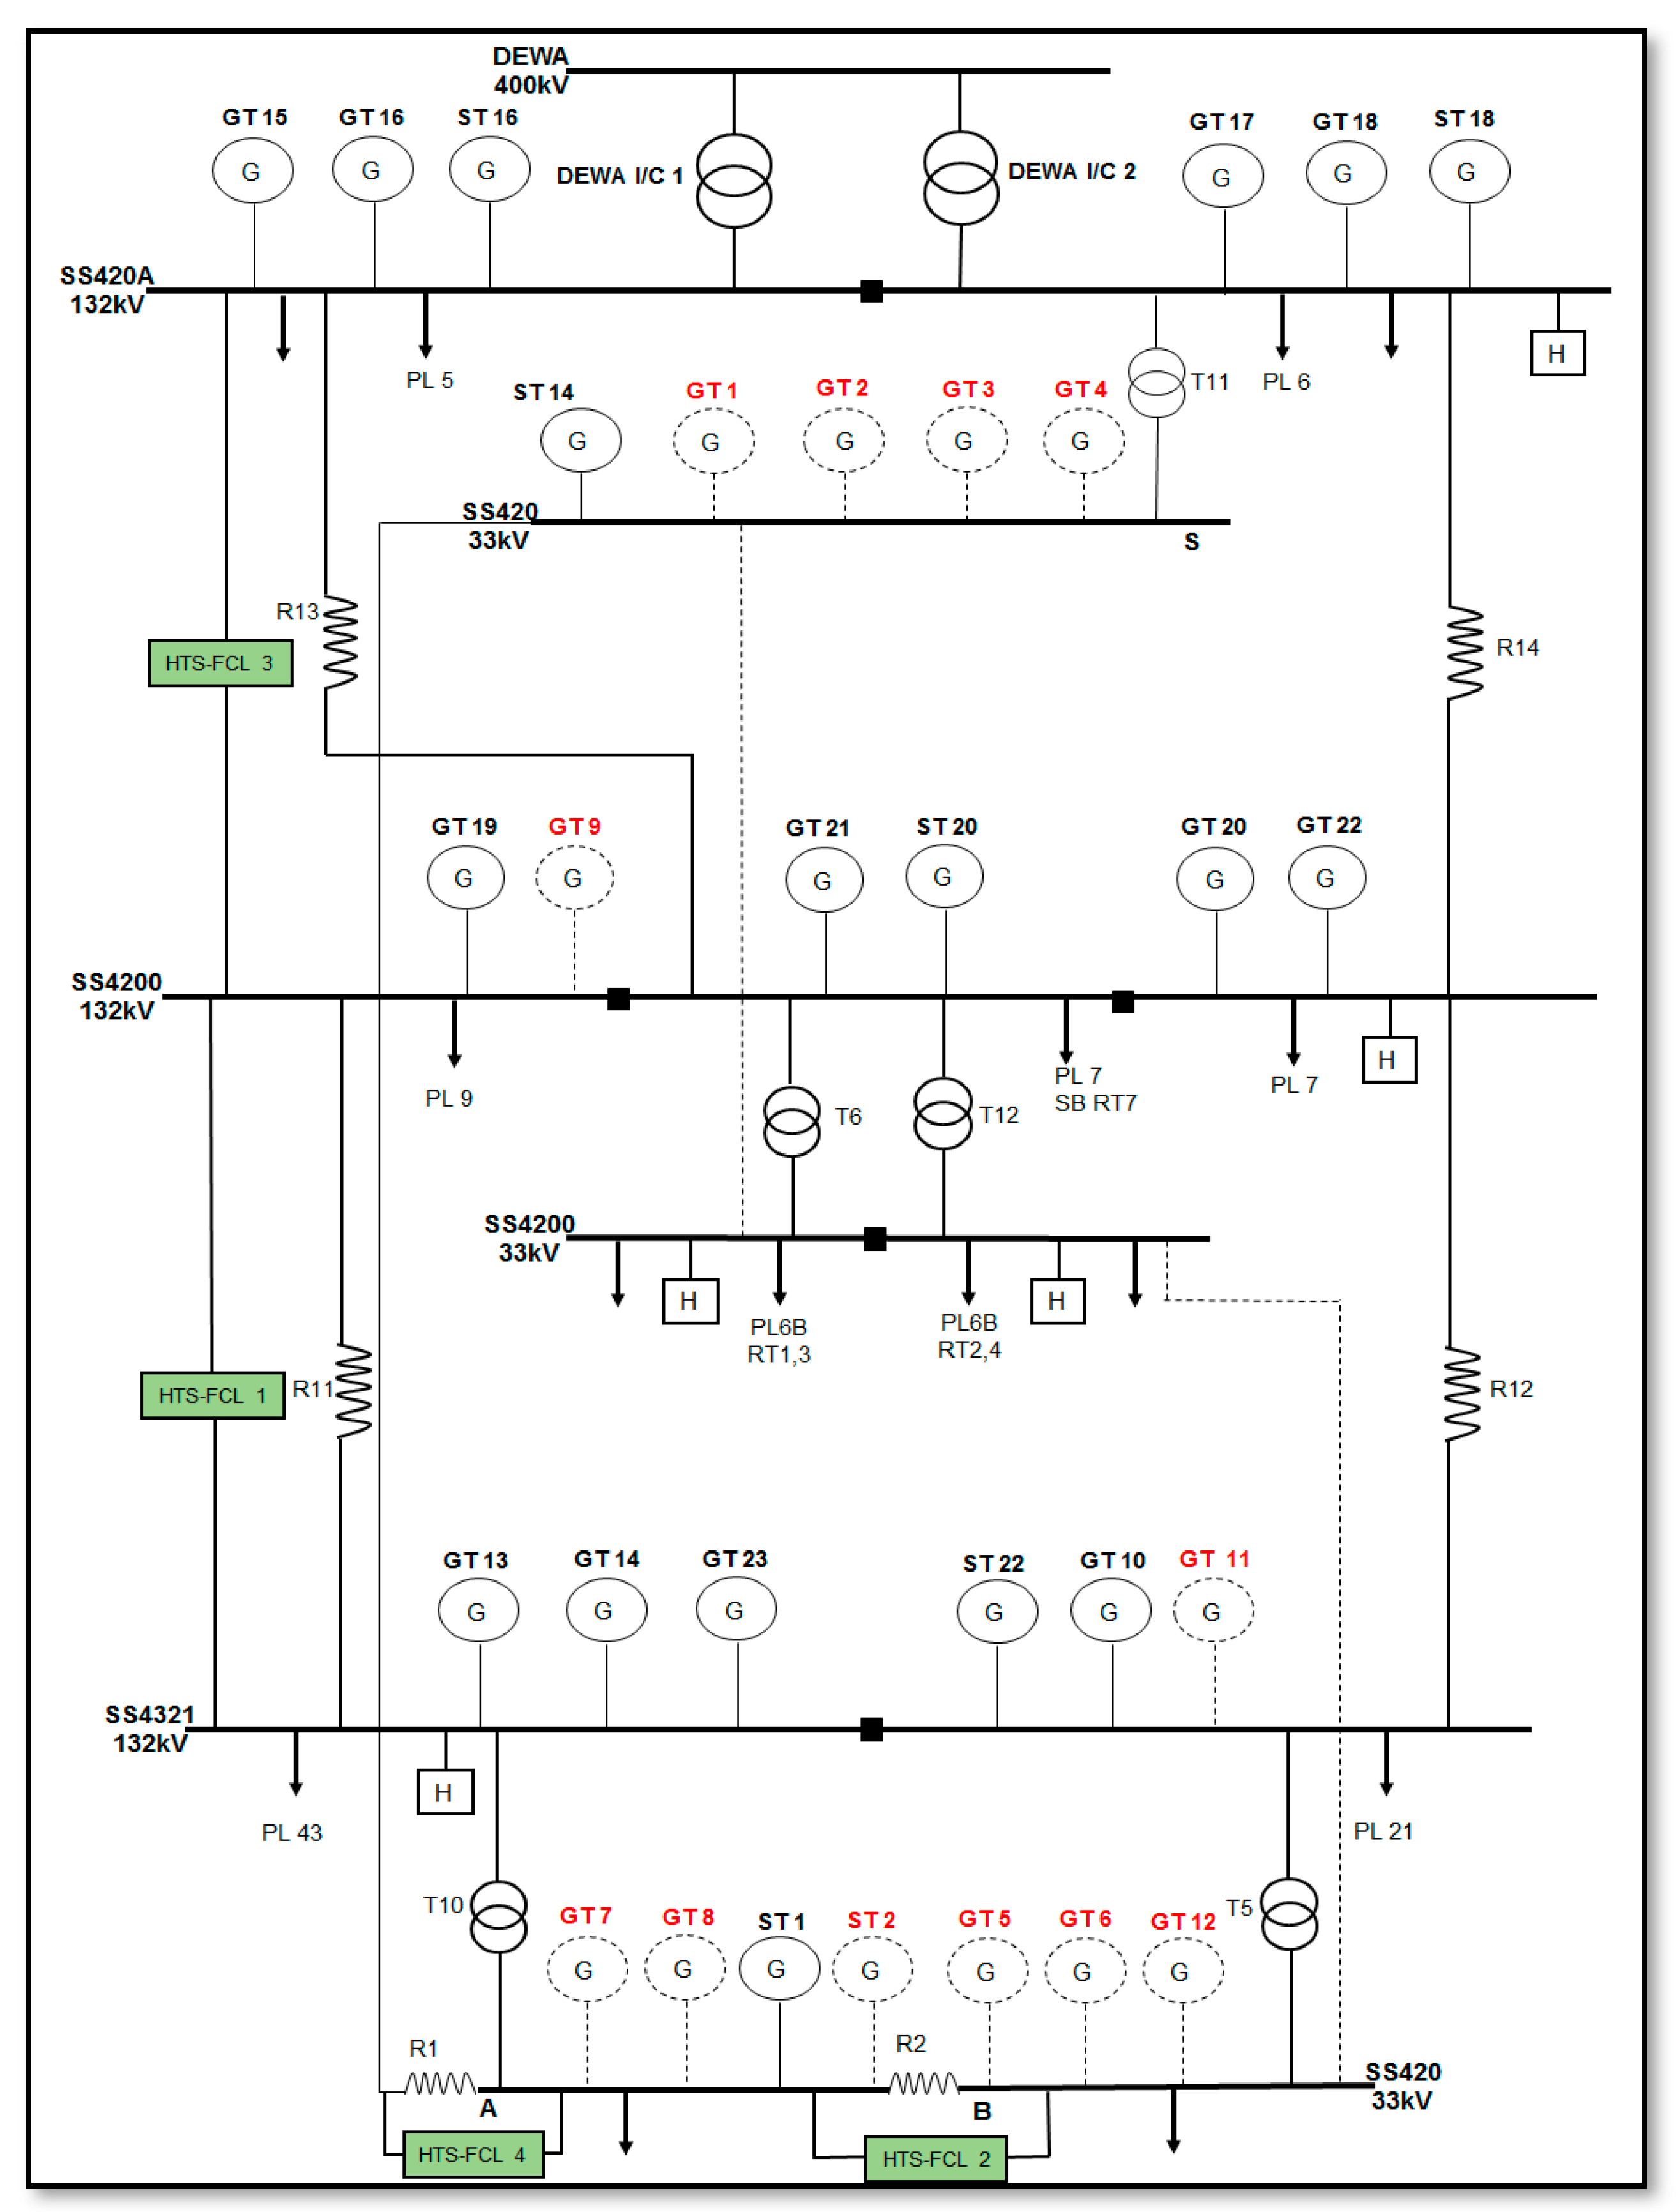
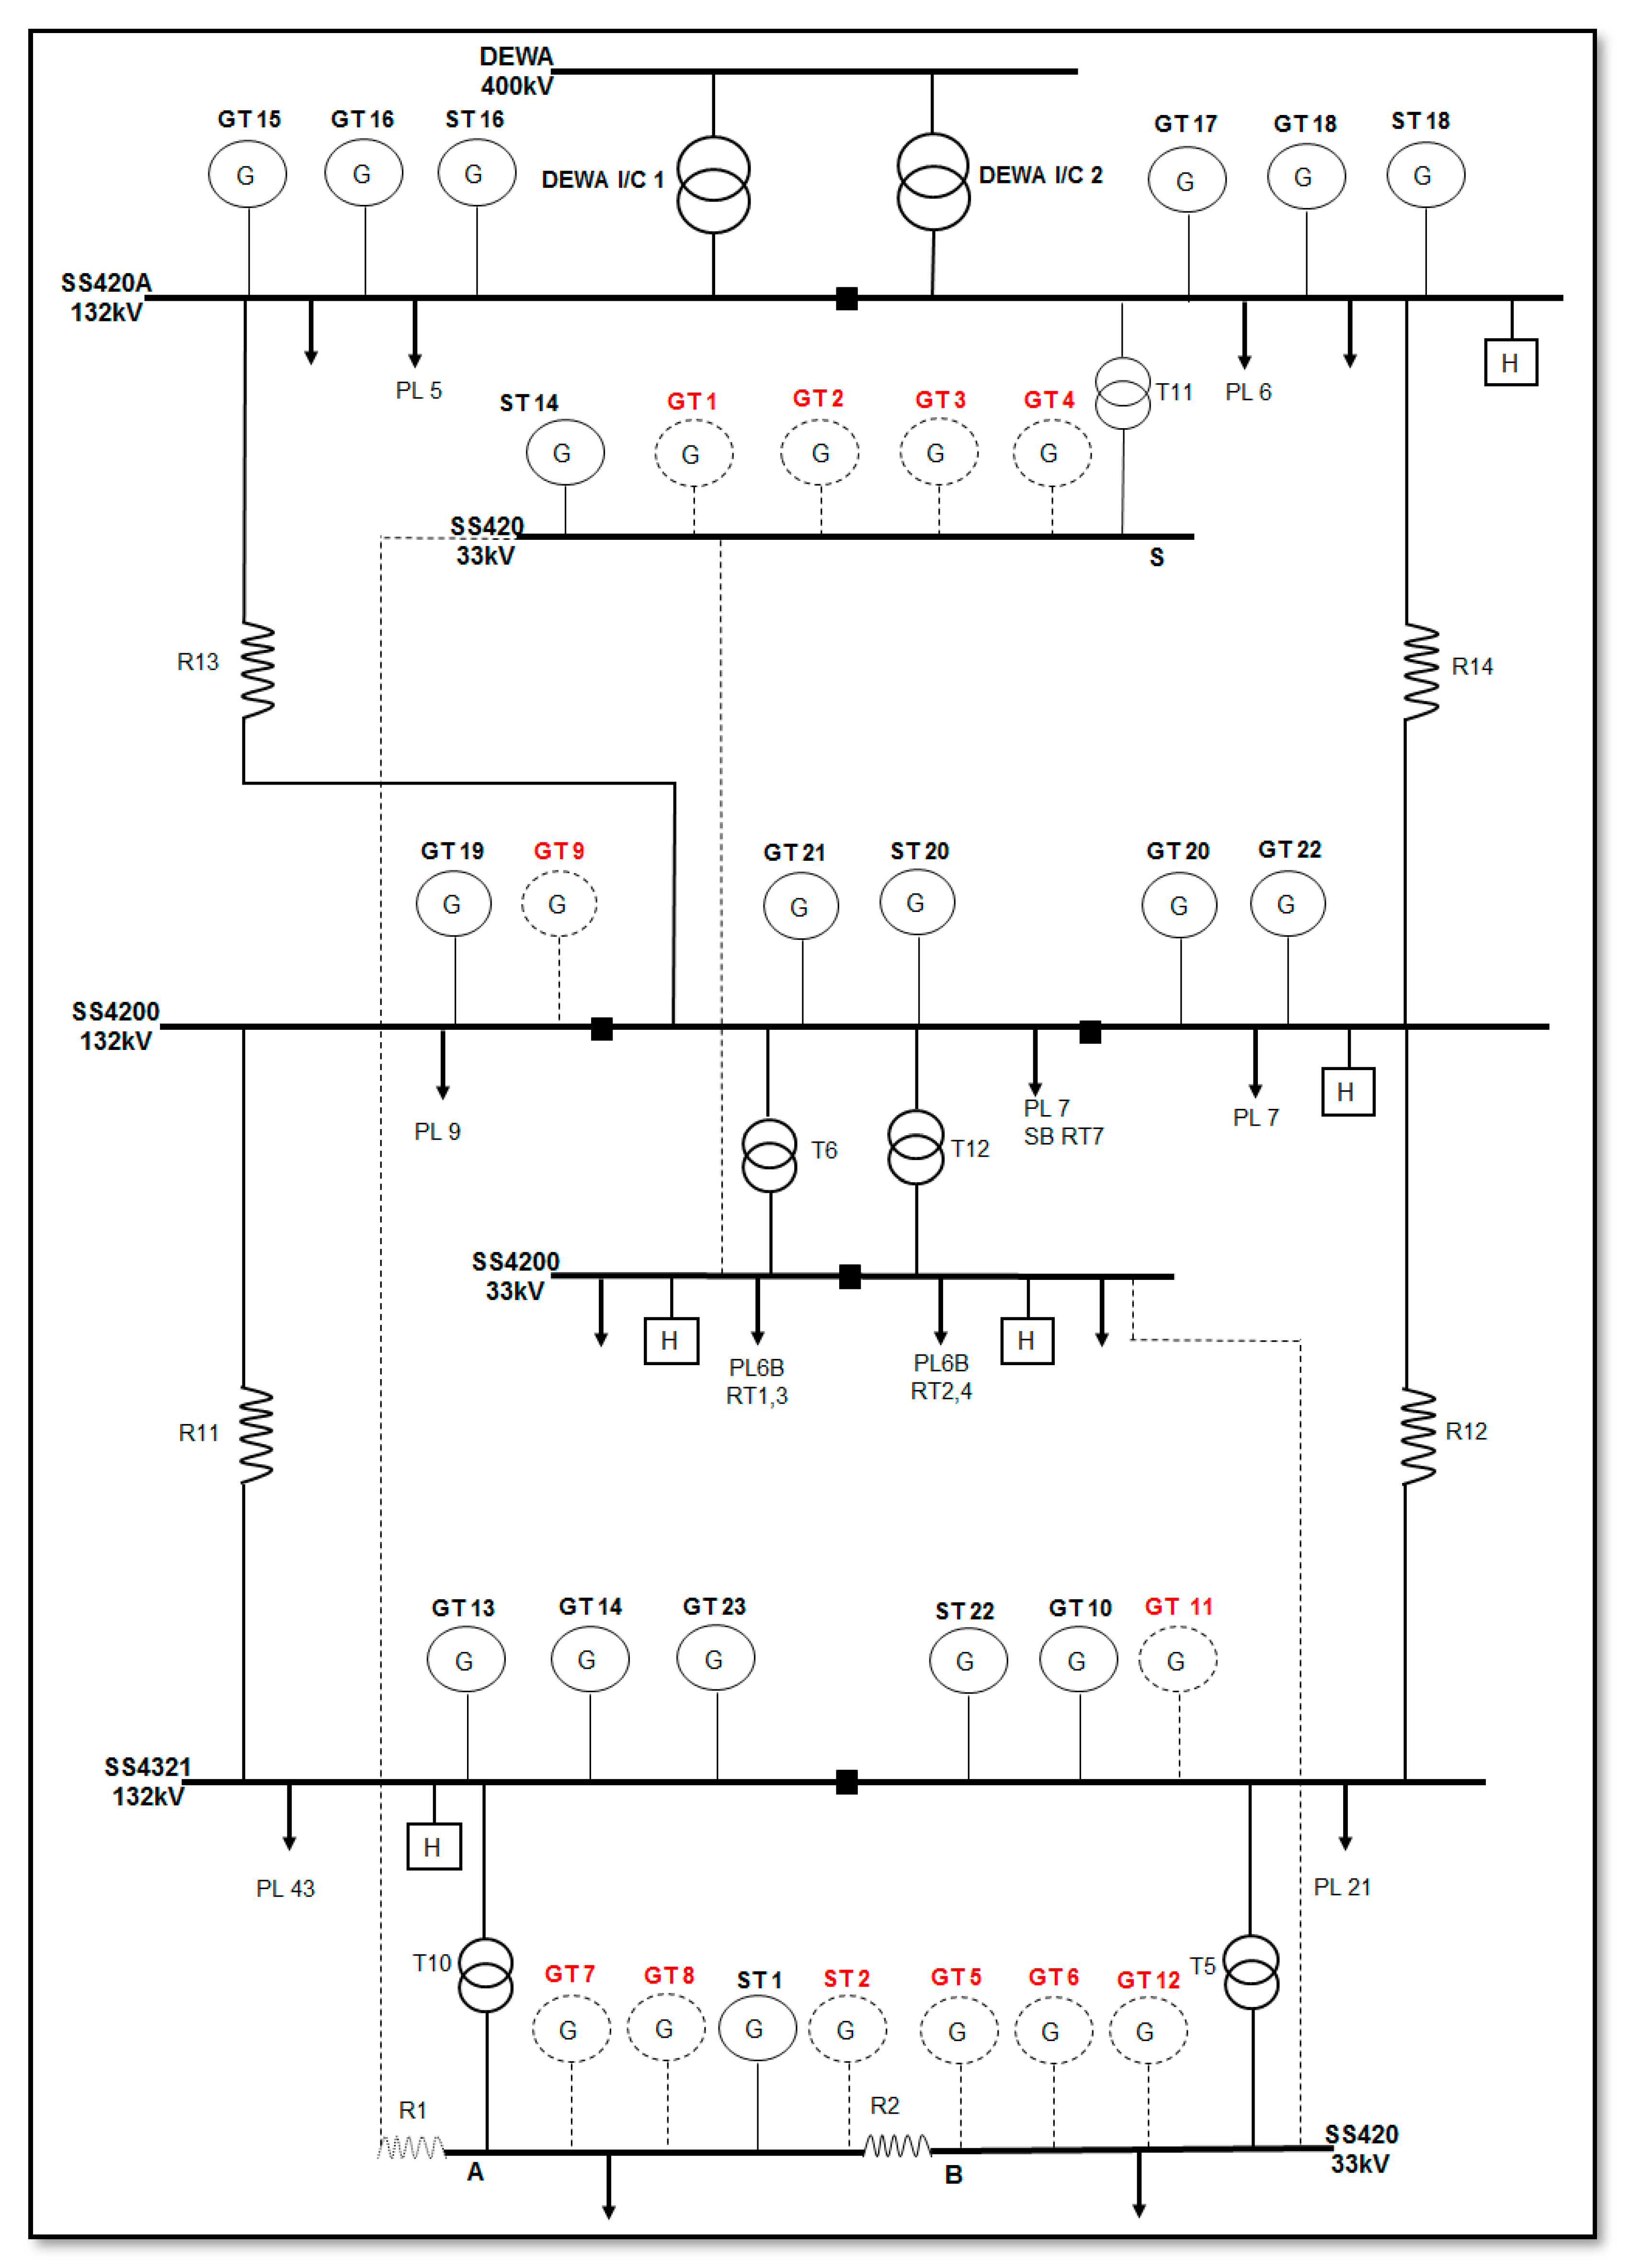
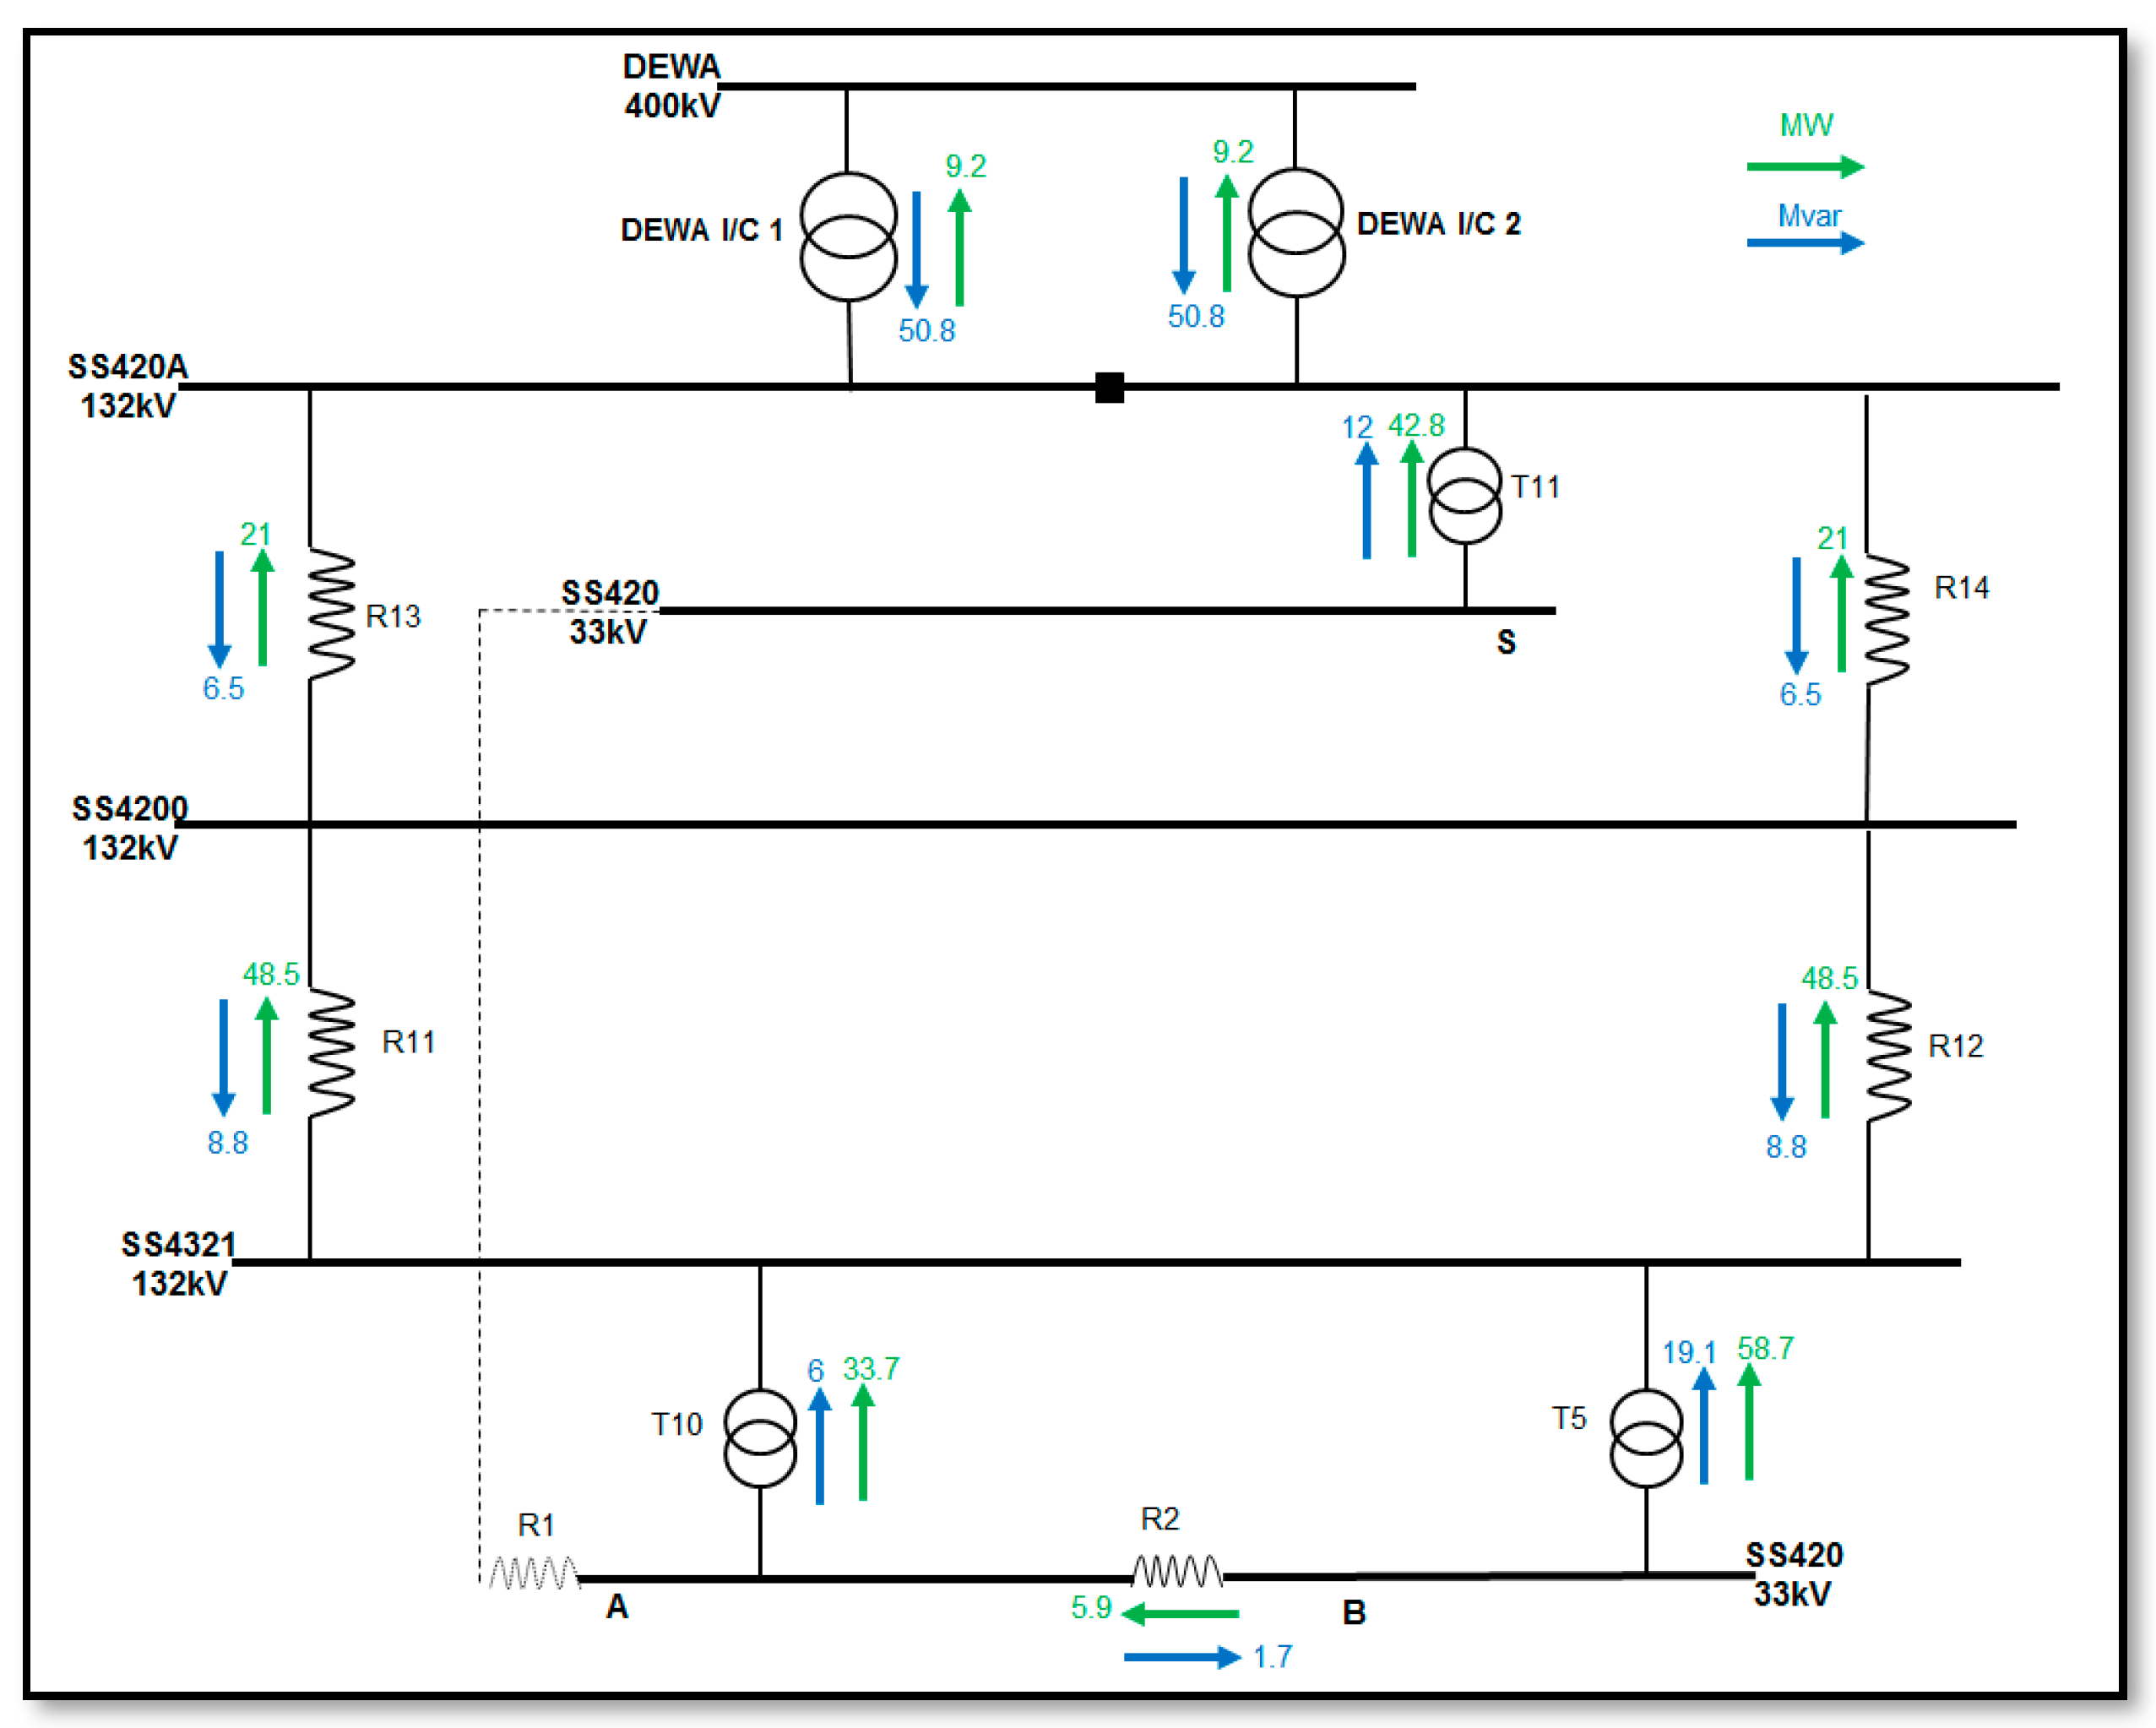
2. Network Description and Study Methodology

A single line diagram of the power plant is shown in Figure 1, with an installed capacity of 2350 MW at 30 °C and a total load demand of 1900 MW. Generation and loads are connected to four 132 kV substations and a 33 kV substation. Four 132 kV FCL reactors (R11, R12, R13, and R14) rated 250 MVA interconnect 132 kV substations to reduce the fault level contribution from other substations. Inter-tie transformers connect between 33 kV sections and 132 kV sections of the plant. Interconnection with the transmission grid is made via two 400/132 kV, 300 MVA transformers (I/C 1 and I/C 2). Harmonic contributions from the rectifier transformers feeding different pot lines (PL) are mitigated using four harmonic filters (H) installed at the locations indicated in the figure.
With reference to the simplified single-line diagram of the part of the power plant shown in Figure 1, three-phase and single-phase faults were applied at the 132 and 33 kV substations. The existing switchgear ratings are shown in Table 1. The fault current contributions from the grid for faults on SS420A section of the plant are approximately 10.4 kA and 11 kA for symmetrical and asymmetrical faults, respectively. The short-circuit breaking time was taken as 80 ms. Total harmonic distortion (THD) values can be calculated as per IEC 61000-3-6 and IEEE Std. 519-1992 standards [18,19], and only the values using the IEEE standard were adopted here, with a reference (THD) of 5% at 33 kV and 2.5% at 132 kV. Load flow analysis was also carried out at the plant substations.

3. Fault Current and Harmonic Analysis with Reactor FCL

Studies were carried out considering the plant operating in the summer period, which is the worst-case scenario. In the load flow analysis, generators GT1-8, GT9, GT11, GT12, and ST2 were assumed on stand-by.

3.1. Fault Current Analysis

The values of computed short-circuit breaking currents are shown in Table 2 and Table 3. As can be seen, the smallest safety margin is 14.1% at the 132 kV SS420A section for the single phase symmetrical breaking current. On the other hand, section SS4321 showed the largest safety margin for all cases. For the SS420 (33 kV) sections, the breaking currents were found approximately equal to each other.

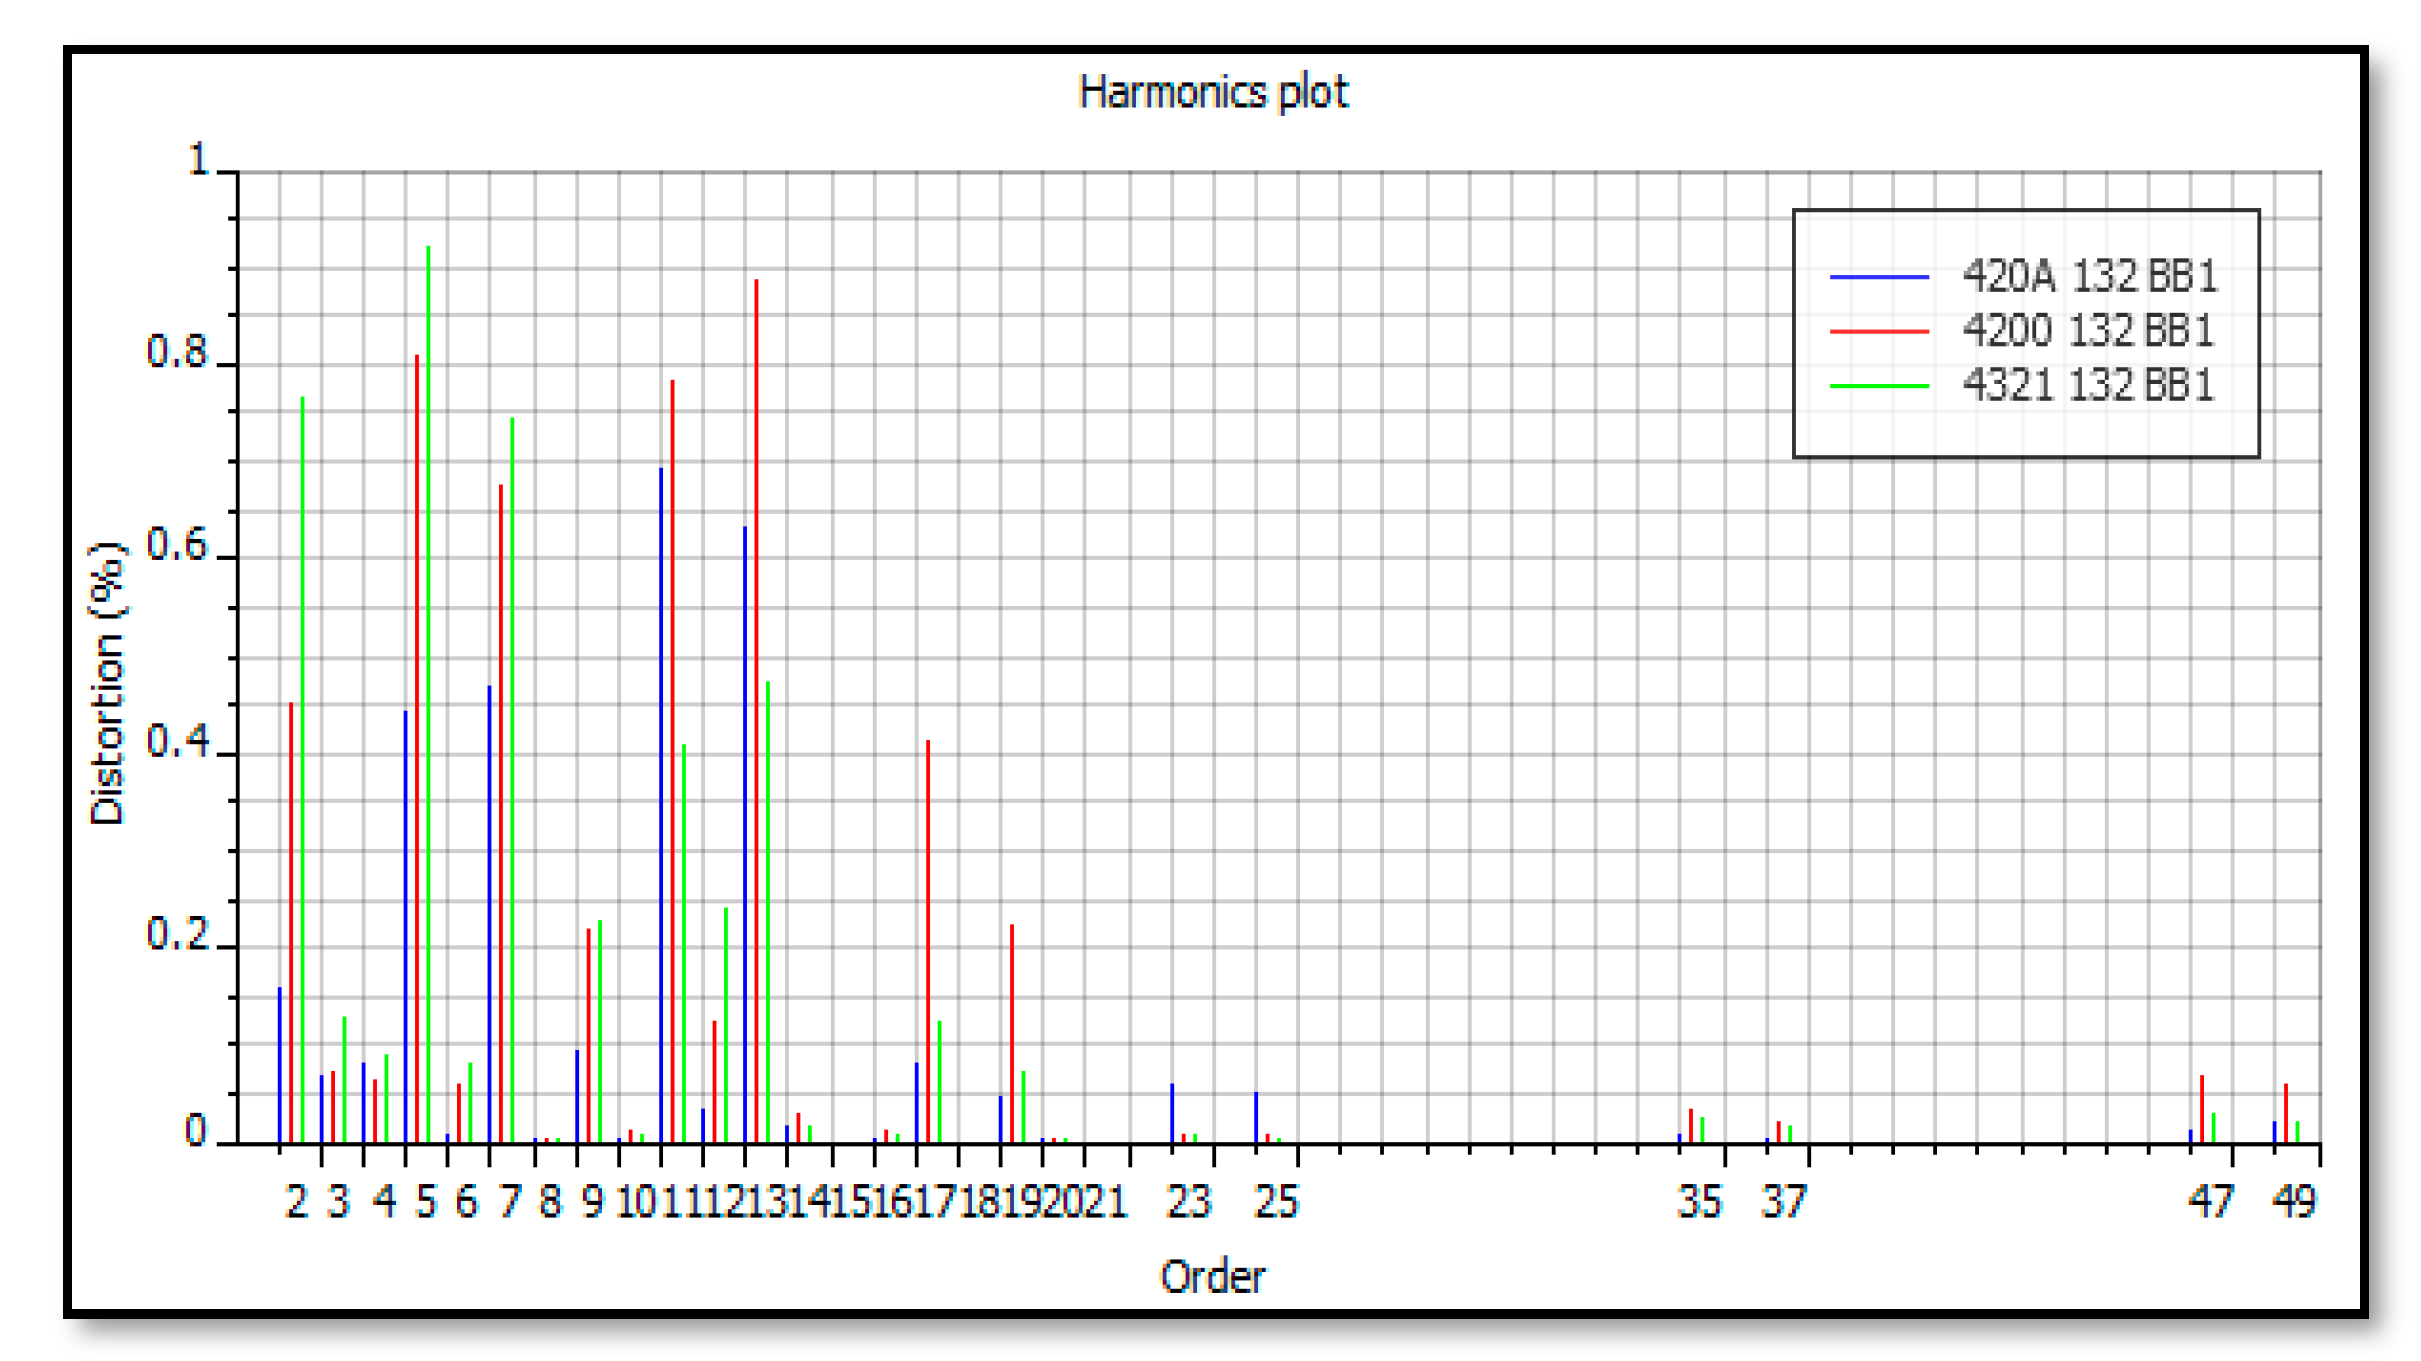
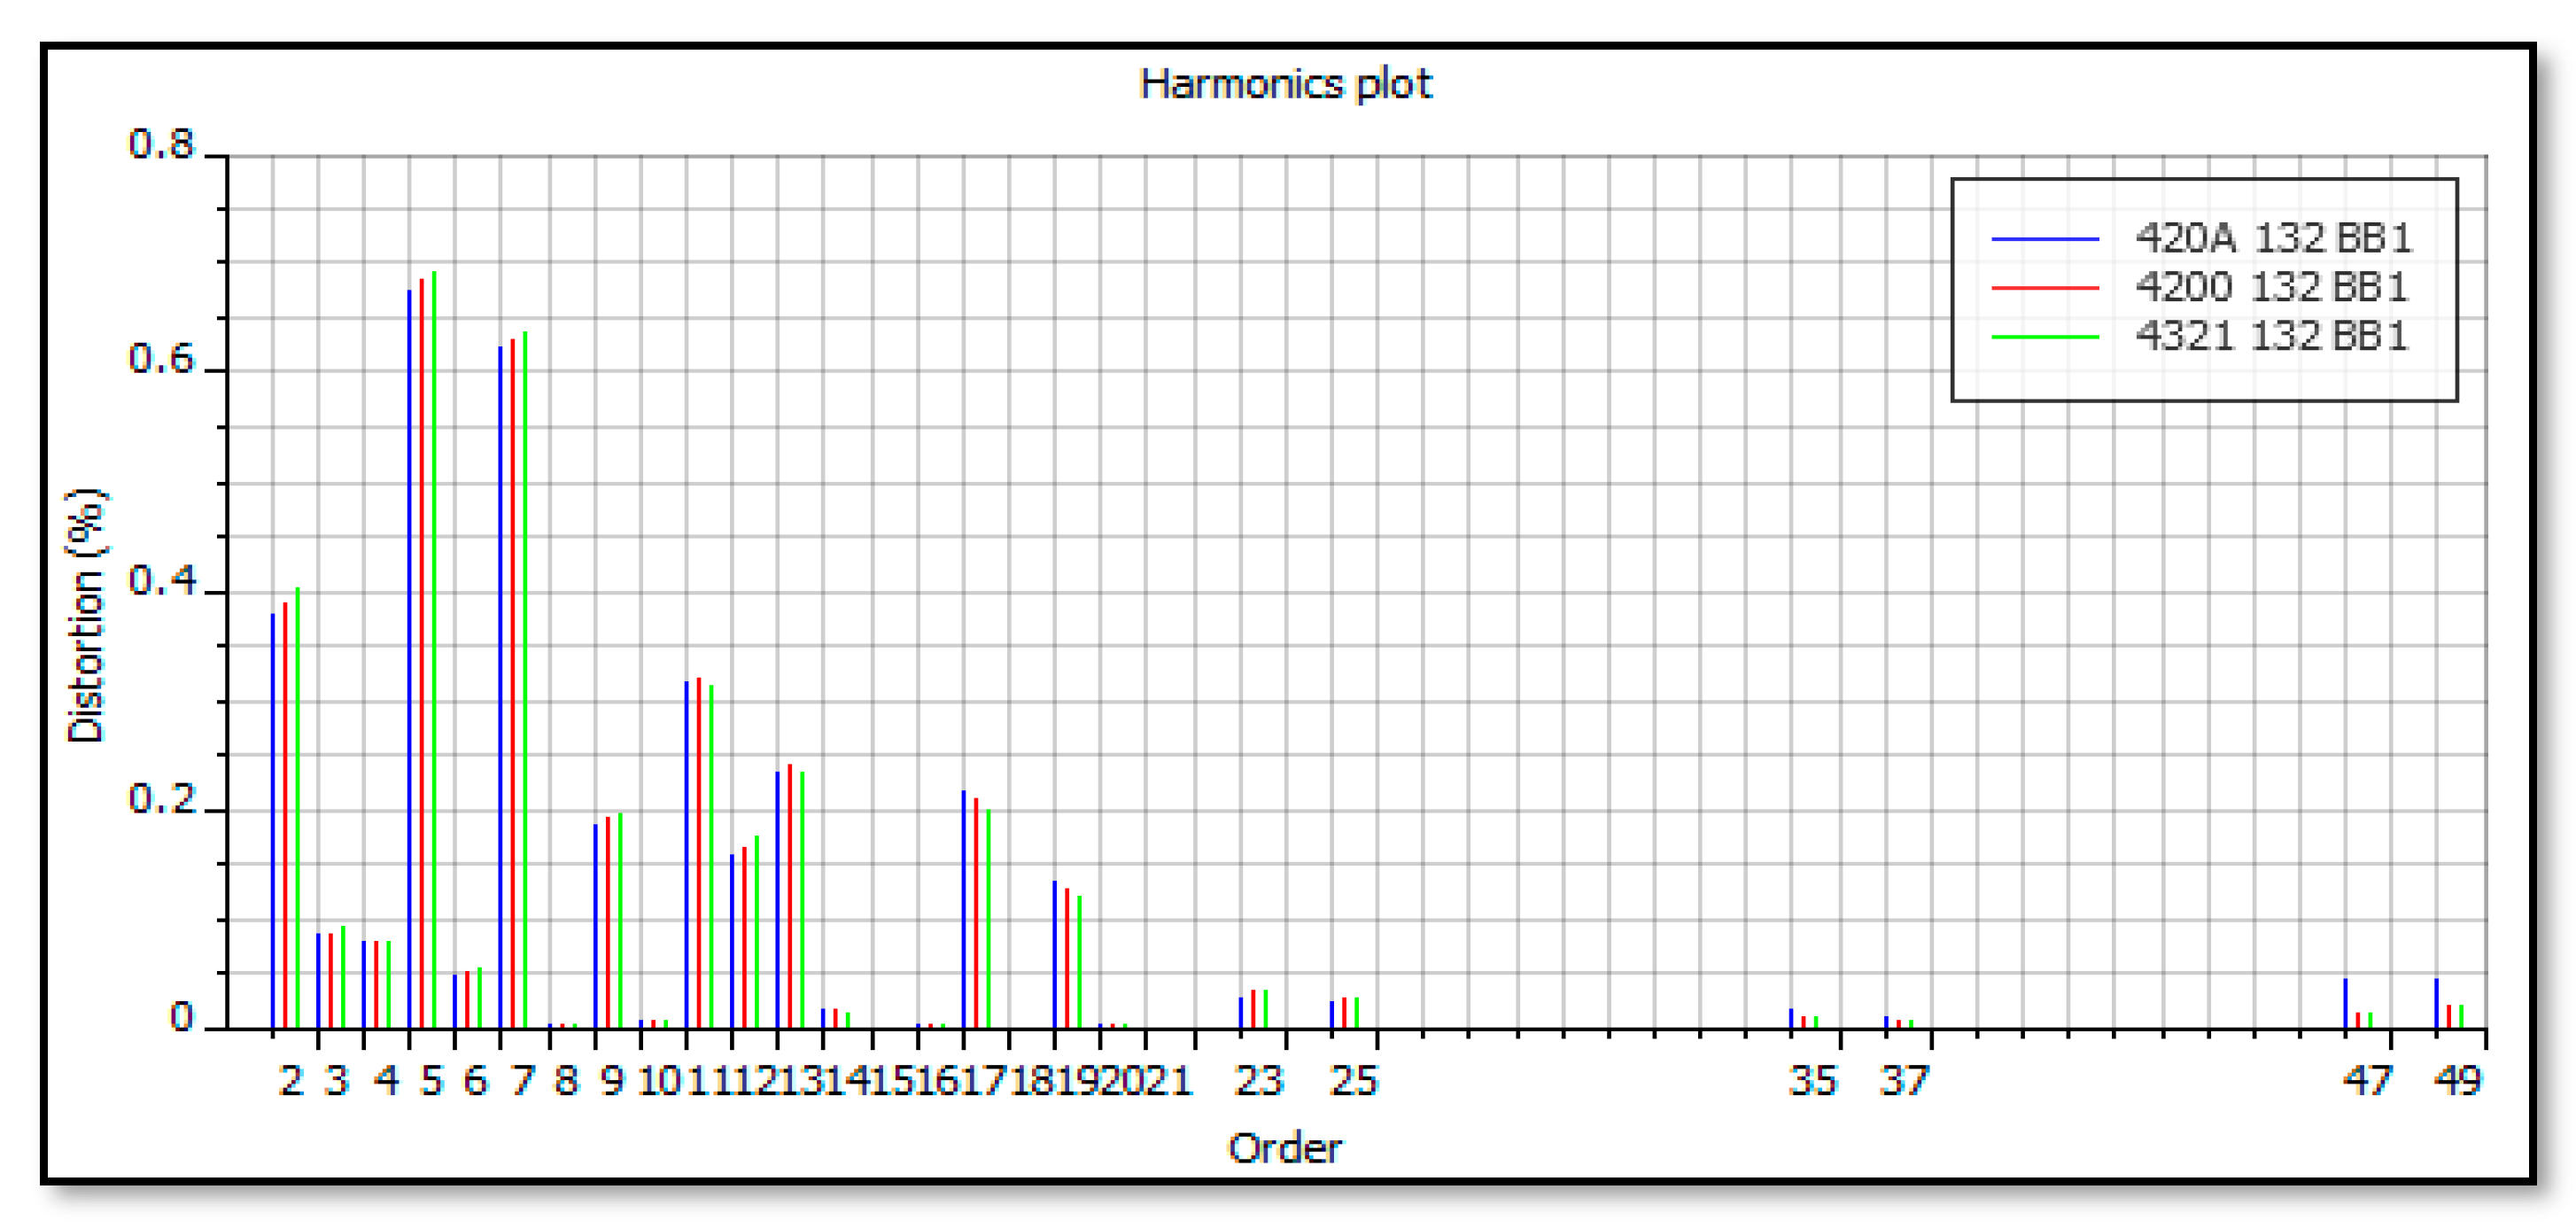
3.2. Harmonic Analysis

Table 4 shows computed values of the THD at 132 kV substations with the maximum acceptable THD being below the standard limit for all cases. The voltage distortion spectra are shown in Figure 2, with small differences between the computed THD and the measured THD as expected. It was found that all individual harmonic distortions were below 1%. Analogous studies made for the 33 kV substations showed that the computed THD was close to the measured value and that the individual harmonic voltage distortions were below 1%.

3.3. Voltage Profiles

The computed and measured voltage profiles for the 132 and 33 kV busbars were found to be very close. It can be said that a good load balance between substations was maintained, with only a small amount of reactive power flow through reactors and little voltage drop.

4. Network Modeling and Analysis with Resistive HT-SFCL

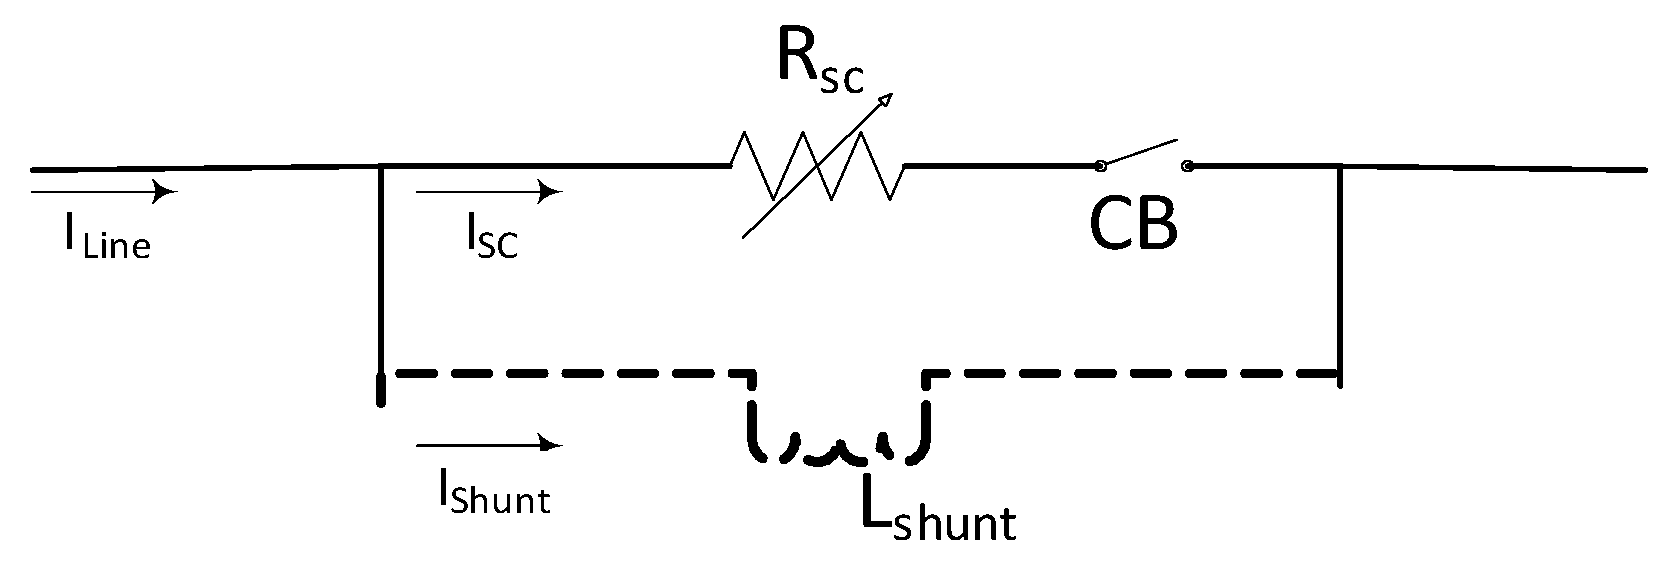
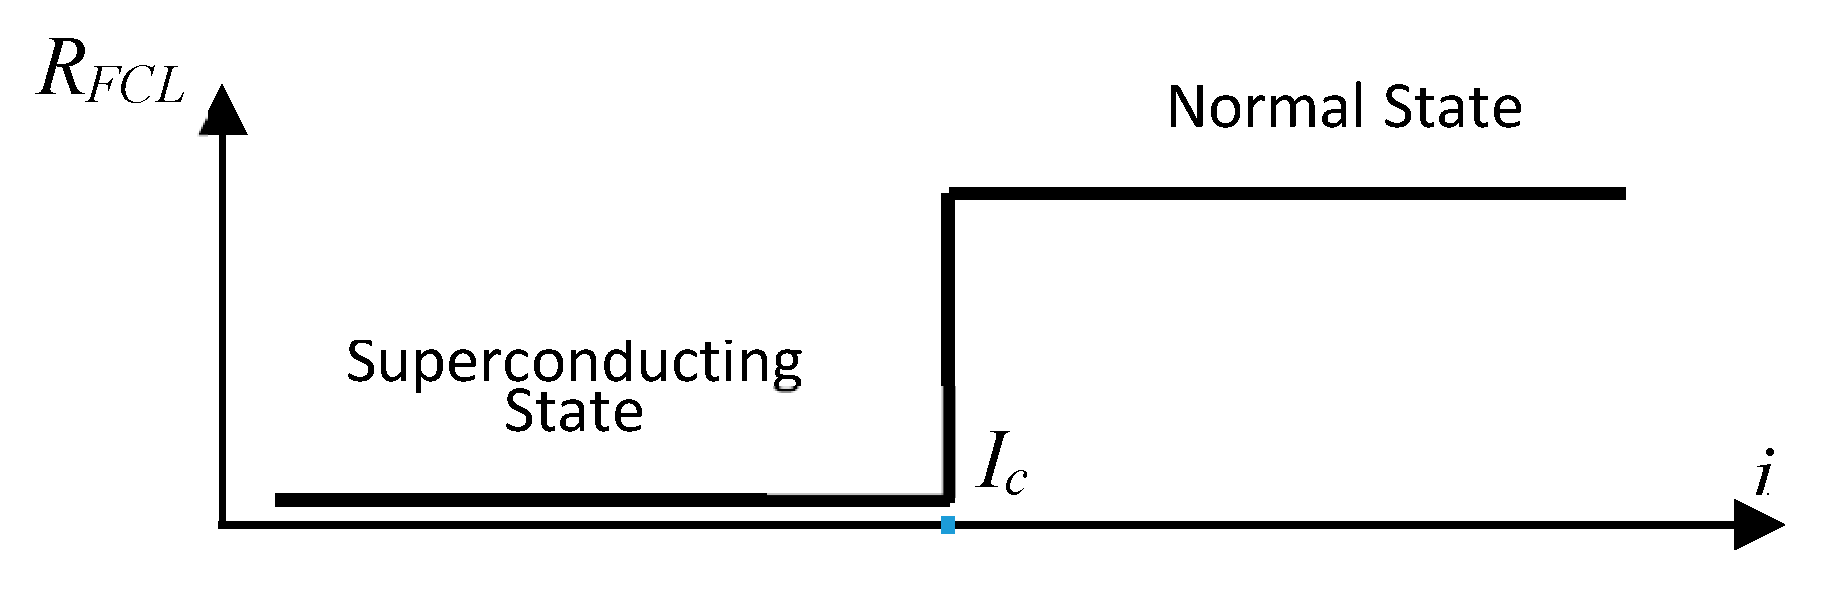
4.1. Resistive HT-SFCL Model

The resistive HT-SFCL was modelled as a non-linear variable resistance (RSC) in parallel with a shunt inductance (Lshunt) to aid with recovery time of the SCFL, as shown in Figure 3. For this study, the currently installed FCL reactors were used to reduce the cost of installing new shunt impedances. The non-linear characteristic of the resistive HT-SCFL describing the transition from the superconducting state to the normal state depends on the type of superconducting material. When the current reaches a critical value during a fault, the superconductor quenches to the normal state in about 3 ms, and then recovers after the fault in a few hundred ms. Understanding the dynamics of this material behavior during the quenching period and the recovery period is important for modelling its transient performance during faults. Substantial research effort has been devoted to developing numerical models for the non-linear characteristics of the material, usually formulated by a power law field-current density relationship of the form [20,21,22]
E = E c ( J J c ) n
where Jc is the critical current density and Ec is the critical field at which critical current is reached. Usually Ec = 1 μv/m is taken to determine the value of the critical current.
This relationship and some of its variants have been used extensively for modelling fault current limiters in power system applications [23,24,25,26,27,28,29,30]. In this study, since only steady-state analysis is considered, we assume instantaneous response of the HT-SFCL after quenching. In this case, the E–J relationship approximates a critical state model, as shown in Figure 4. The relationship of the SFCL resistance RFCL with current i is then given by:
R F C L = { R S C , i < I c R m a x , i I c
where RSC is the resistance of the FCL in the superconducting state, and Rmax is the resistance of the FCL in the normal state. The value of the maximum resistance is chosen to be equal to the reactance value of the shunt series current limiting reactor in order for the resistive HTS-FCL to share equally the fault current with the other current limiting reactor. The value of the superconducting resistances together with the ratings for the 132 and 33 kV HT-SFCLs in each phase were calculated in order to provide approximately a similar fault mitigation performance in the steady-state, and are summarized in Table 5. Additionally, for the three-phase symmetrical fault analysis, the differences in quenching times between each phase were neglected.
Three resistive HT-SFCLs were placed in parallel with the existing reactor FCLs (R11 and R12) and (R13 and R14) for the 132 kV busbars, and reactors (R1 and R2) for the 33 kV busbars. The fault and harmonic analyses were performed with the SFCL in the normal state resistor state and voltage analysis was performed with the SFCL in the superconducting state.

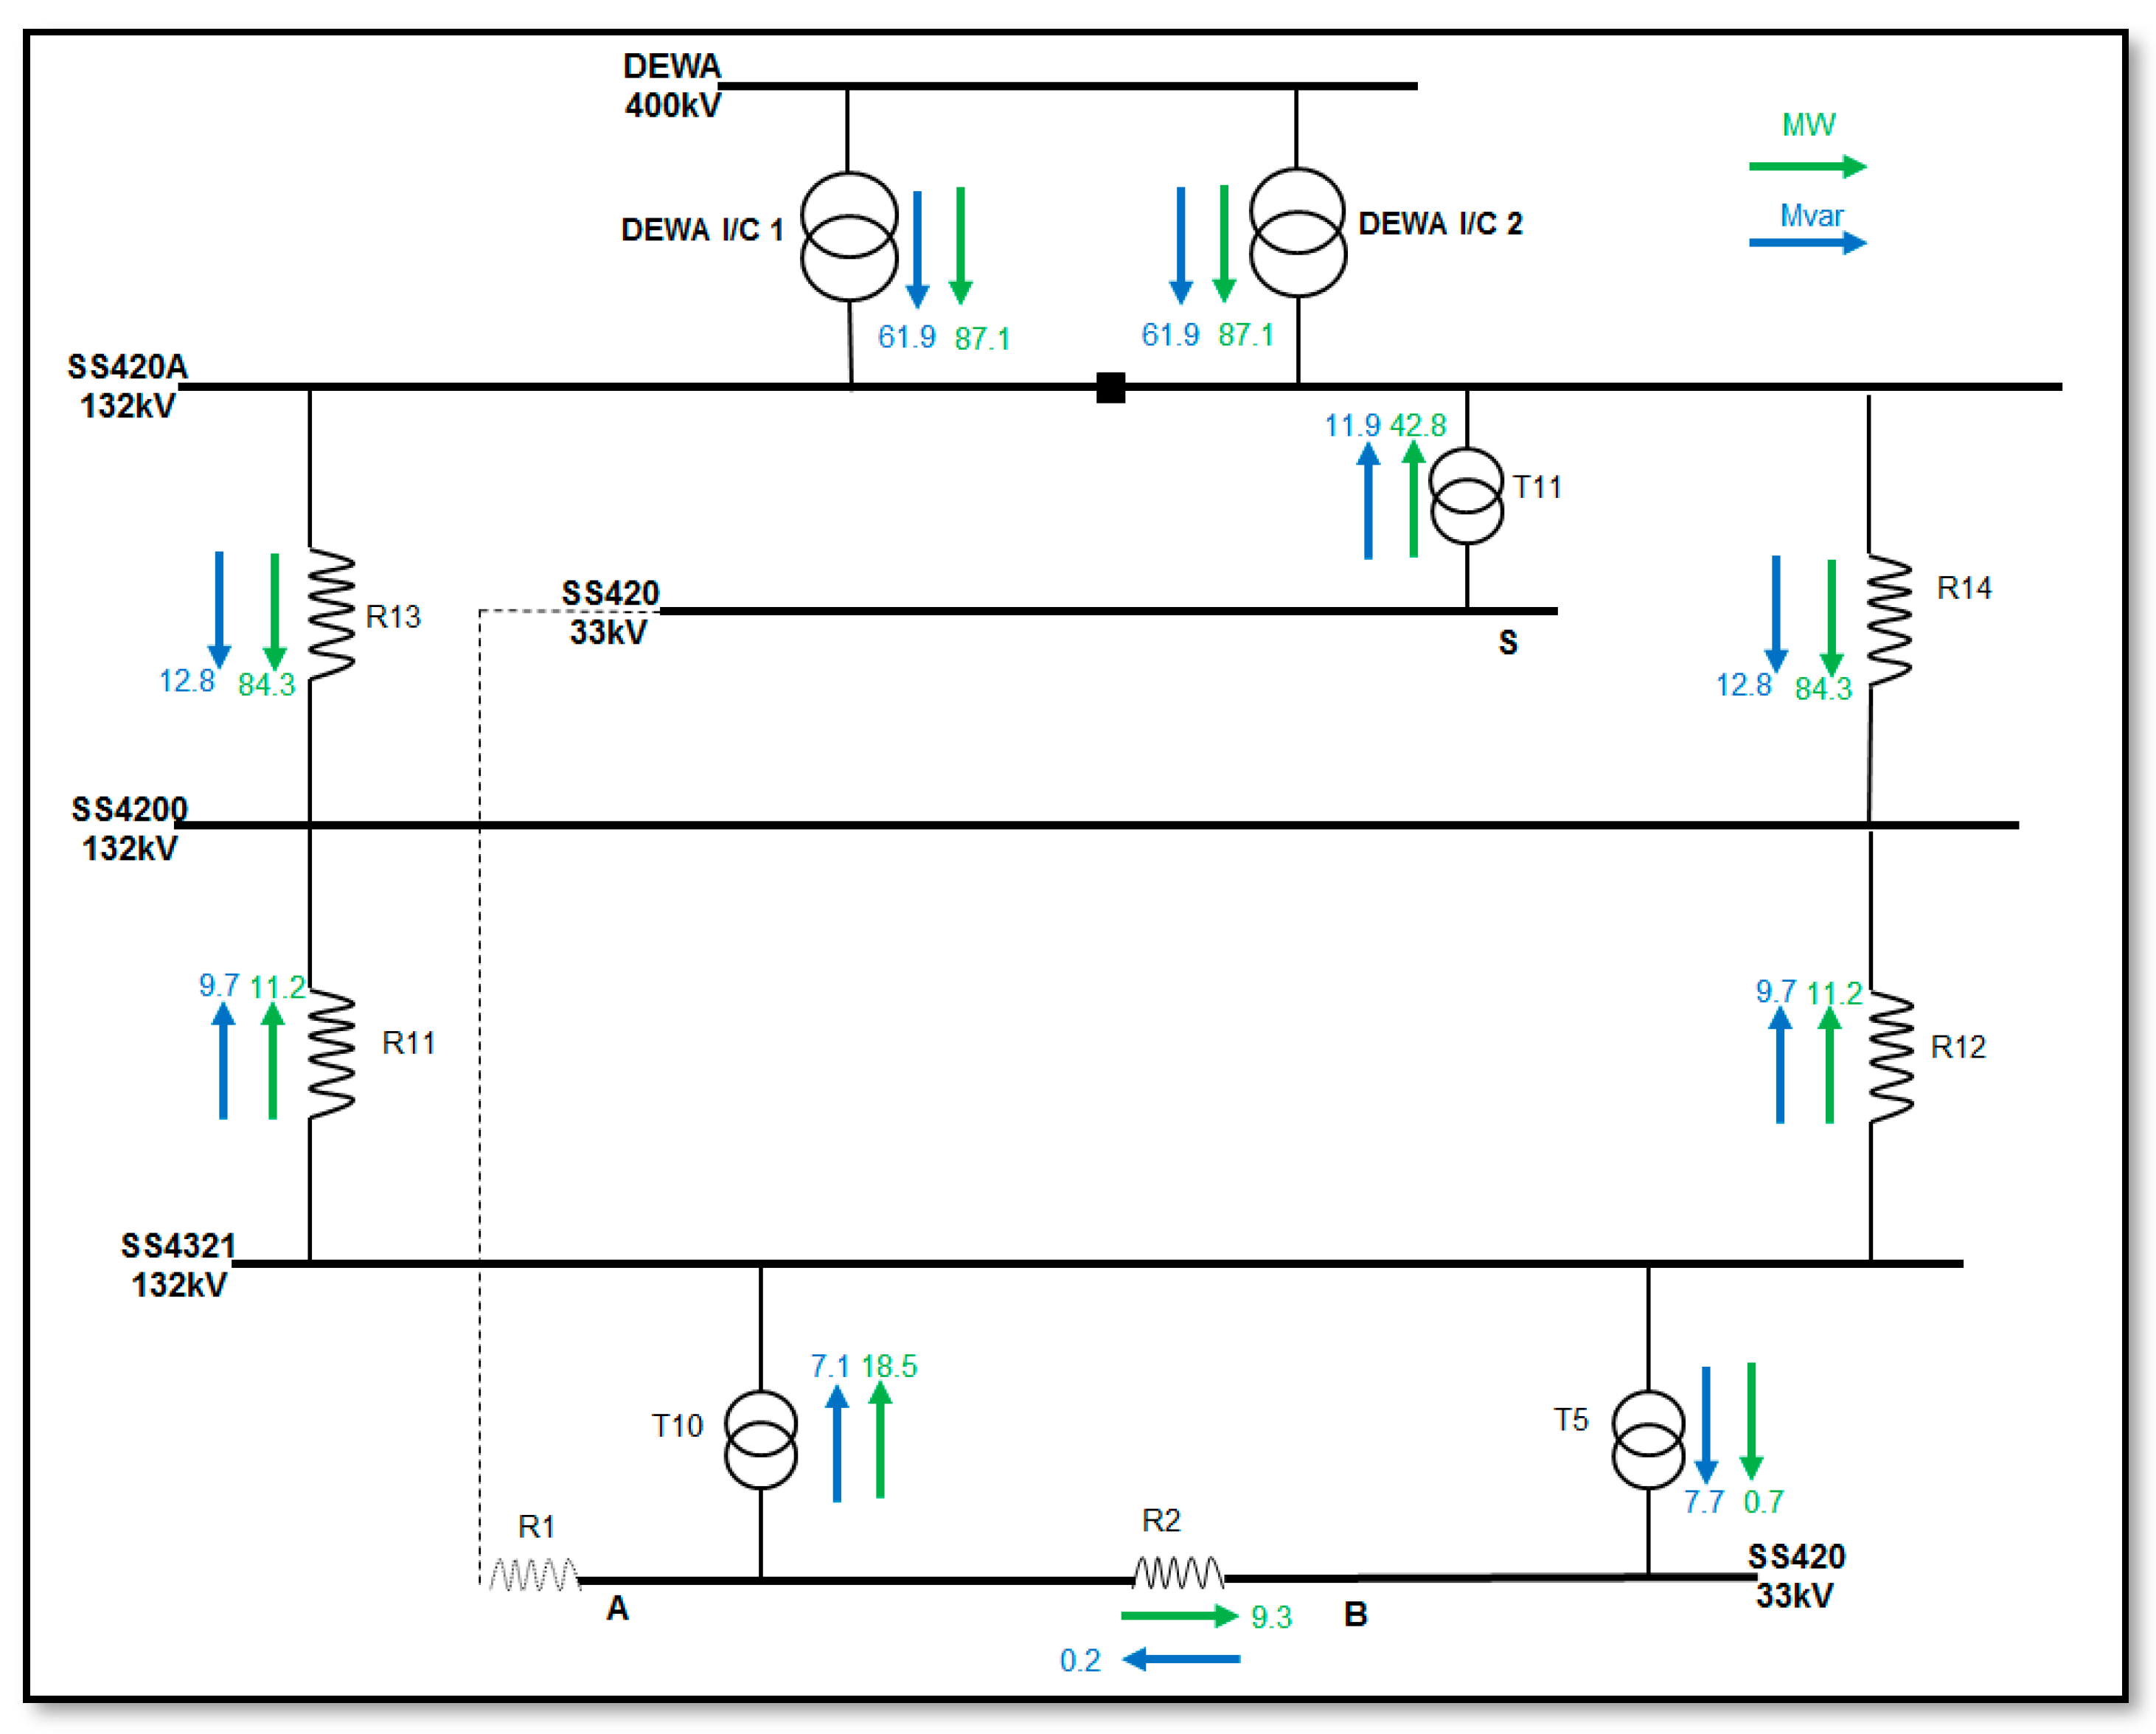
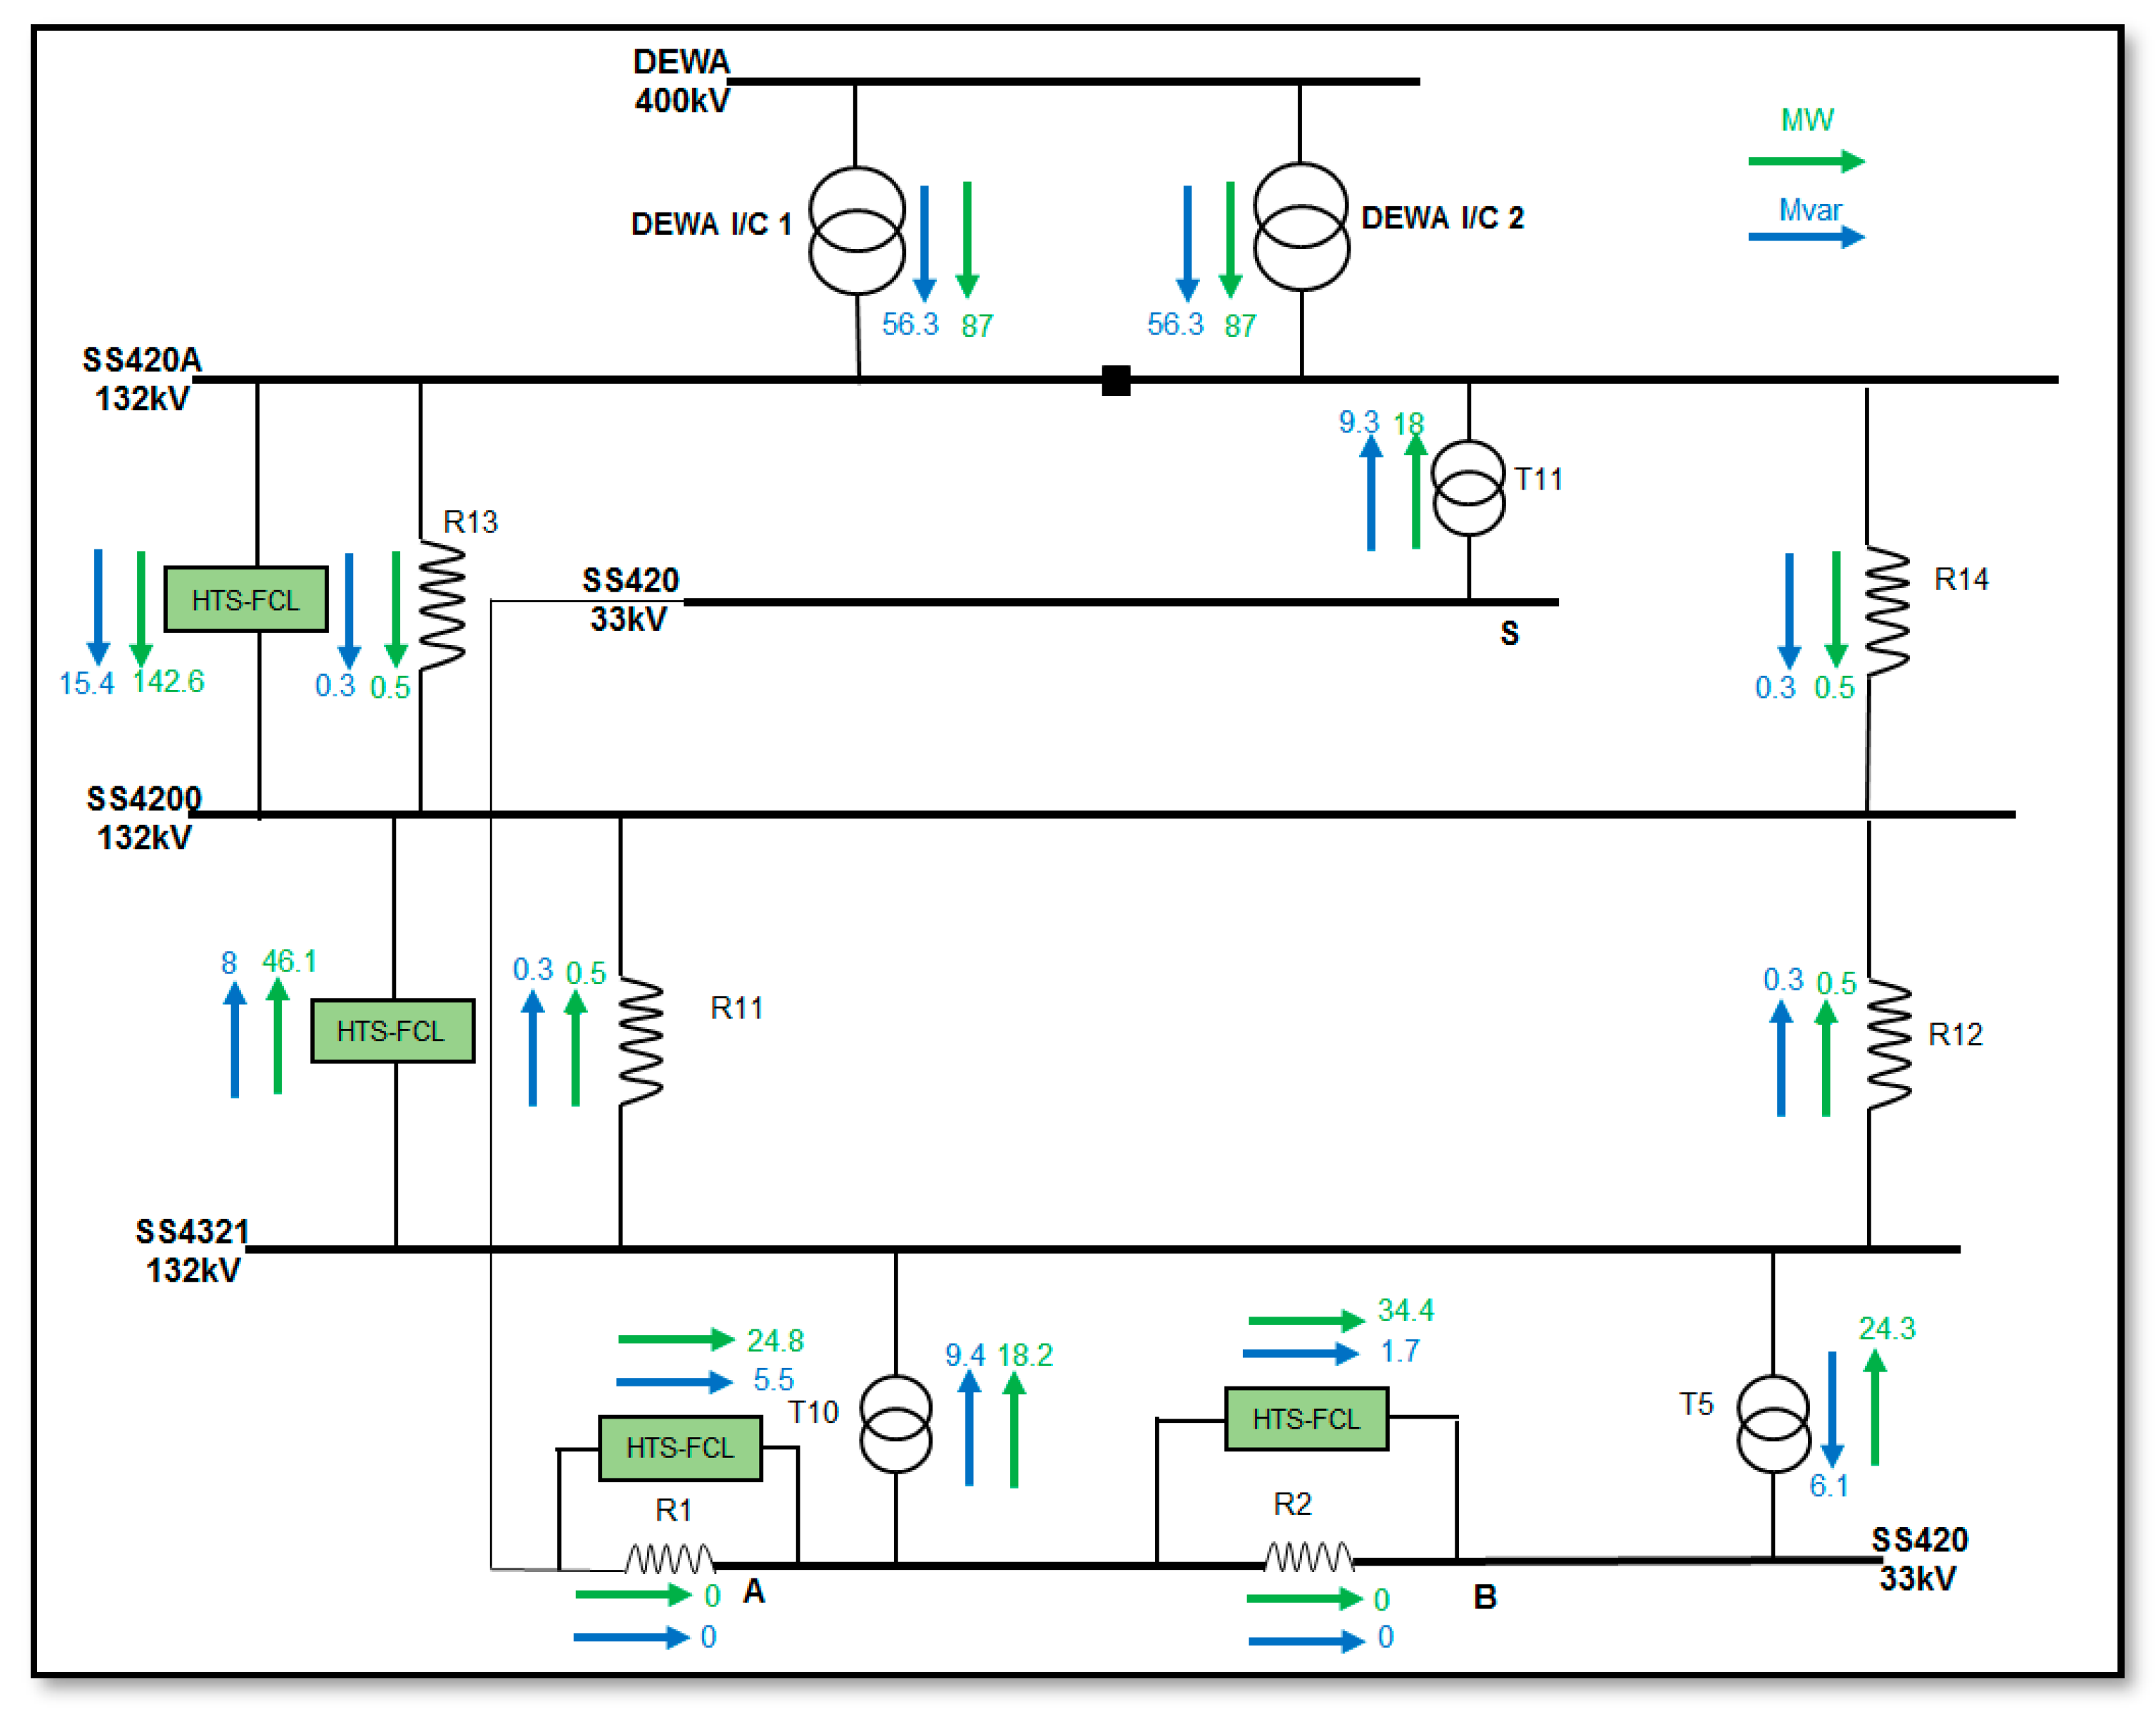
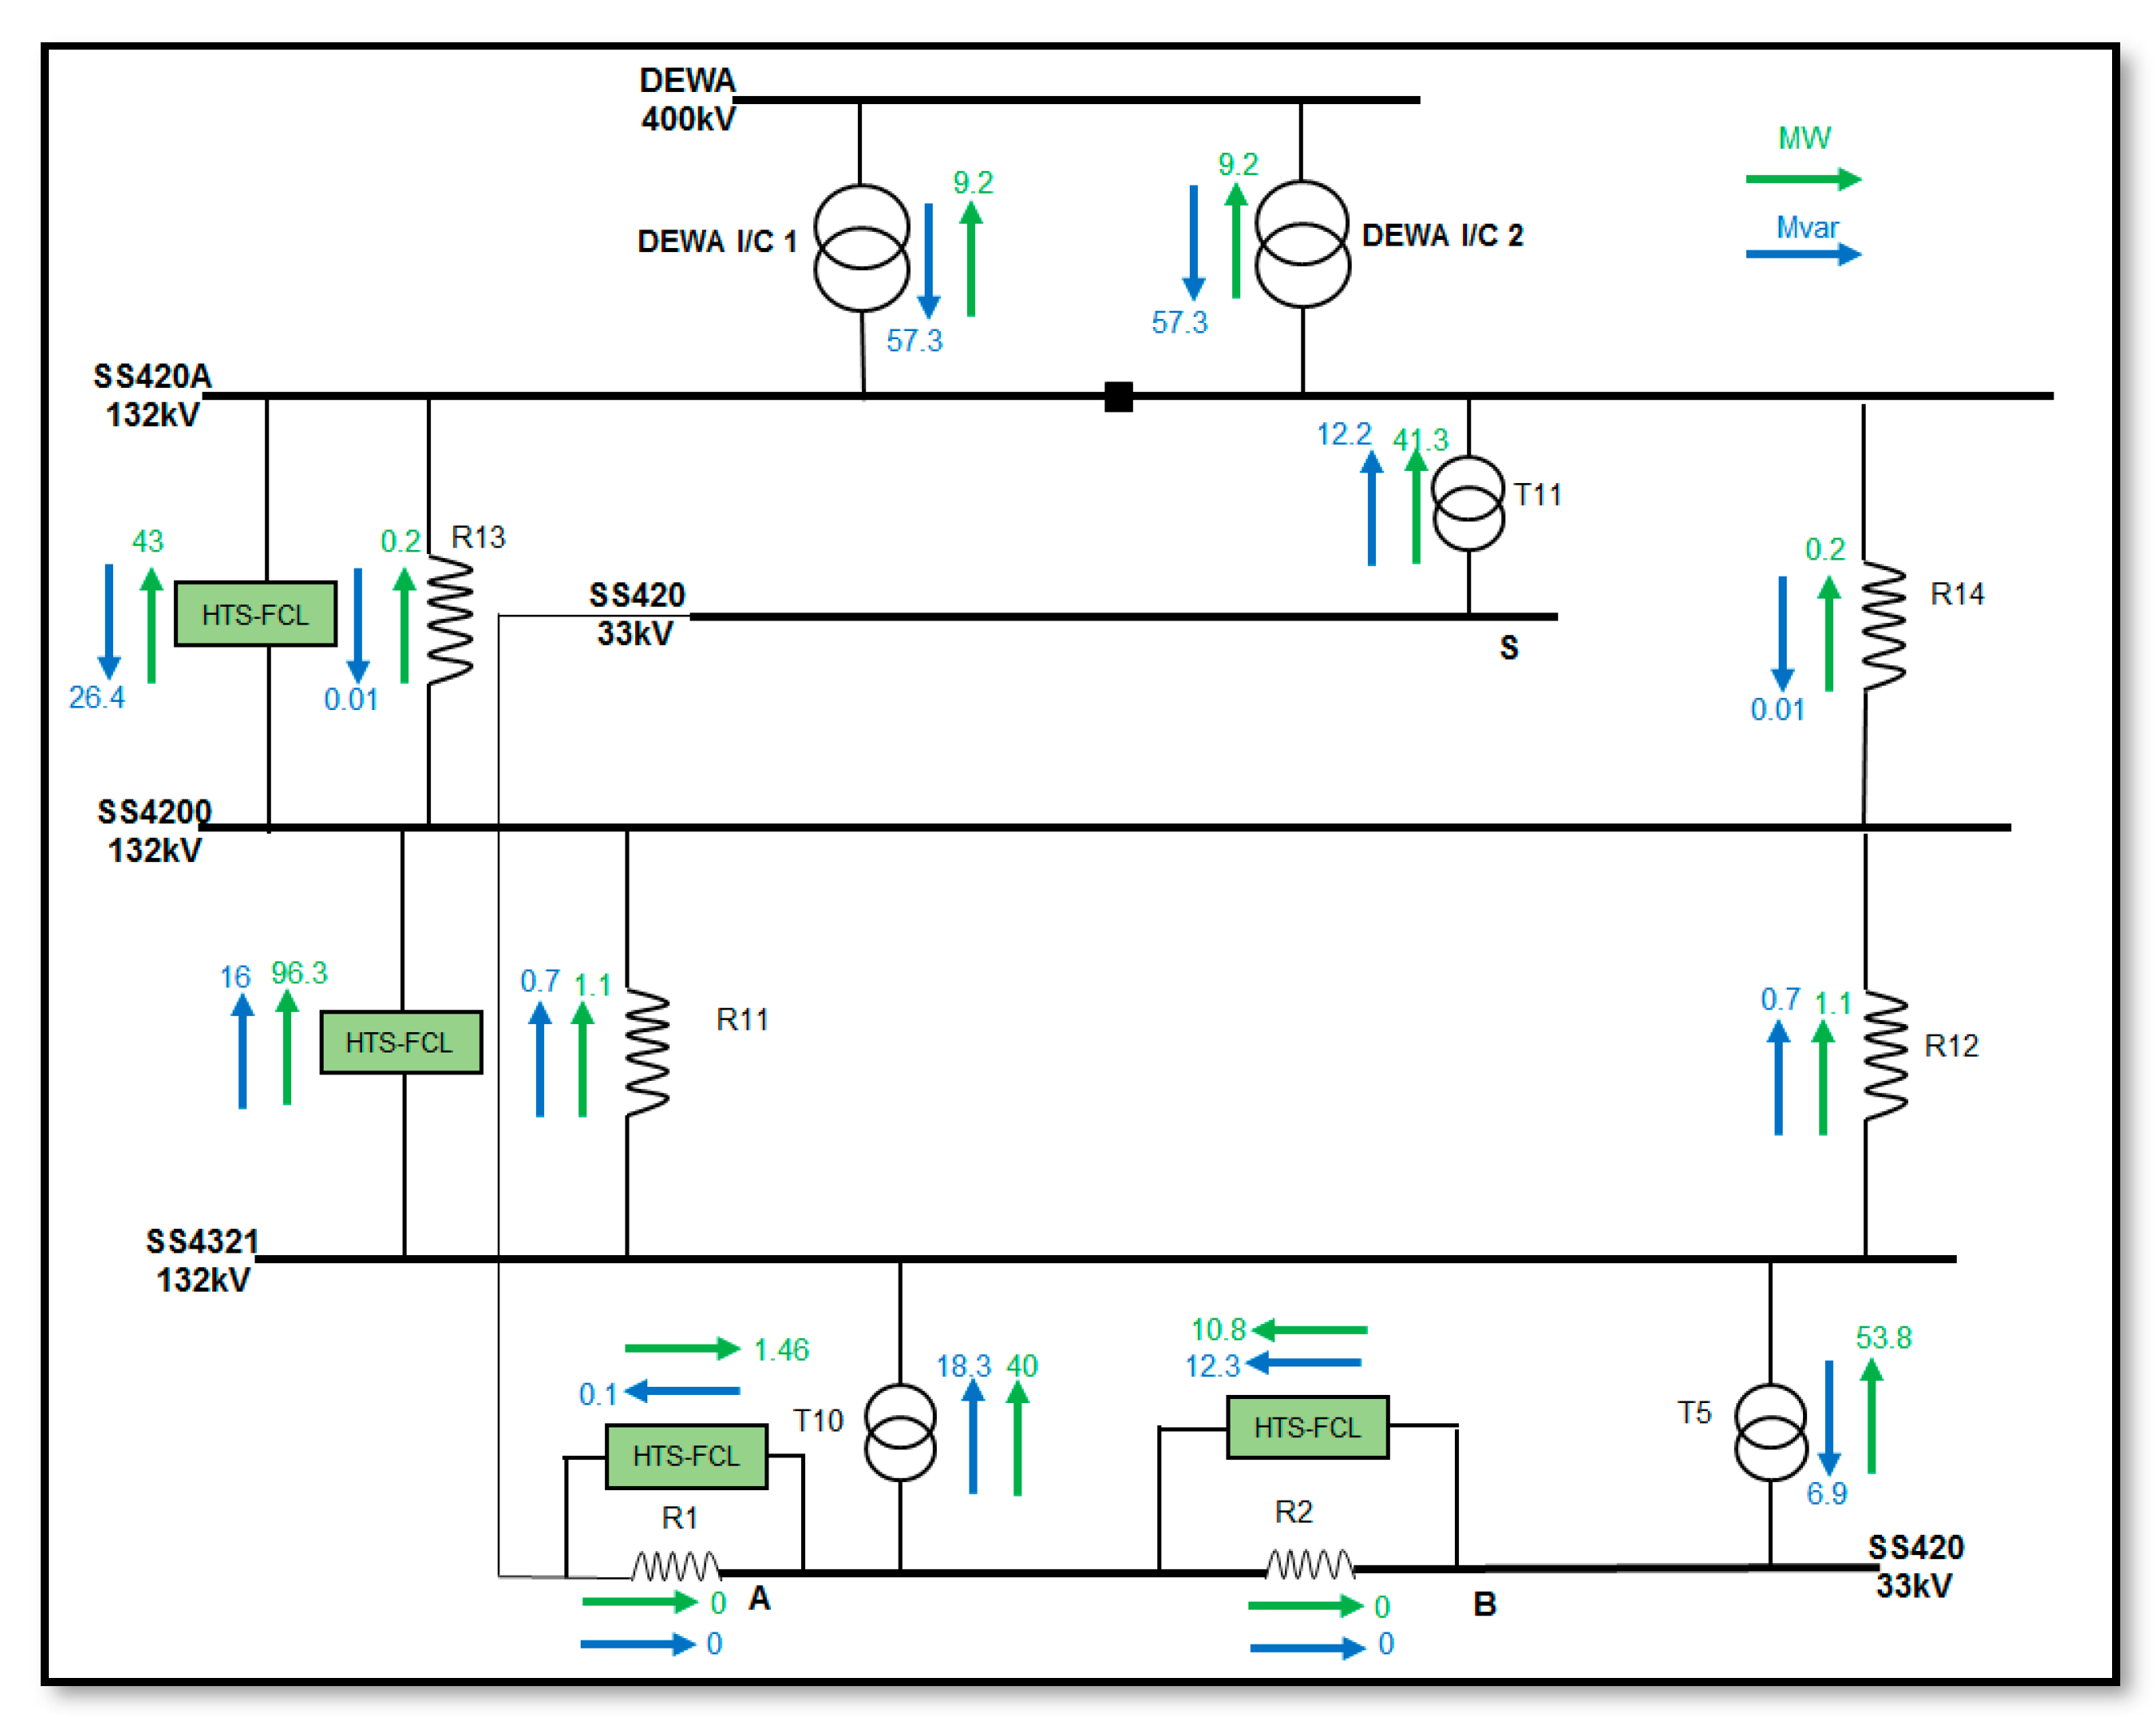
4.2. Network Model with HT-SFCL

The simplified single line diagram of the network with resistor HT-SFCLs is shown in Figure 5. Six different network configurations are considered; (i) Configurations 1–4, where only one of the four FCLs is in operation, (ii) configuration 5, where both (R HT-SFCL 1 and HT-SFCL 2) are in operation, and (iii) configuration 6, where all FCLs are in operation:
  • Configuration 1: 132 kV resistor HTS-FCL between SS4200 and SS4321 only in operation.
  • Configuration 2: 33 kV resistor HTS-FCL in SS420 between section A and section B is only in operation.
  • Configuration 3: 132 kV resistor HTS-FCL between SS4200 and SS420A is only in operation.
  • Configuration 4: 33 kV resistor HTS-FCL in SS420 between section S and section A is only in operation.
  • Configuration 5: Both 132 and 33 kV resistor HTS-FCLs are in operation (R-HTS-FCL1 and R-HTS-FCL2).
  • Configuration 6: All 132 and 33 kV resistor HTS-FCLs are in operation.
Analysis of the results showed that Configuration 6 gave the best SFCL performance and, accordingly, only its results are considered in the next sections.

4.3. Network with HT-SFCL—Configuration 6

Analysis in this case is made with all 132 and 33 kV resistor HT-SFCLs installed. The results for three-phase and one-phase breaking currents are shown in Table 6 and Table 7. Compared with the results shown in Table 2 and Table 3, a slight reduction occurs in the margins of the three-phase and one-phase symmetrical breaking short-circuit currents at the 132 and 33 kV substations, but remains within the limits of switchgear ratings. On the other hand, the margins increased for the 132 kV substations and decreased for the 33 kV substation.
Table 8 shows the THD of the 132 kV substations with and without the resistor HT-SFCL. The results remain within the standard defined limits after installation of the HT-SFCL. The percentage voltage distortion spectrum is shown in Figure 6. The 33 kV substations showed overall improvements similar to those obtained at the 132 kV substations. Table 9 shows the THD at the 33 kV busbars is reducing after application of the HT-SFCLs, mainly in the sections of SS420. The voltage profiles with the HT-SFCLs installed were found to be approximately similar to the existing profiles for both 132 and 33 kV substations. Additionally, since most of the load current is diverted to the Resistor HT-SFCLs, the losses in the series reactors are much smaller, resulting in an improved load balance between substations. Furthermore, the phase angle between voltages at the substations is practically zero. The presence of a significant phase angle between the substations causes problems in transformers or reactors which sometimes leads to machine shut down.

5. Contingency Studies

In DUBAL electrical network there are many contingencies that may happen with many scenarios, depending on their probability of occurrence. In this study, two highly probable contingencies are considered: (i) Generator trip and (ii) series reactor trip. In each case, only the voltage profile analysis and load flow study will be conducted under configuration 6. During contingencies there is a period of 30 min in which the real and reactive power imports are allowed from the grid. This allows the operator to reconfigure the network such as starting an additional generating unit to compensate the loss of production. Different control variables can be used, and include transformer taps, reactive power output of the generators, starting of additional generation units and grid active power, and reactive power infeed.

5.1. Generator Trip

In this case, GT-19 tripping scenario is selected to study the effect of generation tripping in SS4200. As a result, the plant loses about 175 MW from both GT-19 and ST-20. The voltage profile analysis on 132 and 33 kV busbars of DUBAL network without and with resistor HT-SFCL immediately after GT-19 tripping is shown in Table 10.
The load flow results without and with resistor HT-SFCL immediately after GT-19 tripping are shown in Figure 7 and Figure 8, respectively.
It can be seen from Table 10 that the voltage level is improved after installing HT-SFCLs. The maximum voltage level improvement is at SS4200 with about 2 kV increment. Comparing Figure 7 and Figure 8, it is seen that the real power flow remains the same while reactive power flow is diverted to SS4200 where GT-19 has tripped. Additionally, the grid reactive power import is reduced by about 12 MVAR after installing HT-SFCLs. In addition, a total of 247 MW and 30 MVAR flows through the Resistive HT-SFCLs, which significantly reduces the losses through the series current limiting reactors.
In order to simulate recovery of the system, the two GTs (GT-12 and GT-9) are started and at the same time ST-20 is adjusted to base load using HRSG-23 replacement mode. The voltage profiles at the 132 and 33 kV busbars without and with resistive HT-SFCL after recovery from GT-19 tripping are shown in Table 11.
The load flows after recovery from GT-19 tripping are shown in Figure 9 and Figure 10 for reactor FCL and resistive SCFCL, respectively.
From Table 11, it is clear that the voltage improves after installing HT-SFCLs. Figure 9 and Figure 10 show that the real power flow decreases through the resistive HT-SFCLs after starting GT-9 and GT-12, while the reactive power flow increases. A total of 150 MW and 55 MVAR flows through the resistive HT-SFCLs.

5.2. Series Reactor Trip

Series reactor tripping is very critical to the system. For the 132 kV system, there are two reactors connected between each of the two substations in order to give more security to the network. However, during one reactor maintenance, the risk of losing the substation interconnection increases. If both reactors are tripped, then some substations will be in island mode. This means that the network frequency becomes very sensitive to any changes in the network. On the other hand, for the 33 kV system, only one reactor is connected between each of the two sections of SS420. The 33 kV reactor tripping will only separate SS420 33 kV sections but, in general, will not affect the system.
After installing all the resistive HT-SFCLs, series reactor tripping becomes less critical to the system because of the HT-SFCLs. For the 132 kV system, there are two reactors between each of the two substations and it will be possible to keep either both reactors in service in parallel to the resistive HT-SFCL, or to take out one reactor and keep it as standby. The risk of going into island mode will be reduced dramatically because there will be three interconnections between the substations, rather than two interconnections. On the other hand, for the 33 kV system, system redundancy will improve because SS420 sections interconnection will have two connections.

6. Conclusions

The possibility of applying the HT-FCLs to reduce fault current in the DUBAL power plant was explored. Resistive HT-SFCLs were introduced at the 132 and 33 kV busbars and used in four different locations to study its performance under six different configurations. The configuration requiring four resistive HT-SFCLs to be installed in four different locations gave the best network performance. The study conclusions are: The installation of resistive HT-SCFLs should improve DUBAL network security by increasing the level of redundancy and making the network more solid. It would also improve its stability by improving voltage levels at substation busbars, and eliminate or greatly reduce network losses in series reactors as well as network harmonic losses. The network response during contingencies and forced outages should also be improved.

Author Contributions

Methodology, H.N. and N.H.; Software, H.N.; Validation, N.H. and H.G., Formal Analysis, H.N. and N.H.; Investigation, N.H. and H.G.; Data Curation, H.N.; Writing—Original Draft Preparation, H.N., N.H. and H.G.; Writing—Review and Editing, N.H. and H.G.; Supervision, N.H. and H.G., Project Administration, N.H.

Funding

This research received no external funding.

Conflicts of Interest

The authors declare no conflict of interest.

References

  1. Morandi, A. State of the art of superconducting fault current limiters and their application to the electric power system. Phys. C Supercond. 2013, 484, 242–247. [Google Scholar] [CrossRef]
  2. Kalsi, S.S. Applications of High Temperature Superconductors to Electric Power Equipment; John Wiley and Sons: Hoboken, NJ, USA, 2011; Volume 26. [Google Scholar]
  3. Noe, M.; Steurer, M. High-temperature superconductor fault current limiters: concepts, applications, and development status. Supercond. Sci. Technol. 2007, 20, R15–R29. [Google Scholar] [CrossRef]
  4. Kovalsky, L.; Yuan, X.; Tekletsadik, K.; Keri, A.; Bock, J.; Breuer, F. Applications of superconducting fault current limiters in electric power transmission systems. IEEE Trans. Appl. Supercond. 2005, 15, 2130–2133. [Google Scholar] [CrossRef]
  5. Xie, Y.-Y.; Marchevsky, M.; Zhang, X.; Lenseth, K.; Chen, Y.; Xiong, X.; Qiao, Y.; Rar, A.; Gogia, B.; Schmidt, R.; et al. Second-Generation HTS Conductor Design and Engineering for Electrical Power Applications. IEEE Trans. Appl. Supercond. 2009, 19, 3009–3013. [Google Scholar]
  6. Lee, B.W.; Rhee, S.B. Test Requirements and Performance Evaluation for Both Resistive and Inductive Superconducting Fault Current Limiters for 22.9 kV Electric Distribution Network in Korea. IEEE Trans. Appl. Supercond. 2010, 20, 1114–1117. [Google Scholar] [CrossRef]
  7. Elschner, S.; Breuer, F.; Noe, M.; Rettelbach, T.; Walter, H.; Böck, J. Manufacturing and testing of MCP 2212 bifilar coils for a 10 MVA fault current limiter. IEEE Trans. Appl. Supercond. 2003, 13, 1980–1983. [Google Scholar] [CrossRef]
  8. Abbott, S.B.; Robinson, D.A.; Perera, S.; Darmann, F.A.; Hawley, C.J.; Beales, T.P. Simulation of HTS saturable core-type FCLs for MV distribution syste+ms. IEEE Trans. Power Del. 2006, 21, 1013–1018. [Google Scholar] [CrossRef]
  9. Ruiz, H.S.; Zhang, X.; Coombs, T.A.; Rondan, H.S.R.; Zhong, Z. Resistive-Type Superconducting Fault Current Limiters: Concepts, Materials, and Numerical Modeling. IEEE Trans. Appl. Supercond. 2015, 25, 1–5. [Google Scholar] [CrossRef]
  10. Lee, H.; Kang, H. Conceptual Design of a Resistive 154 kV/2 kA Superconducting Fault Current Limiter. IEEE Trans. Appl. Supercond. 2016, 26, 1–5. [Google Scholar] [CrossRef]
  11. Noe, M.; Hobl, A.; Tixador, P.; Martini, L.; Dutoit, B. Conceptual Design of a 24 kV, 1 kA Resistive Superconducting Fault Current Limiter. IEEE Trans. Appl. Supercond. 2012, 22, 5600304. [Google Scholar] [CrossRef]
  12. Dommerque, R.; Krämer, S.; Hobl, A.; Böhm, R.; Bludau, M.; Bock, J.; Klaus, D.; Piereder, H.; Wilson, A.; Krüger, T.; et al. First commercial medium voltage superconducting fault-current limiters: Production, test and installation. Supercond. Sci. Technol. 2010, 23, 34020. [Google Scholar] [CrossRef]
  13. Bock, J.; Bludau, M.; Dommerque, R.; Hobl, A.; Kraemer, S.; Rikel, M.O.; Elschner, S. HTS Fault Current Limiters—First Commercial Devices for Distribution Level Grids in Europe. IEEE Trans. Appl. Supercond. 2011, 21, 1202–1205. [Google Scholar] [CrossRef]
  14. Martini, L.; Bocchi, M.; Ascade, M.; Valzasina, A.; Rossi, V.; Ravetta, C.; Angeli, G. The first Italian Superconducting Fault Current Limiter: Results of the field testing experience after one year operation. J. Phys. Conf. Ser. 2014, 507, 032003. [Google Scholar] [CrossRef]
  15. El Moursi, M.S.; Hegazy, R. Novel Technique for Reducing the High Fault Currents and Enhancing the Security of ADWEA Power System. IEEE Trans. Power Syst. 2013, 28, 140–148. [Google Scholar] [CrossRef]
  16. Fotuhi-Firuzabad, M.; Aminifar, F.; Rahmati, I. Reliability Study of HV Substations Equipped With the Fault Current Limiter. IEEE Trans. Power Deliv. 2012, 27, 610–617. [Google Scholar] [CrossRef]
  17. Alaraifi, S.; El Moursi, M.S.; Zeineldin, H.H. Optimal Allocation of HTS-FCL for Power System Security and Stability Enhancement. IEEE Trans. Power Syst. 2013, 28, 4701–4711. [Google Scholar] [CrossRef]
  18. IEC. Limitation of Emission of Harmonic Currents for Equipment Connected to Medium and High Voltage Supply Systems; IEC 61000-3-6; IEC: Geneva, Switzerland, 1996. [Google Scholar]
  19. IEEE. IEEE Recommended Practices and Requirements for Harmonic Control in Electrical Power Systems; IEEE Std 519-1992; IEEE: Piscatway, NJ, USA, 1993; pp. 1–112. [Google Scholar]
  20. Stavrev, S.; Vinot, F.; Klutsch, I.; Meunier, G.; Tixador, P.; Yang, Y.; Martinez, E. Comparison of Numerical Methods for Modeling of Superconductors. IEEE Trans. Magn. 2002, 38, 849–852. [Google Scholar] [CrossRef]
  21. Duron, J.; Grilli, F.; Dutoit, B.; Stavrev, S. Modelling the E–J relation of high-Tc superconductors in an arbitrary current range. Phys. C Supercond. 2004, 401, 231–235. [Google Scholar] [CrossRef]
  22. Morandi, A. 2D electromagnetic modelling of superconductors. Supercond. Sci. Technol. 2012, 25, 104003. [Google Scholar] [CrossRef]
  23. Langston, J.; Steurer, M.; Woodruff, S.; Baldwin, T.; Tang, J. A Generic Real-Time Computer Simulation Model for Superconducting Fault Current Limiters and its Application in System Protection Studies. IEEE Trans. Appl. Supercond. 2005, 15, 2090–2093. [Google Scholar] [CrossRef]
  24. Dutta, S.; Babu, B.C. Modelling and analysis of resistive Superconducting Fault Current Limiter. In Proceedings of the 2014 IEEE Students’ Technology Symposium, (TechSym), Kharagpur, India, 28 February–2 March 2014; pp. 362–366. [Google Scholar]
  25. Gomory, F.; Mosat, M.; Souc, J. Superconducting fault current limiter operating in liquid nitrogen. In Proceedings of the 2014 ELEKTRO, Rajecke Teplice, Slovakia, 19–20 May 2014; pp. 650–653. [Google Scholar]
  26. Lee, G.H.; Park, K.B.; Sim, J.; Kim, Y.G.; Oh, I.S.; Hyun, O.B.; Lee, B.W. Hybrid Superconducting Fault Current Limiter of the First Half Cycle Non-Limiting Type. IEEE Trans. Appl. Supercond. 2009, 19, 1888–1891. [Google Scholar]
  27. Noe, M.; Kudymow, A.; Fink, S.; Elschner, S.; Breuer, F.; Bock, J.; Walter, H.; Kleimaier, M.; Weck, K.-H.; Neumann, C.; et al. Conceptual Design of a 110 kV Resistive Superconducting Fault Current Limiter Using MCP-BSCCO 2212 Bulk Material. IEEE Trans. Appl. Supercond. 2007, 17, 1784–1787. [Google Scholar] [CrossRef]
  28. Llambes, J.-C.; Hazelton, D.; Weber, C. Recovery Under Load Performance of 2nd Generation HTS Superconducting Fault Current Limiter for Electric Power Transmission Lines. IEEE Trans. Appl. Supercond. 2009, 19, 1968–1971. [Google Scholar] [CrossRef]
  29. Ye, L.; Juengst, K.-P. Modeling and Simulation of High Temperature Resistive Superconducting Fault Current Limiters. IEEE Trans. Appl. Supercond. 2004, 14, 839–842. [Google Scholar] [CrossRef]
  30. Choi, H.S.; Lim, S.H.; Chung, D.C.; Han, B.S.; Hyun, O.B.; Sung, T.H.; Hwang, J.S. Responses of resistive superconducting-fault-current-limiters to unbalanced faults. IEEE Trans. Appl. Supercond. 2005, 15, 2035–2038. [Google Scholar] [CrossRef]
Figure 1. Simplified single line diagram of DUBAL electrical power plant.
Energies 12 03007 g001
Figure 2. Voltage harmonic spectrum, 32 kV busbars.
Energies 12 03007 g002
Figure 3. Circuit model of resistive HT-SFCL.
Energies 12 03007 g003
Figure 4. Variation of SCFL resistance with current.
Energies 12 03007 g004
Figure 5. Simplified diagram with HT-SFCL.
Energies 12 03007 g005
Figure 6. Voltage distortion spectrum of 132 kV busbars with HT-SFCL (configuration 6).
Energies 12 03007 g006
Figure 7. Simplified load flow diagram after GT-19 tripping, reactor FCL.
Energies 12 03007 g007
Figure 8. Simplified load flow diagram after GT-19 tripped with HT-SFCL.
Energies 12 03007 g008
Figure 9. Simplified load flow diagram after recovery from GT-19 trip without HT-SFCL.
Energies 12 03007 g009
Figure 10. Simplified load flow diagram after recovery from GT-19 trip with HT-SFCL.
Energies 12 03007 g010
Table 1. DUBAL switchgear ratings.
Voltage LevelSubstation
Name
Symmetrical Breaking Current, kA Asymmetrical Breaking Current, kA Peak Current, kA
132 kV420A4048.9100
132 kV42004049.6100
132 kV43214046.8104
33 kV4204043.5100
Table 2. Fault level for existing DUBAL network (symmetrical RMS).
Symmetrical Short-Circuit Breaking Current
Three-PhaseOne-Phase
BusbarRating [kA]Current [kA]Margin [%]Current [kA]Margin [%]
132 kV_420A4027.71530.734.34414.1
132 kV_42004022.52043.731.77820.6
132 kV_43214019.48151.326.69833.3
33 kV_420_S4012.12169.715.37161.6
33 kV_420_A4013.57266.115.30161.7
33 kV_420_B4013.73265.717.01657.5
Table 3. Fault level for existing DUBAL network, asymmetrical root mean square (RMS) values.
Asymmetrical Short-Circuit Breaking Current
Three-PhaseOne-Phase
BusbarsRating [kA]Current [kA]Margin [%]Current [kA]Margin [%]
132 kV_420A48.938.30921.736.60825.1
132 kV_420049.633.92331.632.66234.1
132 kV_432146.829.18637.627.49841.2
33 kV_420_S43.518.96656.422.16549.0
33 kV_420_A43.519.37855.517.79259.1
33 kV_420_B43.519.04356.220.58552.7
Table 4. Measured and computed THD for 132 kV busbars.
BusbarsMax. THD [%]Measured THD [%]Computed THD [%]
132 kV_420A2.51.461.162
132 kV_42002.51.521.737
132 kV_43212.51.371.592
Table 5. Resistive HTS-FCL specifications installed at the 132 and 33 kV busbars.
Parameter132 kV33 kV
Rated power (MVA)25060
Rated voltage (kV)13233
Rated current (A)1093 1575
SC resistance (RSC, p.u. *)0.000142 0.000241
Max. resistance (Rmax, p.u.)0.040174 0.36497
* on 100 MVA base.
Table 6. Fault levels with HT-SFCL (configuration 6; symmetrical RMS).
Network with
HT-SFCL (Config. 6)
Symmetrical Short-Circuit Breaking Current
Three-PhaseOne-Phase
BusbarsRating [kA]Current [kA]Margin [%]Current [kA]Margin [%]
132 kV_420A4028.29929.334.92612.7
132 kV_42004023.50041.333.00117.5
132 kV_43214020.65048.428.11229.7
33 kV_420_S4016.26459.319.93550.2
33 kV_420_A4018.52753.720.71148.2
33 kV_420_B4014.86062.918.20054.5
Table 7. Fault levels with HT-SFCL (configuration 6; asymmetrical RMS).
Network with
HT-SFCL (Config. 6)
Asymmetrical Breaking Current
Three-PhaseOne-Phase
BusbarsRating [kA]Current [kA]Margin [%]Current [kA]Margin [%]
132 kV_420A48.934.92828.636.70824.9
132 kV_420049.627.08545.433.30632.9
132 kV_432146.823.82149.128.45439.2
33 kV_420_S43.523.64945.630.35130.2
33 kV_420_A43.518.90256.520.79452.2
33 kV_420_B43.519.43755.325.72240.9
Table 8. THD for 132 kV busbars with HT-SFCL (configuration 6).
BusbarsMax. THD [%]THD [%] Reactor FCLTHD [%] HT-SFCL
132 kV_420A2.51.1621.131
132 kV_42002.51.7371.147
132 kV_43212.51.5921.156
Table 9. Computed THD for 33 kV busbars with HT-SFCL (configuration 6).
BusbarsMax. THD [%]THD [%], Reactor FCLTHD [%], HT-SFCL
33 kV_420051.5861.219
33 kV_420_S50.9900.934
33 kV_420_A51.3210.934
33 kV_420_B51.4180.935
Table 10. Voltage levels at 132 and 33 kV busbars after GT-19 tripping.
BusbarsIPSA Voltage Level
Without HT-SFCL [kV]
IPSA Voltage Level
With HT-SFCL [kV]
132 kV_420A128.886129.530
132 kV_4200127.380129.455
132 kV_4321127.917129.473
33 kV_420_S33.06832.969
33 kV_420_A32.84832.967
33 kV_420_B32.88532.964
Table 11. IPSA voltage level of 132 and 33 kV busbars after recovery from GT-19 tripping.
BusbarsIPSA Voltage Level
without HT-SFCL [kV]
IPSA Voltage Level
with HT-SFCL [kV]
132 kV_420A130.938130.202
132 kV_4200129.629130.199
132 kV_4321130.095130.237
33 kV_420_S33.17733.007
33 kV_420_A32.96933.006
33 kV_420_B32.78233.007

