Feasibility Study on Energy Audit and Data Driven Analysis Procedure for Building Energy Efficiency: Bench-Marking in Korean Hospital Buildings


Abstract
:
1. Introduction
1.1. Background and Objectives
1.2. Research Methodology and Procedure
2. Related Work
3. Development of Energy Audit Method for Hospital Buildings
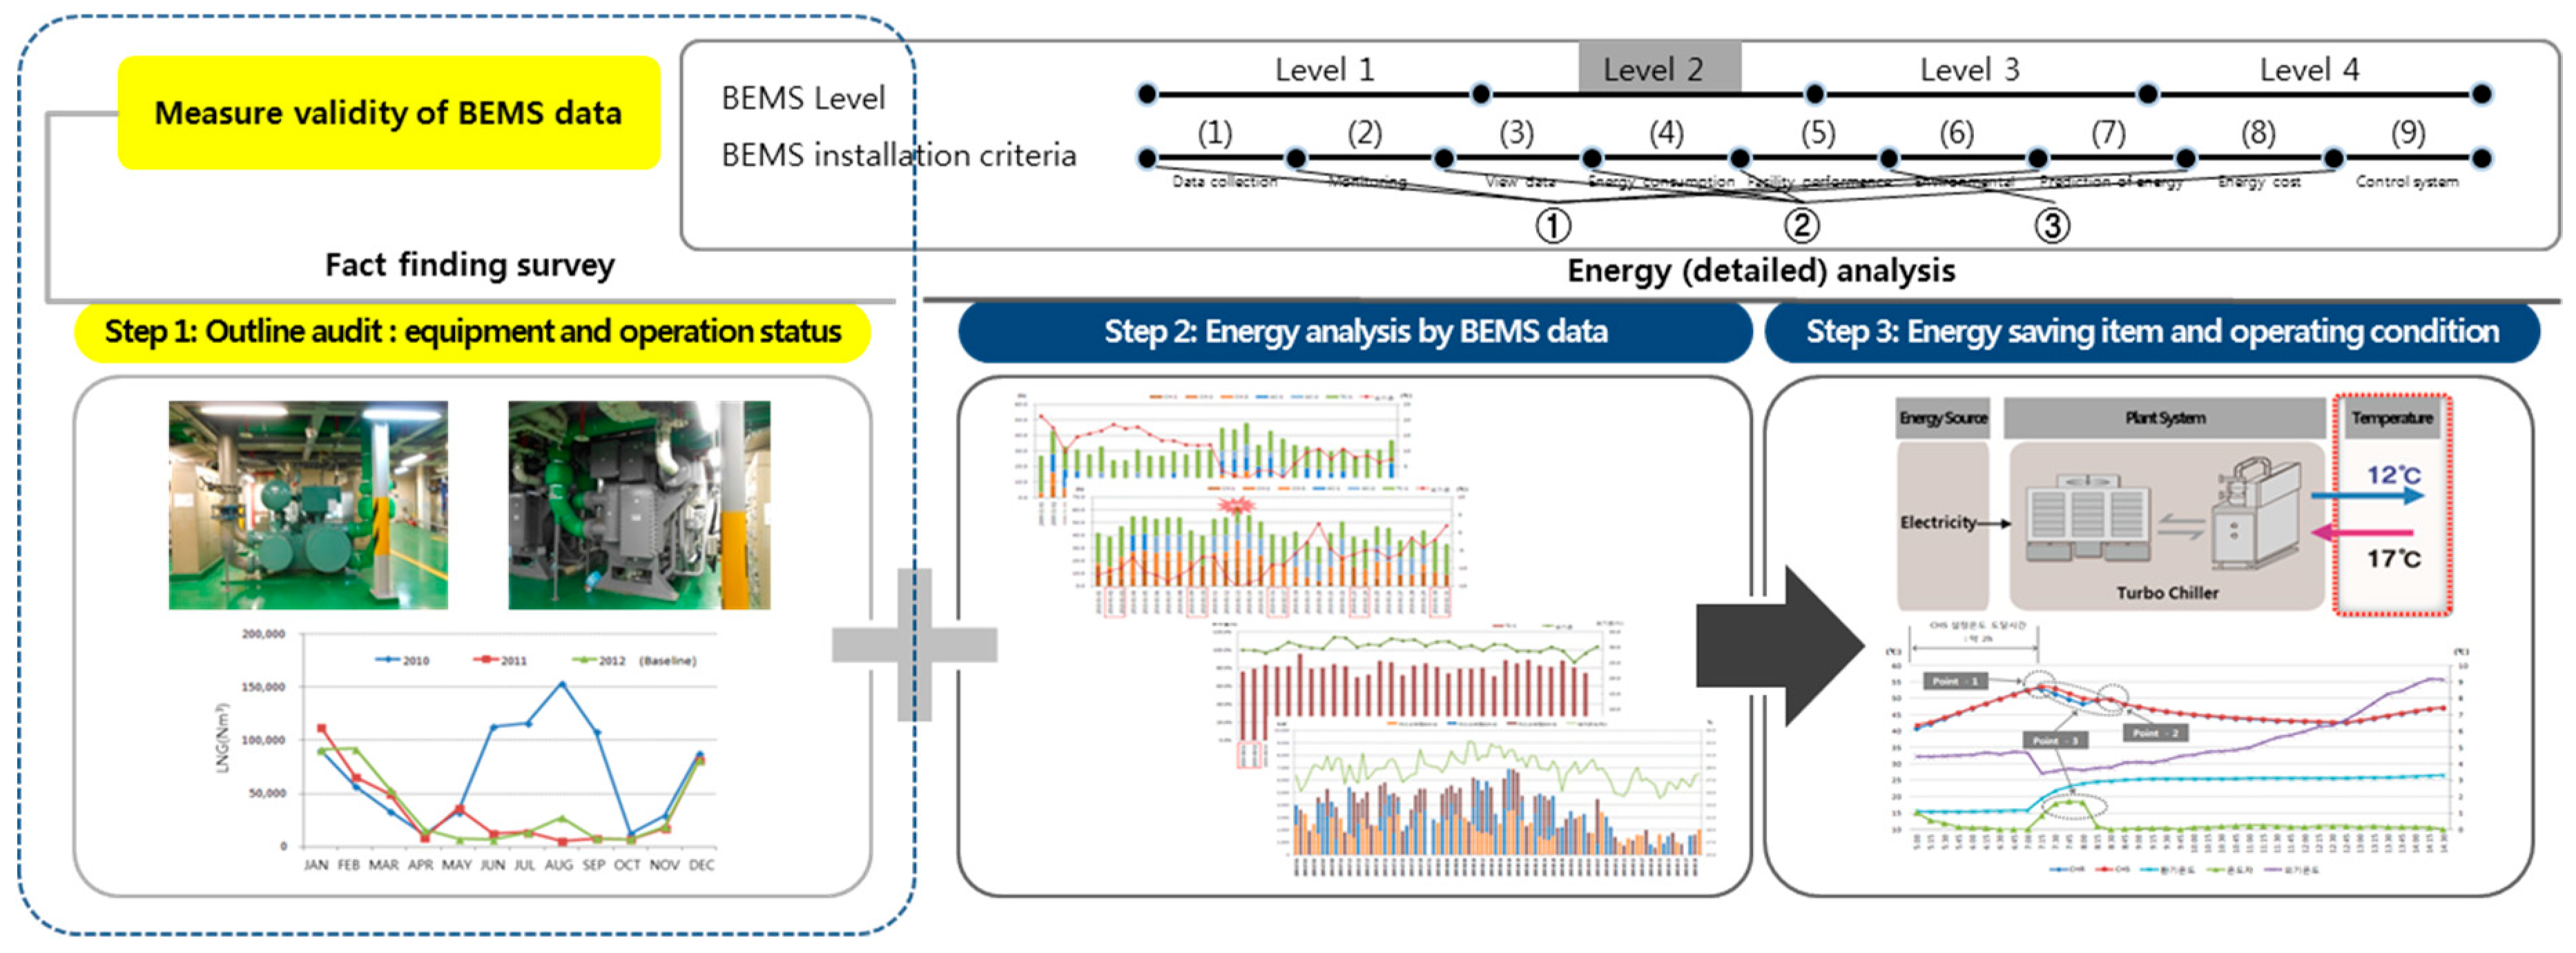
3.1. Stage 1: On-Site Investigation and Preliminary Energy Audit
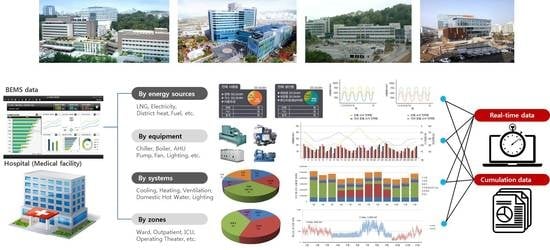
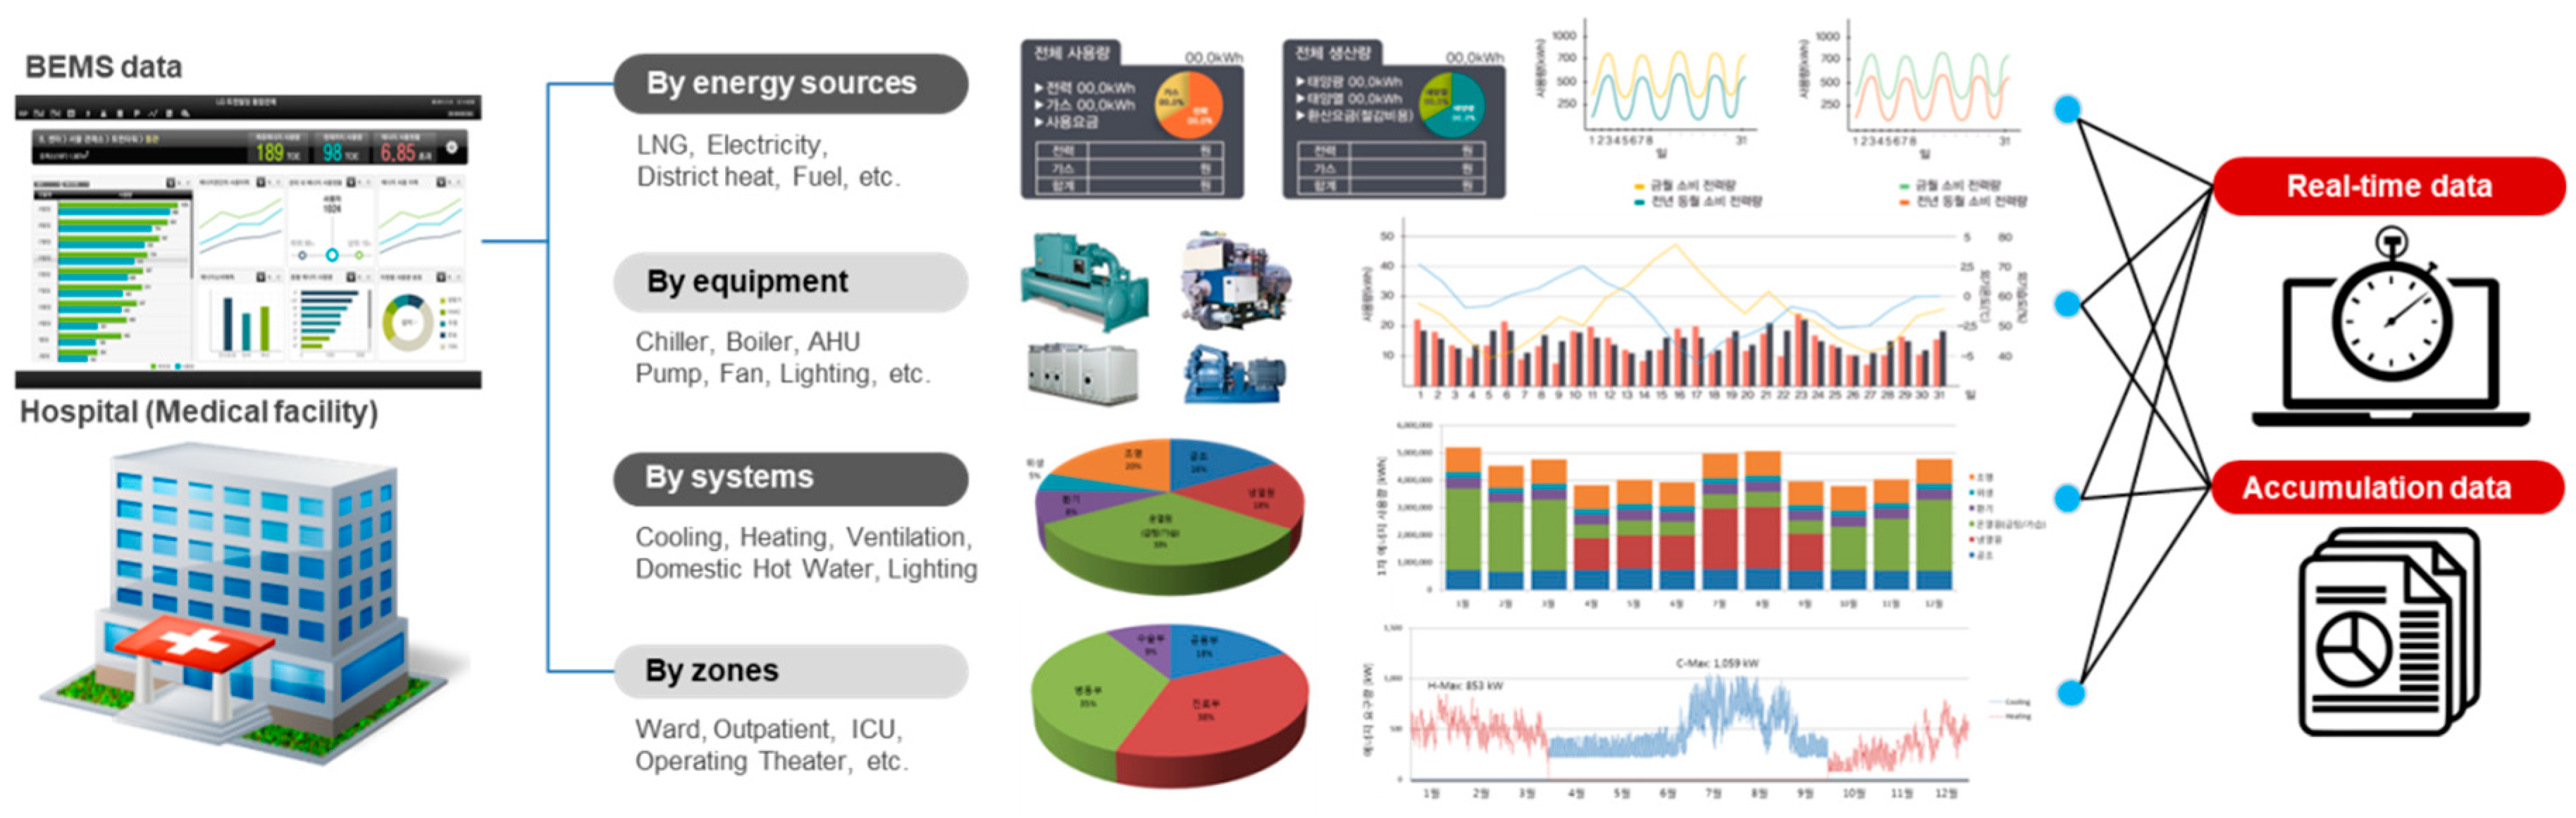
3.2. Stage 2: Data Collection from Remote Energy Monitoring
3.3. Stage 3: Selection of Energy-Related Factors and Performance Evaluation Items
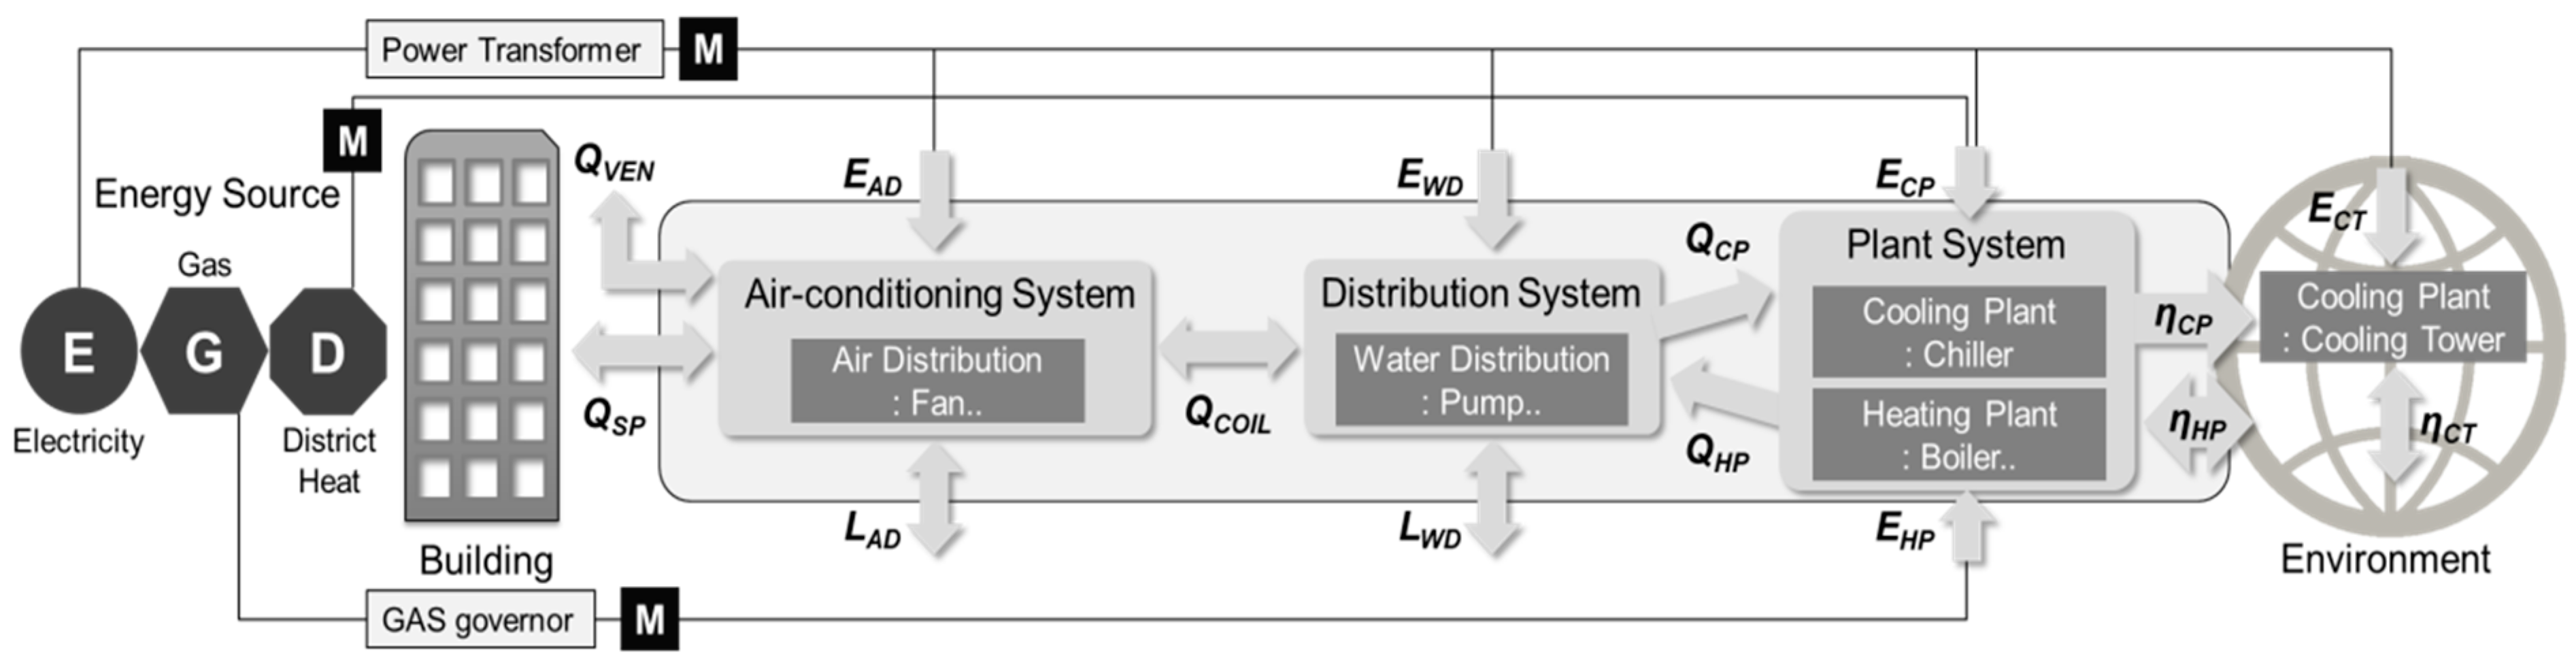
3.4. Stage 4: Detailed Energy Analysis Method of Hospital Building
3.5. Stage 5: Discovering Energy Saving Operation Factors According to the Characteristics of Medical Facility
4. Analysis of Energy Consumption and Effect of Hospital Buildings by Case Study
4.1. Status of Target Hospitals
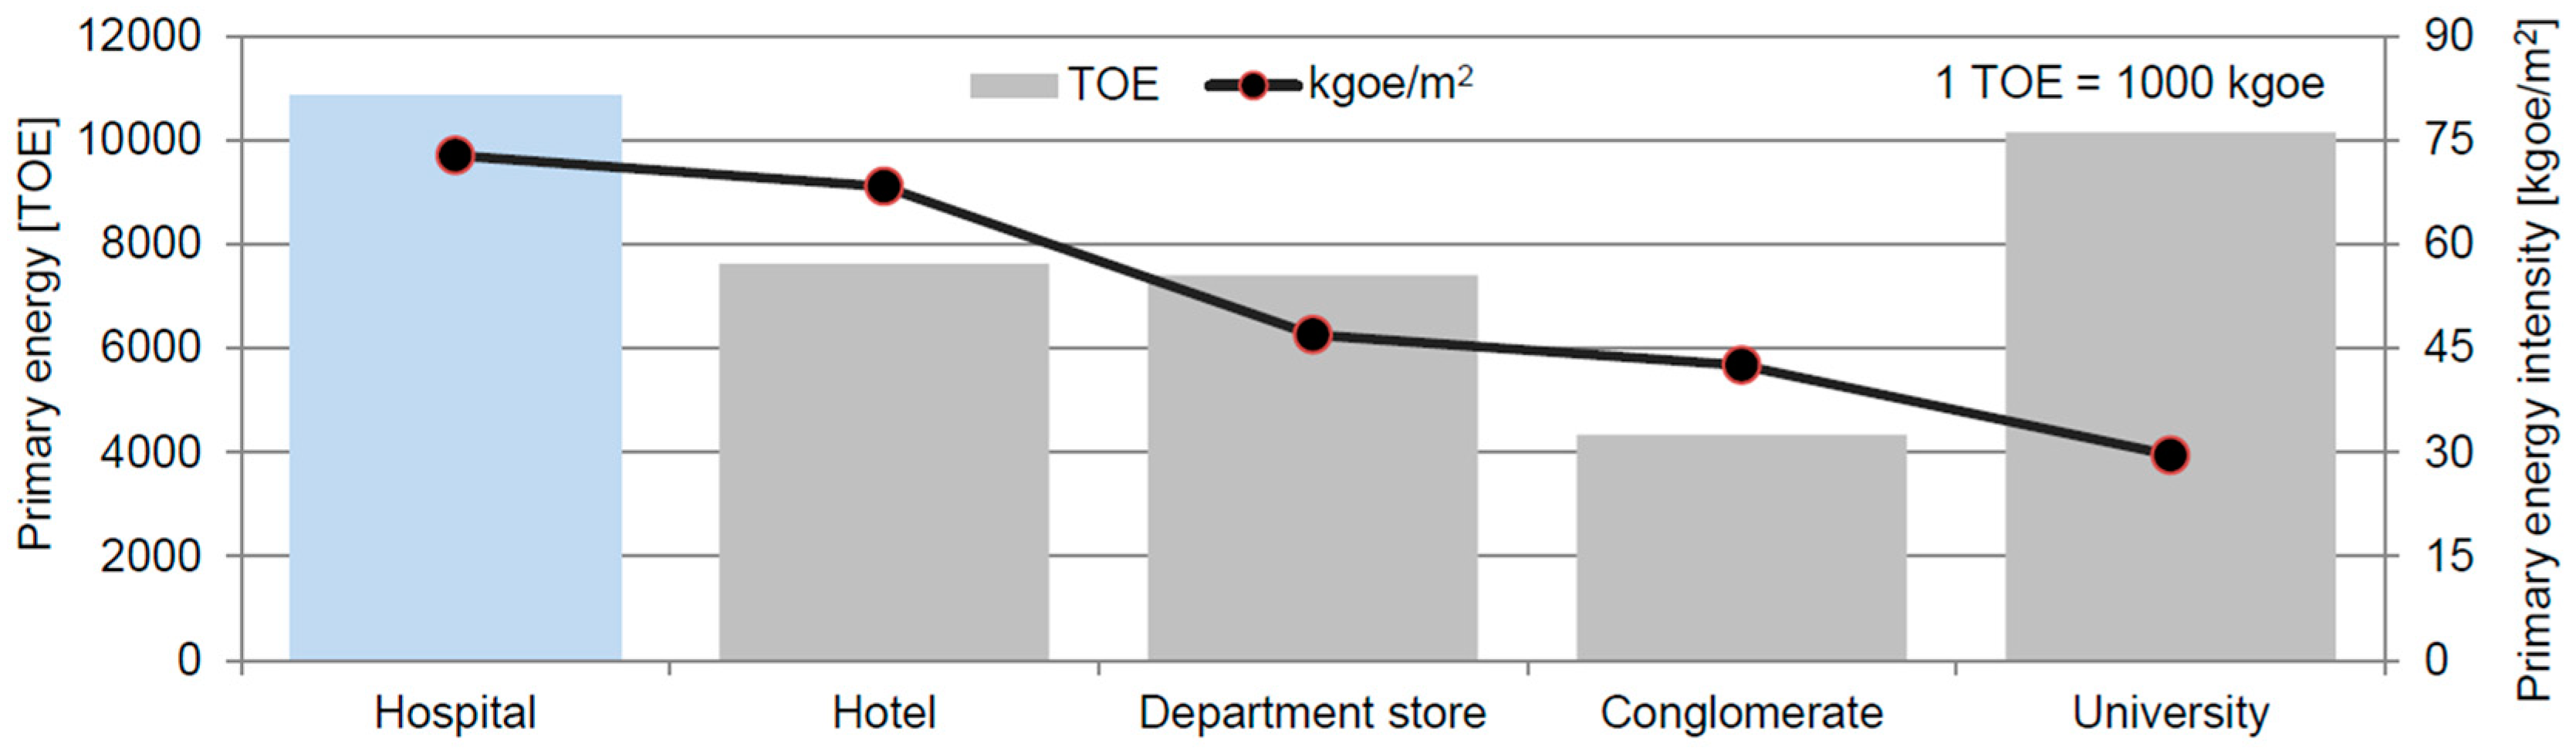
4.2. Total Energy Consumption
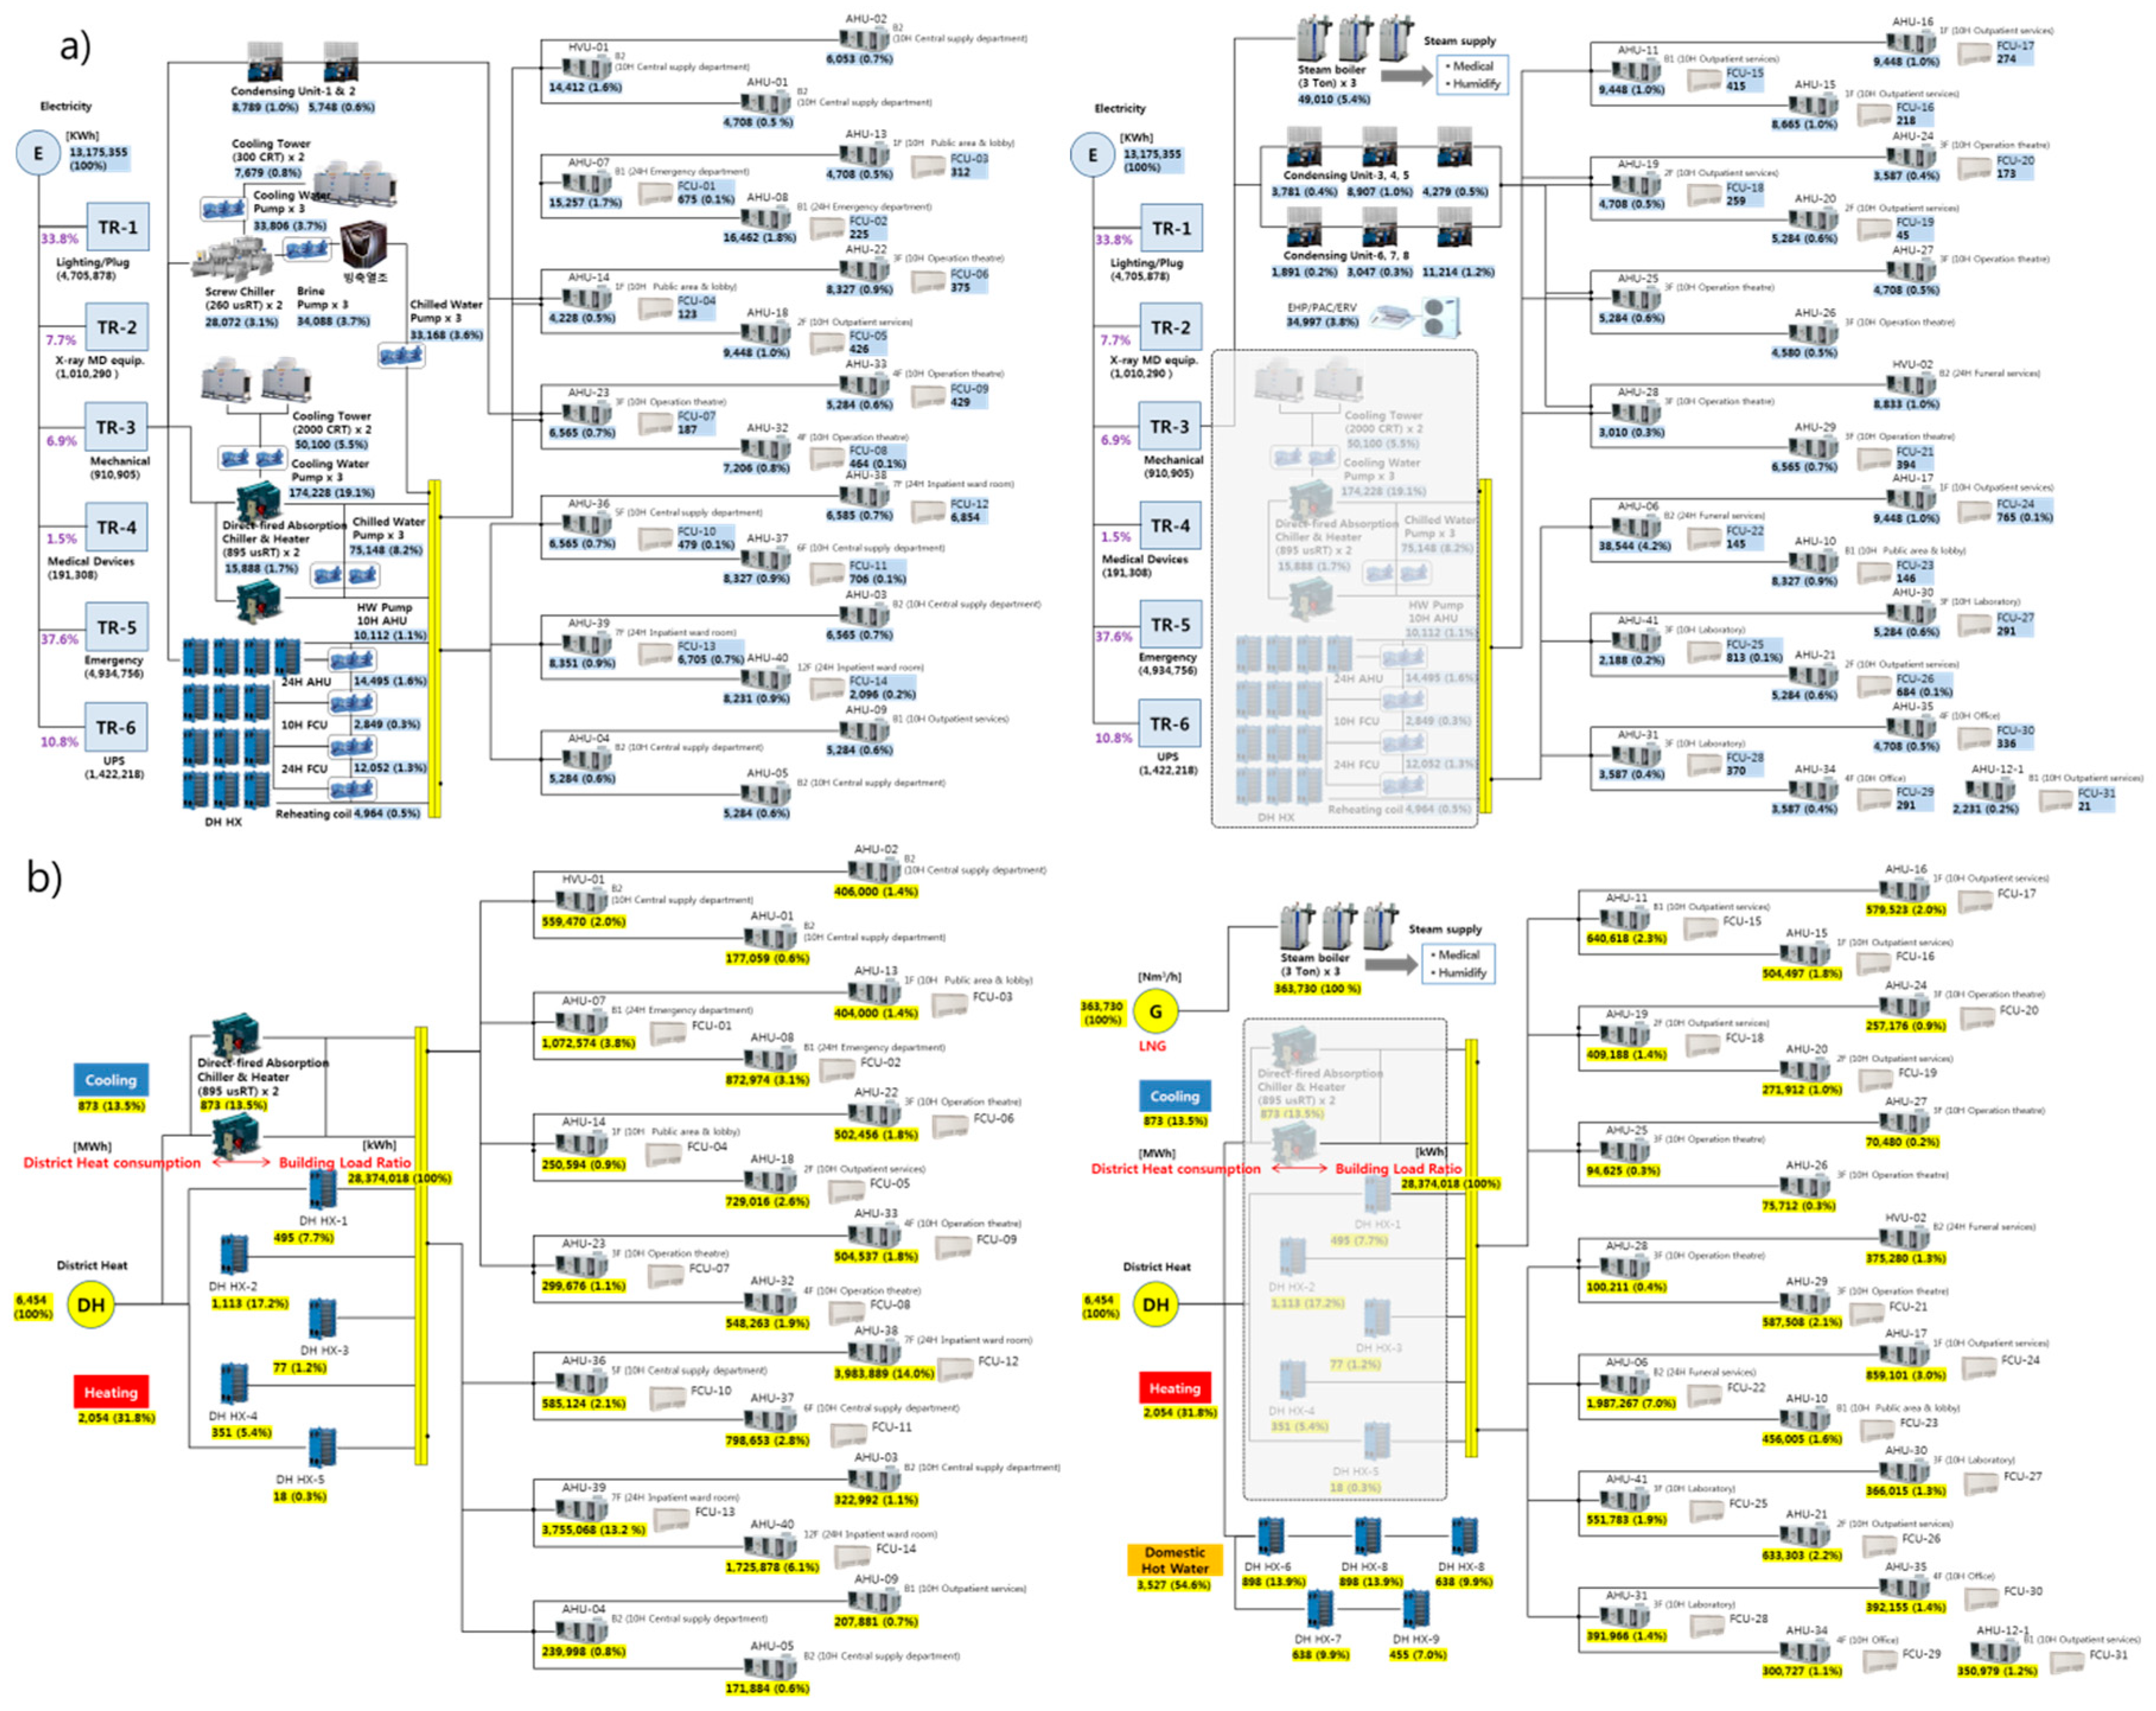
4.3. Detailed Energy Consumption
4.4. The Differences in Energy Consumption
5. Discussion and Conclusions
- (1)
- The method of the energy audit and data-driven analysis for the hospital building energy saving is largely required to find the energy saving operation factor according to the characteristics of the medical facility through the setting of the energy evaluation standard of the target facility system and the smart energy analysis of the hospital building.
- (2)
- Detailed information on the field survey and preliminary evaluation items and methods, remote measurement energy data collection, energy related factors and performance evaluation items, and detailed analysis method of the energy of the hospital building is presented.
- (3)
- As a result of analyzing the energy structure of four hospitals in Seoul, energy consumption highly varied with the size of building, the area of the used facility, the type of energy source, the usage ratio and the main equipment configuration.
- (4)
- Various energy reduction activities in a hospital building should be prioritized to achieve the reduction target effectively in accordance with the hospital.
- (5)
- As future work, it will be necessary to develop an energy saving operation guideline that can perform effective energy saving activities of the hospital through a procedure to analyze the concrete energy consumption structure of the hospital building.
Author Contributions
Funding
Conflicts of Interest
References
- Korea Energy Economics Institute. 2014 Energy Consumption Survey; Korea Ministry of Trade, Industry & Energy: Sejong, Korea, 2015. [Google Scholar]
- DOE/EIA-0484, International Energy Outlook 2013; U.S. Energy Information Administration: Washington, DC, USA, 2013.
- Korea Energy Economics Institute. 2013 Yearbook of Regional Energy Statistics; Korea Ministry of Trade, Industry & Energy: Sejong, Korea, 2014. [Google Scholar]
- Energy Information Administration. Commercial Building Energy Consumption Survey; U.S. Department of Energy: Washington, DC, USA, 2003.
- Pe´rez-Lombard, L.; Ortiz, J.; Pout, C. A review on buildings energy consumption information. Energy Build. 2008, 40, 394–398. [Google Scholar] [CrossRef]
- Bonnema, E.; Studer, D.; Parker, A.; Pless, S.; Torcellini, P. Large Hospital 50% Energy Savings: Technical Support Document; National Renewable Energy Laboratory: Golden, CO, USA, 2010.
- 2018 Korea Energy Agency Handbook; Korea Energy Agency: Ulsan, Korea, 2018.
- Korea Energy Economics Institute. Survey on Energy Consumption in Buildings; Korea Ministry of Trade, Industry & Energy: Sejong, Korea, 2015. [Google Scholar]
- Cho, J.; Moon, J.; Rhee, K.; Kang, H. Energy consumption characteristics of patient room HVAC systems for large hospital buildings in worldwide climate zones. J. Archit. Inst. Korea 2015, 31, 171–180. [Google Scholar]
- Cho, J.; Moon, J.; Kang, H. Energy Performance Analysis for Energy Saving Potentials of a Hospital Building: A Case Study Methodology Based on Annual Energy Demand Profiles. Korean J. Air Cond. Refrig. Eng. 2017, 29, 29–37. [Google Scholar]
- Biglia, A.; Caredda, F.V.; Fabrizio, E.; Filippic, M.; Mandas, N. Technical-economic feasibility of CHP systems in large hospitals through the Energy Hub method: The case of Cagliari AOB. Energy Build. 2017, 147, 101–112. [Google Scholar] [CrossRef]
- Wang, T.; Li, X.; Liao, P.C.; Fang, D. Building energy efficiency for public hospitals and healthcare facilities in China: Barriers and drivers. Energy 2016, 103, 588–597. [Google Scholar] [CrossRef]
- Christiansen, N.; Kaltschmitt, M.; Dzukowski, F. Electrical energy consumption and utilization time analysis of hospital departments and large scale medical equipment. Energy Build. 2016, 131, 172–183. [Google Scholar] [CrossRef]
- Congradac, V.; Prebiracevic, B.; Petrovacki, N. Methods for assessing energy savings in hospitals using various control techniques. Energy Build. 2014, 69, 85–92. [Google Scholar] [CrossRef]
- Ascione, F.; Bianco, N.; Stasio, C.; Mauro, G.M.; Vanoli, G.P. Multi-stage and multi-objective optimization for energy retrofitting a developed hospital reference building: A new approach to assess cost-optimality. Appl. Energy 2016, 174, 37–68. [Google Scholar] [CrossRef]
- González, A.; García-Sanz-Calcedo, J.; Salgado, D.R. A quantitative analysis of final energy consumption in hospitals in Spain. Sustain. Cities Soc. 2018, 36, 169–175. [Google Scholar] [CrossRef]
- Teke, A.; Timur, O. Assessing the energy efficiency improvement potentials of HVAC systems considering economic and environmental aspects at the hospitals. Renew. Sustain. Energy Rev. 2014, 33, 224–235. [Google Scholar] [CrossRef]
- Vanhoudt, D.; Desmedt, J.; Bael, J.V.; Robeyn, N.; Hoes, H. An aquifer thermal storage system in a Belgian hospital: Long-term experimental evaluation of energy and cost savings. Energy Build. 2011, 43, 3657–3665. [Google Scholar] [CrossRef]
- Ma, H.; Du, N.; Yu, S.; Lu, W.; Zhang, Z.; Deng, N.; Li, C. Analysis of typical public building energy consumption in northern China. Energy Build. 2017, 136, 139–150. [Google Scholar] [CrossRef]
- Papantoniou, S.; Kolokotsa, D.; Kalaitzakis, K. Building optimization and control algorithms implemented in existing BEMS using a web based energy management and control system. Energy Build. 2015, 98, 45–55. [Google Scholar] [CrossRef]
- Lee, D.; Cheng, C. Energy savings by energy management systems: A review. Renew. Sustain. Energy Rev. 2016, 56, 760–777. [Google Scholar] [CrossRef]
- Shen, C.; Zhao, K.; Ge, J.; Zhou, Q. Analysis of Building Energy Consumption in a Hospital in the Hot Summer and Cold Winter Area. Energy Procedia 2019, 158, 3735–3740. [Google Scholar] [CrossRef]
- Thinate, N.; Wongsapai, W.; Damrongsak, D. Energy Performance Study in Thailand Hospital Building. Energy Procedia 2017, 141, 255–259. [Google Scholar] [CrossRef]
- Alonso, S.; Morán, A.; Prada, M.Á.; Reguera, P.; José, J.F.; Domínguez, M. A Data-Driven Approach for Enhancing the Efficiency in Chiller Plants: A Hospital Case Study. Energies 2019, 12, 827. [Google Scholar] [CrossRef]
- González, A.; García-Sanz-Calcedo, J.; Salgado, D.R. Evaluation of Energy Consumption in German Hospitals: Benchmarking in the Public Sector. Energies 2018, 11, 2279. [Google Scholar] [CrossRef]
- García-Sanz-Calcedo, J.; Gómez-Chaparro, M. Quantitative analysis of the impact of maintenance management on the energy consumption of a hospital in Extremadura (Spain). Sustain. Cities Soc. 2017, 30, 217–222. [Google Scholar] [CrossRef]
- Cho, J.; Shin, S.; Kim, J.; Hong, H. Development of an energy evaluation methodology to make multiple predictions of the HVAC&R system energy demand for office buildings. Energy Build. 2014, 76, 169–183. [Google Scholar]
- ASHRAE. Advanced Energy Design Guide for Large Hospitals; American Society of Heating, Refrigerating and Air-Conditioning Engineers, Inc: Atlanta, GA, USA, 2012. [Google Scholar]


| Year | Energy | Offices | Retails | Schools | Hotels | Hospitals | Dwellings |
|---|---|---|---|---|---|---|---|
| 2007 | Total energy use (kWh/m2) | 281 | 414 | 210 | 487 | 490 | 162 |
| Electricity consumption (kWh/m2) | 179 | 293 | 121 | 223 | 203 | 41 | |
| 2010 | Total energy use (kWh/m2) | 245 | 274 | 210 | 390 | 467 | 145 |
| Electricity consumption (kWh/m2) | 140 | 170 | 106 | 147 | 172 | 34 | |
| 2013 | Total energy use (kWh/m2) | 222 | 231 | 190 | 341 | 423 | 127 |
| Electricity consumption (kWh/m2) | 150 | 174 | 120 | 151 | 192 | 37 |
| Level | Energy Analysis | Data Collection | Main Function |
|---|---|---|---|
| 1 | By energy sources (electricity, gas, etc.) | BAS Basic energy-saving control | BAS energy-saving function - Enthalpy control - Optimum start/stop control - Operating number control - CO2 control |
| 2 | By systems (heating, cooling etc.) | BAS + EMS Energy management system | Level 1 + Energy trend analysis - Energy consumption - Energy demand trend - Energy change analysis |
| 3 | By equipment (chiller, boiler, etc.) | BAS + EMS + α Energy performance management | Level 1 + 2 + Equipment performance - Energy over-consumption - Fault detection |
| 4 | By zones (ward, outpatient, etc.) | BAS + EMS + α + β Energy optimization system | Level 1 + 2 + 3 + Optimization control |
| BEMS installation criteria | |||
| ① Data collection and display | ② Information monitoring | ③ View data | |
| ④ Analysis of energy usage status | ⑤ Analysis of facility efficiency | ⑥ Providing in/outdoor information | |
| ⑦ Prediction of energy consumption | ⑧ Energy cost inquiry and analysis | ⑨ Interlocking control system | |
| Energy-Related Factors | |||
|---|---|---|---|
| Outside environment | ① Temperature (DB/WB) | ② Humidity (RH) | |
| Thermal load | ① Set temperature (DB) | ② Set related humidity (RH) | |
| ③ Intake outdoor airflow rate | |||
| HVAC system | Air-conditioning | ① Supply air (SA) temp./enthalpy | ② Return air (RA) temp./enthalpy |
| ③ Air flow rate (CMH) | ④ OA flow rate (damper) (%) | ||
| ⑤ Coil leaving water temp. | ⑥ Coil entering water temp. | ||
| ⑦ Hot/chilled water flow rate | |||
| Fans | ① Fan power | ||
| Plant system | Chiller/Boiler | ① Equipment leaving water temp. | ② Equipment entering water temp. |
| ③ Hot/chilled water flow rate | ④ System efficiency/COP | ||
| Cooling tower | ① Outdoor wet-bulb temperature | ② Leaving condenser water temp. | |
| ③ Entering condenser water temp. | ④ Cooling tower fan power | ||
| Water distribution | ① Pump power | ||
| Energy consumption | ① Gas(LNG) consumption | ② Electricity consumption | |
| Energy-related equations | 1. SHF, sensible heat factor → Initial input required by design data 2. QSP: Space thermal load + Energy demand 3. QVEN: Ventilation loads - Fresh air intake 4. Cooling loads ∝ Air flow rate × SA/RA enthalpy difference 5. Heating loads ∝ Air flow rate × SA/RA temperature difference 6. Humidity loads ∝ OA flow rate × OA/SA absolute humid difference 7. QCOIL: Secondary system load: Cooling/heating system load = AHU coil capacity ∝ Hot/chilled water flow rate × coil temperature difference 8. EAD: Air distribution energy, LAD: Air distribution loss 9. QHP/QCP: Primary system load ∝ Hot/chilled water flow rate × Equipment leaving/entering water temperature difference × Heat loss 10. EHP/ECP: Input energy ∝ Primary system load × System efficiency (COP) 11. ηHP/ηCP: System efficiency (Cooling/Heating) 12. Range = Entering condenser water temp. - Leaving condenser water temp. 13. Approach = Leaving condenser water temp. - Air wet bulb temp. 14. Efficiency = Range ÷ (Range + Approach) 15. ECT: Cooling Tower efficiency energy (Cooling/Heating) 16. EWD: Water distribution energy 17, ηCT: System efficiency 18. Energy consumption: Calculated input energy × Primary energy factor 19 EUI (Energy Use Intensity) = Energy consumption ÷ A/C area | ||
| Equipment | Energy-Related Factors | Measure | Reference Value | Ranges | |
|---|---|---|---|---|---|
| (1) Direct-fired absorption | CHW flow rate (Gchw) | S | m3/h | Initial measured | ±20% |
| chiller & heater (cooling) | Entering CHW temp. (te-chw) | S | °C | Rated (7 °C) | - |
| Leaving CHW temp. (tl-chw) | S | °C | Setting | ±20% | |
| CW flow rate (Gcw) | S | m3/h | Initial measured | ±20% | |
| Entering CW temp. (te-cw) | S | °C | Setting (37 °C) | >36 °C | |
| Leaving CW temp. (tl-cw) | S | °C | Rated | <21 °C | |
| Power consumption (Aw′) | S | kW | Rated | - | |
| Gas consumption (Aw″) | S | Nm3/h | Rated | - | |
| Chiller COP | SC | - | Rated | - | |
| Heat load rate | SC | % | - | 50–100% | |
| Heat balance | SC | % | - | - | |
| IPLV | SC | - | - | - | |
| Annual COP profile | SC | - | by entering CW temp. | - | |
| (2) Direct-fired absorption | HW flow rate (Ghw) | S | m3/h | Initial measured | ±20% |
| chiller & heater (heating) | Entering HW temp. (te-hw) | S | °C | Rated (55 °C) | |
| Leaving HW temp. (tl-hw) | S | °C | Setting | ±20% | |
| Power consumption (Aw′) | S | kW | Rated | ±20% | |
| Gas consumption (Aw″) | S | Nm3/h | Rated | - | |
| Heater efficiency | SC | - | Rated | - | |
| Heat load rate | SC | % | - | 50–100% | |
| IPLV | SC | - | - | - | |
| Annual efficiency profile | SC | - | - | - | |
| (3) Centrifugal | CHW flow rate (Gchw) | S | m3/h | Initial measured | ±20% |
| and screw chillers | Entering CHW temp. (te-chw) | S | °C | Rated (7 °C) | - |
| Leaving CHW temp. (tl-chw) | S | °C | Setting | ±20% | |
| CW flow rate (Gcw) | S | m3/h | Initial measured | ±20% | |
| Entering CW temp. (te-cw) | S | °C | Setting (37 °C) | >36 °C | |
| Leaving CW temp. (tl-cw) | S | °C | Rated | <21 °C | |
| Power consumption (Aw′) | S | kW | Rated | - | |
| Chiller COP | SC | - | Rated | - | |
| Heat load rate | SC | % | - | 50–100% | |
| Heat balance | SC | % | - | - | |
| IPLV | SC | - | - | - | |
| Annual COP profile | SC | - | by entering CW temp. | - | |
| (4) Cooling tower | CW flow rate (Gcw) | S | m3/h | Initial measured | ±20% |
| Entering CW temp. (te-cw) | S | °C | Setting (37 °C) | >36 °C | |
| Leaving CW temp. (tl-cw) | S | °C | Rated | <21 °C | |
| Entering DB temp. (te-DB) | S | °C | - | - | |
| Entering WB temp. (te-WB) | S | °C | - | - | |
| Fan power consumption (Aw′) | S | kW | Rated | - | |
| Range | SC | - | - | - | |
| Approach | SC | - | - | - | |
| Cooling tower efficiency | SC | - | - | - | |
| (5) Hot water boiler | HW flow rate (Ghw) | S | m3/h | Initial measured | ±20% |
| Entering HW temp. (te-hw) | S | °C | Rated (60 °C) | - | |
| Leaving HW temp. (tl-hw) | S | °C | Setting | ±20% | |
| Gas consumption (Aw″) | S | N m3/h | Rated | - | |
| Boiler efficiency | SC | - | Rated | - | |
| Heat load rate | SC | % | - | 50–100% | |
| IPLV | SC | - | - | - | |
| Annual efficiency profile | SC | - | - | - | |
| (6) Steam boiler | Steam flow rate (Gs) | S | kg/h | Initial measured | ±20% |
| Steam pressure (Ps) | S | kg/cm2 | Rated | - | |
| Gas consumption (Aw″) | S | Nm3/h | Rated | - | |
| Boiler efficiency | SC | - | Rated | - | |
| Heat load rate | SC | % | - | 50–100% | |
| IPLV | SC | - | - | - | |
| Annual efficiency profile | SC | - | - | - | |
| (7) Air Handling Unit (AHU) | SA flow rate (Gsa) | S | m3/h | Initial measured | ±20% |
| RA flow rate (Gra) | S | m3/h | Initial measured | ±20% | |
| OA flow rate (Goa) | S | m3/h | Setting | - | |
| Coil CHW flow rate (Gchw) | S | m3/h | Initial measured | ±20% | |
| Coil HW flow rate (Ghw) | S | m3/h | Initial measured | ±20% | |
| Entering CHW temp. (te-chw) | S | °C | Setting (7 °C) | - | |
| Leaving CHW temp. (tl-chw) | S | °C | Setting | ±20% | |
| Entering HW temp. (te-hw) | S | °C | Setting (55 °C) | - | |
| Leaving HW temp. (tl-hw) | S | °C | Setting | ±20% | |
| ATF (Air transfer factor) | SC | - | - | - | |
| S: Measured value, SC: Calculated value | |||||
| Equipment | Energy-Related Factors | X-Axis | Y-Axis | Data Type |
|---|---|---|---|---|
| (1) Chiller | Entering CHW temp. versus heat load rate | Heat load rate | Entering CHW temp. | Monthly |
| (Common) | COP versus heat load rate | Heat load rate | COP | Monthly |
| Heat load rate | COP | by CW temp. | ||
| Entering CW temp. versus COP | Entering CW temp. | COP | by heat load rate | |
| Entering CW temp. | COP | Monthly | ||
| Entering CHW temp. versus COP | Entering CHW temp. | COP | by heat load rate | |
| COP versus outdoor air temp. | Outdoor air temp. | COP | Monthly | |
| COP versus leaving CHW temp. | Leaving CHW temp. | COP | - | |
| (2) Boiler | Entering HW temp. versus heat load rate(H) | Heat load rate | Entering HW temp. | Monthly |
| Hot-water(H) | Efficiency versus leaving HW temp.(H) | Leaving HW temp. | Efficiency | - |
| Steam(S) | Entering HW temp. versus efficiency(H) | Entering HW temp. | Efficiency | by heat load rate |
| Efficiency versus steam pressure (S) | Steam pressure | Efficiency | - | |
| Efficiency versus heat load rate | Heat load rate | Efficiency | Monthly | |
| Efficiency versus outdoor air temp. | Outdoor air temp. | Efficiency | Monthly | |
| (3) Cooling | (Chiller) heat load rate versus efficiency | Heat load rate | Efficiency | - |
| tower | Efficiency versus entering WB temp. | Efficiency | Entering WB temp. | - |
| Ranged versus entering WB temp. | Entering CW temp. | Entering WB temp. | - | |
| (4) AHU | Coil entering/leaving ΔT (CHW & HW) | Entering/leaving ΔT | Operating time | - |
| AFT versus outdoor air temp. | Outdoor air temp. | AFT | - | |
| Water entering/leaving ΔT (CHW & HW) | Entering/leaving ΔT | - | ||
| versus air entering/leaving ΔT (SA & RA) | SA & RA ΔT |
| Energy-Related Factors | X-Axis | Y-Axis (1) | Y-Axis (2) | |
|---|---|---|---|---|
| Each equipment | Total energy consumption | Total operating hour | Energy consumption | - |
| Energy consumption | Hour | Energy consumption | Average air temp. | |
| versus average daily outdoor air temp. | - | - | - | |
| Energy consumption for the relevant year | Hour | Energy consumption | - | |
| Energy consumption for the past year | Year | Energy consumption | - |
| Category | Hospital A | Hospital B | Hospital C | Hospital D |
|---|---|---|---|---|
| Building features |  |  |  |  |
| Year built | 2011 | 1991 | 2004 | 2011 |
| Location | Seoul, Korea | Seoul, Korea | Seoul, Korea | Seoul, Korea |
| Total area | 10,0121 m2 | 75,000 m2 | 30,306 m2 | 39,263 m2 |
| Number of floors | B4F/13F | B3F/8F | B2F/7F | B4F/8F |
| Energy source | Electricity, city gas and district heating | Electricity and city gas | Electricity and city gas | Electricity, city gas and district heating |
| Heating plant | District heating | Direct-fired absorption chiller/heater | Heat (steam) exchanger | District heating |
| Cooling plant | HW driven absorption chiller | Direct-fired absorption chiller/heater & Absorption chiller | Absorption chiller | Absorption chiller |
| Domestic hot water | District heating | Heat (steam) exchanger | Heat (steam) exchanger | District heating |
| Steam | Once-through steam boiler | Furnace smoke tube & Once-through steam boiler | Furnace smoke tube & Once-through steam boiler | Furnace smoke tube steam boiler |
| Major HVAC system | FCU+AHU | FCU+AHU | FCU+AHU | FCU+AHU |
| System features |   |   |   |   |
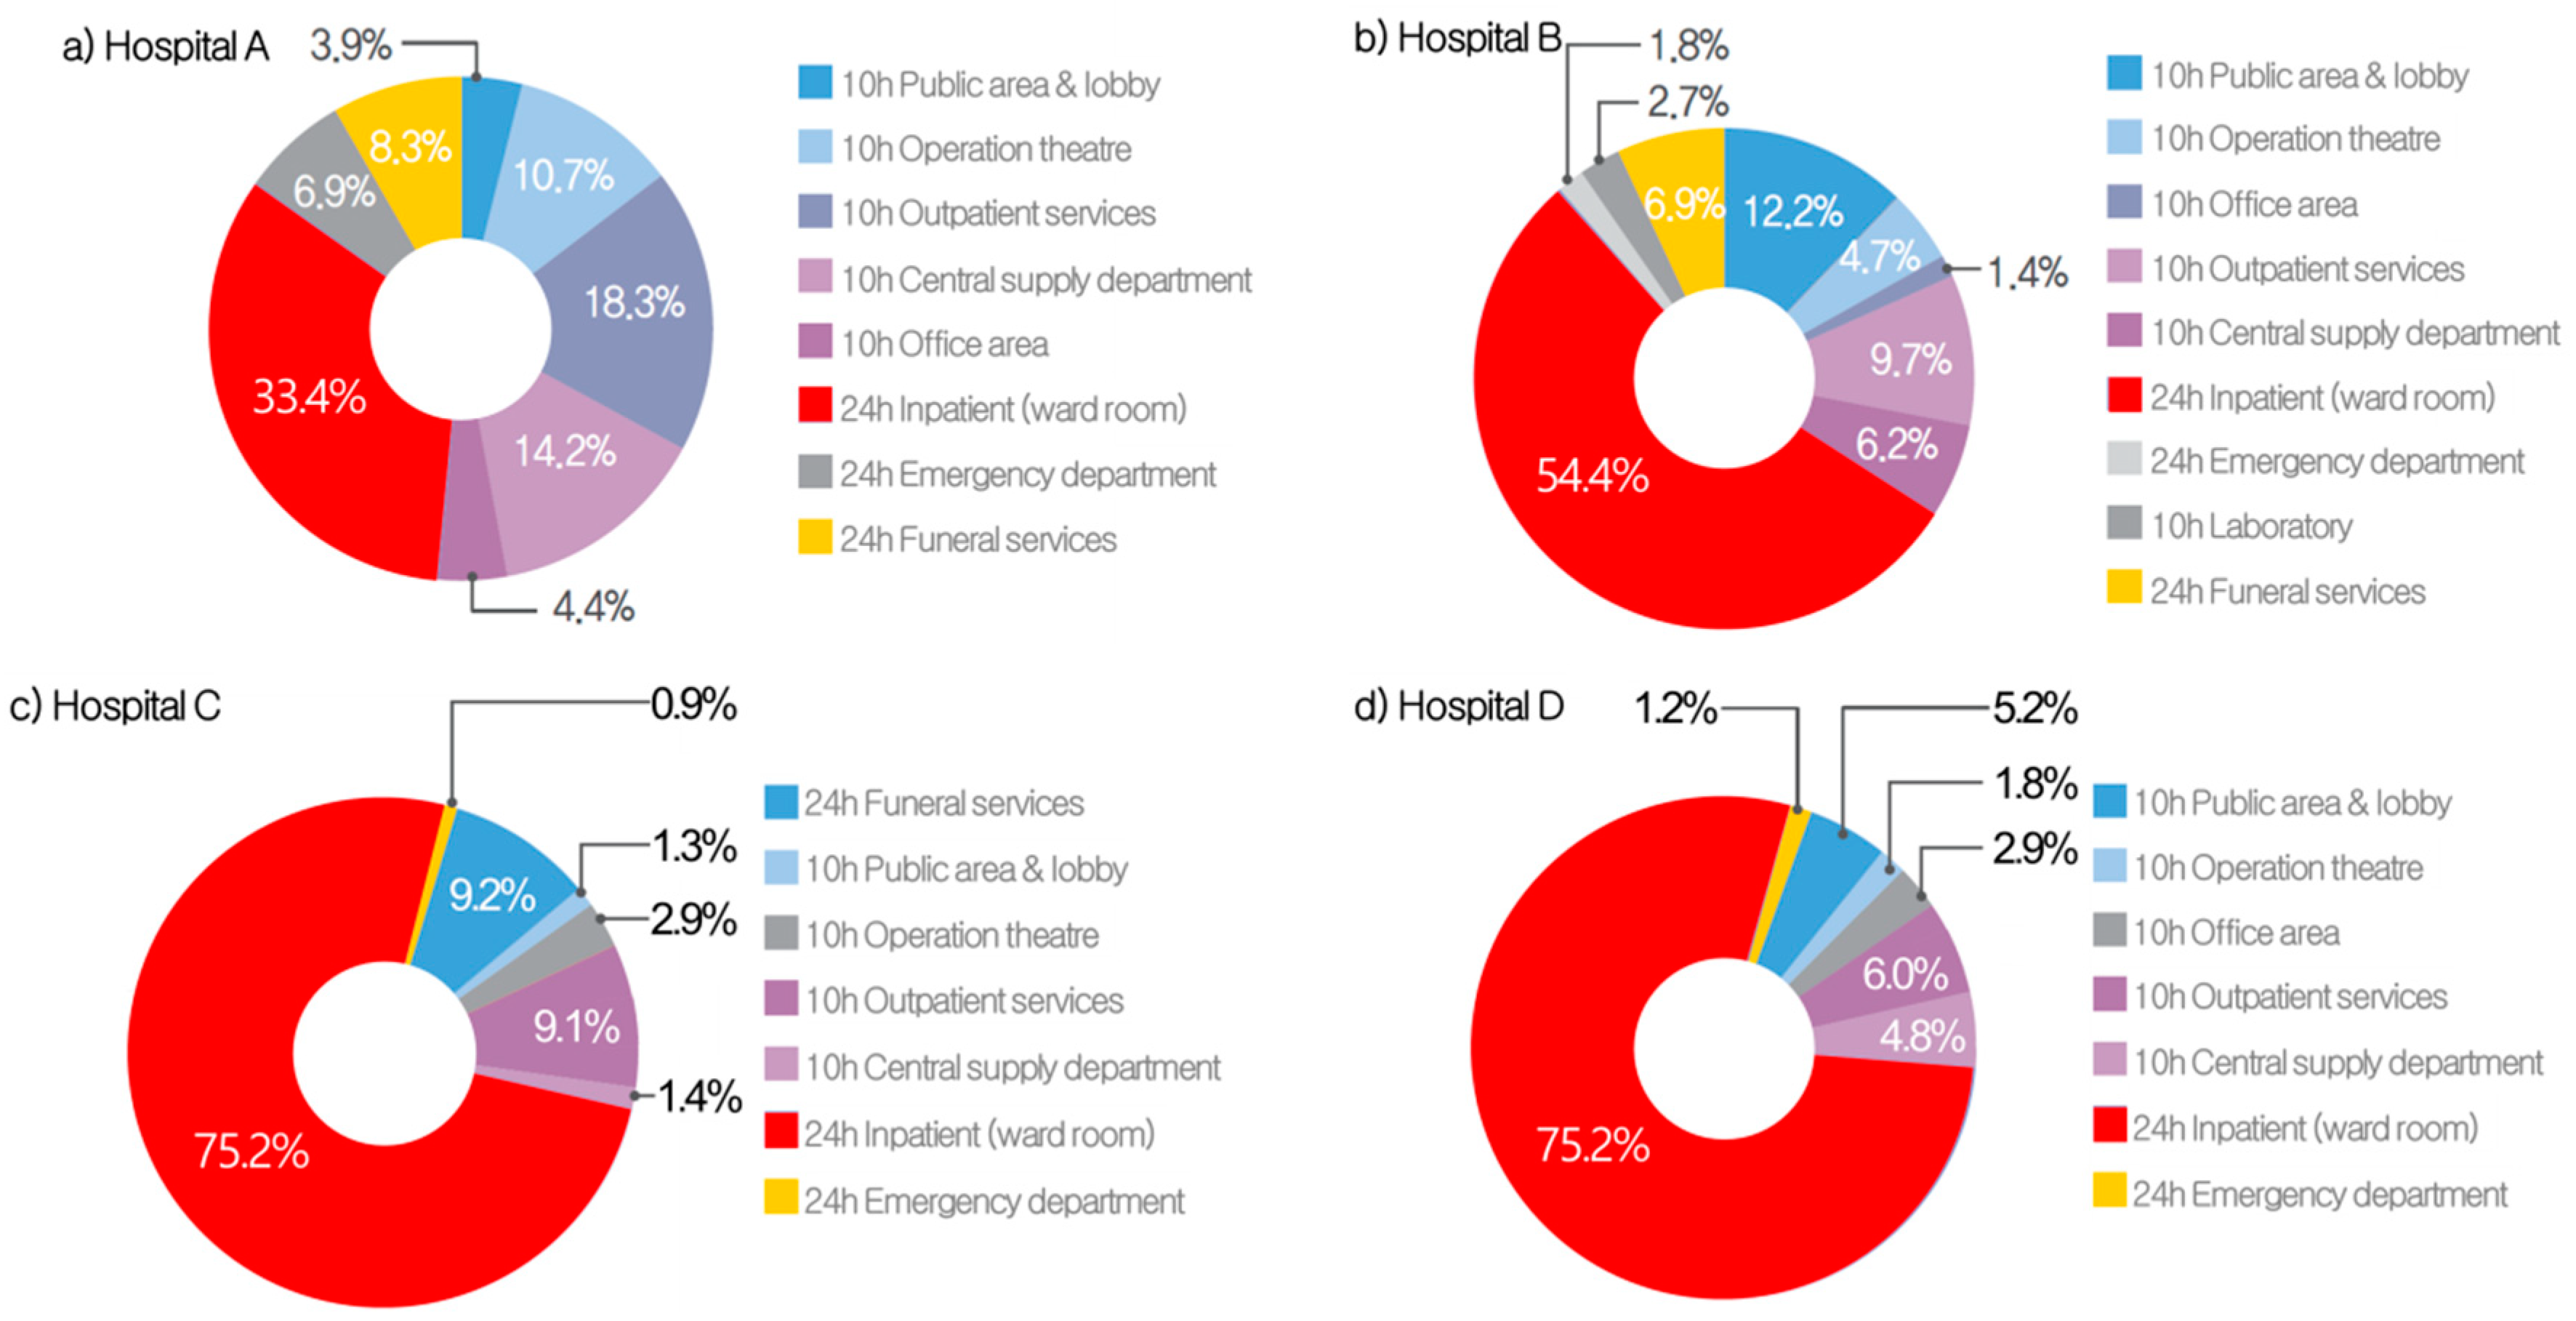
| Category | Department | Hospital A | Hospital B | Hospital C | Hospital D | |
|---|---|---|---|---|---|---|
| 24h zone | Inpatient (ward room) | 24.6% (2) | 24.1% (2) | 69.1% (1) | 42.9% (1) | |
| Emergency department | 4.1% | 5.0% | 0.7% | 1.3% | ||
| Funeral services | 5.4% | 2.8% | 5.8% (3) | - | ||
| 10h zone | Outpatient services | 25.4% (1) | 26.9% (1) | 13.5% (2) | 15.1% (3) | |
| Operation theatre | 12.6% (4) | 7.6% | 3.2% | 3.1% | ||
| Central supply department | 15.2% (3) | 12.2% (4) | 3.1% | 8.9% (4) | ||
| Public area & lobby | 5.8% | 16.3% (3) | 4.6% (4) | 21.4% (2) | ||
| Office | 6.8% | 3.4% | - | 4.3% | ||
| Laboratory | - | 1.6% | - | 2.9% | ||
| Zone features |  |  |  |  | 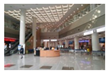 |  |
| Inpatient | Outpatient | Operation theatre | Central supply | Public area | Office | |
| Category | Electricity | District Heat | Gas(LNG) | Baseline | |||||
|---|---|---|---|---|---|---|---|---|---|
| kWh | kgoe | kWh | kgoe | Nm3 | kgoe | kgoe | kWh | ||
| Hospital A | Total energy use | 14,031,729 | 3,213,266 | 6,453,567 | 516,192 | 363,730 | 374,278 | 4,103,736 | 46,789,881 |
| Energy use per (m2) | 140.1 | 32.1 | 64.5 | 5.2 | 3.6 | 3.7 | 41.0 | 467.3 | |
| Ratio by energy source | - | (78.3%) | - | (12.6%) | - | (9.1%) | (100%) | - | |
| Hospital B | Total energy use | 22,140,947 | 5,070,277 | - | - | 1,906,235 | 1,961,516 | 7,031,793 | 83,725,000 |
| Energy use per (m2) | 295.2 | 67.6 | - | - | 25.4 | 26.2 | 93.8 | 1116.3 | |
| Ratio by energy source | - | (72.1%) | - | - | (27.9%) | (100%) | - | ||
| Hospital C | Total energy use | 3,596,299 | 823,552 | - | - | 794,723 | 817,770 | 1,641,322 | 19,203,902 |
| Energy use per (m2) | 118.7 | 27.2 | - | - | 26.2 | 27.0 | 54.2 | 633.7 | |
| Ratio by energy source | - | (50.2%) | - | - | - | (49.8%) | (100%) | - | |
| Hospital D | Total energy use | 5,198,799 | 1,190,525 | 4,891,800 | 391,274 | 165,989 | 170,802 | 1,752,601 | 19,199,607 |
| Energy use per (m2) | 132.4 | 30.3 | 124.6 | 10.0 | 4.2 | 4.4 | 44.6 | 489.0 | |
| Ratio by energy source | - | (67.9%) | - | (22.3%) | - | (9.7%) | (100%) | - | |
| Category | Hospital A | Hospital B | Hospital C | Hospital D | |
|---|---|---|---|---|---|
| Total Area | 100,121 m2 | 75,000 m2 | 30,306 m2 | 39,263 m2 | |
| Zonal floor area ratio | 1 | Outpatient (25.4%) | Outpatient (26.9%%) | Inpatient (69.1%) | Inpatient (42.9%) |
| 2 | Inpatient (24.6%) | Inpatient (24.1%%) | Outpatient (13.5%) | Public area (21.4%) | |
| 3 | Central supply (15.2%) | Public area (16.3%) | Funeral services (5.8%) | Outpatient (15.1%) | |
| Energy use by energy sources | 1 | Electricity (78.3%) | Electricity (72.1%) | Electricity (50.2%) | Electricity (67.9%) |
| 2 | District heat (12.6%) | LNG (27.9%) | LNG (49.8%) | District heat (22.3%) | |
| 3 | LNG (9.1%) | - | - | LNG (9.7%) | |
| Energy use by zone | 1 | Inpatient (33.4%) | Inpatient (54.4%) | Inpatient (75.2%) | Inpatient (78.0%) |
| 2 | Outpatient (18.3%) | Public area (12.2%) | Funeral services (9.2%) | Outpatient (6.0%) | |
| 3 | Central supply (14.2%) | Outpatient (9.7%) | Outpatient (9.1%) | Public area (5.2%) | |
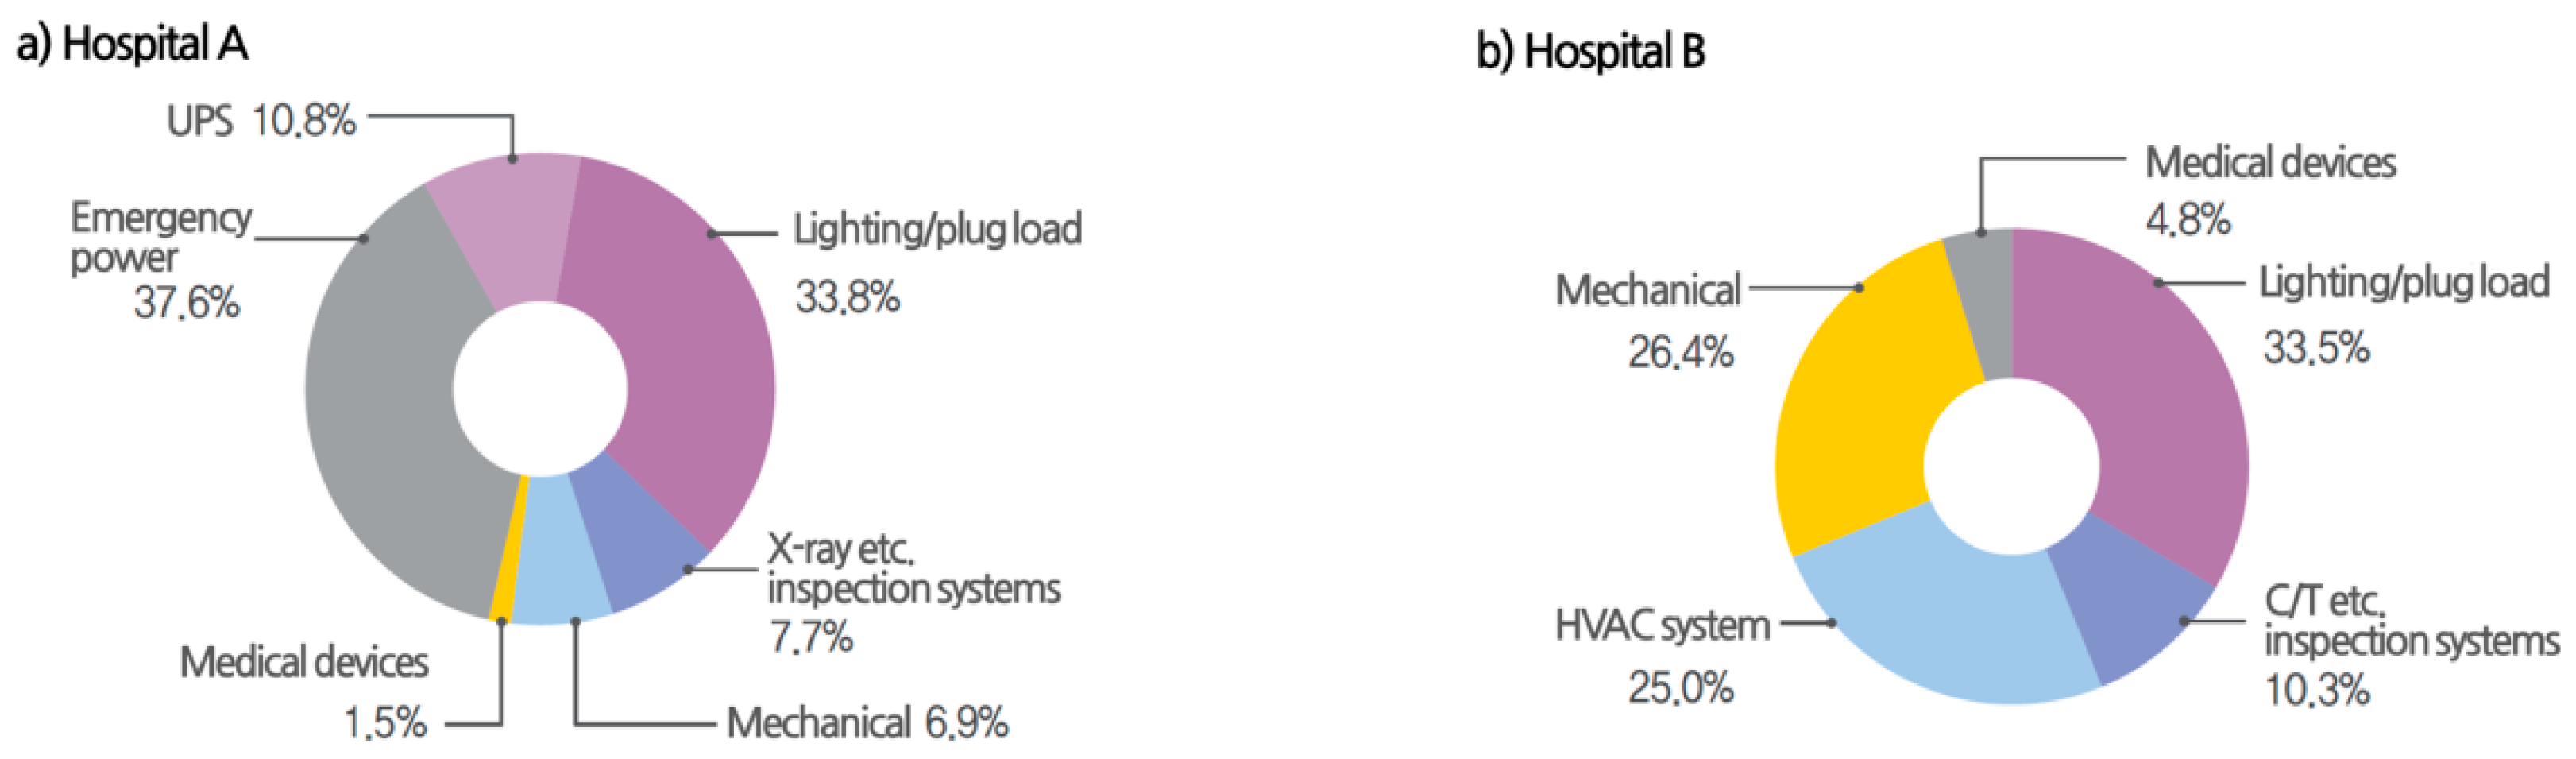
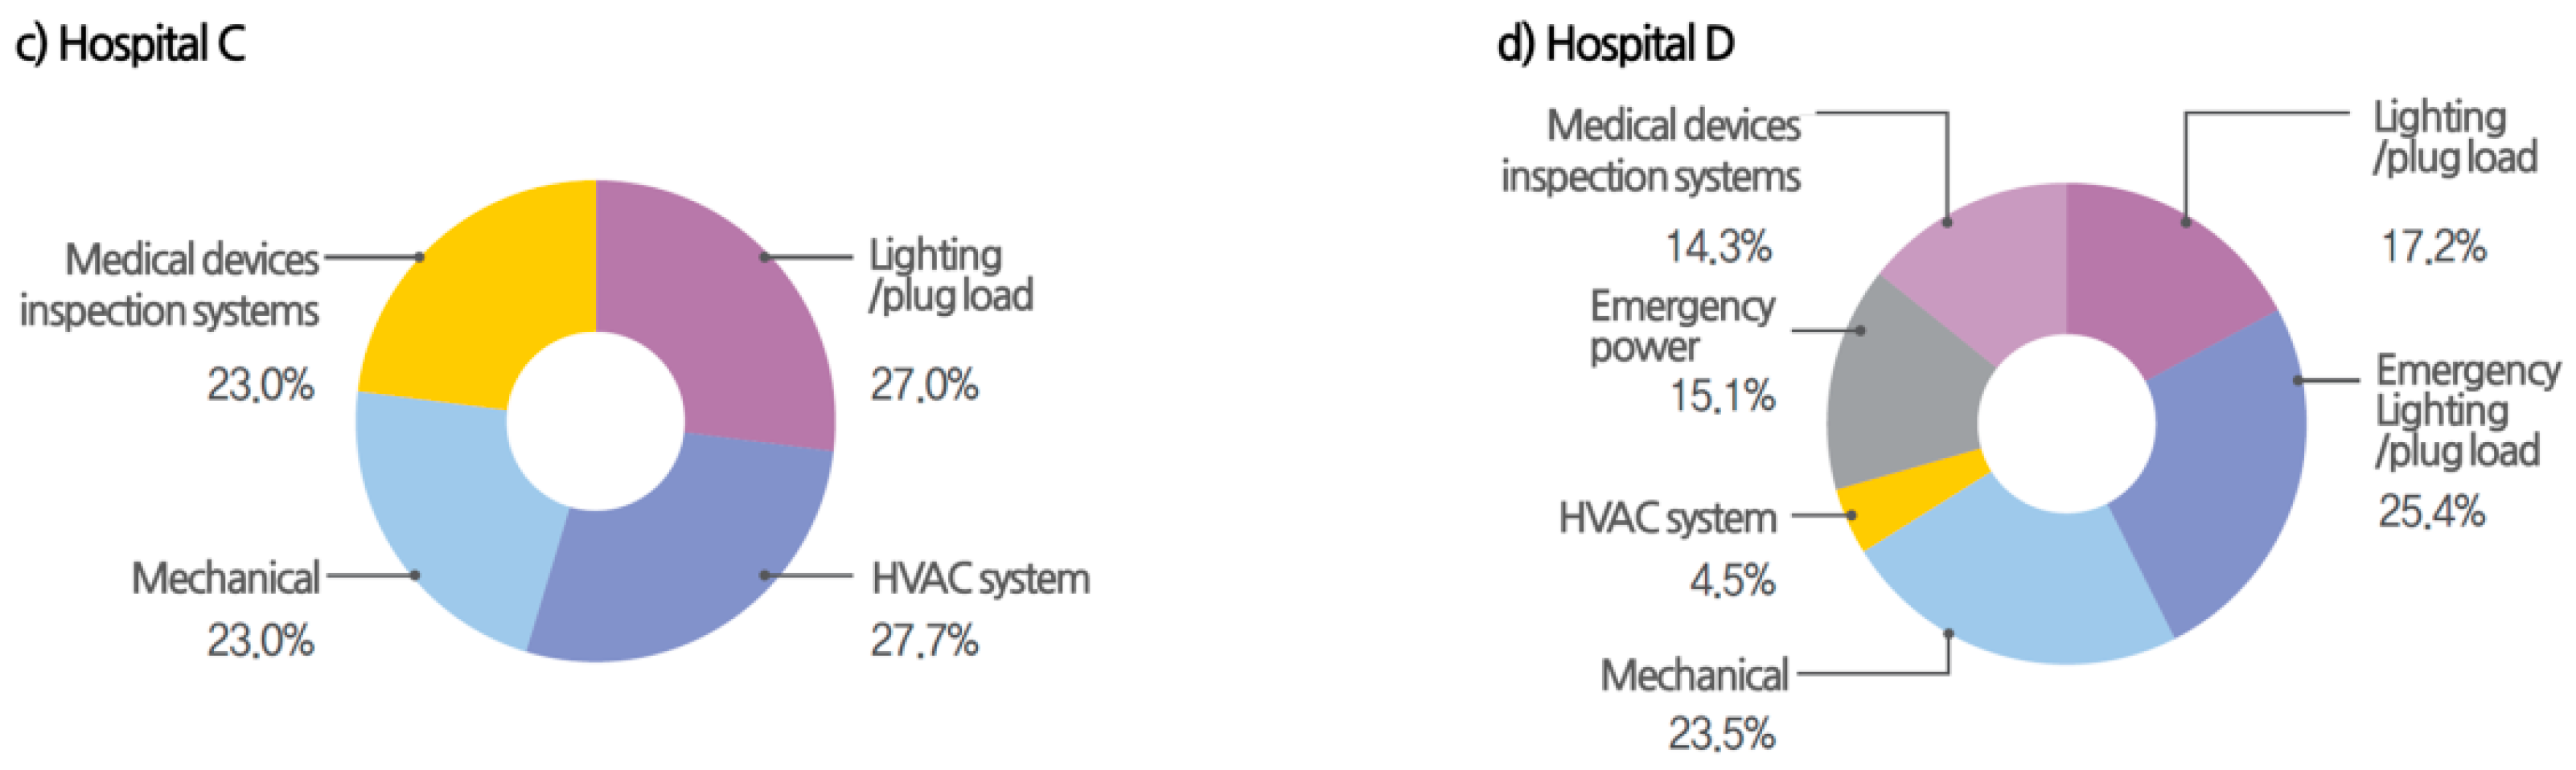
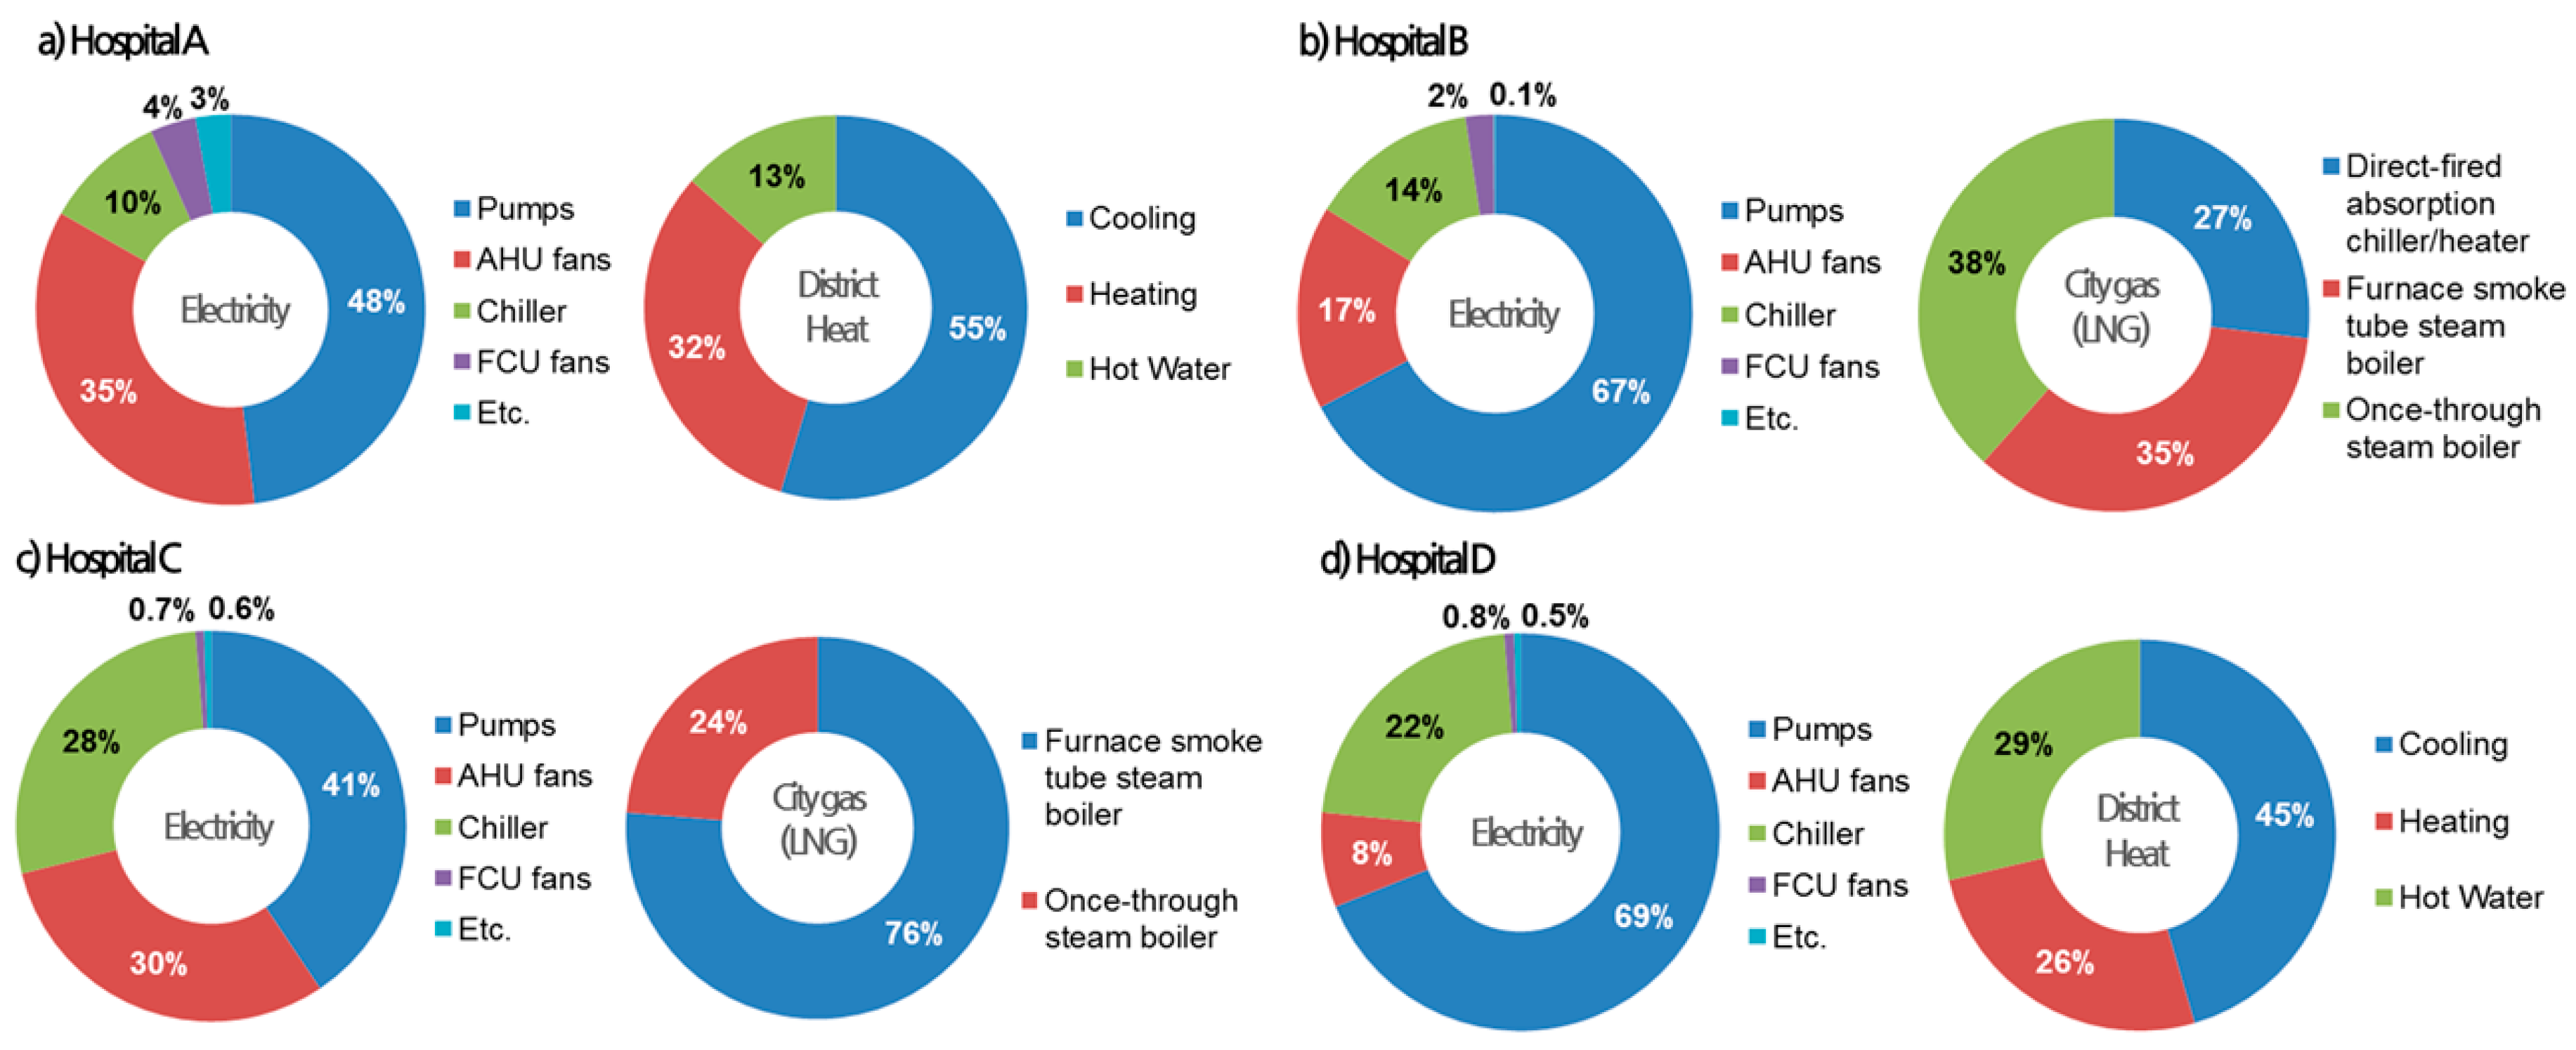
| Power usage ratio by systems | 1 | Lighting/plug (33.8%) | Lighting/plug (33.5%) | HVAC (27.7%) | Lighting/plug (17.2%) |
| 2 | HVAC (6.9%) | HVAC (25.0%) | Lighting/plug (27.0%) | HVAC (4.5%) | |
| - | Medical devices (9.2%) | Medical devices (15.1%) | Medical devices (23.0%) | Medical devices (14.3%) | |
| Total energy (baseline) | 4,104 TOE | 7,032 TOE | 1,641 TOE | 1,753 TOE | |
| 41.0 kgoe/m2 | 93.8 kgoe/m2 | 54.2 kgoe/m2 | 44.6 kgoe/m2 | ||
| Hospital average: 76.1 kgoe/m2 | |||||
© 2019 by the authors. Licensee MDPI, Basel, Switzerland. This article is an open access article distributed under the terms and conditions of the Creative Commons Attribution (CC BY) license (http://creativecommons.org/licenses/by/4.0/).
Share and Cite
Hwang, D.K.; Cho, J.; Moon, J. Feasibility Study on Energy Audit and Data Driven Analysis Procedure for Building Energy Efficiency: Bench-Marking in Korean Hospital Buildings. Energies 2019, 12, 3006. https://doi.org/10.3390/en12153006
Hwang DK, Cho J, Moon J. Feasibility Study on Energy Audit and Data Driven Analysis Procedure for Building Energy Efficiency: Bench-Marking in Korean Hospital Buildings. Energies. 2019; 12(15):3006. https://doi.org/10.3390/en12153006
Chicago/Turabian StyleHwang, Dong Kon, Jinkyun Cho, and Junghwan Moon. 2019. "Feasibility Study on Energy Audit and Data Driven Analysis Procedure for Building Energy Efficiency: Bench-Marking in Korean Hospital Buildings" Energies 12, no. 15: 3006. https://doi.org/10.3390/en12153006
APA StyleHwang, D. K., Cho, J., & Moon, J. (2019). Feasibility Study on Energy Audit and Data Driven Analysis Procedure for Building Energy Efficiency: Bench-Marking in Korean Hospital Buildings. Energies, 12(15), 3006. https://doi.org/10.3390/en12153006