Article

A 3-In-1 Approach to Evaluate Gas Hydrate Inhibitors

by
Narendra Kumar
,
Niaz Bahar Chowdhury
and
Juan G. Beltran
*
Department of Chemistry and Chemical Engineering, Royal Military College of Canada, 3 General Crerar Crescent, Kingston, ON K7K 7B4, Canada
*
Author to whom correspondence should be addressed.
Energies 2019, 12(15), 2921; https://doi.org/10.3390/en12152921
Submission received: 20 May 2019 / Revised: 20 July 2019 / Accepted: 25 July 2019 / Published: 29 July 2019
(This article belongs to the Special Issue Advances in Natural Gas Hydrates)

Abstract

:
With a single apparatus and very short experimentation times, we have assessed phase equilibria, apparent kinetics and morphology of methane gas hydrates in the presence of thermodynamic inhibitors ethane-1,2-diol (MEG) and sodium chloride (NaCl); and kinetic hydrate inhibitor polyvinyl-pyrrolidone (PVP). Tight, local temperature control produced highly repeatable crystal morphologies in constant temperature systems and in systems subject to fixed temperature gradients. Hydrate-Liquid-Vapor (HLV) equilibrium points were obtained with minimal temperature and pressure uncertainties ( u T avg = 0.13 K and u p = 0.005 MPa). By applying a temperature gradient during hydrate formation, it was possible to study multiple subcoolings with a single experiment. Hydrate growth velocities were determined both under temperature gradients and under constant temperature growth. It was found that both NaCl and MEG act as kinetic inhibitors at the studied concentrations. Finally, insights on the mechanism of action of classical inhibitors are presented.

1. Introduction

Gas hydrates are non-stoichiometric, crystalline compounds where guest molecules are trapped in a hydrogen bonded network of water molecules. Under appropriate thermodynamic conditions, the crystal structure is stabilized by weak Van der Waals forces between the guest molecules and the host cavities [1]. All common natural gas hydrates belong to the three crystalline structures: cubic structure I (sI), cubic structure II (sII), and hexagonal structure H (sH). At moderate conditions, structure I is the thermodynamically stable phase for methane hydrate. However, coexistence of structure I and metastable structure II methane hydrate has been shown to occur [2].
Addition of thermodynamic hydrate inhibitors (THIs) such as methanol, ethane-1,2-diol (MEG) or sodium chloride to the aqueous phase may prevent hydrate formation. These additives shift the hydrate stability zone [3,4] and may prevent pipelines from reaching hydrate forming conditions. For low temperature and high water cut operations, amounts in excess of 50 % by volume of THI’s may be required. Inhibitor use in these quantities can increase the cost of fossil fuel production significantly [5].
Cha et al. [6] have reported that 10 % MEG does not have kinetic inhibition properties whereas 30 % MEG does have kinetic hydrate-inhibition properties. Although NaCl is considered to be a thermodynamic inhibitor, Chong et al. [7] have noted its kinetic inhibition effects. Nagashima et al. [8] have shown that upon hydrate formation, NaCl concentration increases in the aqueous phase.
Over the past decade, there has been a transition towards low dosage hydrate inhibitors (LDHIs) [5,9]. These chemicals are used in aqueous mass fractions ranging from 0.1% to 2% and can be divided into kinetic hydrate inhibitors (KHIs) and anti-agglomerants (AAs). KHIs tend to delay nucleation and growth of hydrates. On the other hand, AAs do not prevent hydrate formation, but instead prevent agglomeration of hydrate particles in pipelines [10,11].
Polyvinyl-pyrrolidone (PVP) is a popular KHI. Posteraro et al. [12] found that methane concentration in the bulk liquid increases with increased PVP inhibitor loading. Another study by Posteraro et al. [13] found the masking effect of PVP on hydrate growth when used in high driving force. The same group found that [13], under certain operating conditions, PVP affects hydrate growth but not nucleation. Bruusgaard et al. [14] showed water droplets containing PVP produced hydrate shells with varying thicknesses and a characteristic rod-like morphology.
Various types of reactors have been designed to study the performance of gas hydrate inhibitors. Growth inhibition is often studied by measuring the lateral growth rate of a single tetrahydrofuran hydrate crystal [15]. Stirred tank reactors and autoclaves have been widely used to study formation/dissociation kinetics at the macro scale [16,17,18,19], hydrate phase equilibria [20,21], and hydrate particle agglomeration [22]. The ball stop rig and rocker rig [5,23], flow loops [24], pipe wheels [3] are examples of reactors that have been used to simulate pipeline conditions for measuring hydrate formation/dissociation kinetics, agglomeration of hydrate particles and plug formation.
Traditional phase equilibria, kinetic and morphology investigation of gas hydrates require separate pieces of equipment and experimentation times in the order of days. Recently, we designed a reactor coupled with a 3-in-1 technique that allowed assessment of crystal morphology, apparent kinetics and phase equilibria of methane hydrates in a single experiment, completed in the order of hours [25]. Morphology and apparent kinetics results for methane hydrate proved to be highly reproducible. Phase equilibrium data with minimum temperature and pressure uncertainties and in close agreement with literature values were obtained. Udegbunam et al. [26] applied this method to systems containing non-colligative inhibitors. Non-colligative inhibitors were used as a first approximation to study inhibitors with our technique, as concentration should not alter the system behavior.
In this paper, we apply the 3-in-1 method to methane + water systems containing thermodynamic inhibitors ethane-1,2-diol (MEG) and sodium chloride (NaCl), and kinetic hydrate inhibitor polyvinyl-pyrrolidone (PVP). Overall, we present a technique based on high resolution imaging and innovative reactor design to assess morphology, kinetics and thermodynamics of hydrate forming systems with a single apparatus. Furthermore, by applying gradients to our samples we are able to observe several subcoolings in a single experiment. Finally, with little time investment, small sample sizes (20 μ L) can be used to obtain replicates with minimum temperature and pressure uncertainties.

2. Materials and Methods

2.1. Materials

Table 1 reports the suppliers and purities of the materials used in this study. Aqueous solutions were prepared by gravimetric method using an analytical balance. Mass fraction standard uncertainties were estimated to be 0.001.

2.2. Apparatus

The 3-in-1 method/apparatus recently developed in our lab was used for all the experiments [25]. A succinct description follows, and we refer the reader to our previous publications for details [25,26].
A stainless steel reactor housed a temperature-control stage. The stage provided localized temperature control using thermoelectric coolers (TE Technology, Traverse city, MI, USA). A sapphire slide held the water sample between the two ends of the stage. Slide temperatures were measured by thermistors (TE Technology, Traverse city, MI, USA) with an instrumental standard uncertainty of u T t h e r m i s t o r = 0.01 K. Sapphire sight windows (Rayotek, San Diego, CA, USA) located on the top and bottom of the vessel allowed illumination and observation of the sample. A PCO.edge 5.5 cMOS camera (Optikon, Kitchener, ON, Canada) equipped with high resolution lenses was used to film the experiments. Cold light illumination was provided by a Schott KL2500 light source (Optikon, Kitchener, ON, Canada). The reactor was cooled with a Thermo Scientific AC200 chiller (Fisher Scientific, Ottawa, ON, Canada), which circulated a 50/50 (v/v) mixture of ethylene glycol and water through a copper coil, wound around the vessel. Pressure was measured with a Rosemount 3051S pressure transmitter (Laurentide Controls, Montreal, QC, Canada) and temperature was monitored with a Platinum RTD probe (Omega Engineering, Laval, QC, Canada). Instrumental standard uncertainty for bulk temperature was u T R T D = 0.32 K and u p = 0.005 MPa for pressure.

2.3. Methods

A clean sapphire slide was placed on the stage, and a 20 μ L droplet of the sample solution was transferred to the slide with a micro-pipette. Subsequently, the vessel was sealed and purged with nitrogen and methane.

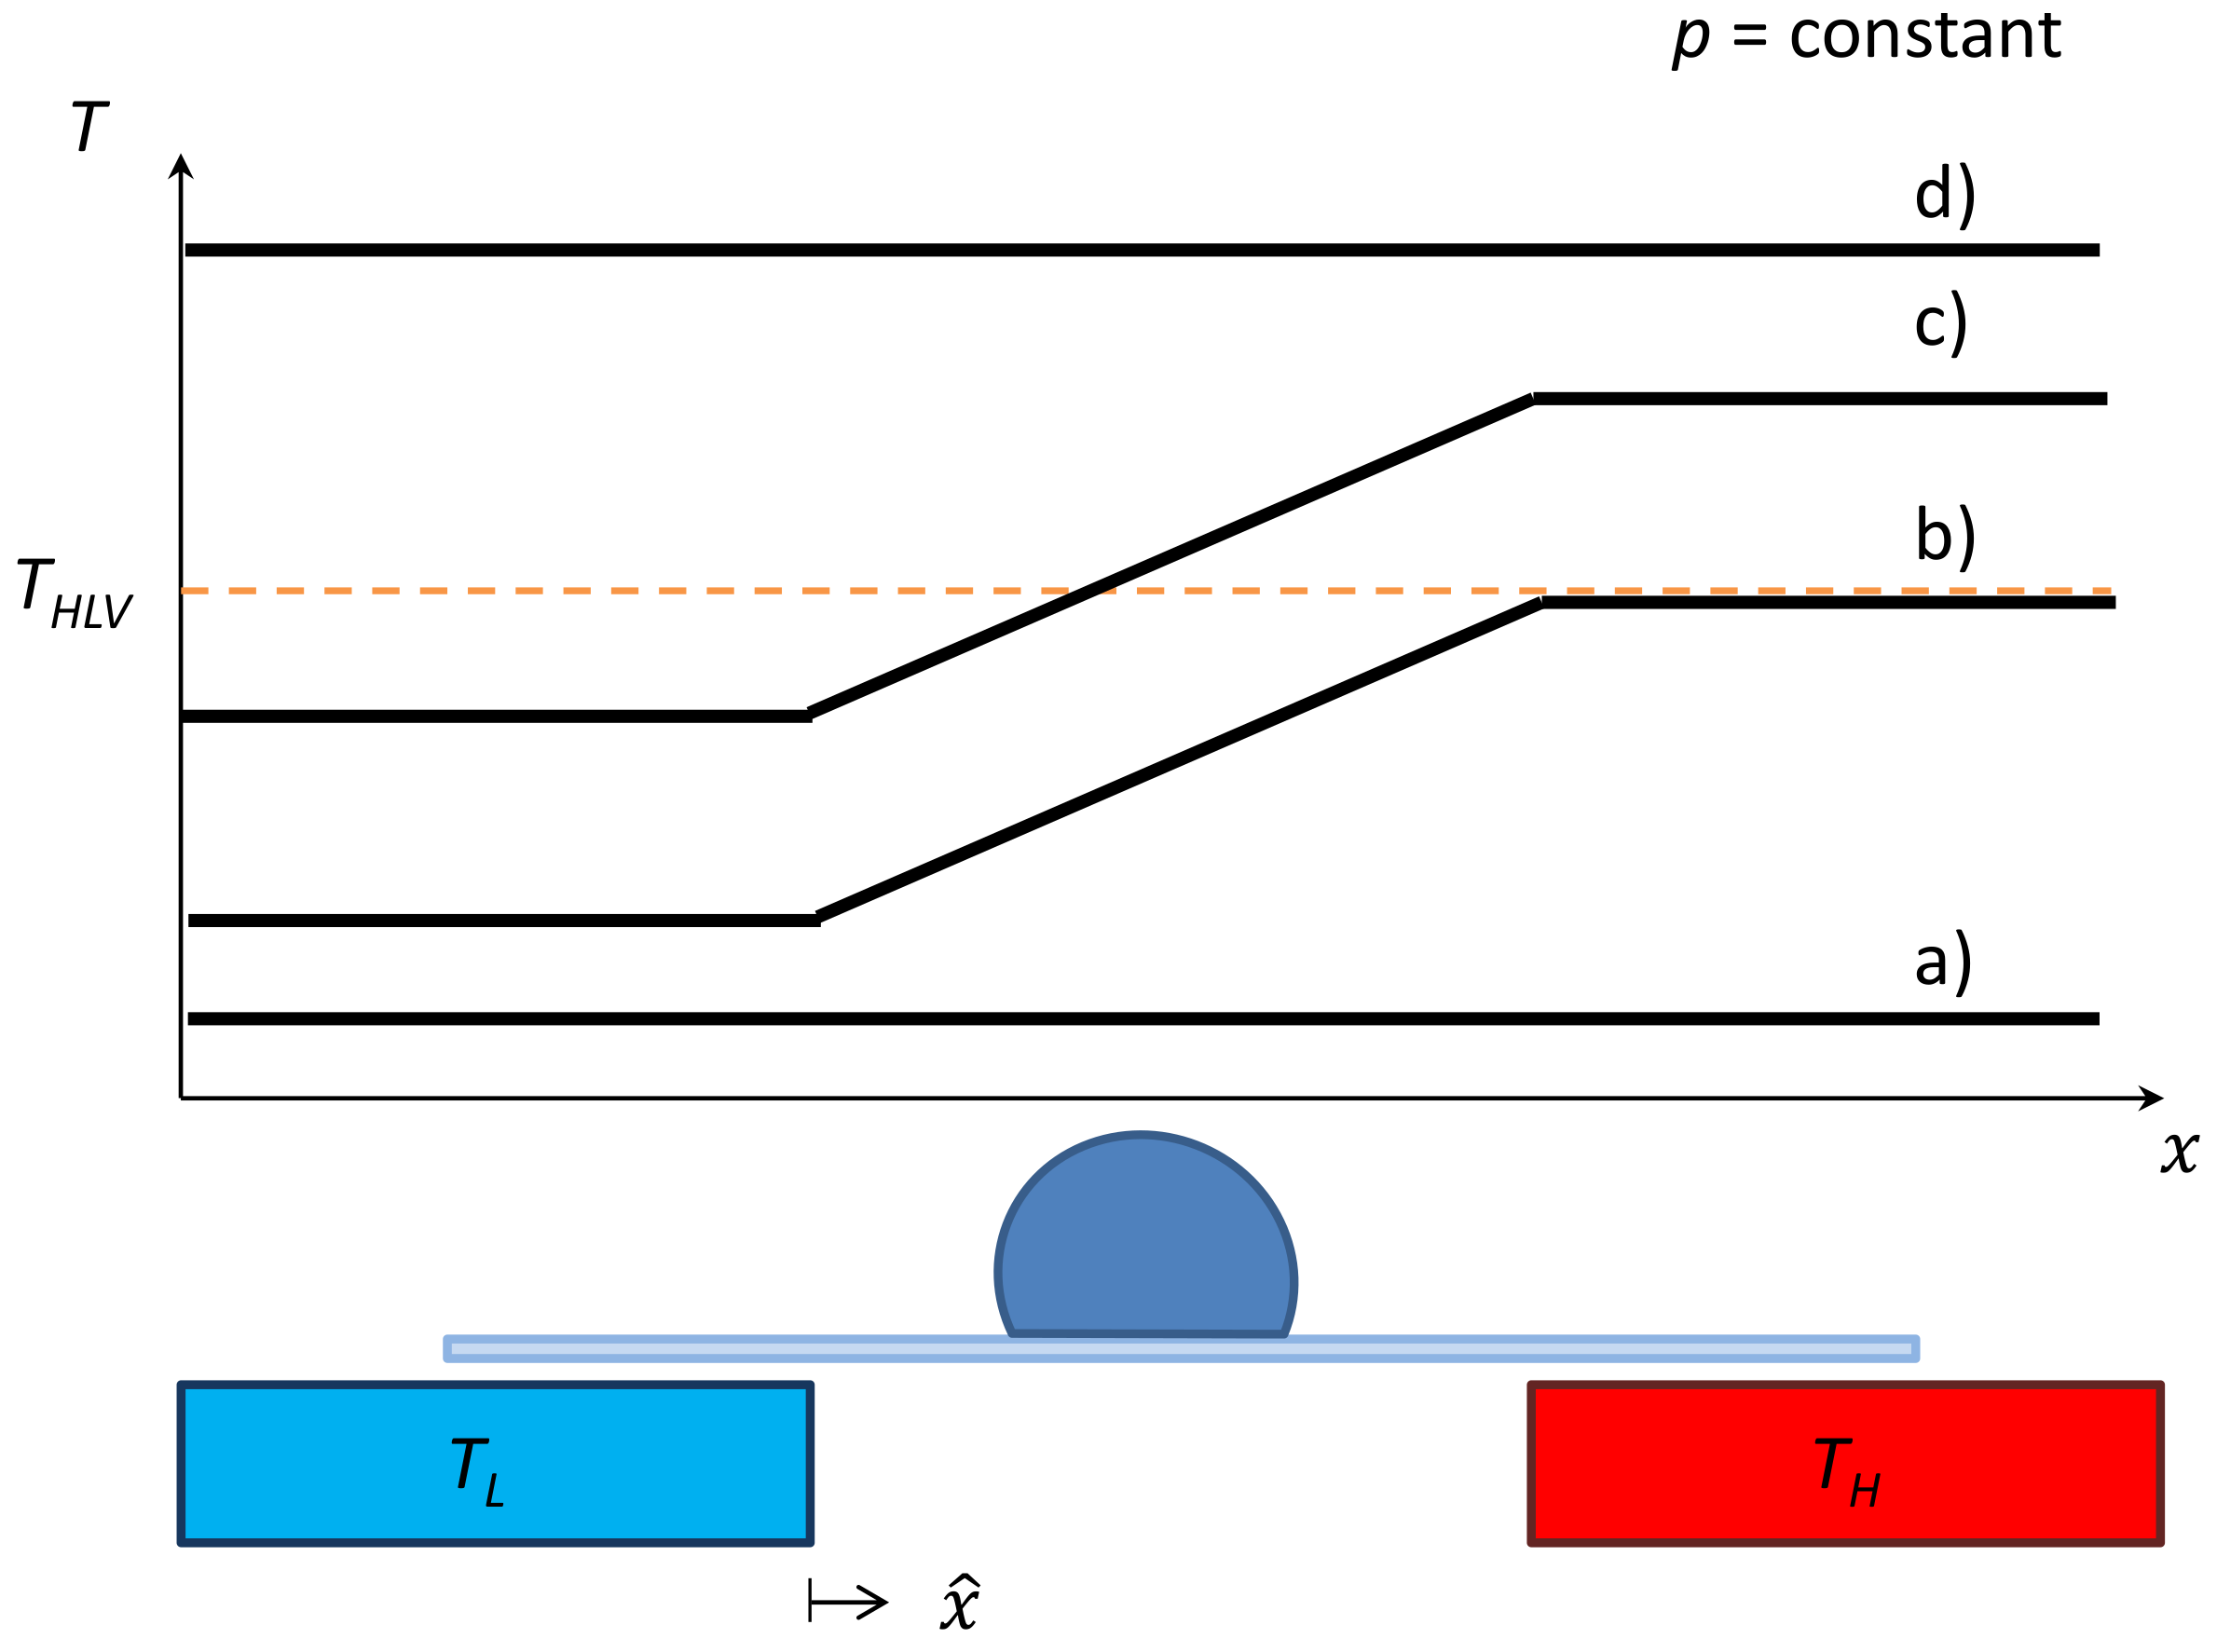
2.3.1. Crystal Formation History

To shorten the induction time for hydrate nucleation, all the hydrate formation experiments were performed with water droplets that had undergone previous clathrate formation. Figure 1 provides a schematic of the pre-treatment steps. To start, ice was formed slightly above atmospheric pressure and then melted in the hydrate stable region to form hydrates. The sample was then heated just above hydrate-liquid-vapor equilibrium temperature, at the experimental pressure, to dissociate the initial hydrate [25]. Discussion on crystal formation history is beyond the scope of this paper, but interested readers are referred to the literature on this topic as applied to gas hydrates [27,28,29,30].

2.3.2. Hydrate Formation

The temperature control stage locally cooled the sample to the required temperature profile. Two profiles were used: uniform surface temperatures (Figure 2a) and constant temperature gradients (Figure 2b) across the sample. The sample was cooled at a rate of approximately 5 K min 1 while the system moved from the liquid vapor region to the hydrate liquid region (Figure 1d traversed from right to left). Experimental conditions were fixed for the duration of the clathrate formation [25].

2.3.3. Hydrate Dissociation

Two temperature profiles were also used for hydrate dissociation: uniform surface temperature (Figure 2d) and constant temperature gradient (Figure 2c). The high and low set-point temperatures were increased simultaneously. Each of such step increases in the end temperatures moved the HLV isotherm toward the cold side of the stage [25]. For clathrate dissociation under uniform temperature, the whole sapphire surface was heated in small increments until complete hydrate dissociation was observed.

3. Results and Discussion
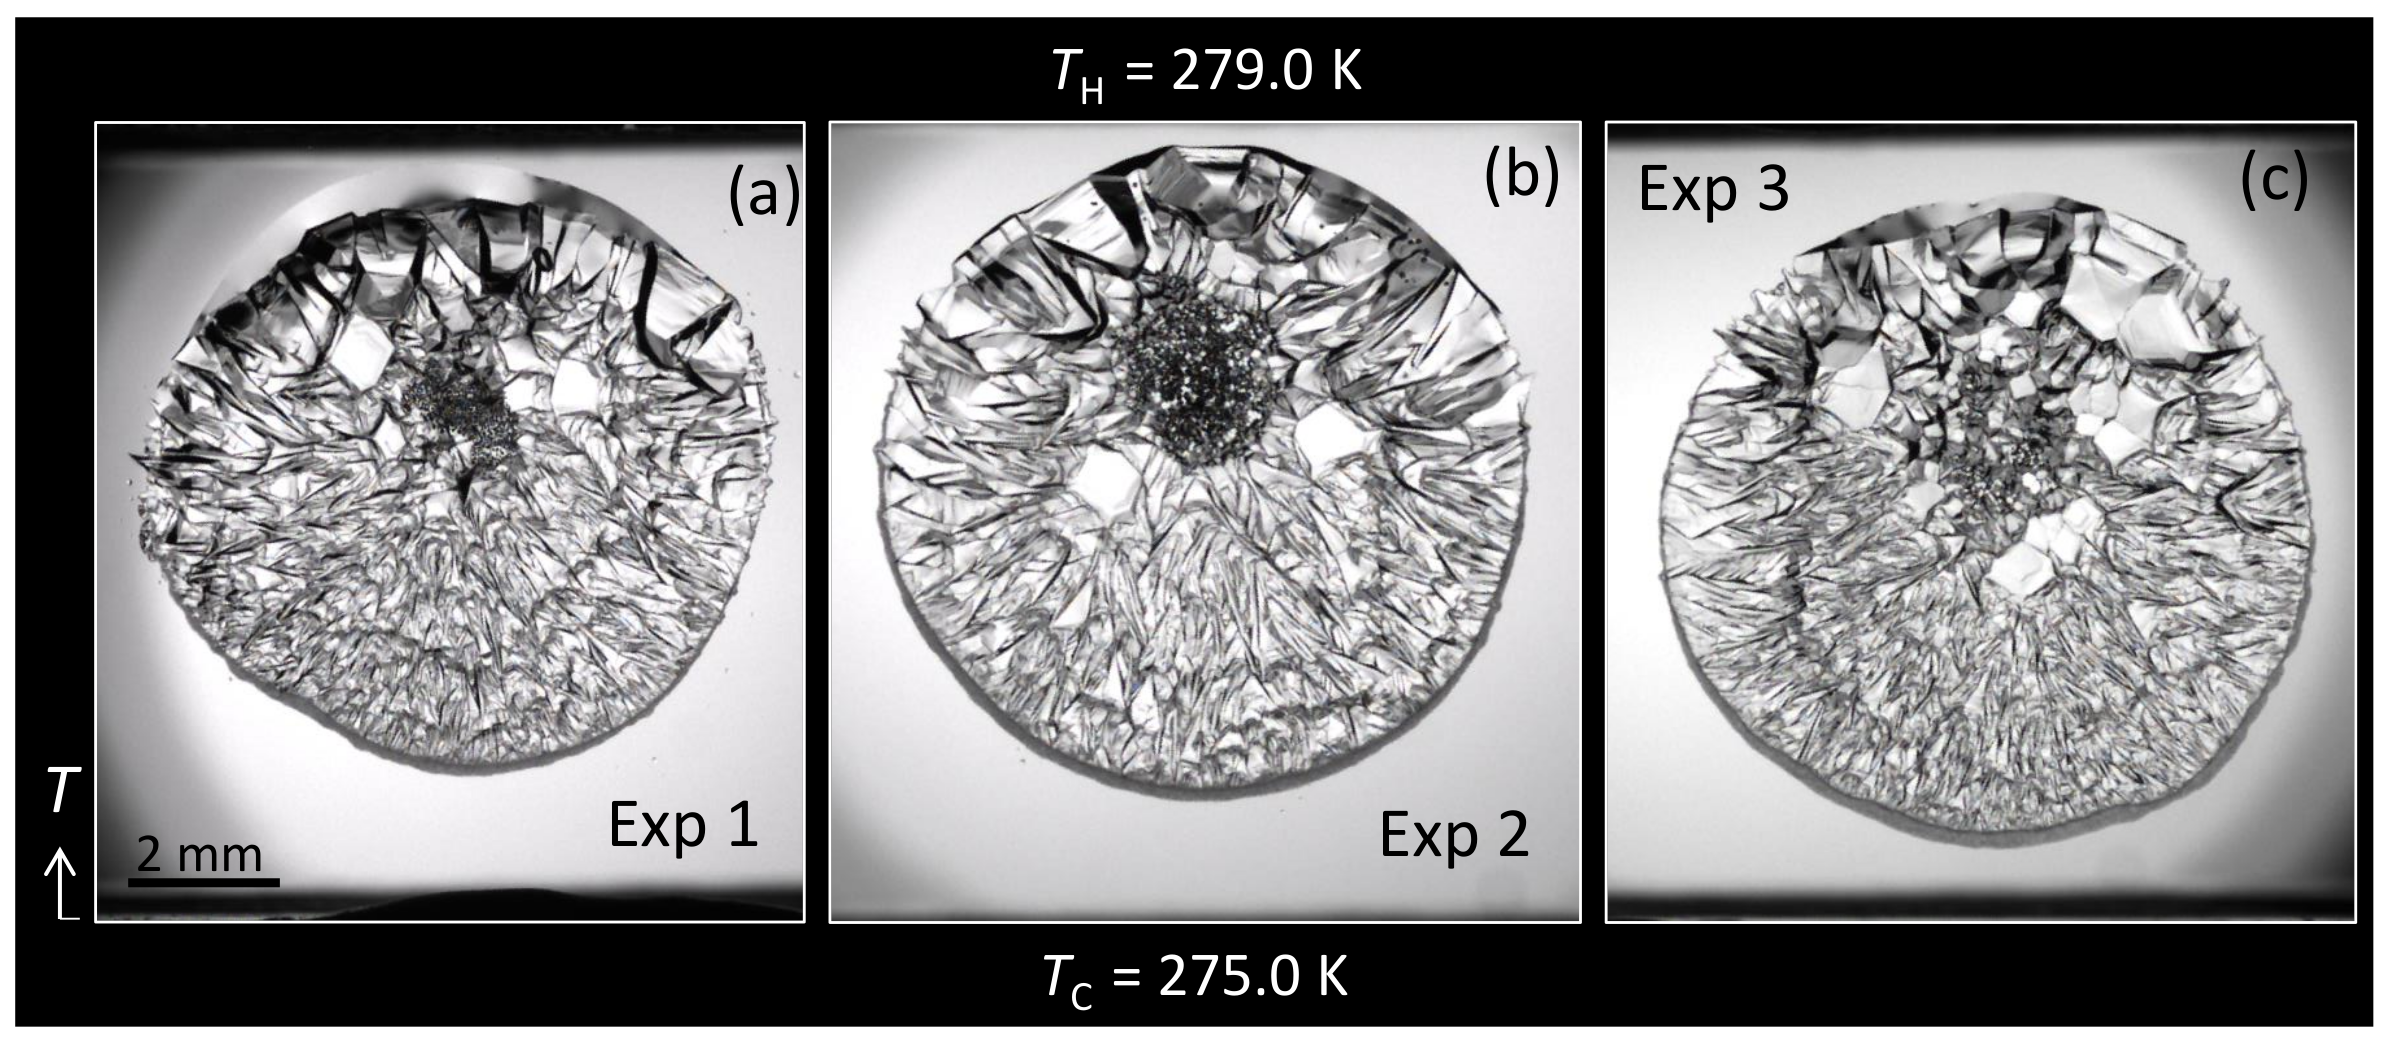
Hydrate formation and dissociation experiments were performed to assess the effect of gas hydrate inhibitors on hydrate crystal morphology, apparent kinetics, and phase equilibrium.
A minimum of three runs were performed at each set of conditions for all systems used in this study. This confirmed reproducibility of the observed crystal growth behavior, film velocity, and phase equilibria.
The degree of sub-cooling ( Δ T sub ) was used as a measure of the driving force for hydrate formation. Sub-cooling was defined as Δ T sub = T eq T exp , where T eq is the HLV equilibrium temperature and T exp is the experimental temperature at a given pressure.

3.1. Morphology

3.1.1. Water + CH 4 + MEG ( w MEG = 10 % )

A sequence of methane hydrate growth on an aqueous MEG solution droplet, subject to a temperature gradient, is shown in Figure 3. The crystal nucleated at random points within the droplet and moved towards the center of the droplet. The hydrate growth-front advanced faster toward the high driving force (lower temperature) end than toward the low driving force (higher temperature) end of the slide. Halo growth (hydrate growth outside of the original water boundary) [31] started from the high driving force end of the slide after the hydrate front had reached the droplet boundary, but before completing coverage of the droplet by the hydrate layer (Figure 3c). The halo crystal habit transitioned from smooth to polygonal morphology as the halo advanced away from the center of the droplet (Figure 3d). The size of hydrate crystals in the halo also decreased with increased subcooling: this can be seen clearly by comparing the halo morphology at 1 K subcooling (Figure 4) and at 3 K subcooling (Figure 4).
Temperature gradient experiments can be used as benchmarking tools to assess morphology changes, across several subcoolings, using a single experiment. Figure 4 shows detailed views of a gradient experiment with a water droplet containing 10 % MEG. Methane hydrate formed in the presence of MEG exhibited a type 1, spherulitic morphology for Δ T sub > 1.5 K.
At approximately Δ T sub = 1.5 K, a transition to large faceted crystals was observed. For Δ T sub < 1.5 K the hydrate continued to exhibit a faceted morphology. Throughout the hydrate film, dark channels were observed between grain boundaries (insets of Figure 4). The faceted crystals from the droplet propagated outside the original water boundary (Figure 4(left) and Figure 4a).
The presence of MEG had a dramatic effect on halo propagation. Previous studies [31,32] had reported smooth halos, but never the three-dimensional faceted habit observed in Figure 4. The results observed in Figure 4 were highly reproducible as shown in Figure 5.
Once the temperature gradient experiment was carried out to assess the effect of multiple subcoolings, uniform temperature experiments were carried out to study a particular driving force in detail. Figure 6 shows a hydrate prepared from a 10 % MEG aqueous solution under uniform Δ T sub = 2.9 K. The gradient (Figure 4) and the uniform (Figure 6) temperature experiments exhibited type 1, spherulitic morphologies. At 2.9 K, the crystal habit is comparable in both cases (Figure 4 and Figure 6) despite the fact one experiment was run with uniform temperature and the other with a gradient.
Figure 7 shows a dissociation sequence of methane hydrate formed from an aqueous solution containing a mass fraction of 10 % MEG using a temperature gradient. The observed hydrate-liquid phase interface was irregular. This could be due to a concentration gradient of inhibitor across the droplet. In Figure 7b,c it can be seen that hydrate dissociated towards the hot side of the gradient but also in several other regions on the slide. Since no clear pattern of dissociation was observed during temperature gradient experiments, uniform temperature dissociation was carried out.
Figure 8 shows the sequence of hydrate dissociation using a uniform surface temperature. Hydrate dissociation started from the boundary of the droplet around 0.6 K below the HLV equilibrium. Dissociation proceeded symmetrically from the periphery toward the center of the droplet. This is expected, as dissociation is an endothermic process and heat is more effectively transferred from the periphery. Comparable results were observed for hydrate dissociation from systems containing NaCl and for uninhibited systems.

3.1.2. Water + CH 4 + NaCl ( w NaCl = 5.44%)

Figure 9 presents a typical hydrate, formed from an aqueous NaCl solution droplet, subject to a temperature gradient. The hydrate exhibited a smooth granular morphology for Δ T sub > 1.5 K and faceted hydrate morphology below Δ T sub < 0.7 K. For 0.7 K Δ T sub 1.5 K a mixture of faceted and granular morphology was observed. Similar to the pure system [25], the size of the individual hydrate crystals decreased with increasing Δ T sub .
A small increment in the size of the individual hydrate crystals was observed as the hydrate film advanced away from the center of the droplet. A section of the aqueous solution droplet remained in the liquid state within the hydrate stable region. Furthermore, there was an unexpected change in crystal size towards the periphery of the droplet along an isotherm which can also be attributed to the local change of Δ T sub . This can be explained by the increase in NaCl concentration in the liquid phase caused by hydrate crystallization [4,8]. Once the hydrate film reached the droplet boundary near the high driving force end, a hydrate halo [31,32] propagated outside of the original water boundary.
Compared at the same subcooling, hydrate crystals for the NaCl system were smaller than the hydrates formed with MEG, yet larger than those of the pure system. In contrast, Sakemoto et al. [33] observed that the morphology of cyclopentane hydrate with pure water and with NaCl solutions was qualitatively similar at the same Δ T sub .
Dissociation of hydrates prepared from NaCl solutions started at the droplet boundary and proceeded symmetrically toward the center of the droplet. This was also true for the MEG system and the uninhibited system. However, the NaCl system did not form gas bubbles upon dissociation. Solubility work in the literature [34,35,36] suggests that at the conditions we worked with (p, T and x), methane should be roughly twice as soluble in the aqueous phase in the presence of MEG than in the presence of NaCl. Based on the solubility argument alone, one would expect no bubbles with MEG. A more likely explanation for the formation of bubbles is the lower surface tension of 10% MEG aqueous solutions [37] compared to that of 5.44% NaCl solutions [38].

3.1.3. Water + CH 4 + PVP ( w PVP = 0.1 % )

Figure 10 presents a typical hydrate formation from an aqueous PVP solution droplet, subject to a temperature gradient. Within the tested conditions, the driving force had no observable effect on clathrate morphology.
The hydrate film was very thin (based on translucency) and smooth compared to hydrates formed from pure water [25] or in the presence of MEG (Figure 4) and NaCl (Figure 9). This result is comparable with those reported in past studies for KHIs [14,39,40]. Addition of KHIs has been postulated to increase the porosity of the hydrate crust, thus allowing for guest transport and thickening of the clathrate [41,42,43,44,45,46]. Once hydrate film covered the entire droplet surface, a thin hydrate halo extended outside of the original water boundary (Figure 10).
When temperature gradients were used to dissociate methane hydrates prepared in the presence of PVP, remnant crystals were observed in the liquid phase region above the HLV equilibrium temperature. These remnant crystals were only stable near the hydrate-liquid interface and dissociated after approximately 5 h slightly above T HLV . These results are comparable with those reported previously [14]. Sharifi et al. [47], Daraboina et al. [48,49] and Makogon et al. [50] have reported that hydrate formed in the presence of KHIs dissociated at a higher temperature compared to the hydrate prepared in pure water. Although PVP was found to inhibit hydrate growth it also seemed to stabilize the hydrate, and as a result it inhibits hydrate dissociation.

3.2. Overall Result

3.2.1. Overall Morphology

Figure 11 and Figure 12 offer a morphology comparison of methane hydrate formed on quiescent water droplets, with and without inhibitors, subject to temperature gradients (Figure 11) and to uniform temperatures (Figure 12). On inspection, it is evident that each system has a unique, easily distinguishable morphology.
Multiple subcoolings were assessed in a single gradient experiment as shown for different systems in Figure 4, Figure 9 and Figure 10 (summarized in Figure 11). This represents a tremendous economy in inhibitor characterization. Thus, gradient experiments could be used to benchmark an inhibitor. Then, uniform temperature experiments could be used, if desired, to study a specific subcooling of interest (Figure 12).

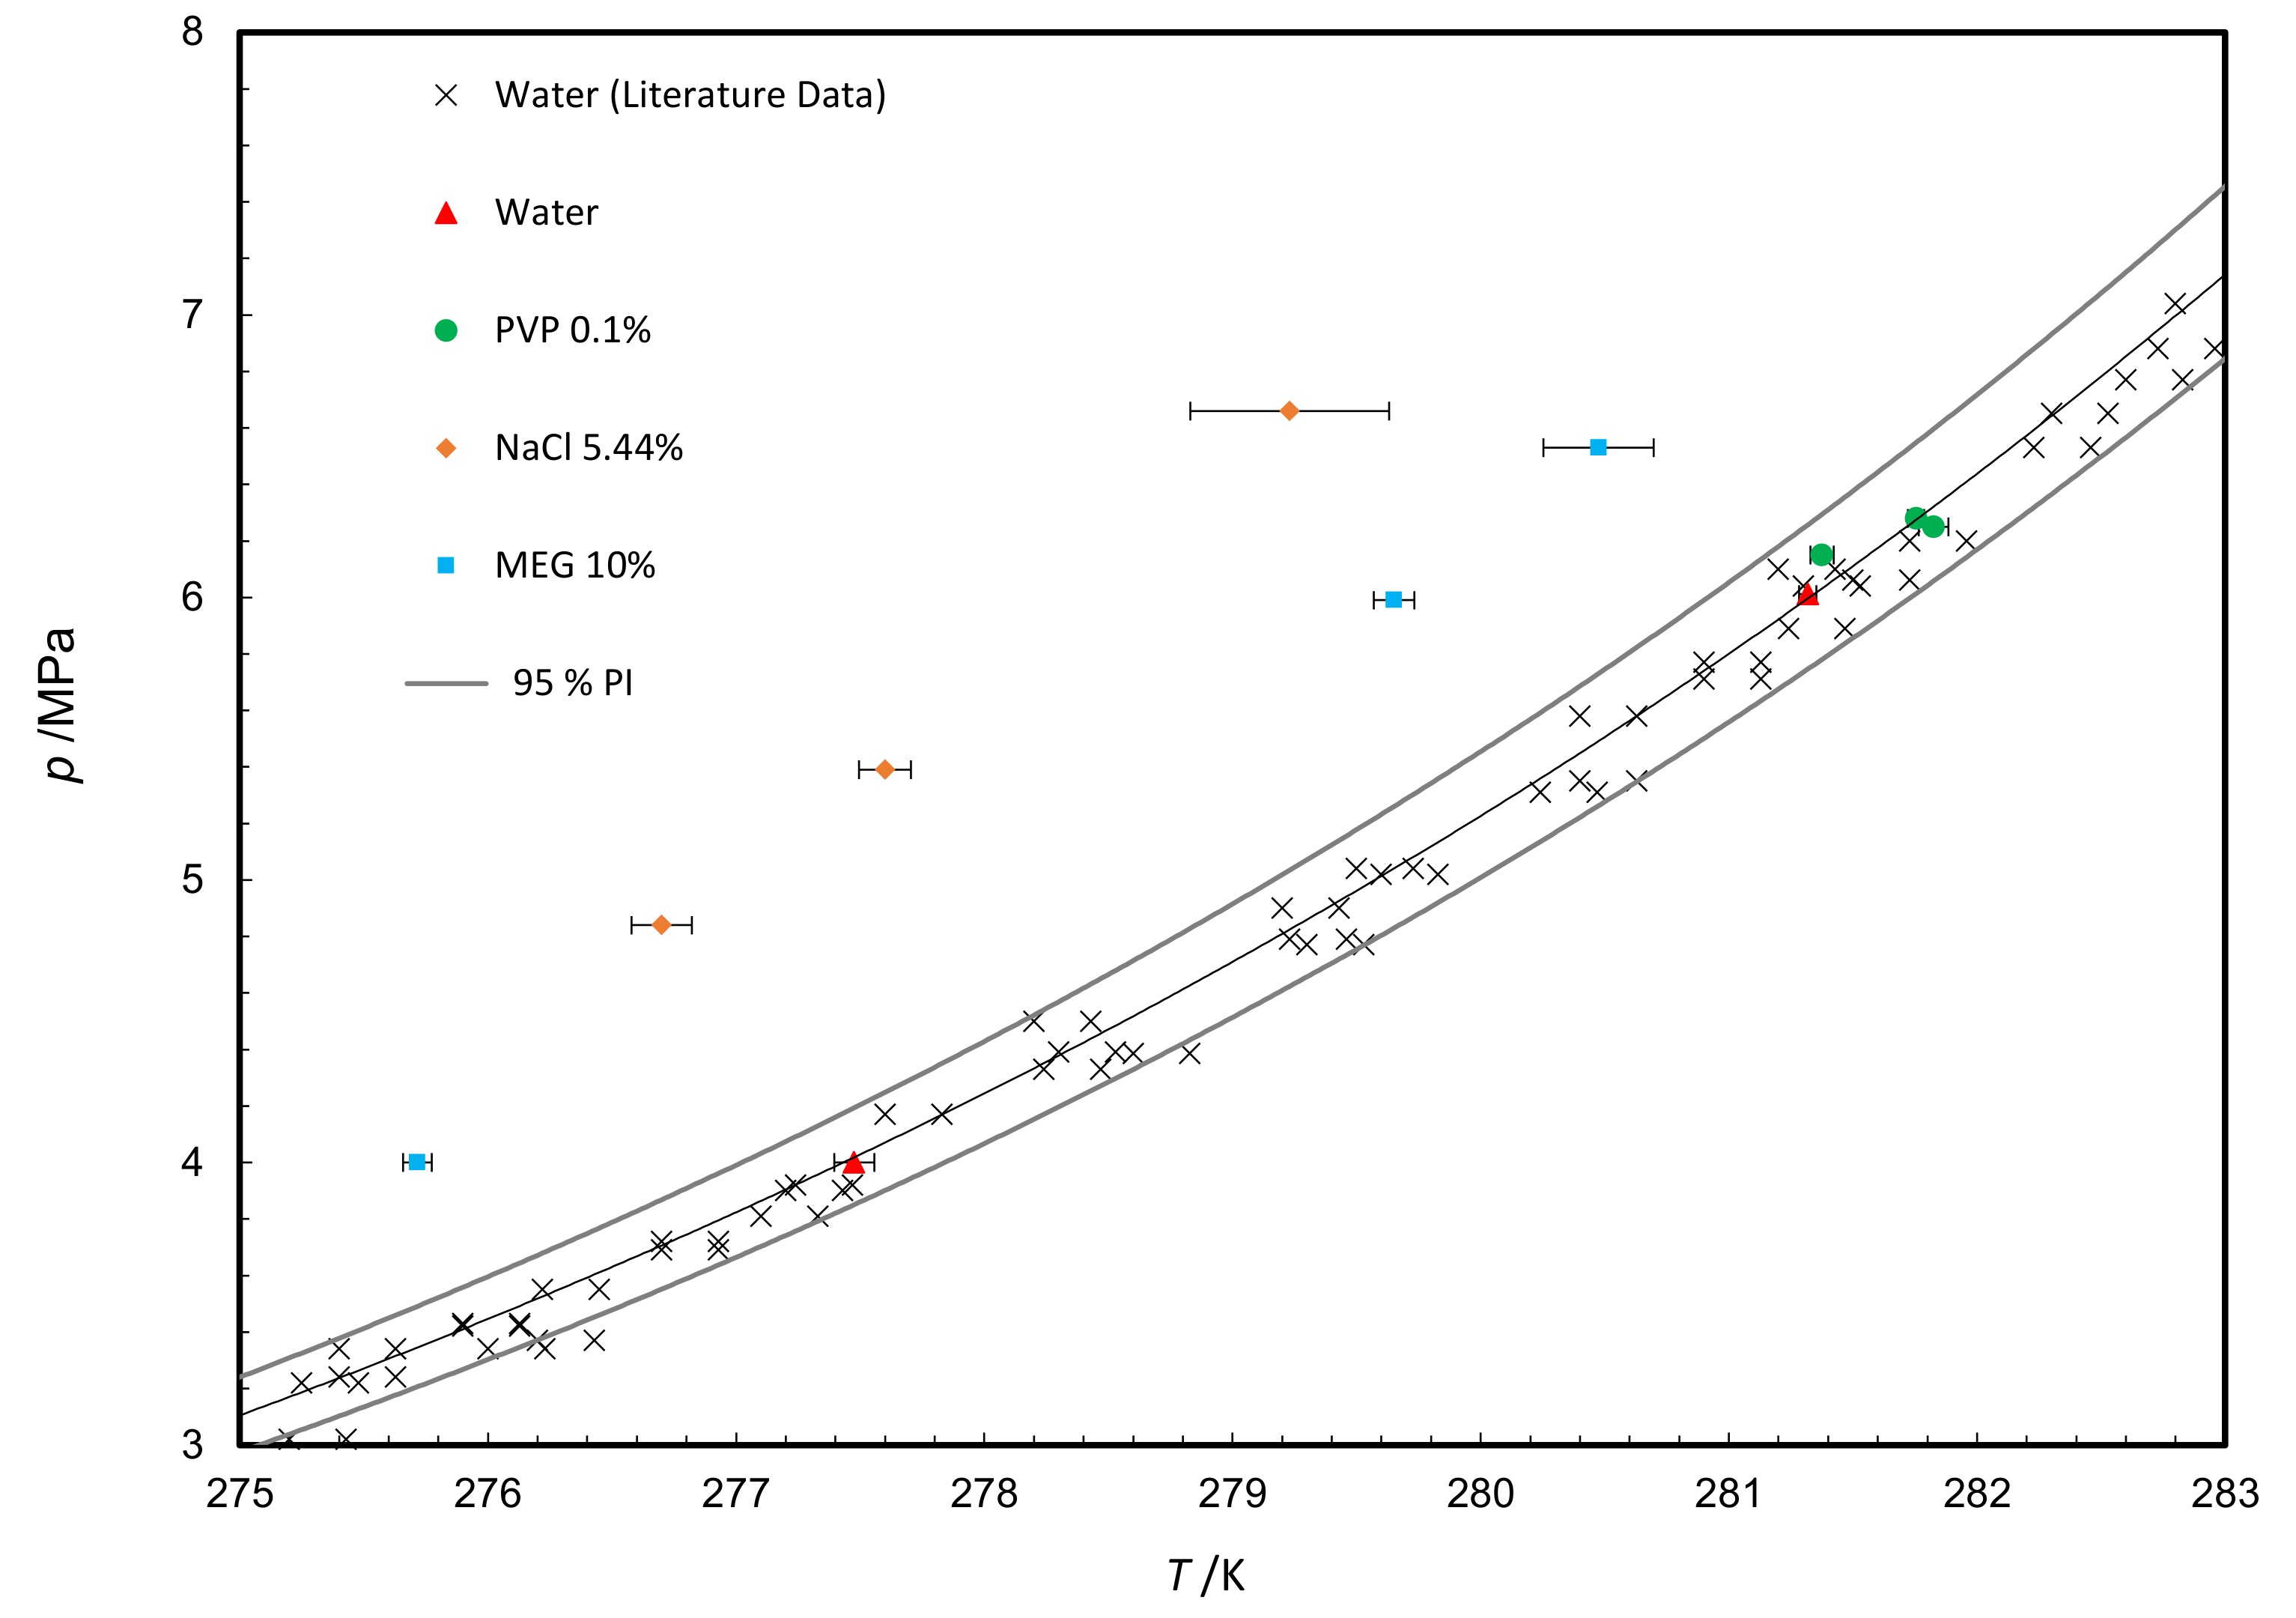
3.2.2. Phase Equilibria

For the systems: water + NaCl ( w NaCl = 5.44 % ) + CH 4 , and water + MEG ( w MEG = 10 % ) + CH 4 the equilibrium temperature was determined by averaging the temperature at which the last hydrate crystal was observed and the temperature at which the complete hydrate dissociation was achieved.
The results of phase equilibrium measurements for the dissociation data are summarized in Figure 13. The HLV values for the systems: water + CH 4 , and water + PVP ( w PVP = 0.1 % ) + CH 4 fall within a 95% prediction interval, regressed from HLV data for the water + CH 4 system, compiled in the literature [11]. The presence of either NaCl or MEG shifted the hydrate equilibrium conditions to higher pressures and lower temperatures. Table 2 lists all the HLV values with uncertainties.
The methane hydrate, phase-equilibrium results in the presence of THIs, are summarized in Figure 14 and Figure 15. The CSMGem [51] model prediction and the corresponding literature data are also shown in these figures. Both NaCl and MEG reduced the hydrate stability region, as a result lower temperature is required for hydrate formation at constant pressure.
Equlibrium data shown in Figure 14 and Figure 15 are precise (error bars corresponds to one standard uncertainty), within a maximum deviation of 0.7 K with respect to CSMGem [51] predictions, and comparable to previous studies [52,53,54]. Notwithstanding, prediction values are steadily higher for NaCl and consistently lower for MEG compared to our experiment. This systematic deviation between data and prediction is comparable to that reported by Lafond et al. [4] for methane hydrate in the presence of 10 % methanol aqueous solutions.

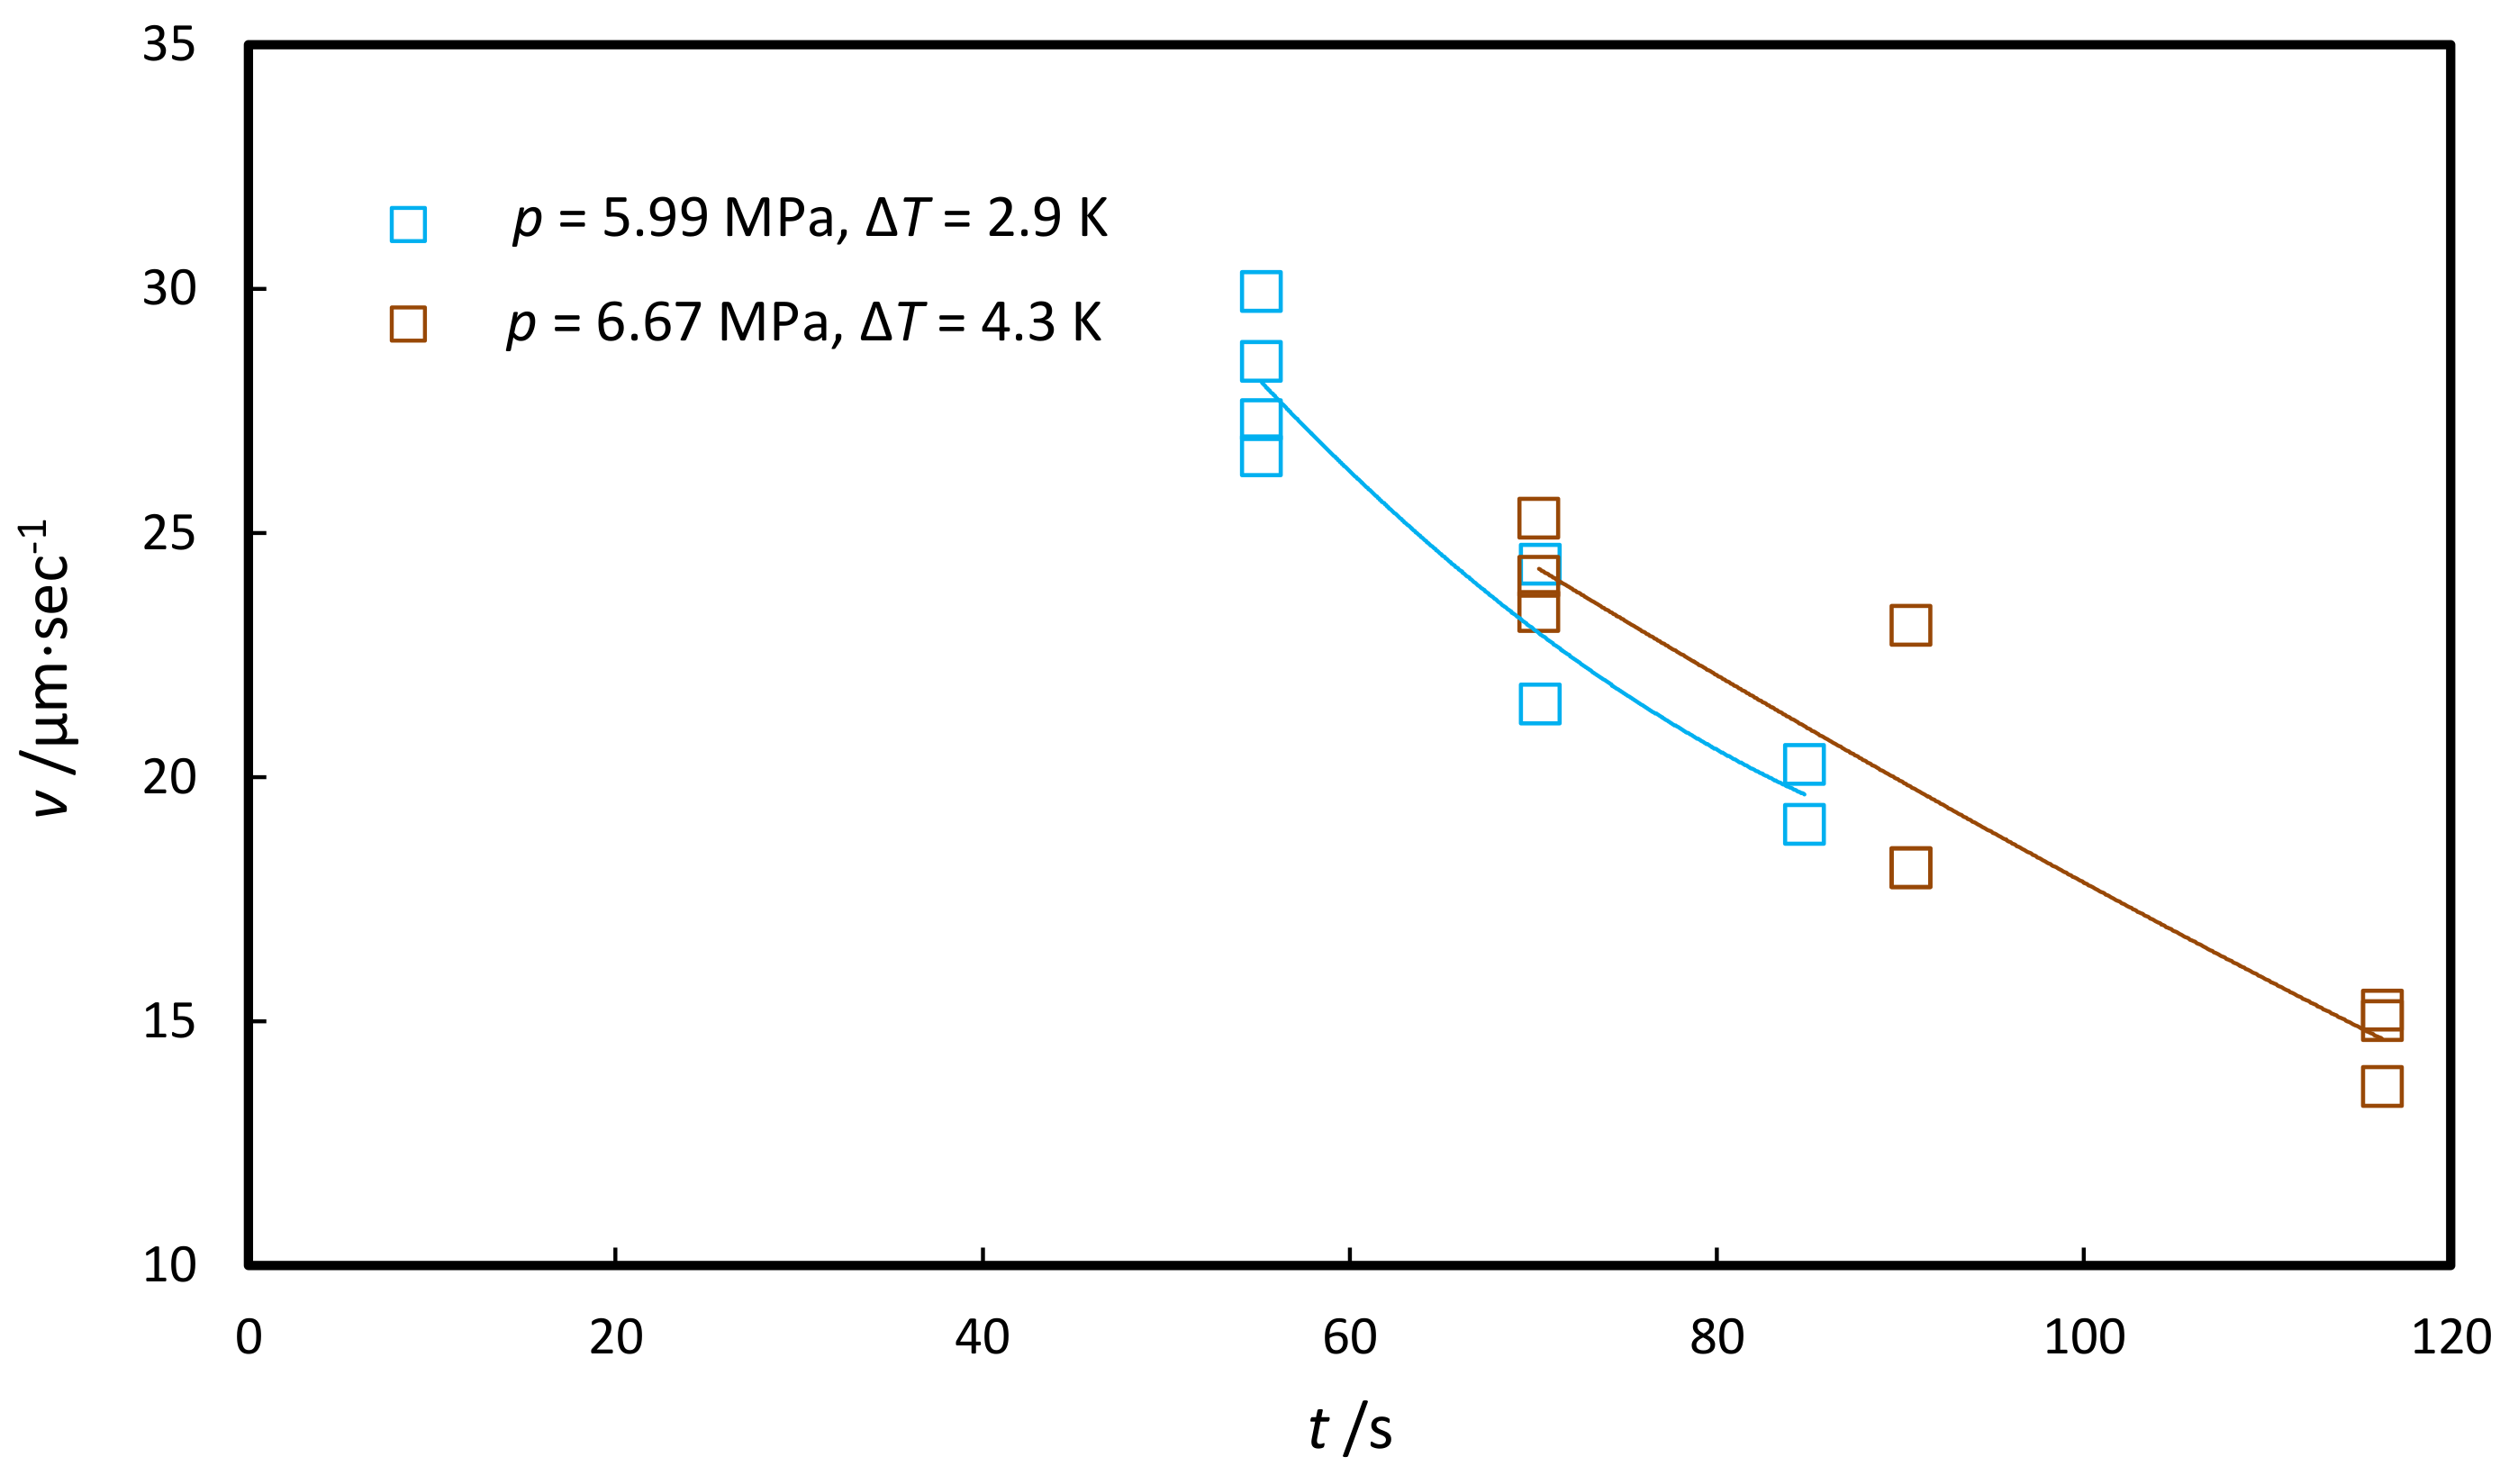
3.2.3. Apparent Kinetics

Kinetic inhibitors are generally considered to retard nucleation, and assessment is generally done by measuring induction times. Given the stochastic nature of nucleation it can be difficult and resource-intensive to obtain meaningful nucleation time data. Anderson et al. [55] have shown that measuring crystal growth rates is a simple and reproducible way to quantify inhibition. Here, we used hydrate film growth to measure apparent growth kinetics. The method was described in detail in a previous publication [25]. Figure 16 shows the relationship between film velocity and degree of subcooling ( Δ T sub ) for inhibited and uninhibited systems. With increasing Δ T sub , hydrate film velocity increased in all systems. Multiple measurements were taken for each experiment, as shown in Figure 16. When Δ T sub 2 K, rates appeared to be almost confounded for systems with and without inhibitors. However, for Δ T sub 4 K it became evident that the addition of either NaCl, PVP, or MEG significantly reduced the growth velocity of the pure water system.
Gradient experiments allowed assessment of multiple subcoolings in a single experiment. Thus, a gradient experiment could be used to benchmark the kinetic behavior of an inhibitor (full markers in Figure 16). If required, uniform temperature experiments could then be used to study a particular driving force with reduced uncertainty compared to gradient experiments (empty markers in Figure 16).
Our results agree qualitatively with those reported previously for CO 2 hydrate growth rate in the presence of salt [56,57,58]: we observed reduced methane hydrate growth rates in the presence of NaCl. In contrast, Cha et al. [6] reported that 10 % MEG solution had no kinetic inhibition properties on natural gas hydrates, whereas we observed significant kinetic inhibition for methane hydrates with a 10 % MEG solution. As expected [59,60,61], the hydrate film velocities in the presence of PVP are lower than those for pure water. It has been proposed that the presence of PVP decreases hydrate growth rates because PVP can adsorb to the hydrate crystals and sterically hinder crystal growth [12,18,44,48,49,62,63].
Film velocities were found to decrease with respect to time in systems with thermodynamic inhibitors subject to uniform constant temperatures. Figure 17 shows how film velocity decreased in the water + MEG ( w MEG = 10 % ) + CH 4 system as time progressed. The same holds true for the system water + NaCl ( w NaCl = 5.44 % ) + CH 4 . Rejection of MEG and NaCl from the hydrate crystal causes locally increased MEG and NaCl concentration ahead of the growing front, reduced Δ T sub , and ultimately local reduction in film velocity.

3.2.4. Hydrate Halo Growth

All of the systems studied in this work showed halo growth (Figure 4, Figure 9 and Figure 10). The pure system formed halo which was smooth irrespective of driving force and temperature profile. The presence of MEG produced a smooth crystal that propagated outside the original water boundary, but this halo changed abruptly to a faceted morphology (Figure 4 and Figure 11b). However, the MEG halo on the low driving force side seemed to merge with the faceted crystal growing within the water droplet (Figure 4 and Figure 11b). Halo propagation has been shown to operate through water migration by capillary action, followed by hydrate formation [31]. Indeed, the wettability of the sapphire substrate was higher with the 10 % MEG aqueous solution compared to the other systems in this study. It is plausible that this increased wettability facilitated water migration and the dramatic halo effect observed with MEG.
Addition of NaCl produced a smooth halo for the most part (Figure 9), except at very low driving forces ( Δ T sub 0.5 K) where it seemed that the main crystal merged with the halo (Figure 9).
Mori et al. [64,65] proposed a water capillary permeation model for the transport of water molecules in the formed hydrate layer, and latter Davies et al. [66] reported that hydrate growth is controlled by the movement of water in the hydrate film. Austvik et al. [67] also noted that polycrystalline gas hydrate films are generally porous. Therefore, it is plausible that the porous channels in the hydrate film could provide the transport route for aqueous solution migration through the hydrate layer and to the sapphire surface.
The hydrate crust formed at low subcoolings exhibited fewer channels than that formed at high subcoolings. These channels consistently made contact with the sapphire surface at the periphery of the aqueous solution. This might be the reason more hydrate halo growth was observed towards the cold side than the hot side of the gradient experiments.

4. Conclusions

We successfully assessed hydrate morphology and growth rates in the presence of traditional hydrate inhibitors (MEG, NaCl, and PVP) using the 3-in-1 reactor/method [25]. The method also produced reliable phase equilibrium data (hydrate-liquid-vapor) with minimal uncertainties ( u T avg = 0.13 K and u p = 0.005 MPa).
Addition of NaCl, MEG or PVP significantly reduced hydrate growth rates compared to the uninhibited system. Furthermore, in the presence of either NaCl or MEG, methane hydrate growth rate slowed down as crystallization progressed. This was attributed to increased concentration of THIs in the liquid phase, ahead of the growing hydrate front.
Hydrate crystal-growth behavior varied between pure and inhibited systems, and distinctly with each additive. For systems inhibited with MEG and NaCl, it was found that the size of individual hydrate crystals decreased with increasing subcooling. For systems inhibited with PVP, no significant change in the crystal habit was observed. Morphologies were found to be highly reproducible with the 3-in-1 method.
Halo propagation (hydrate growth outside of the original water boundary) was observed in all the systems studied here. It was hypothesized that inhibitors may change hydrate porosity which could facilitate the permeation of the aqueous solution through the hydrate layer. The latter, in conjunction with wettability changes due to inhibitor addition, may explain the change of crystal habit of hydrate halos in the presence of THIs.
Overall, the obtained morphology, kinetics and phase equilibria results were consistent and reproducible. Furthermore, gradient experiments allowed assessment of multiple subcoolings in a single experiment. The 3-in-1 reactor/technique should prove valuable especially in the assessment of potential inhibitors, when turnaround times are critical or when samples are available in limited quantities.

Author Contributions

Conceptualization, J.G.B.; methodology, J.G.B., N.K. and N.B.C.; software, J.G.B., N.K. and N.B.C.; validation, J.G.B., N.K. and N.B.C.; formal analysis, J.G.B., N.K. and N.B.C.; investigation, J.G.B., N.K. and N.B.C.; resources, J.G.B.; data curation, J.G.B., N.K. and N.B.C.; Writing—Original Draft preparation J.G.B., N.K. and N.B.C.; Writing—Review and Editing, J.G.B. and N.B.C.; visualization J.G.B., N.K. and N.B.C.; supervision, J.G.B.; project administration, J.G.B.; funding acquisition, J.G.B.

Funding

Natural Sciences and Engineering Research Council of Canada (NSERC) Discovery Grant No. 42488, the Canadian Foundation for Innovation (CFI) Project # 30151 and the Royal Military College of Canada Short Term Research Needs Program.

Conflicts of Interest

The authors declare no conflict of interest.

References

  1. Van der Waals, J.H.; Platteeuw, J.C. Clathrate solutions. Adv. Chem. Phys. 1959, 2, 1–57. [Google Scholar]
  2. Schicks, J.M.; Reepmester, J.A. The Coexistence of Two Different Methane Hydrate Phases under Moderate Pressure and Temperature Conditions: Kinetic versus Thermodynamic Products. Chem. Int. Ed. 2004, 43, 3310–3313. [Google Scholar] [CrossRef] [PubMed]
  3. Urdahl, O.; Lund, A.; Mork, P.; Nilsen, T. Inhibition of gas hydrate formation by means of chemical additives—I. Development of an experimental set-up for characterization of gas hydrate inhibitor efficiency with respect to flow properties and deposition. Chem. Eng. Sci. 1995, 50, 863–870. [Google Scholar] [CrossRef]
  4. Lafond, P.G.; Olcott, K.A.; Sloan, E.D.; Koh, C.A.; Sum, A.K. Measurements of methane hydrate equilibrium in systems inhibited with NaCl and methanol. J. Chem. Thermodyn. 2012, 48, 1–6. [Google Scholar] [CrossRef]
  5. Perfeldt, C.M.; Chua, P.C.; Daraboina, N.; Friis, D.; Kristiansen, E.; Ramlov, H.; Woodley, J.M.; Kelland, M.A.; Von Solms, N. Inhibition of Gas Hydrate Nucleation and Growth: Efficacy of an Antifreeze Protein from the longhorn beetle Rhagium mordax. Energy Fuels 2014, 28, 3666–3672. [Google Scholar] [CrossRef]
  6. Cha, M.; Shin, K.; Kim, J.; Chang, D.; Seo, Y.; Lee, H.; Kang, S. Thermodynamic and kinetic hydrate inhibition performance of aqueous ethylene glycol solutions for natural gas. Chem. Eng. Sci. 2013, 99, 184–213. [Google Scholar] [CrossRef]
  7. Chong, Z.R.; Chana, A.H.M.; Babu, P.; Yanga, M.; Linga, P. Effect of NaCl on methane hydrate formation and dissociation in porous media. J. Nat. Gas Sci. Eng. 2015, 27, 178–189. [Google Scholar] [CrossRef]
  8. Nagashima, K.; Yamamoto, Y.; Komai, T.; Hoshino, H.; Ohga, K. Interferometric Observation of Salt Concentration Distribution in Liquid Phase Around THF Clathrate Hydrate During Directional Growth. J. Jpn. Inst. Energy 1999, 78, 326–331. [Google Scholar] [CrossRef]
  9. Davenport, J.R.; Musa, O.M.; Paterson, M.J.; Piepenbrock, M.M.; Fucke, K.; Steed, J.W. A simple chemical model for clathrate hydrate inhibition by polyvinylcaprolactam. Chem. Commun. 2011, 35, 9891–9893. [Google Scholar] [CrossRef]
  10. Kelland, M.A.; Svartaas, T.M.; Ovsthus, J.; Tomita, T.; Mizuta, K. Studies on some alkylamide surfactant gas hydrate antiagglomerants. Chem. Eng. Sci. 2006, 61, 4290–4298. [Google Scholar] [CrossRef]
  11. Sloan, E.D., Jr.; Koh, C. Clathrate Hydrates of Natural Gases; CRC Press: Boca Raton, FL, USA, 2007; pp. 32–58. [Google Scholar]
  12. Posteraro, D.; Ivall, J.; Maric, M.; Servio, P. New insights into the effect of polyvinylpyrrolidone (PVP) concentration on methane hydrate growth. 2. Liquid phase methane mole fraction. Chem. Eng. Sci. 2015, 126, 91–98. [Google Scholar] [CrossRef]
  13. Posteraro, D.; Verrett, J.; Maric, M.; Servio, P. Hydrate anti-agglomeration and synergy effect in normal octane at varying water cuts and salt concentrations. J. Nat. Gas Sci. Eng. 2016, 34, 1–5. [Google Scholar] [CrossRef]
  14. Bruusgaard, H.; Lessard, L.D.; Servio, P. Morphology study of structure I methane hydrate formation and decomposition of water droplets in the presence of biological and polymeric kinetic inhibitors. Cryst. Growth Des. 2009, 9, 3014–3023. [Google Scholar] [CrossRef]
  15. Walker, V.K.; Zeng, H.; Ohno, H.; Daraboina, N.; Sharifi, H.; Bagherzadeh, S.A.; Alavi, S.; Englezos, P. Antifreeze proteins as gas hydrate inhibitors. Can. J. Chem. 2015, 93, 839–849. [Google Scholar] [CrossRef]
  16. Bergeron, S.; Beltran, J.G.; Servio, P. Reaction rate constant of methane clathrate formation. Fuel 2010, 2, 294–301. [Google Scholar] [CrossRef]
  17. Englezos, P.; Kalogerakis, N.; Dholabhai, P.D.; Bishnoi, P.R. Kinetics of formation of methane and ethane gas hydrates. Chem. Eng. Sci. 1987, 42, 2647–2658. [Google Scholar] [CrossRef]
  18. Lederhos, J.P.; Long, J.P.; Sum, A.; Christiansen, R.L.; Sloan, E.D. Effective kinetic inhibitors for natural gas hydrates. Chem. Eng. Sci. 1996, 51, 1221–1229. [Google Scholar] [CrossRef]
  19. Tohidi, B.; Anderson, R.; Mozaffar, H.; Tohidi, F. The return of kinetic hydrate inhibitors. Energy Fuels 2015, 29, 8254–8260. [Google Scholar] [CrossRef]
  20. Bruusgaard, H.; Beltran, J.G.; Servio, P. Vapor-liquid water-hydrate equilibrium data for the system N2 + CO2 + H2O. J. Chem. Eng. Data 2008, 53, 2594–2597. [Google Scholar] [CrossRef]
  21. Luna-Ortiz, E.; Healey, M.; Anderson, R.; Sorhaug, E. Crystal Growth Inhibition Studies for the Qualification of a Kinetic Hydrate Inhibitor under Flowing and Shut-In Conditions. Energy Fuels 2014, 28, 2902–2913. [Google Scholar] [CrossRef]
  22. Huo, Z.; Freer, E.; Lamar, M.; Sannigrahi, B.; Knauss, D.M.; Sloan, E.D. Hydrate plug prevention by anti-agglomeration. Chem. Eng. Sci. 2001, 56, 4979–4991. [Google Scholar] [CrossRef]
  23. Chua, P.C.; Kelland, M.A. Study of the Gas Hydrate Anti-agglomerant Performance of a Series of n-Alkyl-tri (n-butyl) ammonium Bromides. Energy Fuels 2013, 27, 1285–1292. [Google Scholar] [CrossRef]
  24. Bishnoi, P.R. Gas Hydrate—My Personal Ecperinces and Challenges. In Proceedings of the Fifth International Conference on Gas Hydrates, Trondheim, Norway, 13–16 June 2005; pp. 1–18. [Google Scholar]
  25. DuQuesnay, J.R.; Posada, M.C.D.; Beltran, J.G. Novel gas hydrate reactor design: 3-in-1 assessment of phase equilibria, morphology and kinetics. Fluid Phase Equilib. 2015, 413, 148–157. [Google Scholar] [CrossRef]
  26. Udegbunam, L.U.; DuQuesnay James, R.; Osorio, L.; Walker, V.K.; Beltran, J.G. Phase equilibria, kinetics and morphology of methane hydrate inhibited by antifreeze proteins: Application of a novel 3-in-1 method. J. Chem. Thermodyn. 2018, 117, 155–163. [Google Scholar] [CrossRef]
  27. Sowa, B.; Maeda, N. Statistical Study of the Memory Effect in Model Natural Gas Hydrate Systems. J. Phys. Chem. A 2015, 119, 10784–10790. [Google Scholar] [CrossRef]
  28. Takeya, S.; Hori, A.; Hondoh, T.; Uchida, T. Freezing-Memory Effect of Water on Nucleation of CO2 Hydrate Crystals. J. Phys. Chem. B 2000, 104, 4164–4168. [Google Scholar] [CrossRef]
  29. Buchanan, P.; Soper, A.K.; Westacott, R.E.; Creek, J.L.; Hobson, G.; Koh, C.A. Search for memory effects in methane hydrate: Structure of water before hydrate formation and after hydrate decomposition. J. Chem. Phys. 2005, 123, 164507. [Google Scholar] [CrossRef]
  30. Thompson, H.; Soper, A.K.; Buchanan, P.; Aldiwan, N.; Creek, J.L.; Koh, C.A. Methane hydrate formation and decomposition: Structural studies via neutron diffraction and empirical potential structure refinement. J. Chem. Phys. 2006, 124, 164508–464508. [Google Scholar] [CrossRef]
  31. Esmail, S.; Beltran, J.G. Methane hydrate propagation on surfaces of varying wettability. J. Nat. Gas Sci. Eng. 2016, 35, 1535–1543. [Google Scholar] [CrossRef]
  32. Beltran, J.G.; Servio, P. Morphological Investigations of Methane- Hydrate Films Formed on a Glass Surface. Cryst. Growth Des. 2010, 10, 4339–4347. [Google Scholar] [CrossRef]
  33. Sakemoto, R.; Sakamoto, H.; Shiraiwa, K.; Ohmura, R.; Uchida, T. Clathrate hydrate crystal growth at the seawater/hydrophobic- guest- liquid interface. Cryst. Growth Des. 2009, 10, 1296–1300. [Google Scholar] [CrossRef]
  34. Folas, G.K.; Berg, O.J.; Solbraa, E.; Fredheim, A.O.; Kontogeorgis, A.M.; Michelsen, M.L.; Stenby, E.H. High-pressure vapor–liquid equilibria of systems containing ethylene glycol, water and methane: Experimental measurements and modeling. Fluid Phase Equilib. 2007, 251, 52–58. [Google Scholar] [CrossRef]
  35. Wang, L.; Chen, G.; Han, G.; Guo, X.; Guo, T. Experimental study on the solubility of natural gas components in water with or without hydrate inhibitor. Fluid Phase Equilib. 2003, 1, 143–154. [Google Scholar] [CrossRef]
  36. Kim, Y.S.; Lim, B.D.; Lee, J.E.; Lee, C.S. Solubilities of Carbon Dioxide, Methane, and Ethane in Sodium Chloride Solution Containing Gas Hydrate. J. Chem. Eng. Data 2008, 53, 1351–1354. [Google Scholar] [CrossRef]
  37. Bzdek, B.R.; Power, R.M.; Simpson, S.H.; Reid, J.P.; Royall, C.P. Precise, contactless measurements of the surface tension of picolitre aerosol droplets. Chem. Sci. 2016, 1, 274–285. [Google Scholar] [CrossRef]
  38. Tsierkezos, N.G.; Molinou, I.E. Thermodynamic properties of water+ ethylene glycol at 283.15, 293.15, 303.15, and 313.15 K. J. Chem. Eng. Data 1998, 6, 989–993. [Google Scholar] [CrossRef]
  39. Lee, S.Y.; Kim, H.C.; Lee, J.D. Morphology study of methane–propane clathrate hydrates on the bubble surface in the presence of SDS or PVCap. J. Cryst. Growth 2014, 402, 249–259. [Google Scholar] [CrossRef]
  40. Wu, R.; Kozielski, K.A.; Hartley, P.G.; May, E.F.; Boxall, J.; Maeda, N. Methane–propane mixed gas hydrate film growth on the surface of water and Luvicap EG solutions. Energy Fuels 2013, 27, 2548–2554. [Google Scholar] [CrossRef]
  41. Cha, M.; Shin, K.; Seo, Y.; Shin, J.; Kang, S. Catastrophic growth of gas hydrates in the presence of kinetic hydrate inhibitors. J. Phys. Chem. A 2013, 117, 13988–13995. [Google Scholar] [CrossRef]
  42. Kumar, R.; Lee, J.D.; Song, M.; Englezos, P. Kinetic inhibitor effects on methane/propane clathrate hydrate-crystal growth at the gas/water and water/n-heptane interfaces. J. Cryst. Growth 2008, 310, 1154–1166. [Google Scholar] [CrossRef]
  43. Lee, J.D.; Englezos, P. Unusual kinetic inhibitor effects on gas hydrate formation. Chem. Eng. Sci. 2006, 61, 1368–1376. [Google Scholar] [CrossRef]
  44. Sharifi, H.; Englezos, P. Accelerated Hydrate Crystal Growth in the Presence of Low Dosage Additives Known as Kinetic Hydrate Inhibitors. J. Chem. Eng. Data 2014, 60, 336–342. [Google Scholar] [CrossRef]
  45. Sharifi, H.; Ripmeester, J.; Walker, V.K.; Englezos, P. Kinetic inhibition of natural gas hydrates in saline solutions and heptane. Fuel 2014, 117, 109–117. [Google Scholar] [CrossRef]
  46. Sharifi, H.; Walker, V.K.; Ripmeester, J.; Englezos, P. Insights into the behavior of biological clathrate hydrate inhibitors in aqueous saline solutions. Cryst. Growth Des. 2014, 14, 2923–2930. [Google Scholar] [CrossRef]
  47. Sharifi, H.; Ripmeester, J.; Englezos, P. Recalcitrance of gas hydrate crystals formed in the presence of kinetic hydrate inhibitors. J. Nat. Gas Sci. Eng. 2016, 35, 1573–1578. [Google Scholar] [CrossRef] [Green Version]
  48. Daraboina, N.; Ripmeester, J.A.; Walker, V.K.; Englezos, P. Natural gas hydrate formation and decomposition in the presence of kinetic inhibitors. 1. High pressure calorimetry. Energy Fuels 2011, 10, 4392–4397. [Google Scholar] [CrossRef]
  49. Daraboina, N.; Ripmeester, J.A.; Walker, V.K.; Englezos, P. Natural gas hydrate formation and decomposition in the presence of kinetic inhibitors. 3. Structural and compositional changes. Energy Fuels 2011, 10, 4398–4404. [Google Scholar] [CrossRef]
  50. Makogon, Y.F.; Makogon, T.Y.; Holditch, S.A. Kinetics and mechanisms of gas hydrate formation and dissociation with inhibitors. Ann. N. Y. Acad. Sci. 2000, 912, 777–796. [Google Scholar] [CrossRef]
  51. Sloan, E.D. Fundamental principles and applications of natural gas hydrates. Nature 2003, 426, 353–363. [Google Scholar] [CrossRef]
  52. Mohammadi, A.H.; Richon, D. Gas hydrate phase equilibrium in the presence of ethylene glycol or methanol aqueous solution. Ind. Eng. Chem. Res. 2010, 49, 8865–8869. [Google Scholar] [CrossRef]
  53. Robinson, D.B. Hydrate Formation and Inhibition in Gas or Gas Condensate Streams. Can. Pet. Technol. 1986, 25. [Google Scholar] [CrossRef]
  54. Cha, M.; Hu, Y.; Sum, A.K. Methane hydrate phase equilibria for systems containing NaCl, KCl, and NH4Cl. Fluid Phase Equilib. 2016, 413, 2–9. [Google Scholar] [CrossRef]
  55. Anderson, R.; Mozaffar, H.; Tohidi, B.; Glenat, P. Applicatio of a crystal growth inhibition based KHI evaluation method to commercial formulation assessment. In Proceedings of the 7th International Conference on Gas Hydrates, Edinburgh, Scotland, 17–21 July 2011. [Google Scholar]
  56. Kishimoto, M.; Iijima, S.; Ohmura, R. Crystal growth of clathrate hydrate at the interface between seawater and hydrophobic-guest liquid: Effect of elevated salt concentration. Ind. Eng. Chem. Res. 2012, 51, 5224–5229. [Google Scholar] [CrossRef]
  57. Peng, B.; Sun, C.; Chen, G.; Yang, L.; Zhou, W.; Pang, W. Hydrate film growth at the interface between gaseous CO2 and sodium chloride solution. Sci. China Chem. 2009, 52, 676–682. [Google Scholar] [CrossRef]
  58. Uchida, T.; Ikeda, I.Y.; Takeya, S.; Ebinuma, T.; Nagao, J.; Narita, H. CO2 hydrate film formation at the boundary between CO2 and water: Effects of temperature, pressure and additives on the formation rate. J. Cryst. Growth 2002, 237, 383–387. [Google Scholar] [CrossRef]
  59. Gordienko, R.; Ohno, H.; Singh, V.K.; Jia, Z.; Ripmeester, J.A.; Walker, V.K. Towards a green hydrate inhibitor: Imaging antifreeze proteins on clathrates. PLoS ONE 2010, 5, e8953. [Google Scholar] [CrossRef]
  60. Jensen, L.; Ramlov, H.; Thomsen, K.; Von Solms, N. Inhibition of methane hydrate formation by ice-structuring proteins. Ind. Eng. Chem. Res. 2010, 49, 1486–1492. [Google Scholar] [CrossRef]
  61. Kitamura, M.; Mori, Y.H. Clathrate-hydrate film growth along water/methane phase boundaries-an observational study. Cryst. Res. Technol. 2013, 48, 511–519. [Google Scholar] [CrossRef]
  62. Daraboina, N.; Moudrakovski, I.L.; Ripmeester, J.A.; Walker, V.K.; Englezos, P. Assessing the performance of commercial and biological gas hydrate inhibitors using nuclear magnetic resonance microscopy and a stirred autoclave. Fuel 2013, 105, 630–635. [Google Scholar] [CrossRef]
  63. Ivall, J.; Pasieka, J.; Posteraro, D.; Servio, P. Profiling the Concentration of the Kinetic Inhibitor Polyvinylpyrrolidone throughout the Methane Hydrate Formation Process. Energy Fuels 2015, 29, 2329–2335. [Google Scholar] [CrossRef]
  64. Mori, Y.; Mochizuki, T. Modeling of Mass Transport across a Hydrate Layer Intervening between Liquid Water and ‘Guest’ Fluid Phases. In Proceedings of the 2nd International Symposium on Gas Hydrates, Daejeon, Korea, 1–2 November 1996; pp. 267–274. [Google Scholar]
  65. Mori, Y.H.; Mochizuki, T. Mass transport across clathrate hydrate films a capillary permeation model. Chem. Eng. Sci. 1997, 52, 3613–3616. [Google Scholar] [CrossRef]
  66. Davies, S.R.; Sloan, E.D.; Sum, A.K.; Koh, C.A. In situ studies of the mass transfer mechanism across a methane hydrate film using high-resolution confocal Raman spectroscopy. J. Phys. Chem. C 2009, 114, 1173–1180. [Google Scholar] [CrossRef]
  67. Austvik, T.; Li, X.; Gjertsen, L.H. Hydrate plug properties: Formation and removal of plugs. Ann. N. Y. Acad. Sci. 2000, 912, 294–303. [Google Scholar] [CrossRef]
Figure 1. Pre-treatment of the water droplet. (a) Ice formation at constant pressure. (b) Pressure is increased to the experimental pressure. (c) Hydrate formation from ice. (d) Hydrate dissociation.
Energies 12 02921 g001
Figure 2. Temperature profiles used in this work: (a) Uniform surface temperature below hydrate-liquid-vapor equilibrium temperature. (b) Constant temperature gradient, formation. (c) Constant temperature gradient, dissociation. (d) Uniform surface temperature above hydrate-liquid-vapor equilibrium temperature.
Energies 12 02921 g002
Figure 3. Methane hydrate formation and growth on an aqueous MEG solution droplet subject to a temperature gradient. The temperature gradient increased from T L = 275.0 K (left) to T H = 279.0 K (right). w EG = 10 % , p = 5.99 MPa, T HLV = 279.7 K. (a) Aqueous MEG solution droplet before hydrate formation. (b) Initial growth points moving to the center of the droplet and continued growth of hydrate film. (c) Droplet is completely covered by hydrate. The red arrow points to the initial halo growth. (d) The dotted line marks the original droplet boundary. Hydrate halo propagates from the original water boundary toward both the high driving force end of the slide and toward the low driving force end.
Energies 12 02921 g003
Figure 4. Detail of methane hydrate morphology on an aqueous MEG solution droplet subject to a temperature gradient. w MEG = 10 % , p = 5.99 MPa, T L = 275.0 K, T H = 279.0 K, and T HLV = 279.7 K. (a) Large faceted crystals at the droplet boundary. (b) Small faceted crystals inside the droplet. (c) Smaller crystals.
Energies 12 02921 g004
Figure 5. Replicates of methane hydrate formation from an aqueous MEG solution droplet subject to a temperature gradient. w MEG = 10 % , p = 5.99 MPa, T C = 275.0 K, T H = 279.0 K, and T HLV = 279.7 K. Each panel shows a different experiment.
Energies 12 02921 g005
Figure 6. Methane hydrate formed on an aqueous MEG solution droplet at uniform surface temperature. w MEG = 10 % , p = 5.99 MPa, T = 276.8 K ( Δ T sub = 2.9 K). (a) Halo propagation from the droplet boundary. (b) Crystal growth inside the droplet boundary, but far from initial growth points. (c) Individual crystal geometry grown from initial growth points.
Energies 12 02921 g006
Figure 7. Dissociation sequence of a methane hydrate formed from an aqueous MEG solution, with applied temperature gradient. w MEG = 10 % , p = 5.99 MPa, T HLV = 279.7 K. (a) Before hydrate dissociation. (b,c) Irregular pattern of hydrate dissociation.
Energies 12 02921 g007
Figure 8. Dissociation sequence of a methane hydrate formed from an aqueous MEG solution, with uniform surface temperature. w MEG = 10 % , p = 6.53 MPa, T HLV = 280.5 K. (a) Before hydrate dissociation. (b) Hydrate started to dissociate at the periphery of the droplet. (c) Continued dissociation towards the center of the droplet. (d) Complete hydrate dissociation.
Energies 12 02921 g008
Figure 9. Detail of methane hydrate morphology on an aqueous NaCl solution droplet, subject to a temperature gradient. w NaCl = 5.44 % , p = 5.39 MPa, T L = 274.4 K, T H = 278.4 K, and T HLV = 277.6 K. (a) Big faceted crystals. (b) Granular crystals. (c) Smaller granular crystals.
Energies 12 02921 g009
Figure 10. Detail of methane hydrate morphology from an aqueous PVP solution droplet with an applied temperature gradient. w PVP = 0.1 % , p = 6.13 MPa, T L = 273.7 K, T H = 277.7 K, and T HLV = 281.4 K. (a,b) Wrinkled hydrate film. (c) Boundary between the aqueous solution droplet and the sapphire substrate.
Energies 12 02921 g010
Figure 11. Methane hydrate formed from various aqueous systems subject to a temperature gradient (a) Water + Methane system T L = 273.7 K (left) to T H = 277.7 K (right), p = 4.00 MPa (b) Water + Methane + MEG system, T L = 275.0 K (left) to T H = 279.0 K (right). w MEG = 10 % , p = 5.99 MPa (c) Water + Methane + NaCl system, T L = 274.4 K (left) to T H = 278.4 K (right). w NaCl = 5.44 % , p = 5.39 MPa (d) Water + Methane + PVP system, T L = 273.7 K (left) to T H = 277.7 K (right). w PVP = 0.1 % , p = 6.13 MPa.
Energies 12 02921 g011
Figure 12. Methane hydrate formed from various aqueous systems subject to uniform temperature (a) Water + Methane system p = 4.00 MPa, T = 275.5 K (b) Water + Methane + MEG system, w MEG = 10 % , p = 5.99 MPa, T = 276.8 K (c) Water + Methane + NaCl system, w NaCl = 5.44 % , p = 6.66 MPa, T = 277.1 K (d) Water + Methane + PVP system, w PVP = 0.1 % , p = 6.13 MPa, T = 275.2 K.
Energies 12 02921 g012
Figure 13. Hydrate-liquid-vapor equilibrium for the system water + CH 4 , water + PVP ( w PVP = 0.1 % ) + CH 4 , water + NaCl ( w NaCl = 5.44 % ) + CH 4 , and water + MEG ( w MEG = 10 % ) + CH 4 . Error bars correspond to standard uncertainty. The black curve is a best fit based on literature data (as compiled in ref [11]) for uninhibited methane hydrate. The gray curves show a 95% prediction interval based on literature data for uninhibited methane hydrate.
Energies 12 02921 g013
Figure 14. Hydrate-liquid-vapor equilibrium for the system water + MEG ( w MEG = 10%) + CH 4 . Error bars correspond to standard uncertainty. Literature data are also shown [52,53]. The curves show phase equilibria predictions using CSMGem [51].
Energies 12 02921 g014
Figure 15. Hydrate-liquid-vapor equilibria for the system water + NaCl ( w NaCl = 5.44 % ) + CH 4 . Error bars correspond to standard uncertainty. Literature data are also shown [54]. The curves show phase equilibria predictions using CSMGem [51].
Energies 12 02921 g015
Figure 16. Film velocity as a function of supercooling for methane hydrate formed on quiescent water droplets with and without inhibitors. Data for hydrates formed under uniform constant temperature and a constant temperature gradient are shown. Error bars correspond to one standard uncertainty.
Energies 12 02921 g016
Figure 17. Methane hydrate film velocity versus time for the system water + MEG ( w MEG = 10 % ) + CH 4 at uniform surface temperature. Continuous lines are drawn to increase the readability of the graph, but do not represent a modeling effort.
Energies 12 02921 g017
Table 1. Reagents used in this study. Resistivity was used as an indicator of water purity: at the source, it was measured to be 18 M Ω · cm .
Chemical NameSourcePurityPurity Units
MEGFisher Scientific, Canada≥99.80%Mass Fraction
NaClCaledon Laboratory Ltd.≥99.00%Mass Fraction
PVPSigma-Aldrich Canada Co.N/AN/A
CH4Air Liquide, QC Canada99.99%Mass Fraction
N2Air Liquide, QC Canada99.99%Mass fraction
Distilled WaterIn-houseSee captionSee caption
Table 2. HLV equilibrium temperature T and pressure p, for the system methane + water in the presence of different inhibitors. Standard uncertainties for temperature are shown in the table. Standard uncertainty for pressure was u p = 0.005 MPa. Average values are shown for equilibrium temperatures and pressures. At least 3 replicates were done for each condition of every system.
SystemT/K u T HLV /Kp/ MPa
Water277.480.144.00
Water281.310.086.01
PVP281.380.086.15
PVP281.830.066.28
PVP281.820.106.25
NaCl276.720.124.84
NaCl277.610.115.39
NaCl279.230.406.66
MEG279.650.085.99
MEG280.480.226.53
MEG275.720.064.00

