Article

Melting Behavior of Phase Change Material in Honeycomb Structures with Different Geometrical Cores

1
Department of Mechanics, Huazhong University of Science and Technology, Wuhan 430074, China
2
Hubei Key Laboratory of Engineering Structural Analysis and Safety Assessment, Luoyu Road 1037, Wuhan 430074, China
3
School of Naval Architecture and Ocean Engineering, Huazhong University of Science and Technology, Wuhan 430074, China
*
Author to whom correspondence should be addressed.
Energies 2019, 12(15), 2920; https://doi.org/10.3390/en12152920
Submission received: 26 June 2019 / Revised: 25 July 2019 / Accepted: 25 July 2019 / Published: 29 July 2019
(This article belongs to the Section J: Thermal Management)

Abstract

:
Honeycomb structure with phase change material (PCM) is frequently used in passive thermal management devices. The geometrical shape of the honeycomb core greatly influences the melting rate of the PCM. This paper investigates the melting rates of PCM in honeycomb cores of non-hexagonal cells in comparison with that of hexagonal cell in three Rayleigh numbers. The objective is to find the optimal shape in order to reduce the melting time of the PCM. The constrained melting behaviors of PCM in triangular, quadrilateral, hexagonal, and circular honeycomb cores are numerically studied. The enthalpy porosity technique and finite volume method are used in this paper. The instantaneous liquid fraction and energy absorption of PCM in different honeycomb cores are discussed in detail. The influences of the placed orientation and aspect ratio of different cores on melting rates of PCM are considered. Results show that the melting rate of PCM in a rectangular core is always higher than the hexagonal core for the given aspect ratio and Rayleigh number. The geometrical factor (GF), which indicates the cross-sectional area per unit perimeter, is found to be an important index on the melting rate. At a small Rayleigh number, it takes a longer melting time of the PCM for the core with a larger GF. As the Rayleigh number is large, the melting time of the PCM is affected by both the GF and the orientation of the cores.

1. Introduction

The thermal management system can be classified by the passive and active thermal control system. Compared to the active thermal control system, the passive one is more widely applied due to its advantages of low cost and reliable operation. A phase change material (PCM) device, as one potential passive thermal control system, has attracted extensive attention. During the last two decades, many researchers have used the passive thermal control of PCM in building constructions. Arnault et al. [1] developed a numerical model to study the thermal behaviors of the building’s floor with or without PCM, which was subjected to solar irradiation and convection. Their results showed that the thermal behaviors of a thin PCM layer could outperform a massive concrete floor. Considering the advantage of PCM applied in buildings, Jiang et al. [2] also presented a simple analytical method to get the optimal phase change temperature and latent heat of the interior PCM for a passive solar room. Their method could guide the design and make the choice for the interior PCM in a passive solar room. In order to comprehensively understand the relationship between the energy conservation potential and economic feasibility of latent heat energy storage systems, Sun et al. [3] developed a theoretical heat transfer model for PCM boards in building enclosures. Their model could provide the optimum phase transition temperatures of the PCMs for applications of building in the five climatic zones. Coincidentally, Ye et al. [4] also developed a model to evaluate the thermal performance of a building material or component from an energy consumption standpoint. However, different from Sun et al.’s work, Ye et al. used the energy saving equivalent (ESE) and energy saving index (ESI) to evaluate the performance of a component or material.
Mazzeo et al. [5,6,7] presented a lot of valuable studies on innovative building walls containing a PCM layer. They proposed a set of parameters to study the effective dynamic thermal behavior of the PCM layer. Accordingly, some calculation correlations were obtained from these parameters [5]. They also developed a predictive mathematical model to analyze the thermal performance of PCM layers. An experiment was performed to validate the model [6]. Subsequently, they presented a numerical model to study the thermal behavior of PCM layers with different operating conditions on the external walls of air-conditioned buildings [7]. In addition to those predictable models to study the energy-saving effects of PCM as the passive thermal control applied in buildings, many other studies have investigated the thermal behavior of the PCM layer used for building. For example, Erlbeck et al. [8] experimentally investigated the thermal behavior of encapsulated PCM with different shapes embedded in a concrete block. Recently, Dardir et al. [9] comprehensively reviewed the progress on the application of PCM as passive thermal control devices in the air heat exchangers of free cooling buildings. The prediction model or the performance of encapsulated PCM and the integration of PCM into building structures as a promising application has been widely studied as reported in the review.
As the material of the passive thermal control system in buildings, PCM can absorb or release a large amount of latent heat during its phase change processes and maintain a relatively narrow temperature range at the same time. However, the low thermal conductivity of PCM is the main disadvantage of its working performances. To overcome its disadvantage, many enhancement techniques have been proposed, such as using porous media/foam metals [10,11,12,13], adding nanoparticles [14,15,16], and expanding the heat transfer area by embedding fins [17,18,19,20,21] or honeycomb structures [22,23,24]. Compared to the former two methods, it is more suitable to expand the heat transfer area for latent thermal energy storage systems due to its low cost and convenience. According to the review of Liu et al. [25], the external fins and honeycomb structure could be an effective way of enhancing the thermal performance of PCM macro-encapsulation in building envelopes. However, the external fins might lead to an increase in the spacing between encapsulation containers. The honeycomb structure as the internal fins can not only enhance the heat transfer but also ensure the compactness of space in the structure.
In recent years, a honeycomb structure filled with PCM as a component of a passive thermal control system have been taken into account by many researchers due to its high porosities and high latent heat. In addition, Xie et al. [26] also found that the mechanical properties of honeycomb filled with PCM could provide enhanced structural characteristics that were lacking in conventional shape-stabilized PCMs. Their experiment showed that not only could the temperature variation be controlled in a small range but also the stress tolerance limit was promoted by using the honeycomb structure. Similar work had been performed by Li et al. [27]. They experimentally investigated a composite PCM immersed in an aluminum honeycomb component of a battery thermal management system. Their results showed that the component exhibited excellent mechanical properties and high heat-dissipation efficiency. Hence, honeycomb structures with PCM are widely studied in passive thermal management devices. For example, Lai et al. [28] indicated that using an aluminum honeycomb for structural support can enhance the thermal conductivity of a building wallboard and rapidly transfer heat into the PCM. Abuşka et al. [29] experimentally revealed that honeycomb as the internal fin structure can significantly reduce the charge–discharge time of a solar air heater. It is worth noting that the cross-section of the honeycomb core is a hexagonal cell in most studies. In addition, there are several other honeycomb cores with various geometrical shapes, such as diamonds, rectangles, bubbles, and circles [27]. In fact, according to the studies of Erlbeck et al. [8] and Liu et al. [25], PCM in encapsulated shells with different geometrical shapes could acquire different melting rates. Raj et al. [30] indicated that the melting rate of PCM in metallic cylinder encapsulates was different from PCM in rectangular encapsulates. Dhaidan et al. [31] also noted that the shape of the enclosure containing PCM had an important effect on the dynamic behavior of the melting process. However, the differences in the melting rates of PCM in different honeycomb cores and whether the hexagonal core is the best choice have not yet been studied formally.
Therefore, our objectives in this paper are: (i) To study the melting process of PCM in triangular, rectangular, trapezoidal, hexagonal, and circular cells and compare the melting rates of PCM in non-hexagonal honeycomb cores to that in hexagonal cores; (ii) to study the influence of the aspect ratio and orientation for the melting process of PCM in different honeycomb cores; and (iii) to find the honeycomb core which has the highest melting rate of PCM in these cells. The above objectives are discussed in the range of Rayleigh number from 3.095 × 10⁵ to 3.87 × 10⁷. The Rayleigh number measures the importance of the buoyancy of the fluid in the natural heat transfer system. Below a critical value, the heat transfer in a fluid is solely dependent on conduction. On the contrary, an increase of the Rayleigh number could dramatically enhance heat transfer by convection as it is larger than a threshold. Hence, the melting of PCM at three different Rayleigh numbers was studied in this paper to extract the universality of the results.
The organization of this paper is as follows. In Section 2, the problem statement and numerical tool used in this paper are presented. In Section 3, we compare the melting rates, energy absorption, and time-saving ratios of PCM in non-hexagonal cores to the hexagonal core with different aspect ratios and orientations in three different Rayleigh numbers. At last, a concluding remark is stated in Section 4.

2. Mathematical Formulation and Numerical Validation

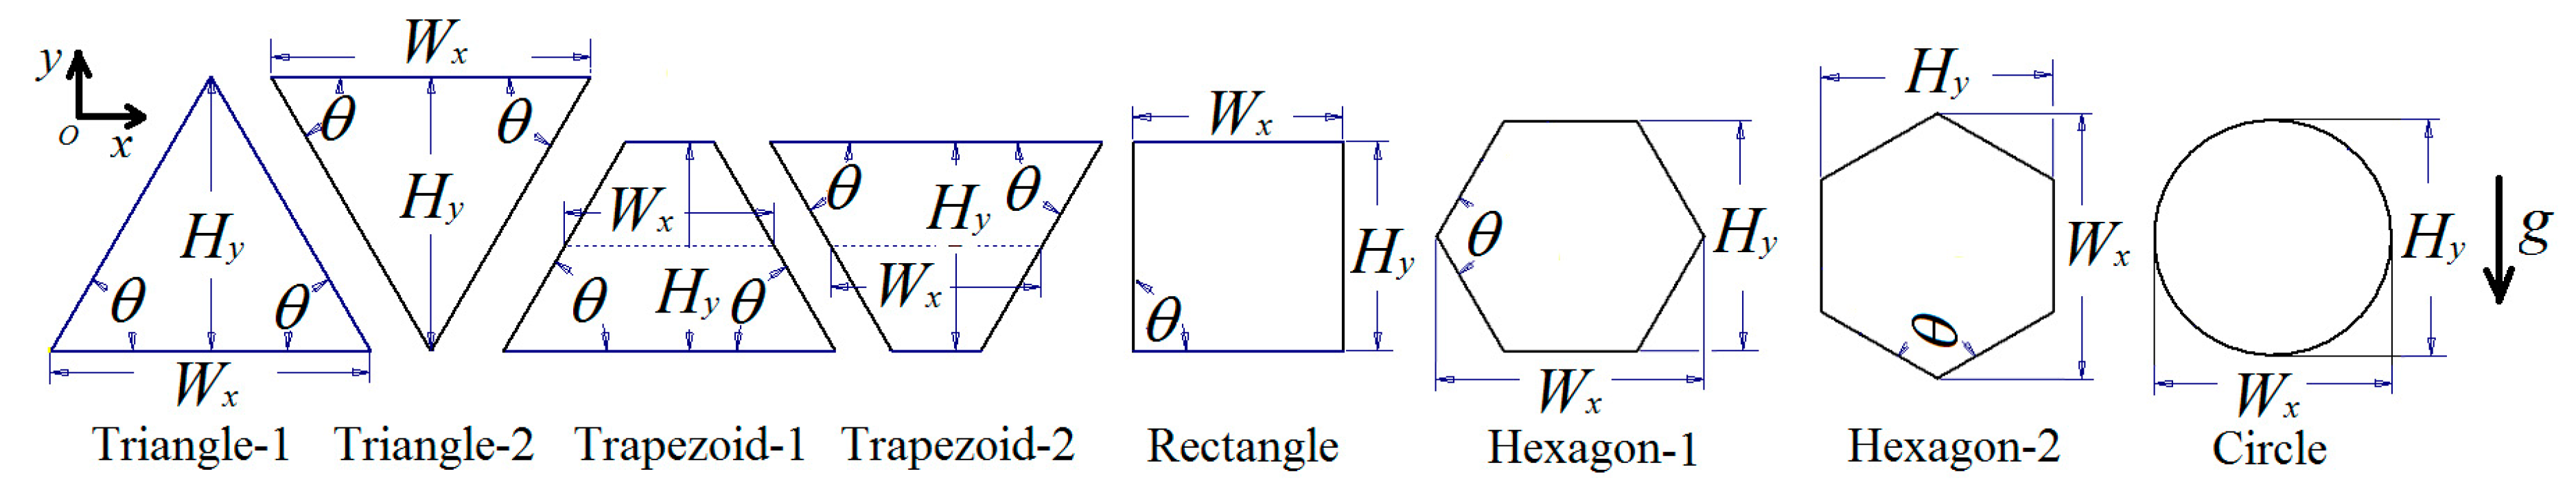
2.1. Problem Statement

The PCM used in this study was paraffin since it is generally used as a carrier of solid–liquid phase change devices due to its low cost, stable chemical properties and the broad range of melting temperatures [32,33,34]. The constrained melting of paraffin in honeycomb cores was investigated in this study instead of unconstrained melting because the unconstrained melting is mainly influenced by thermal conduction rather than natural convection [35]. In this paper, we considered the influence of both natural convection and conduction for the melting process of paraffin.
In this study, five basic shapes, including triangular, trapezoidal, rectangular, hexagonal, and circular honeycomb cells, were studied (as shown in Figure 1). The cross-sectional areas of these cells are the same, which suggests the thermal storage capacity is fixed. Three different sectional areas (100, 625, and 2500 mm2 per cell) were simulated to consider the influence of the Rayleigh number. In order to simplify the problem, numerical simulations of the cells of honeycomb core were performed in two dimensions. The two-dimensional cell (in the xy-plane and z0 = (z1 + z2)/2) is a simplification for the long-enough cell in the z-direction so that the boundaries of the hot front wall (in the xy-plane and z = z1) and back wall (in the xy-plane and z = z2) have little impact for the melting process of PCM. Both ends of the honeycomb structure were directly contacted to the hot aluminous front wall and aluminous back wall. The material of the honeycomb structure was aluminum. The thermal conductivity of aluminum is much larger than paraffin. Hence, all boundaries of every cell numerically simulated were set isothermally (Tw). The width (Wx) and the height (Hy) or the aspect ratio (AR) of these cells are crucial to the melting rate of the PCM inside. At the beginning (t = 0), the temperature of PCM is supposed to be ambient temperature, T0, which was assumed to be less than the melting temperature of PCM (T0 < Tm). Consequently, PCM was solid inside the cells at the beginning. To study the geometrical influence on the melting behavior in these cells, we studied the melting of PCM in a different orientation (triangle-1 vs. triangle-2, trapezoid-1 vs. trapezoid-2, hexagon-1 vs. hexagon-2, as shown in Figure 1). The direction of gravitational acceleration is always supposed to the opposite direction of the y-axis and its value was 9.81 m/s2.
Figure 1 shows the five shapes of honeycomb cores that were numerically simulated in this study. The section of triangle-2 is the inversion of triangle-1, hence both of them have the same size, as well as the trapezoidal cells. The section of hexagon-2 is hexagon-1 rotating 90° to the left. The characteristic angles for the five cells are listed in Table 1. The definition of the aspect ratio for these five cells is the height to the width (AR = Hy/Wx). For the trapezoidal, rectangular, and hexagonal cells, the angles (θ) are fixed when the sizes of the height (Hy) or width (Wx) are increasing or decreasing. In this study, the angles of trapezoidal, rectangular, and hexagonal cells were 60°, 90°, and 120°, respectively.

2.2. Mathematical Formulation

The enthalpy porosity technique [36] was used to describe the physical model. The governing equations, including the continuity and momentum equations used in this study, are presented as follows:
ρ t + ( ρ u ) x + ( ρ v ) y = 0 ,
( ρ u ) t + ( ρ u u ) x + ( ρ u v ) y = p x + μ 2 u x 2 + μ 2 u y 2 + S u ,
( ρ v ) t + ( ρ u v ) x + ( ρ v v ) y = p y + μ 2 v x 2 + μ 2 v y 2 + ρ g + S v .
In Equation (3), the density in the buoyancy force term conforms to the Boussinesq approximation, which can be considered to be a function of the temperature. The parameter, S, in Equations (2) and (3) is the porosity function defined by Brent et al. [36]. The terms were added to the momentum equations due to the effect of phase change on convection:
S = C ( 1 γ ) 2 γ 3 + ε ,
where C is the mushy zone constant. In the very limited mushy zone, the mushy zone constant is important to a specific PCM, which is desirably in the range of 105 to 108 in most studies on the phase change of PCM [37]. It was set to 105 in this paper, which is consistent with the experimental data of Wu et al. [38]; ε is a small number used to avoid division by zero, whose value is 0.001; and γ is the liquid fraction, which is expressed as follows:
γ = { 0 i f   T T s T T s T l T s i f   T l < T < T s 1 i f   T T l .
The energy equation is expressed as follows:
( ρ c p T ) t + ( ρ u c p T ) x + ( ρ v c p T ) y = x ( k T x ) + y ( k T y ) .
The following assumptions were made in this study: The natural convection is taken into account with the Boussinesq approximation; the liquid is Newtonian and incompressible; the PCM properties are constant and it is a pure material; and the flow is laminar.
The above problem allowed us to define the non-dimensional parameters related to the present study. The equivalent Rayleigh number (Ra), Prandtl number (Pr), could be related. They are well-defined as the following forms [39]:
R a = g ρ β H 3 ( T w T s ) α μ ,
Pr = μ ρ α ,
where α = k c p ρ is the thermal diffusivity coefficient; H = A is the equivalent height; and A is the cross-sectional area. In this study, in order to consider the influence of the size of the honeycomb core on the melting rate, three different cross-sectional area settings were considered. The corresponding Rayleigh numbers are 3.095 × 10⁵, 4.83 × 10⁶, and Ra = 3.87 × 10⁷, respectively. The definition of the effective Rayleigh number is the real height of the cell. The Prandtl number was set to 102.

2.3. Initial and Boundary Conditions

To make the above partial differential system well-posed, the initial and boundary conditions should be well-defined.
Initial conditions:
t = 0 ,   T ( 0 ) = T 0 = 286.5 K ,   u ( 0 ) = v ( 0 ) = 0 .
Isothermal boundary conditions at all the walls of cells:
T ( t ) = T w = 353.15 K .

2.4. Numerical Method

The finite volume method (FVM) was used to solve the above governing equations by the commercial CFD package, ANSYS Fluent 17.1. The discrete form of above conservational equations was solved by the SIMPLE (Semi-Implicit Method for Pressure-Linked Equations) algorithm in order to couple the velocity and pressure field. These methods are well documented in textbooks on computational fluid dynamics [40].
In this work, the convective terms of momentum and energy equations were discretized by the second-order upwind scheme [40]. The under-relaxation factors for pressure, density, and momentum are 0.3, 1.0, and 0.2, respectively. The convergence of the solution was checked at each time step with the criterion that the scaled residuals were less than 10−3 for the continuity equation, 10−4 for the momentum equation, and 10−8 for the energy equation.

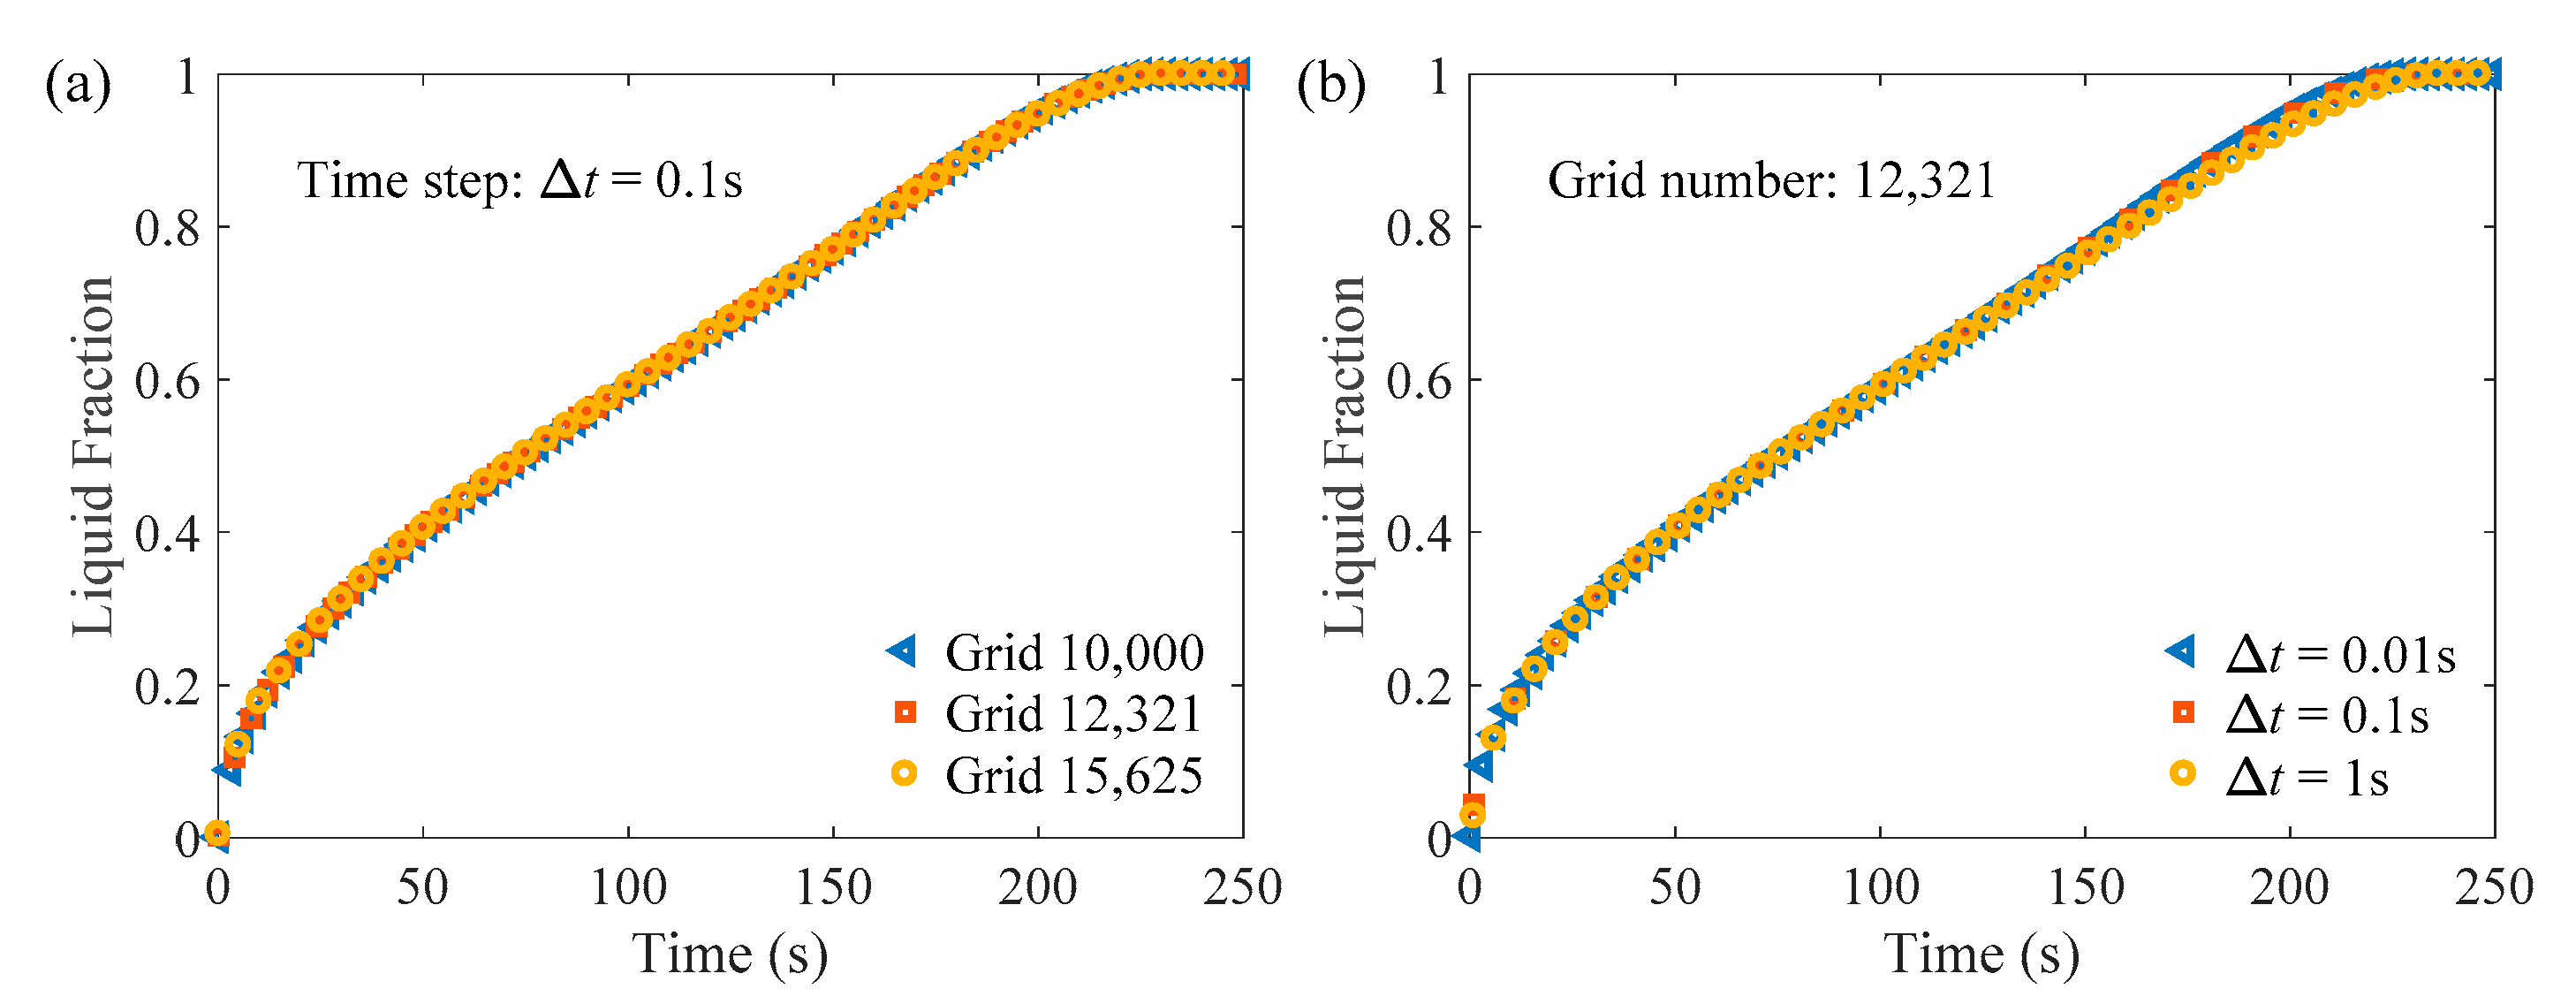
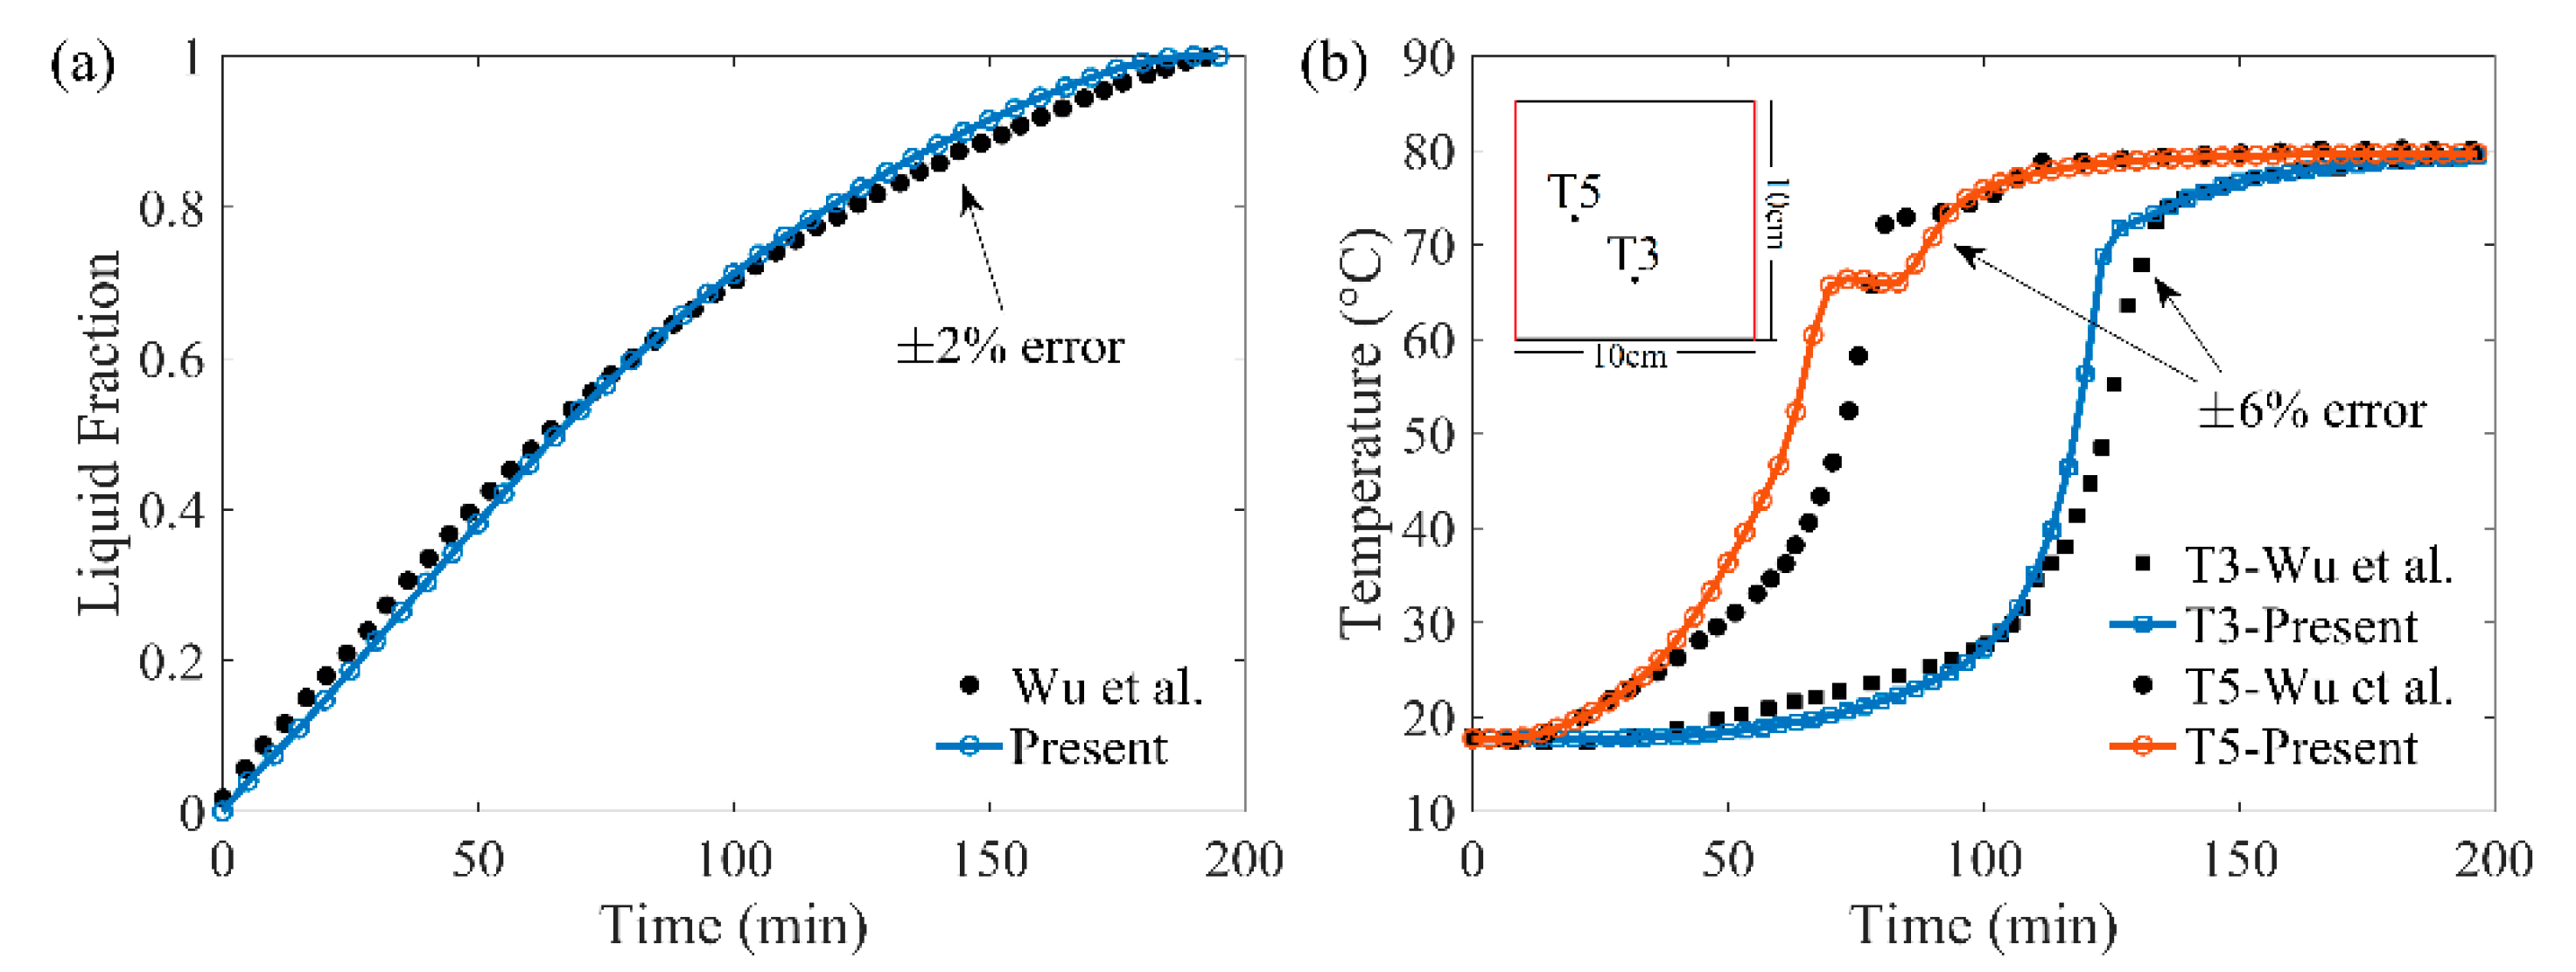
2.5. Numerical Verification and Validation

Figure 2 shows the grid and time-step independence validation of a square enclosure with a size of 10 × 10 mm2. The grid numbers, including 10,000, 12,321, and 15,625 cells, were tested to check the grid independence. The time steps, including 0.01, 0.1, and 1 s, were also tested. In Figure 2, it can be observed that further refinement in the grid size and time step did not apparently change the solution. The grid number of 12,321 and the time step of 0.1 s can satisfy the calculation accuracy.
The PCM used for the simulations in this paper was paraffin [38]. The properties of paraffin are shown in Table 2.
Figure 3 shows the present numerical results compared with the numerical and experimental data reported by Wu et al. [38], in which the liquid fraction was the numerical data and the temperature was the experimental data in [38]. The paraffin was in the cavity (10 × 10cm2), and the initial temperature of this system was 290.85 K. The left and right walls were 353 K. Both the top and bottom walls were thermally insulated. In Figure 3b, it can be seen that the biggest differences were observed at the temperature profile of T5 from 50 to 70 min. In Figure 3a, the slope of the liquid fraction profile before 50 min is approximately linear because thermal conduction is dominant. After 50 min, as more solid PCM gradually melts into liquid, the differences as shown in Figure 3b could come from the difference in the thermal conductivity of paraffin between the simulation and experiment since it could be slightly changed as the variation of temperature during the experiment. However, the thermal conductivity was considered as the constant in this study since the variation of thermal conductivity with temperature was not recorded in [38]. The errors of temperature profiles near the steady-state were less than ±6%. In general, the validation agrees with the experimental measurements, and the present numerical results are reliable.

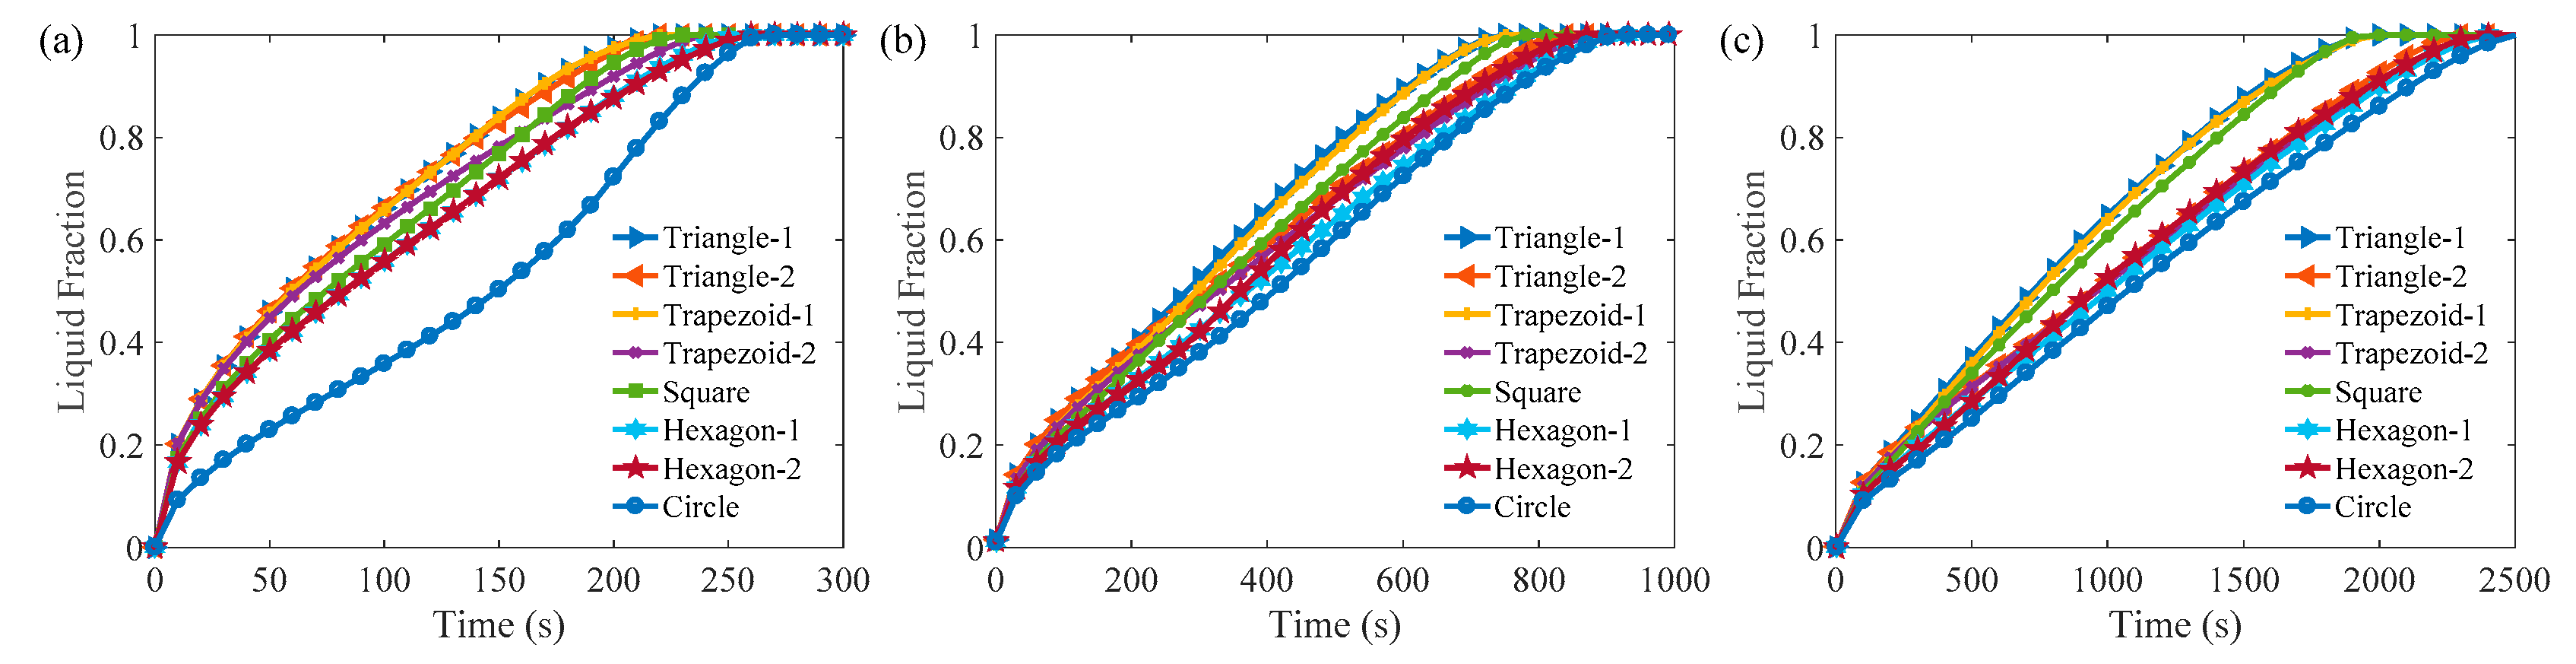
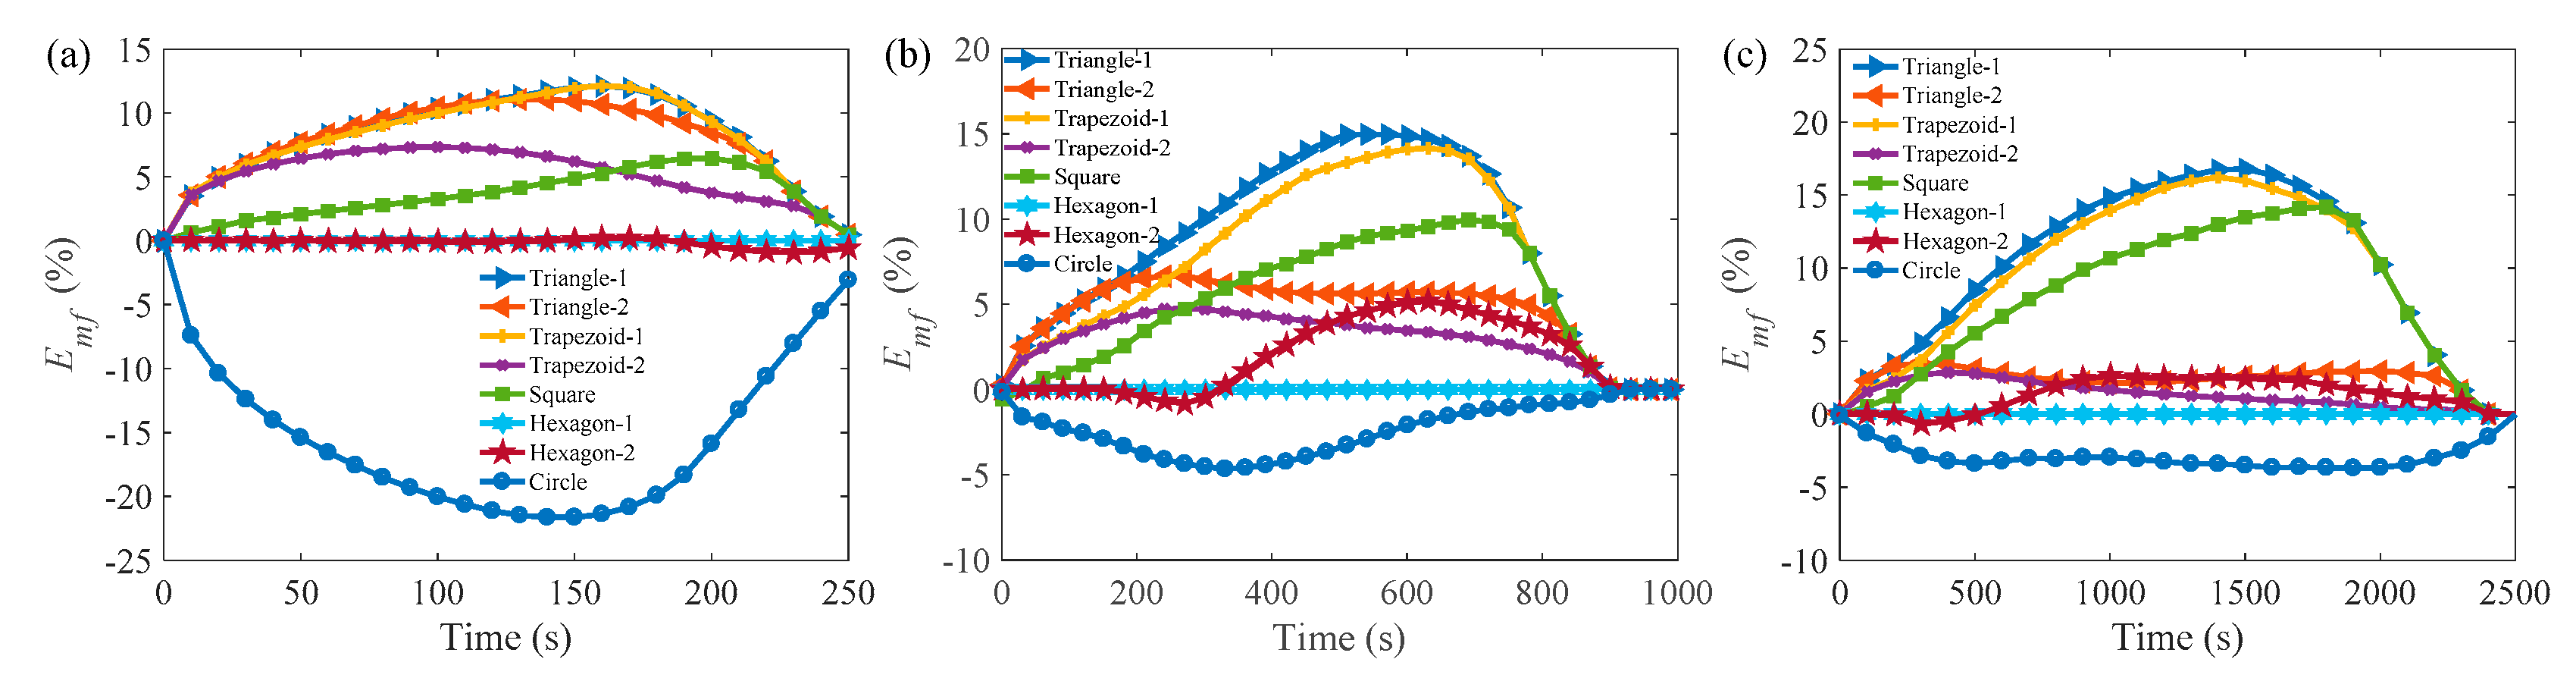
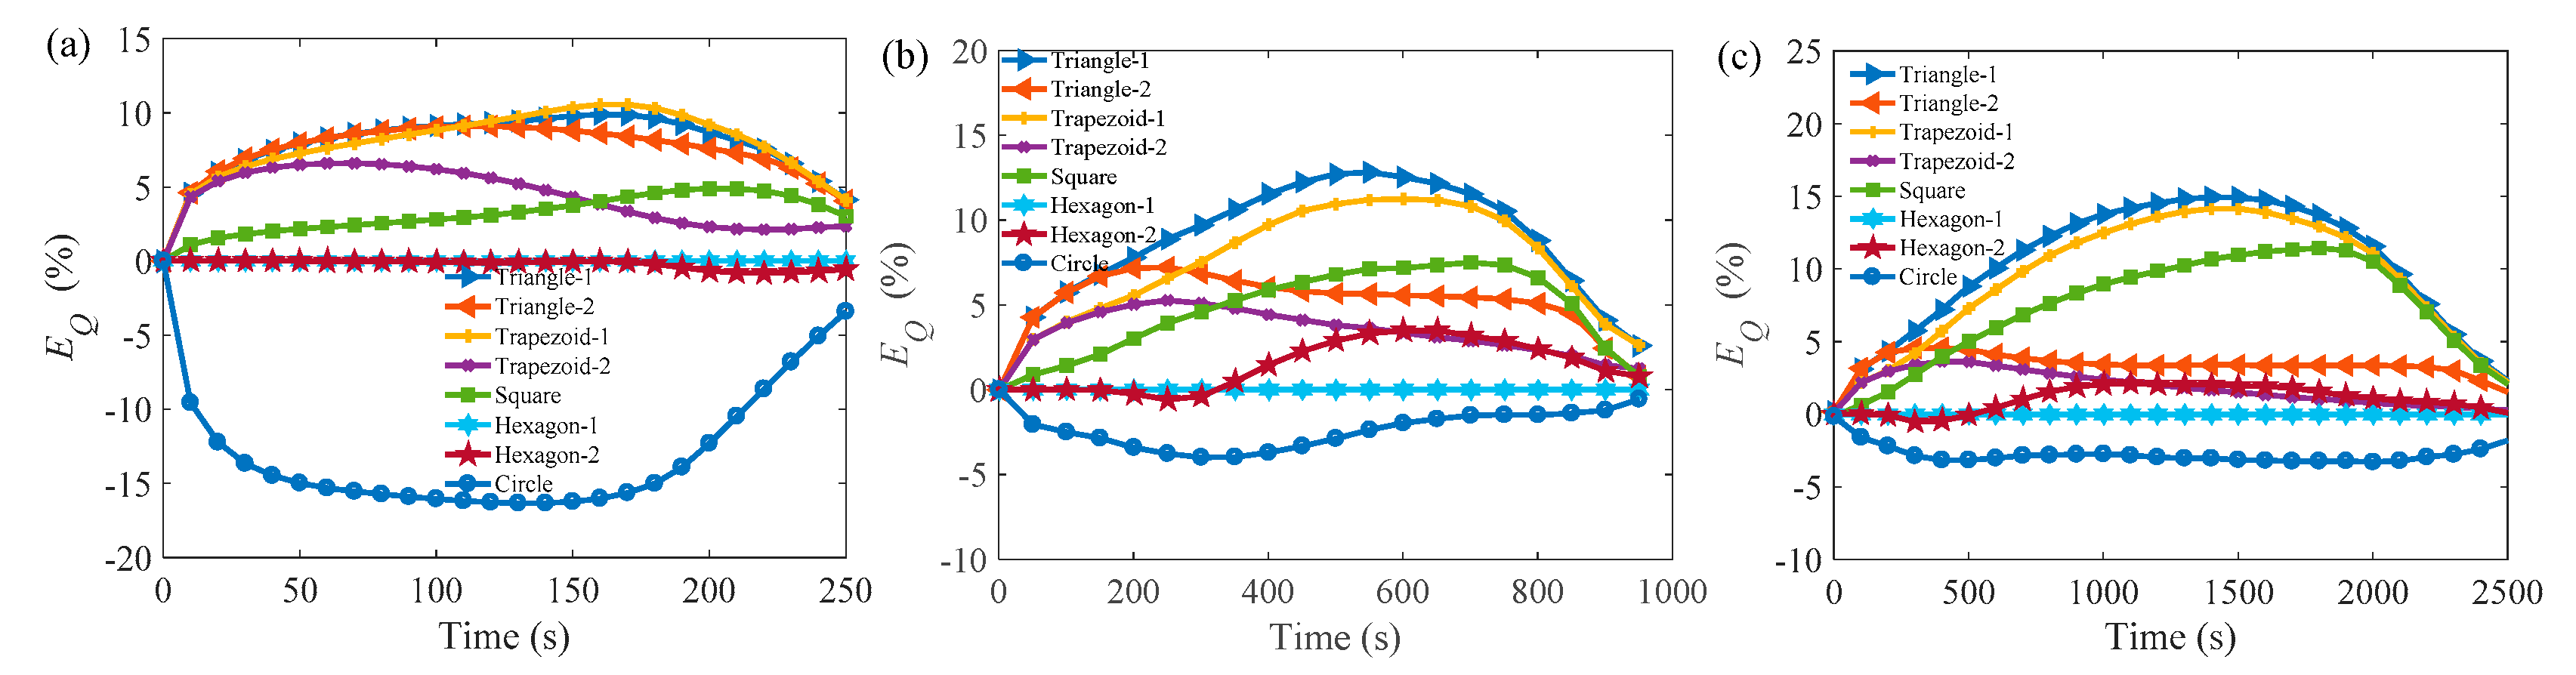
3. Results and Discussion

Figure 4a illustrates the two-dimensional sections of compositional triangular, trapezoidal, rectangular, and hexagonal cells with partly aluminum structure used to simulate the melting process of paraffin in Figure 4b. In Figure 4a, the hot wall is the vertically the front wall of the honeycomb structure, which is heated. Since the thermal conductivity of the aluminum structure is much larger than that of PCM, the PCM in the honeycomb core is mostly heated by the surrounding isothermal boundary. The simulated compositional cells in Figure 4b are selected from the slice of the honeycomb structure, which is far enough from the hot wall. Hence, the melting of PCM is dominated by isothermal boundaries rather than the hot wall.
In Figure 4b, it can be observed that the melting rate of paraffin in the hexagonal compositional cell is not the fastest. Therefore, it is necessary to study the melting rates of PCM in other cells for the whole phase change process.

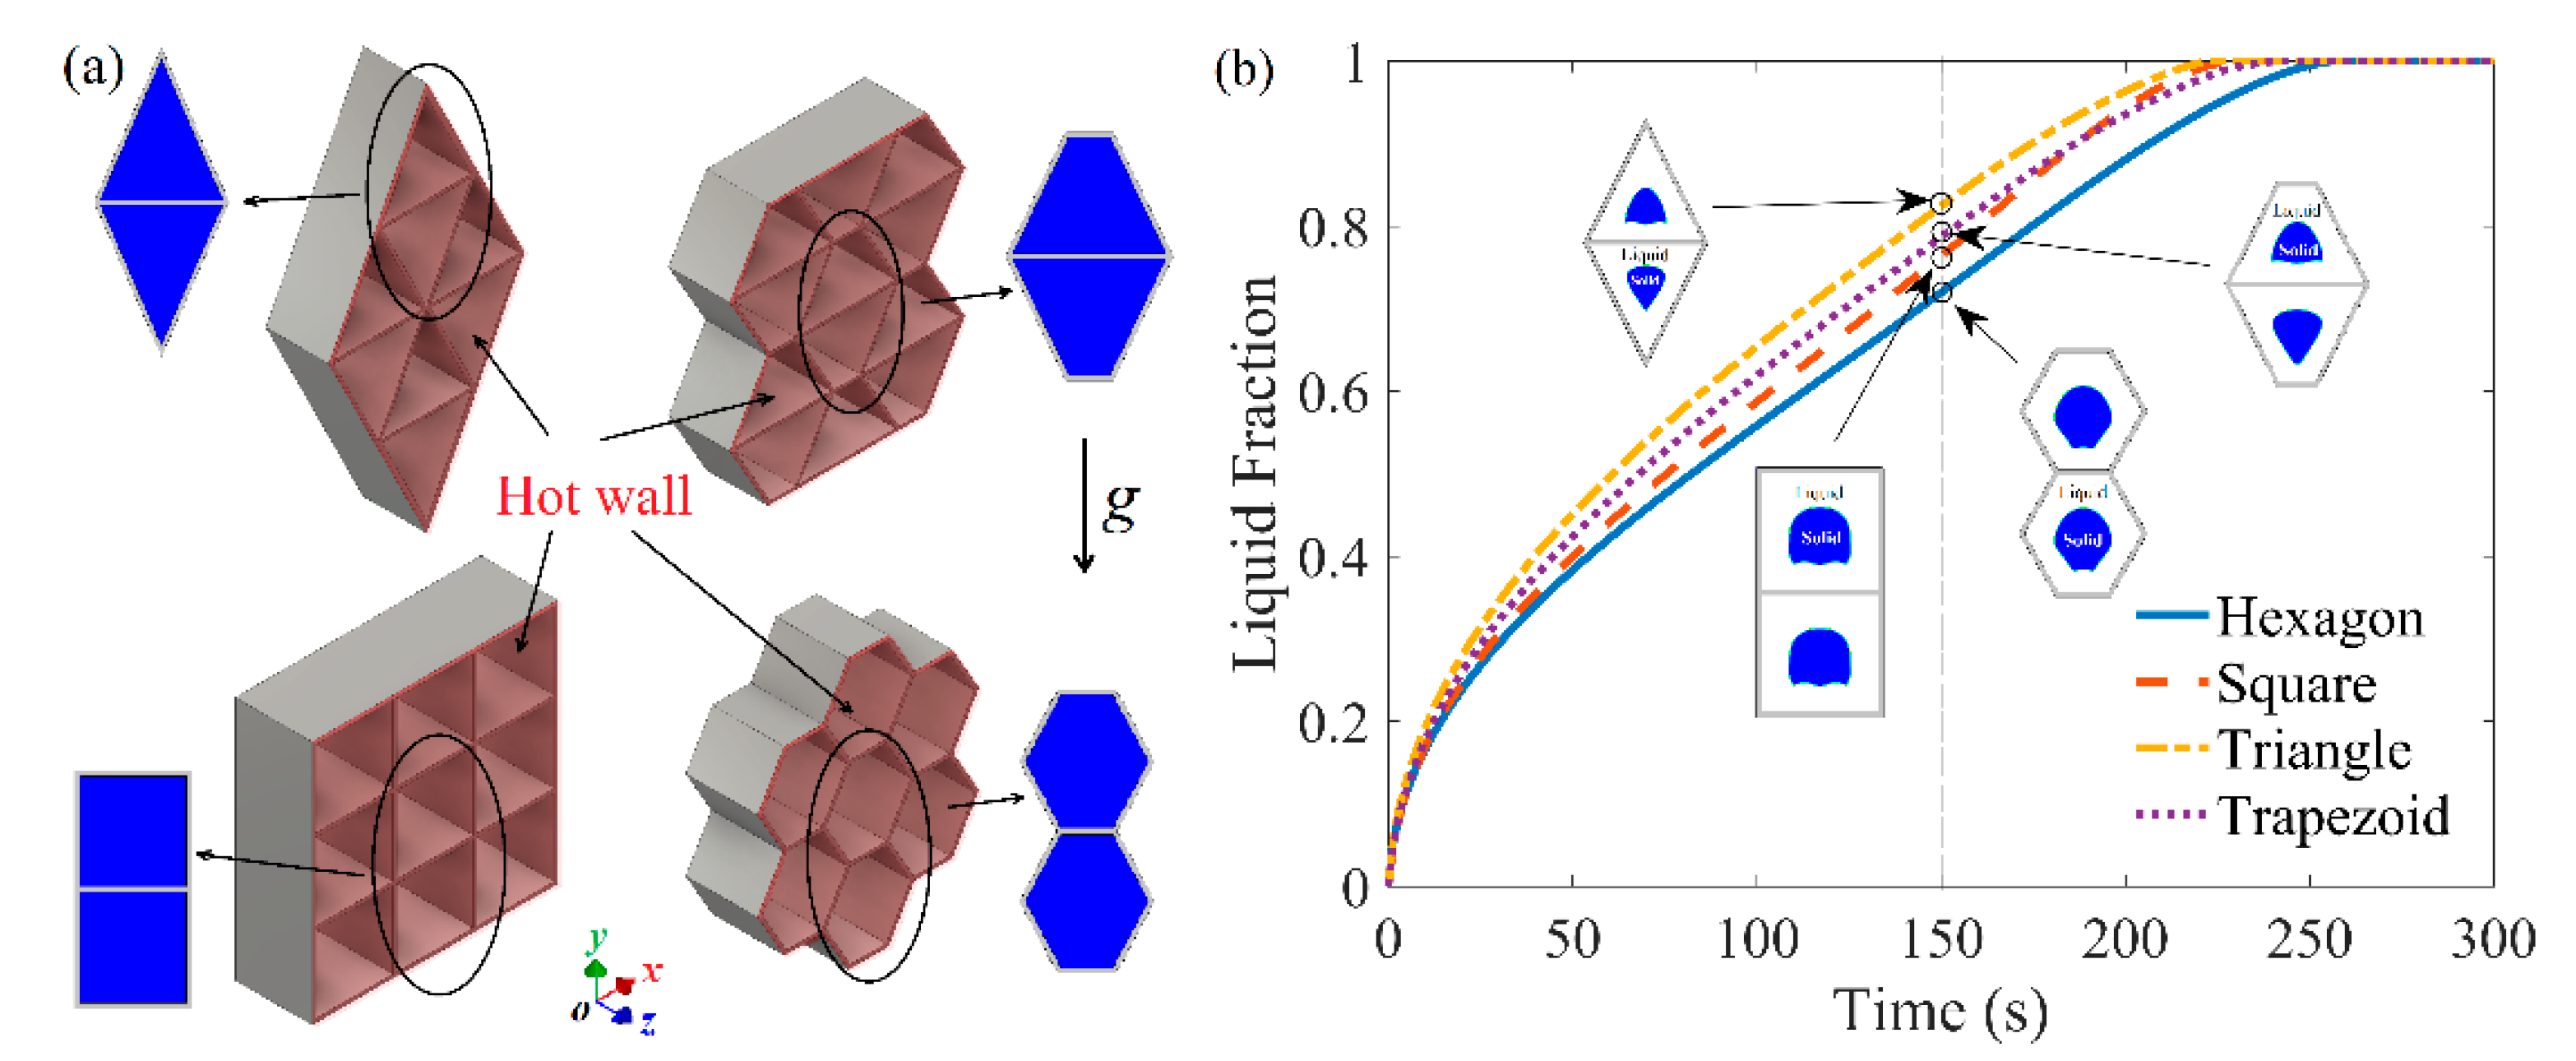
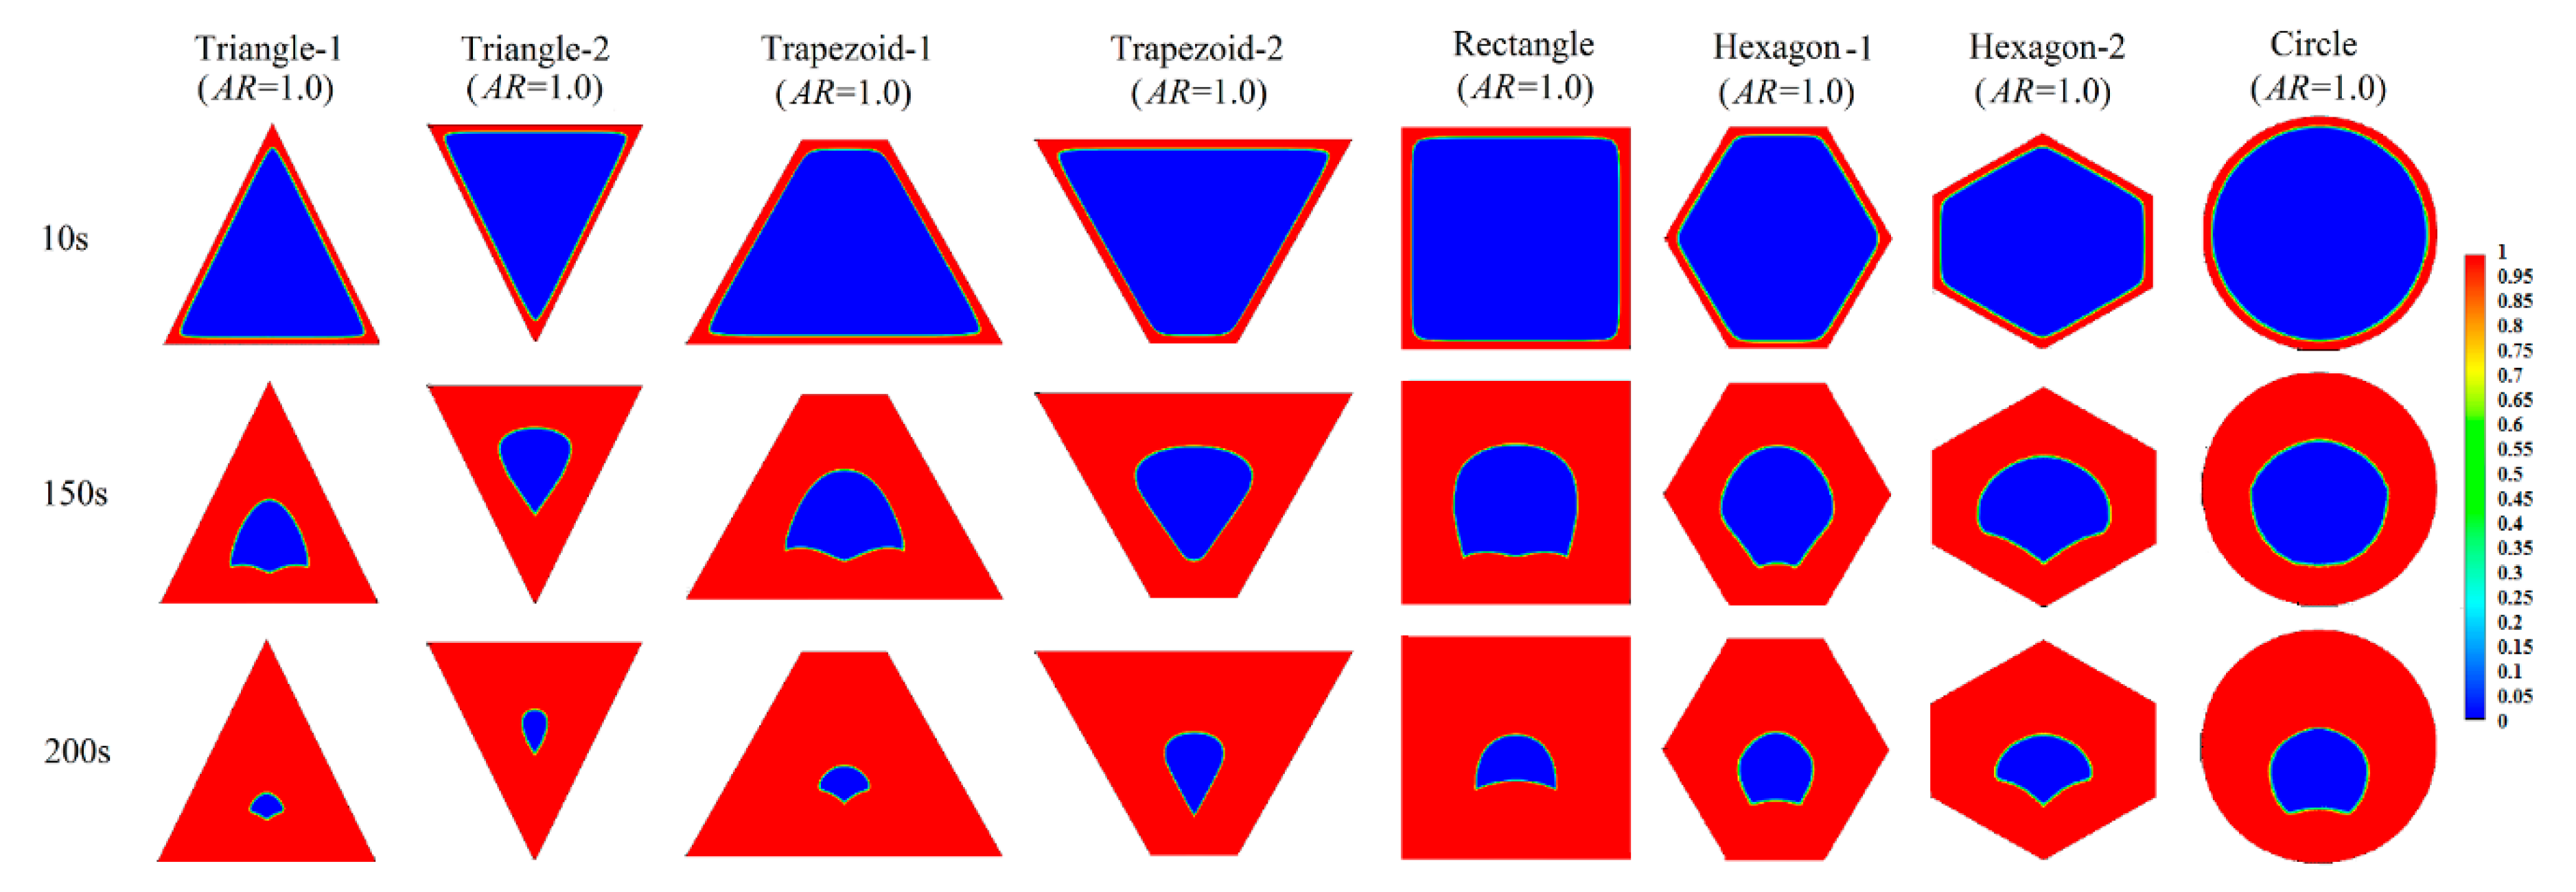
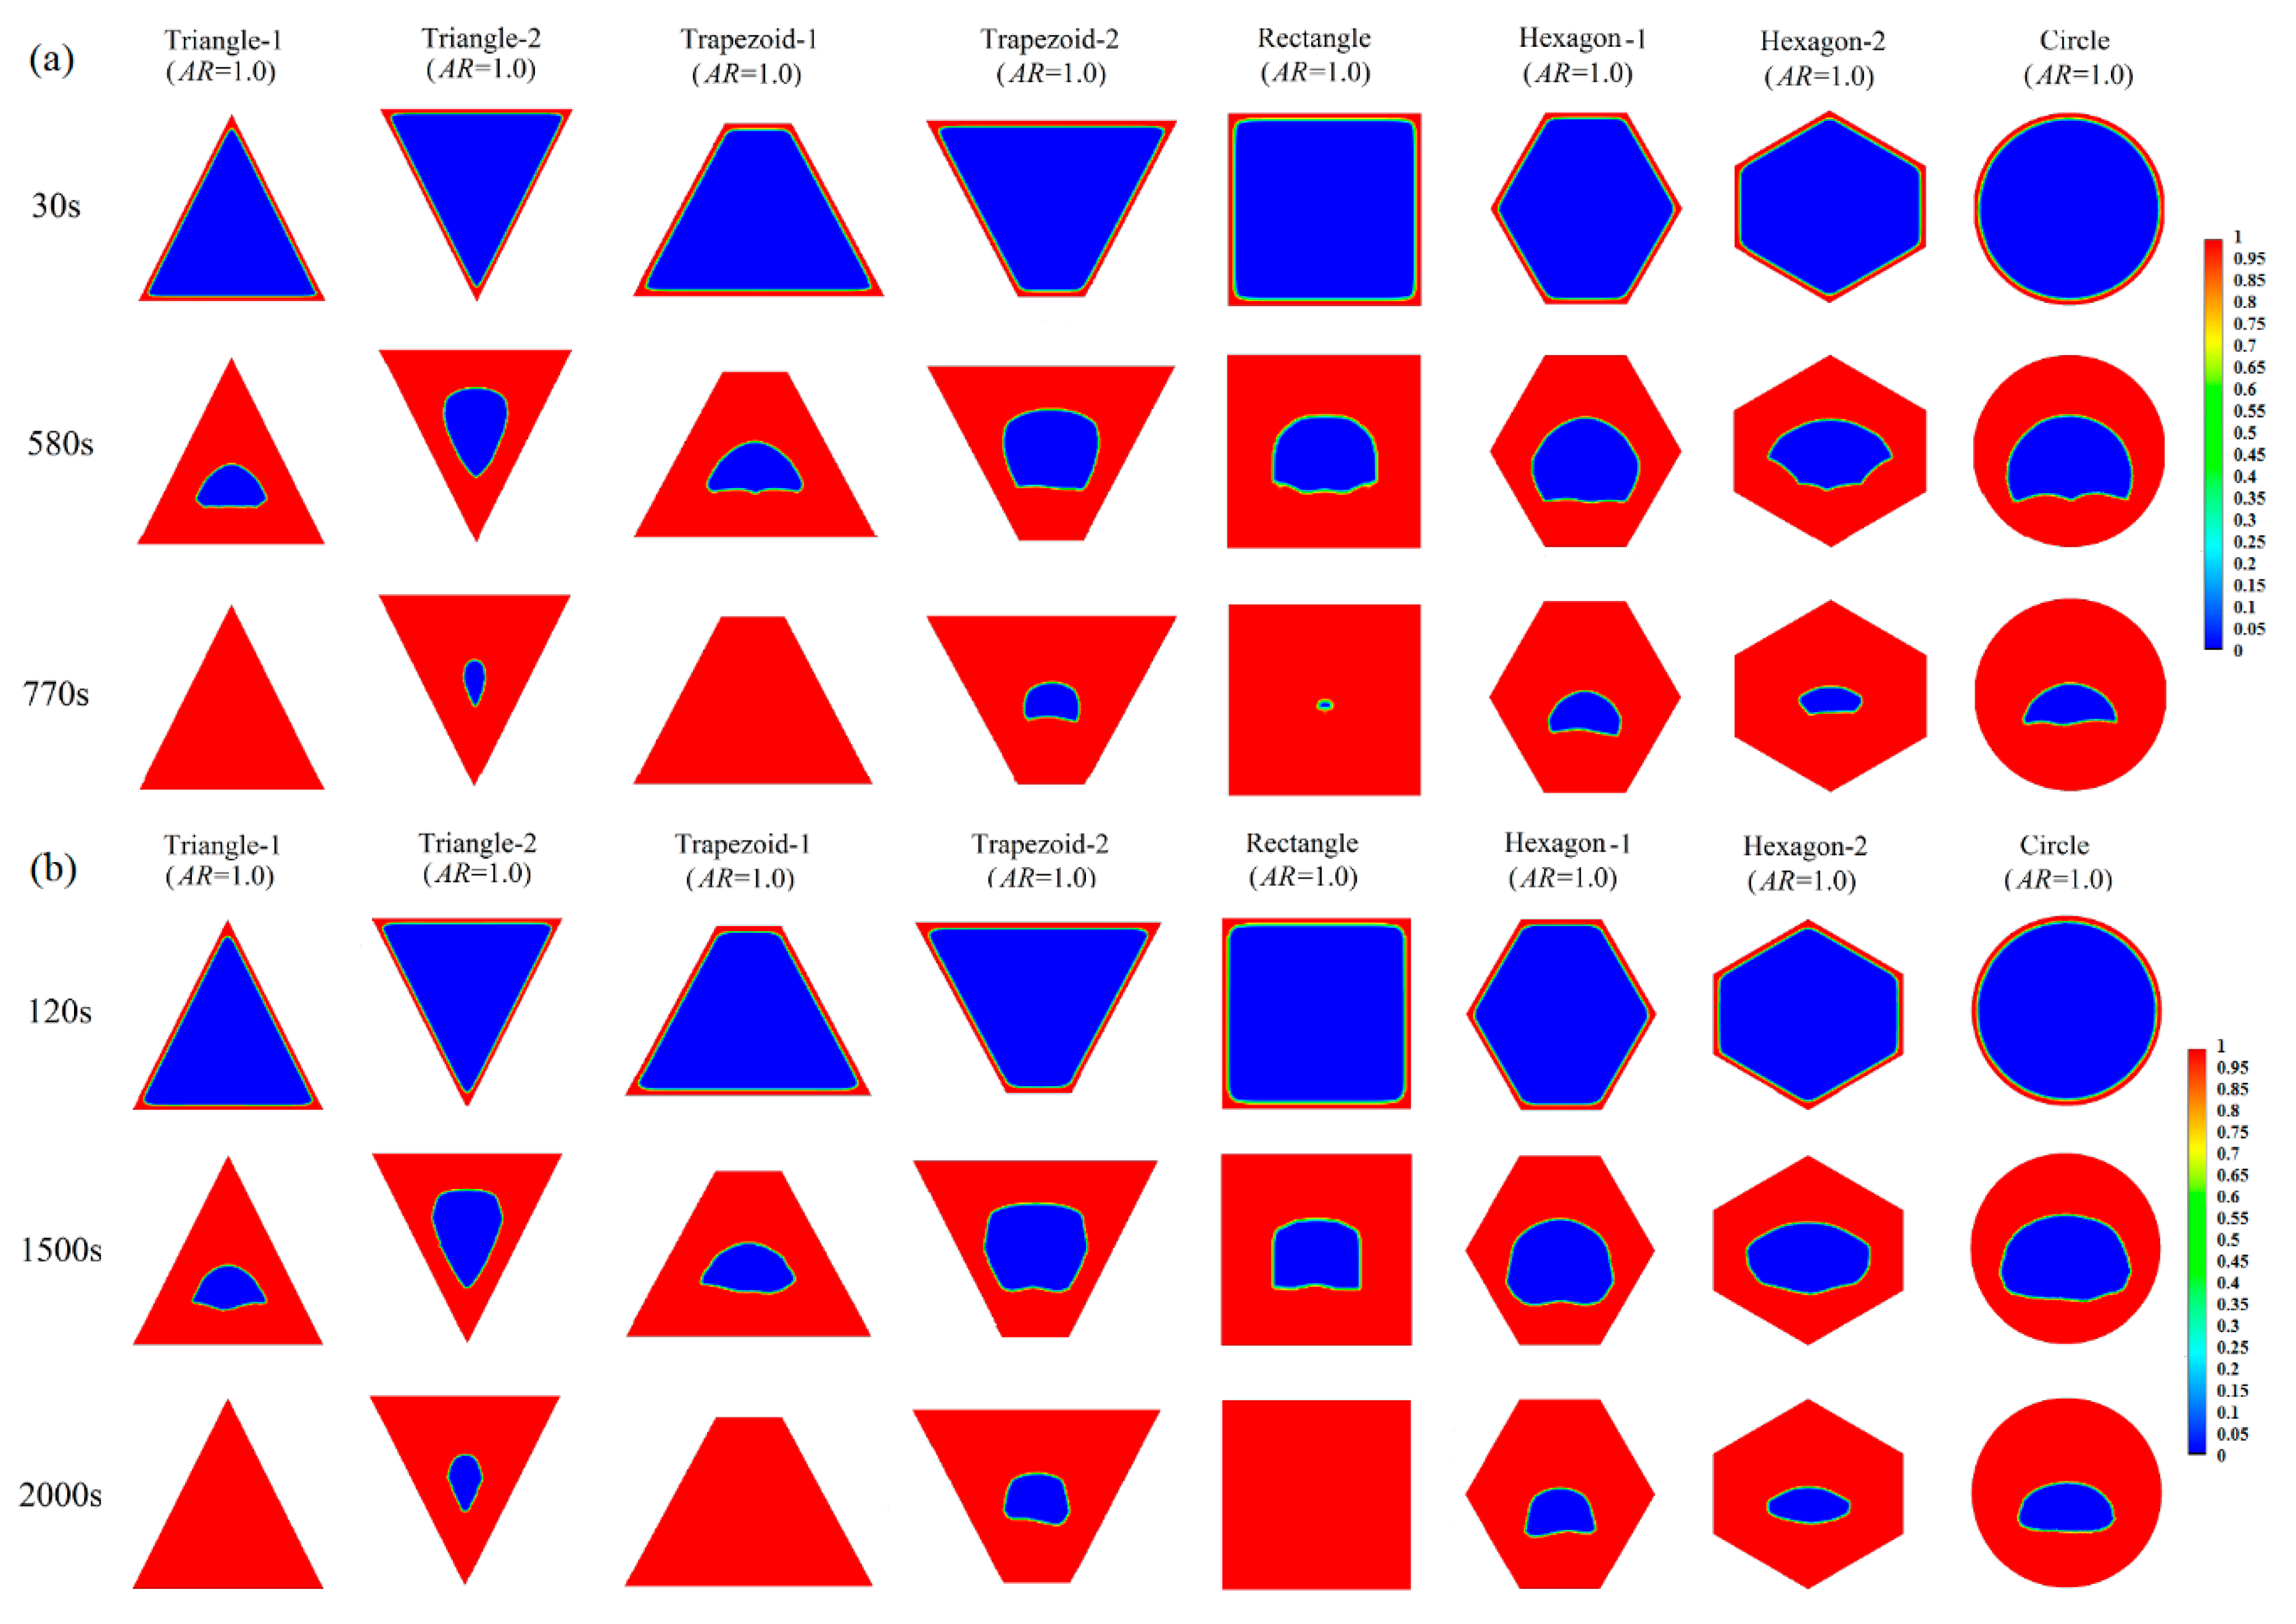
3.1. Melting Process in Cells with AR = 1.0

From Figure 4b, it is found that the melting process of PCM in the compositional cells with different orientations are independent from each other. The total melting time depends on the slower melting stage in the compositional cells. Hence, the melting of PCM in one cell was studied in detail as follows. Figure 5 shows the liquid fractions of paraffin in the triangular, trapezoidal, square, hexagonal, and circular cells at Ra = 3.095 × 10⁵ (A = 100 mm2). The contours of the liquid fraction of the other two Rayleigh numbers (Ra = 4.83 × 10⁶ (A = 625 mm2) and Ra = 3.87 × 10⁷ (A = 2500 mm2)) are shown in the Appendix A. The mass of PCM in the different cells is the same for any studied Rayleigh number. The aspect ratios of these cells are 1.0. Figure 5 indicates that the same PCM has different melting rates in different cells at the same time. At the beginning of melting, the solid PCM melting is mainly influenced by the thermal conduction. At the end of the melting process, the melting rates of the PCM varies because of the different intensity of convection in different cells.
Figure 6 shows the temporal evolutions of the liquid fraction of PCM in five different cells when the aspect ratio is 1.0 and the Rayleigh numbers are 3.095 × 10⁵, 4.83 × 10⁶, and 3.87 × 10⁷, respectively. It was found that the liquid fractions of PCM in triangle-1, trapezoid-1, and square cells are larger than that in a hexagonal cell at the same time. When the Rayleigh number is 3.87 × 10⁷, this conclusion is much clearer (see Figure 6c).
Therefore, Figure 6 demonstrates that the geometrical characteristic plays an important role in the melting process of PCM. In fact, as the shape of the enclosure changes, the real height of the enclosures is different. Consequently, their effective Rayleigh numbers are different. On the other side, the streamlines of convective flow inside the enclosure are bounded by their boundary. When the lateral sides are not connected in straight lines, such as the hexagonal and circular cells, the extensional boundaries prolong the period of the circulation inside the enclosure. As a result, the heat flux induced by thermal plumes reduced so that the corresponding melting rate decreases at the same time. As aspect ratio increases, this effect is more pronounced since the lateral sides of the enclosure are more stretched.
In addition, the orientation of the enclosure also plays an important role in the melting rate of PCM. For example, in Figure 6b,c, it can be seen that the melting rates of the same PCM in the same triangular cells with different orientations are not the same. This difference is not obvious in Figure 6a, because both cells absorb the same thermal energy from the same perimeter when the conduction is dominated at a small Rayleigh number. Kamkari et al. [41] reported that the same PCM in the same enclosure with different inclined angles could acquire different melting times. Because the different orientation leads to a different effective Rayleigh number in the same gravitational acceleration. Therefore, the influence of the place orientation of different cells should be considered.
Figure 7 and Figure 8 plot the enhancement ratios of the liquid fraction and energy absorption in the triangular, trapezoidal, square, and hexagon-2 cells compared to the hexagon-1 cell for different Rayleigh numbers. The definitions of the enhancement ratios of the liquid fraction [20] and energy absorption are as follows:
E m f ( t ) = m f ( t ) m f h e x ( t ) m f max × 100 % ,
E Q ( t ) = Q ( t ) Q h e x ( t ) Q max × 100 % ,
where mfmax is 1.0, mfhex(t) is the instantaneous liquid fraction of the PCM in the hexagon-1 cell; Qmax is the total energy absorption when the PCM melts completely in the hexagon-1 cell, and Qhex(t) is the instantaneous energy absorption of the PCM in the hexagon-1 cell. All of these parameters are compared at the same aspect ratio and the same Rayleigh number.
Figure 7 reveals that the melting rates of PCM in triangular, trapezoidal, and square cells are greater than that of PCM in the hexagon-1 cell for different Rayleigh numbers. Accordingly, the energy absorption ratios in Figure 8 exhibit a similar trend with the melting rate in Figure 7. Both Figure 7 and Figure 8 reveal that the use of a circular cell acquires a lower melting rate and energy absorption than the hexagon-1 cell.

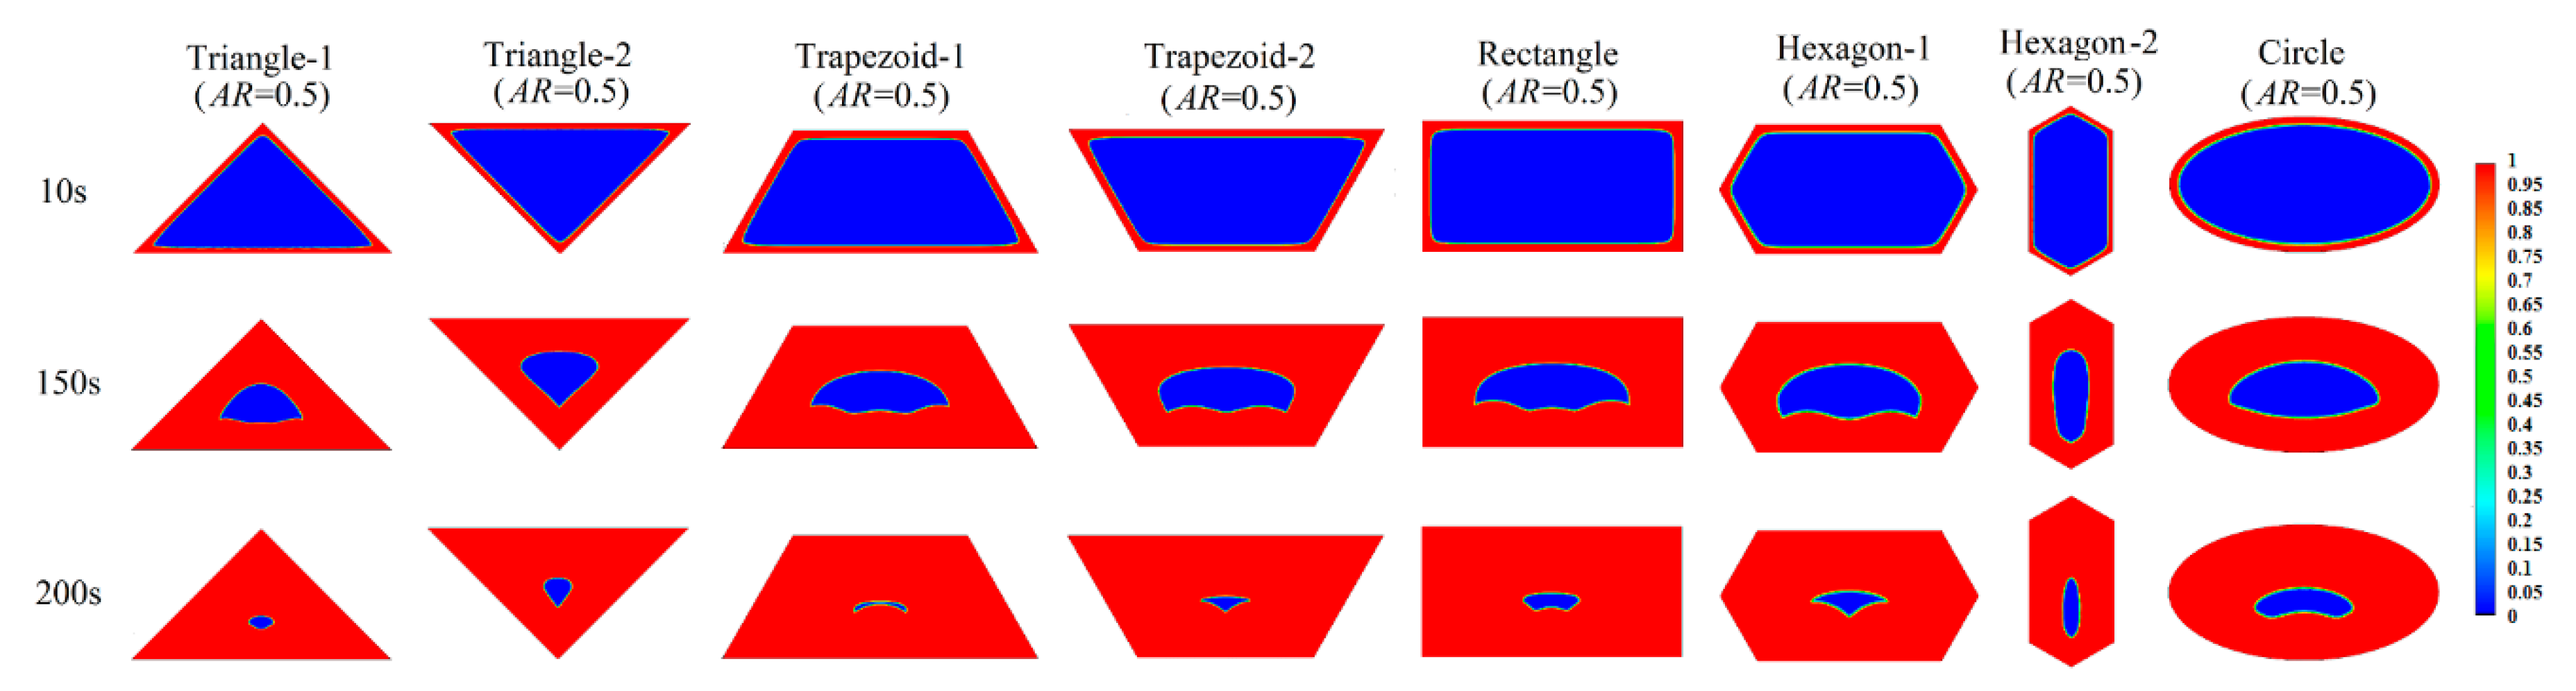
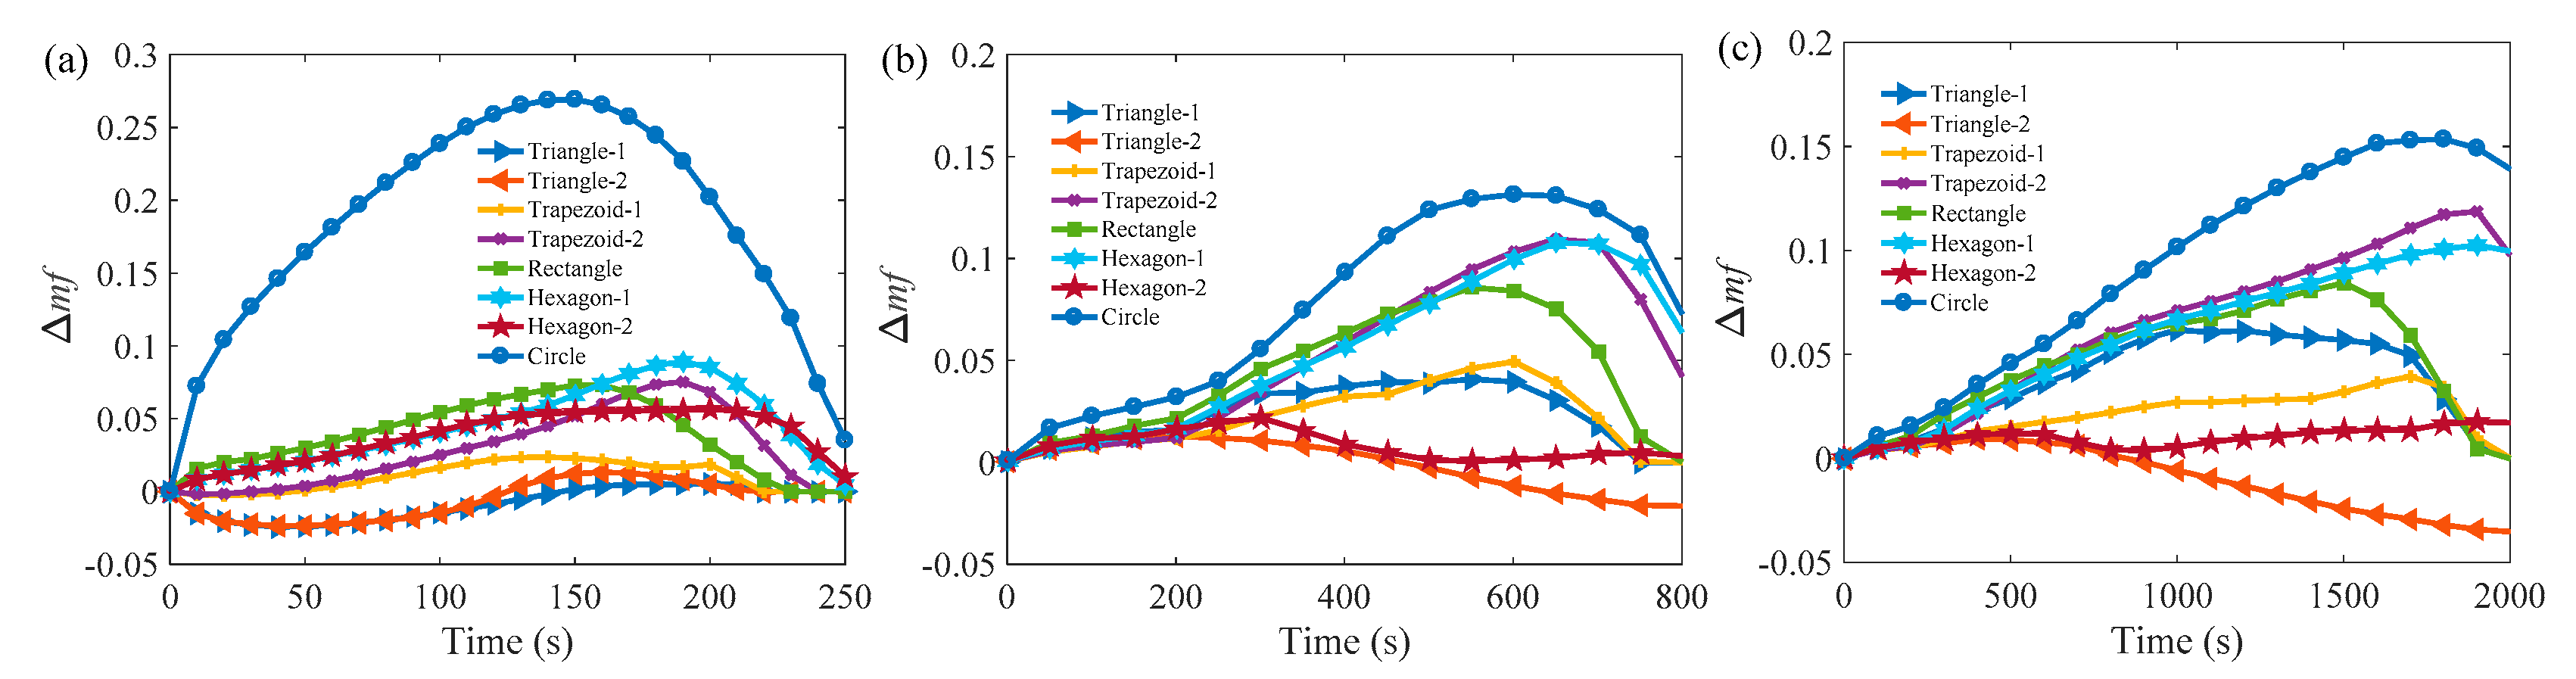
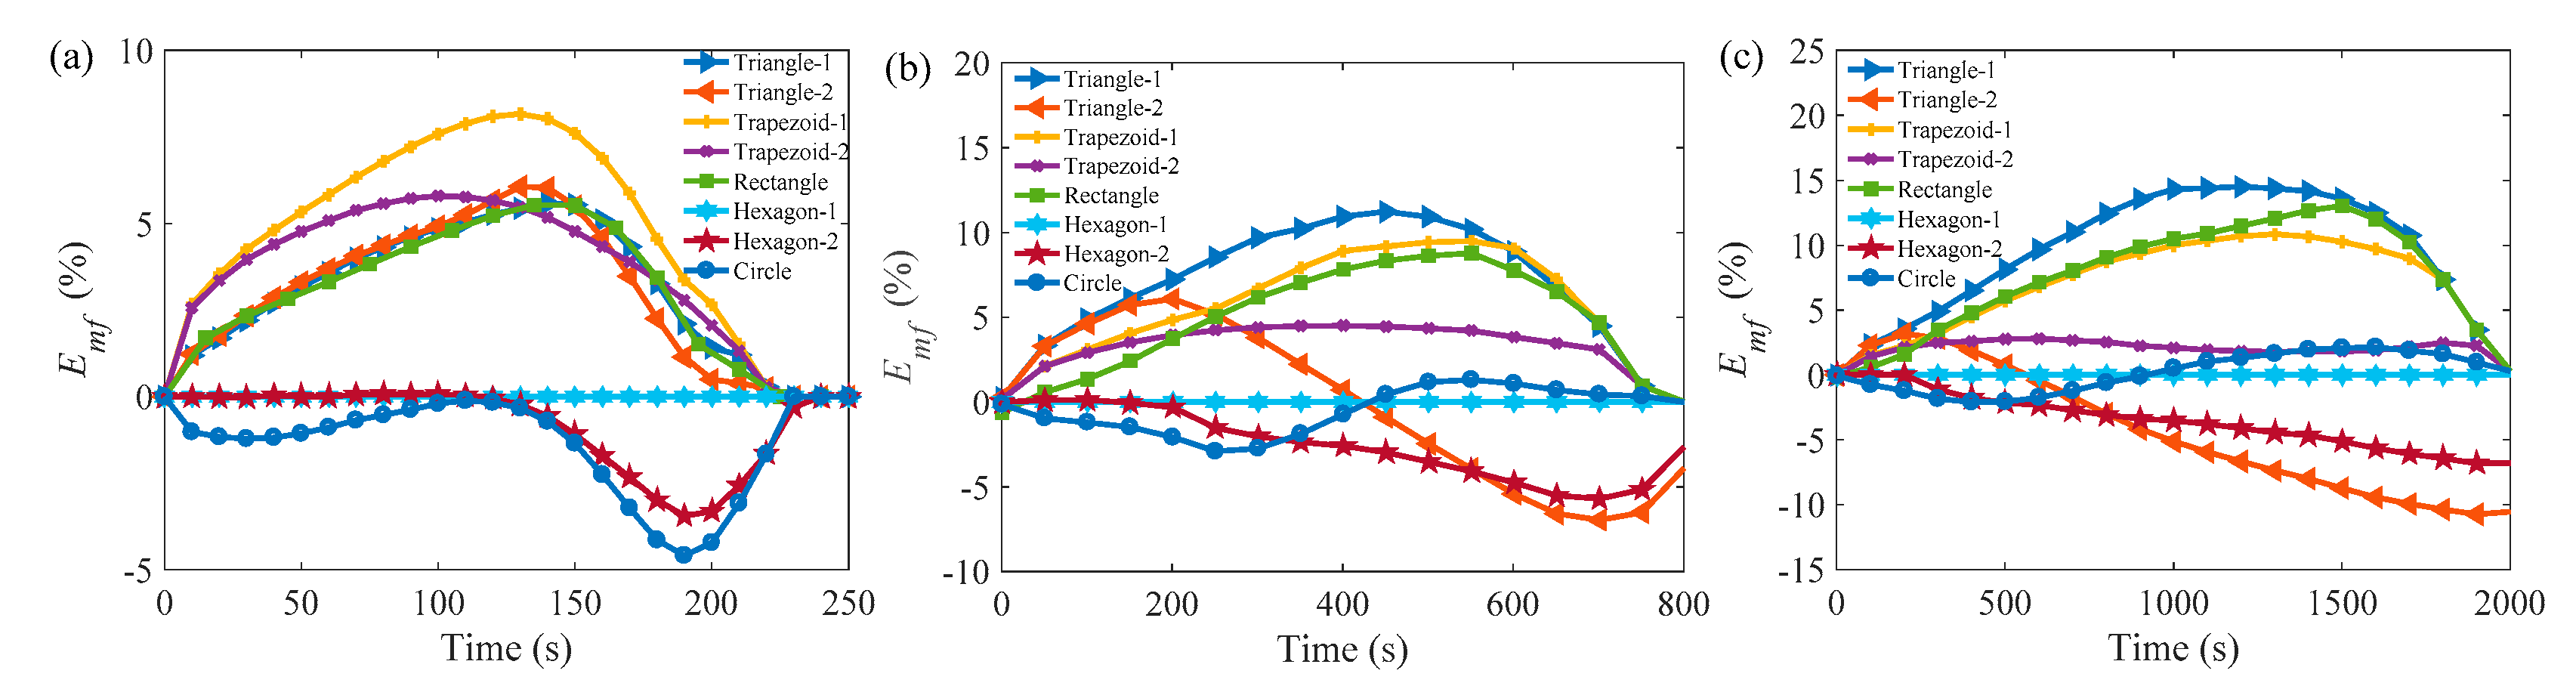
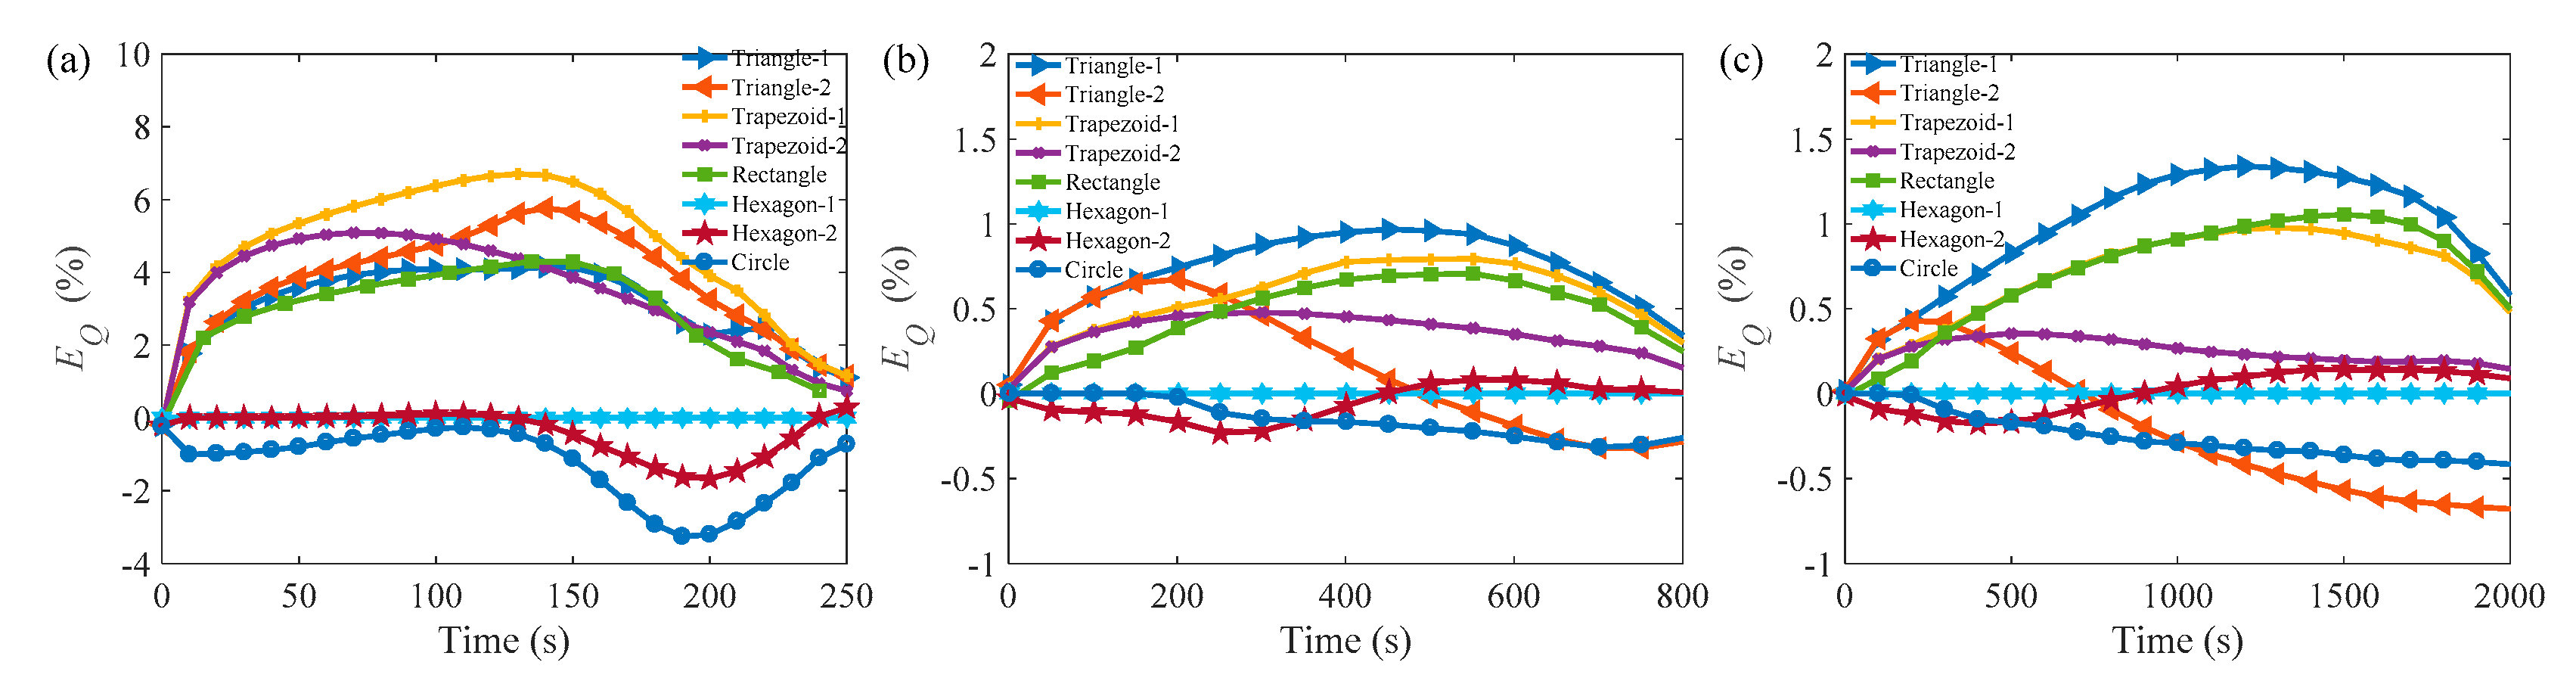
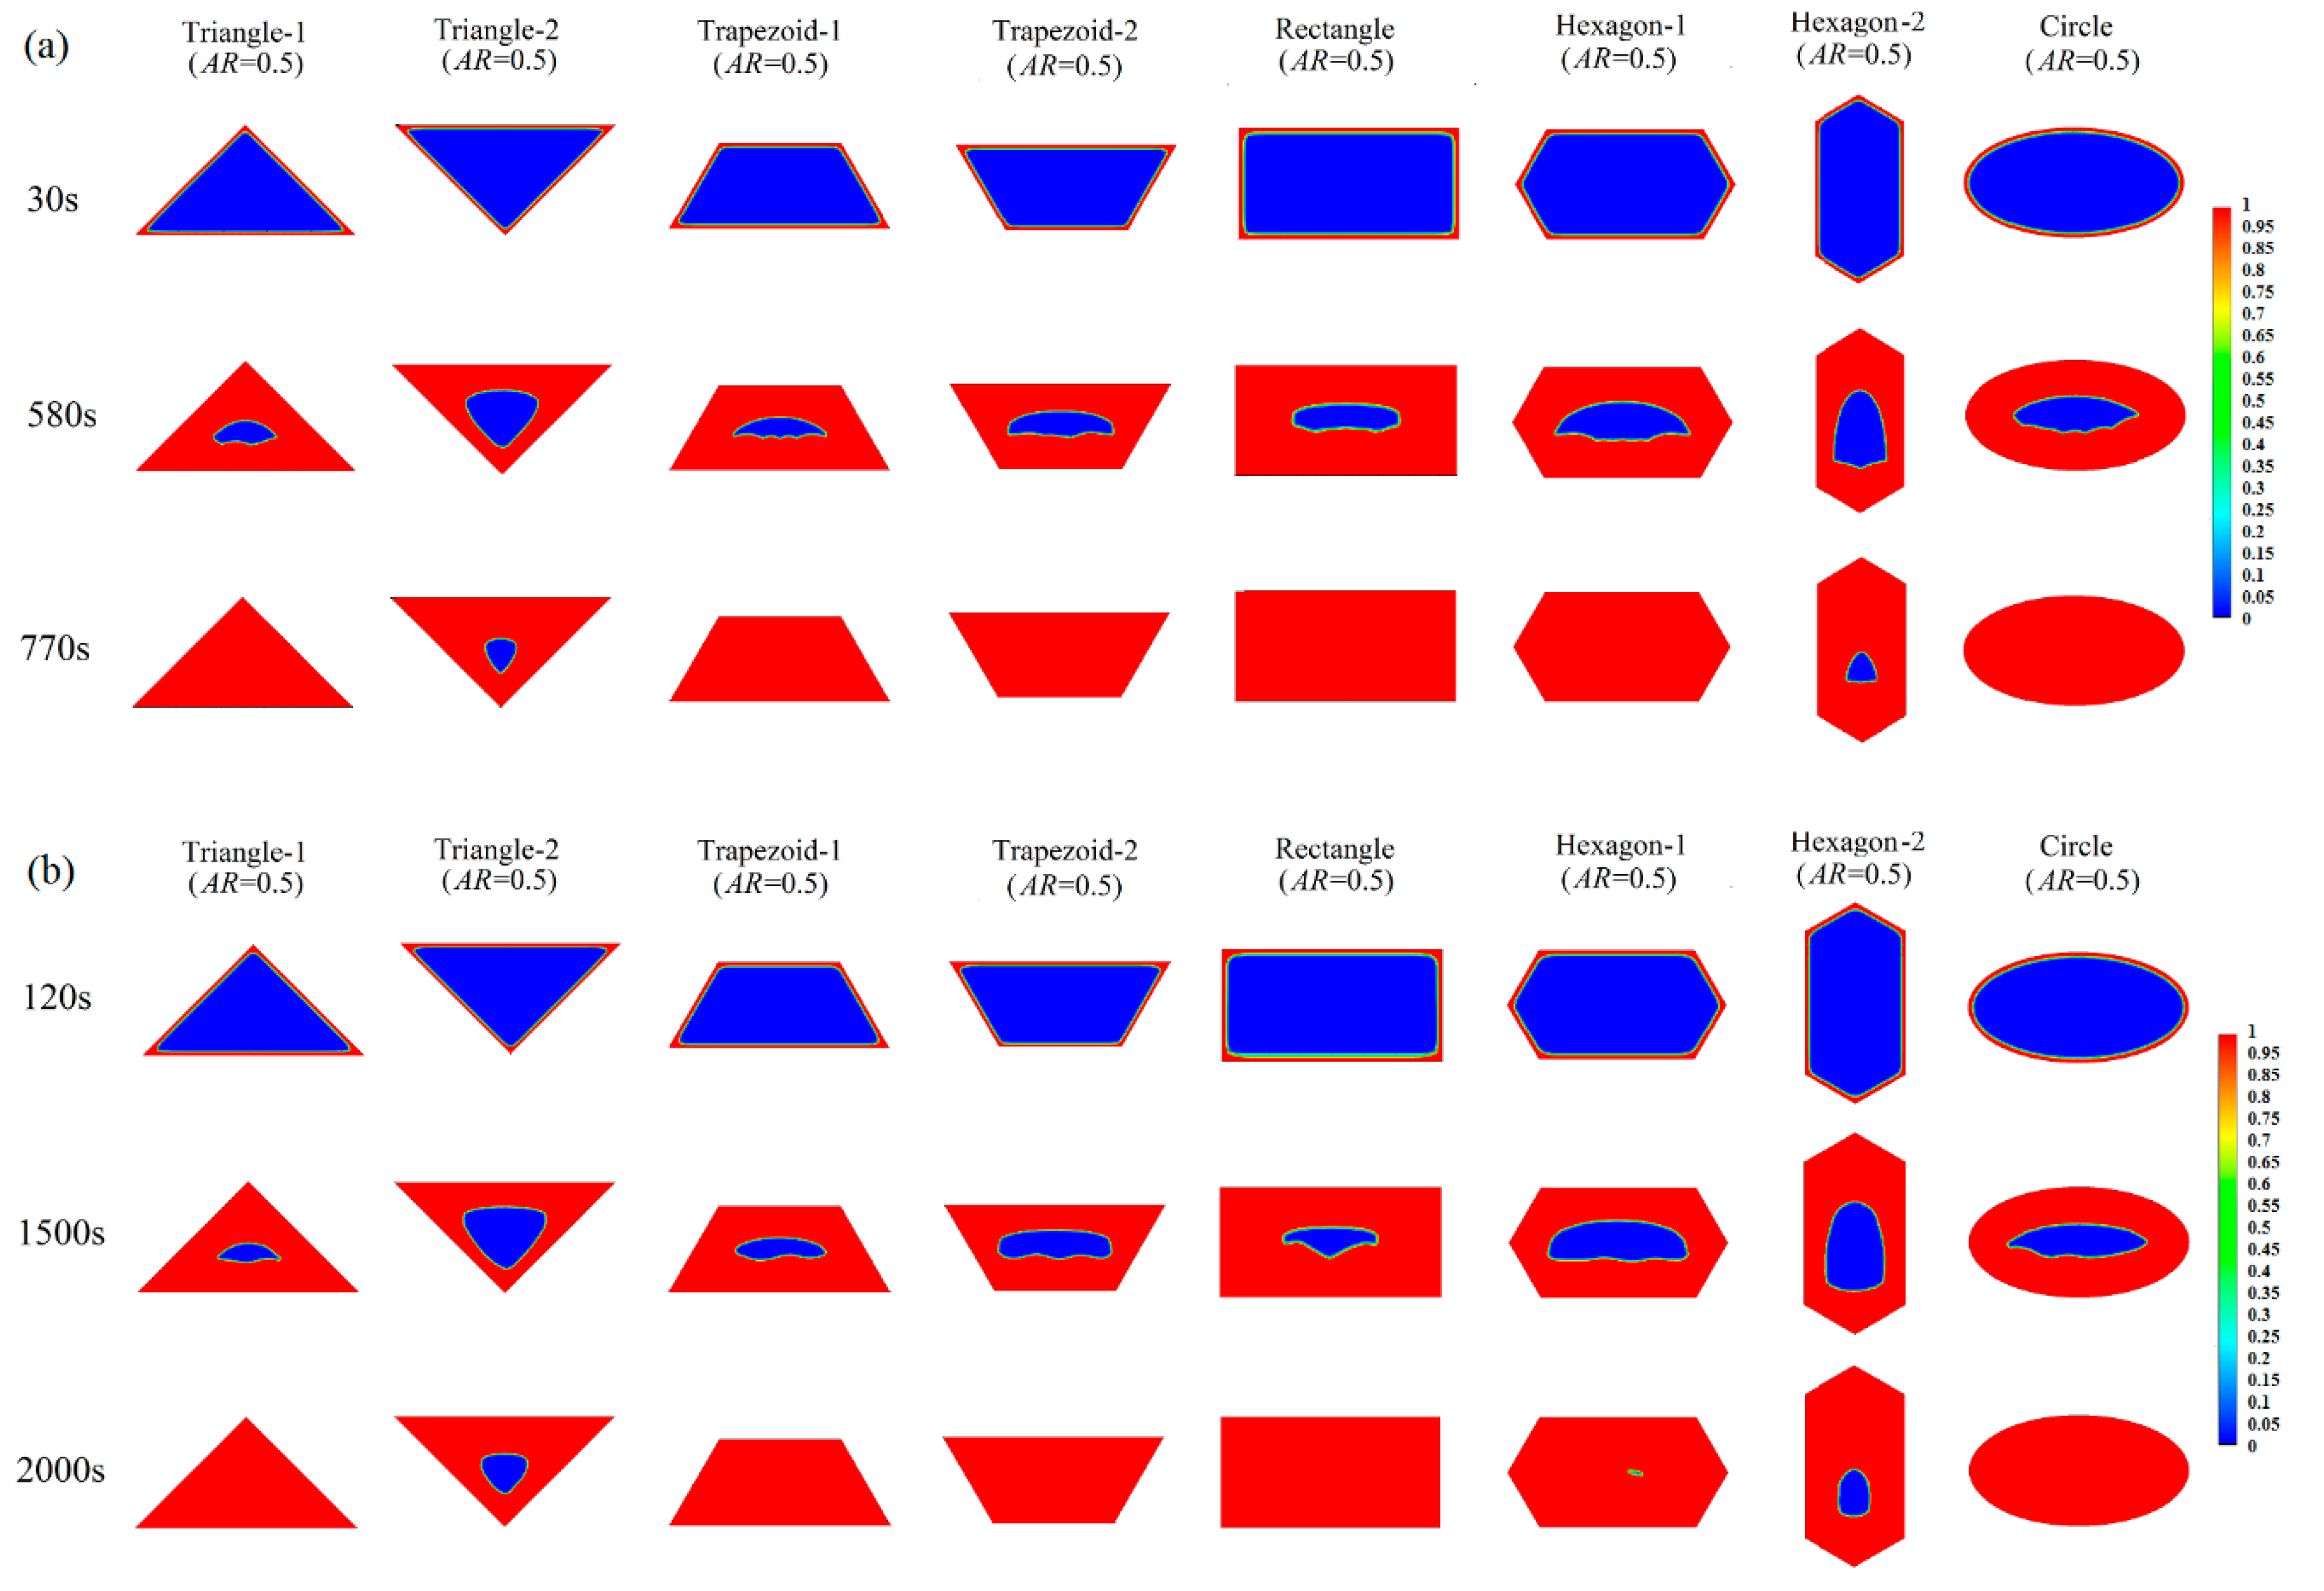
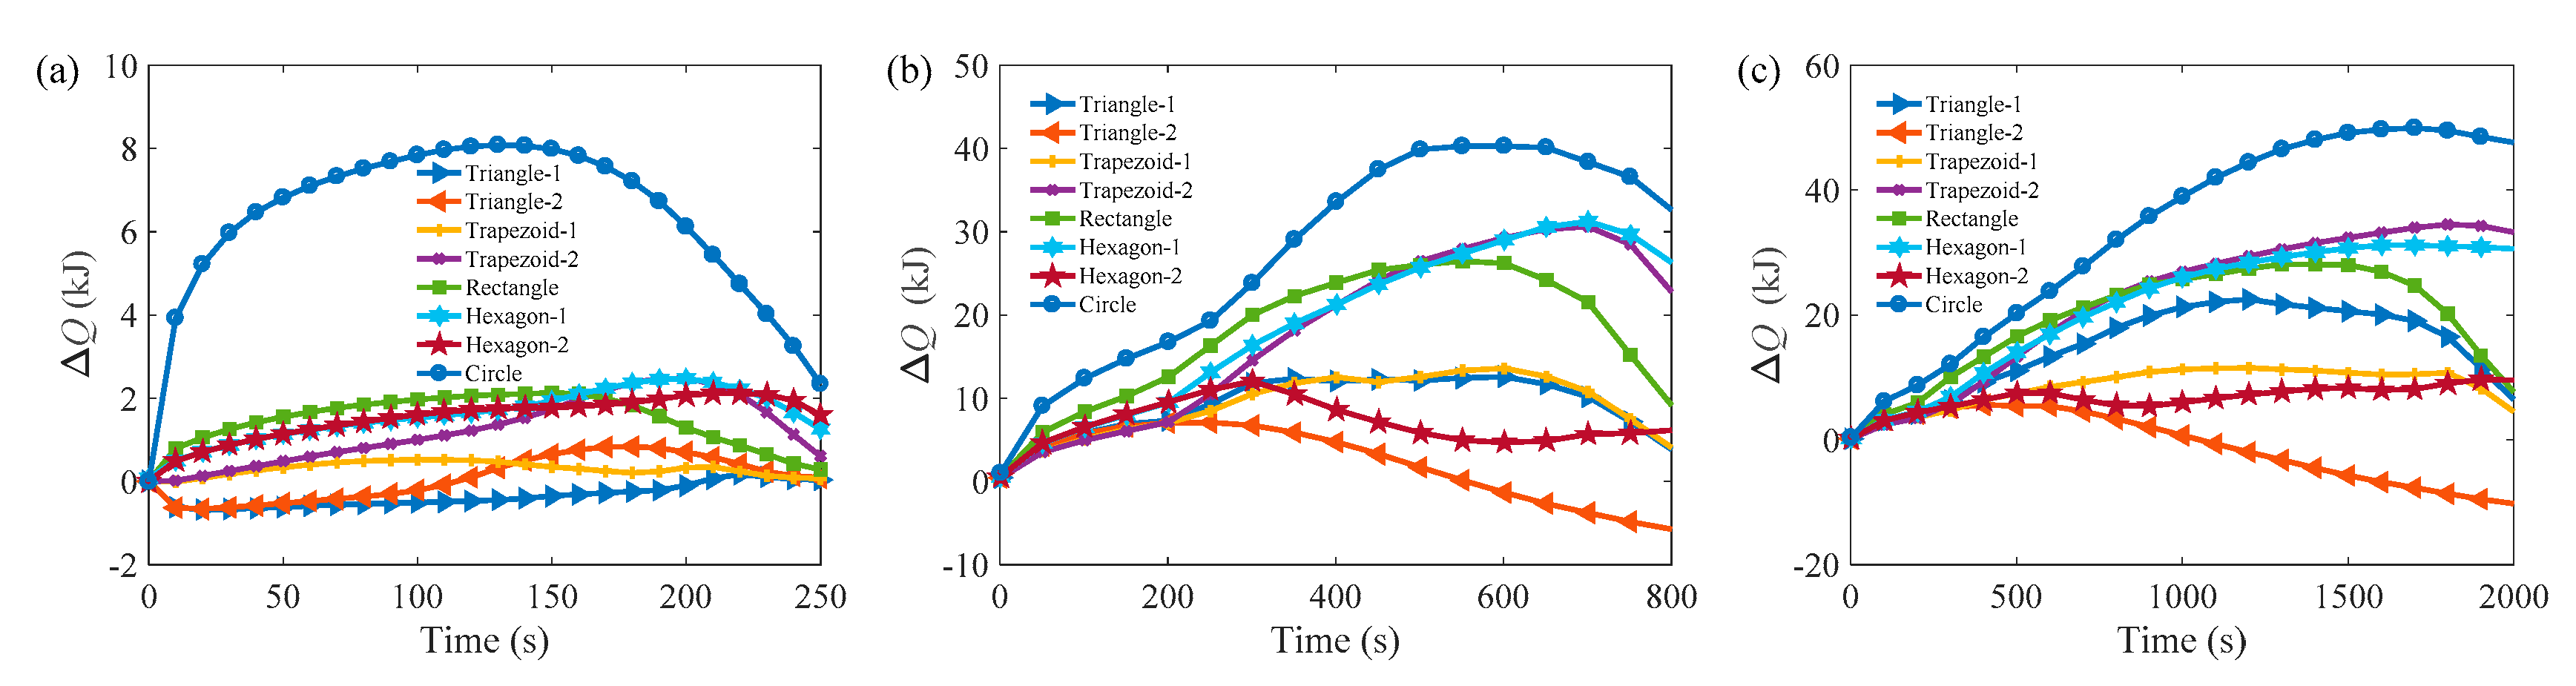
3.2. Melting Process in Cells with AR = 0.5

Besides the different cell shape and orientation, the aspect ratio of cells also influences the melting rate. Figure 9 shows the liquid fractions of the triangular, trapezoidal, rectangular, hexagonal, and circular cells with the smaller aspect ratios (AR = 0.5) for Ra = 3.095 × 10⁵. The evolution of the melting process at other Rayleigh numbers may refer to the Appendix A. Compared to the case of AR = 1.0 in Figure 5, the liquid fractions are much larger for AR = 0.5 at 200, 770, and 2000 s.
Figure 10 shows the increased liquid fraction of PCM in the cells with the smaller aspect ratio (AR = 0.5) compared to the cells with the larger aspect ratio (AR = 1.0). The increased liquid fractions are counted on the basis of the triangular, trapezoidal, rectangular, hexagonal, and circular cells with the larger aspect ratio (AR = 1.0) (see Equation (13)):
Δ m f ( t ) = m f s m a l l e r _ A R ( t ) m f l a r g e r _ A R ( t ) .
In Figure 10, it can be seen that the increase of the liquid fraction of PCM in the circular cell is the largest because the perimeters of the circular cell can increase as the aspect ratio reduces. Figure 10 indicates that natural convection is beneficial for the increase of liquid fraction, but this does not hold for the PCM in triangle-2. In other words, the reduction of AR of triangle-2 could greatly weaken the benefits that come from the natural convection. It is different for the melting process of PCM in the triangle-1 cell. Thus, it can be concluded that the orientation of the cell could influence the melting of PCM greatly.
Figure 11 shows the enhancement ratios of the liquid fraction of PCM in all cells compared to the hexagon-1 cell at AR = 0.5. It is worth noting that the maximum value of enhancement ratios in Figure 11a is less than the maximum value in Figure 7a. It means that decreasing the aspect ratio of the hexagonal cell can significantly increase the melting rate of PCM in it, although it is not the optimal choice. In Figure 11b,c, it can be found that the melting rates of PCM in the triangle-2 cell decrease at the end of melting, which is much different from the results shown in Figure 7a,c. Because the above-mentioned low aspect ratio could suppress the natural convection of liquid PCM in the triangle-2 cell.
Figure 12 shows the enhancement ratios of energy absorption of PCM in all cells compared to the hexagon-1 cell at AR = 0.5. It can be seen that the trend of energy absorption in Figure 12 is similar to the liquid fraction in Figure 11.

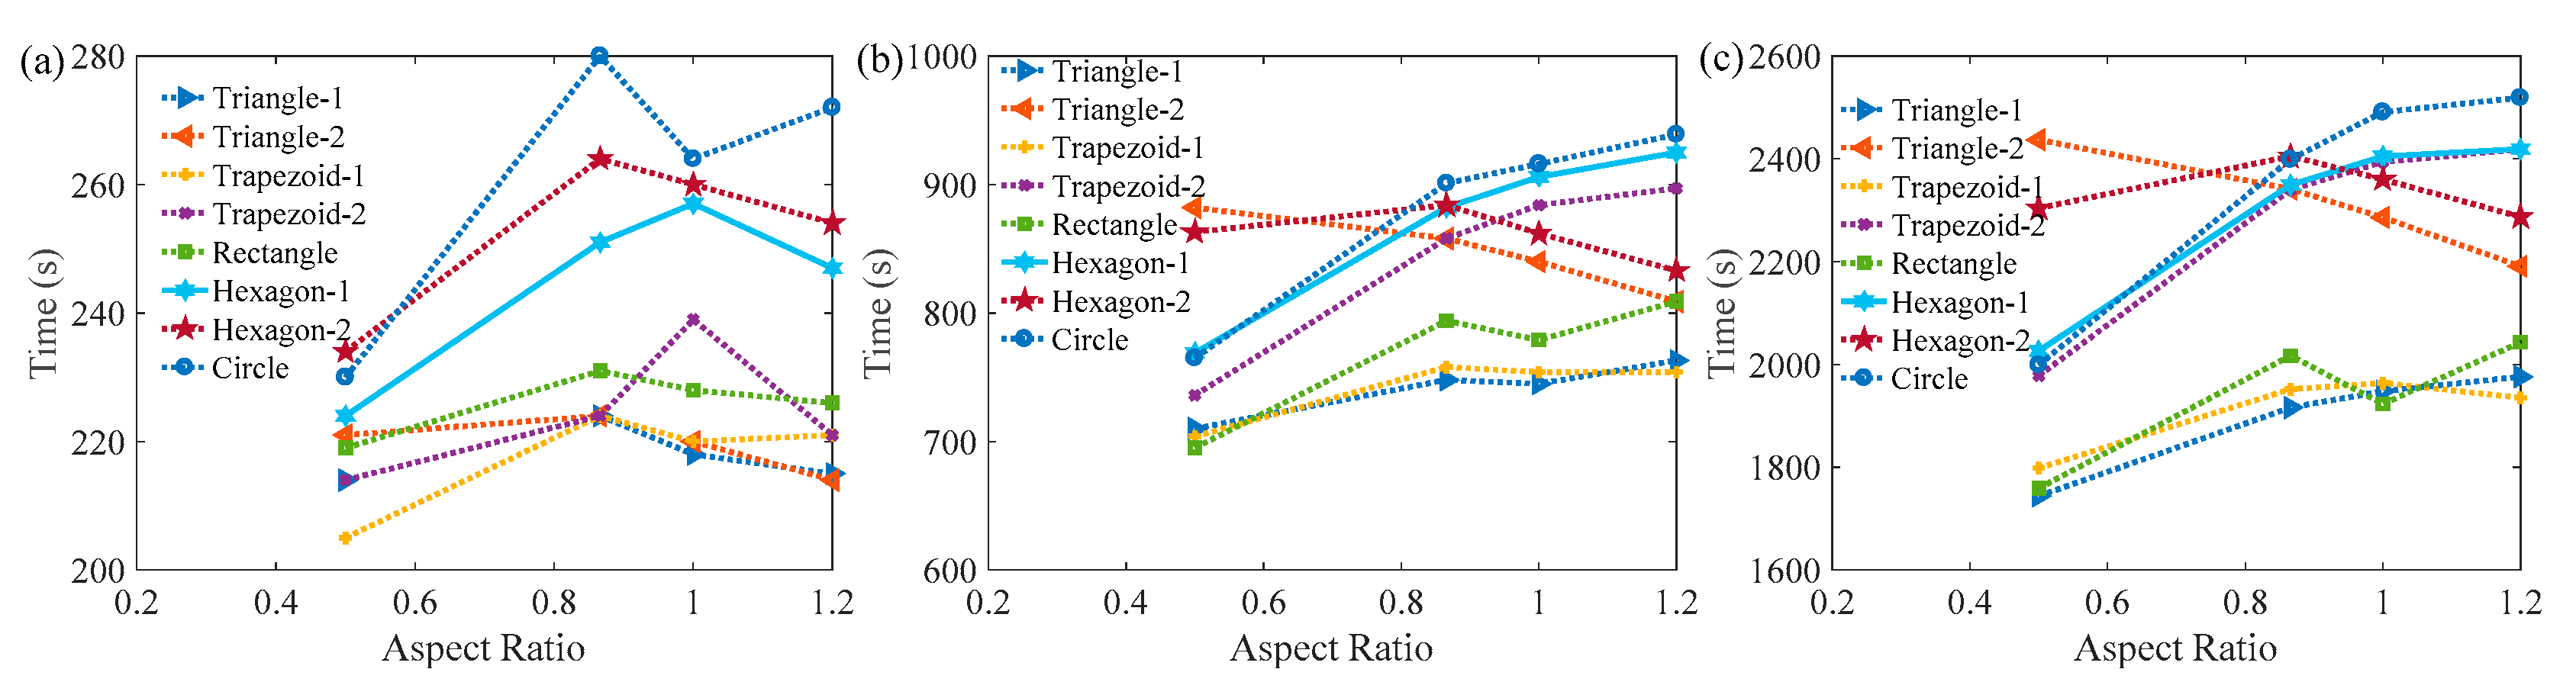
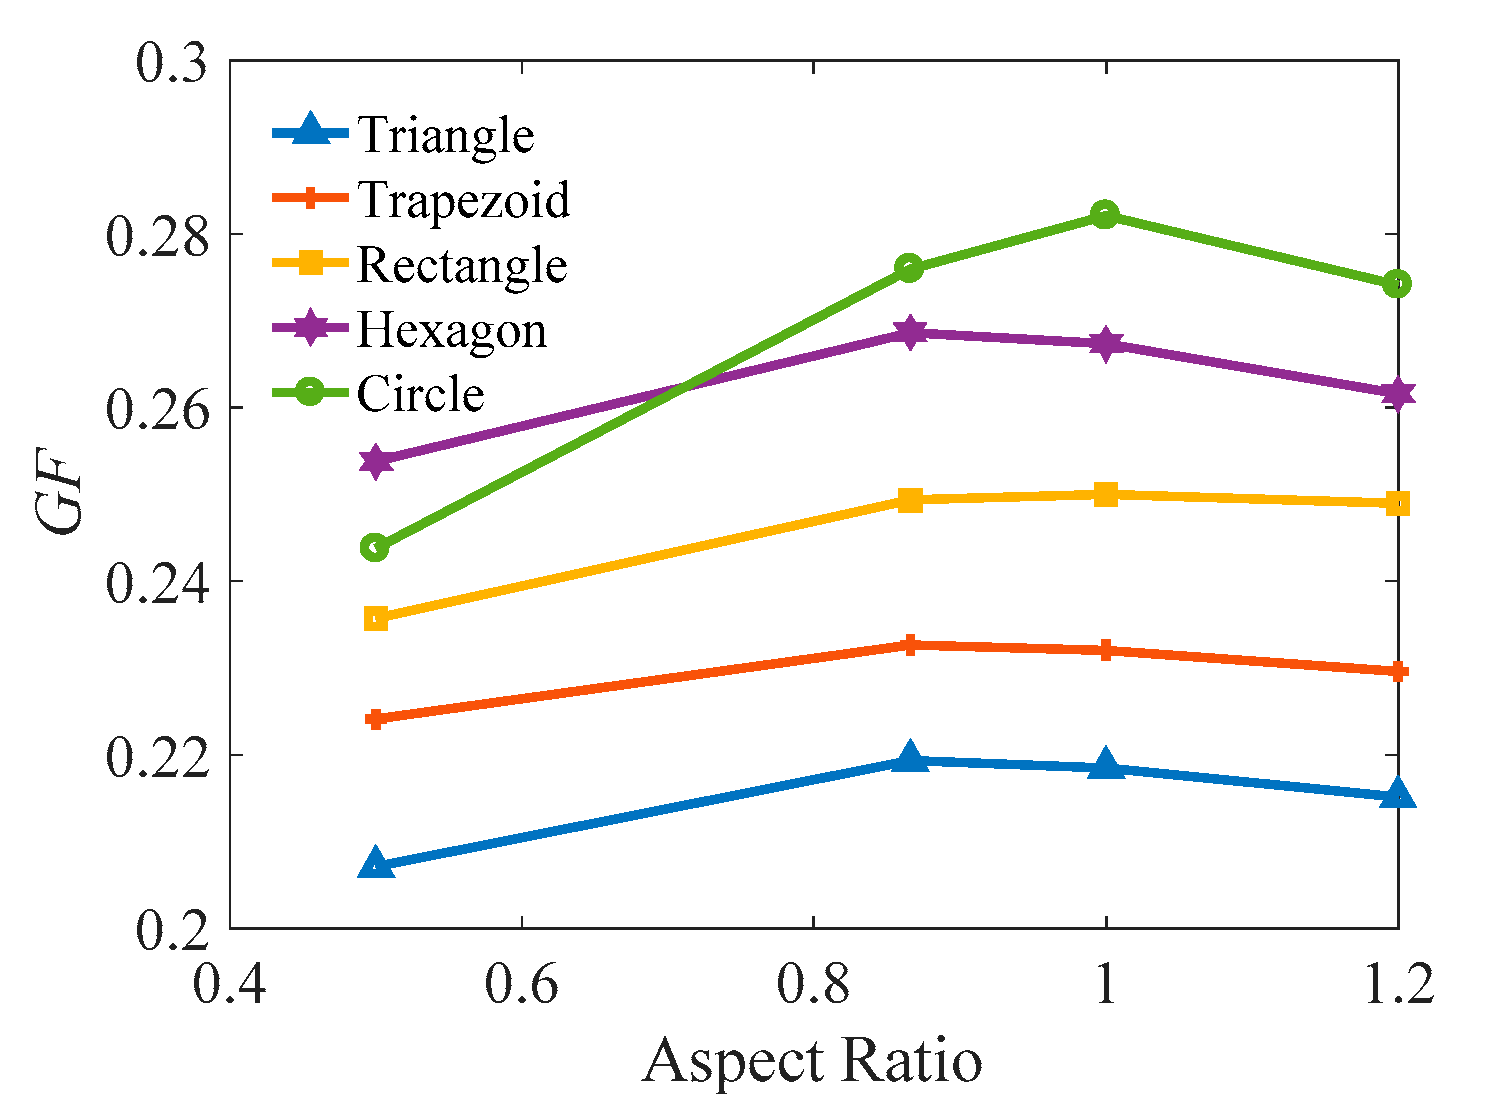
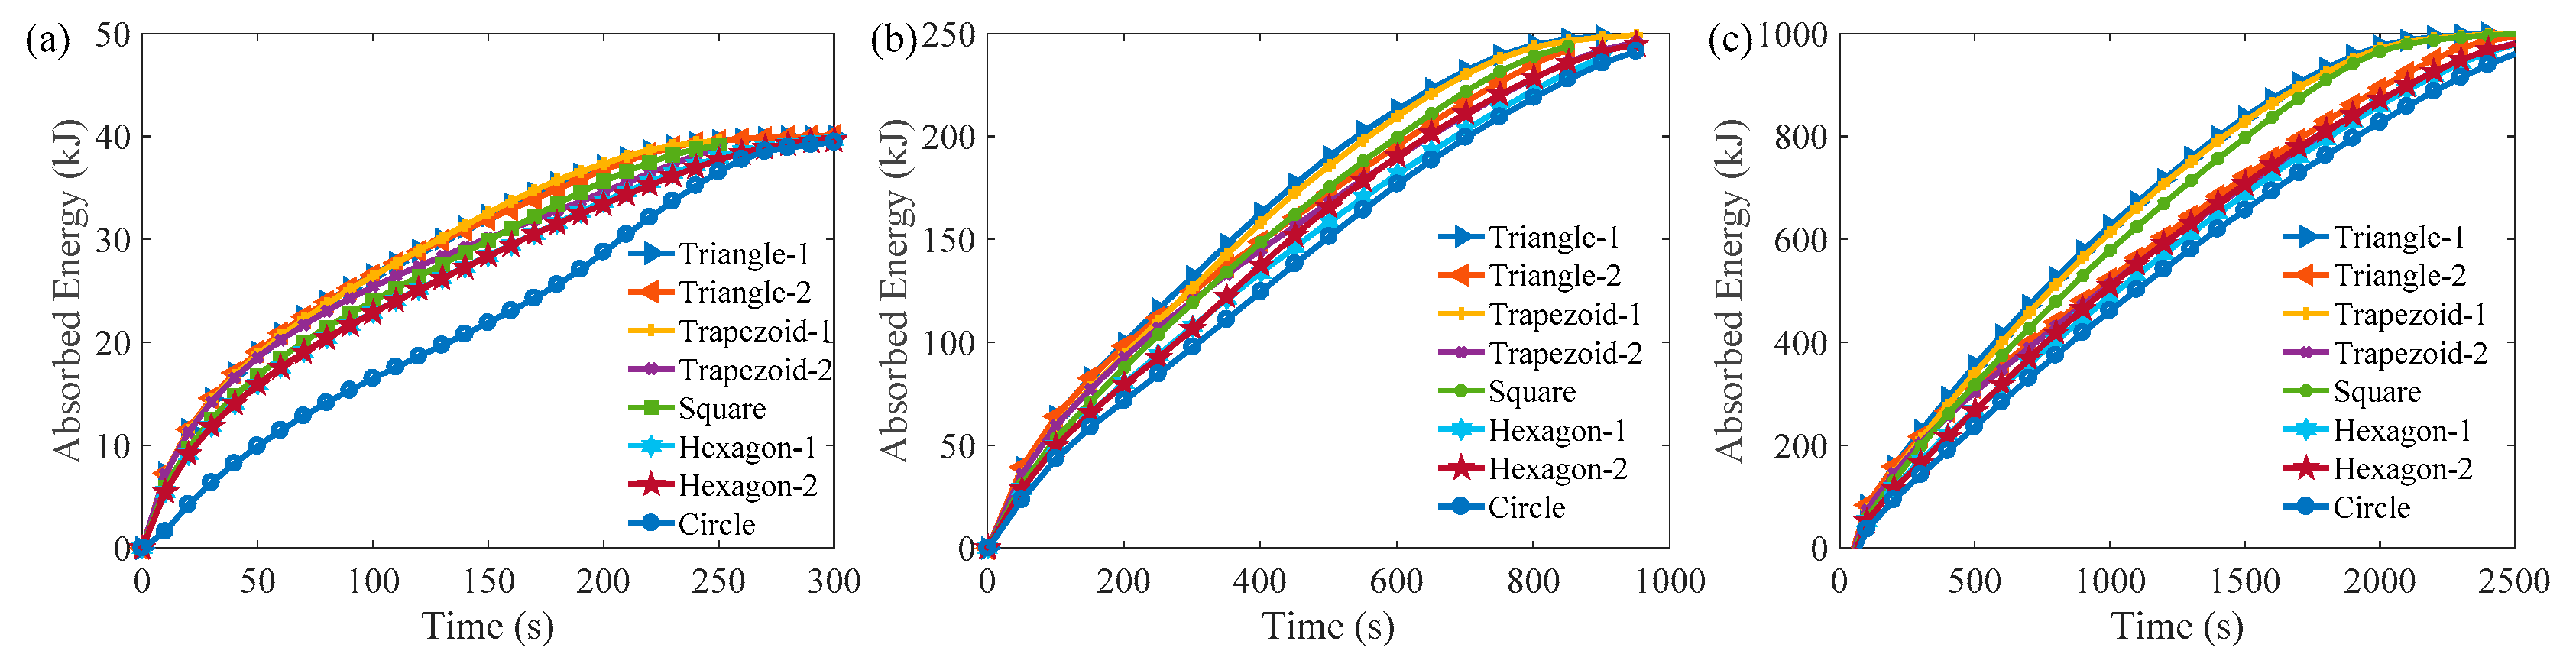
3.3. Comparison of the Melting Time in Different Rayleigh Numbers and ARs

Figure 13 shows the comparisons of the melting times of paraffin in the triangular, trapezoidal, rectangular, hexagonal, and circular cells versus four different aspect ratios (AR = 0.5, 0.866, 1.0, 1.2) at different Rayleigh numbers. Table 3 presents the time-saving ratios of PCM in the triangular, quadrilateral, and circular cells compared to the hexagonal cell in a horizontal arrangement, i.e., hexagon-1. These results reveal that the melting rates of PCM in triangle-1, trapezoid-1, and rectangular cells are much higher than PCM in hexagonal and circular cells at the same aspect ratio in the range of AR from 0.5 to 1.2. Compared to the hexagonal cells, the melting rate of the circular cell is not high, especially at the high aspect ratio.
Considering the hexagonal cells with AR = 0.866 are the frequently used honeycomb cores, the influence of its orientation on the melting rate was also carefully compared as shown in Figure 13 and Table 3. It was found that the melting rate of PCM in the hexagonal cell in the vertical arrangement (hexagon-2) is smaller than that in the hexagonal cell in the horizontal arrangement (hexagon-1) at AR = 0.866. As the AR increases, the two different hexagonal cells show different trends of the melting rate at different Rayleigh numbers. At low Rayleigh numbers, the melting rate of both cells depends on their perimeters. Therefore, as the perimeters of these cells are comparatively large for both the large and small aspect ratio, the corresponding hexagonal cells require less melting time. As the Rayleigh number increases, the perimeter of the cell is not the only factor influencing the melting rate, since natural convection comes into play. Then, the variation of the aspect ratio could affect the height of the cell so that the effective Rayleigh number is different for different aspect ratios. Furthermore, the bottom heated area, which facilitates natural convection, is also an important factor influencing the melting rate. Therefore, the horizontal and vertical placed hexagonal cells show different melting rates as the variation of the AR. Specifically, the melting rate of hexagon-2 is higher than that of hexagon-1 at a high AR. On the contrary, hexagon-1 shows a higher melting rate at a low aspect ratio. The results fully illustrate that the orientation and aspect ratio of the cell could affect the melting rate greatly.
Figure 13 indicates that the melting rates of PCM in hexagonal cells are not the highest. The triangular, trapezoidal, and rectangular cells could sometimes supply a much higher melting ratio than that of hexagonal cells. The best choice is dependent on a specific size and placed orientation as well as its aspect ratio. Considering the requirement of compact installation, the triangle-1 vs. triangle-2 and trapezoid-1 vs. trapezoid-2 are always, respectively, combined together (see the schematic in Figure 4a). Hence, the lower melting rate plays a leading role in the whole melting rate of these compositional cells. Table 3 shows the time-saving ratios of five cells compared to the hexagon-1 cell. The time-saving ratio can guide us intuitively to know which geometrical cell supplies the highest melting rate at the same aspect ratio. Both Figure 13 and Table 3 show that the triangular or quadrangular cells can be a better choice in terms of the melting rate of PCM. For Ra = 3.095 × 10⁵, the highest time-saving ratio of compositional triangular cells is up 14.4% compared to the hexagon-1 cell. For Ra = 4.83 × 10⁶, the highest time-saving ratio [20] of the rectangular cell is up 14.0% compared to the hexagon-1 cell. As the Rayleigh number increases to 3.87 × 10⁷, the rectangular cell is the best choice and the highest time-saving ratio is as high as 20.0% compared to the hexagon-1 cell. Table 3 indicates that the aspect ratios of these cells with the maximum time-saving ratio are about 1.0 without considering the influence of its placed orientation because cells with AR = 1.0 are the most beneficial for the natural convection of liquid PCM.
Figure 14 shows the distribution of the geometrical factor (GF) of triangular, quadrangular, hexagonal, and circular cells with different aspect ratios. The definition of GF is as follows:
G F = A P ,
where A is the cross–sectional area per cell and P is the perimeter of the cell. For the cell with the same sectional areas, the cell with a larger perimeter has a smaller GF. A larger perimeter means that the PCM could absorb more heat from the hot boundary when the conduction dominates the heat transfer. In Figure 14, the GFs of the triangular, trapezoidal, and rectangular cells are always smaller than a hexagonal cell because the perimeters of the triangular, trapezoidal, and rectangular cells are larger than a hexagonal cell for the same sectional area. Figure 13 indicates that the melting times of PCM in the triangular-1, trapezoidal-1, and rectangular cell are generally less than hexagonal cells for different Rayleigh numbers. In association with Figure 14, it could be found that a greater amount of heat can be transferred to the PCM in the cell with smaller GF by conduction. At a small Rayleigh number (such as Ra = 3.095 × 10⁵), the thermal conduction dominates the heat transfer, and it is independent of the placed orientation of the cell. Therefore, the melting of PCM in the cell with a smaller GF is faster and less affected by its placed orientation at small Rayleigh numbers. However, the orientation of cells could greatly affect the melting of PCM when the natural convection dominates the heat transfer at high Rayleigh numbers, such as the case shown at Ra = 3.87 × 10⁷.

4. Conclusions

In this work, the constrained melting processes of paraffin in honeycomb core with different cells (triangle, trapezoid, rectangle, hexagon, and circle) were comprehensively studied. The melting of paraffin in triangular, trapezoidal, rectangular, and circular cells was compared to the hexagonal cell to find the optimal cell with the higher melting rate for a honeycomb core. In order to study the enhancement ratio of PCM melting in different cells comprehensively, three sectional areas were considered, which were 100, 625, and 2500 mm2, corresponding to three different Rayleigh numbers. For a given sectional area, the mass and the Rayleigh number of paraffin in different cells were the same. Then, the influences of geometrical factors, such as the shape, aspect ratio, and orientation of a non-hexagonal PCM cell, on the enhancement ratio compared to the hexagonal cell were carefully studied.
Firstly, it was found that the shape of the honeycomb cell affects the enhancement ratio of the melting rate of PCM greatly. PCM in cells with a smaller geometrical factor (GF) melts faster as the thermal conduction dominates the heat transfer at the low Rayleigh number. The GF of the hexagonal cell was always larger than other cells except for the circular cell (0.5 ≤ AR ≤ 1.2). Hence, the melting times of PCM in triangular and quadrilateral cells are less than hexagonal cells when the thermal conduction dominates. Secondly, the influence of the aspect ratio (AR) of the honeycomb cell on the melting rate of PCM was justified. Although the cell with AR = 0.5 can enhance the melting rate of PCM compared to itself, with AR = 1.0, the melting time-saving ratios of PCM in triangular and quadrilateral cells compared to the hexagonal cell decreased at a low aspect ratio. Thirdly, the same cell with different placed orientation results in different melting rates of PCM. For example, turning the hexagonal cell corner down saves the melting time up to 9.9%.
As a result, it was found that the hexagonal cell as the honeycomb core is not the optimum option in terms of the melting rate compared to triangular and quadrilateral cells. At the same aspect ratio, the maximum melting time-saving ratio of PCM in triangular cells varied from 14% to 20% compared to its hexagonal counterpart in the present range of Rayleigh numbers from 3.095 × 10⁵ to 3.87 × 10⁷.
It is noted that the solidification process of PCM in different cells is as important as the melting process. The present numerical model could be equally applied to the solidification process by the implementation of different initial and boundary conditions. Specifically, a cold boundary is necessary to extract the thermal energy in the discharge process from the liquid to solid phase. The geometrical influence on the melting process could be an important reference of the solidification process. However, the quantitative influence requires further numerical simulations. The results of this paper can provide a reference for engineers and researchers to choose the most appropriate and efficient cell filled with PCM during their design or study of honeycomb cores.

Author Contributions

Software, D.Y.; J.D. and Y.X. planned the study. J.D. performed all of the numerical simulations. All of the authors validated numerical results. J.D. proposed the paper organization and prepared the original paper. All of the authors revised and edited the final paper.

Funding

This work was funded by the National Natural Science Foundation of China grant number 11872187, 51779097 and the National Nature Science Foundation of Hubei province grant number 2018CFB461. And the APC was funded by the National Natural Science Foundation of China.

Acknowledgments

Thanks to SCTS/CGCL HPCC of HUST for providing computing resources and technical support.

Conflicts of Interest

The authors declare no conflict of interest.

Nomenclature

Cmushy zone constant [kg/m3·s]
Hyheight of the one honeycomb cell [m]
Wxwidth of the one honeycomb cell [m]
cpspecific heat [J/kg·K]
ppressure [N/m2]
ttime [s]
hsflatent heat [J/kg]
Ttemperature [K]
kthermal conductivity [W/m·K]
u, vvelocity in the x- and y-direction, respectively [m/s]
ggravitational acceleration [m/s2]
Qinstantaneous total heat transfer rate [J]
ARaspect ratio
GFgeometrical factor
Greek symbols
ρdensity [kg/m3]
μdynamic viscosity [kg/m·s]
αthermal diffusivity [m2/s]
βthermal expansion coefficient [1/K]
γliquid fraction of a calculated cell
εa small number, typically approximately 10−3
Subscripts
whot wall
ssolid
lliquid
mmelting

Appendix A

Appendix A.1 Melting Process in Cells with AR = 1.0

Figure A1 shows the contours of the liquid fraction with Ra = 4.83 × 10⁶ (A = 625 mm2) and Ra = 3.87 × 10⁷ (A = 2500 mm2) corresponding to Figure 5. At 150 s in Figure 5 580 s in Figure A1a, and 1500 s in Figure A1b, the influence of thermal convection is dominated because the solid–liquid interface is irregular and vortex flow structures have been formed. At 200 s in Figure 5, 770 s in Figure A1a, and 2000 s in Figure A1b, it shows that the melting rates are apparently different in different cells. As Rayleigh number increases, the PCM in triangle–1, trapezoid–1, and square cells melts faster than others.
Figure A1. Liquid fraction contours at an initial, intermediate, and final melting time in triangular, trapezoidal, square, hexagonal, and circular cells (AR = 1.0). (a) Ra = 4.83 × 10⁶ (A = 625 mm2); (b) Ra = 3.87 × 10⁷ (A = 2500 mm2).
Energies 12 02920 g0a1
Figure A2 shows the energy absorption rates of PCM in the triangular, trapezoidal, and square cells are greater than that in the hexagonal cells due to the larger melting rates at the same time. The PCM in the triangular, trapezoidal, and rectangular cells could absorb the maximum amount of energy in a shorter time than hexagonal and circular cells.
Figure A2. Temporal evolutions of the profiles of energy absorption in the triangular, trapezoidal, square, hexagonal, and circular cells (AR = 1.0) at (a) Ra = 3.095 × 10⁵; (b) Ra = 4.83 × 10⁶; (c) Ra = 3.87 × 10⁷.
Energies 12 02920 g0a2

Appendix A.2 Melting Process in Cells with AR = 0.5

Figure A3 shows the contours of the liquid fraction with Ra = 4.83 × 10⁶ (A = 625 mm2) and Ra = 3.87 × 10⁷ (A = 2500 mm2) corresponding to Figure 10.
Figure A3. Liquid fractions of the triangular, trapezoidal, rectangular, hexagonal, and circular cells with smaller aspect ratios (AR = 0.5). (a) Ra = 4.83 × 10⁶ (A = 625 mm2); (b) Ra = 3.87 × 10⁷ (A = 2500 mm2).
Energies 12 02920 g0a3
Figure A4 shows the increase of absorbed energy of PCM in cells with the smaller aspect ratio (AR = 0.5) compared to the larger aspect ratio (AR = 1.0). The increase of instantaneous energy absorption can be defined as follows:
Δ Q ( t ) = Q s m a l l e r _ A R ( t ) Q l a r g e r _ A R ( t ) .
Figure A4. Comparisons of the energy absorption increase between the cells with the smaller aspect ratio (AR = 0.5) and those with the larger aspect ratio (AR = 1.0). (a) Ra = 3.095 × 10⁵; (b) Ra = 4.83 × 10⁶; (c) Ra = 3.87 × 10⁷.
Energies 12 02920 g0a4

References

  1. Arnault, A.; Mathieu-Potvin, F.; Gosselin, L. Internal surfaces including phase change materials for passive optimal shift of solar heat gain. Int. J. Therm. Sci. 2010, 49, 2148–2156. [Google Scholar] [CrossRef]
  2. Jiang, F.; Wang, X.; Zhang, Y.P. A new method to estimate optimal phase change material characteristics in a passive solar room. Energy Convers. Manag. 2011, 52, 2437–2441. [Google Scholar] [CrossRef]
  3. Sun, X.Q.; Zhang, Q.; Medina, M.A.; Lee, K.O. Energy and economic analysis of a building enclosure outfitted with a phase change material board (PCMB). Energy Convers. Manag. 2014, 83, 73–78. [Google Scholar] [CrossRef]
  4. Ye, H.; Long, L.S.; Zhang, H.T.; Zou, R.Q. The performance evaluation of shape-stabilized phase change materials in building applications using energy saving index. Appl. Energy 2014, 113, 1118–1126. [Google Scholar] [CrossRef]
  5. Mazzeo, D.; Oliveti, G.; Arcuri, N. Definition of a new set of parameters for the dynamic thermal characterization of PCM layers in the presence of one or more liquid-solid interfaces. Energy Build. 2017, 141, 379–396. [Google Scholar] [CrossRef]
  6. Mazzeo, D.; Oliveti, G.; Gracia, A.; Coma, J.; Sole, A.; Cabeza, L.F. Experimental validation of the exact analytical solution to the steady periodic heat transfer problem in a PCM layer. Energy 2017, 140, 1131–1147. [Google Scholar] [CrossRef] [Green Version]
  7. Mazzeo, D.; Oliveti, G. Thermal field and heat storage in a cyclic phase change process caused by several moving melting and solidification interfaces in the layer. Int. J. Therm. Sci. 2018, 129, 462–488. [Google Scholar] [CrossRef]
  8. Erlbeck, L.; Schreiner, P.; Schlachter, K.; Dörnhofer, P.; Fasel, F.; Methner, F.J.; Rädle, M. Adjustment of thermal behavior by changing the shape of PCM inclusions in concrete blocks. Energy Convers. Manag. 2018, 158, 256–265. [Google Scholar] [CrossRef]
  9. Dardir, M.; Panchabikesan, K.; Haghighat, F.; Mankibi, M.E.; Yuan, Y.P. Opportunities and challenges of PCM-to-air heat exchangers (PAHXs) for building free cooling applications—A comprehensive review. J. Energy Storage 2019, 22, 157–175. [Google Scholar] [CrossRef]
  10. Zhao, C.Y.; Wu, Z.G. Heat transfer enhancement of high temperature thermal energy storage using metal foams and expanded graphite. Sol. Energy Mater. Sol. Cells 2011, 95, 636–643. [Google Scholar] [CrossRef]
  11. Esapour, M.; Hamzehnezhad, A.; Darzi, A.A.R.; Jourabian, M. Melting and solidification of PCM embedded in porous metal foam in horizontal multi-tube heat storage system. Energy Convers. Manag. 2018, 171, 398–410. [Google Scholar] [CrossRef]
  12. Wang, G.; Wei, G.S.; Xu, C.; Ju, X.; Yang, Y.P.; Du, X.Z. Numerical simulation of effective thermal conductivity and pore-scale melting process of PCMs in foam metals. Appl. Therm. Eng. 2019, 147, 464–472. [Google Scholar] [CrossRef]
  13. Hu, X.; Patnaik, S.S. Modeling phase change material in micro-foam under constant temperature condition. Int. J. Heat Mass Transf. 2014, 68, 677–682. [Google Scholar] [CrossRef]
  14. Sidik, N.A.C.; Kean, T.H.; Chow, H.K.; Rajaandra, A.; Rahman, S.; Kaur, J. Performance enhancement of cold thermal energy storage system using nanofluid phase change materials: A review. Int. Commun. Heat Mass Transf. 2018, 94, 85–95. [Google Scholar] [CrossRef]
  15. Ebadi, S.; Tasnim, S.H.; Aliabadi, A.A.; Mahmud, S. Melting of nano–PCM inside a cylindrical thermal energy storage system: Numerical study with experimental verification. Energy Convers. Manag. 2018, 166, 241–259. [Google Scholar] [CrossRef]
  16. Farsani, R.Y.; Raisi, A.; Nadooshan, A.A.; Vanapalli, S. Does nanoparticles dispersed in a phase change material improve melting characteristics? Int. Commun. Heat Mass Transf. 2017, 89, 219–229. [Google Scholar] [CrossRef]
  17. Kamkari, B.; Shokouhmand, H. Experimental investigation of phase change material melting in rectangular enclosures with horizontal partial fins. Int. J. Heat Mass Transf. 2014, 78, 839–851. [Google Scholar] [CrossRef]
  18. Abdulateef, A.M.; Abdulateef, J.; Mat, S.; Sopian, K.; Elhub, B.; Mussa, M.A. Experimental and numerical study of solidifying phase-change material in a triplex–tube heat exchanger with longitudinal/triangular fins. Int. Commun. Heat Mass Transf. 2018, 90, 73–84. [Google Scholar] [CrossRef]
  19. Mahdi, J.M.; Lohrasbi, S.; Ganji, D.D.; Nsofor, E.C. Accelerated melting of PCM in energy storage systems via novel configuration of fins in the triplex-tube heat exchanger. Int. J. Heat Mass Transf. 2018, 124, 663–676. [Google Scholar] [CrossRef]
  20. Ji, C.Z.; Qin, Z.; Dubey, S.; Choo, F.H.; Duan, F. Simulation on PCM melting enhancement with double-fin length arrangements in a rectangular enclosure induced by natural convection. Int. J. Heat Mass Transf. 2018, 127, 255–265. [Google Scholar] [CrossRef]
  21. Xie, J.L.; Lee, H.M.; Xiang, J.H. Numerical study of thermally optimized metal structures in a Phase Change Material (PCM) enclosure. Appl. Therm. Eng. 2019, 148, 825–837. [Google Scholar] [CrossRef]
  22. Li, Y.; Guo, B.; Huang, G.F.; Kubo, S.C.; Shu, P.C. Characterization and thermal performance of nitrate mixture/SiC ceramic honeycomb composite phase change materials for thermal energy storage. Appl. Therm. Eng. 2015, 81, 193–197. [Google Scholar] [CrossRef]
  23. Egolf, P.W.; Amacker, N.; Gottschalk, G.; Courret, G.; Noume, A.; Hutter, K. A translucent honeycomb solar collector and thermal storage module for building façades. Int. J. Heat Mass Transf. 2018, 127, 781–795. [Google Scholar] [CrossRef]
  24. Hasse, C.; Grenet, M.; Bontemps, A.; Dendievel, R.; Sallee, H. Realization, test and modeling of honeycomb wallboards containing a phase change material. Energy Build. 2011, 43, 232–238. [Google Scholar] [CrossRef]
  25. Liu, Z.X.; Yu, Z.; Yang, T.T.; Qin, D.; Li, S.S.; Zhang, G.Q.; Haghighat, F.; Joybari, M.M. A review on macro-encapsulated phase change material for building envelope applications. Build. Environ. 2018, 144, 281–294. [Google Scholar] [CrossRef]
  26. Xie, B.; Cheng, W.L.; Xu, Z.M. Studies on the effect of shape-stabilized PCM filled aluminum honeycomb composite material on thermal control. Int. J. Heat Mass Transf. 2015, 91, 135–143. [Google Scholar] [CrossRef]
  27. Li, J.H.; Huang, J.H.; Cao, M. Properties enhancement of phase-change materials via silica and Al honeycomb panels for the thermal management of LiFeO4 batteries. Appl. Therm. Eng. 2018, 131, 660–668. [Google Scholar] [CrossRef]
  28. Lai, C.; Hokoi, S. Thermal performance of an aluminum honeycomb wallboard incorporating microencapsulated PCM. Energy Build. 2014, 73, 37–47. [Google Scholar] [CrossRef]
  29. Abuşka, M.; Şevik, S.; Kayapunar, A. A comparative investigation of the effect of honeycomb core on the latent heat storage with PCM in solar air heater. Appl. Therm. Eng. 2019, 148, 684–693. [Google Scholar] [CrossRef]
  30. Raj, A.K.; Srinivas, M.; Jayaraj, S. A cost-effective method to improve the performance of solar air heaters using discrete macro-encapsulated PCM capsules for drying applications. Appl. Therm. Eng. 2019, 146, 910–920. [Google Scholar] [CrossRef]
  31. Dhaidan, N.S.; Khodadadi, J.M. Melting and convection of phase change materials in different shape containers: A review. Renew. Sustain. Energy Rev. 2015, 43, 449–477. [Google Scholar] [CrossRef] [Green Version]
  32. Belessiotis, G.V.; Papadokostaki, K.G.; Favvas, E.P.; Efthimiadou, E.K.; Karellas, S. Preparation and investigation of distinct and shape stable paraffin/SiO2 composite PCM nanospheres. Energy Convers. Manag. 2018, 168, 382–394. [Google Scholar] [CrossRef]
  33. Kahwaji, S.; Johnson, M.B.; Kheirabadi, A.C.; Groulx, D.; White, M.A. A comprehensive study of properties of paraffin phase change materials for solar thermal energy storage and thermal management applications. Energy 2018, 162, 1169–1182. [Google Scholar] [CrossRef]
  34. Farzanehnia, A.; Khatibi, M.; Sardarabadi, M.; Passandideh-Fard, M. Experimental investigation of multiwall carbon nanotube/paraffin based heat sink for electronic device thermal management. Energy Convers. Manag. 2019, 179, 314–325. [Google Scholar] [CrossRef]
  35. Tan, F.L. Constrained and unconstrained melting inside a sphere. Int. Commun. Heat Mass Transf. 2008, 35, 466–475. [Google Scholar] [CrossRef]
  36. Brent, A.D.; Voller, V.R.; Reid, K.J. Enthalpy-porosity technique for modeling convection-diffusion phase change: Application to the melting of a pure metal. Numer. Heat Transf. 1988, 13, 297–318. [Google Scholar] [CrossRef]
  37. Hong, Y.X.; Ye, W.B.; Du, J.; Huang, S.M. Solid-liquid phase-change thermal storage and release behaviors in a rectangular cavity under the impacts of mushy region and low gravity. Int. J. Heat Mass Transf. 2019, 130, 1120–1132. [Google Scholar] [CrossRef]
  38. Wu, Z.G.; Sheng, W.C.; Tao, W.Q.; Li, Z. A novel experimental–numerical method for studying the thermal behaviors of phase change material in a porous cavity. Sol. Energy 2018, 169, 325–334. [Google Scholar] [CrossRef]
  39. Kakac, S.; Aung, W.; Viskanta, R. (Eds.) Natural Convection: Fundamentals and Applications; Hemisphere: Washington, DC, USA, 1985. [Google Scholar]
  40. Wesseling, P. Principles of Computational Fluid Dynamics; Springer: Berlin, Germany, 2001. [Google Scholar]
  41. Kamkaria, B.; Amlashi, H.J. Numerical simulation and experimental verification of constrained melting of phase change material in inclined rectangular enclosures. Int. Commun. Heat Mass Transf. 2017, 88, 211–219. [Google Scholar] [CrossRef]
Figure 1. Schematics of the triangular, trapezoidal, rectangular, hexagonal, and circular cells.
Energies 12 02920 g001
Figure 2. Grid and time step independency analysis: (a) grid independence study with a time step of 0.1 s; (b) time step independence study with a grid number of 12,321.
Energies 12 02920 g002
Figure 3. Validation of the present numerical model with the numerical and experimental data reported by Wu et al. [38]: (a) liquid fraction; (b) temperature profiles of T3 (x = 5 cm, y = 2.5 cm) and T5 (x = 2.5 cm, y = 5 cm).
Energies 12 02920 g003
Figure 4. (a) Sketch of 2D cross-sections of triangular, trapezoidal, square, and hexagonal cells and (b) liquid fractions of the triangular, trapezoidal, square, and hexagonal honeycomb cores.
Energies 12 02920 g004
Figure 5. Liquid fraction contours at an initial, intermediate, and final melting time in triangular, trapezoidal, square, hexagonal, and circular cells (AR = 1.0) at Ra = 3.095 × 10⁵ (A = 100 mm2).
Energies 12 02920 g005
Figure 6. Temporal evolutions of the profiles of liquid fraction in the triangular, trapezoidal, square, hexagonal, and circular cells (AR = 1.0) at (a) Ra = 3.095 × 10⁵; (b) Ra = 4.83 × 10⁶; (c) Ra = 3.87 × 10⁷.
Energies 12 02920 g006
Figure 7. Instantaneous enhancement ratios of liquid fraction in the triangular, trapezoidal, square, hexagonal, and circular cells (AR = 1.0) at (a) Ra = 3.095 × 10⁵; (b) Ra = 4.83 × 10⁶; (c) Ra = 3.87 × 10⁷.
Energies 12 02920 g007
Figure 8. Instantaneous enhancement ratios of energy absorption in the triangular, trapezoidal, square, hexagonal, and circular cells (AR = 1.0) at (a) Ra = 3.095 × 10⁵; (b) Ra = 4.83 × 10⁶; (c) Ra = 3.87 × 10⁷.
Energies 12 02920 g008
Figure 9. Liquid fractions of the triangular, trapezoidal, rectangular, hexagonal, and circular cells with smaller aspect ratios (AR = 0.5) at Ra = 3.095 × 10⁵ (A = 100 mm2).
Energies 12 02920 g009
Figure 10. Comparisons of the liquid fraction increase between the cells with the smaller aspect ratio (AR = 0.5) and those with the larger aspect ratio (AR = 1.0). (a) Ra = 3.095 × 10⁵; (b) Ra = 4.83 × 10⁶; (c) Ra = 3.87 × 10⁷.
Energies 12 02920 g010
Figure 11. Instantaneous enhancement ratios of the liquid fraction in the triangular, trapezoidal, square, hexagonal, and circular cells (AR = 0.5) (a) Ra = 3.095 × 10⁵; (b) Ra = 4.83 × 10⁶; (c) Ra = 3.87 × 10⁷.
Energies 12 02920 g011
Figure 12. Enhancement ratios of energy absorption in the triangular, trapezoidal, square, hexagonal, and circular cells over time (AR = 0.5). (a) Ra = 3.095 × 10⁵; (b) Ra = 4.83 × 10⁶; (c) Ra = 3.87 × 10⁷.
Energies 12 02920 g012
Figure 13. Comparisons of the melting times of the paraffin in the triangular, trapezoidal, rectangular, hexagonal, and circular cells with AR = 0.5, 0.866, 1.0, and 1.2. (a) Ra = 3.095 × 10⁵; (b) Ra = 4.83 × 10⁶; (c) Ra = 3.87 × 10⁷.
Energies 12 02920 g013
Figure 14. The geometrical factors of triangular, trapezoidal, rectangular, hexagonal, and circular cells at different aspect ratios.
Energies 12 02920 g014
Table 1. The characteristic angles of different cells with AR = 0.5, 0.866, 1.0, and 1.2.
CellsAR = 0.5AR = 0.866AR = 1.0AR = 1.2
Triangle45°60°63.43°67.38°
Trapezoid60°60°60°60°
Rectangle90°90°90°90°
Hexagon120°120°120°120°
Circle----
Table 2. Thermophysical properties of pure paraffin [38] and aluminum.
ParametersSymbolParaffinAluminum
Solidus/liquidus density [kg/m3]ρs/ρl980/9802719
Specific heat capacity [J/kg·K]cp3400871
Thermal conductivity [W/m·K]k0.2202.4
Dynamic viscosity [kg/m·s]μ0.006-
Thermal expansion coefficient [1/K]β3.85 × 10−4-
Latent heat [J/kg]hsf224,000-
Solidus/liquidus temperature [K]Ts/Tl323/323-
Table 3. The time-saving ratios of the cells with different aspect ratios (★ represents the maximum value, Tri, T, Rec, Hex, and Cir are abbreviated forms of triangular, trapezoidal, rectangular, hexagonal, and circular cells, respectively).
CellRa = 3.095 × 10⁵Ra = 4.83 × 10⁶Ra = 3.87 × 10⁷
0.50.8661.01.20.50.8661.01.20.50.8661.01.2
Tri-14.5%10.8%15.2%13.0%7.7%15.2%17.8%17.5%13.9%18.4%19.0%18.3%
Tri-21.3%10.4%14.4%13.4%−14.7%2.7%7.3%12.5%−20.3%0.3%4.9%9.4%
T-18.5%10.4%14.4%10.5%8.5%14.1%16.8%18.5%11.3%16.9%18.3%20.0%
T-24.5%10.4%7.0%10.5%4.3%2.7%2.4%3.0%2.4%0.4%0.5%0.1%
Rec2.2%8.0%11.3%8.5%9.6%10.0%14.0%12.5%13.2%14.1%20.0%15.5%
Hex-1------------
Hex-2−4.5%−5.6%−1.2%−2.8%−12.2%−0.2%4.9%9.9%−13.7%−2.4%1.9%5.5%
Cir−2.7%−12.0%−2.7%−10.1%0.5%−2.2%−1.1%−1.5%1.3%−2.1%−3.6%−4.1%

