Impact of Tail Water Fluctuation on Turbine Start-Up and Optimized Regulation


Abstract
1. Introduction
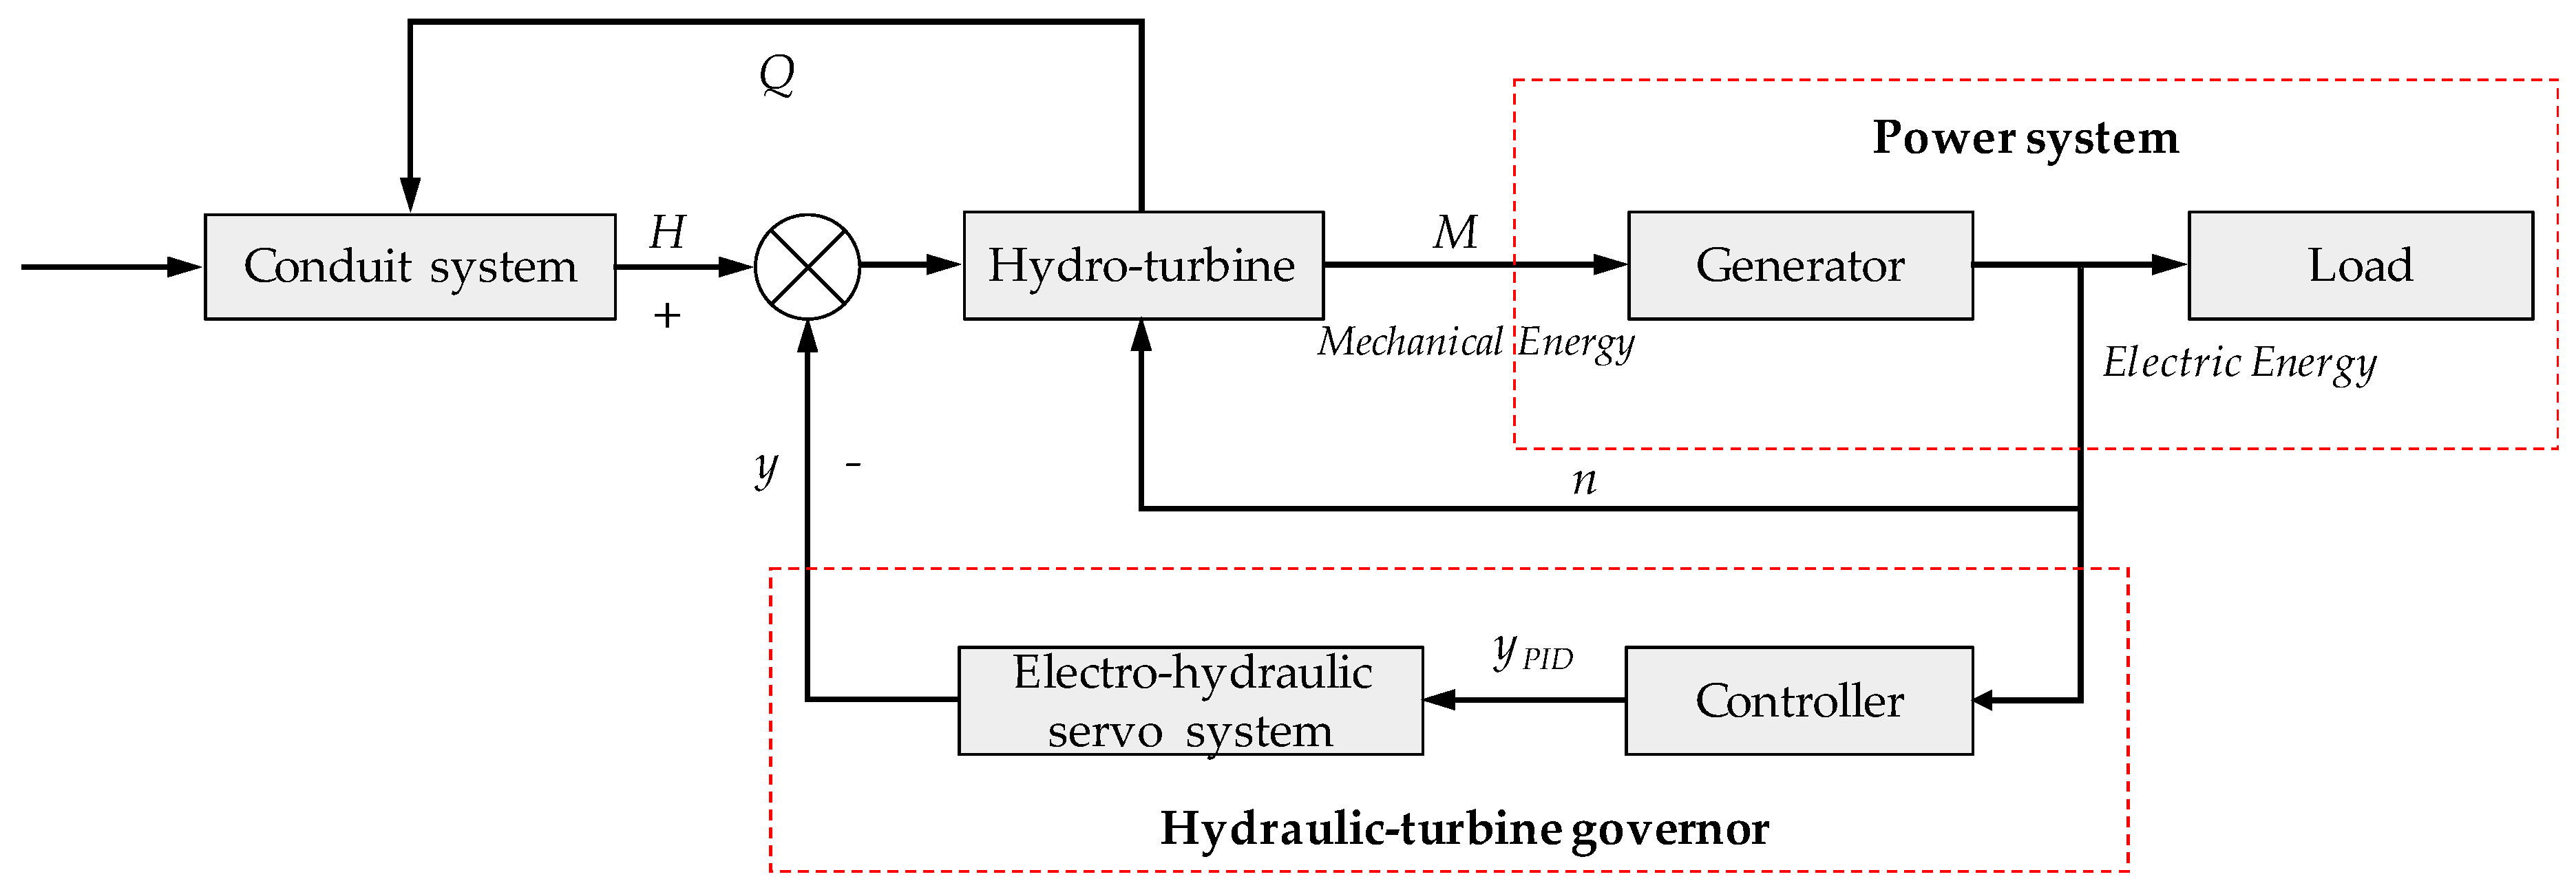
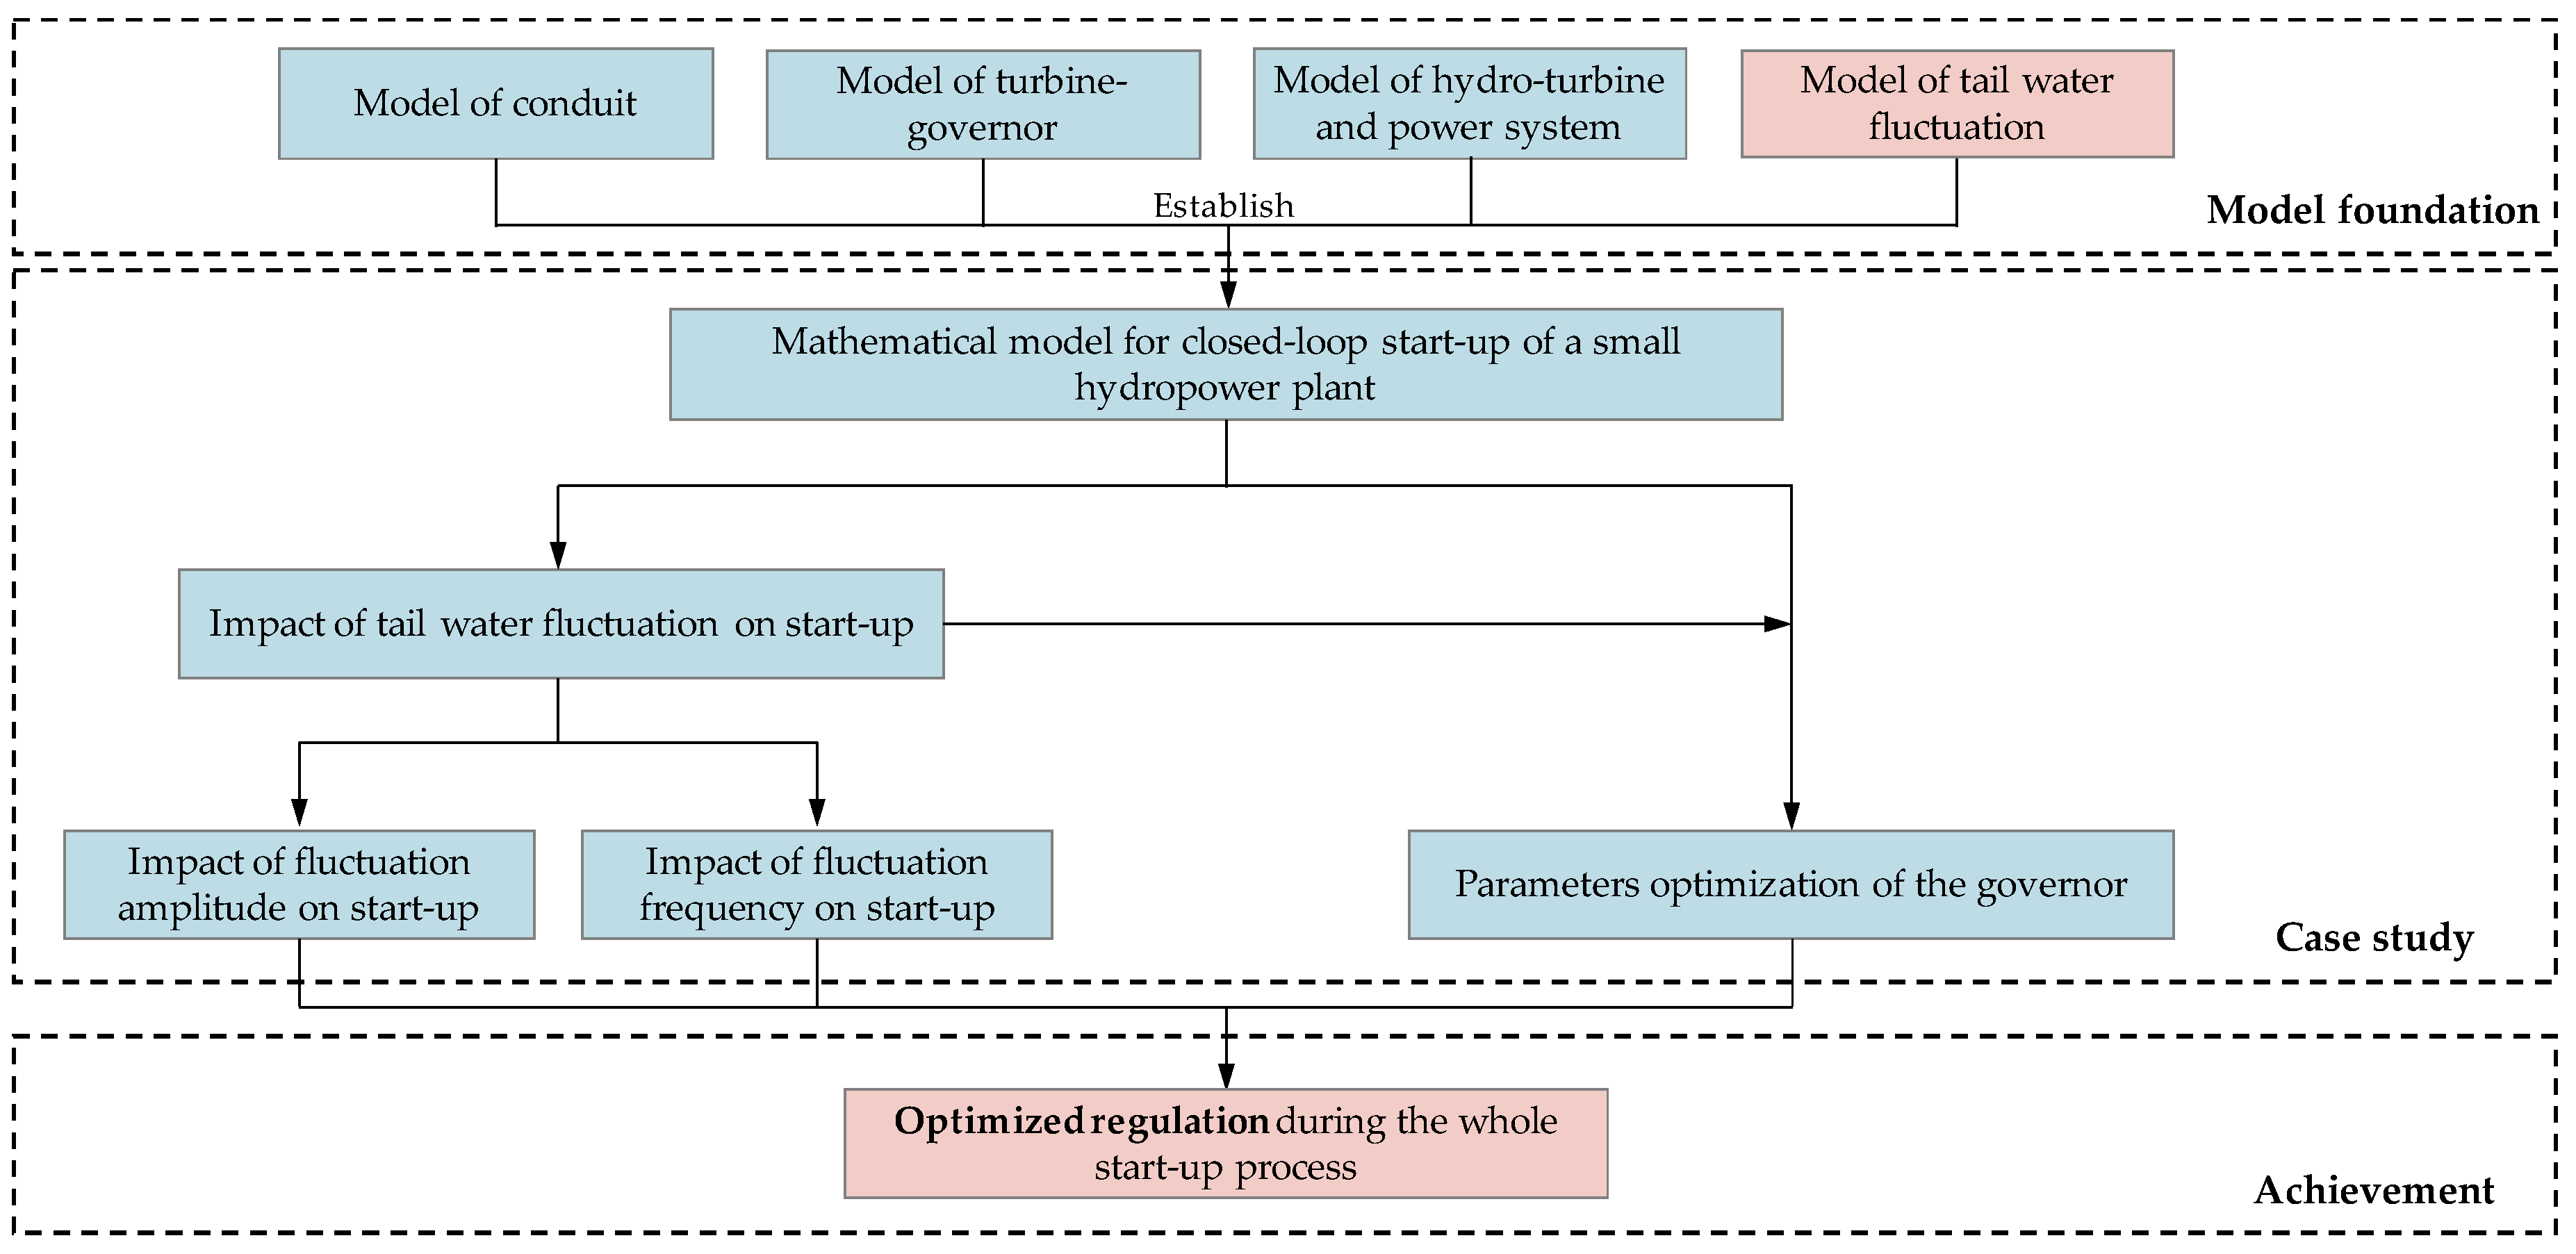
2. Mathematic Model
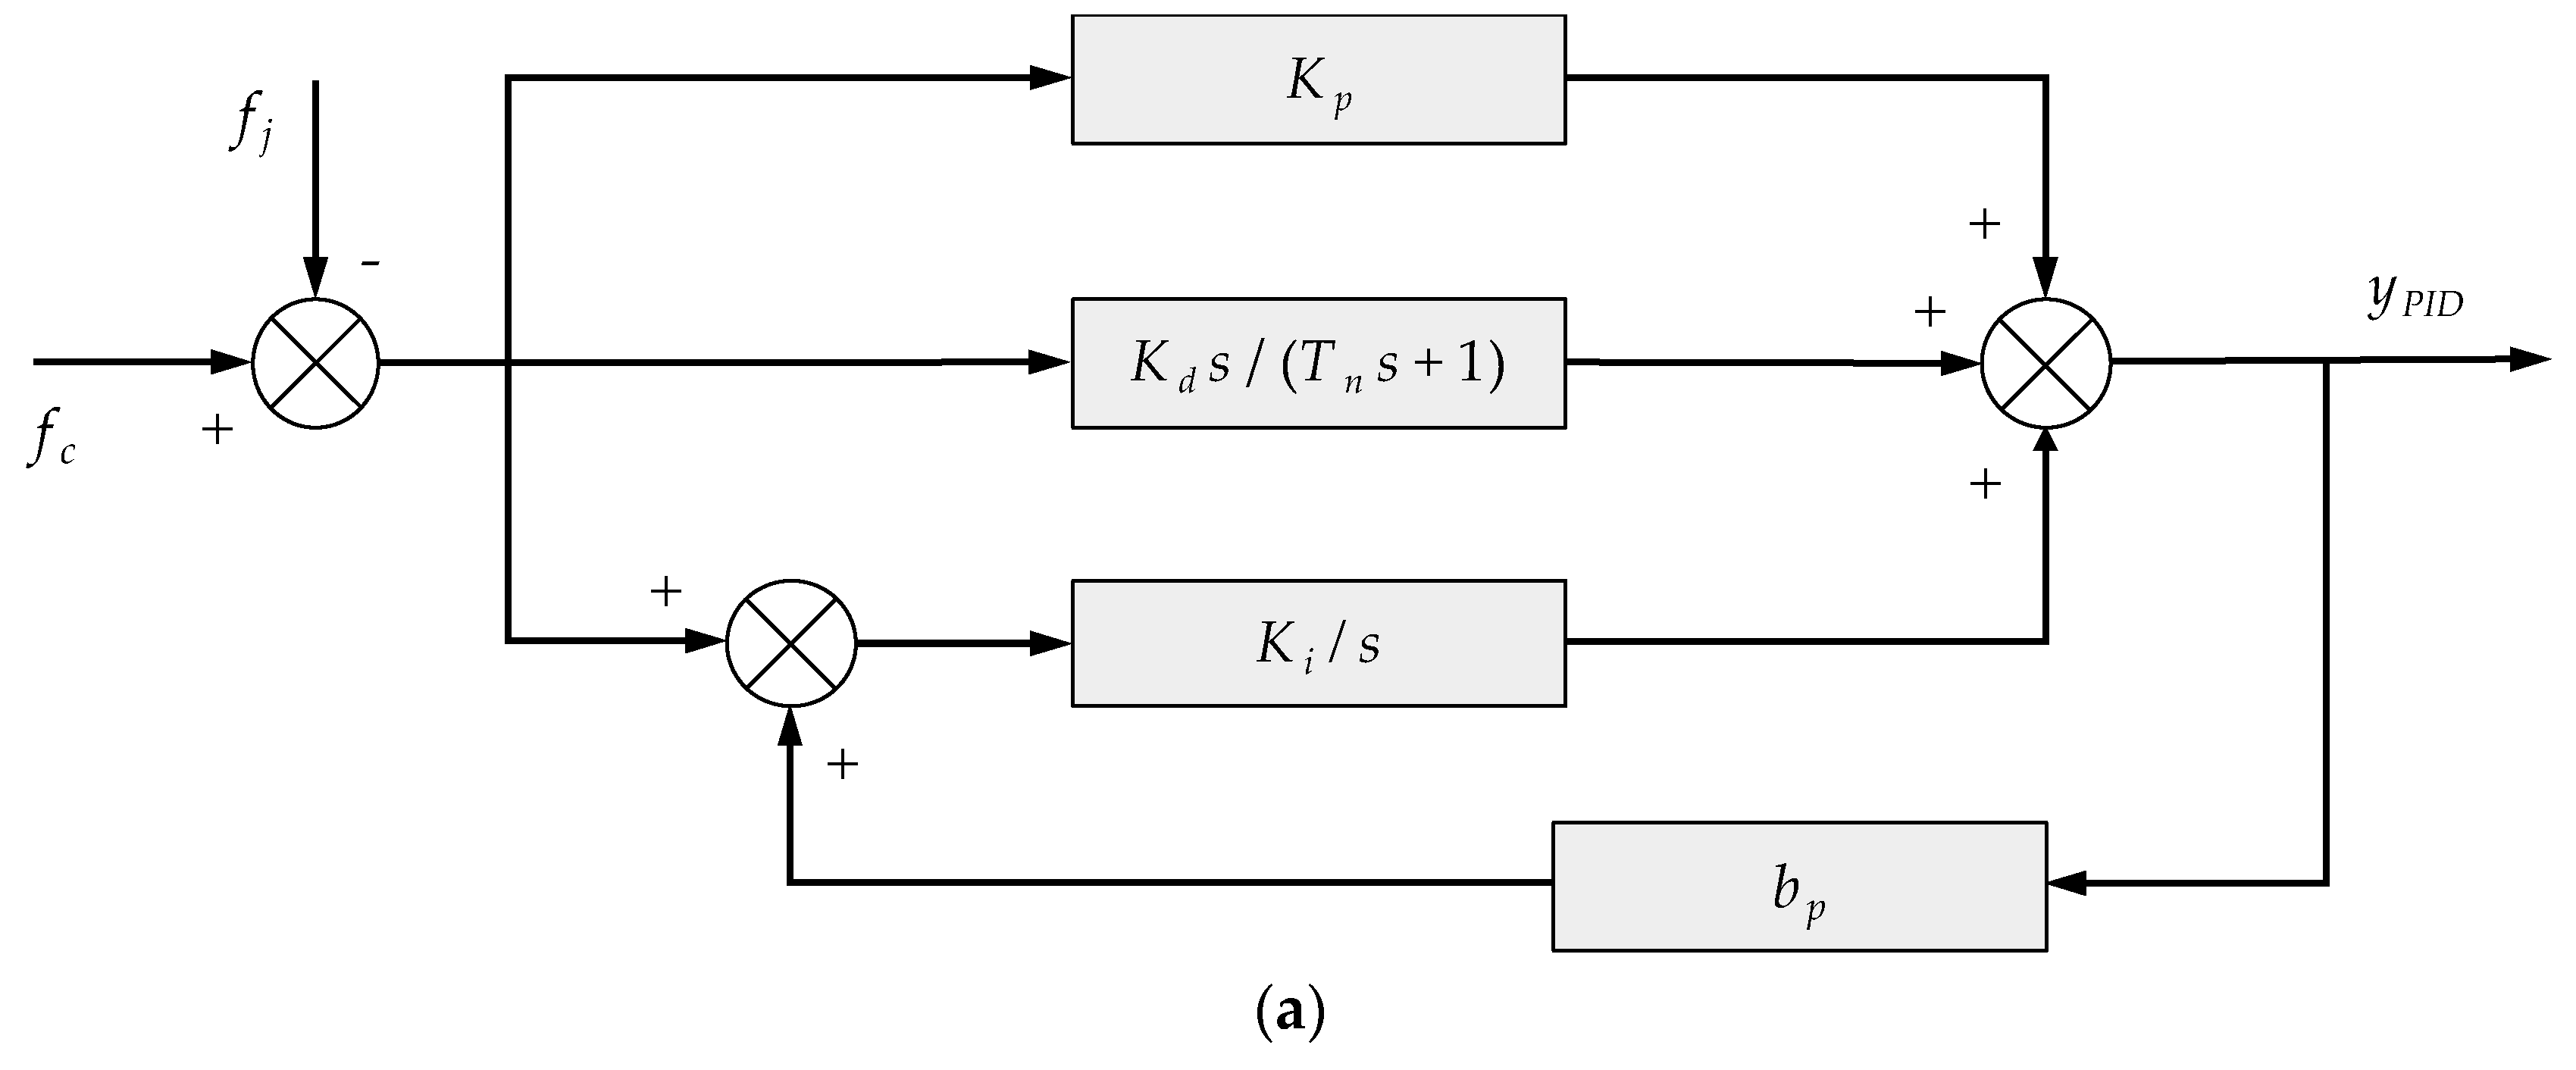
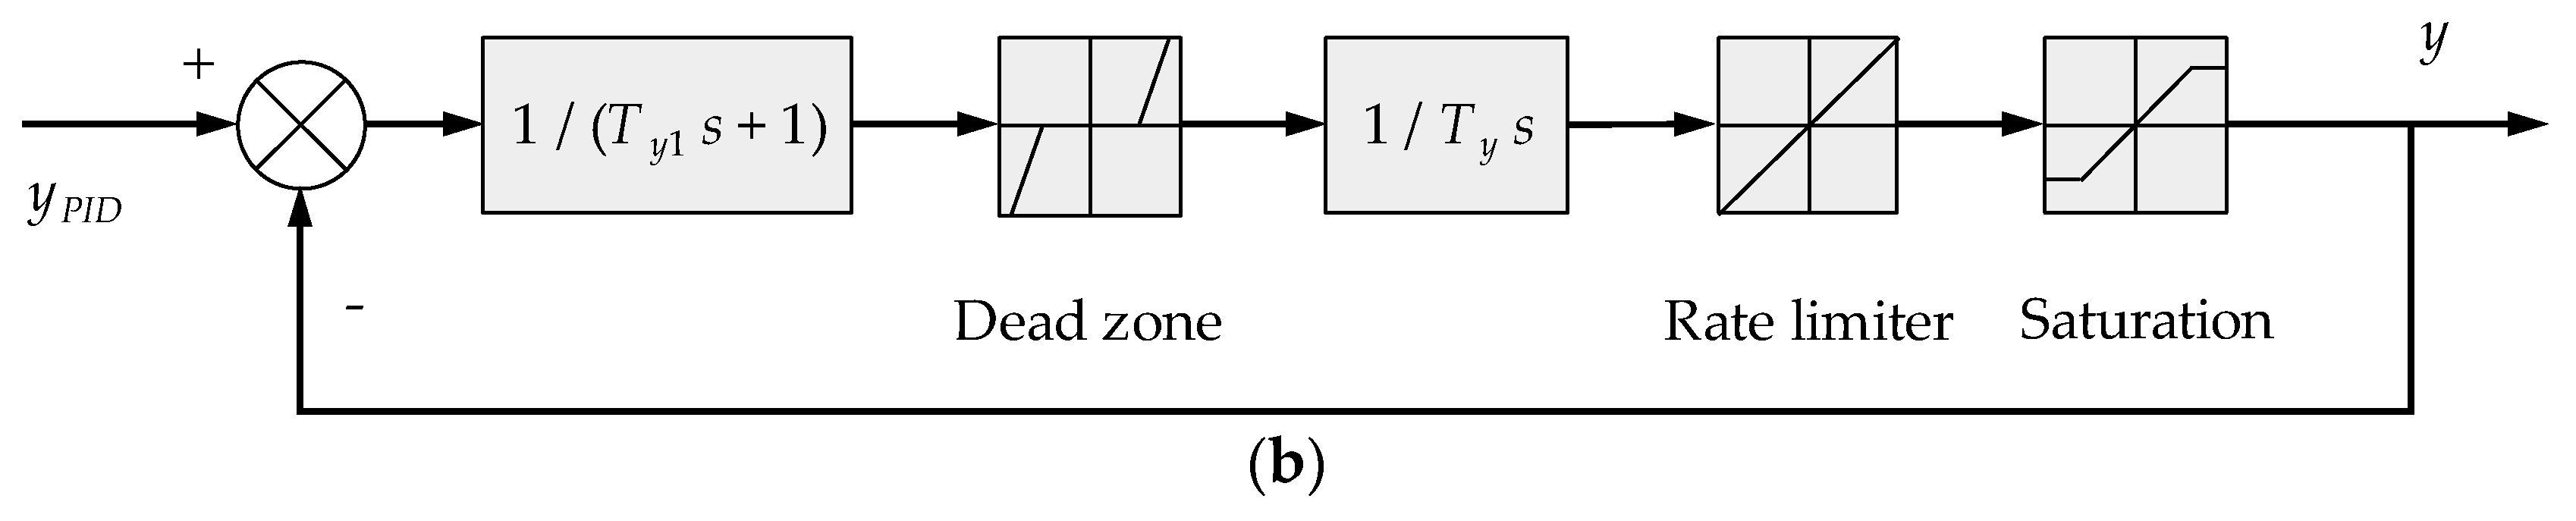
2.1. Model of Turbine Governor
2.2. Model of Hydro-Turbine and Power System
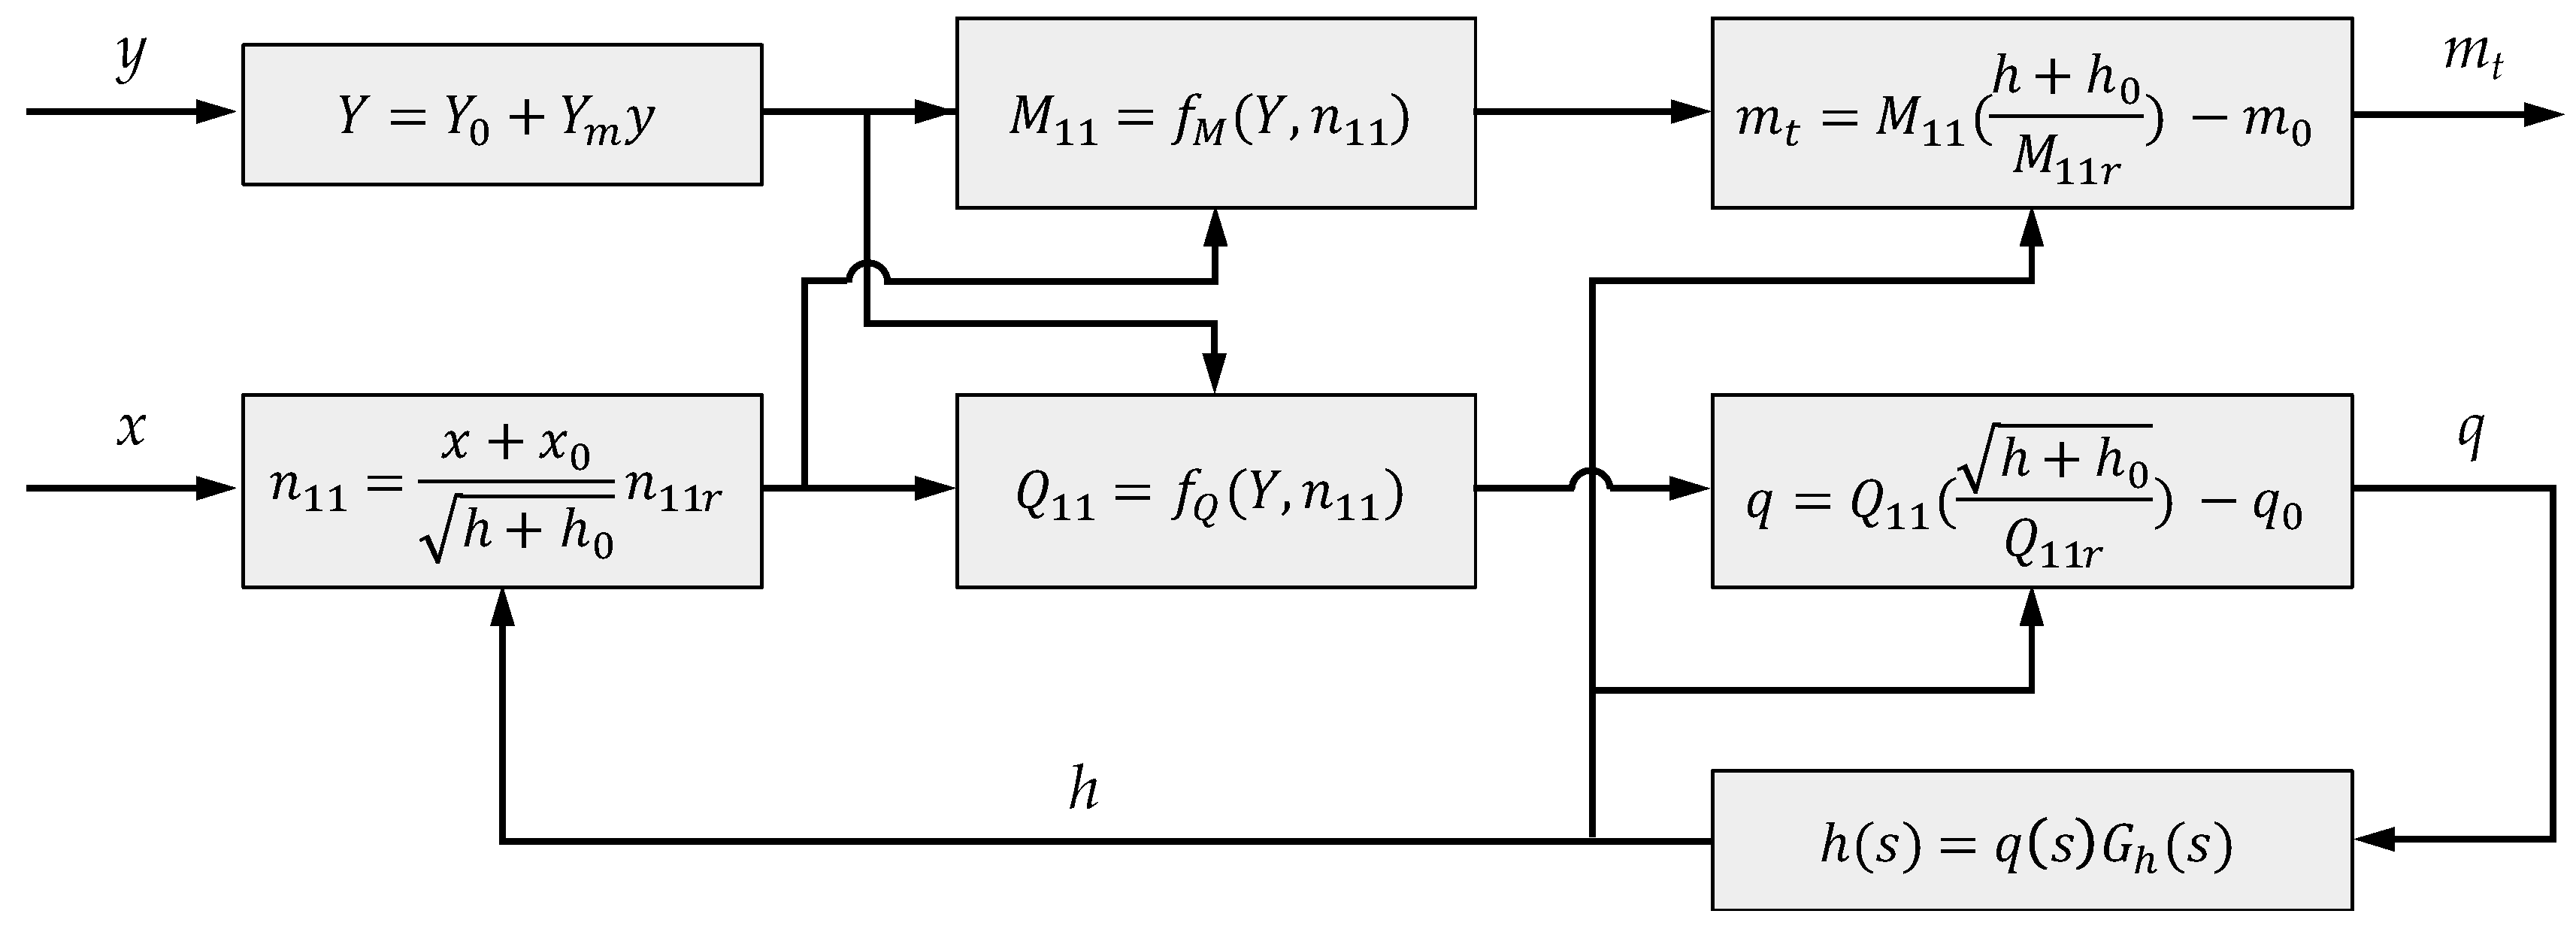
2.2.1. Hydro-Turbine
2.2.2. Power System
2.3. Model of Conduit System
2.4. Model of Tail Water Fluctuation
3. Start-Up Strategy and Multi-Objective Optimization
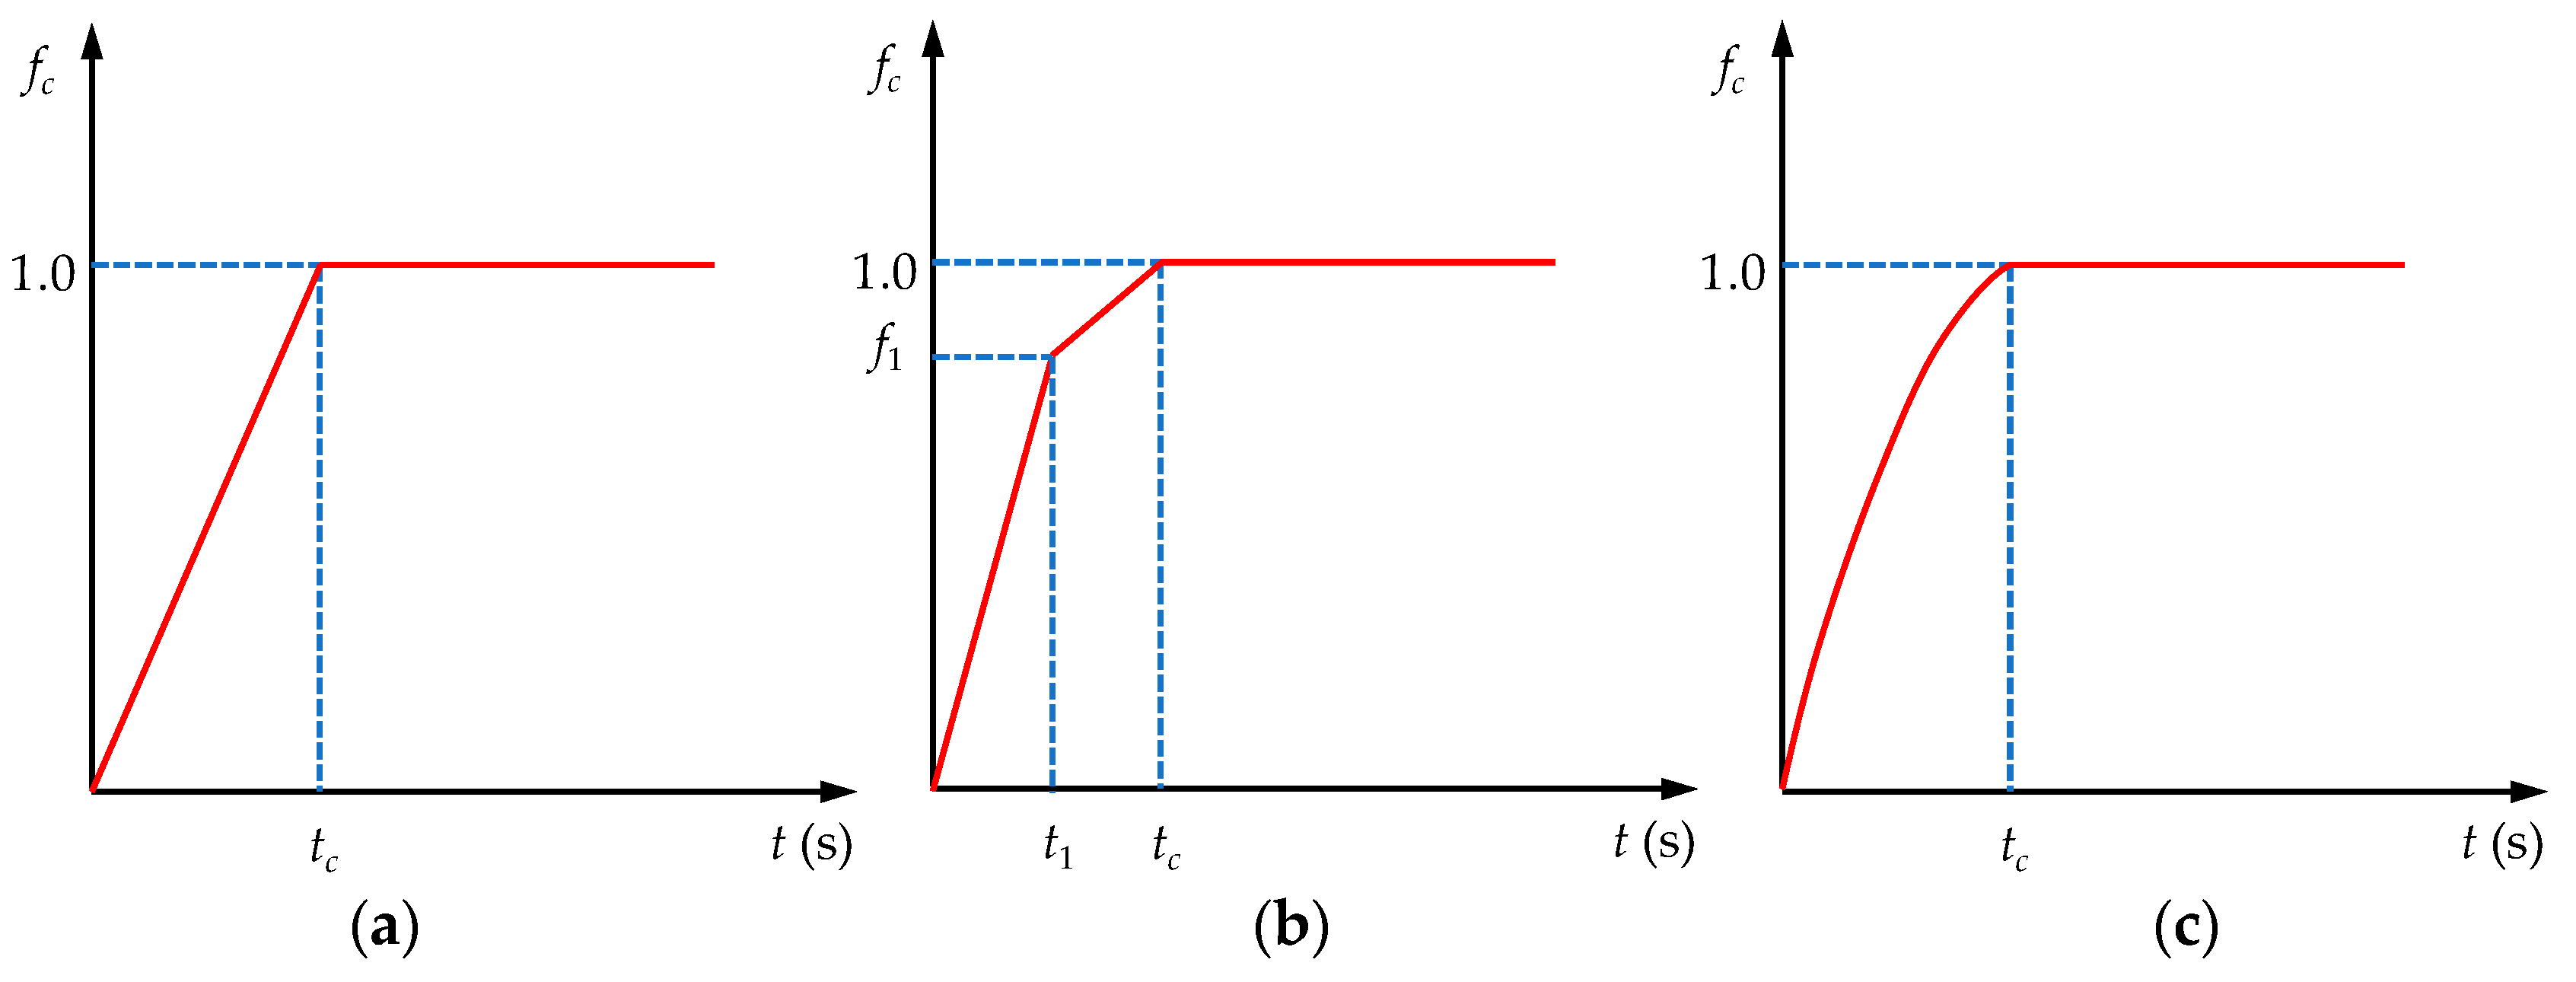
3.1. Start-Up Strategy
3.2. Multi-Objective Optimization
4. Case Study and Results
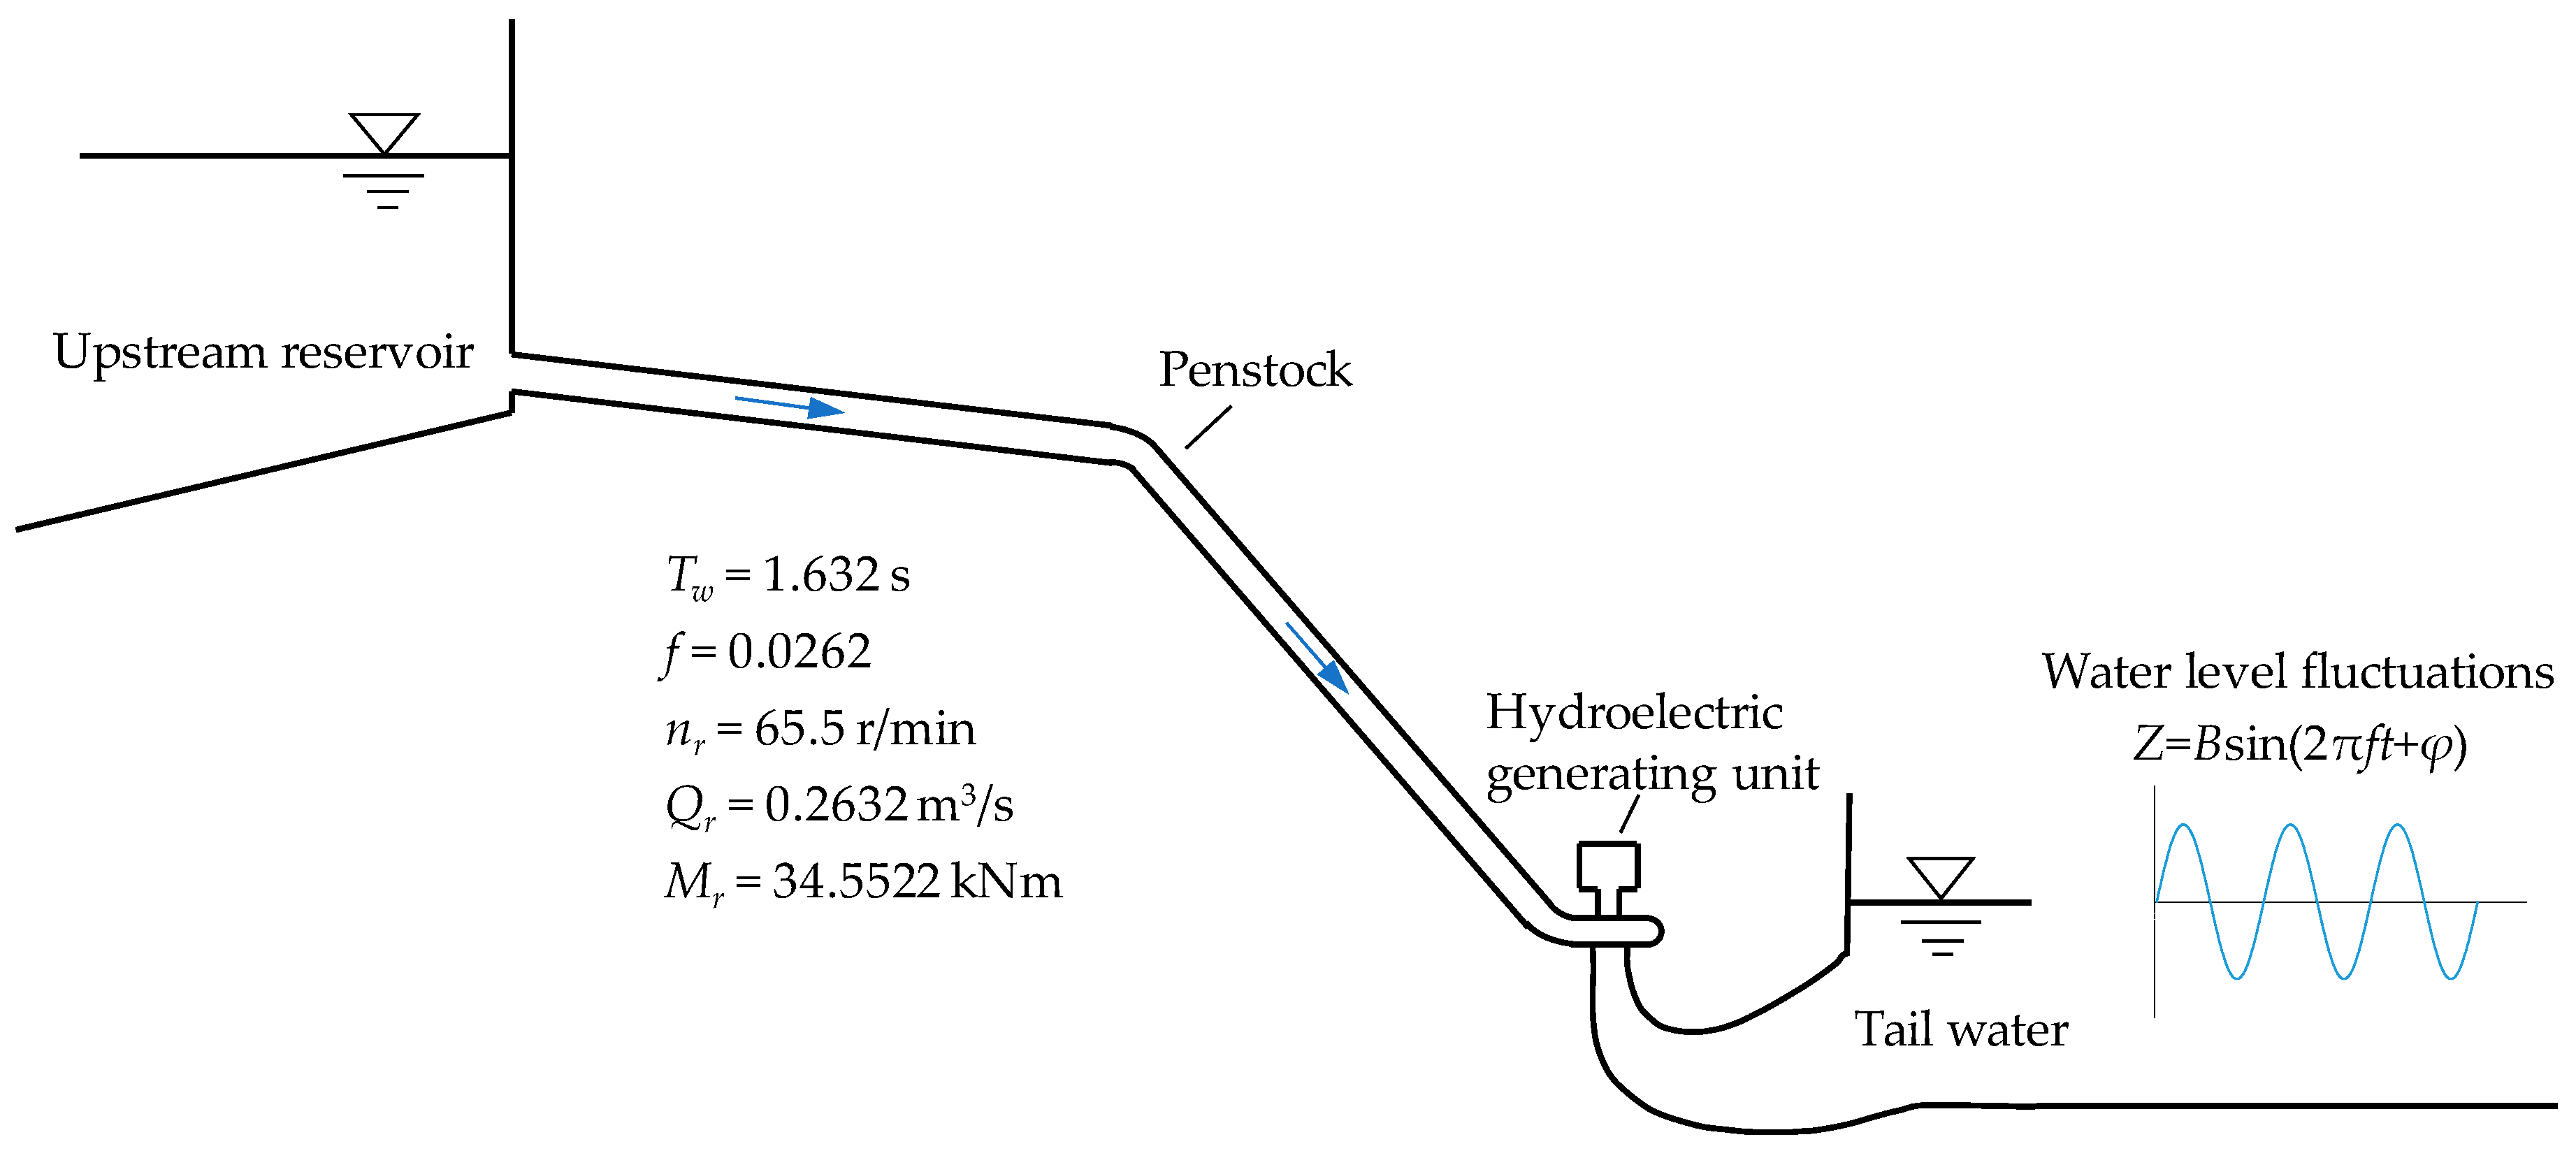
4.1. Case Study
4.2. Results and Analysis
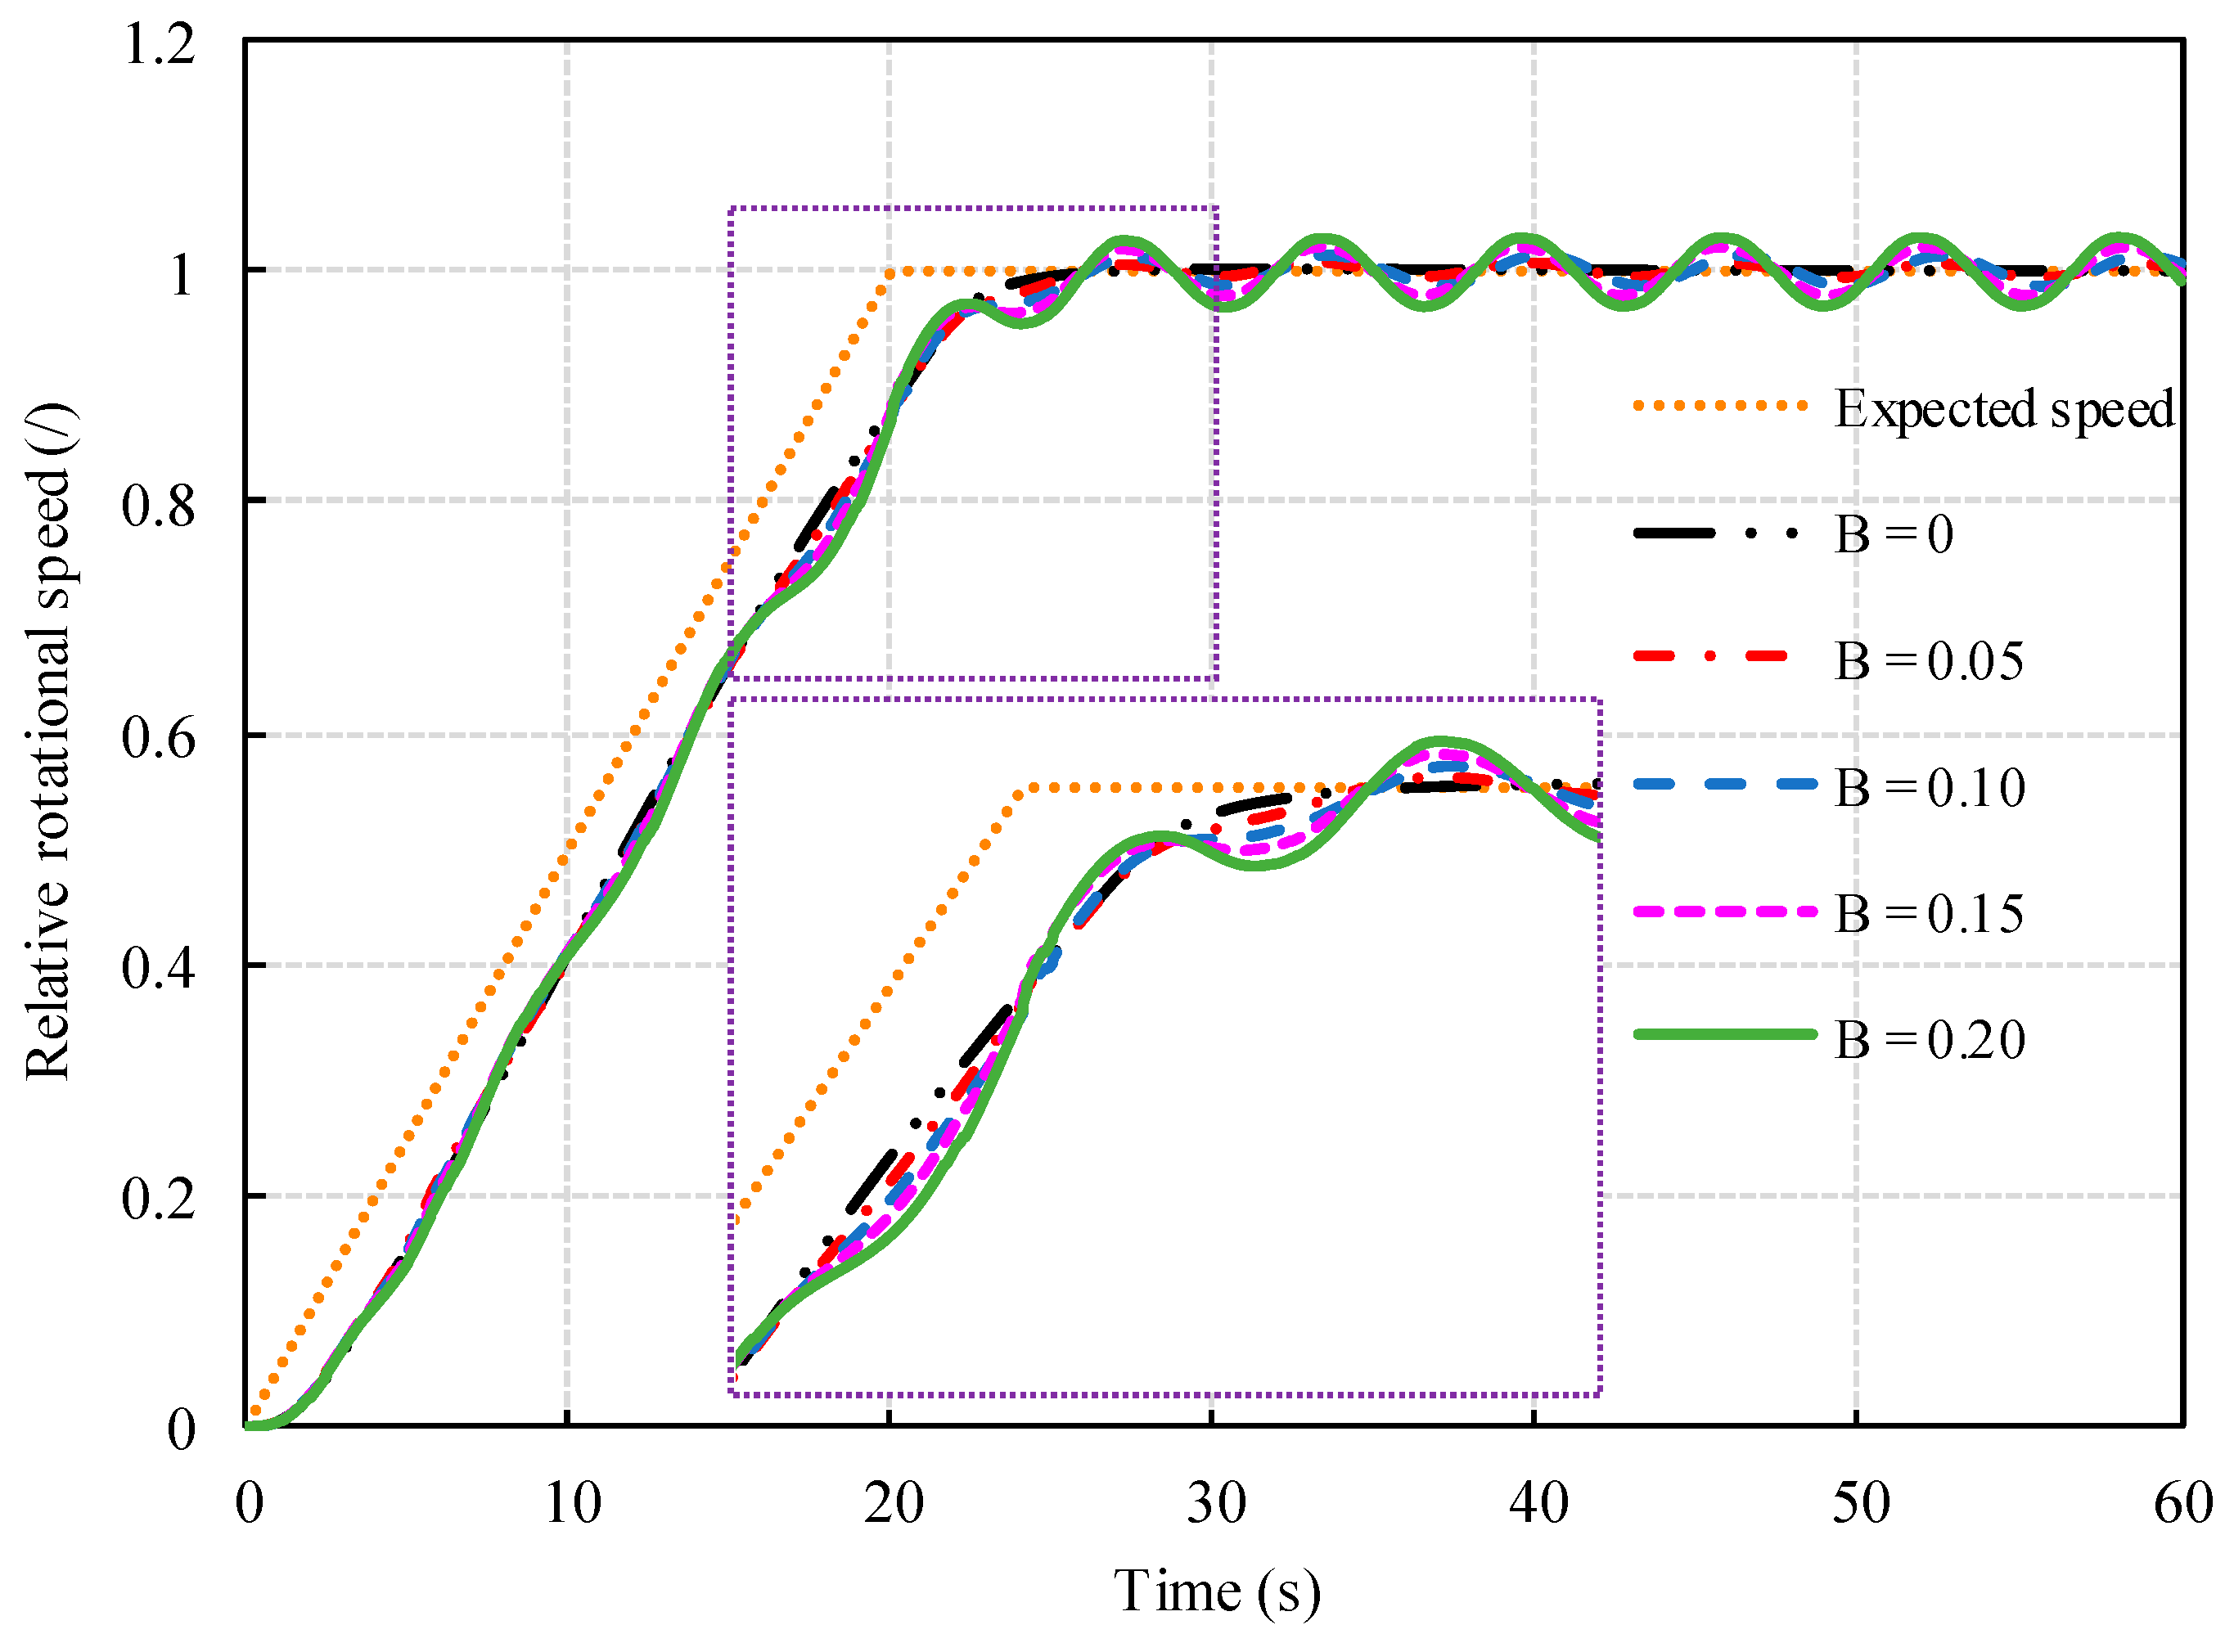
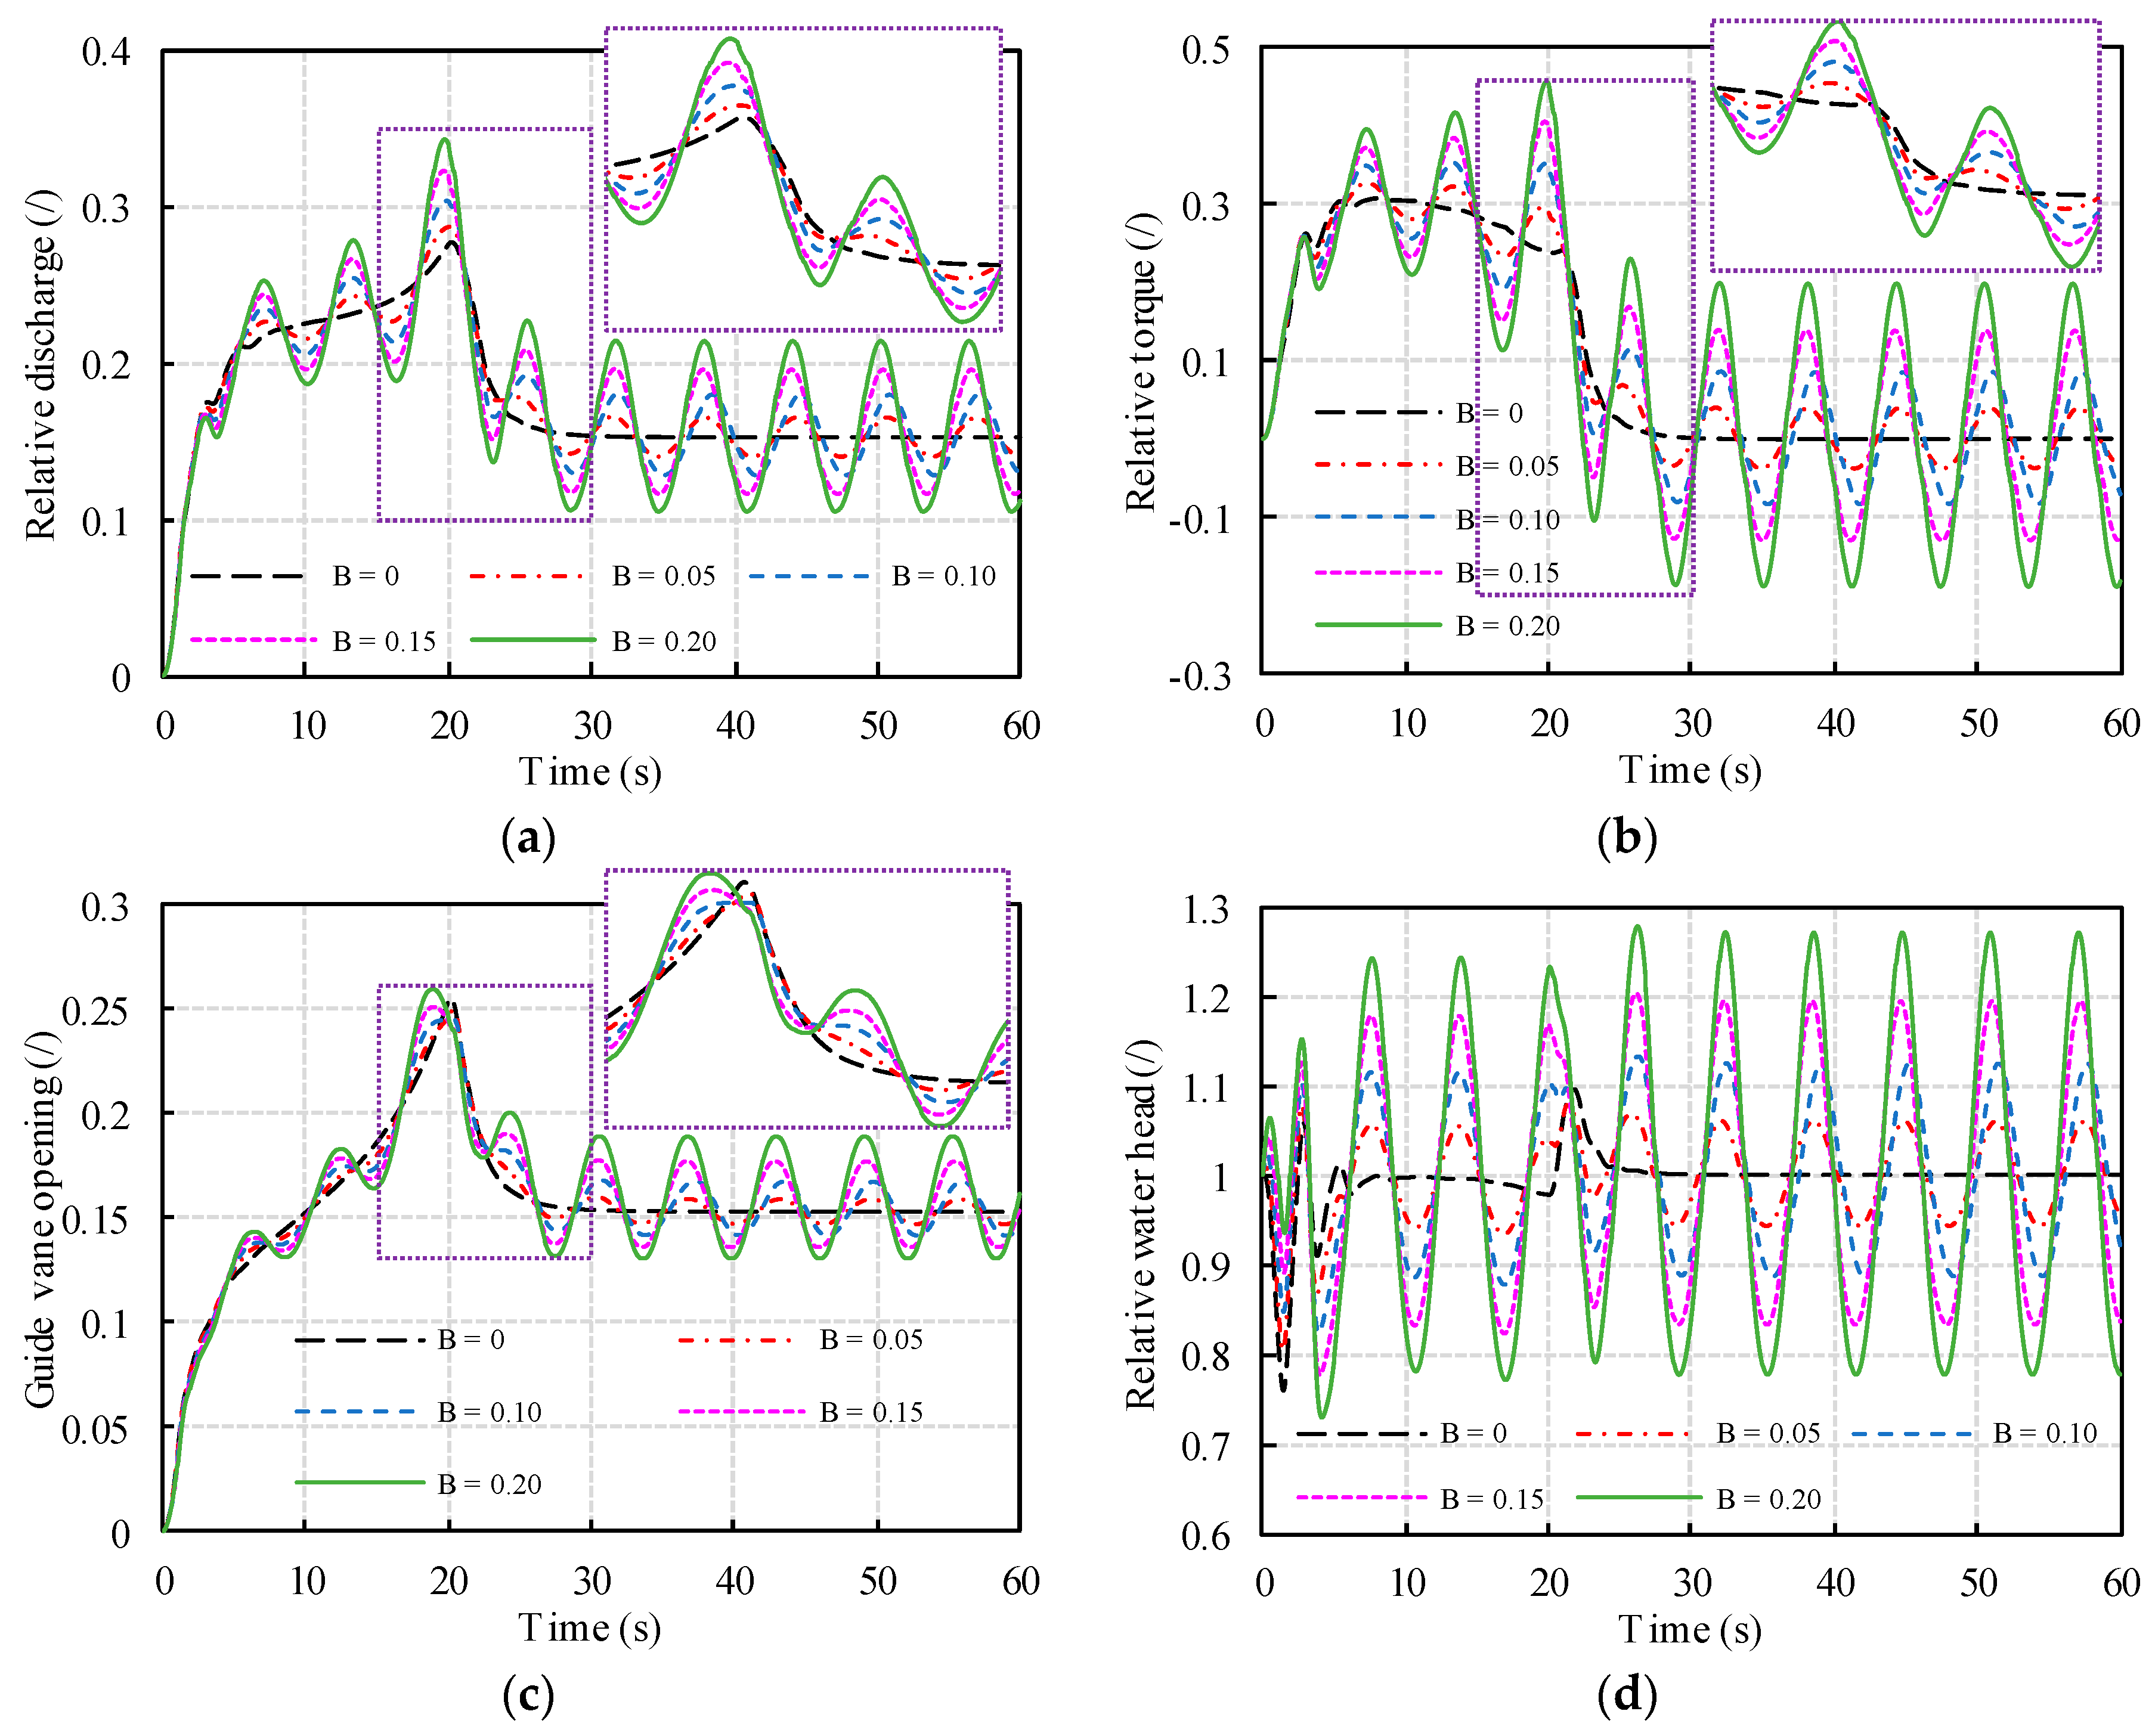
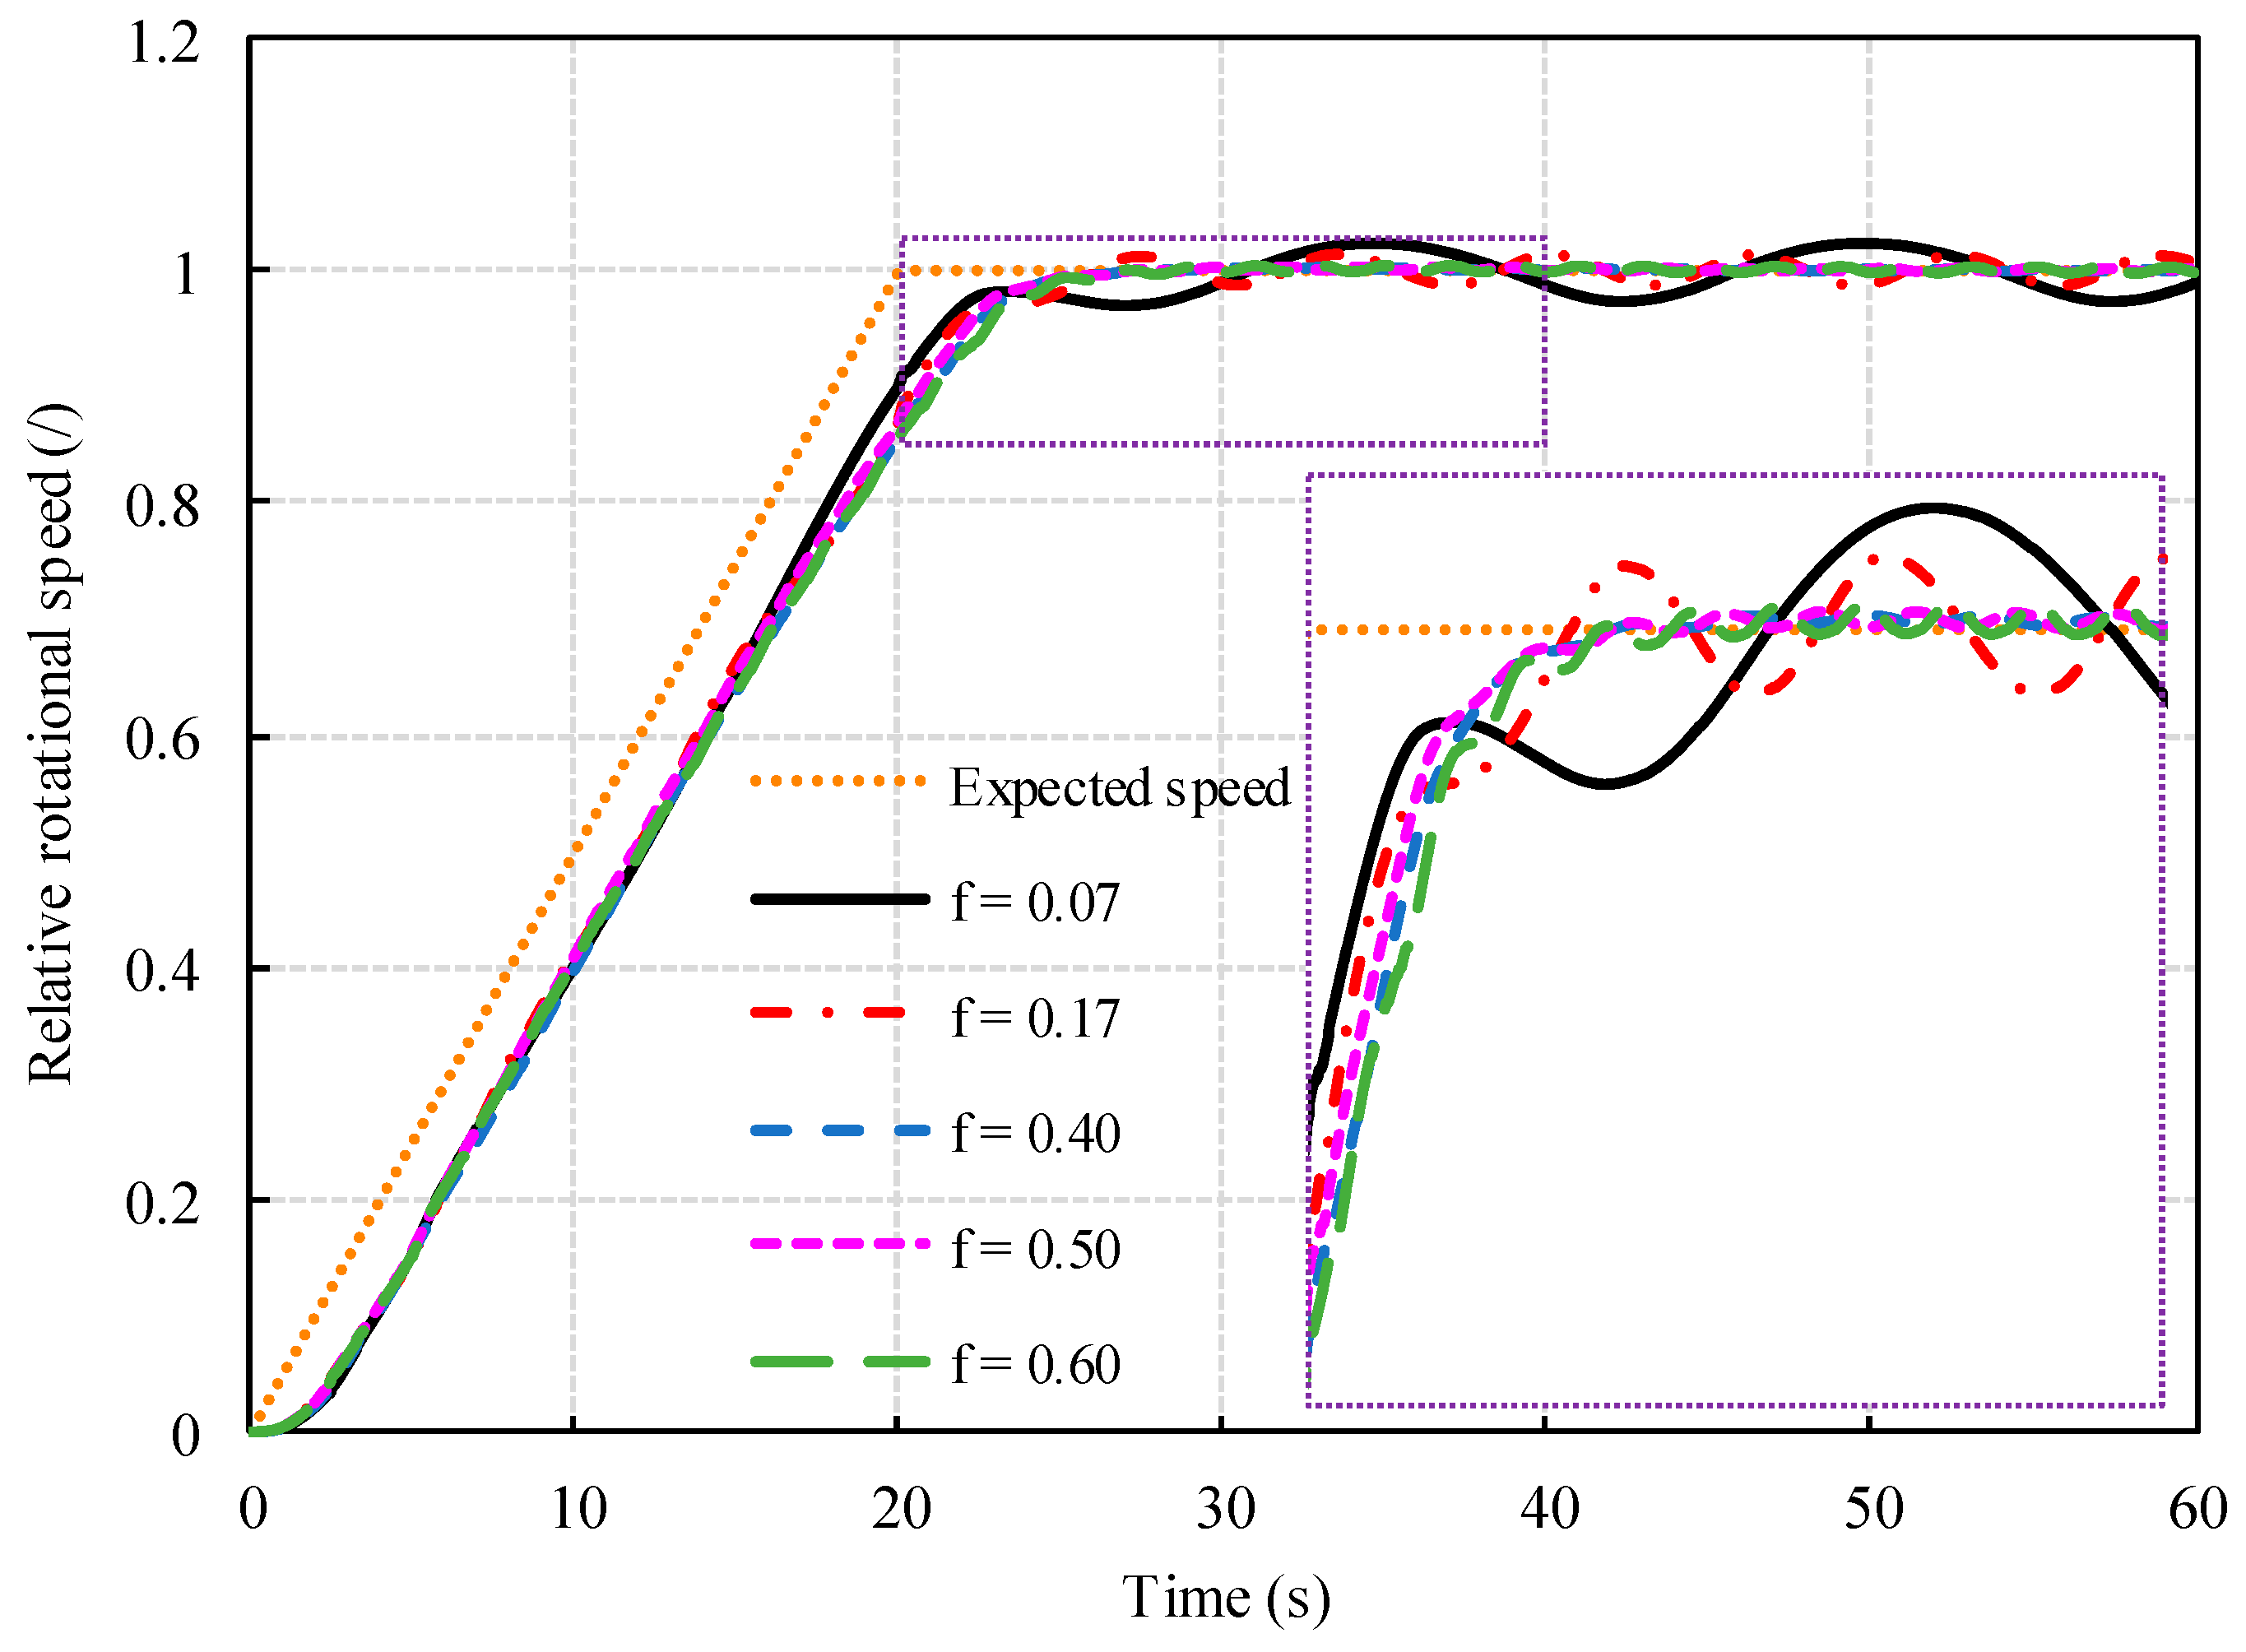
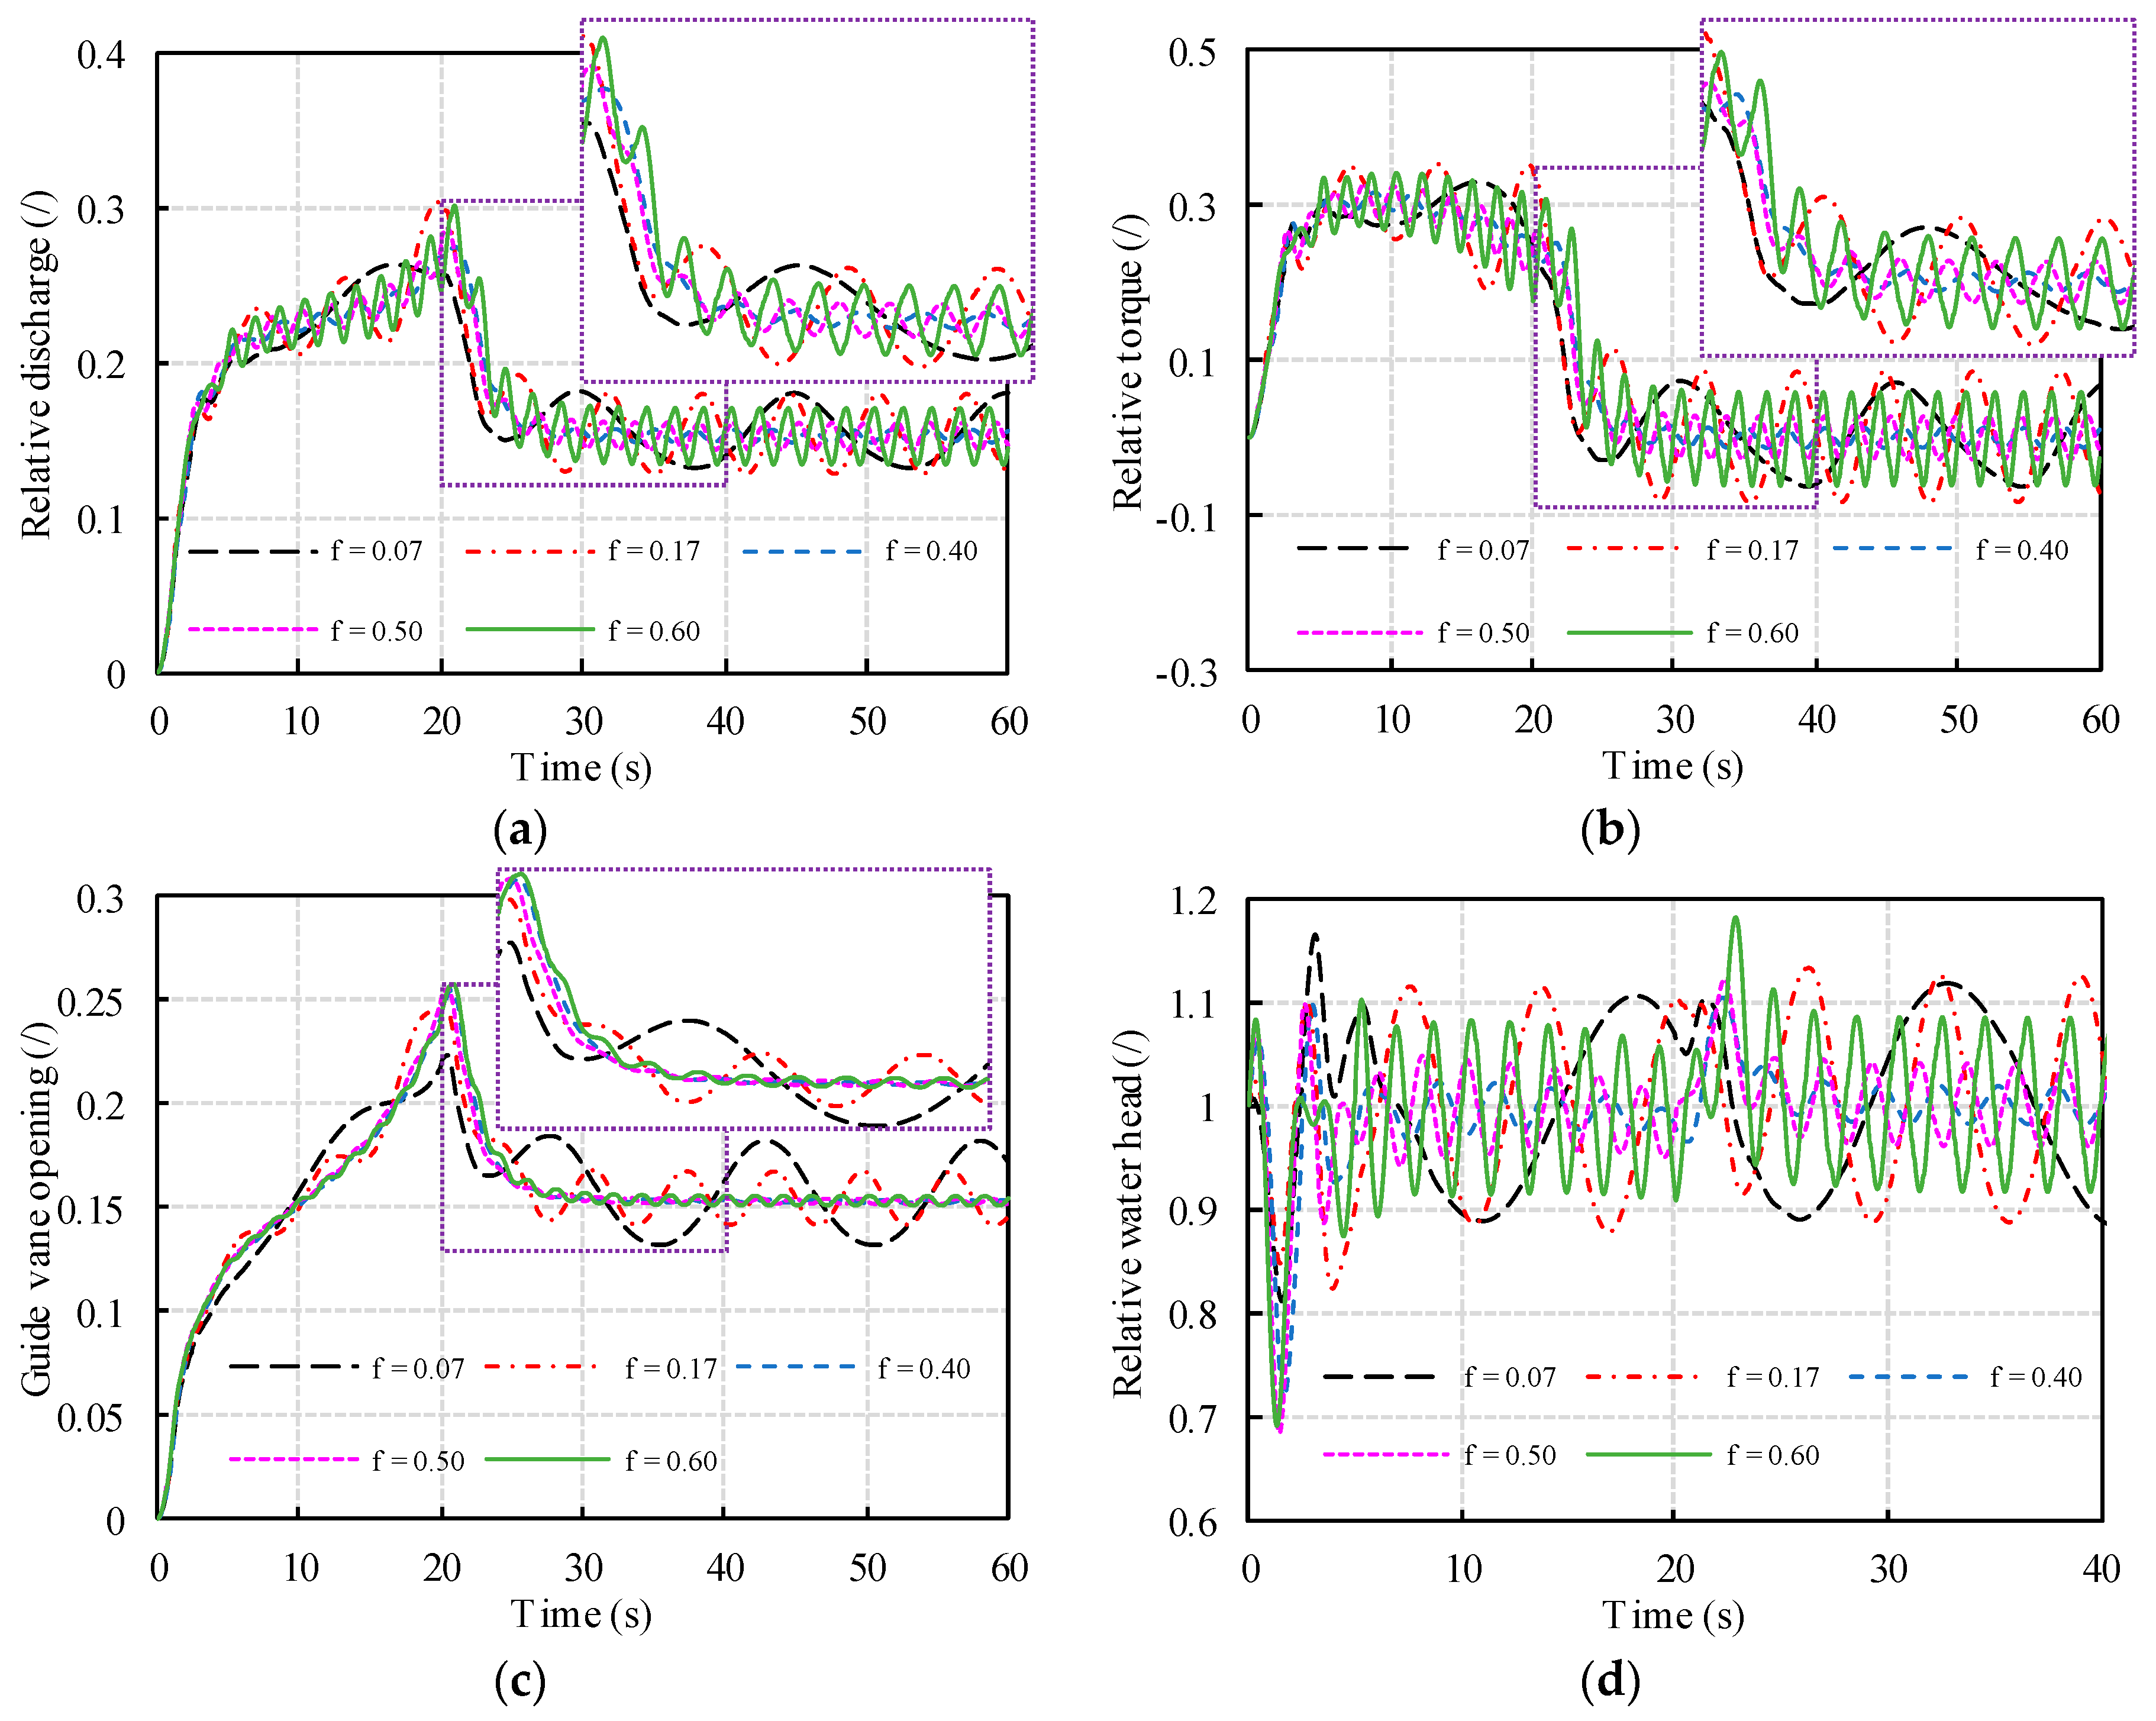
4.2.1. Impact of Tail Water Fluctuation on Start-Up
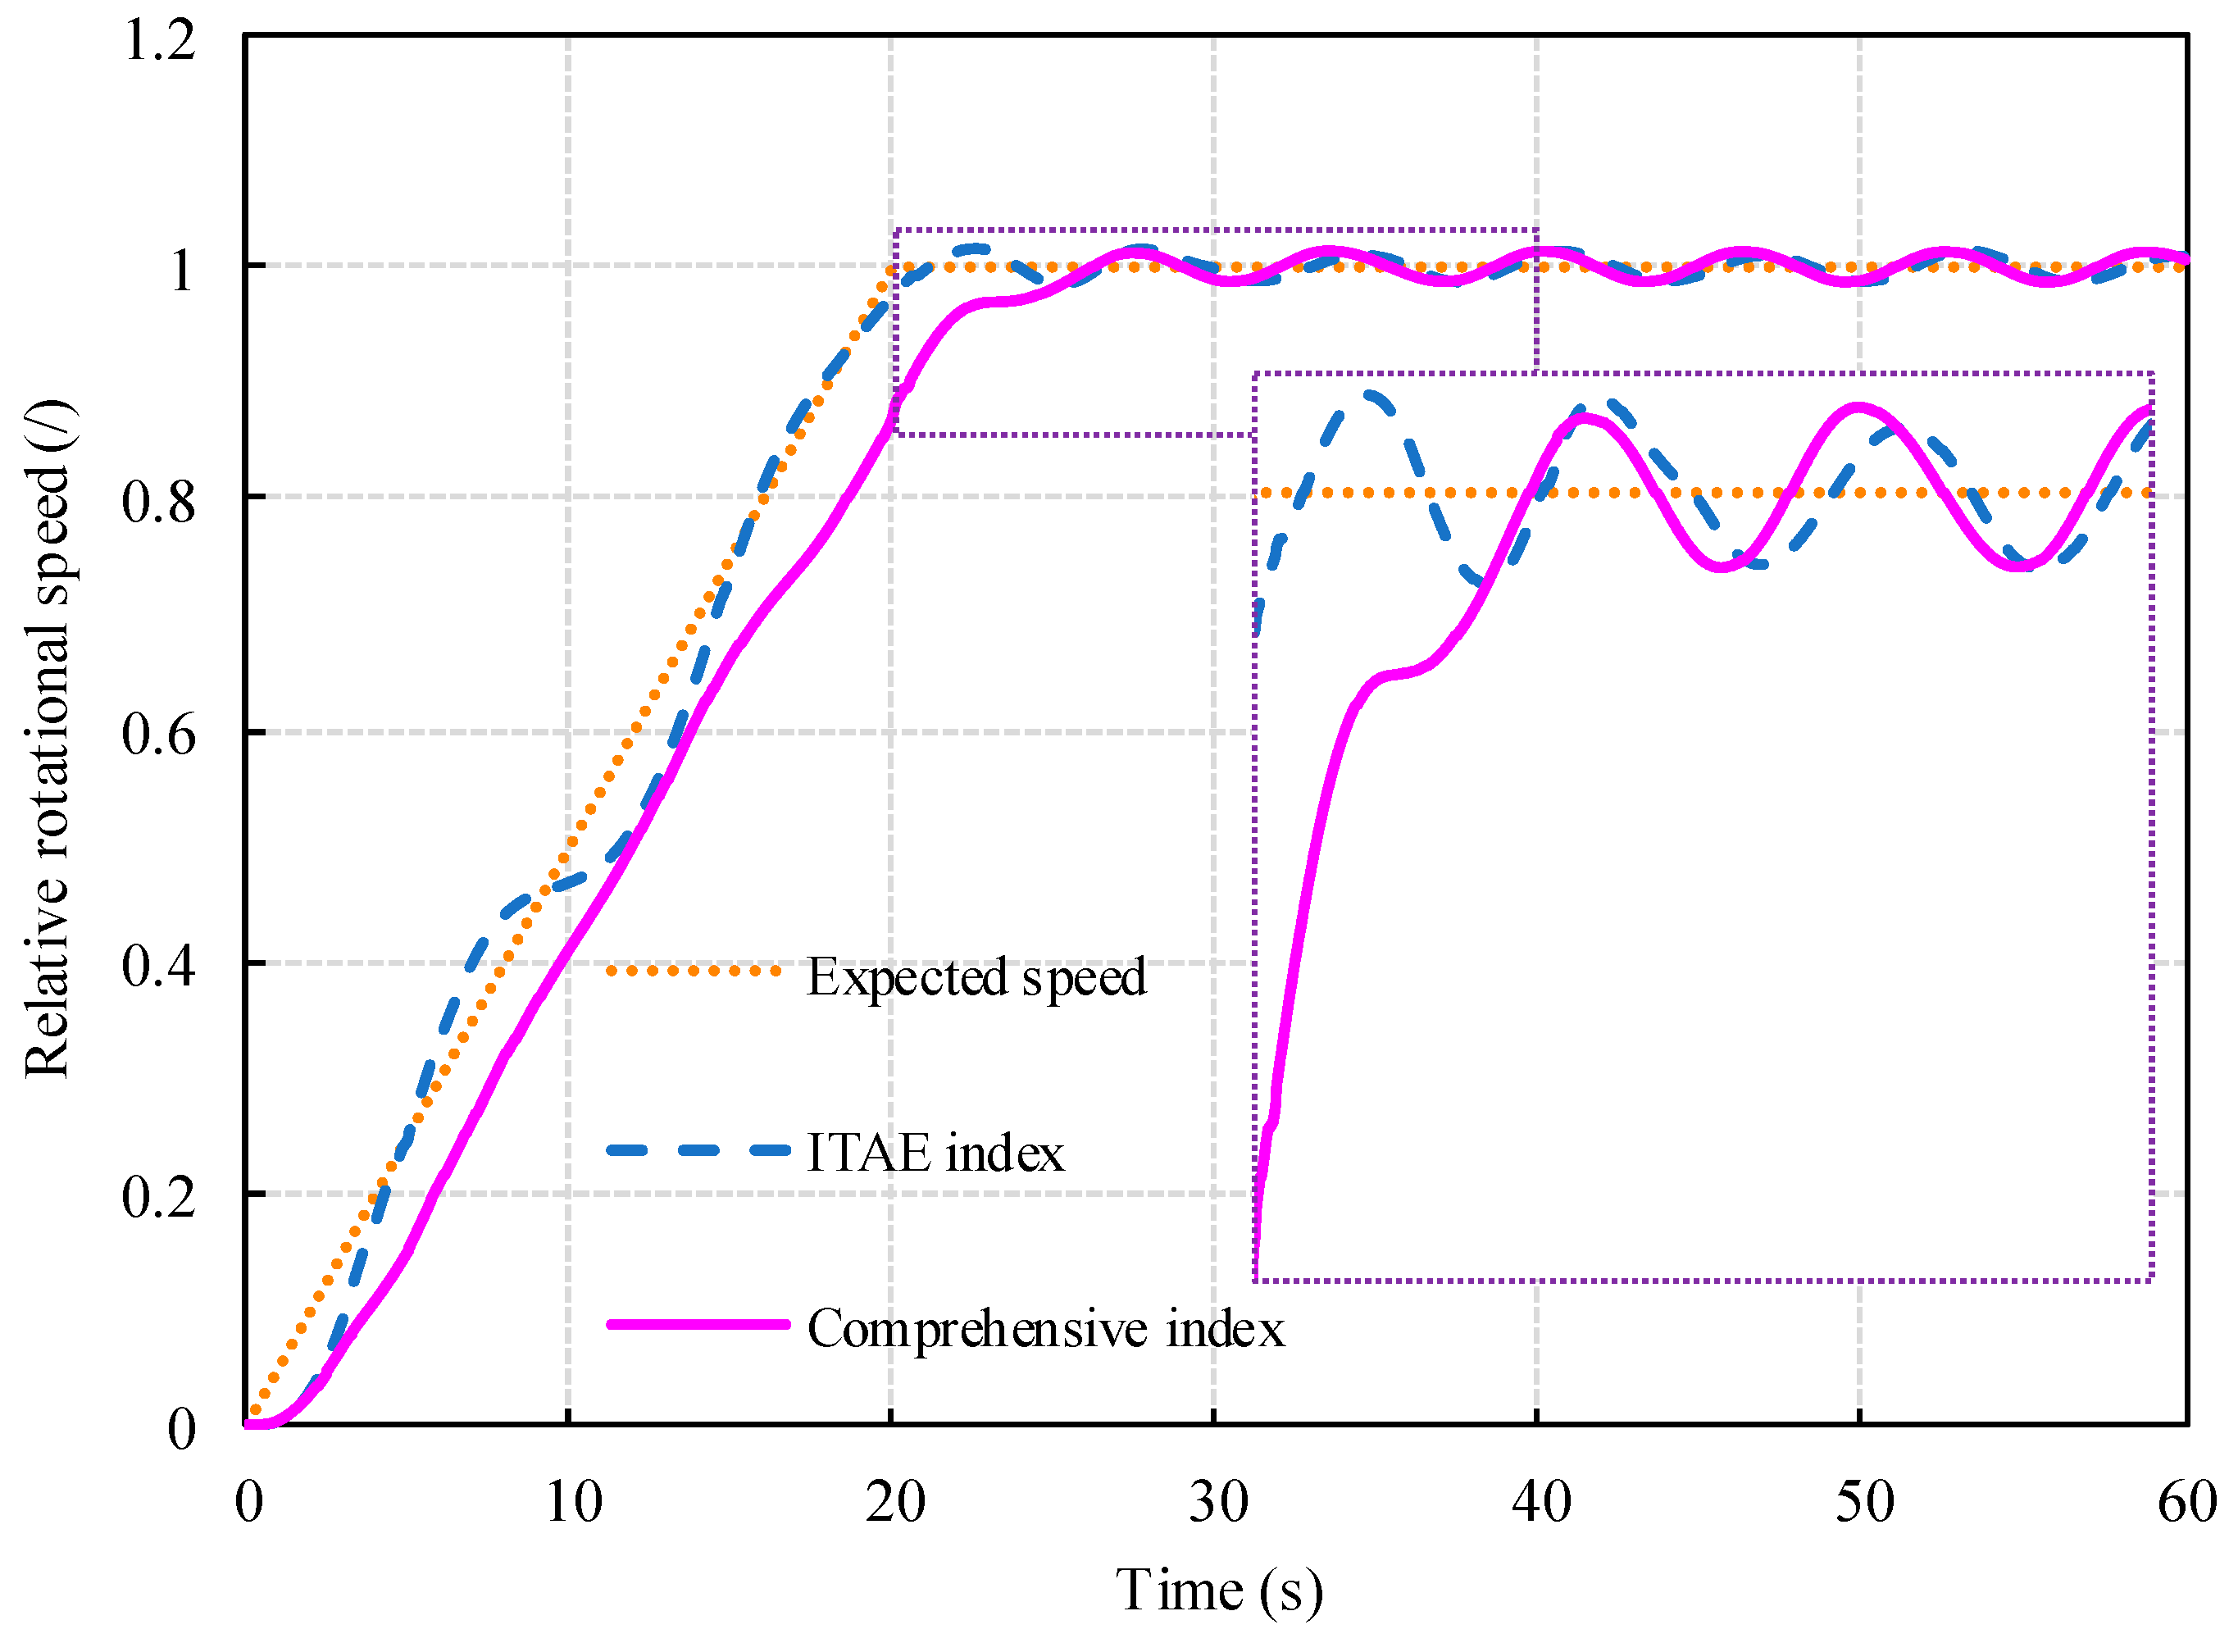
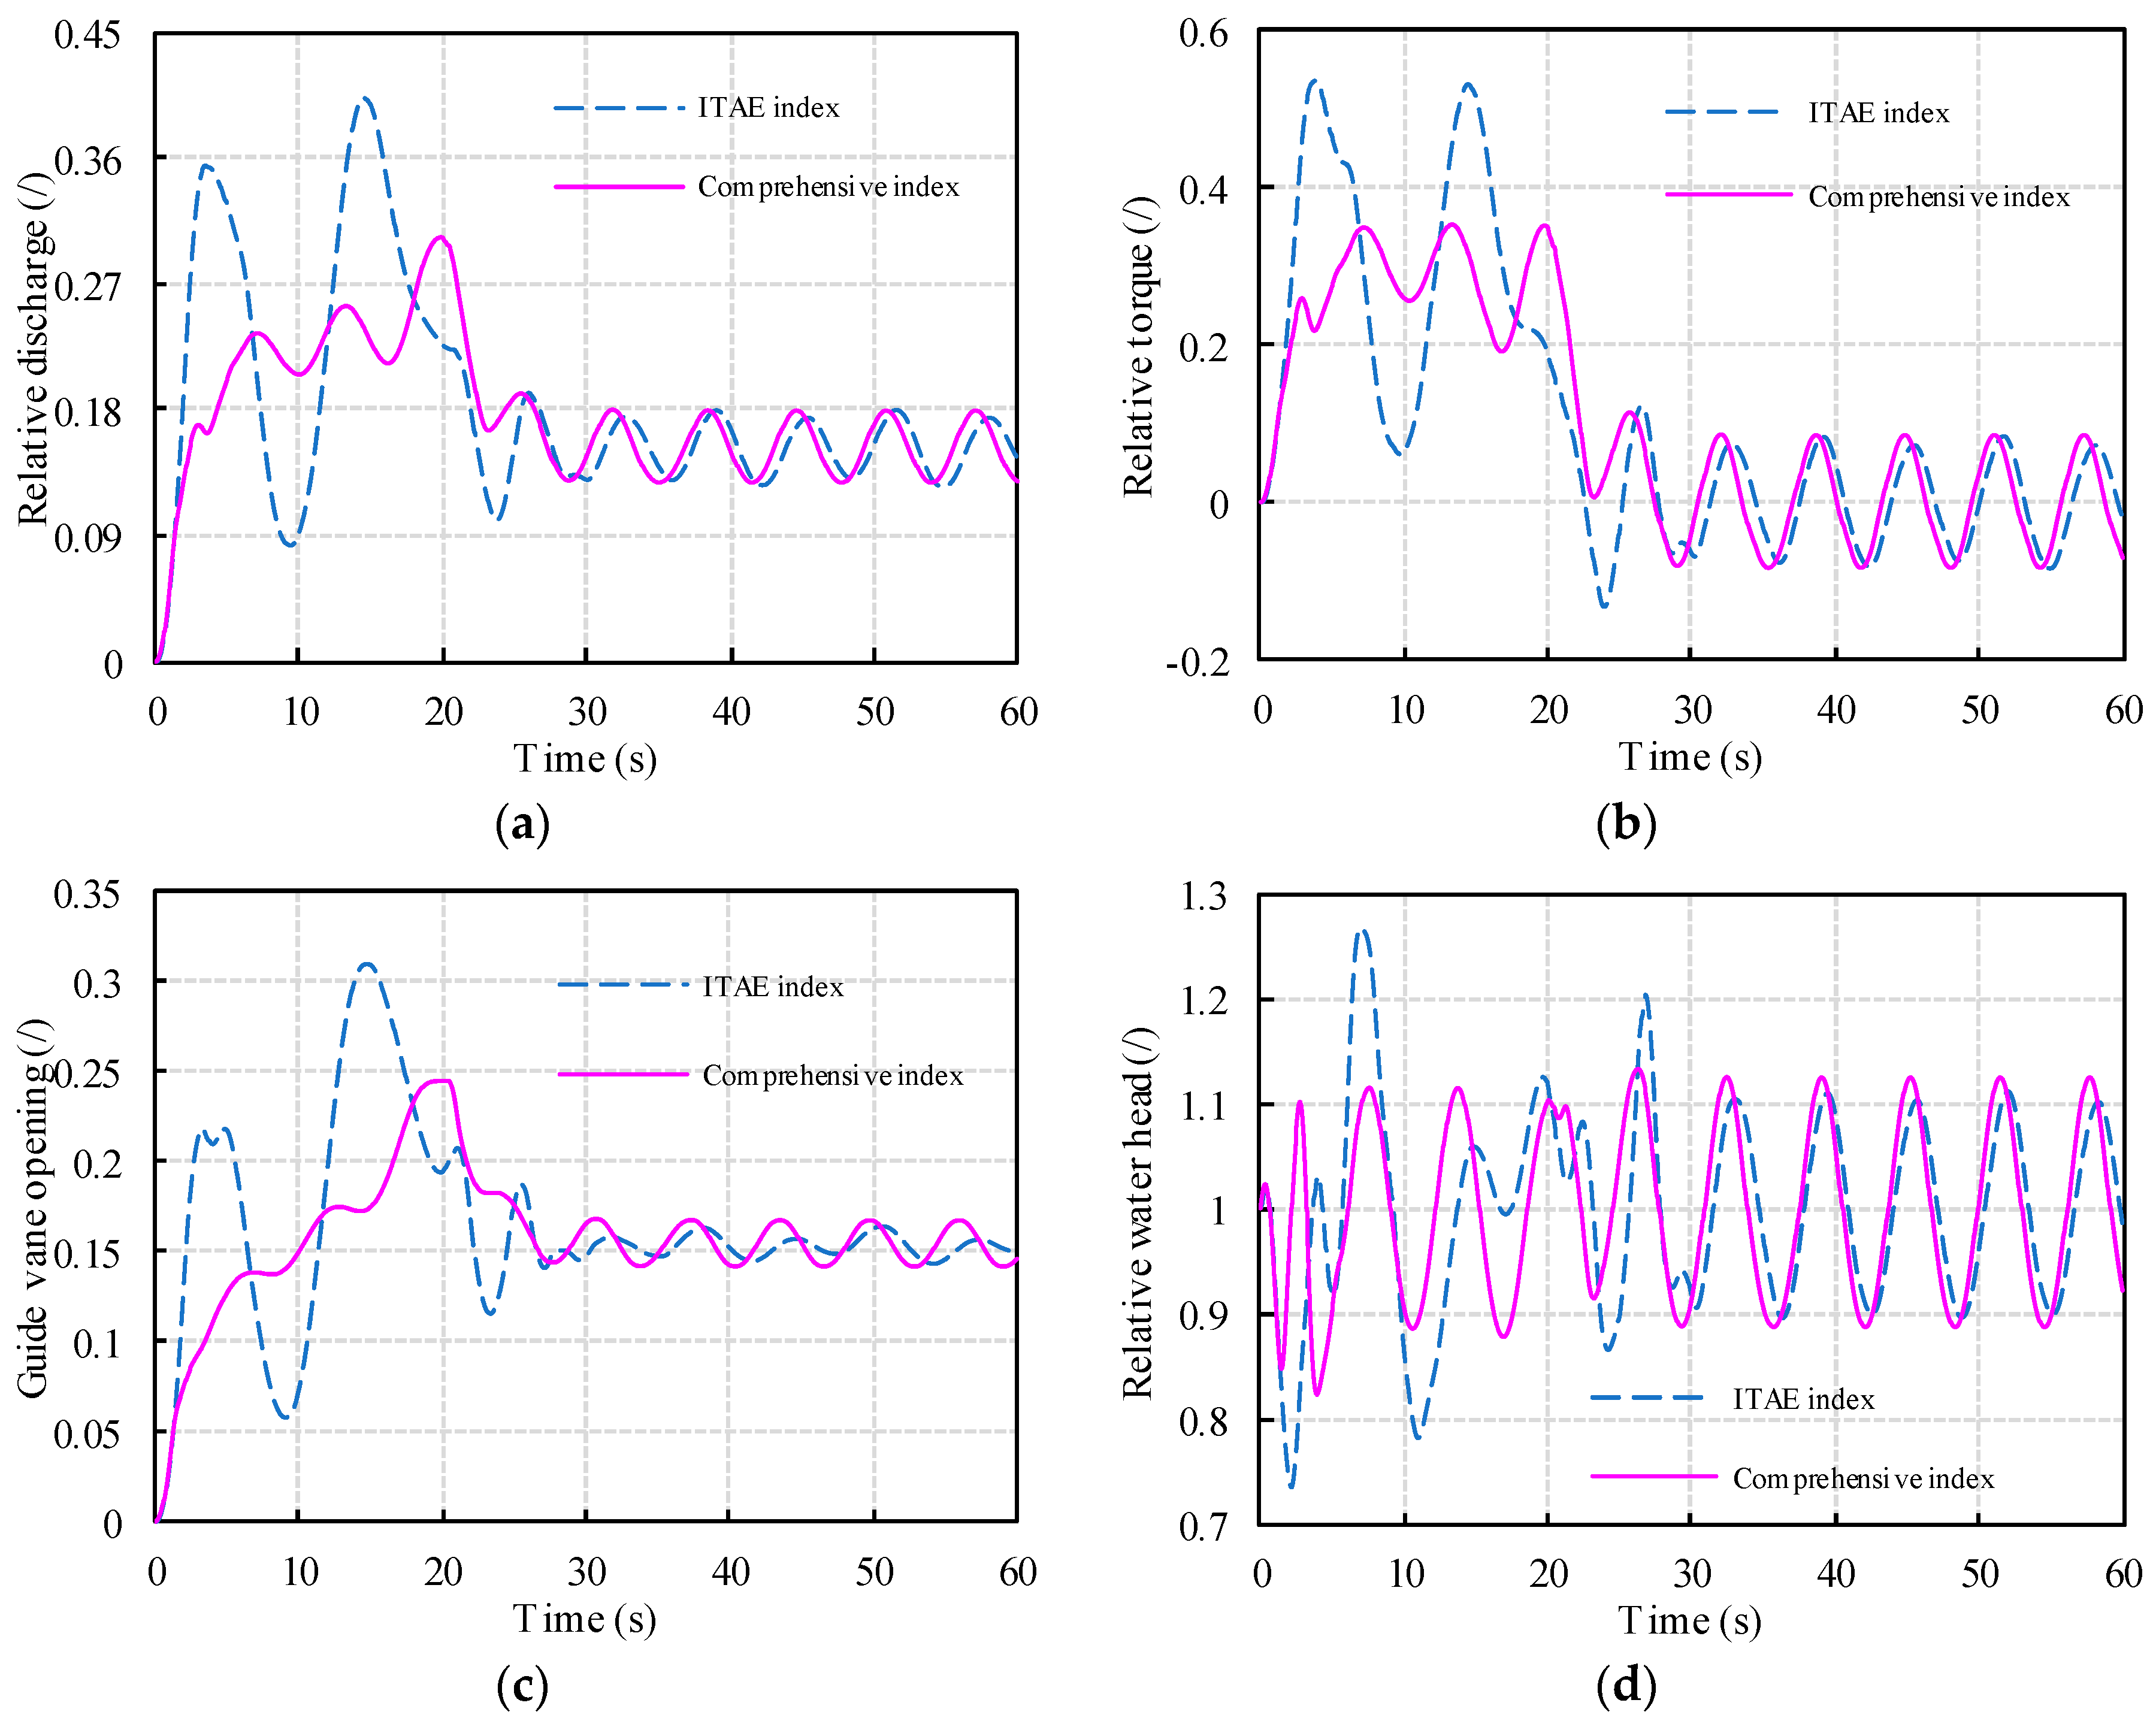
4.2.2. Optimization of Start-Up Under Tail Water Fluctuation
5. Discussion
6. Conclusions
Author Contributions
Funding
Conflicts of Interest
Nomenclature
| Deviation of mechanical torque | |
| Deviation of discharge | |
| Deviation of rotating speed | |
| Deviation of water head | |
| Rated unit torque | |
| Rated unit speed | |
| Rated unit flow | |
| Characteristic function of unit torque | |
| Characteristic function of unit discharge | |
| Main relay stroke | |
| Hydro-turbine unit inertia time constant | |
| Load disturbance torque | |
| Wave velocity | |
| A | Pipe area |
| Head loss of conduit | |
| D | Pipe diameter |
| Head | |
| Discharge | |
| Relative head loss of pipeline | |
| Proportional coefficient | |
| Integral coefficient | |
| Differential coefficient | |
| Reaction time constant of main servomotor | |
| Reaction time constant of auxiliary servomotor | |
| Time of duration rising from 0 to rated speed | |
| switching time of turning point for two-phase opening scheme | |
| switching frequency of turning point for two-phase opening scheme | |
| Deviation between expected and actual speed | |
| Deviation between initial head and head at any instant | |
| Speed overshoot | |
| Value of amplitude of the tail water fluctuation | |
| The initial phase | |
| Frequency of the tail water fluctuation |
References
- Feng, Z.K.; Niu, W.J.; Cheng, C.T.; Liao, S.L. Hydropower system operation optimization by discrete differential dynamic programming based on orthogonal experiment design. Energy 2017, 126, 720–732. [Google Scholar] [CrossRef]
- Manzano-Agugliaro, F.; Taher, M.; Zapata-Sierra, A.; Juaidi, A.; Montoya, F.G. An overview of research and energy evolution for small hydropower in Europe. Renew. Sustain. Energy Rev. 2017, 75, 476–489. [Google Scholar] [CrossRef]
- François, B.; Zoccatelli, D.; Borga, M. Assessing small hydro/solar power complementarity in ungauged mountainous areas: A crash test study for hydrological prediction methods. Energy 2017, 127, 716–729. [Google Scholar] [CrossRef]
- Jumani, S.; Rao, S.; Machado, S.; Prakash, A. Big concerns with small projects: Evaluating the socio-ecological impacts of small hydropower projects in India. AMBIO 2017, 46, 500–511. [Google Scholar] [CrossRef] [PubMed]
- Liu, D.N.; Zhao, W.D.; Li, Z.H.; Xu, X.F.; Xiao, B.W.; Niu, D.X. Can hydropower develop as expected in China? A scenario analysis based on system dynamics model. Energy 2018, 161, 118–129. [Google Scholar] [CrossRef]
- Cheng, C.T.; Miao, S.M.; Luo, B.; Sun, Y.J. Forecasting monthly energy production of small hydropower plants in ungauged basins using grey model and improved seasonal index. J. Hydroinform. 2017, 19, 993–1008. [Google Scholar] [CrossRef]
- Zhang, X.; Zha, T.; Zhao, Y.; Qin, J.; Lyv, Z.; Ma, Z.; Yu, H.; Zhu, Y.; Wang, G.; Tettenborn, F.; et al. Sustainable Effects of Small Hydropower Substituting Firewood Program in Majiang County, Guizhou Province, China. Sustainability 2017, 9, 988. [Google Scholar] [CrossRef]
- Qiao, H.J.; Zhang, C.L.; Zhang, J.; Yan, J. Analysis on Promoting the Development of Small Hydropower in China. Haihe Water Resour. 2015, 2, 35–37. [Google Scholar]
- Chang, X.L.; Liu, X.H.; Zhou, W. Hydropower in China at present and its further development. Energy 2010, 35, 4400–4406. [Google Scholar] [CrossRef]
- Cheng, C.T.; Wu, H.J.; Wu, X.Y.; Shen, J.J.; Wang, J. Power Generation Scheduling for Integrated Large and Small Hydropower Plant Systems in Southwest China. J. Water Resour. Plann. Manag. 2017, 143, 04017027. [Google Scholar] [CrossRef]
- Panić, M.; Urošev, M.; Pešić, A.M.; Brankov, J.; Bjeljac, Z. Small hydropower plants in Serbia: Hydropower potential, current state and perspectives. Renew. Sustain. Energy Rev. 2013, 23, 341–349. [Google Scholar] [CrossRef]
- Dadu, V.; Dadu, A.; Frunza, D.; Catarig, G.; Popa, F.; Popa, B. Innovative Concepts Applied to Recent Small Hydropower Plants. Energy Procedia 2017, 112, 426–433. [Google Scholar] [CrossRef]
- Kang, L.; Jiang, T.B.; Ye, L.Q. Study on the Rules and the Simulations in Opening Process for Hydroturbines. J. Huazhong Univ. Sci. Tech. 1999, 27, 49–51. [Google Scholar] [CrossRef]
- Yang, W.J.; Yang, J.D. Study on optimum start-up method for hydroelectric generating unit based on analysis of the energy relation. In Proceedings of the 2012 Asia-Pacific Power and Energy Engineering Conference, Shanghai, China, 27–29 March 2012. [Google Scholar]
- Kang, L.; Ye, L.Q.; Jiang, T.B. A closed-loop start-up control strategy and its simulation studies for hydroelectric generating units. In Proceedings of the International Conferences on Info-Tech and Info-Net 2001, Beijing, China, 29 October–1 November 2001. [Google Scholar]
- Chen, S.Y.; Zhang, G.S.; Zhao, R.; Cao, N.; Cao, B.D. Porgram Control Based Starting-up Control Strategy of Hydroelectric Generating Sets. Power Syst. Technol. 2005, 29, 76–79. [Google Scholar] [CrossRef]
- Bao, H.Y.; Yang, J.D.; Fu, L. Study on nonlinear dynamical model and control strategy of transient process in hydropower station with Francis turbine. In Proceedings of the 2009 Asia-Pacific Power and Energy Engineering Conference, Wuhan, China, 27–31 March 2009. [Google Scholar]
- Li, C.S.; Mao, Y.F.; Zhou, J.Z.; Zhang, N.; An, X.L. Design of a fuzzy-PID controller for a nonlinear hydraulic turbine governing system by using a novel gravitational search algorithm based on Cauchy mutation and mass weighting. Appl. Soft Comput. 2017, 52, 290–305. [Google Scholar] [CrossRef]
- Fang, H.Q.; Chen, L.; Shen, Z.Y. Application of an improved PSO algorithm to optimal tuning of PID gains for water turbine governor. Energy Convers. Manag. 2011, 52, 1763–1770. [Google Scholar] [CrossRef]
- Wang, Z.B.; Li, C.S.; Lai, X.J.; Zhang, N.; Xu, Y.H.; Hou, J.J. An Integrated Start-Up Method for Pumped Storage Units Based on a Novel Artificial Sheep Algorithm. Energies 2018, 11, 151. [Google Scholar] [CrossRef]
- Maiti, D.; Acharya, A.; Chakraborty, M.; Konar, A.; Janarthanan, R. Tuning PID and PIλDδ Controllers using the Integral Time Absolute Error Criterion. In Proceedings of the 2008 4th International Conference on Information and Automation for Sustainability, Colombo, Sri Lanka, 12–14 December 2008. [Google Scholar]
- Zhou, B.; Su, Y.L.; Luo, R.J.; Wu, J. Comparison and Optimization of Two Control Technologies on Hydraulic Turbine Start-up Process. Hydropower Autom. Dam Monit. 2013, 37, 17–19. [Google Scholar] [CrossRef]
- Hou, J.J.; Li, C.S.; Tian, Z.Q.; Xu, Y.H.; Lai, X.J.; Zhang, N.; Zheng, T.P.; Wu, W. Multi-Objective Optimization of Start-up Strategy for Pumped Storage Units. Energies 2018, 11, 1141. [Google Scholar] [CrossRef]
- Li, J.P.; Yang, J.D. Effect of tail water level fluctuation on stable operation of units in hydropower station. Eng. J. Wuhan Univ. 2004, 37, 28–32. [Google Scholar] [CrossRef]
- Li, H.H.; Chen, D.Y.; Zhang, X.G.; Wu, Y.H. Dynamic analysis and modelling of a Francis hydro-energy generation system in the load rejection transient. IET Renew. Power Gen. 2016, 10, 1140–1148. [Google Scholar] [CrossRef]
- Zhang, C.; Li, C.S.; Peng, T.; Xia, X.; Xue, X.M.; Fu, W.L.; Zhou, J.Z. Modeling and Synchronous Optimization of Pump Turbine Governing System Using Sparse Robust Least Squares Support Vector Machine and Hybrid Backtracking Search Algorithm. Energies 2018, 11, 3108. [Google Scholar] [CrossRef]
- Wu, Q.Q.; Zhang, L.K.; Ma, Z.Y. A model establishment and numerical simulation of dynamic coupled hydraulic-mechanical-electric-structural system for hydropower station. Nonlinear Dynam. 2017, 87, 459–474. [Google Scholar] [CrossRef]
- Guo, W.C.; Yang, J.D. Stability performance for primary frequency regulation of hydro-turbine governing system with surge tank. Appl. Math. Model. 2018, 54, 446–466. [Google Scholar] [CrossRef]
- Chen, Z.H.; Yuan, X.H.; Ji, B.; Wang, P.T.; Tian, H. Design of a fractional order PID controller for hydraulic turbine regulating system using chaotic non-dominated sorting genetic algorithm II. Energy Convers. Manag. 2014, 84, 390–404. [Google Scholar] [CrossRef]
- Shen, Z.Y. Hydraulic Turbine Regulation, 3rd ed.; China Water & Power Press: Beijing, China, 1998. [Google Scholar]
- Liang, J.; Yuan, X.H.; Yuan, Y.B.; Chen, Z.H.; Li, Y.Z. Nonlinear dynamic analysis and robust controller design for Francis hydraulic turbine regulating system with a straight-tube surge tank. Mech. Syst. Signal. Process. 2017, 85, 927–946. [Google Scholar] [CrossRef]
- Xu, B.B.; Chen, D.Y.; Zhang, H.; Wang, F.F. Modeling and stability analysis of a fractional-order Francis hydro-turbine governing system. Chaos Solitons Fract. 2015, 75, 50–61. [Google Scholar] [CrossRef]


| Control Indices | Kp | Ki | Kd | Index | σ | ∑h(t) | tc | |
|---|---|---|---|---|---|---|---|---|
| ITAE index | 0.52 | 1.37 | 1.01 | 19.19 | 0.021 | 0.27 | 4.77 | 19.42 |
| MOC index | 1.00 | 0.08 | 0.08 | 35.80 | 0.019 | 0.18 | 4.50 | 23.85 |
© 2019 by the authors. Licensee MDPI, Basel, Switzerland. This article is an open access article distributed under the terms and conditions of the Creative Commons Attribution (CC BY) license (http://creativecommons.org/licenses/by/4.0/).
Share and Cite
Chen, S.; Li, G.; Wang, D.; Wang, X.; Zhang, J.; Yu, X. Impact of Tail Water Fluctuation on Turbine Start-Up and Optimized Regulation. Energies 2019, 12, 2883. https://doi.org/10.3390/en12152883
Chen S, Li G, Wang D, Wang X, Zhang J, Yu X. Impact of Tail Water Fluctuation on Turbine Start-Up and Optimized Regulation. Energies. 2019; 12(15):2883. https://doi.org/10.3390/en12152883
Chicago/Turabian StyleChen, Sheng, Gaohui Li, Delou Wang, Xingtao Wang, Jian Zhang, and Xiaodong Yu. 2019. "Impact of Tail Water Fluctuation on Turbine Start-Up and Optimized Regulation" Energies 12, no. 15: 2883. https://doi.org/10.3390/en12152883
APA StyleChen, S., Li, G., Wang, D., Wang, X., Zhang, J., & Yu, X. (2019). Impact of Tail Water Fluctuation on Turbine Start-Up and Optimized Regulation. Energies, 12(15), 2883. https://doi.org/10.3390/en12152883