Article

Catalytic Effect of Cobalt Additive on the Low Temperature Oxidation Characteristics of Changqing Tight Oil and Its SARA Fractions

1
School of Petroleum Engineering, China University of Petroleum (East China), Qingdao 266580, China
2
Petroleum Systems Engineering, Faculty of Engineering and Applied Science, University of Regina, Regina, SK S4S 0A2, Canada
*
Author to whom correspondence should be addressed.
Energies 2019, 12(15), 2848; https://doi.org/10.3390/en12152848
Submission received: 27 June 2019 / Revised: 18 July 2019 / Accepted: 22 July 2019 / Published: 24 July 2019
(This article belongs to the Special Issue Development of Unconventional Reservoirs)

Abstract

:
Air flooding is a potential enhanced oil recovery (EOR) method to economically and efficiently develop a tight oil reservoir due to its sufficient gas source and low operational costs, during which low temperature oxidation (LTO) is the key to ensuring the success of air flooding. In addition to inefficiency of conventional LTO, air flooding has seen its limited applications due to the prolonged reaction time and safety constraints. In this paper, a novel air injection technique based on the catalyst-activated low temperature oxidation (CLTO) is developed to improve the operational safety together with its oil recovery in tight oil reservoirs. Experimentally, static oxidation experiments are conducted to examine the influence of the catalyst on the LTO reaction kinetics of Changqing tight oil and its fractions. The catalytic oxidation characteristics are identified by applying a thermogravimetric analyzer coupled with Fourier transform infrared spectrometer (TG-FTIR) with respect to tight oil and its SARA (i.e., saturates, aromatics, resins, and asphaltenes) fractions. Accordingly, the catalyst can obviously decrease the LTO reaction activation energy of the Changqing tight oil and its SARA fraction. Cobalt additive can change the LTO reaction pathways of the SARA fractions, i.e., promoting the formation of hydroxyl-containing oxides and CO2 from the oxidation of saturates, aromatics and resins, while inhibiting the formation of ethers from the oxidation of aromatics and resins. The LTO of each SARA fraction contains both oxygen addition reaction and bond scission reaction that can be effectively promoted with the cobalt additive. The catalytic effect on the bond scission reaction is continuously enhanced and becomes gradually stronger than that on the oxygen addition reaction as the reaction proceeds.

1. Introduction

Air flooding is a cost-effective technique for exploiting oil reservoirs, which is remarkably effective for tight oil reservoirs and conventional reservoirs in the late stage of waterflooding [1,2,3,4]. Recently, there have seen numerous researches and field pilots for air flooding in the North Sea [5,6], Indonesia [7,8], Argentina [9], Buffalo Red River Unit (BRRU) [10], West Hackberry [11,12], Coral Creek [13], Ekofisk [6,14], Buffalo [15,16], and Horse Creek oilfields [17] with good performance. After air is injected into a hydrocarbon reservoir, the oxygen of air reacts with hydrocarbons in various ways, generating a lot of flue gas and heat, and thus enhancing the oil recovery. To enhance the safety of air flooding, the injected oxygen should be completely consumed before produced. To improve the safety of air flooding without changing flooding pattern in a depleted reservoir, it is a good method to increase the oxygen consumption rate of crude oil by adding catalyst to the LTO process.
Recently, numerous efforts have been made to quantify high-temperature catalytic oxidation during in-situ combustion (ISC) and the high-temperature catalytic viscosity reduction of heavy oil with air injection. As shown in Table 1, effects of metallic additives such as iron, tin, copper, cobalt, and et al. have been examined on the efficiency of ISC, acidity of heavy oil, viscosity reduction rate, and kinetic parameters through combustion tube tests, viscosity reduction tests, and simultaneous thermogravimetry and differential scanning calorimetry (TG-DSC) tests [18,19,20,21,22,23,24,25,26,27,28,29,30,31].
So far, few attempts have been made to quantify catalyst-activated low temperature oxidation (CLTO) and identify the associated catalytic mechanisms. Zhao et al. [32] examined the effect of reservoir rock and clay minerals on the LTO reaction characteristics of light crude oil. By examining the influence of clay-mineral type on the oxidation of crude oil at condition of 120 °C and 30 MPa, they found that clay minerals could catalyze the oxidation of light oil, while the catalytic effect varied for different types of clay minerals due mainly to the different compositions of metal salts in the clay minerals. Jia et al. [33] examined the catalytic effect of clay and rock minerals on the oxidation of light crude oil using the thermogravimetry and differential thermal analysis (TG-DTA) during high-pressure air injection processes. Their results showed that rock cuttings could promote the deposition of fuel (i.e., coke) and that clay minerals can enhance the oxidation degree of light oil. By treating the fracturing proppant with a catalyst and subsequently injecting the supported catalyst into the formation by sand fracturing, Shi et al. [34] found that the effect of the supported catalyst on the LTO of crude oil greatly improved the oxygen consumption rate, and thereby enhanced the safety of air flooding. Such research on the CLTO reaction, however, is still at the early stage, while the underlying mechanisms for the CLTO have not been fully identified.
In our previous work on the CLTO technique [35,36], numerous efforts have been done on the optimization and evaluation of LTO catalysts. Cobalt additive is found to be a proper catalyst that can promote the LTO reaction rate and enhance the safety of air flooding obviously by delaying the oxygen breakthrough time. A preliminary study on the catalytic mechanism has been conducted in our previous work [37] by quantifying the influence of catalyst on the oxidation behavior of the crude oil applying the thermogravimetry coupled with Fourier transform infrared spectroscopy (TG-FTIR) tests. However, the catalytic effect of cobalt additive on different fractions has not been researched before, and the relationships between the catalytic oxidation characteristics of different oil fractions are still not clear. This study tends to investigate the effects of the cobalt additive on the LTO reaction process of the individual SARA fraction of Changiqng tight oil by applying static oxidation experiments and TG-FTIR tests. Then, the experimental measurements are analyzed and discussed to identify the CLTO characteristics of SARA fractions.

2. Experimental

2.1. Materials

In this study, crude oil produced from Dongzhi tight oil reservoir in the Changqing Oilfield in China is collected and used to conduct the experiments. The tight oil physical properties are shown in Table 2. It is worthwhile noting that the oxidation of asphaltenes is not included in this research due to the fact that the state of asphaltenes in a crude oil is completely different from that of the asphaltenes separated from the crude oil [38]. The air used is supplied by the Qingdao Tianyuan Gas Company which is composed of 21.0 mol % oxygen and 79.0 mol % nitrogen. The neutral alumina, reagent-grade n-pentane, HPLC-grade toluene, HPLC-grade methanol, and HPLC-grade tetrahydrofuran used in the SARA fraction separation are all provided by the Sinopharm Chemical Reagent (Co., Ltd., Shanghai, China). The cobalt additives (cobalt naphthenate and cobalt chloride) used as the catalyst are also provided by the Sinopharm Chemical Reagent (Co., Ltd.).

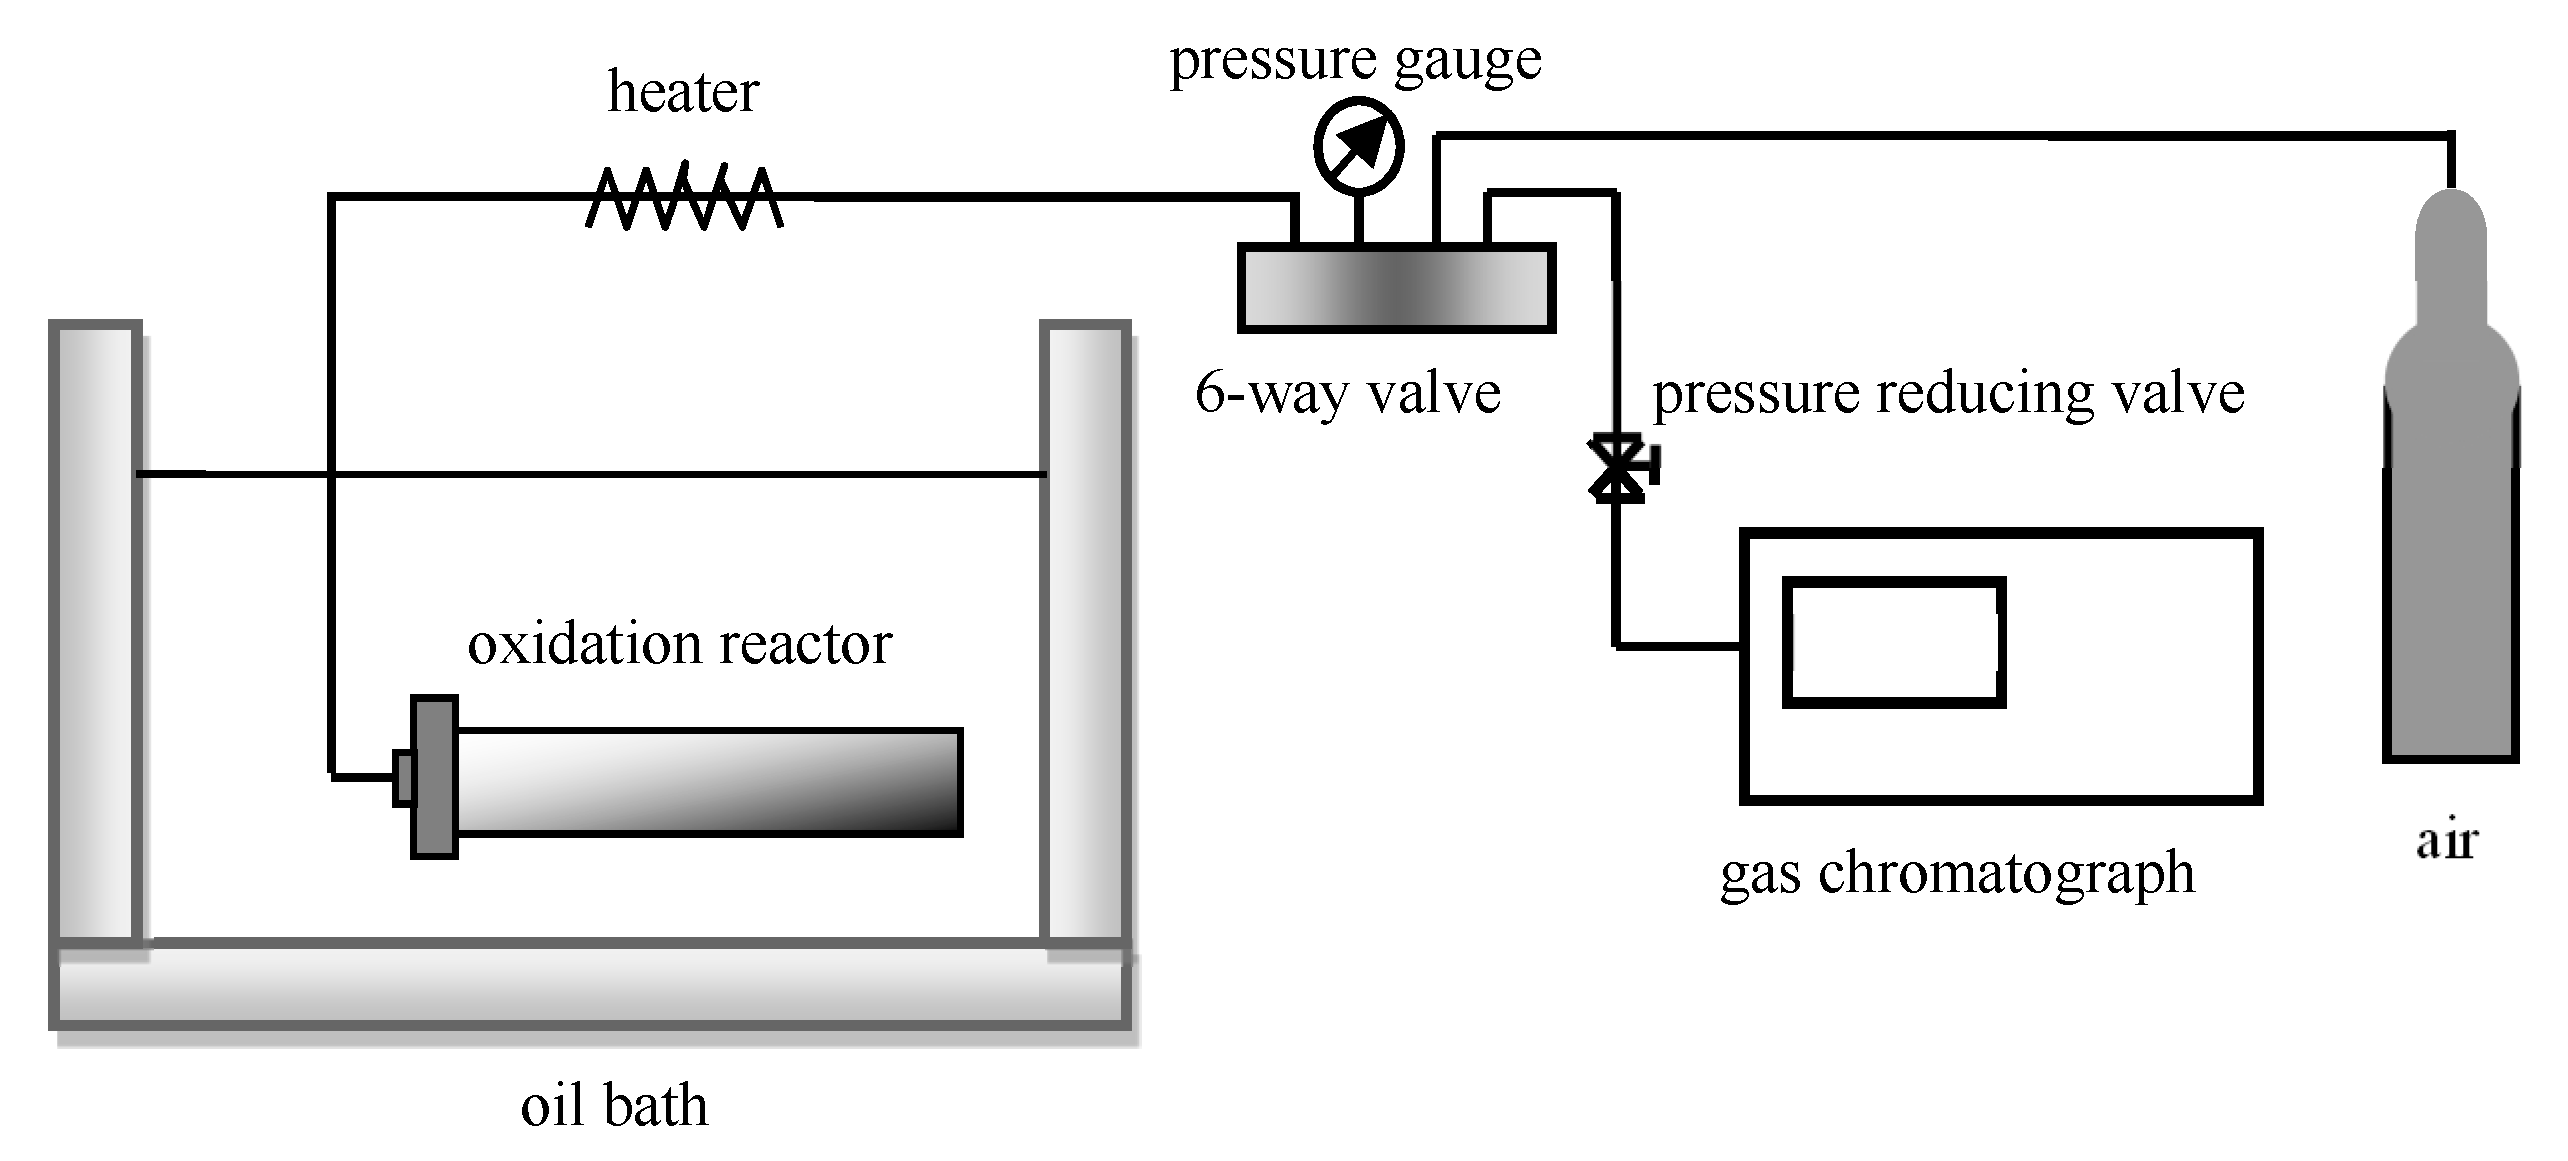
2.2. Experimental Setup

In this study, a vacuum oven (YZF-6032, Shanghai Yaoshi Instrument Equipment Factory, Shanghai, China), an analytical balance (AB105, Shanghai Precision Instrument Company, Shanghai, China), and an ultrasonic disperser (Scientz-2400F, SCIENTZ, China) are used to separate the tight oil into SARA fractions. The operating temperatures of the vacuum oven is from the room temperature to 250 °C with its temperature accuracy of 0.1 °C and the ultimate vacuum less than 133 Pa. The maximum scale of the balance is 105 g with its weighting accuracy of 0.01 mg, while the frequency of ultrasonic disperser is 19.5–20.5 kHz.
The static oxidation experimental setup (Hai’an Petroleum Research Instrument Co., Ltd., Hai’an, China) used in this research is the same as that of the previous study [35,39]. The schematic of the static oxidation experiment setup is shown in Figure 1.
The experimental setup used in thermal analysis consists of a TG-DTG test system (STA6000, PerkinElmer, Waltham, MA, USA) and a FTIR spectrometer (Fourier Infrared Spectrometer, PerkinElmer, Waltham, MA, USA), which is the same as that used in the previous study [37].

2.3. Experimental Procedures

2.3.1. Separation of SARA Fractions

The Changqing tight oil was separated into SARA fractions according to a modified analytical procedure used by Freitag et al. [40]. The separation of Asphaltenes was based on the properties of asphaltenes insoluble in n-pentane. The other three fractions were subsequently separated applying a modified liquid chromatography procedure. Saturates fraction was eluted from the alumina column using n-pentane, aromatics fraction was separated using toluene, and resins fraction was eluted out with methanol and tetrahydrofuran. The vacuum oven was used to remove the remaining solvents from the separated fractions, during which nitrogen was used to protect the SARA fractions from oxidation.

2.3.2. Static Oxidation Experiments

The static oxidation experiment method applied in this study was similar as that used in our previous research [41]. The experimental samples were oil or the SARA fraction with or without catalyst added. The experimental pressure was 16 MPa. The catalyst used in this research is cobalt naphthenate which had good oil solubility, and the catalyst dosage was 0.08 mol/L. The LTO reaction rate is determined applying the material balance method [39,42].

2.3.3. TG-FTIR Tests

The TG-FTIR tests were conducted to quantify the catalytic effect of cobalt additive on the oxidation characteristics of the SARA fractions separated from a tight oil. 12 mg sample (oil or its fraction with or without catalyst added) was placed in the alumina crucible of the thermogravimetric analyzer to conduct the tests. The sample was first heated to 180 °C at a heating rate of 50 °C/min, and then kept at 180 °C for 120 min. By using air as a carrier gas (30 mL/min), the oxidized volatiles were directly introduced to the IR gas cell of the FTIR spectrometer for on-line analysis. The transfer line used in the setup was kept at 180 °C to prevent any condensation of the released gaseous products.
To exclude the influence of the organic groups of catalyst, the anhydrous cobalt chloride (CoCl2) was used as the catalyst in TG-FTIR test. The catalyst dispersion method used is the same as that of previous research [37]. The catalyst dosage was 0.08 mol/L in the tests. The catalytic effect of additive is controlled by the metallic portion of the catalyst and is minimally affected by the anions [39], and the change of cobalt additive has a little effect on the reaction [37].

3. Results and Discussion

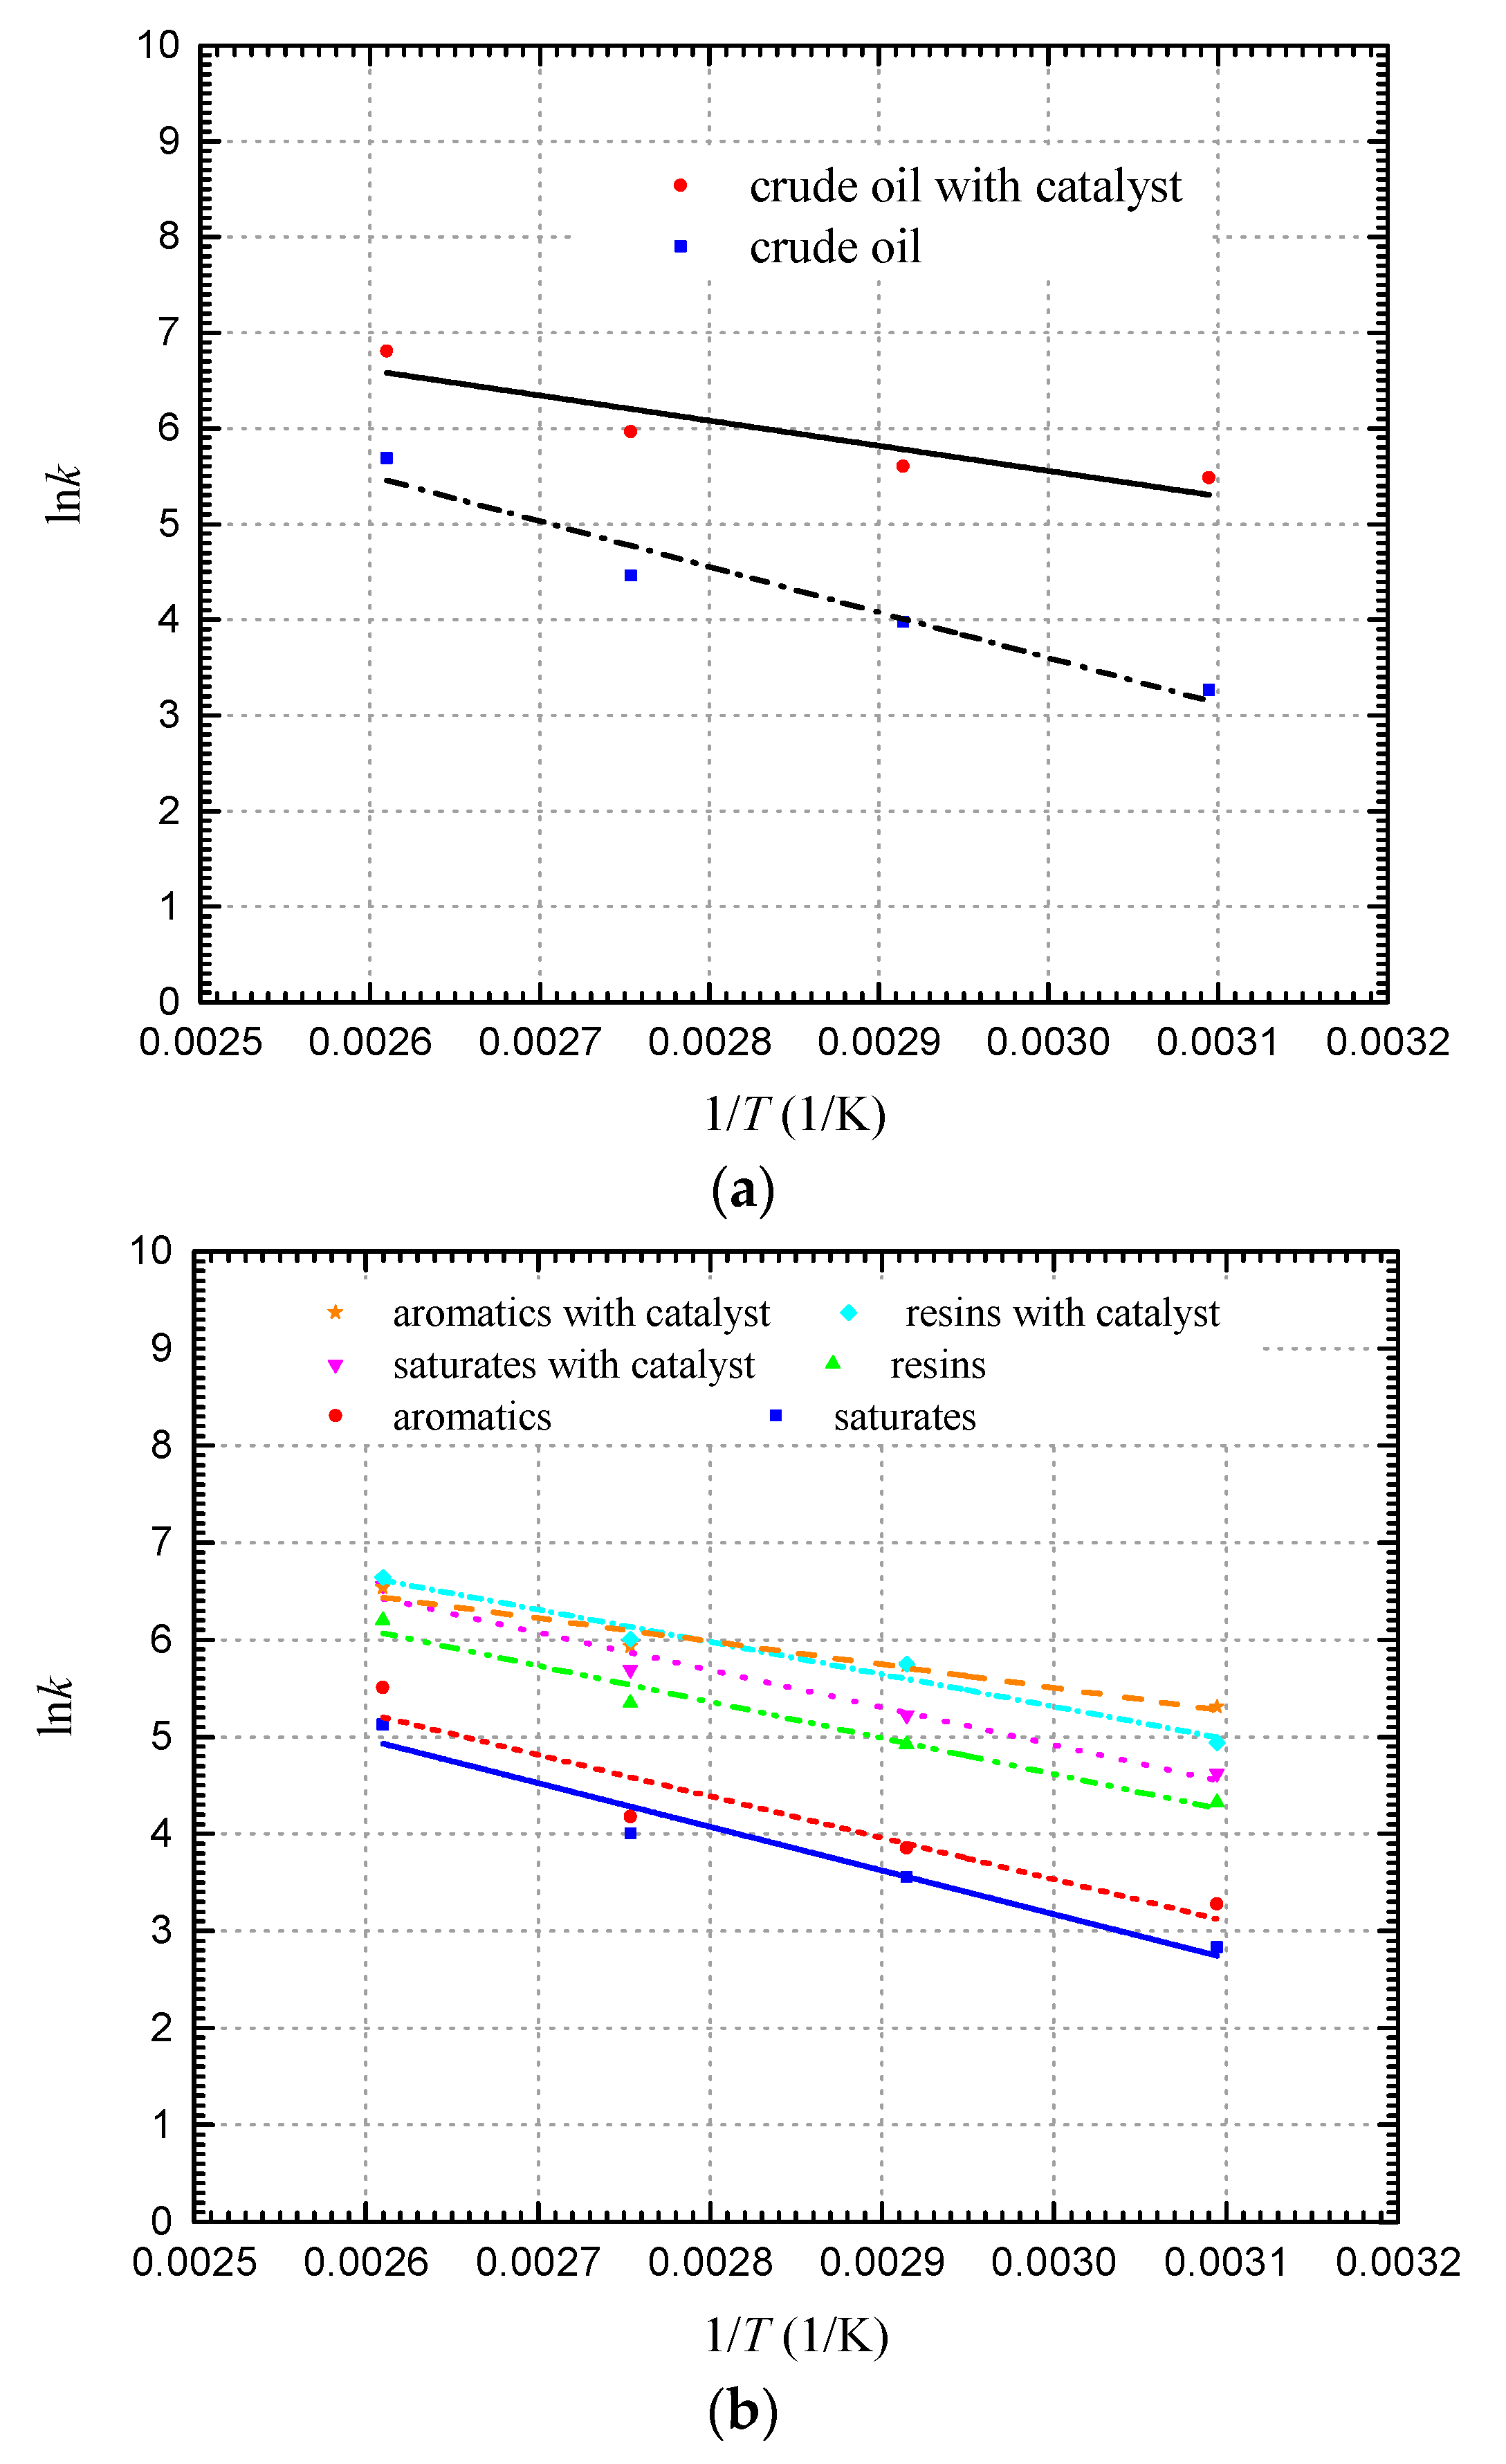
3.1. Catalytic Oxidation Kinetics

The LTO reaction rates of Changqing tight oil and SARA fractions with and without catalyst at 16 MPa are tabulated in Table 3. To identify the catalytic mechanisms, the changes in kinetic parameters of LTO before and after adding cobalt additive are studied applying the simplified Arrhenius model [3].
d c ( O 2 ) d t = f · e E / R T
l n d c ( O 2 ) d t = l n f E R T
The relationship between oxygen consumption rate and absolute temperature at 16 MPa is shown in Figure 2. The LTO activation energies of crude oil and its fractions with or without catalyst added are summarized in Table 4. The cobalt additive can decrease the LTO reaction activation energy of oil and SARA fraction obviously. The activation energy of crude oil is reduced to 21,864 J/mol from 39,571 J/mol due to the catalyst. The activation energy of aromatics is decreased by 44.3% from 35,606 J/mol to 19,849 J/mol, while the activation energy of saturates and resins is decreased to 32,088 and 27,700 J/mol from 37,469 and 30,970 J/mol, respectively. As such, the reduction in activation energy is found to be the main mechanism for the cobalt additive catalyzing the LTO of Changqing tight oil. The reduction in LTO reaction activation energy of SARA fractions is the intrinsic reason for the catalysis of crude oil oxidation.

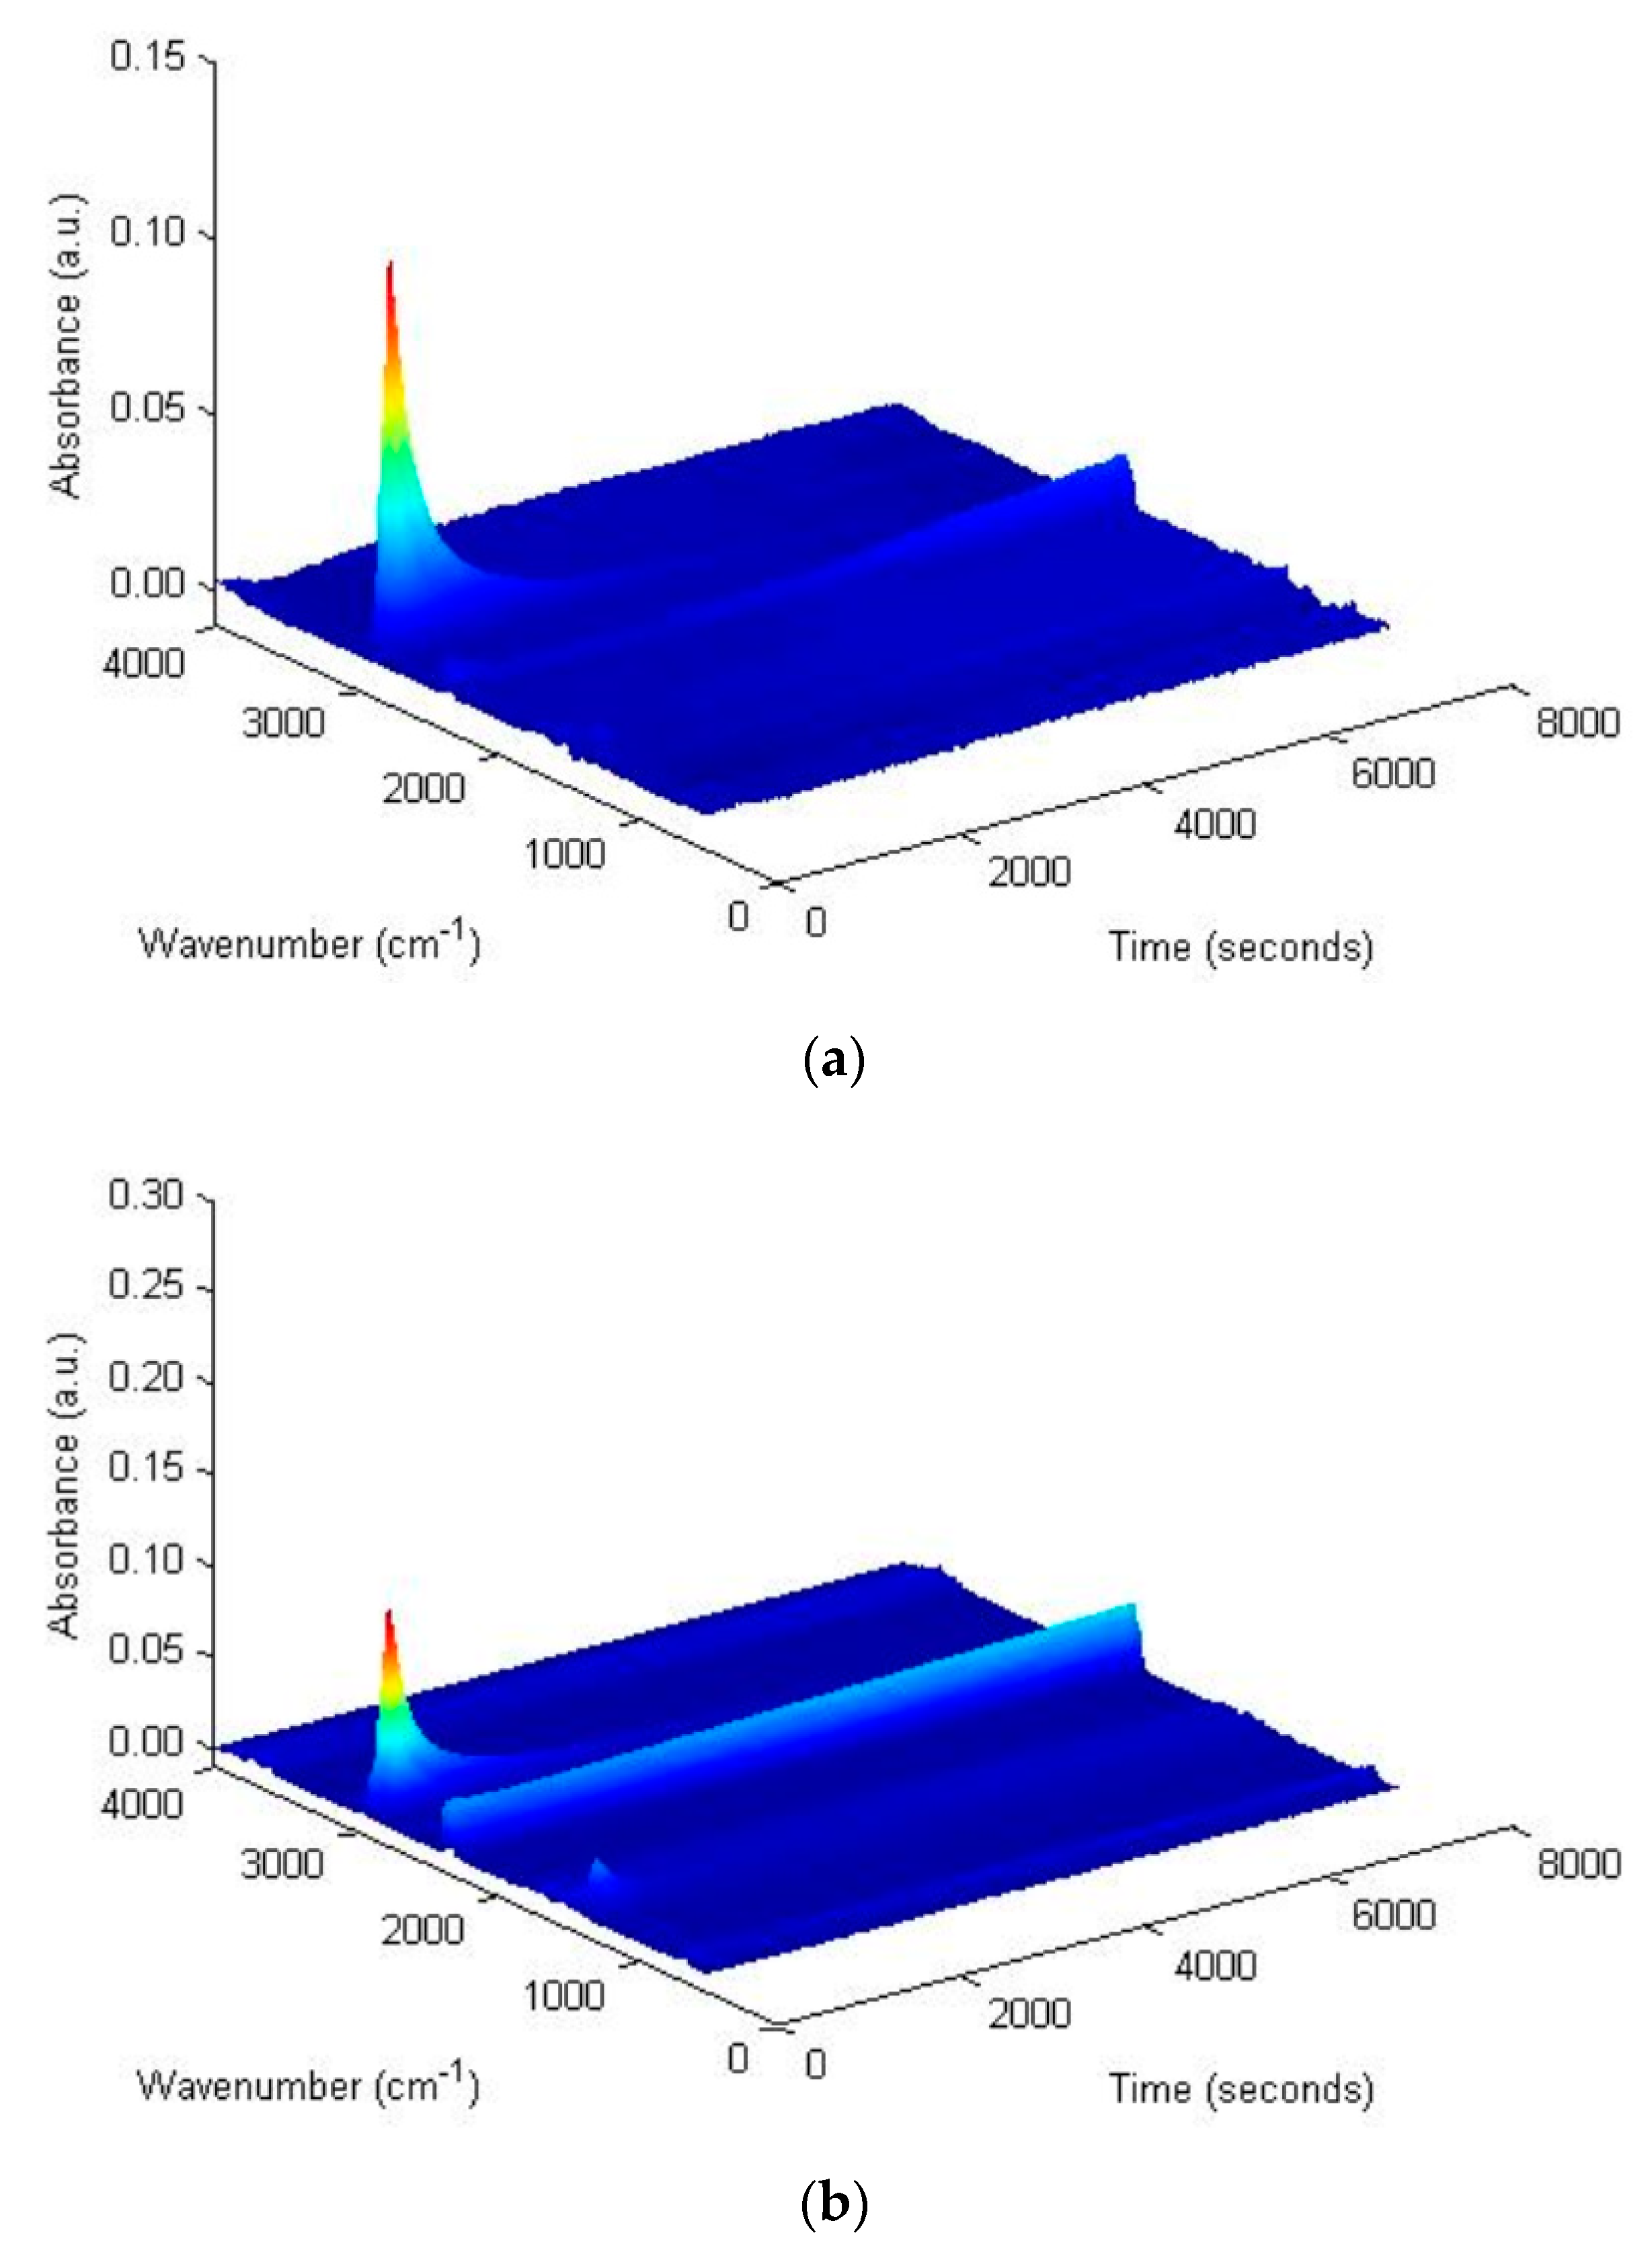
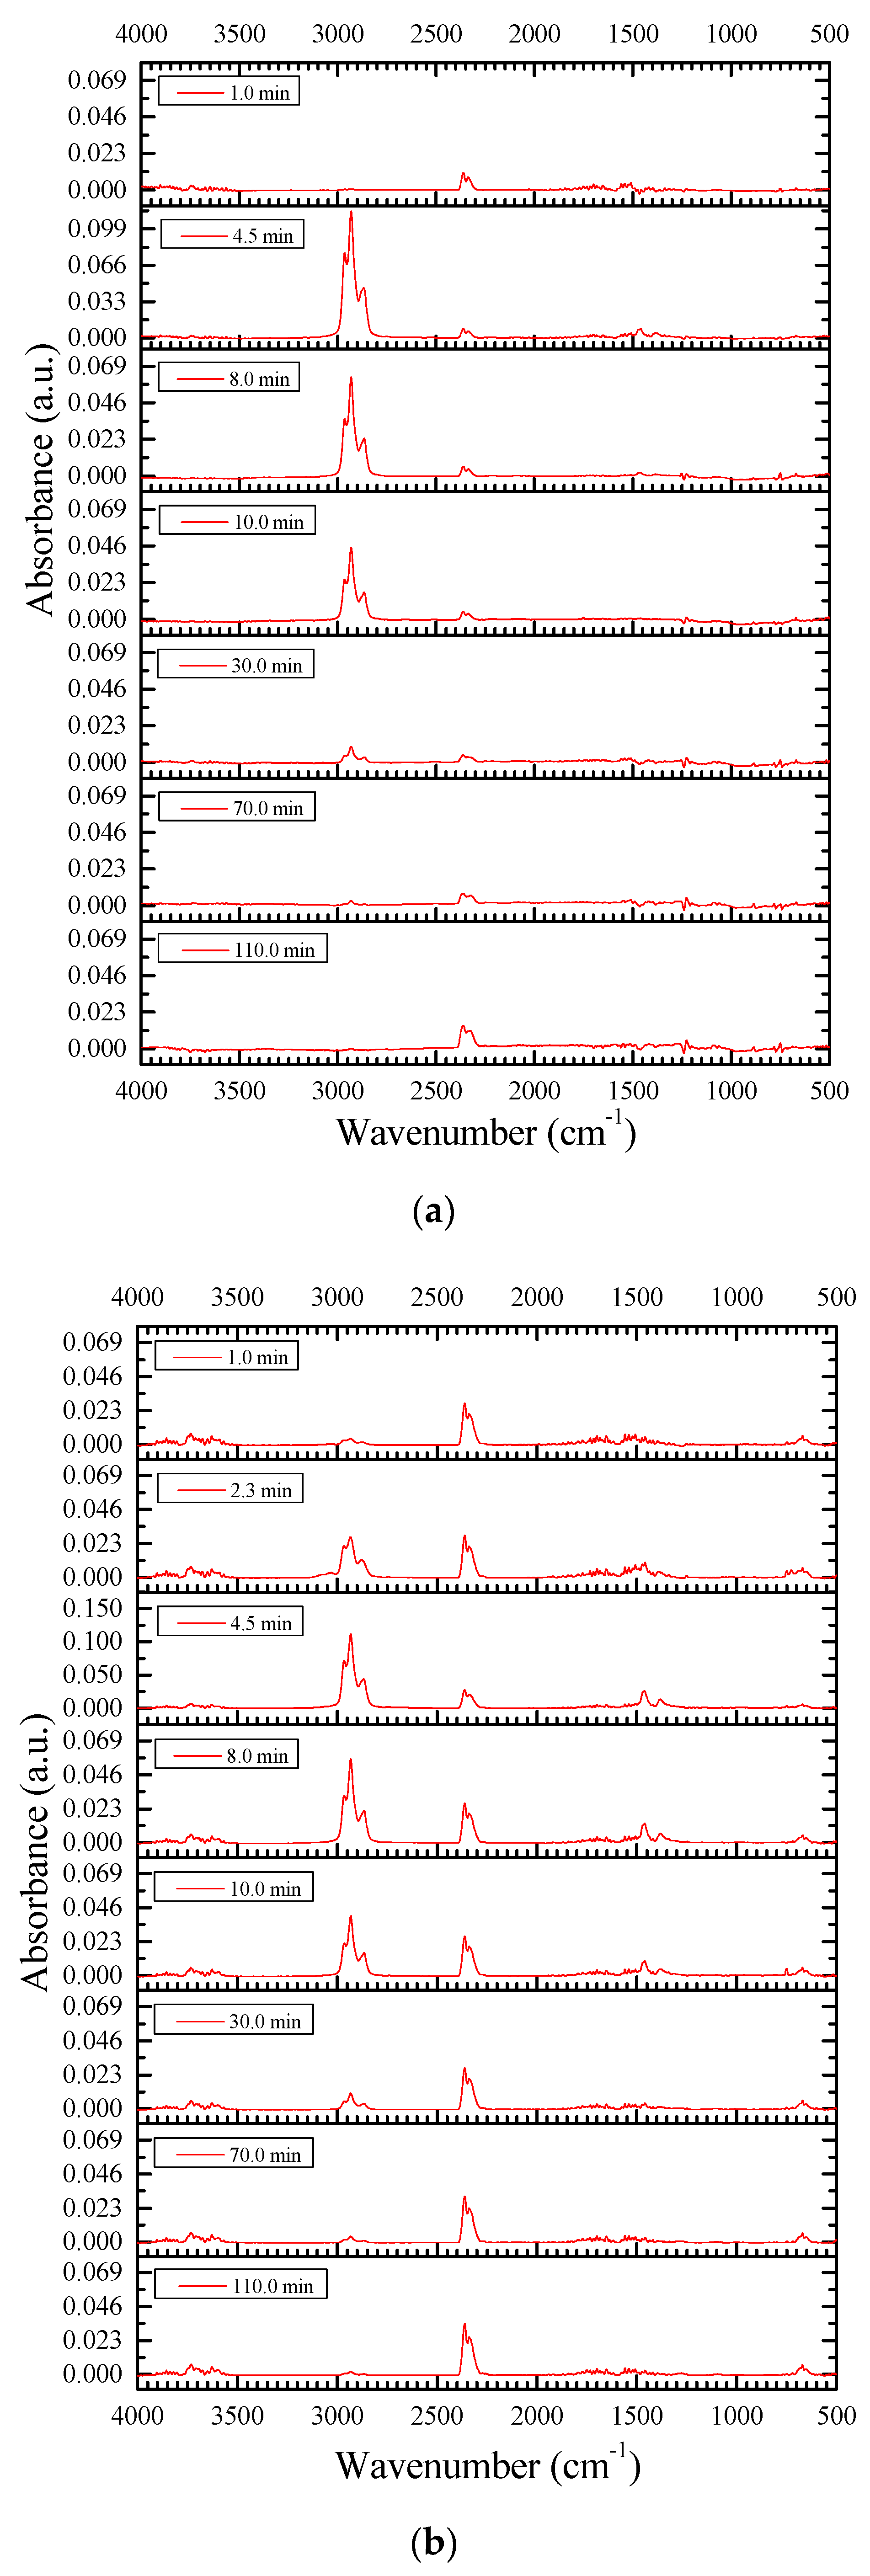
3.2. CLTO Reaction Process of Changqing Tight Oil Fractions

The catalytic effect of the cobalt additive on the LTO reaction pathway of SARA fractions is examined by analyzing the composition changes of evolved gas during the LTO and CLTO process by performing TG-FTIR tests. The catalytic oxidation characteristics of Changqing tight oil was researched before, as described in the reference [37].

3.2.1. Saturates Fraction

The mass losses of the saturates with and without catalyst are shown in Figure 3a. At the initial stage of the test, the saturates mass loss is fast. For t < 20.0 min, the mass loss during the CLTO of the saturates is lower than that during the LTO test. Afterwards, the mass loss rate during the LTO of the saturates is reduced, becoming lower than that during the CLTO of the saturates. When the tests end at t = 120.0 min, the residual mass after the CLTO of the saturates is 37.89%, which is 2.32% lower than that of the LTO test. The rapid mass loss of saturates at the initial stage of the test is mainly due to the distillation of low-boiling-point hydrocarbons and some LTO products. At the middle and late stages of the test, the continuous mass loss of the saturates is resulted from the volatilization of the oxidation products.
Figure 4 plots the 3D infrared spectra of the gaseous products during the test. The characteristic peak intensities of the functional groups of the gas products all change significantly with the catalyst, especially in the case of CO2 (characteristic peaks for the asymmetric stretching (2360 cm−1) and bending vibrations (670 cm−1)) [43,44]. Figure 3b is the GS curves of saturates fraction. When t < 20.0 min, the gas release rate during the CLTO of the saturates is lower than that during the LTO of the saturates, whereas, when t > 20.0 min, the gas release rate during the CLTO of the saturates is higher. The trend of the GS curves is consistent with that of the TG curves.
Figure 5 displays the infrared spectra of the released gas by the LTO of the saturates with and without the catalyst. With the catalyst added, no new peaks appear in the spectra, but the intensities of the original absorption peaks change dramatically. The most remarkable increases are observed for the characteristic peaks of hydroxyl groups between 3400 cm−1 and 4000 cm−1 [45] and for the characteristic peaks of CO2 at 2360 cm−1 and 670 cm−1, indicating that the catalyst greatly promotes the oxygen addition reaction and bond scission reaction during the saturates LTO process. Additionally, the promotion effect on the bond scission reaction becomes more pronounced as the reaction proceeds. On one hand, the catalytic effect on the oxygen addition reaction causes the oxidation of more hydrocarbons to oxygenated hydrocarbons with higher boiling points, which reduces the mass loss of the saturates during the initial stage of the test. On the other hand, the catalytic effect on the bond scission reaction facilitates the formation of volatile products such as CO2 and H2O, which increase the mass loss during the middle and late stages of the test.

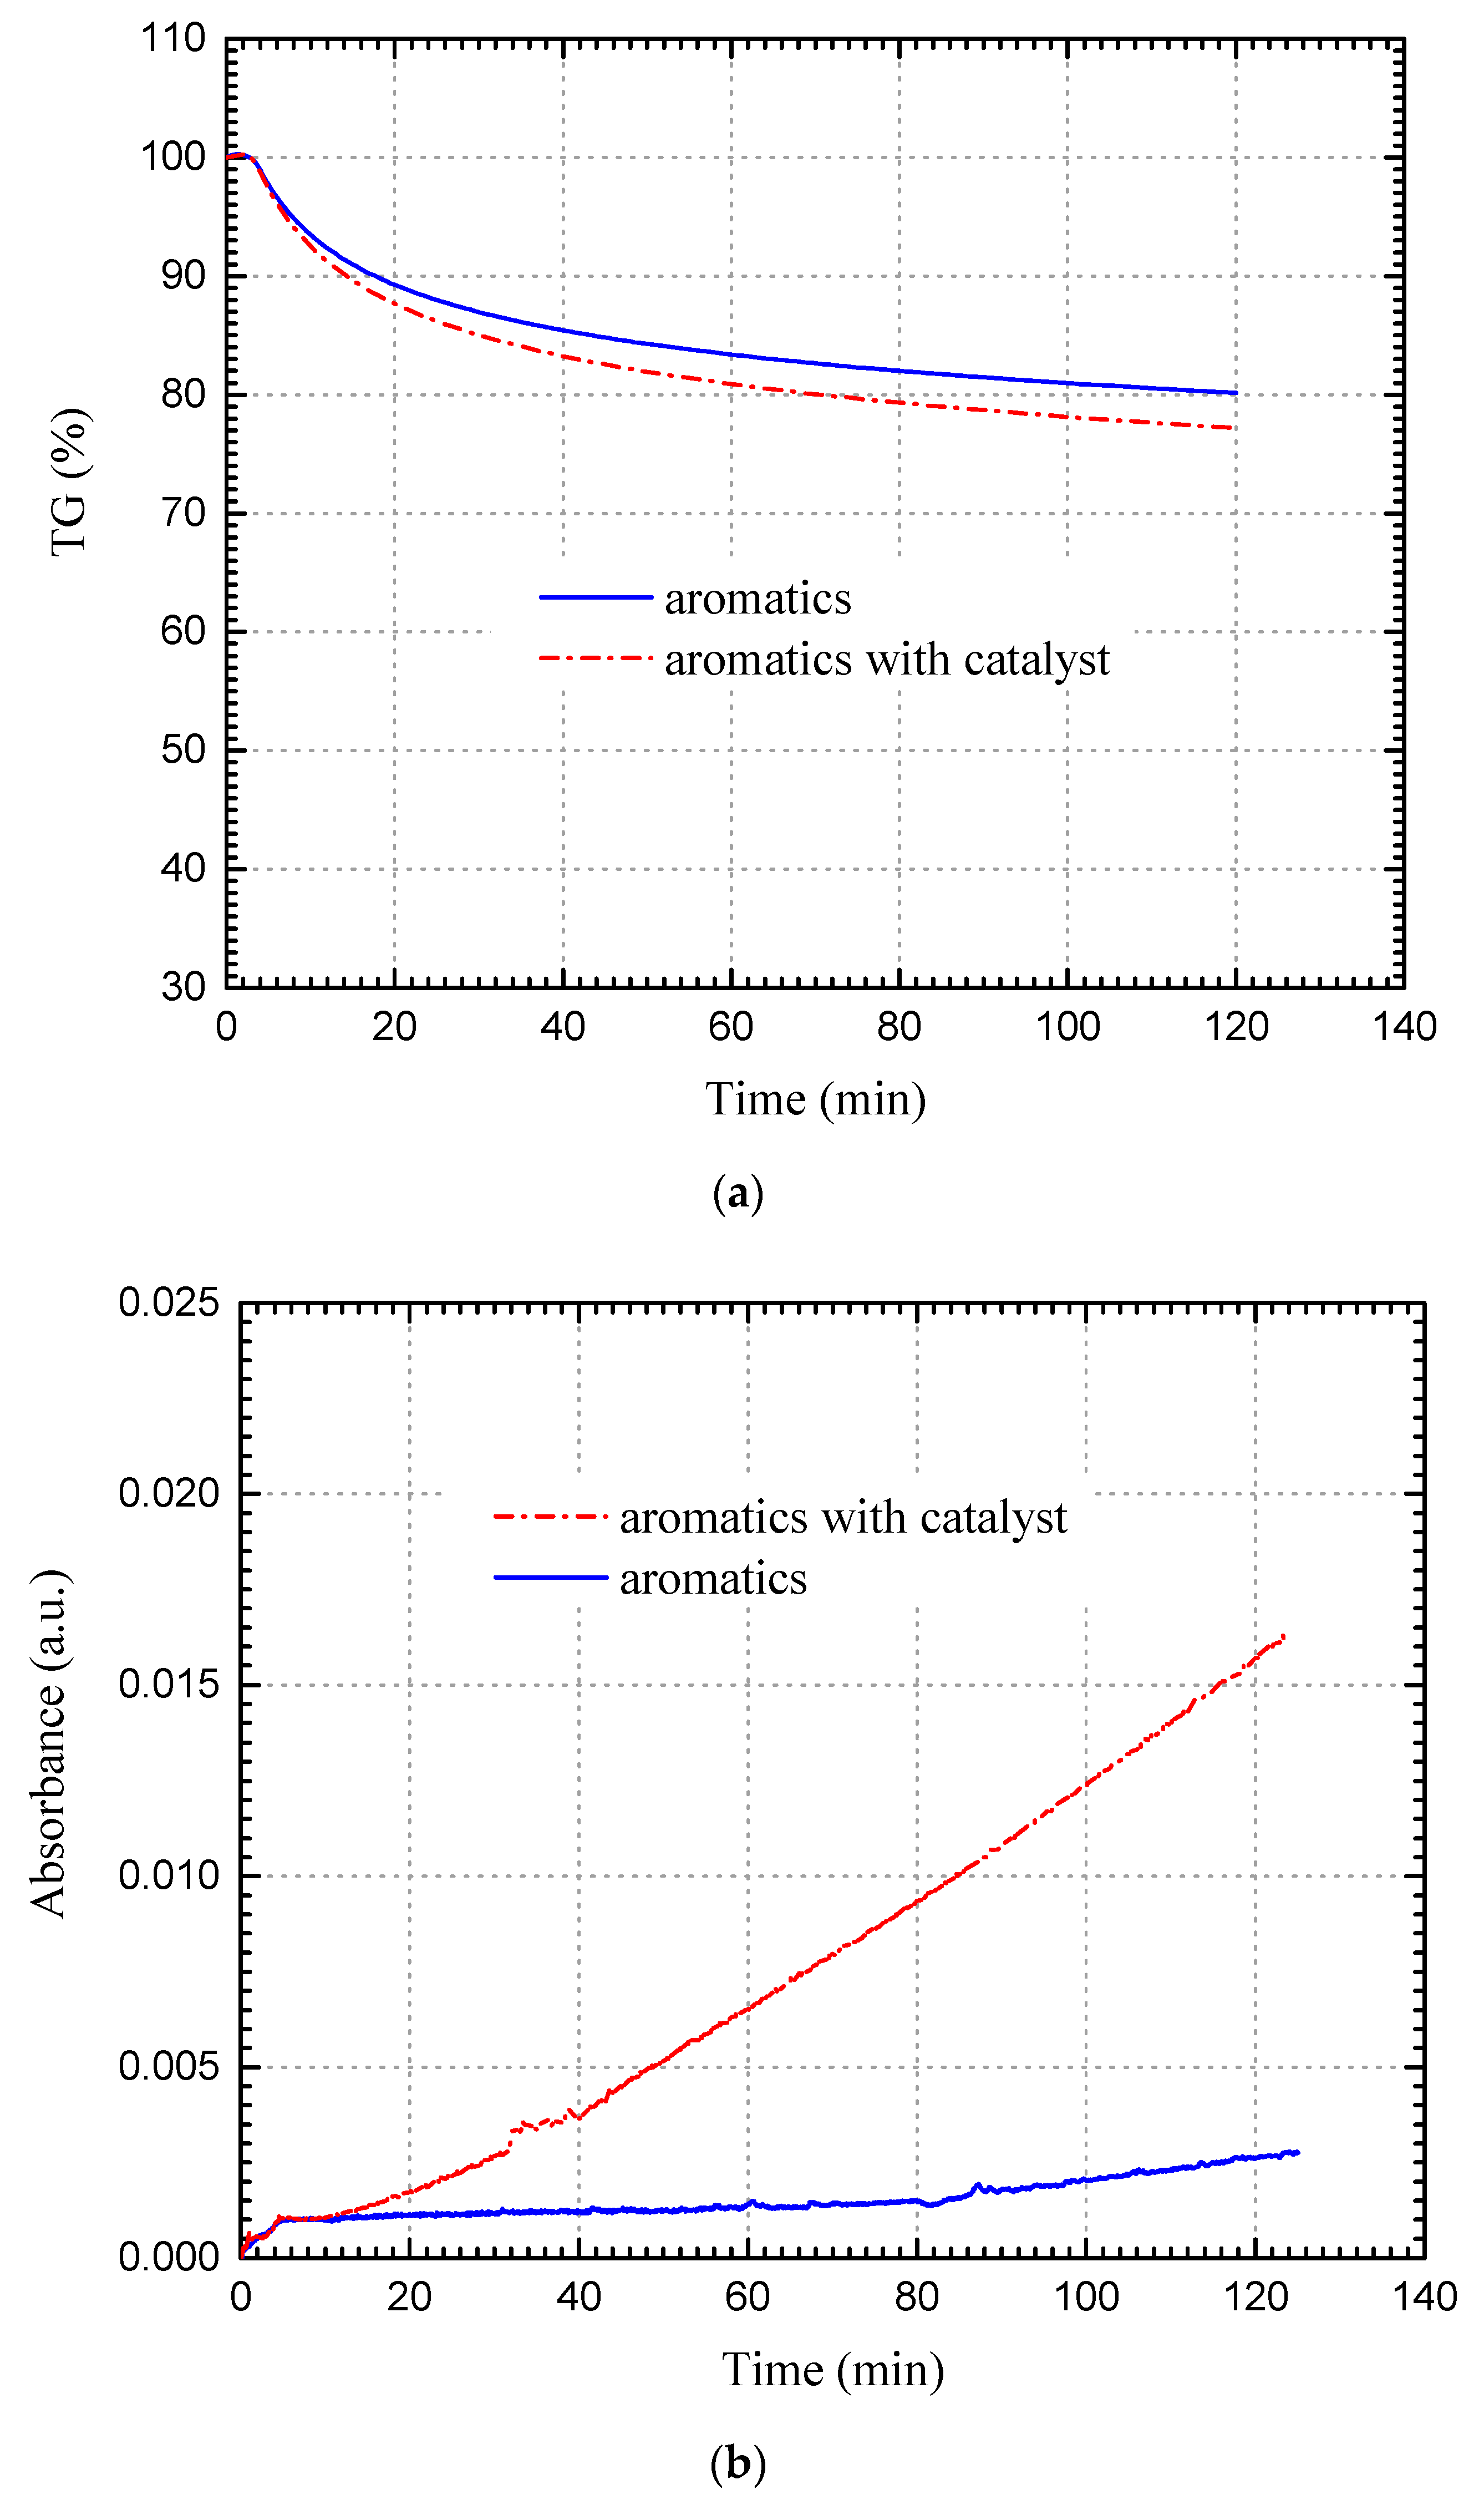
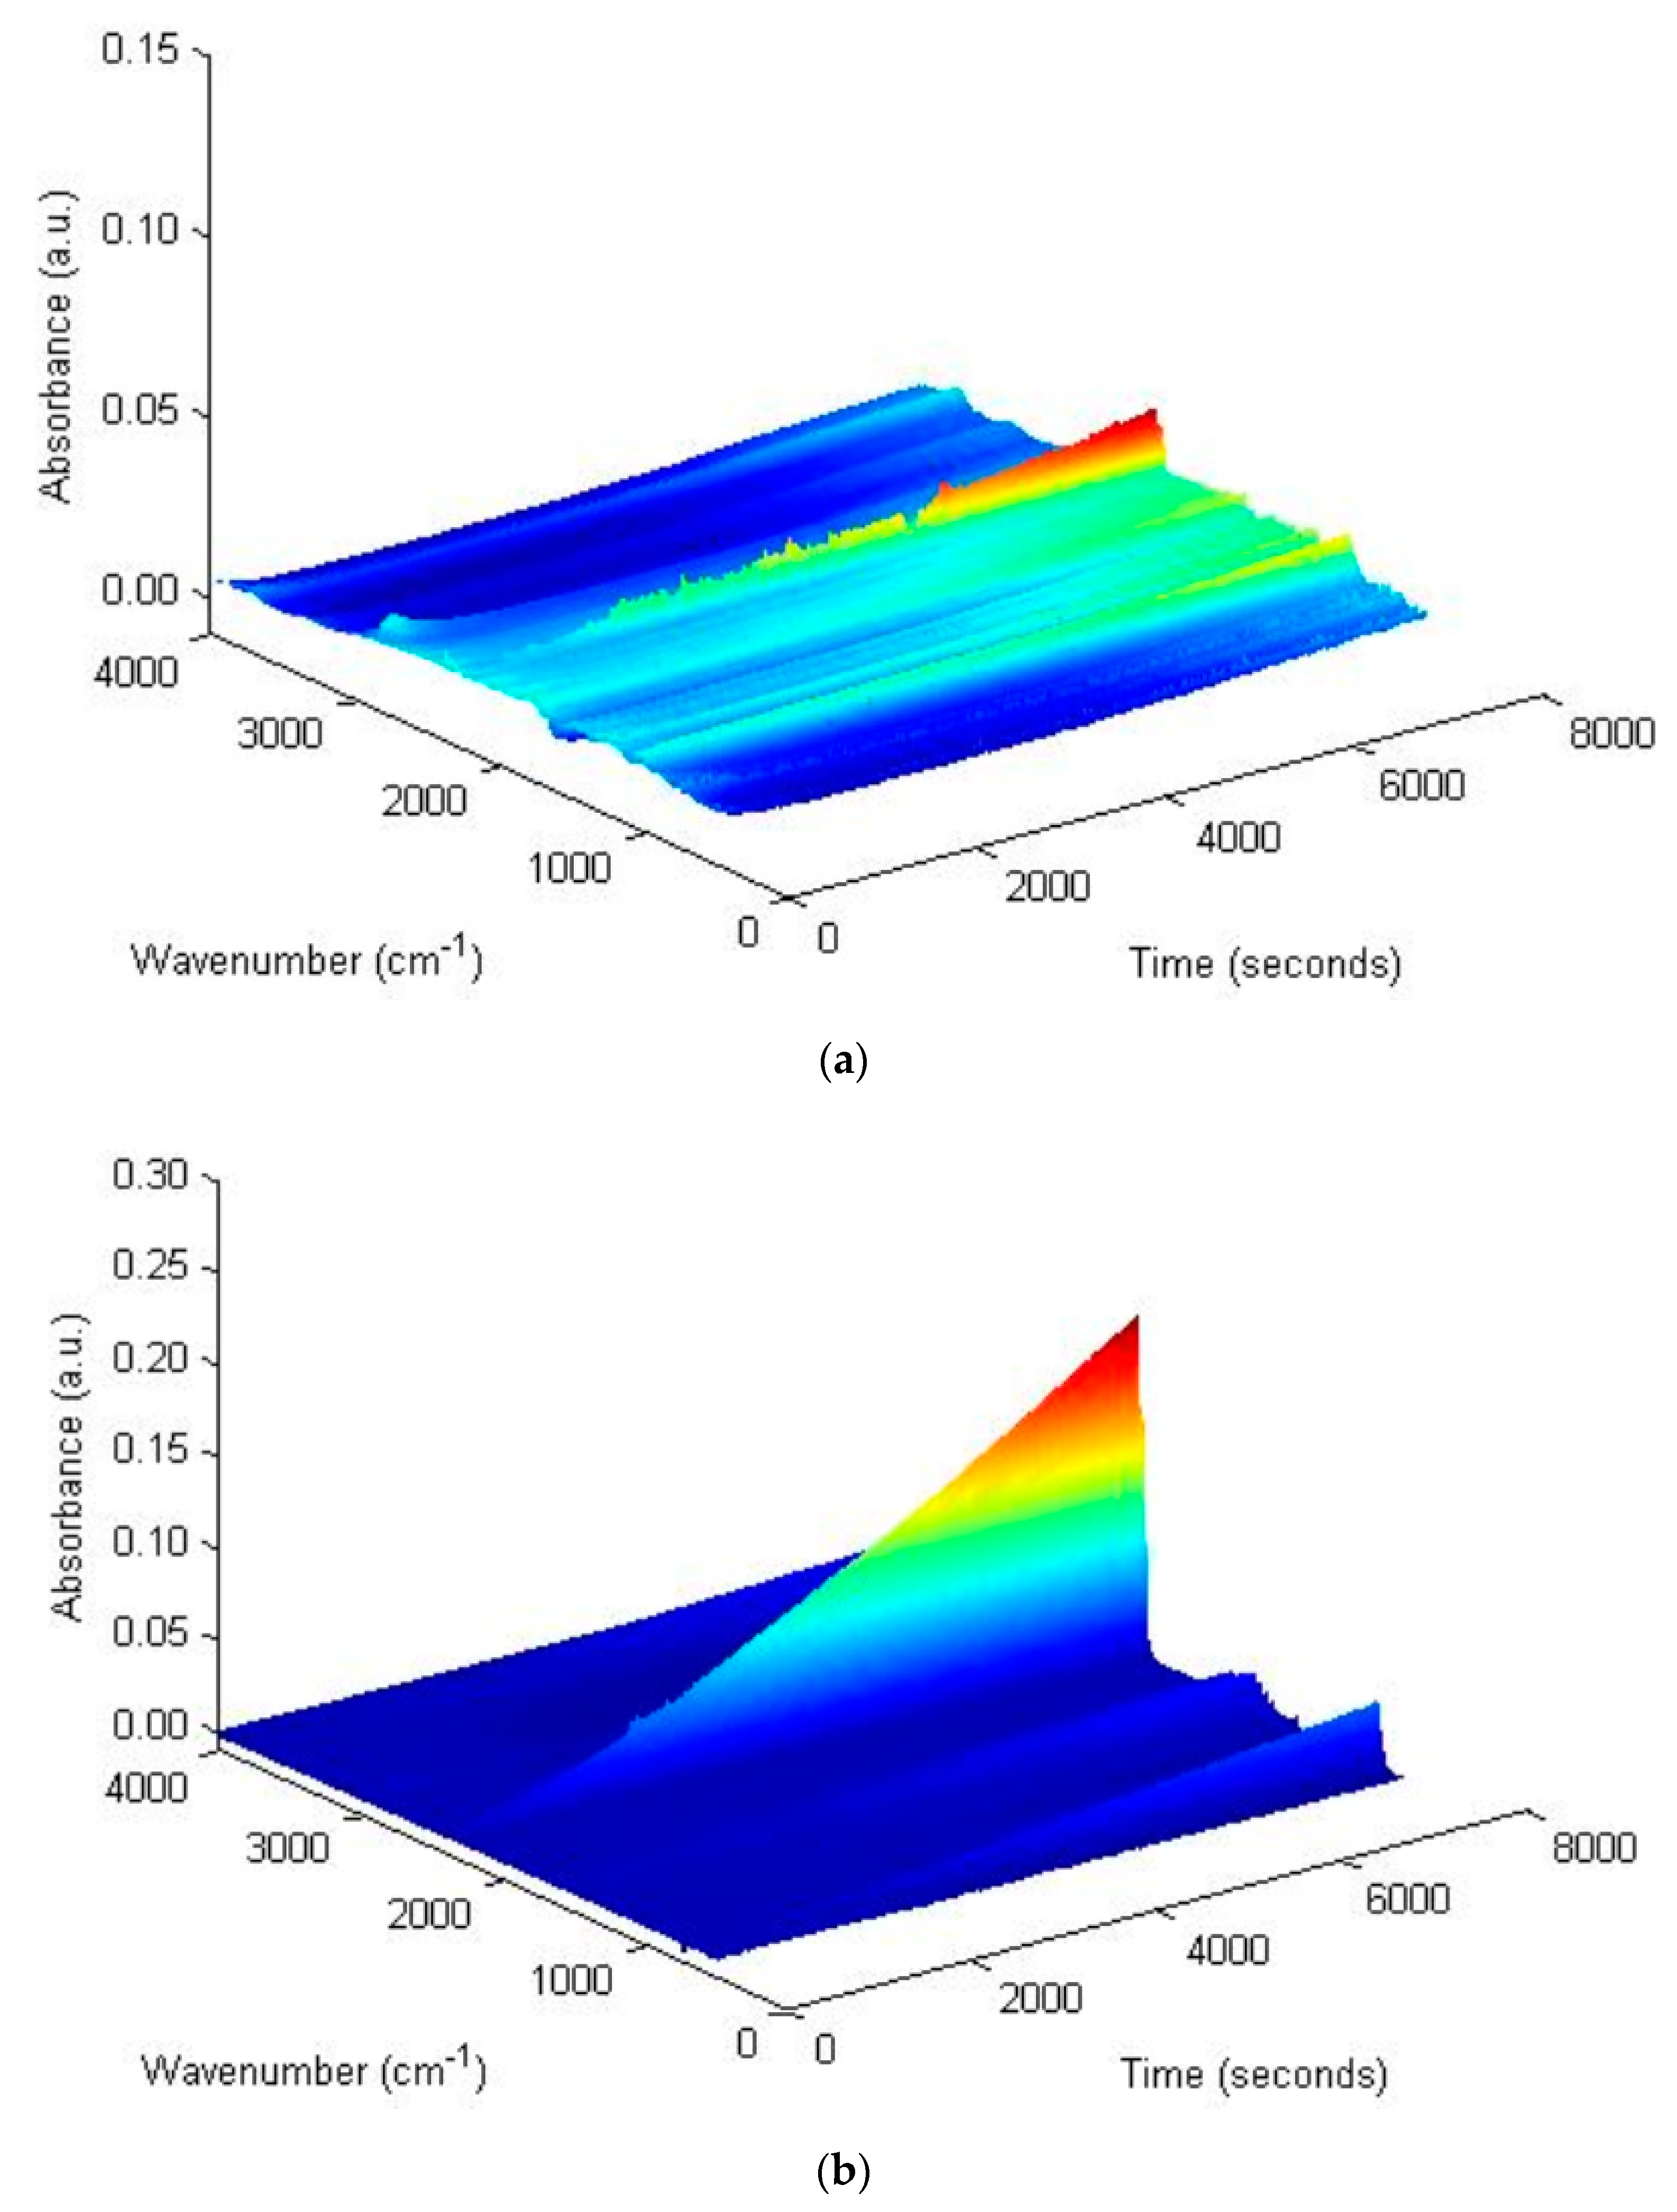
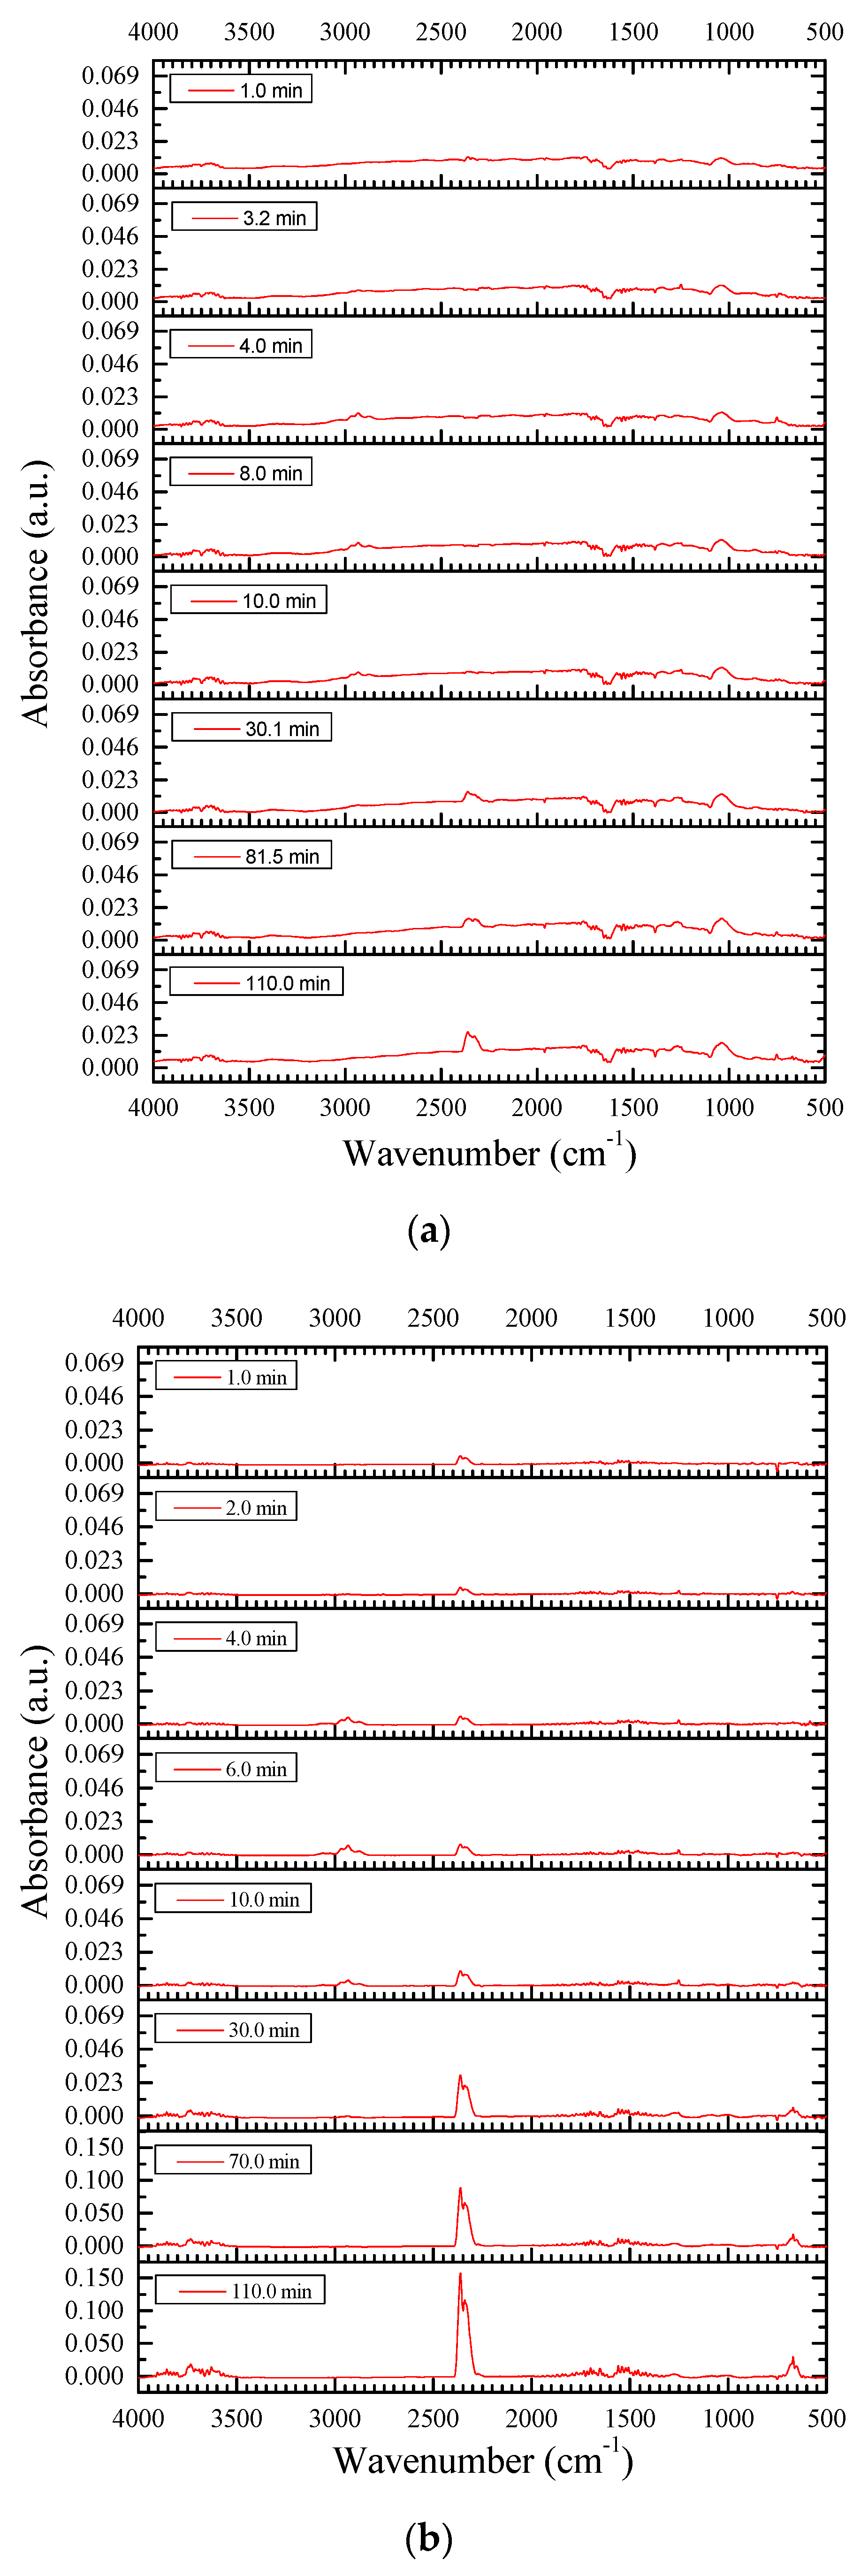
3.2.2. Aromatics Fraction

As shown in Figure 6 and Figure 7, the catalyst imposes no apparent influence on the mass loss trend during the LTO of the aromatics, but it does increase the mass loss rate. At the end of the test, the mass loss during the CLTO of the aromatics is 22.81%, which is 2.97% higher than that during the LTO of the aromatics. Physically, the aromatics has a high molecular weight and a low content of low-boiling-point components, and thus the mass loss due to direct distillation during the test is limited. With the catalyst added, the production of carbon oxides during the LTO is increased, resulting in the rapid increment in gas production, and thereby, the larger mass loss.
Figure 8 depicts the infrared spectra of gas produced by the LTO of the aromatics as a function of time at 180 °C. The absorption peaks change dramatically with the catalyst. Signals corresponding to ethers (absorption peaks between 1000 cm−1 and 1300 cm−1) are greatly weakened or even absent, whereas the peaks corresponding to hydroxyl groups and CO2 were greatly enhanced. The result suggests that the catalyst substantially promotes the oxygen addition reaction and bond scission reaction during the LTO of aromatics. However, it is worthwhile noting that the catalyst behaves selectively, significantly favoring the formation of hydroxyl-containing oxides while inhibiting the formation of ethers. As the reaction proceeds, the catalytic effect on the bond scission reaction becomes more pronounced, leading to a linear increase in the gas production in the GS curve. This phenomenon is the main reason for the growing difference in mass loss between catalytic and noncatalytic oxidations of aromatics at the middle and late stages of the test.

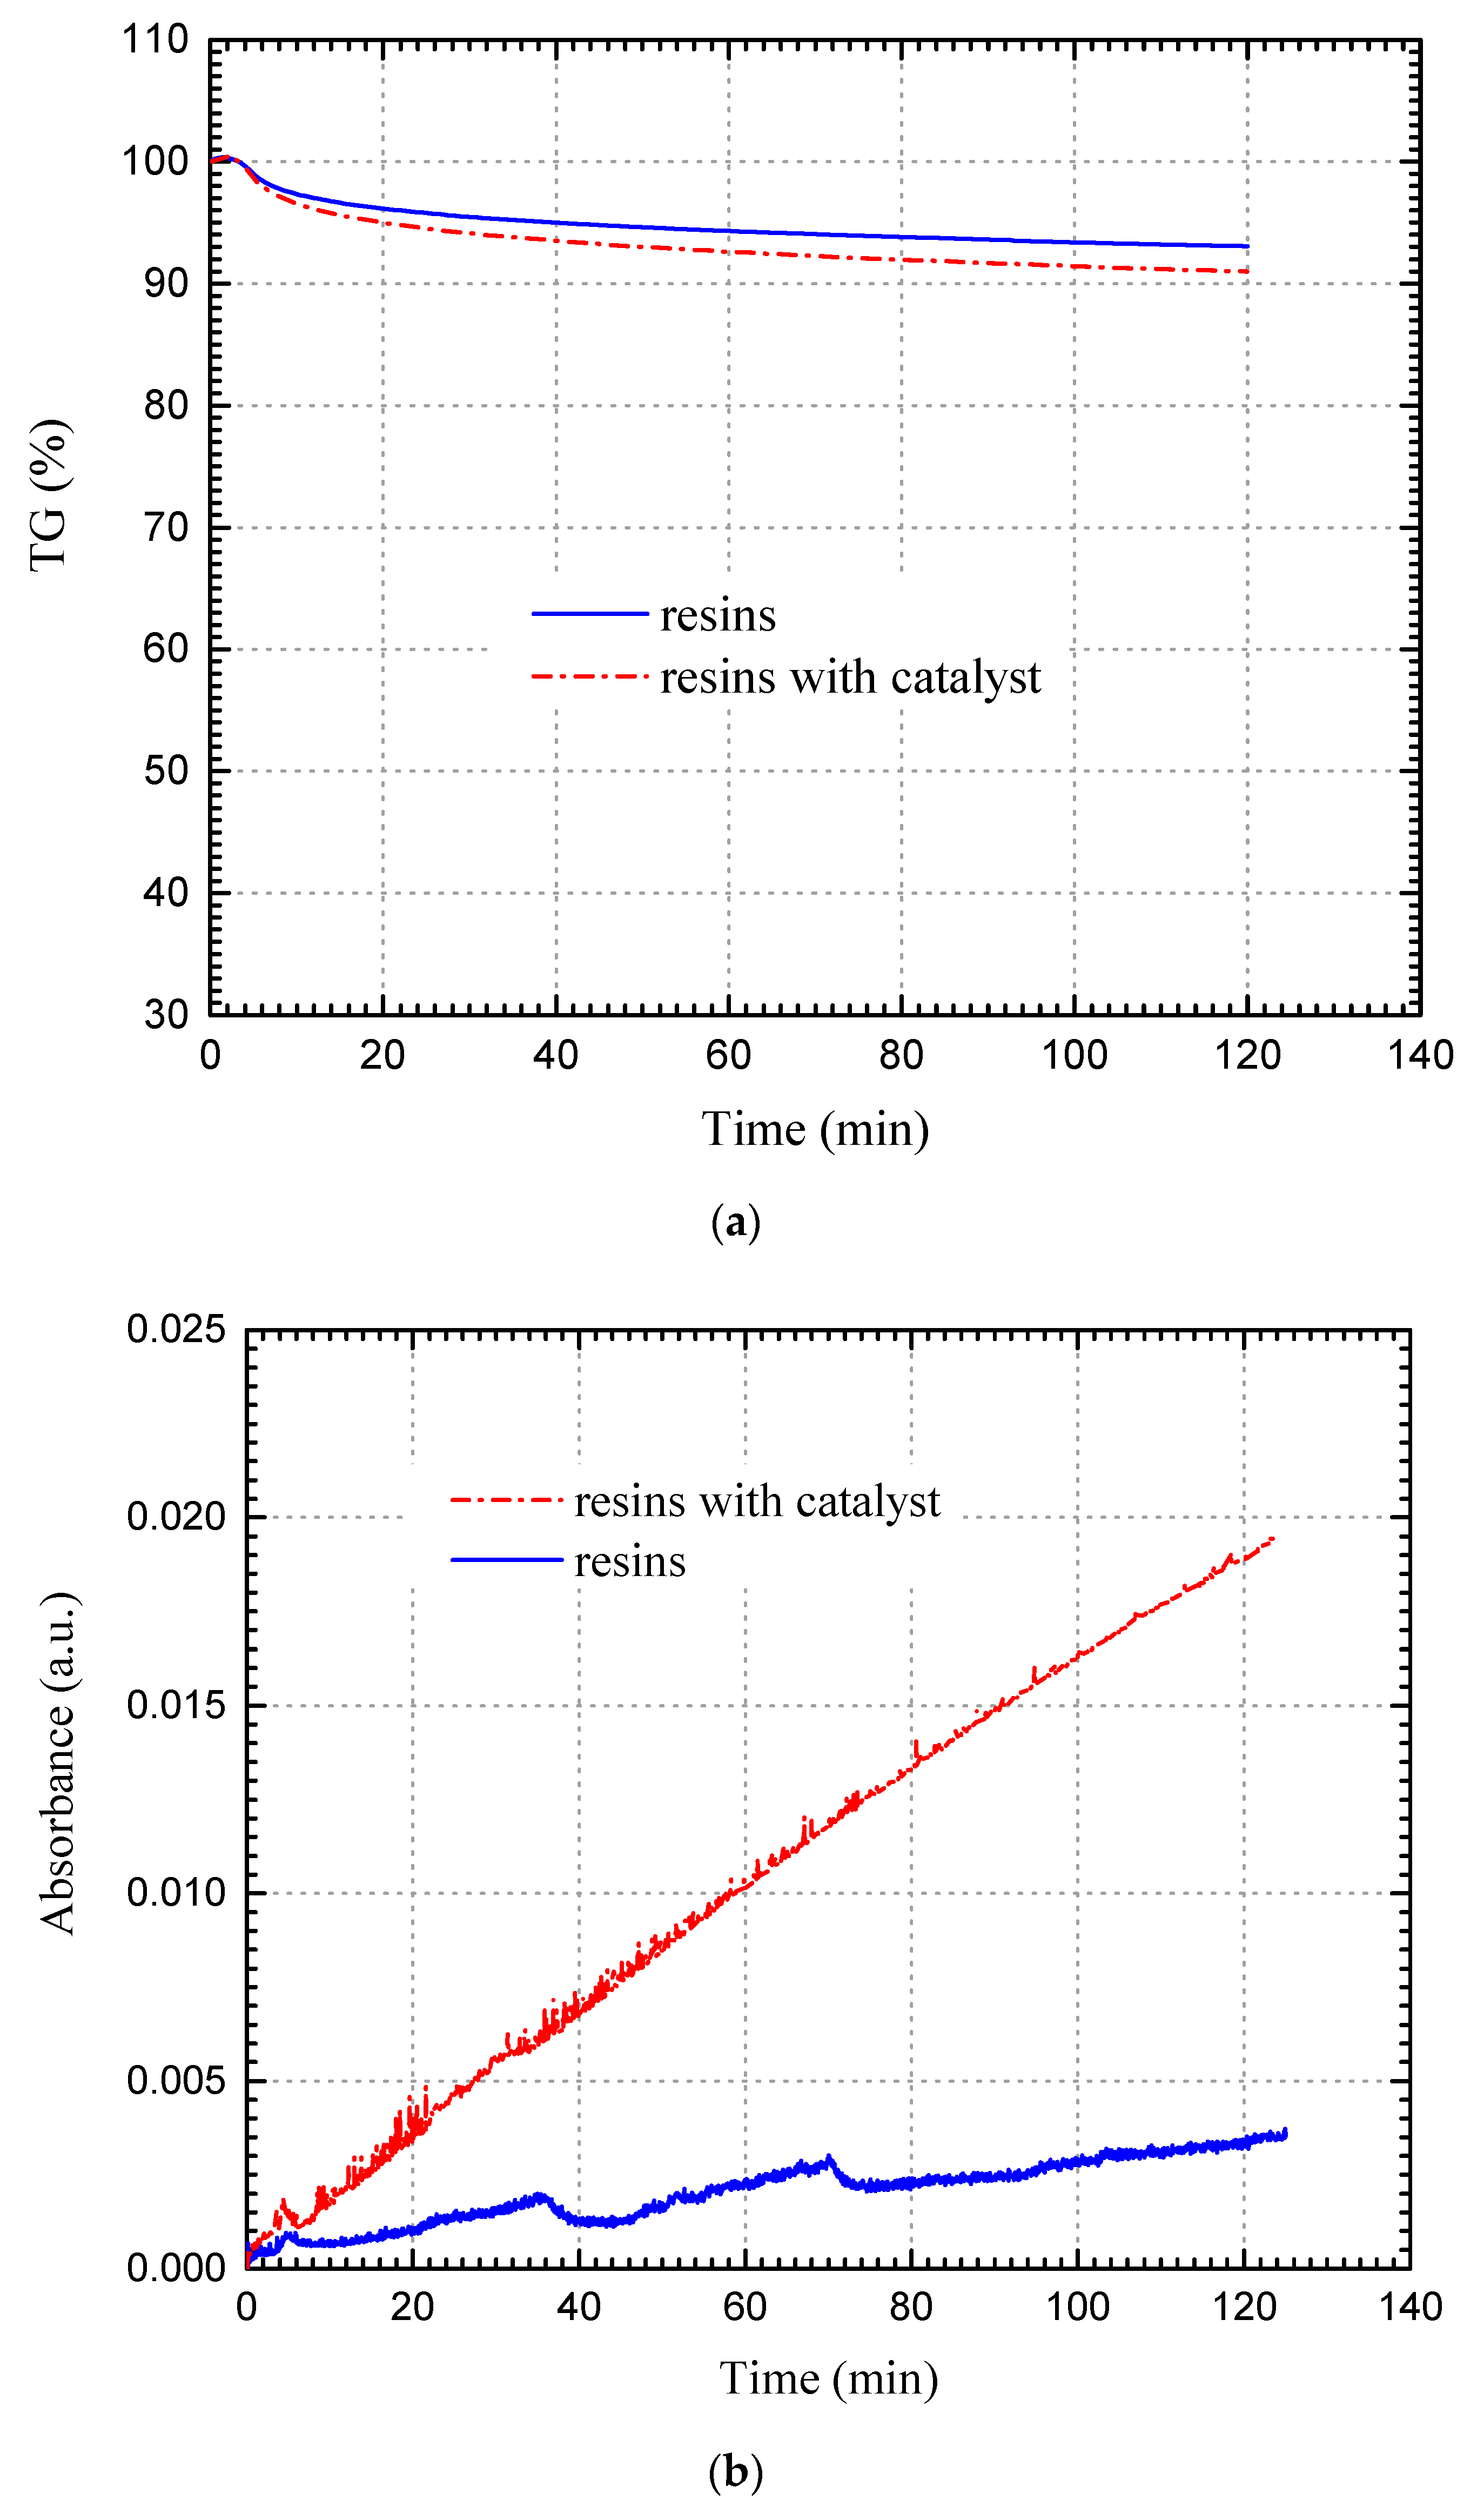
3.2.3. Resins Fraction

Resins is a heavy fraction of crude oil, which exhibits complex molecular structures and a high boiling point [44]. The mass loss caused by direct distillation during the test is therefore limited. Similar to the observations on aromatics, the catalyst does not affect the trend of mass loss during the LTO of resins but increases the mass loss rate (see Figure 9a). At the end of the test, the mass loss of the CLTO of the resins is 9.0%, which is 2.07% higher than that of the noncatalytic LTO. With the catalyst added, the intensities of the CO2 absorption peaks in the 3D infrared spectra of the resins increase significantly as the reaction proceeds (see Figure 10); on the GS curves, the gas production increases linearly (see Figure 9b). These changes are consistent with the changes of the TG curve.
With the catalyst, the change in the infrared spectra of the resins is similar to that of the aromatics. The absorption peaks corresponding to ethers are basically absent, whereas the absorption peaks for hydroxyl groups and CO2 are enhanced significantly (see Figure 11). The result suggests that the catalyst significantly promotes the oxygen addition reaction and bond scission reaction. As the reaction proceeds, the promotion effect on the bond scission reaction becomes more pronounced, and the production of CO2 increases sharply.

3.3. Catalytic Oxidation Characteristics of Changqing Tight Oil and SARA Fraction

As can be seen from the above TG-FTIR tests, the cobalt salt imposes an obvious catalytic effect on the LTO of SARA fractions. The catalyst significantly changes the reaction pathways of the LTO of SARA fractions, which is the intrinsic reason for its catalytic effect on Changqing tight oil oxidation.
As shown in Figure 12, during the initial stage of the CLTO of crude oil, the gas is mainly produced from the saturates, and the contributions of aromatics and resins are small. The findings are similar to those observed for the noncatalytic LTO of crude oil; however, the gas production from resin and aromatic fractions increases rapidly at the middle and late stages of the CLTO and exceeds that from the saturate fraction after t = 20.0 min. As evidenced by the TG-FTIR studies, the main component of the gas after 20 min is CO2 generated by the bond scission reaction. Thus, the intensities of the bond scission reaction of SARA fractions during the middle and late stages of the CLTO reaction follow the order of resins > aromatics > saturates. Considering that the reaction intensities of the three fractions are close without the catalyst, it can be inferred that the promotion effect on the bond scission reaction is the most pronounced for the resins, followed by the aromatics, and the weakest for the saturates. The difference in the catalytic activities can be attributed to the difference in the molecular structures of the SARA fractions. Resins is a heavy fraction in crude oil, and its molecules contain a large number of aromatic rings, alicyclic rings, various long and short branches, and heteroatoms [44]. Resins possesses a very strong polarity and is easier to react with metal ions to achieve a better catalytic effect than with the aromatic and saturate fractions.
Figure 13 illustrates the effect of the catalyst on CO2 production (i.e., the absorbance of peak corresponding to the asymmetric stretching (2360 cm−1) of CO2) during the LTO of Changqing tight oil and its SARA fractions. At initial stage of the CLTO, a large amount of CO2 is produced from the saturate fraction, but the growth rate in CO2 production from saturates is lower than those from the aromatics and resins. As a result, the amount of CO2 produced from the saturate fraction is the lowest at the middle and late stages of the CLTO. This result indicates that the saturates in the SARA fractions is most susceptible to the promotion effect on the bond scission reaction, but the catalytic effect is not the strongest. Under the same conditions, the strongest promotion effect on the bond scission reaction occurs with that of the resin fraction.
The catalytic oxidation mechanisms of Changqing tight oil were identified by the free radical chain reaction theory and the coordination catalysis theory, as described in our previous research [37]. The catalyst can increase the formation rate of organic peroxides. As a result, the degenerate-branching chain reaction is promoted, and the formation of CO2 and oxygenated hydrocarbons, such as alcohol and carboxylic acid, is increased. The dispersed cobalt metal ions interact with the aromatic rings or heteroatoms in the crude oil to form coordination complexes between the metal ions and crude oil fractions. Aromatics and resins are heavy fractions of crude oil, which contain more aromatic rings or heteroatoms than saturates [44], so the catalytic effect on the oxidation reaction is more pronounced for aromatics and resins fractions.

4. Conclusions

The cobalt additive can significantly enhance the oxygen consumption capacity of Changqing tight oil and promote the formation of carbon oxides, which are beneficial to the successful application of the air injection technology for tight oil reservoir development.
  • The cobalt-salt catalyst can reduce the LTO reaction activation energies of Changqing tight oil and its SARA fractions. The catalytic effect on LTO of SARA fractions is the intrinsic reason for the significant catalysis of Changqing tight oil oxidation.
  • The catalyst greatly promotes the oxygen addition reaction and bond scission reaction of saturates, aromatics and resins, and the promotion effect on the bond scission reaction is stronger. The promotion effect on the bond scission reaction is the most pronounced for the resins, followed by the aromatics, and the weakest for the saturates.
  • The catalyst significantly changes the reaction pathways of the LTO of SARA fractions. The formation of hydroxyl-containing oxides and CO2 from the oxidation of saturates, aromatics and resins is promoted, while the formation of ethers from the oxidation of aromatics and resins is inhibited.

Author Contributions

T.W. completed the investigation; T.W. and J.W. designed the research; T.W. completed the experiments; T.W. and J.W. in charge of writing.

Funding

The authors gratefully acknowledge the financial supports from CSC Scholarship (Grant No. 201806455023), Shandong Provincial Natural Science Foundation, China (Grant No. ZR2017BEE023), and The Fundamental Research Funds for the Central Universities (Grant No. 24720182162A).

Conflicts of Interest

The authors declare no conflict of interest.

References

  1. Jia, H.; Sheng, J.J. Numerical modeling on air injection in a light oil reservoir: Recovery mechanism and scheme optimization. Fuel 2016, 172, 70–80. [Google Scholar] [CrossRef] [Green Version]
  2. Huang, S.; Sheng, J.J. Discussion of thermal experiments’ capability to screen the feasibility of air injection. Fuel 2017, 195, 151–164. [Google Scholar] [CrossRef]
  3. Ren, S.R.; Greaves, M.; Rathbone, R.R. Air injection LTO process: An IOR technique for light-oil reservoirs. SPE J. 2002, 7, 90–99. [Google Scholar] [CrossRef]
  4. Gutierrez, D.; Taylor, A.R.; Kumar, V.; Ursenbach, M.G.; Moore, R.G.; Mehta, S.A. Recovery factors in high-pressure air injection projects revisited. SPE Reserv. Eval. Eng. 2008, 11, 1097–1106. [Google Scholar] [CrossRef]
  5. Fraim, M.L.; Moffitt, P.D.; Yannimaras, D.V. Laboratory testing and simulation results for high pressure air injection in a waterflooded North Sea oil reservoir. In Proceedings of the SPE Annual Technical Conference and Exhibition, San Antonio, TX, USA, 5–8 October 1997. [Google Scholar]
  6. Adetunji, L.A.; Teigland, R. Light-oil air-injection performance: Sensitivity to critical parameters. In Proceedings of the SPE Annual Technical Conference and Exhibition, Dallas, TX, USA, 9–12 October 2005. [Google Scholar]
  7. Clara, C.; Durandeau, M.; Quenault, G.; Nguyen, T.H. Laboratory studies for light-oil air injection projects: Potential application in Handil field. SPE Reserv. Eval. Eng. 2000, 3, 239–248. [Google Scholar] [CrossRef]
  8. Duiveman, M.W.; Herwin, H.; Grivot, P.G. Integrated management of water, lean gas and air injection: The successful ingredients to IOR projects on the mature Handil field. In Proceedings of the SPE Asia Pacific Oil and Gas Conference and Exhibition, Jakarta, Indonesia, 5–7 April 2005. [Google Scholar]
  9. Pascual, M.; Crosta, D.; Lacentre, P.; Coombe, D. Air injection into a mature waterflooded light oil reservoir-laboratory and simulation results for Barrancas field, Argentina. In Proceedings of the 67th EAGE Conference Exhibition, Madrid, Spain, 13–16 June 2005. [Google Scholar]
  10. Fassihi, M.R.; Yannimaras, D.V.; Kumar, V.K. Estimation of recovery factor in light-oil air-injection projects. SPE Reserv. Eng. 1997, 12, 173–178. [Google Scholar] [CrossRef]
  11. Fassihi, M.R.; Gillham, T.H. The use of air injection to improve the double displacement processes. In Proceedings of the SPE Annual Technical Conference and Exhibition, Houston, TX, USA, 3–6 October 1993. [Google Scholar]
  12. Gillham, T.H.; Cerveny, B.W.; Turek, E.A.; Yannimaras, D.V. Keys to increasing production via air injection in Gulf Coast light oil reservoirs. In Proceedings of the SPE Annual Technical Conference and Exhibition, San Antonio, TX, USA, 5–8 October 1997. [Google Scholar]
  13. Glandt, C.A.; Pieterson, R.; Dombrowski, A.; Balzarini, M.A. Coral creek field study: A comprehensive assessment of the potential of high-pressure air injection in a mature waterflood project. In Proceedings of the SPE Mid-continent operations symposium, Oklahoma, OK, USA, 28–31 March 1999. [Google Scholar]
  14. Stokka, S.; Oesthus, A.; Frangeul, J. Evaluation of air injection as an IOR method for the Giant Ekofisk Chalk Field. In Proceedings of the SPE International Improved Oil Recovery Conference in Asia Pacific, Kuala Lumpur, Malaysia, 5–6 December 2005. [Google Scholar]
  15. Gutierrez, D.; Kumar, V.; Moore, R.G.; Mehta, S.A. Air injection and waterflood performance comparison of two adjacent units in the Buffalo Field. SPE Reserv. Eval. Eng. 2008, 11, 848–857. [Google Scholar] [CrossRef]
  16. Denney, D. 30 years of successful high-pressure air injection: Performance evaluation of Buffalo field, South Dakota. J. Pet. Technol. 2011, 63, 50–53. [Google Scholar] [CrossRef]
  17. Germain, P.; Geyelin, J.L. Air injection into a light oil reservoir: The Horse Creek project. In Proceedings of the SPE Middle East Oil Show and Conference, Awali, Bahrain, 15–18 March 1997. [Google Scholar]
  18. Bagci, S.; Celebioglu, D. Light oil combustion with metallic additives in limestone medium. In Proceedings of the Canadian International Petroleum Conference, Calgary, AB, Canada, 8–10 June 2004. [Google Scholar]
  19. Shallcross, D.C.; De los Rios, C.F.; Castanier, L.M.; Brigham, W.E. Modifying in-situ combustion performance by the use of water-soluble additives. SPE Reserv. Eng. 1991, 6, 287–294. [Google Scholar] [CrossRef]
  20. Gerritsen, M.; Kovscek, A.; Castanier, L.; Nilsson, J.; Younis, R.; He, B. Experimental investigation and high resolution simulator of in-situ combustion processes; 1. Simulator design and improved combustion with metallic additives. In Proceedings of the SPE International Thermal Operations and Heavy Oil Symposium and Western Regional Meeting, Bakersfield, CA, USA, 16–18 March 2004. [Google Scholar]
  21. Ramirez-Garnica, M.A.; Mamora, D.D.; Nares, R.; Schacht-Hernandez, P.; Mohammad, A.A.; Cabrera, M. Increase heavy-oil production in combustion tube experiments through the use of catalyst. In Proceedings of the SPE Latin American and Caribbean Petroleum Engineering Conference, Buenos Aires, Argentina, 15–18 April 2007. [Google Scholar]
  22. Ramirez-Garnica, M.A.; Hernandez Perez, J.R.; Cabrera-Reyes, M.D.C.; Schacht-Hernandez, P.; Mamora, D.D. Increase oil recovery of heavy oil in combustion tube using a new catalyst based on nickel ionic solution. In Proceedings of the SPE International Thermal Operations and Heavy Oil Symposium, Calgary, AB, Canada, 20–23 October 2008. [Google Scholar]
  23. Fassihi, M.R.; Brigham, W.E.; Ramey, H.J., Jr. Reaction kinetics of in-situ combustion: Part 1—Observations. SPE J. 1984, 24, 399–407. [Google Scholar] [CrossRef]
  24. Fassihi, M.R.; Brigham, W.E.; Ramey, H.J., Jr. Reaction kinetics of in-Situ combustion: Part 2—Modeling. SPE J. 1984, 24, 408–416. [Google Scholar] [CrossRef]
  25. Castanier, L.M.; Baena, C.J.; Holt, R.J.; Brigham, W.E.; Tavares, C. In situ combustion with metallic additives. In Proceedings of the SPE Latin America Petroleum Engineering Conference, Caracas, Venezuela, 8–11 March 1992. [Google Scholar]
  26. Drici, O.; Vossoughi, S. Catalytic effect of heavy metal oxides on crude oil combustion. SPE Reserv. Eng. 1987, 2, 591–595. [Google Scholar] [CrossRef]
  27. He, B.; Chen, Q.; Castanier, L.M.; Kovscek, A.R. Improved in-situ combustion performance with metallic salt additives. In Proceedings of the SPE Western Regional Meeting, Irvine, CA, USA, 30 March–1 April 2005. [Google Scholar]
  28. Wang, H.; Tang, X.; Meng, K.; Cui, Y.; Wang, Z.; Wang, F. Preparation and evaluation of catalyst for heavy oil injected air catalytic oxidation production. Fine Chem. 2009, 33, 179–188. [Google Scholar]
  29. Tang, X.; Cui, Y.; He, B.; Liu, Q.; Meng, K. Experimental study on the viscosity reduction of Liaohe heavy oil by catalytic air oxidation. Oilfield Chem. 2008, 25, 316–319. [Google Scholar]
  30. Pu, W.; Liu, P.; Li, Y.; Jin, F.; Liu, Z. Thermal characteristics and combustion kinetics analysis of heavy crude oil catalyzed by metallic additives. Ind. Eng. Chem. Res. 2015, 54, 11525–11533. [Google Scholar] [CrossRef]
  31. Amanam, U.U.; Kovscek, A.R. Analysis of the effects of copper nanoparticles on in-situ combustion of extra heavy-crude oil. J. Pet. Sci. Eng. 2017, 152, 406–415. [Google Scholar] [CrossRef]
  32. Zhao, Y. Effect of Clay Minerals on Oxidation Characteristics of Air Flooding. Ph.D. Dissertation, Southwest Petroleum University, Chengdu, China, 2014. [Google Scholar]
  33. Jia, H.; Zhao, J.Z.; Pu, W.F.; Zhao, J.; Kuang, X.Y. Thermal study on light crude oil for application of high-pressure air injection (HPAI) process by TG/DTG and DTA tests. Energy Fuels 2012, 26, 1575–1584. [Google Scholar] [CrossRef]
  34. Shi, G. Experimental study on low-temperature oxidation in air injection with supported-catalyst. Spec. Oil Gas. Reserv. 2012, 19, 126–129. [Google Scholar]
  35. Wang, J.; Wang, T.; Feng, C.; Chen, Z.; Kong, D.; Niu, Z. The catalytic effect of organometallic additives on low-temperature oxidation of light crude oil during air flooding. Pet. Sci. Technol. 2015, 33, 1118–1125. [Google Scholar] [CrossRef]
  36. Wang, T.; Wang, J.; Yang, W.; Kalitaani, S.; Deng, Z. A novel air flooding technology for light crude oil reservoirs applied under reservoir conditions. Energy Fuels 2018, 32, 4942–4950. [Google Scholar] [CrossRef]
  37. Wang, T.; Yang, W.; Wang, J.; Kalitaani, S.; Deng, Z. Low temperature oxidation of crude oil: Reaction progress and catalytic mechanism of metallic salts. Fuel 2018, 225, 336–342. [Google Scholar] [CrossRef]
  38. Groenzin, H.; Mullins, O.C. Asphaltene molecular size and structure. J. Phys. Chem. A 1999, 103, 11237–11245. [Google Scholar] [CrossRef]
  39. Wang, J.; Wang, T.; Feng, C.; Yang, C.; Chen, Z.; Lu, G. Catalytic effect of transition metallic additives on the light oil low-temperature oxidation reaction. Energy Fuels 2015, 29, 3545–3555. [Google Scholar] [CrossRef]
  40. Freitag, N.P.; Exelby, D.R. A SARA-based model for simulating the pyrolysis reactions that occur in high-temperature EOR processes. J. Can. Pet. Technol. 2006, 45, 38–44. [Google Scholar] [CrossRef]
  41. Wang, T.; Wang, J.; Meng, X.; Chu, G.; Liu, C. The low temperature oxidation characteristics of SARA fractions in air flooding process. Pet. Sci. Technol. 2018, 36, 1125–1130. [Google Scholar] [CrossRef]
  42. Yang, S.; Jin, L.; Kong, Q.; Li, L. Advanced Engineering Mechanics; Higher Education Press: Beijing, China, 1988; pp. 156–157, 222–223. [Google Scholar]
  43. Fraust, B. Infrared spectroscopy. In Modern Chemical Techniques; The Royal Society of Chemistry: London, UK, 1997; pp. 62–91. [Google Scholar]
  44. Niu, B.; Ren, S.; Liu, Y.; Wang, D.; Tang, L.; Chen, B. Low-temperature oxidation of oil components in an air injection process for improved oil recovery. Energy Fuels 2011, 25, 4299–4304. [Google Scholar] [CrossRef]
  45. Shokrlu, Y.H.; Maham, Y.; Tan, X.; Babadagli, T.; Gray, M. Enhancement of the efficiency of in situ combustion technique for heavy-oil recovery by application of nickel ions. Fuel 2013, 105, 397–407. [Google Scholar] [CrossRef]
Figure 1. Schematic of the static oxidation experiment setup.
Energies 12 02848 g001
Figure 2. The relationship between oxygen consumption rate and absolute temperature at 16 MPa, (a) crude oil, (b) SARA fractions.
Energies 12 02848 g002
Figure 3. (a) TG, (b) Gram-Schmidt curves of the saturates before and after the catalyst addition.
Energies 12 02848 g003
Figure 4. 3D infrared spectra of (a) saturates, (b) saturates with catalyst.
Energies 12 02848 g004
Figure 5. Infrared spectra of gas produced by the LTO of (a) saturates, (b) saturates with catalyst at 180 °C at different times.
Energies 12 02848 g005
Figure 6. (a) TG, (b) Gram-Schmidt curves of the aromatics with and without the catalyst.
Energies 12 02848 g006
Figure 7. 3D infrared spectra of (a) aromatics, (b) aromatics with catalyst.
Energies 12 02848 g007
Figure 8. Infrared spectra of gas produced by the LTO of (a) aromatics, (b) aromatics with catalyst at 180 °C at different times.
Energies 12 02848 g008
Figure 9. (a) TG, (b) Gram-Schmidt curves of the resin fraction with and without the catalyst.
Energies 12 02848 g009
Figure 10. 3D infrared spectra of (a) resins, (b) resins with catalyst.
Energies 12 02848 g010
Figure 11. Infrared spectra of gas produced by the LTO of (a) resins, (b) resins with catalyst at 180 °C at different times.
Energies 12 02848 g011
Figure 12. Gram-Schmidt curves of crude oil and its SARA fractions (a) without catalyst, (b) with catalyst.
Energies 12 02848 g012
Figure 13. Changes in the CO2 absorbance of crude oil and its SARA fractions in the TG-FTIR test (a) without catalyst, (b) with catalyst.
Energies 12 02848 g013
Table 1. Summary of previous studies on crude oil catalytic oxidation technologies.
SourceExperimental TypeCrude Oil (API Gravity)Experimental Conditions (Temperature/Pressure)AdditivesFindings
Bagci et al. [18]Combustion reaction kinetics experimentsKarakus (29° API) and Beykan (32° API) crude oils from Turkish oilfieldsThe cell was continuously heated to 500–600 °C with a 1 °C/min heating rate at pressures of 172 or 345 kPaCuCl2, FeCl3, and MgCl2The catalyst type and concentration influenced the kinetic parameters (i.e., reaction order and activation energy) of high-temperature oxidation.
Shallcross et al. [19]Combustion cell experimentsCalifornian (18.5° API) and Venezuelan (10.5° API) oilsTemperature was increased to 450 °C at a rate of 50 °C/h at pressures of 280 or 550 kPaFeCl2, SnCl2, CuSO4, ZnCl2, MgCl2, K2Cr2O7, Al2Cl3, MnCl2, Ni(NO3)2, and CdSO4Iron and tin salts could enhance fuel formation, whereas copper, nickel, and cadmium salts have minor effects.
Gerritsen et al. [20]Combustion tube experimentsCymric light oil (34° API)Temperature: 400 °C; Pressure: 68.9 kPairon nitrateMetallic additive improves combustion of light oil. The Cymric light oil cannot sustain combustion without additive.
Ramirez et al. [21,22]Combustion tube experimentsHeavy oil from Gulf of Mexico (12.5° API)Ignition temperature: 300 °C; Pressures: 2070 kPaAdditives included Mo, Co, Ni, and Fe, and the anionic part of the salt was acetylacetonate or alkylhexanoate.The addition of metallic additives could accelerate the propagation velocity of the combustion front, improve combustion efficiency, and increase oil production.
Fassihi et al. [23,24]Combustion cell experimentsSan Ardo oil (11.2° API), Venezuela oil (9.5° API), Huntington Beach oil (18.5° API), and Lynch Canyon oil (10° API)Temperature was increased to 450 °C at a rate of 55 °C/h at pressures of 690, 550 or 138 kPaAdditives included Cu, Ni, Va, and Fe, but the anionic part of the salt was not reported.The additives can lower both the activation energy and the occurrence temperature of the combustion reaction under the identical reservoir conditions.
Castanier et al. [25]Combustion tube experimentsHuntington Beach oil (22° API), Hamaca oil (10° API), Cymric heavy oil (12° API), and Cymric light oil (34° API)Ignition temperature: 315 °C; Pressure: 690 kPaAdditives included Fe, Sn, and Zn, but the anionic part of the salt was not reported.The combustion efficiency and front velocities can be improved by the metallic additives. The H/C ratio of the fuel, heat of combustion, air requirements, and density of the produced crude are changed after the addition of metallic salts. In addition, the combustion of light oil can be improved by metallic additives.
Drici et al. [26]Differential scanning calorimetry (DSC) and therrnogravimetric analysis (TGA)Crude oil from the Iola field (19.8° API)Temperature was increased to 600 °C at a rate of 10 °C/h at atmospheric pressureHeavy metal oxides such as titanium, ferric, nickel, cupric, vanadium, and chromium oxidesThe effect of titanium oxide is similar to that of silica and alumina. Vanadium, nickel, and ferric oxides behaves similarly in enhancing the endothermic reactions. The effect of small amount of metal oxide is weak in the presence of a large surface area such as silica.
He et al. [27]Combustion tube experiments and ramped temperature oxidation (RTO) testsHeavy (12° API) and light (34° API) oil from CymricTube experiments: Ignition temperature 400 °C; Pressure 690 kPa;
RTO tests: Temperature was increased to 470 °C at a rate of 60 °C/h at pressures of 690, 550 or 310 kPa
Fe(NO3)3The combustion reaction catalytic mechanism is cation exchange of metallic salts with clay to create activated sites that enhance the combustion reactions between oil and oxygen. The combustion of light oil can be improved by metallic additives.
Wang et al. [28]Catalytic oxidation experiment; Viscosity reduction experimentSZ36-1 crude oil (30° API)Temperature: 100 °C; Pressure: 2000 kPaIron naphthenate, copper naphthenate, zinc naphthenate, manganese naphthenate, cobalt naphthenateThe preferred catalyst is copper naphthenate in an amount of 0.2% by mass of the crude oil. After the catalytic oxidation, the acid value and viscosity of the heavy oil increases. After adding the auxiliary solution to the oxidized oil system, the resulting surfactant can greatly reduce the viscosity of the aqueous heavy oil system by the emulsified viscosity reduction mechanism.
Tang et al. [29]Catalytic oxidation experiment; Viscosity reduction experimentCrude oil from Liaohe oilfield in China, API gravity is not given, oil viscosity is 382.6 Pa·s.Temperature: 200 °C; Pressure: 500 kPaWater soluble catalyst SP-1, light blue powder, MeL type compoundThe catalyst promotes oxidation and cracking of heavy oil and increases the acid value of heavy oil. The surface-active materials formed in the reaction can greatly reduce the viscosity of the aqueous heavy oil system by the emulsified viscosity reduction mechanism.
Pu et al. [30]Thermogravimetric testingTahe heavy crude oil (18.9° API)Temperature was increased to 800 °C at a rate of 10 °C/min at atmospheric pressureZnSO4, CuCl2, FeCl2, and AlCl3·6H2OMetallic additives exhibit varied catalytic effects on heavy oil oxidation. CuCl2 is found to be an excellent catalyst for improving oil production through positively influencing the oxidation reactions of Tahe heavy crude oil.
Amanam et al. [31]Ramped temperature oxidation experiments; Isoconversional analysis; Thermogravimetric analysisZuata crude oil (9.8° API)Temperature was increased to 600 °C at a rate of 1–3 °C/min at atmospheric pressureCopper nanoparticlesThe apparent activation energy of the high-temperature oxidation region is decreased. The presence of Cu-NP helps maintain a greater front temperature. Cu-NP changes the type of oil produced and decreases the amount of water generated during the reactions.
Table 2. Physical properties of the crude oil sample.
PropertiesValueAppearance
Density (g/cm3)0.850N/A
Viscosity at 70 °C (mPa·s)2.14N/A
SARA composition (wt %)Saturates70.91Colourless liquid
Aromatics16.07Yellow or red sticky liquid
Resins9.78Brown viscous liquid
Asphaltenes3.24Black fragile powder solid
Table 3. Oxidation rate of oil and its fractions at 16 MPa.
Test SampleTemperature, °COxidation Rate, (mol O2/d·m3 [Sample])Test SampleTemperature, °COxidation Rate, (mol O2/d·m3 [Sample])
Crude oil5026.14Crude oil + catalyst50241.16
7053.3770271.69
9086.6290390.46
110295.37110907.23
Saturates5016.97Saturates + catalyst50101.78
7035.0270185.08
9054.6490297.07
110168.81110704.01
Aromatics5026.43Aromatics + catalyst50202.17
7047.2570311.08
9065.1190377.06
110245.96110691.65
Resins5075.34Resins + catalyst50139.75
70137.7570313.27
90210.4390405.37
110492.36110768.33
Table 4. The LTO activation energy of crude oil and its fractions with or without catalyst added.
Crude oil and FractionsActivation Energy, (J/mol)Activation Energy with Catalyst Added, (J/mol)
Crude oil39,57121,864
SARA fractionSaturates37,46932,088
Aromatics35,60619,849
Resins30,97027,700

